Article

Assessing Sensitivity of Paddy Rice to Climate Change in South Korea

1
Institute of Green Bio Science and Technology, Seoul National University, Gangwon 25354, Korea
2
Department of Agricultural Engineering, Gyeongsang National University, Jinju 52828, Korea
3
Department of Rural and Biosystems Engineering, Chonnam National University, Gwangju 61186, Korea
4
Division of Agro-System Engineering & Institute of Agriculture and Life Science, Gyeongsang National University, Jinju 52828, Korea
*
Author to whom correspondence should be addressed.
Water 2016, 8(12), 554; https://doi.org/10.3390/w8120554
Submission received: 12 October 2016 / Revised: 17 November 2016 / Accepted: 24 November 2016 / Published: 28 November 2016

Abstract

:
Paddy rice constitutes a staple crop in Korea. This study conducted sensitivity analysis to evaluate the vulnerability of paddy rice to future climate change, and compared temporal and regional characteristics to classify regions with unfavorable water balances. Rainfall Effectiveness Index for Paddy fields (REIP), the ratio of effective rainfall and consumptive use, was used as a sensitivity index. Weather data from 1971 to 2010 and future climate change scenarios Representative Concentration Pathways (RCP) 4.5 and 8.5 were used to evaluate the sensitivity. Results showed an overall increase in water requirements and consumptive use. The REIP values were small for every period, except the 2040s, 2060s, and 2080s under scenario RCP 4.5, and the 2040s and 2080s under scenario RCP 8.5. Both climate change scenarios showed high sensitivity in regions Jeollabuk-do, Jeollanam-do, and Gyeongnam-do. However, regions Gyeonggi-do, Gangwon-do, and Chungcheongbuk-do had low sensitivity compared to other regions. The REIPs were used to categorize sensitivity into four types: low consumption–water rich, low consumption–water poor, high consumption–water rich, and high consumption–water poor. The Gangwon-do region had the highest number of regions that changed from the low consumption–water rich category to the high consumption-water poor category, making it a priority for measures to improve its adaptive capacity for climate change.

1. Introduction

Global warming is a worldwide phenomenon, and the rise in temperature and unpredictable changes in precipitation pose serious risks to agriculture [1]. The average temperature in the Korean Peninsula has risen by 1.5 °C in the past 100 years and, consequently, the crop calendar has changed and traditional water management practices are being challenged. The mean annual precipitation per person in Korea is just 1/11th of the global mean, defining Korea as a country with water shortage. Furthermore, seasonal fluctuations in precipitation are increasing as the number of precipitation days is decreasing, and the intensity is increasing [2]. The slightest change in climate can easily cause changes in crop-growing environments and cause serious problems for agricultural water resources in areas with great seasonal and regional deviations.
Rice comprises 90% of staple grain production in Korea and is the staple food source for over 60% of the global human population. Since rice is sensitive to weather conditions; changes in climate can drastically affect its growth and yield. Many studies have examined the changes in growth and irrigation patterns of paddy rice due to climate change. For example, Doll [3] predicted that two-thirds of total irrigated fields around the world would experience an increase in irrigation requirements by 2070. Xiong et al. [4] studied irrigated areas in China with the GCM (General Circulation Models) A2 and B2 climate change scenarios, and predicted the area of irrigated fields would decrease overall and, consequently, have a significant impact on rice yield. Gondim et al. [5] studied the sensitivity of irrigation requirements and efficiency in A2 and B2 climate scenarios. Li et al. [6] simulated rice yield and growth processes based on Representative Concentration Pathways (RCP) 4.5 and 8.5 scenarios and showed that temperature increase would cause earlier vegetative periods and reduced crop yield. In Korea, Chung [7] used the HadCM3 (Hadley centre Climate Model 3) model and data from A2 and B2 to analyze agricultural water demand in the Nakdonggang region; the results predicted a decrease in unit duty of water and irrigation demands. Yun et al. [8] used the A1B scenario to analyze changes in reference evapotranspiration and water requirement; results showed an overall increase in both aspects. Lee et al. [9] used a crop growth model that implemented various climate change scenarios, and showed a decrease in future consumptive use and increase in crop yield of paddy rice. Yoo et al. [10] used a high-resolution climate scenario, RCP 8.5, to analyze the changes in paddy irrigation requirements and unit duty of water for different irrigation districts. The results predicted variation between different irrigation districts and seasons, but on average, the actual crop evapotranspiration would increase and, thus, the paddy water requirement and unit duty of water would increase.
These studies above show that climate change threatens agricultural water security, and that the most immediate threat to future agriculture is climate change. Thus, it is essential to study the potential future risks and vulnerability caused by climate change to prepare for this threat, to promote agricultural production, and help prepare solutions, prioritize policies, and technologies. Vulnerability to climate change is a function of the character, magnitude, and rate of climate variation to which a system is exposed, its sensitivity, and its adaptive capacity [11,12]. Sensitivity is defined as the degree to which a given community is affected in its current form, either adversely or beneficially, by climatic stresses [12,13,14]. For example, a community dependent on rain-fed agriculture is much more sensitive to changing rainfall patterns than one where mining is the dominant livelihood [1]. This study analyzed the changing trends in agricultural water demands and used a water balance model to evaluate the sensitivity of rice paddy fields. Furthermore, it used an index to compare the temporal and spatial sensitivity of paddy rice cultivation to climate change, and categorized 162 cities and counties throughout the country according to the sensitivity type of paddy.

2. Materials and Methods

Figure 1 shows the procedures for generating a sensitivity index for climate change and conducting daily water balance analyses for 162 cities and counties in 10-year increments. This process was used to evaluate sensitivity of paddy rice fields in Korea to climate change.
Daily low/high temperatures, daily rainfall, daylight hours, and relative humidity at weather stations throughout the country over the past 40 years (1971–2010) were collected from the Korea Meteorological Administration (KMA) [15]. The daily rainfall and daily reference evapotranspiration (the Penman-Monteith equation) for the future weather (2011–2100) was calculated using data from Representative Concentration Pathways (RCP) scenarios 4.5 and 8.5. The daily water balance analysis was used to predict regional paddy water requirements and calculate the regional sensitivity index of paddy rice.

2.1. Future Climate Change Scenarios

The KMA [13] provides climate change scenarios for South Korea based on RCP, using global and regional climate models. The dynamic downscaling technique is applied to the regional climate model (HadGEM3-RA) to generate climate change scenarios for the Korean Peninsula at a spatial resolution of 12.5 km. This study used the Korean Peninsula climate change scenario for temperature, rainfall, relative humidity, average wind speed, and daylight hours provided by the KMA [15]. The study periods for the climate change scenarios are shown in Table 1. Periods were distinguished by the past (observed between 1971 and 2010) and the future (climate change scenarios, 2011–2100) and were divided into 10-year increments.

2.2. Paddy Water Requirement Calculations Using the Water Balance Model

Generally, water balance analysis for paddy fields predicts the net water requirement of an irrigated area. To calculate this, conditions for the transplantation period, growth period, and crop coefficient are required. The water balance equation for paddy fields is shown in Equation (1). However, in this study, surface inflow was neglected because the quantitative amount could be too little to be estimated or observed under normal conditions in paddy fields, and subsurface inflow was assumed equal to subsurface outflow. In addition, the condition of irrigation was removed to simplify the equation to Equation (2).
P D t = P D t 1 + P R t + I R t + S F I t + L I t L O t A E T t D P t S F O t
P D t = P D t 1 + E R t A E T t D P t E R t = P R t S F O t
where PD is ponding depth, PR is precipitation, IR is irrigation, SFI is surface inflow, LI is horizontal ground water inflow rate, LO is horizontal ground water outflow rate, AET is actual crop evapotranspiration [16], DP is deep percolation, SFO is surface runoff, ER is effective rainfall, and subscripts t and t − 1 represent day t and day t − 1, respectively.
The cropping system for rice cultivation can vary slightly according to the latitude and altitude of agricultural land and the type of rice. This study applied the same cropping system throughout the entire region and selected the irrigation period from 21 May (the start of the transplantation period) to 30 September. Precipitation <5.0 mm/day was deemed as interception loss and the actual crop evapotranspiration was calculated by taking the reference evapotranspiration, calculated using the FAO (Food and Agriculture Organization of the United Nations) Penman-Monteith equation, and multiplying it by the crop coefficient in the Table 2 [17]. The water requirement during transplantation was set at 140 mm and the deep percolation was collectively set at 4.0 mm/day, as suggested by Lee [18]. The desirable ponding depth changes with the growth period of paddy rice and appropriate values were taken from Jang et al. as shown in Table 3 [17]. The maximum ponding depth was limited to 60 mm/day to predict the daily paddy water requirements.

2.3. Sensitivity Index of Vulnerability of Paddy Rice to Climate Change

Water balance analysis was used to predict paddy water requirements. Based on this, a quantitative evaluation of the sensitivity of paddy rice was generated by indexing the quantity of water resource that satisfies the water requirement of the crop. Climate change effects have an effect on agricultural water use indirectly, such as through increases in temperature, which change the growth period, crop coefficient, crop types, and farming practices. Agriculture can also be affected by social and economic factors, such as a reduction in agricultural land. However, increase in crop evapotranspiration and decrease in effective rainfall are direct consequences of climate change that increase agricultural water demands [19]. Equation (3) defines the Rainfall Effectiveness Index for Paddy fields (REIP), which represents the association between consumptive use and effective rainfall. It can be calculated in different time ranges from a day to several years just for the crop growing season. A higher REIP indicates favorable water balance conditions with an adequate environment for cultivating paddy rice. A lower REIP indicates unfavorable conditions for growing paddy rice, and higher sensitivity to climate change.
R E I P = E R C U
where CU is the crop consumptive use which is defined as the sum of actual crop evapotranspiration and deep percolation, and ER is effective rainfall.

2.4. Categorizing Climate Change Sensitivity of Paddy Rice

The REIP was calculated for all fields. A decrease in REIP can occur from decreases in both consumptive use and effective rainfall or from a larger increase in consumptive relative to the changes in effective rainfall. The sensitivity to climate change may be different for two cases that have the same REIP value. Irrespective of the cause of a high REIP, no two cases are the same and each requires a different solution for climate change. Hence, this study categorized climate change sensitivity into four types, according to the magnitudes of REIP relative to a baseline, and analyzed regional characteristics. In this study, the baseline was limited to an average during 1971 to 2010. Regions where the future consumptive use was lower than the baseline consumptive use were categorized as low consumption (L), and those where it was higher as regions of high consumption (H). Regions where the future effective rainfall was lower than the baseline effective rainfall were categorized as water-poor (P), those where it was higher as water-rich (R). Secondly, categorization of consumptive use and effective rainfall were combined to analyze different regions according to the four sensitivity types: low consumption–water rich (LR), high consumption–water rich (HR), low consumption–water poor (LP), and high consumption–water poor (HP) (Figure 2).

3. Results and Discussion

3.1. Temporal Changes in Paddy Water Requirements

Table 4 shows the irrigation requirement calculations throughout the paddy rice growth period for future climate change scenarios. Changes over the past 40 years (1970s–2000s) showed increased rainfall, while the consumptive use was highest in the 1970s. The effective rainfall was highest in the 2000s, while consumptive use was lowest. The net water requirement was highest in the 1970s, when consumptive use was also the highest, but was the lowest in the 2000s, when effective rainfall was highest.
Temporal changes for each climate change scenario were assessed relative to the average values over the last 40 years (1971–2010). The average consumptive use for the baseline period was 536 mm, and the predicted future values for RCP were about 576 mm on average. For RCP 8.5, the average simulated value was almost 595 mm (11% increase), and all future values increased compared to the baseline. Furthermore, RCP 8.5 had a greater increase than RCP 4.5. The annual precipitation during the cultivation period increased in all periods, relative to the baseline, except in the 2010s and 2030s. However, effective rainfall showed a different trend for each scenario and period. The average effective rainfall for the baseline period was 493 mm. The predicted values for the 2030s, 2060s, and 2090s, were 492 mm (0.2% increase), 578 mm (17.2% increase), and 489 mm (0.8% decrease), respectively, for RCP 4.5, and 470 mm (4.6% decrease), 499 mm (1.2% increase), and 570 mm (15.7% increase), respectively, for RCP 8.5. The rainfall and consumptive use increased overall, while effective rainfall varied according to the ponding depth of the paddy field as it was affected by rainfall days or rainfall intensity.
The average net water requirement for the baseline period was 556 mm. The predicted values for the 2030s, 2060s, and 2090s were 602 mm (8.3% increase), 496 mm (10.9% decrease), and 620 mm (11.5% increase), respectively, for RCP 4.5, and 626 mm (12.6% increase), 616 mm (10.8% increase), and 590 mm (6.2% increase), respectively, for RCP 8.5. Specific trends were not identified due to complex effects involving increased actual crop evapotranspiration and effective rainfall.

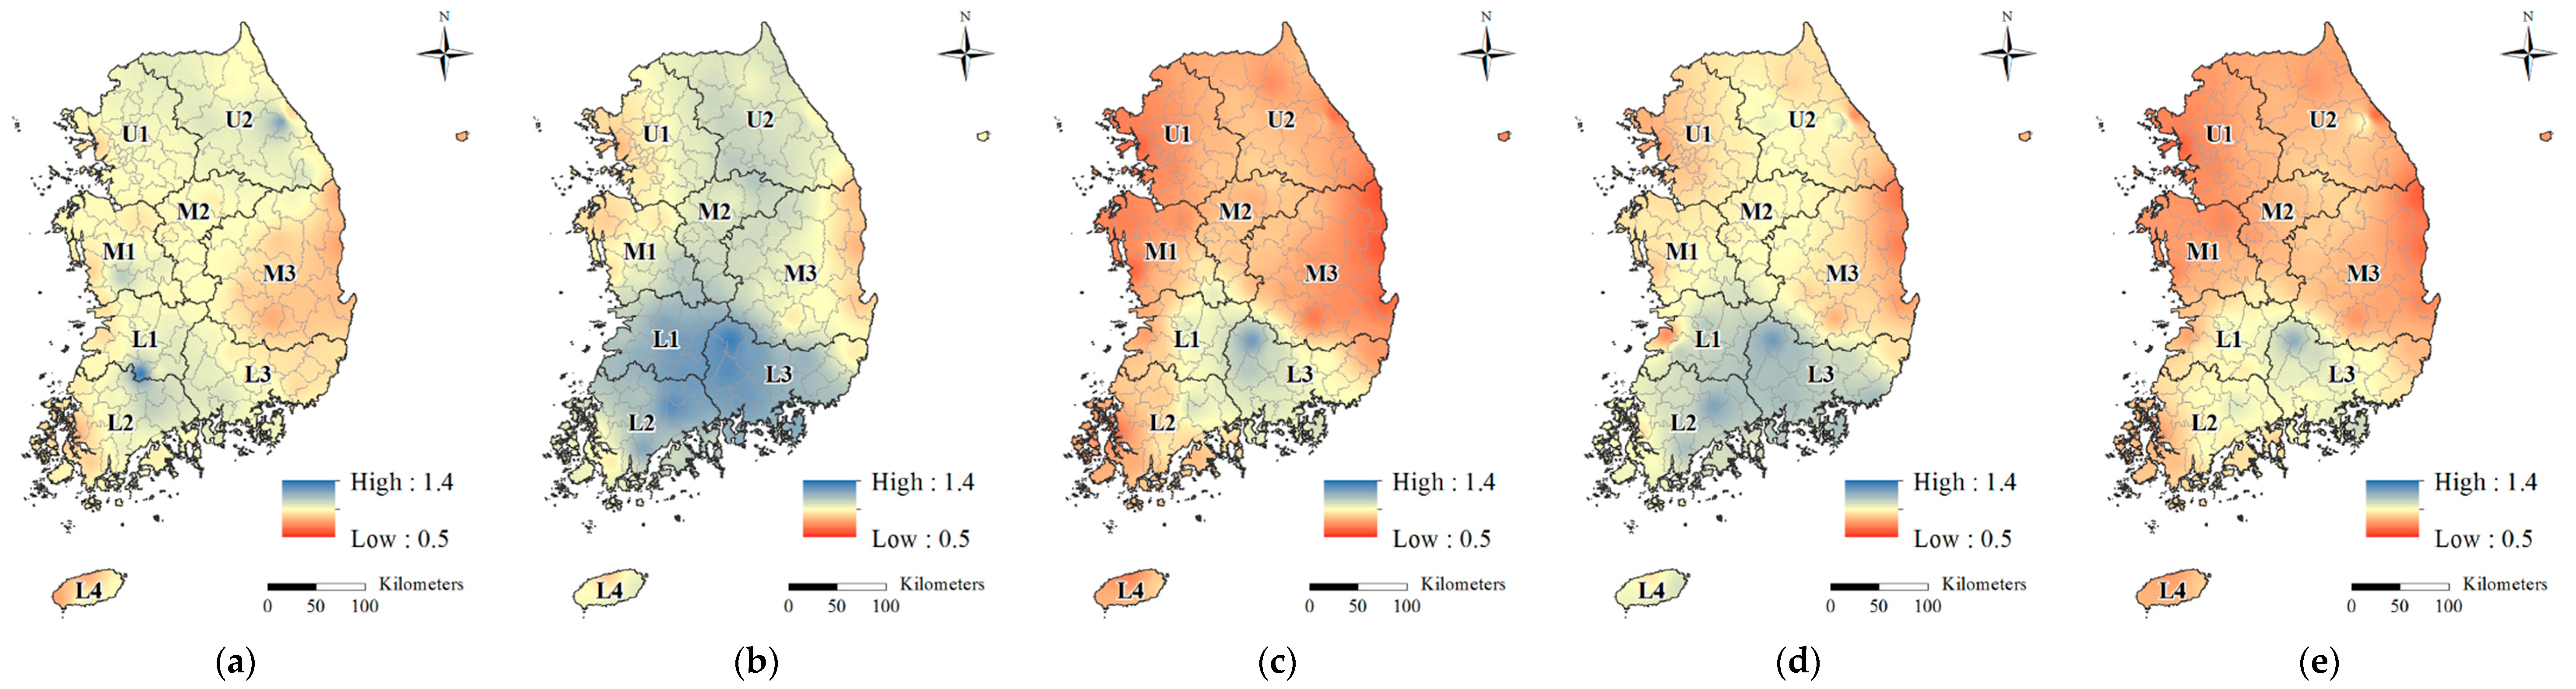
3.2. Regional Changes in the Sensitivity Index of Paddy Rice

This study categorized 162 cities and counties throughout South Korea, including Jeju Island, into nine regions (U1, U2, M1, M2, M3, L1, L2, L3, and L4) to observe regional changes in the sensitivity index (Figure 3).
The temporal distribution of climate change scenarios RCP 4.5 and RCP 8.5 did not show significant statistical differences (Table 5). However, categorization of regional REIPs for all periods showed larger deviation for RCP 4.5 than RCP 8.5. Thus, regionally, it was predicted that RCP 4.5 has a larger deviation for sensitivity to climate change, compared to RCP 8.5.
Figure 4 and Figure 5 show temporal and regional REIP values for RCP 4.5 and RCP 8.5 with the REIP of the baseline period (1971–2010) set at 1.0. The temporal changes for RCP 4.5 showed that future REIP values were higher than the baseline during in the 2040s, 2060s, and 2080s, and in the 2040s and 2080s for RCP 8.5. The water balance was also predicted to be relatively favorable during these periods. Conversely, the remaining periods showed lower REIPs than the baseline, which indicated a negative impact on irrigation supply from future climate change. In the RCP 4.5 scenario, the 2060s showed the most favorable water balance compared to the baseline period (Table 4). During this period, the L3 region had a REIP value of 1.25, indicating it would experience the least adverse effect of climate change. The L3 region had higher REIP values than all other regions in all periods, except for the 2010s, and also the L1 and L2 regions showed relatively higher REIP values in the periods of 2020s, 2040s, 2050s, 2060s, and 2080s (Figure 4). However, the U1 region had REIP values of 0.80, 0.75, 0.72, 0.89, and 0.76 for the 2010s, 2020s, 2030s, 2050s, and 2090s, respectively, which were lower than any other region. The L4 region in the southernmost area, had the lowest values of 0.89 and 0.83 for the 2050s and 2080s, respectively. For scenario RCP 8.5, the L3 region had the most favorable conditions with a REIP value of 1.15 in the 2040s, which was the period with the highest average REIP in South Korea (Figure 5).
As shown in Figure 6, the L3 region was considered to have overall favorable water balance conditions in both future climate change scenarios. Regions L1 and L2, which are both major rice producing areas in South Korea, also showed less vulnerable to climate change, more than other regions. Conversely, U1, U2, and M1 had the lowest REIP for both RCP 4.5 and RCP 8.5, which indicated a need to improve the adaptive capacity for climate change in these regions.

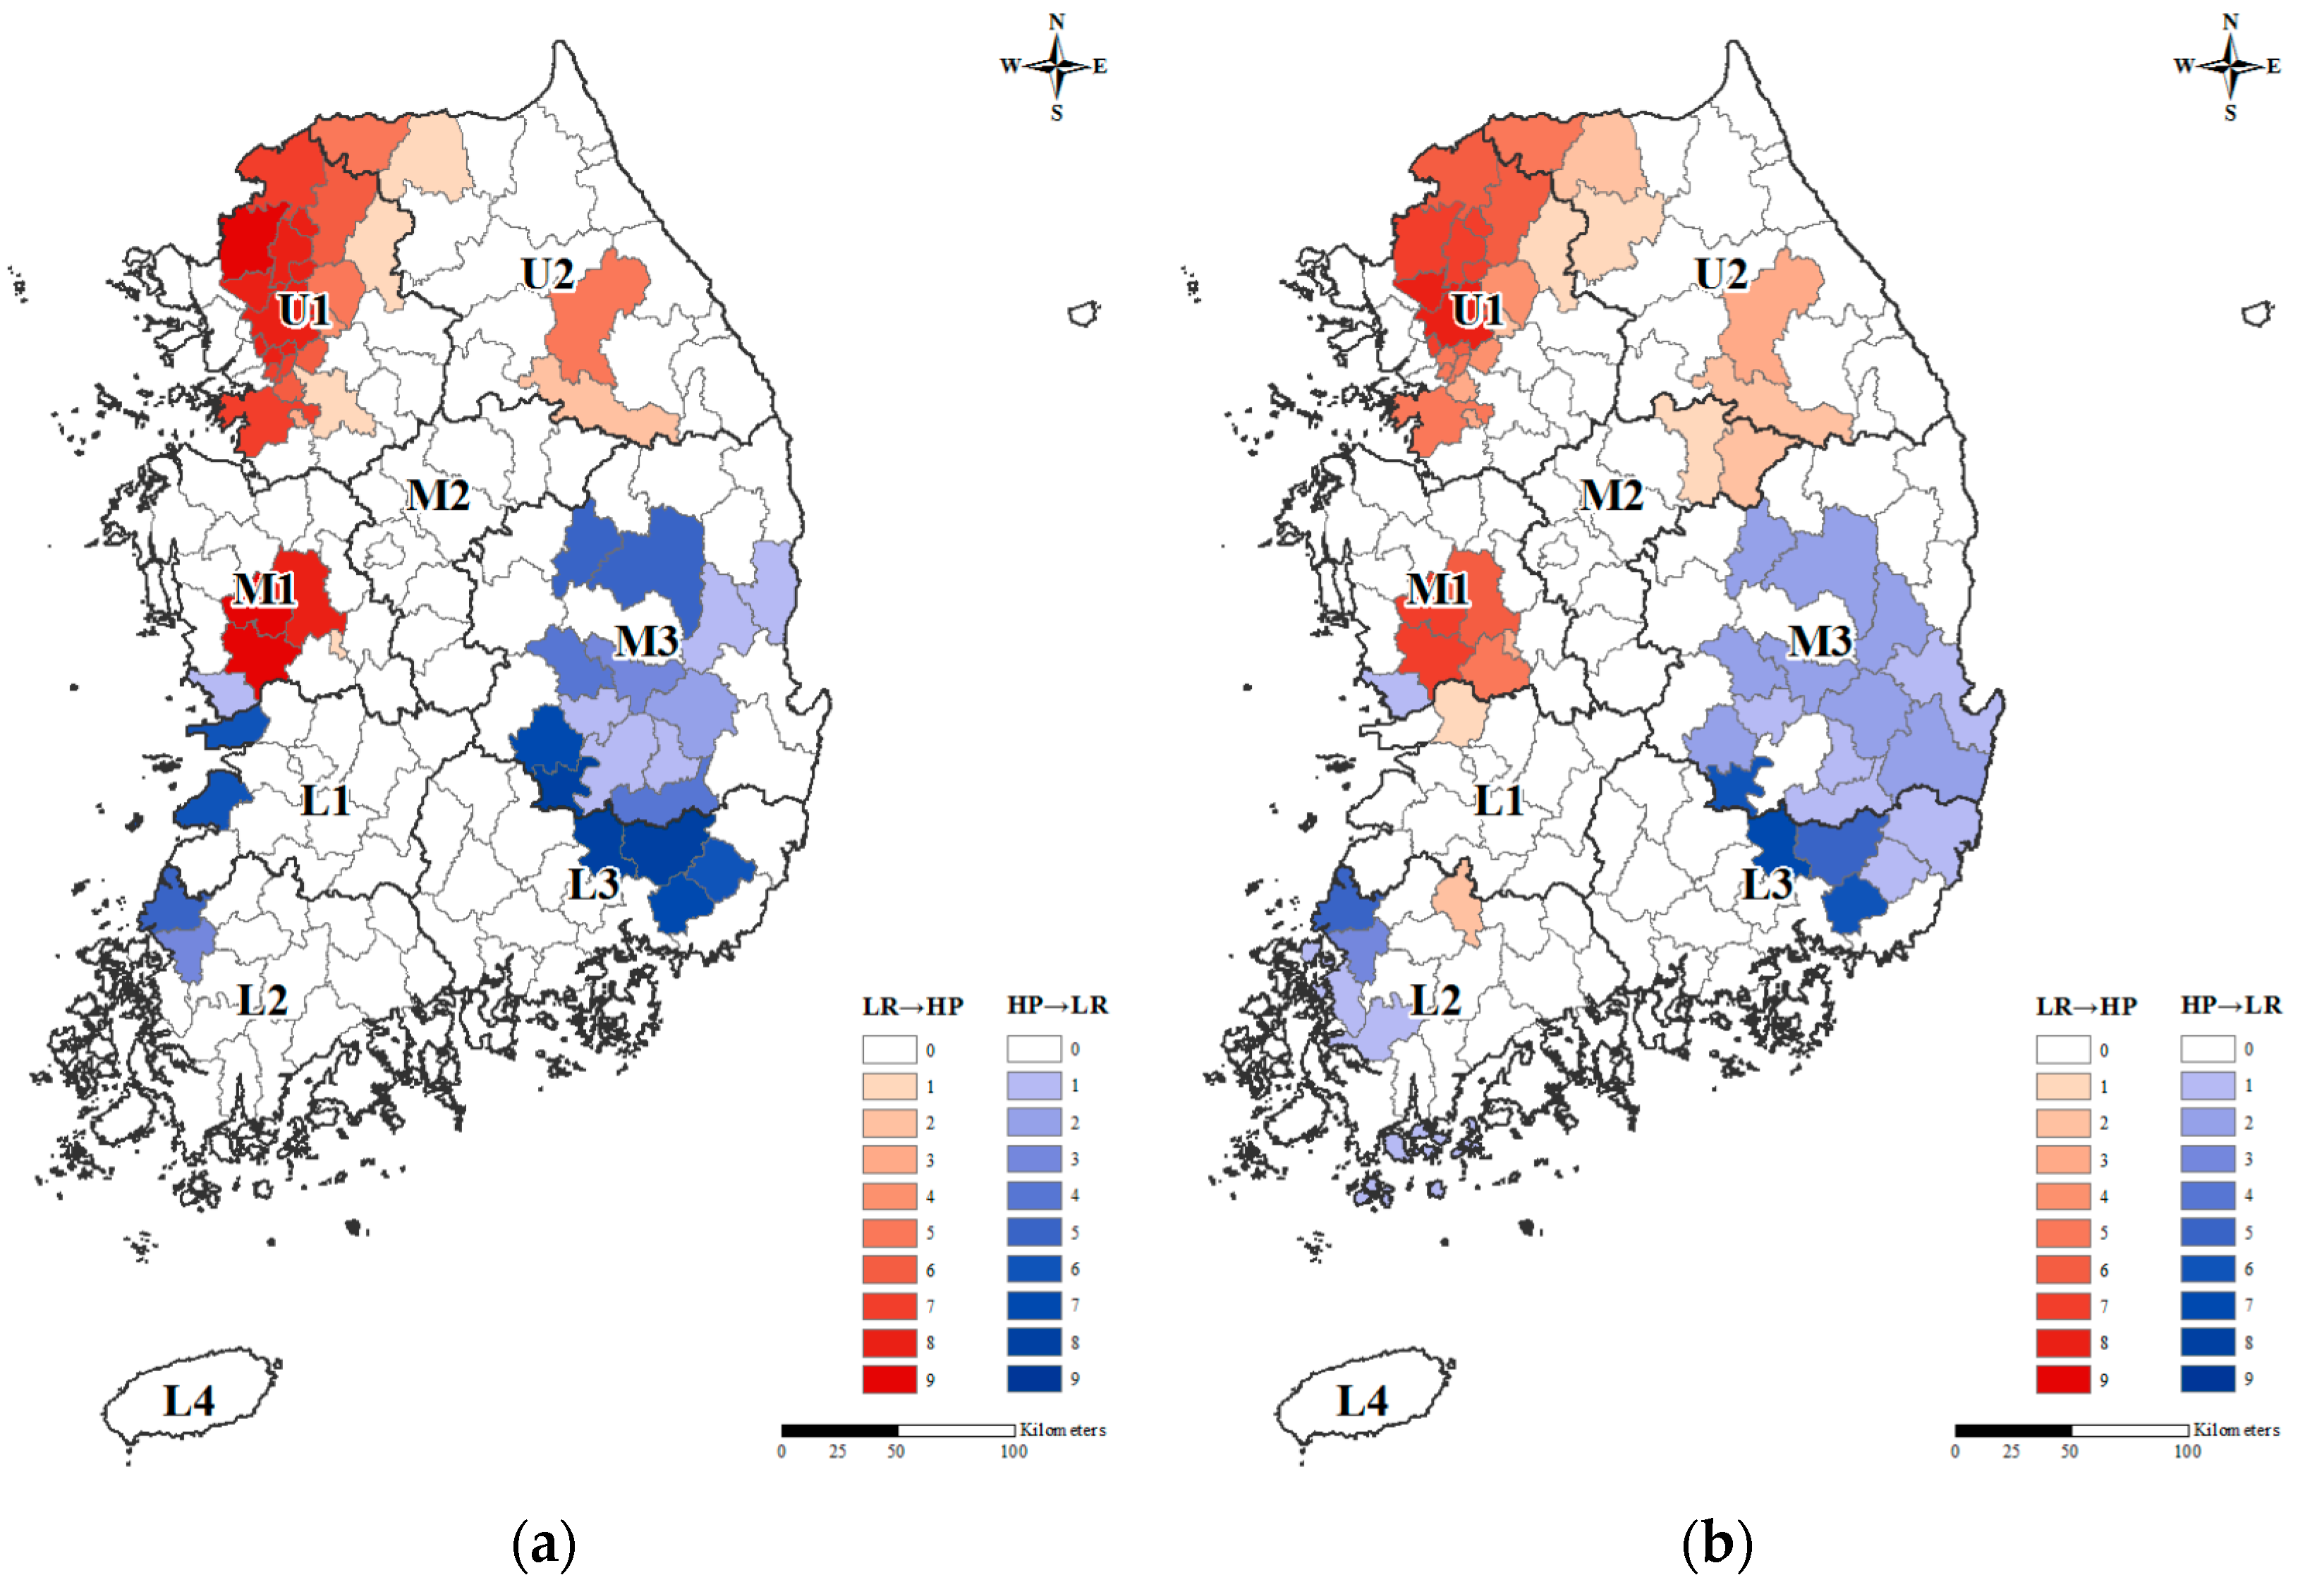
3.3. Categorization of Climate Change Sensitivity Types

Figure 7 shows the categorization of sensitivity types for climate change scenario RCP 4.5. Compared to the present, cities and counties labeled as water-poor regions (LP and HP), increased during all periods. The number of cities and counties labeled as LP or HP during the baseline period was 24 and 38, respectively. However, the climate change scenario for the 2090s showed that the number of LP and HP categories increased to 33 and 49, respectively. Especially in the 2020s, 95 out of 162 cities and counties, approximately 60%, were water-poor regions. There were 49 and 48 HP regions for the 2090s and 2020s, respectively, which made these years the most sensitive to climate change. The average numbers of cities and counties according to sensitivity type (LP, LR, HP, or HR) showed an order of LR (31.9%) > HP (25.5%) > LP (21.6%) > HR (21.0%), compared to the order of averages over the past 40 years: LR (34.6%) > HR (27.2%) > HP (23.5%) > LP (14.8%). The weight of LR was the highest in both cases, however, the weight of HR changed significantly.
Climate change scenario RCP 8.5 also showed an increase in the number of cities and counties classified as water-poor regions during all periods (Figure 8). The average number of cities and counties classified as LP and HP in the future was 42 and 42, respectively. The 2010s and 2030s had the highest number of cities and counties classified as either LP or HP. Of most concern were the 2040s and 2090s, where the numbers of HP cities and counties was highest, even when compared to scenario RCP 4.5. The lowest number of LR regions was during the 2060s and highest during the 2040s. For scenario RCP 8.5, the average number of cities and counties of each type were in the order of HR (26.3%) > LP (25.8%) > HP (25.7%) > LR (22.2%), showing HR with the highest weight, unlike the baseline, and showing LR with the least weight. Scenario RCP 8.5 had the highest percentage of cities and counties categorized as HR at 25.3%, contradicting the results of RCP 4.5. However, the number of cities and countries for each sensitivity type did not show a big difference between RCP 8.5 and RCP 4.5.
Regions that change from LR (the most favorable) to HP (the most sensitive type) in the future are a priority for measures to adapt to climate change. Conversely, regions that change from HP to LP are predicted to experience the least adverse effects of climate change. Figure 9 shows that regions that changed from LR to HP in the climate change scenario RCP 4.5 occurred most often during the 2030s with 27 cities and counties, and the least often during the 2060s, with only 7 cities and counties. Furthermore, from 2011 to 2100, there were 34 cities and counties that changed from LR to HP, and there were 22 for U1, 4 for U2, and 4 for M1 (Figure 10). RCP 8.5 had the most cities and counties in the 2010s, followed by the 2090s, as shown in Figure 9. However, the 2020s and the 2080s had five and six cities and counties, respectively, which changed from LR to HP, indicating that these periods are predicted to experience the least adverse effects of climate change. Each region had similar results under RCP 4.5, where the focus was on the U1, U2, and M1 regions, while M2, L1, and L2 regions also had four cities and counties. In all scenarios, U1 was the most sensitive to future climate change (Table 5 and Figure 6), and is a priority for efforts to adapt to climate change. Twenty-two cities and counties improved from HP to LR for scenario RCP 4.5, and 34 cities and counties for scenario RCP 8.5. Both scenarios indicated M3 region had the most regions that changed in a positive direction [15]. The M3 region, shown in Figure 6a, is known as the driest region with the least rainfall and highest temperatures in South Korea.

4. Conclusions

This study predicted changes in the water balance of paddy fields using climate change scenarios RCP 4.5 and 8.5. Furthermore, an index was used to quantitatively express the sensitivity to climate change of paddy rice fields and categorize 162 cities and counties in South Korea into four types.
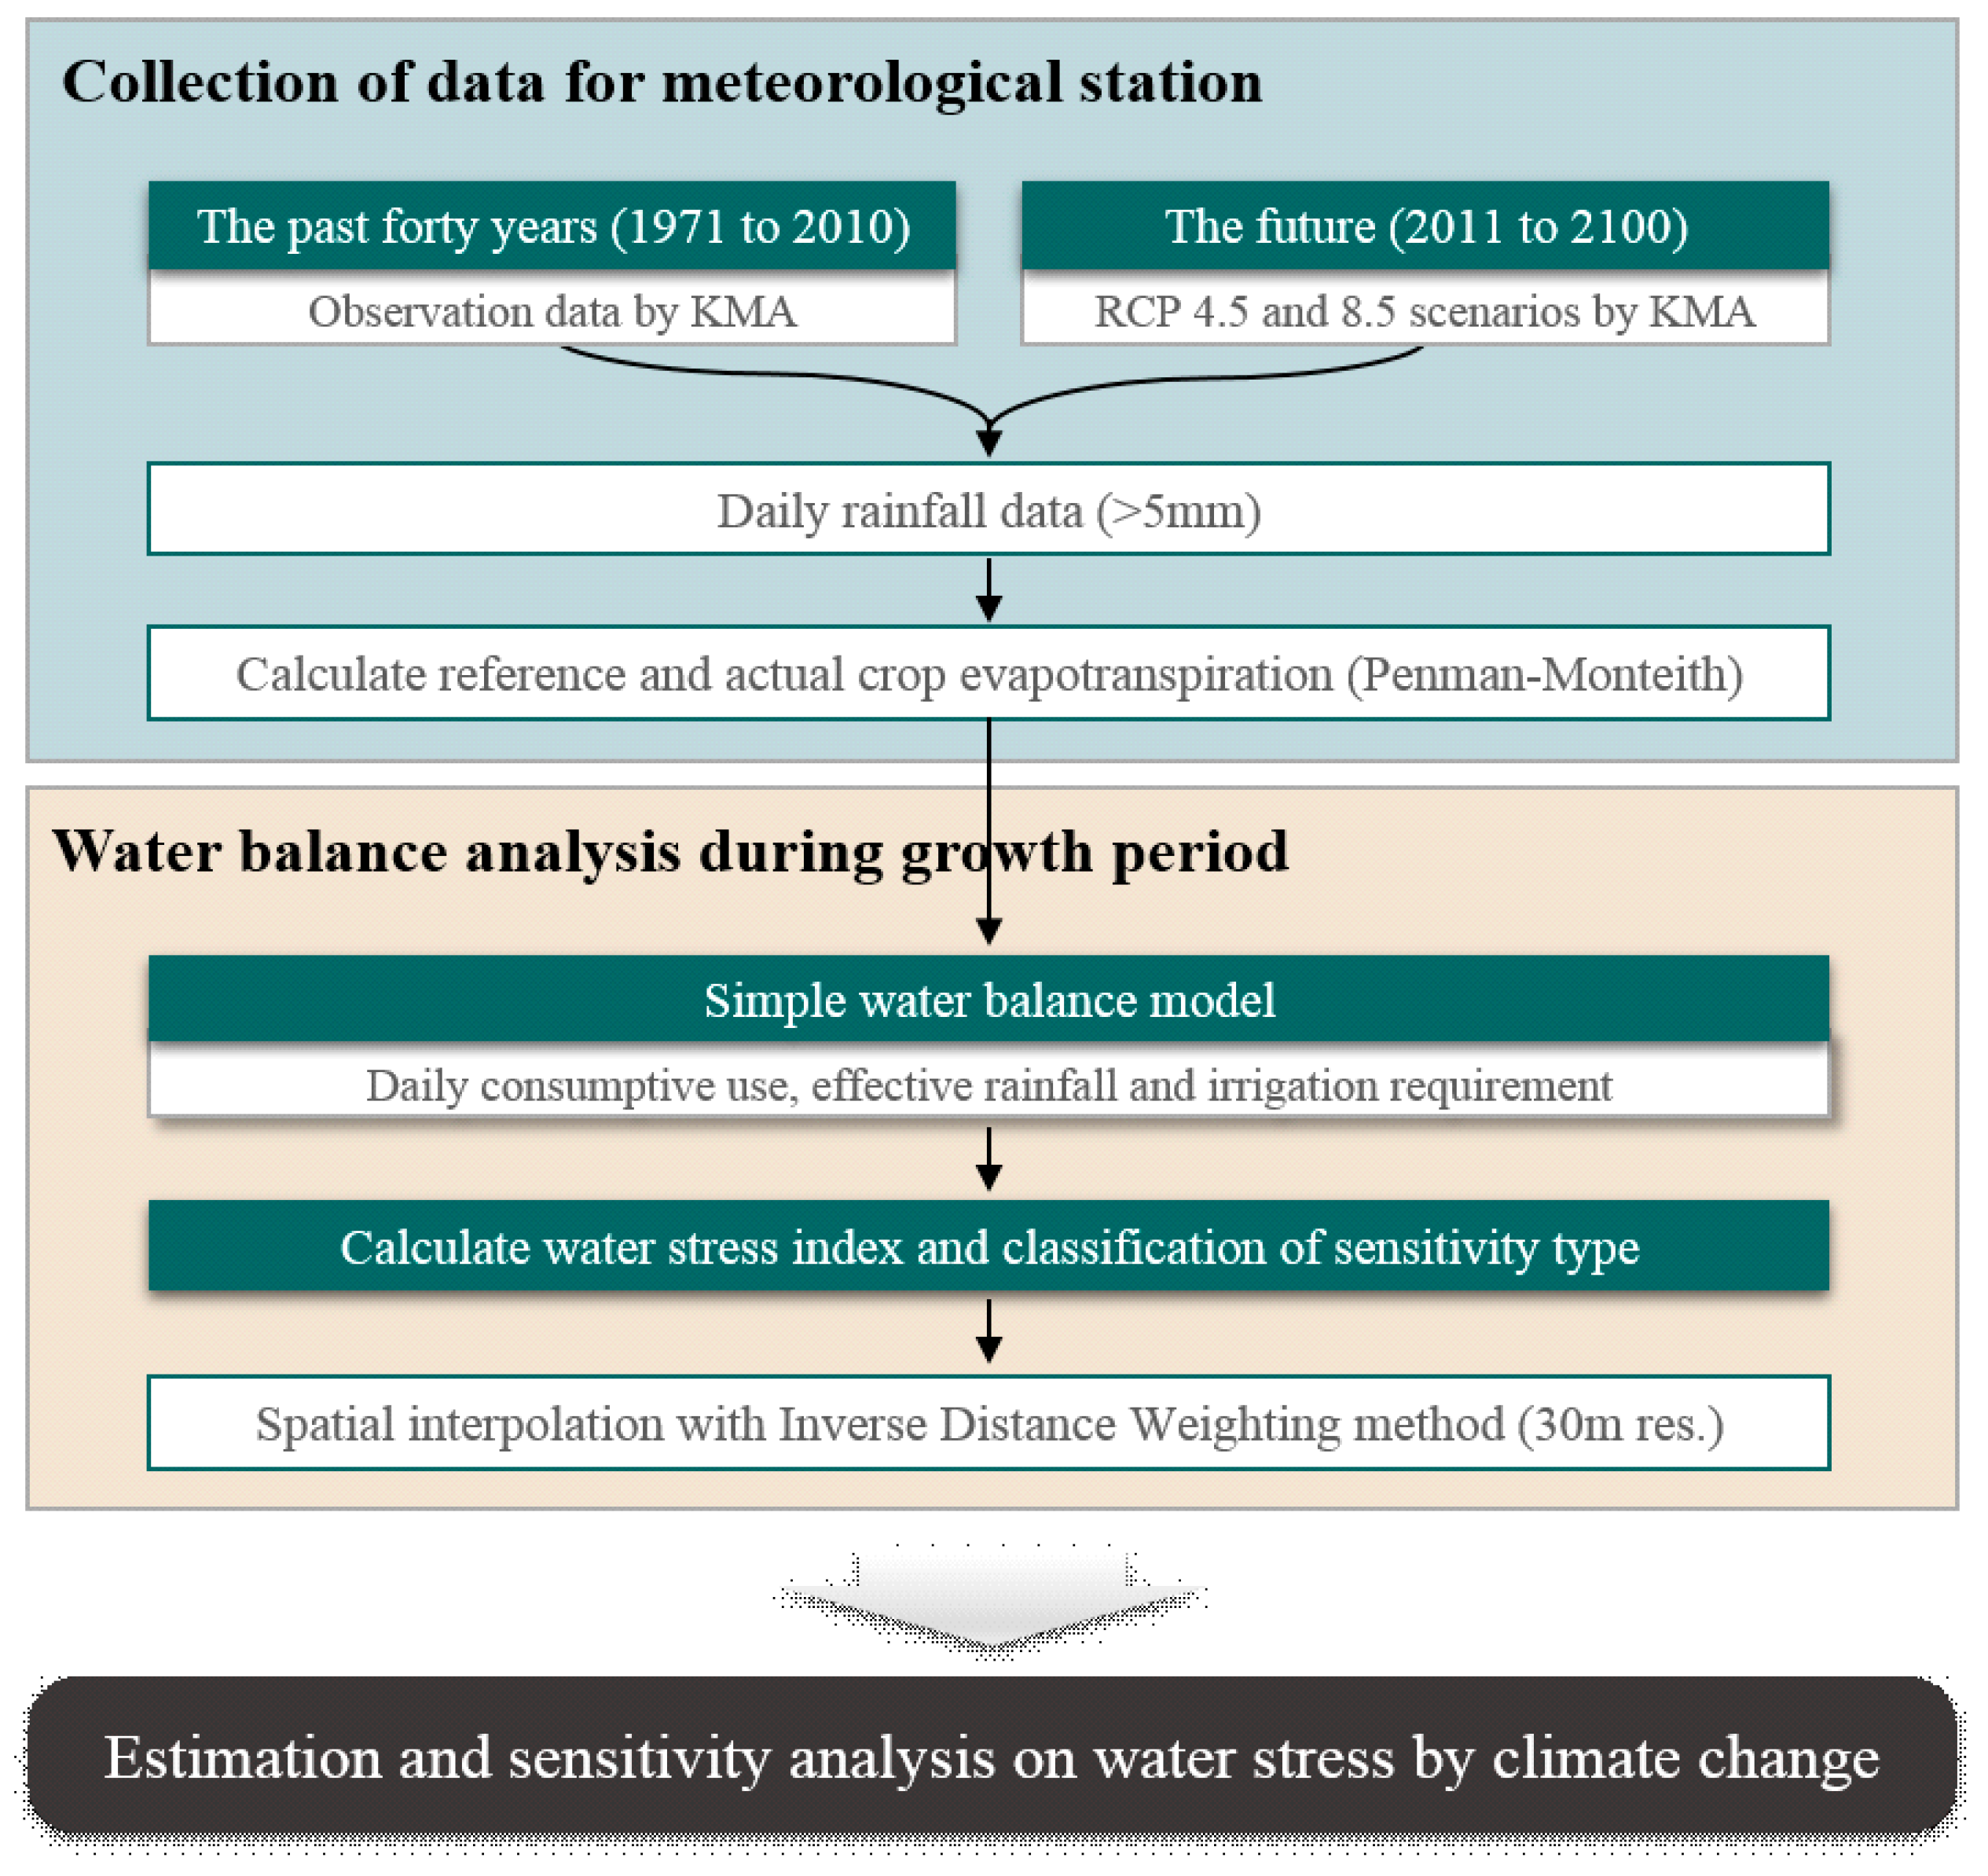
  • The future water balance of paddy fields was estimated using weather data over the past 40 years (1971–2010) as a baseline. Scenarios RCP 4.5 and 8.5 both showed an increase in consumptive use. The increase for RCP 8.5 (average 10.9%) was higher than for RCP 4.5 (average 7.5%). The annual precipitation during the cultivation period increased compared to the present in all periods, except for the 2010s and 2030s. However, effective rainfall varied according to climate change scenarios and periods due to effects of rainfall days, rainfall intensities, and freshwater conditions of the field. The net water requirement was predicted to increase overall in the future, but did not show a specific trend.
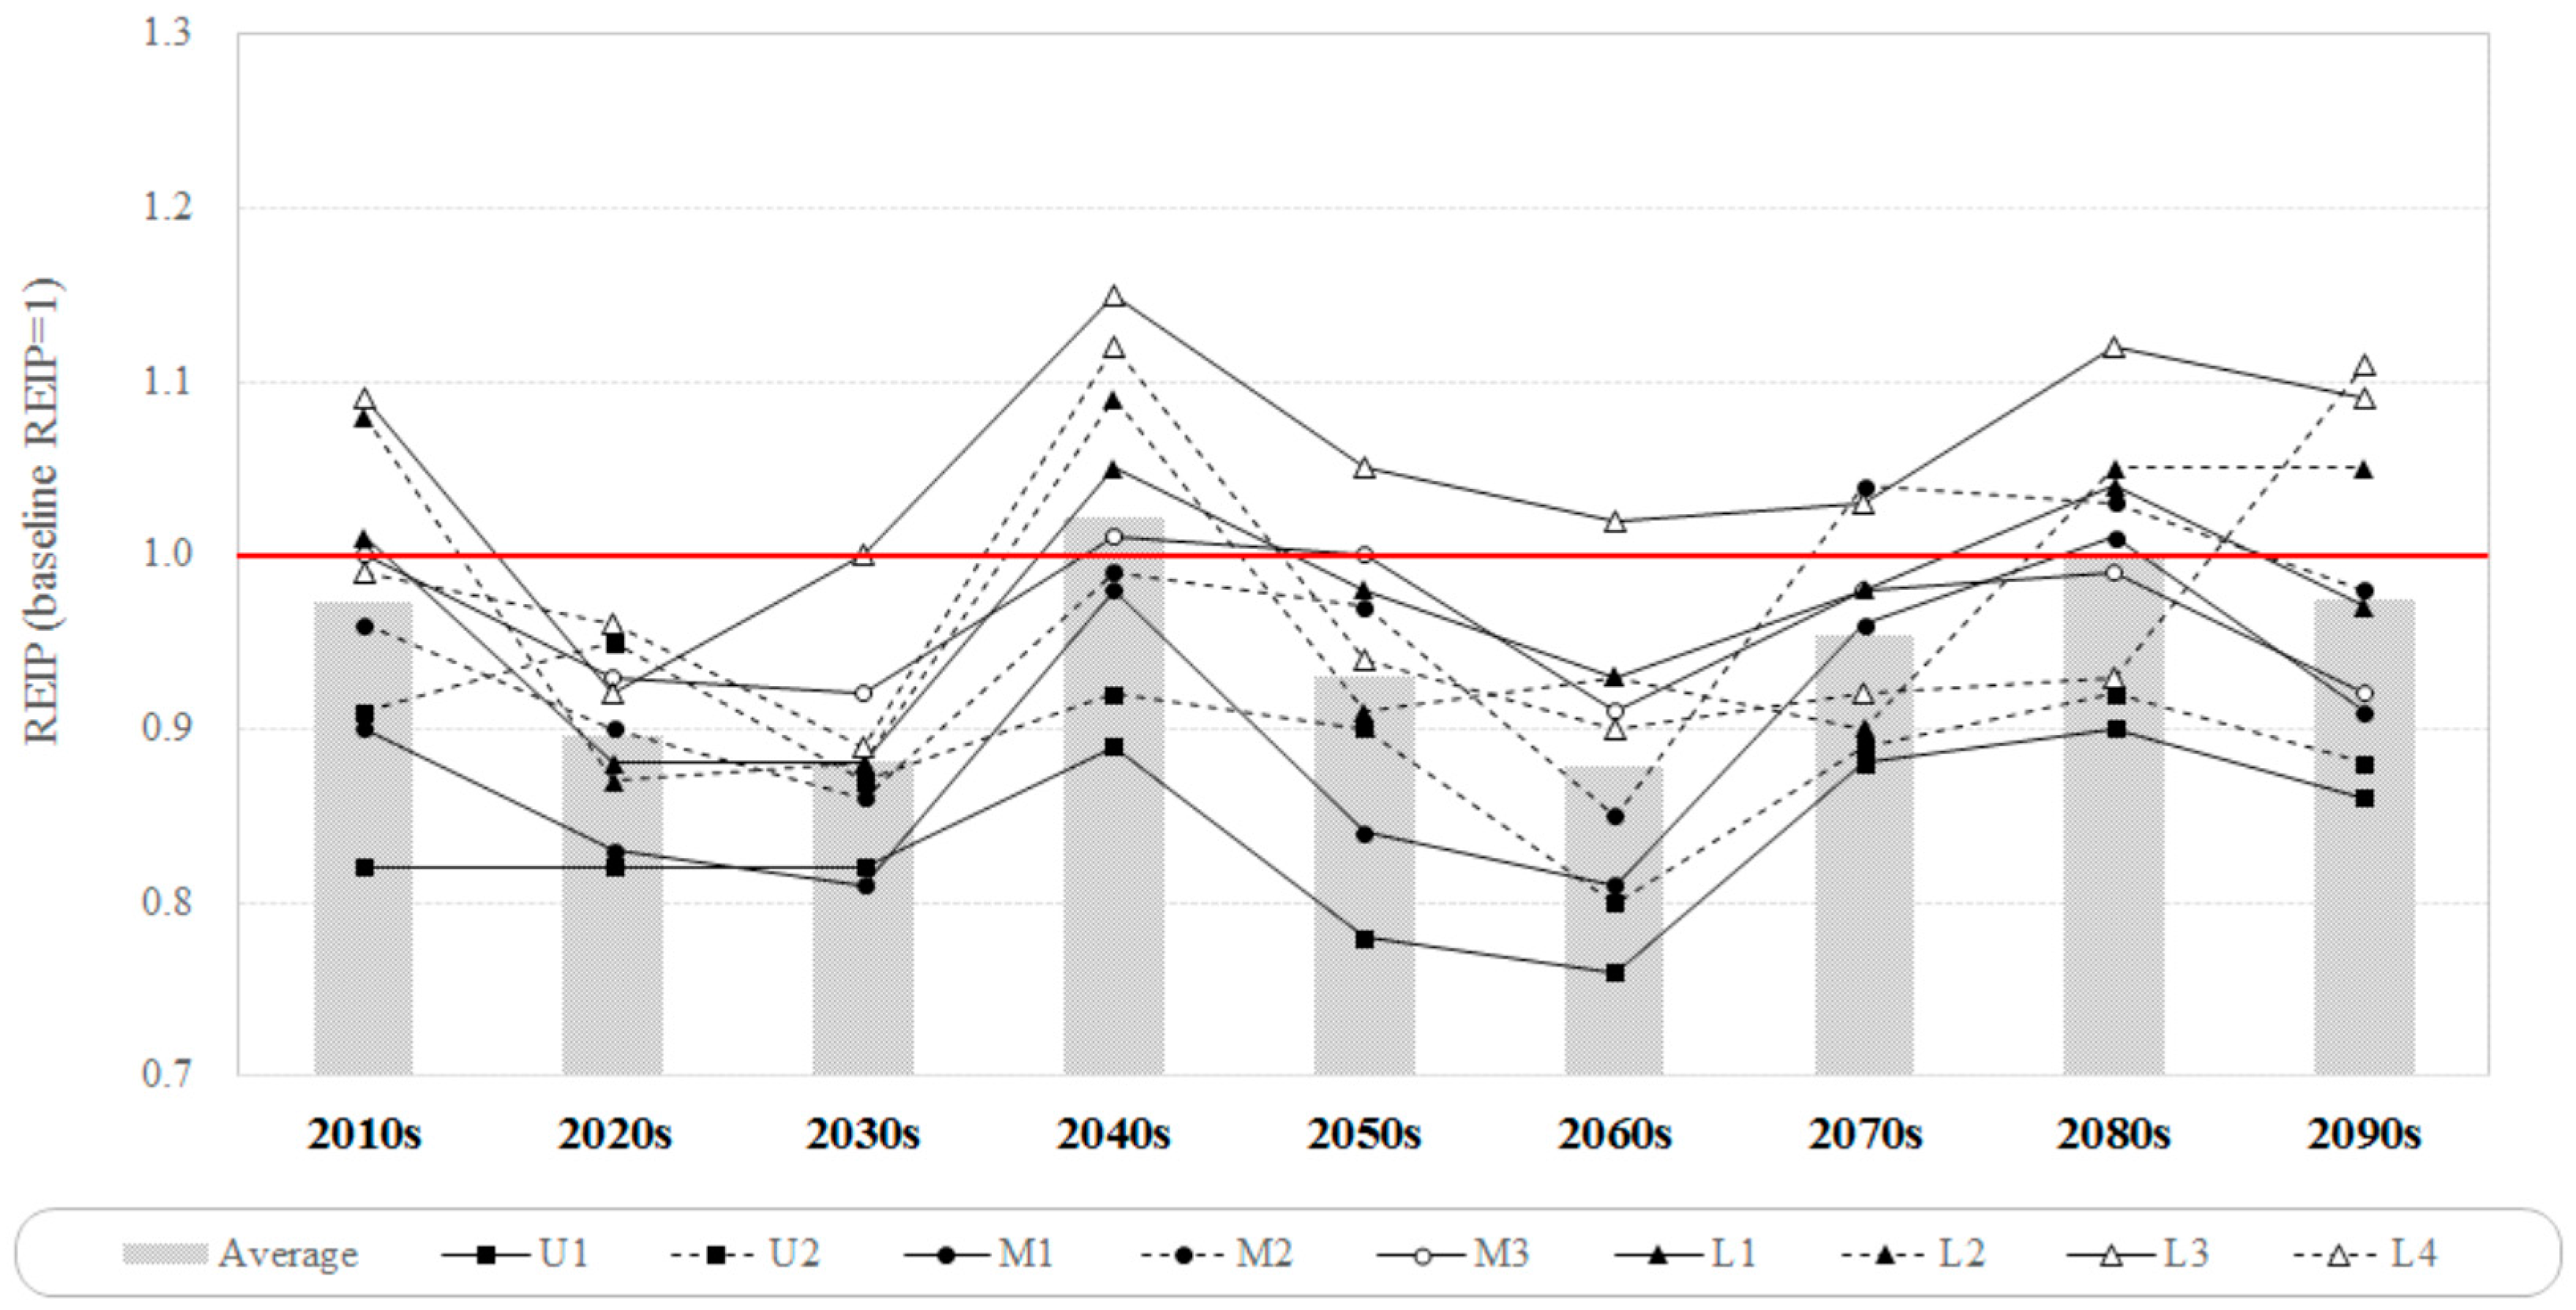
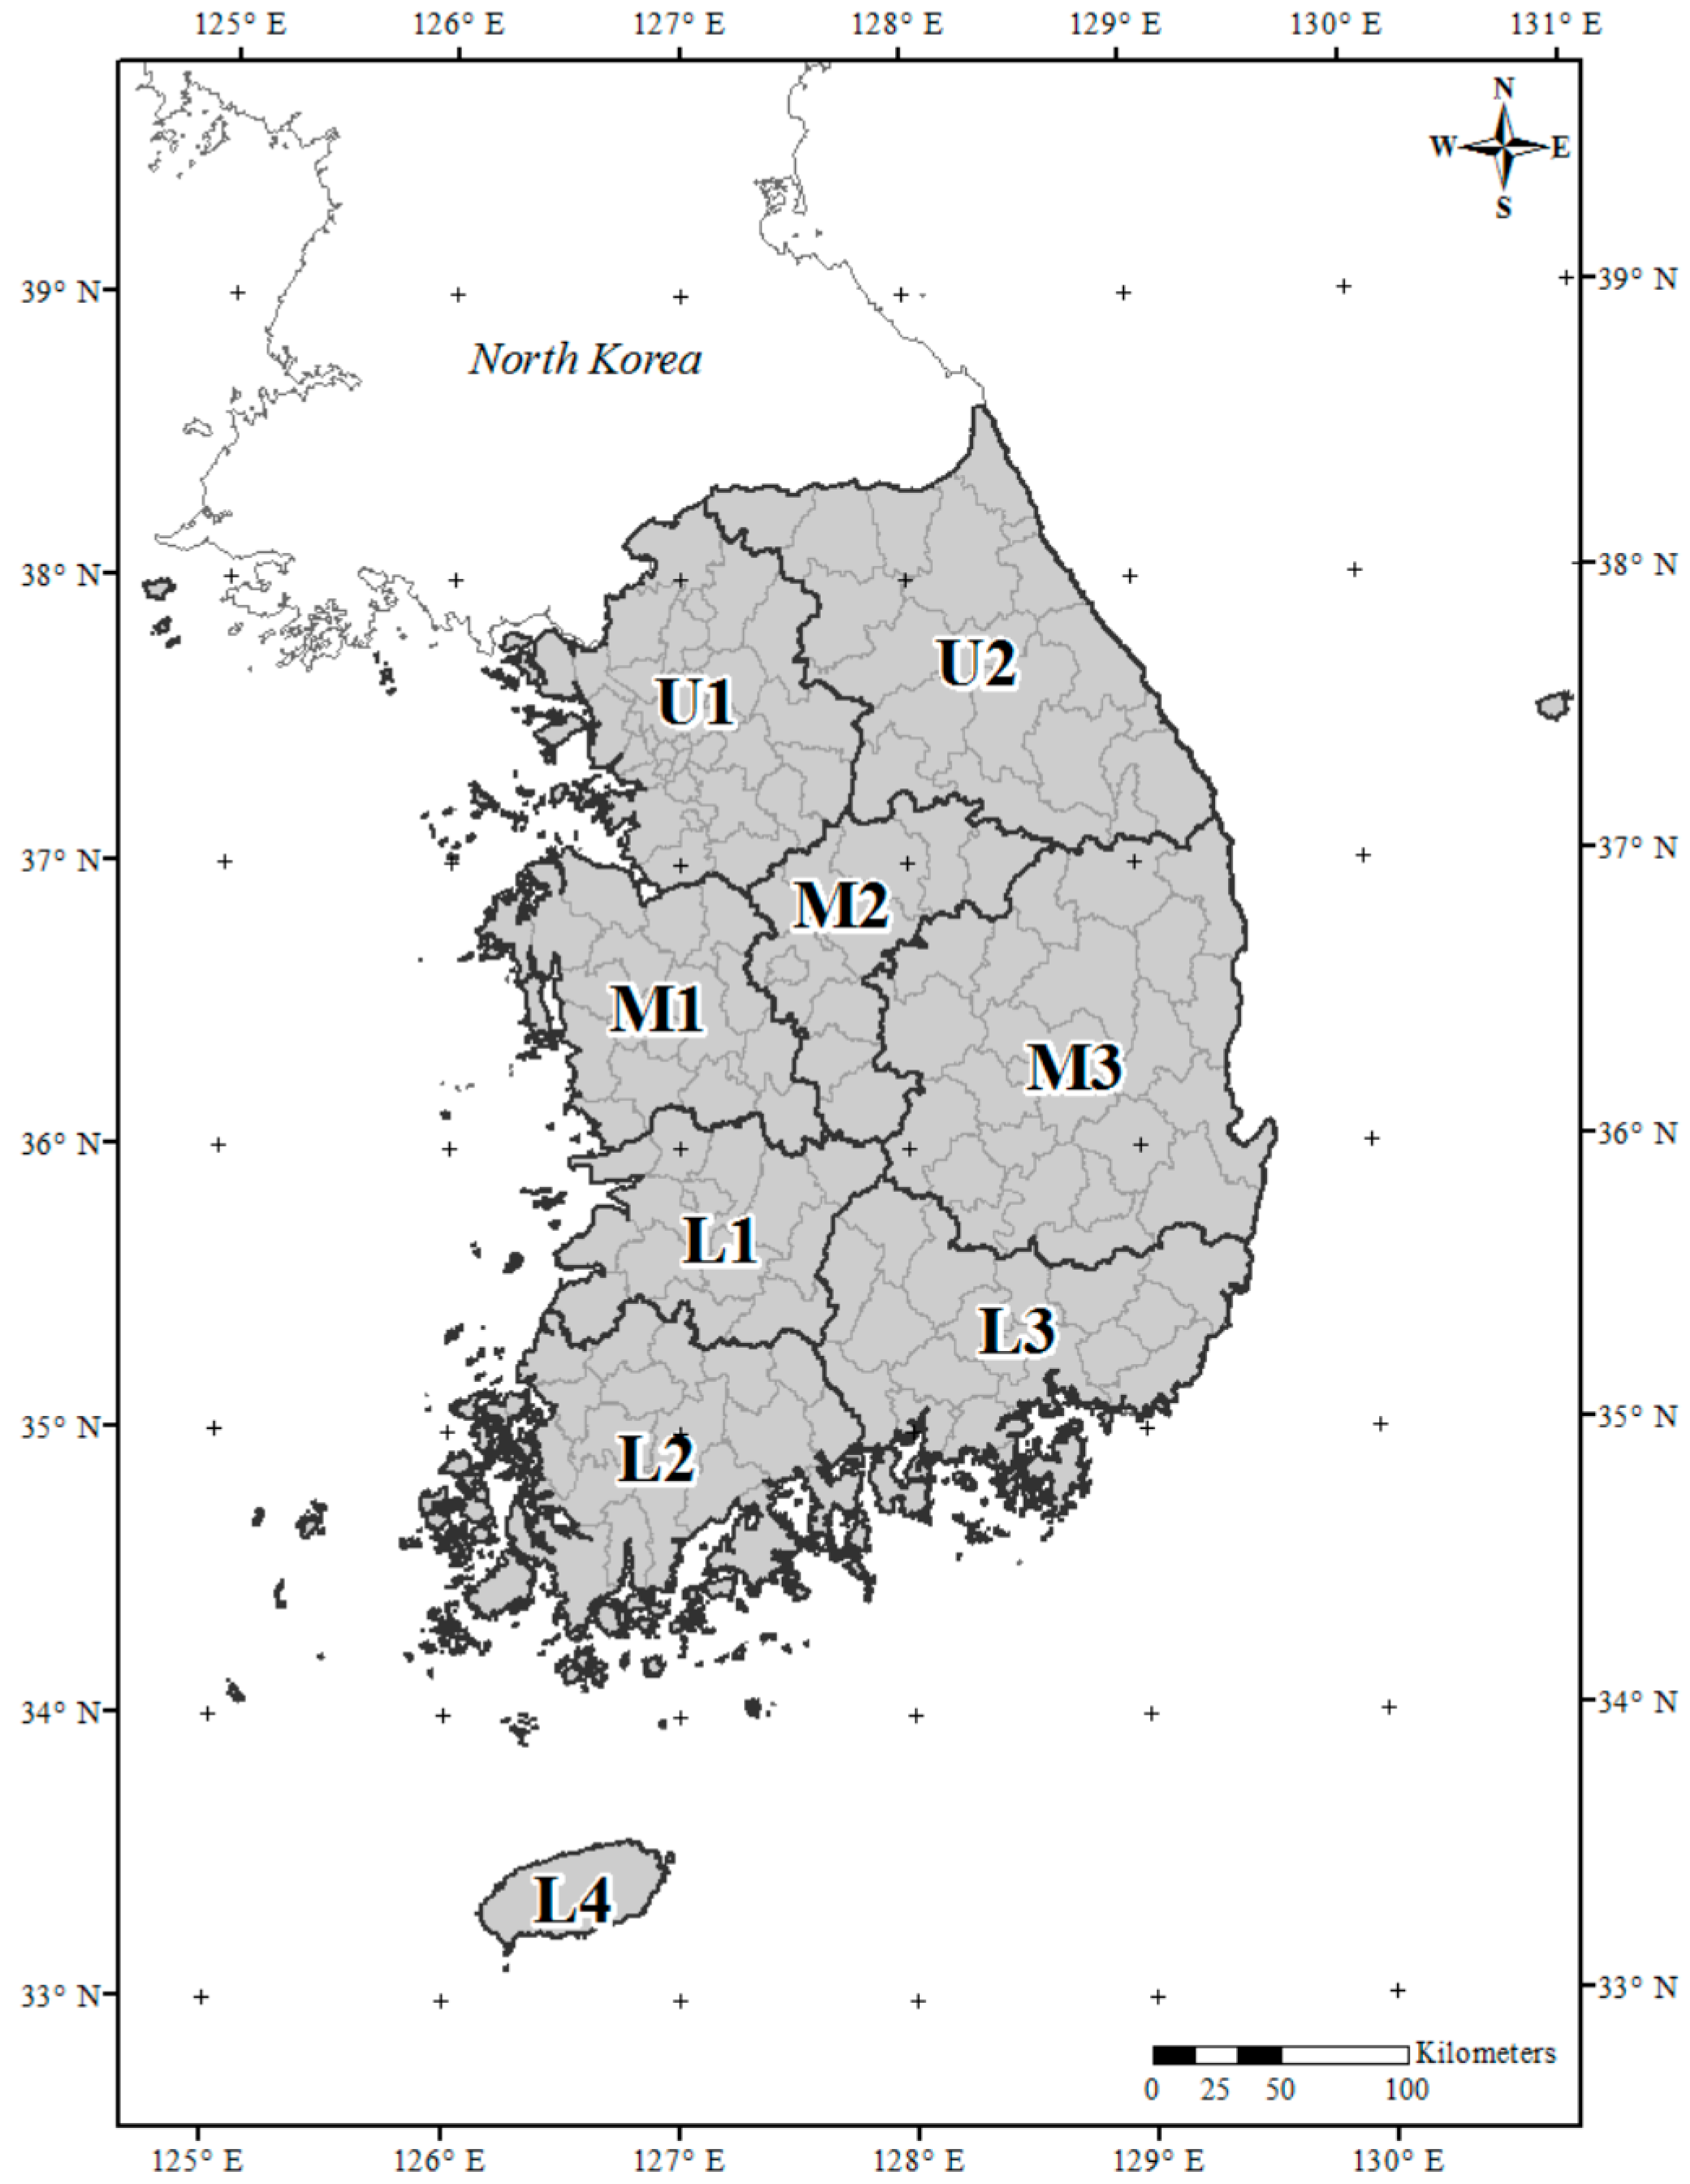
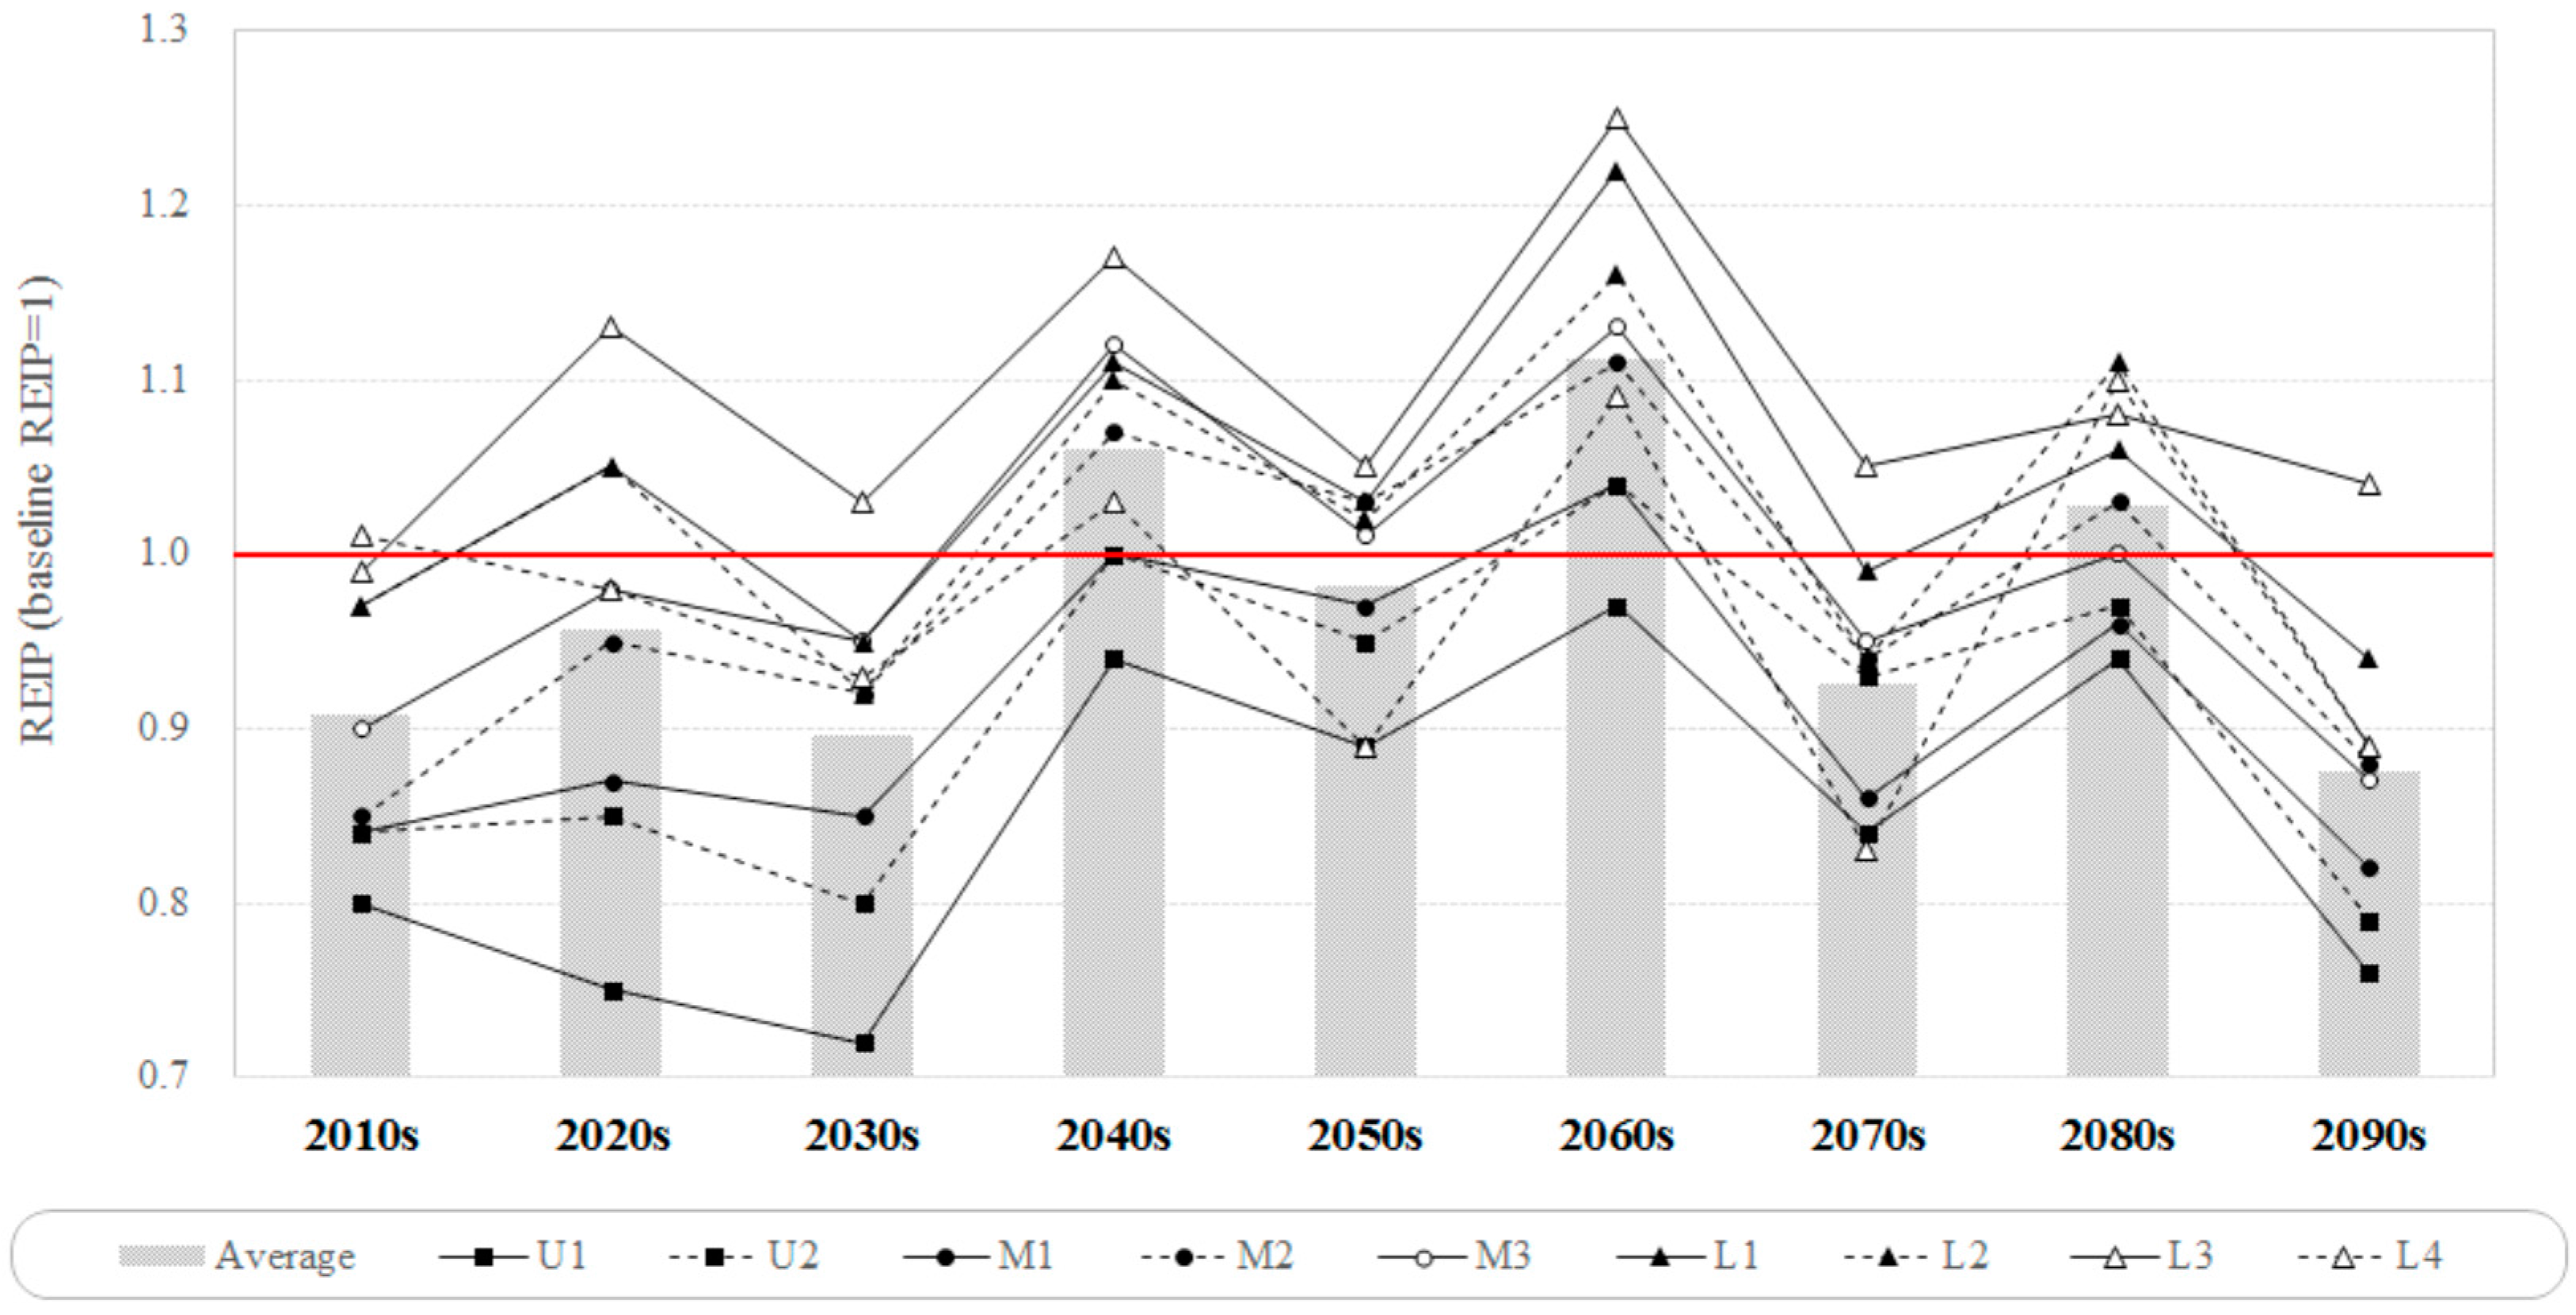
  • Sensitivity of paddy rice to climate change was evaluated using the ratio of effective rainfall to consumptive use (REIP). Higher REIP values indicated favorable water balance conditions, and low sensitivity to climate change, and vice versa. Compared to the REIP values over the past 40 years, sensitivity improved only during the 2040s, 2060s, and 2080s for RCP 4.5, and during the 2040s and 2080s for RCP 8.5. In the regional analysis, both climate change scenarios showed high REIP values for L3 regions, but U1 regions generally showed the lowest REIP values overall, which predicted an increase in sensitivity to climate change.
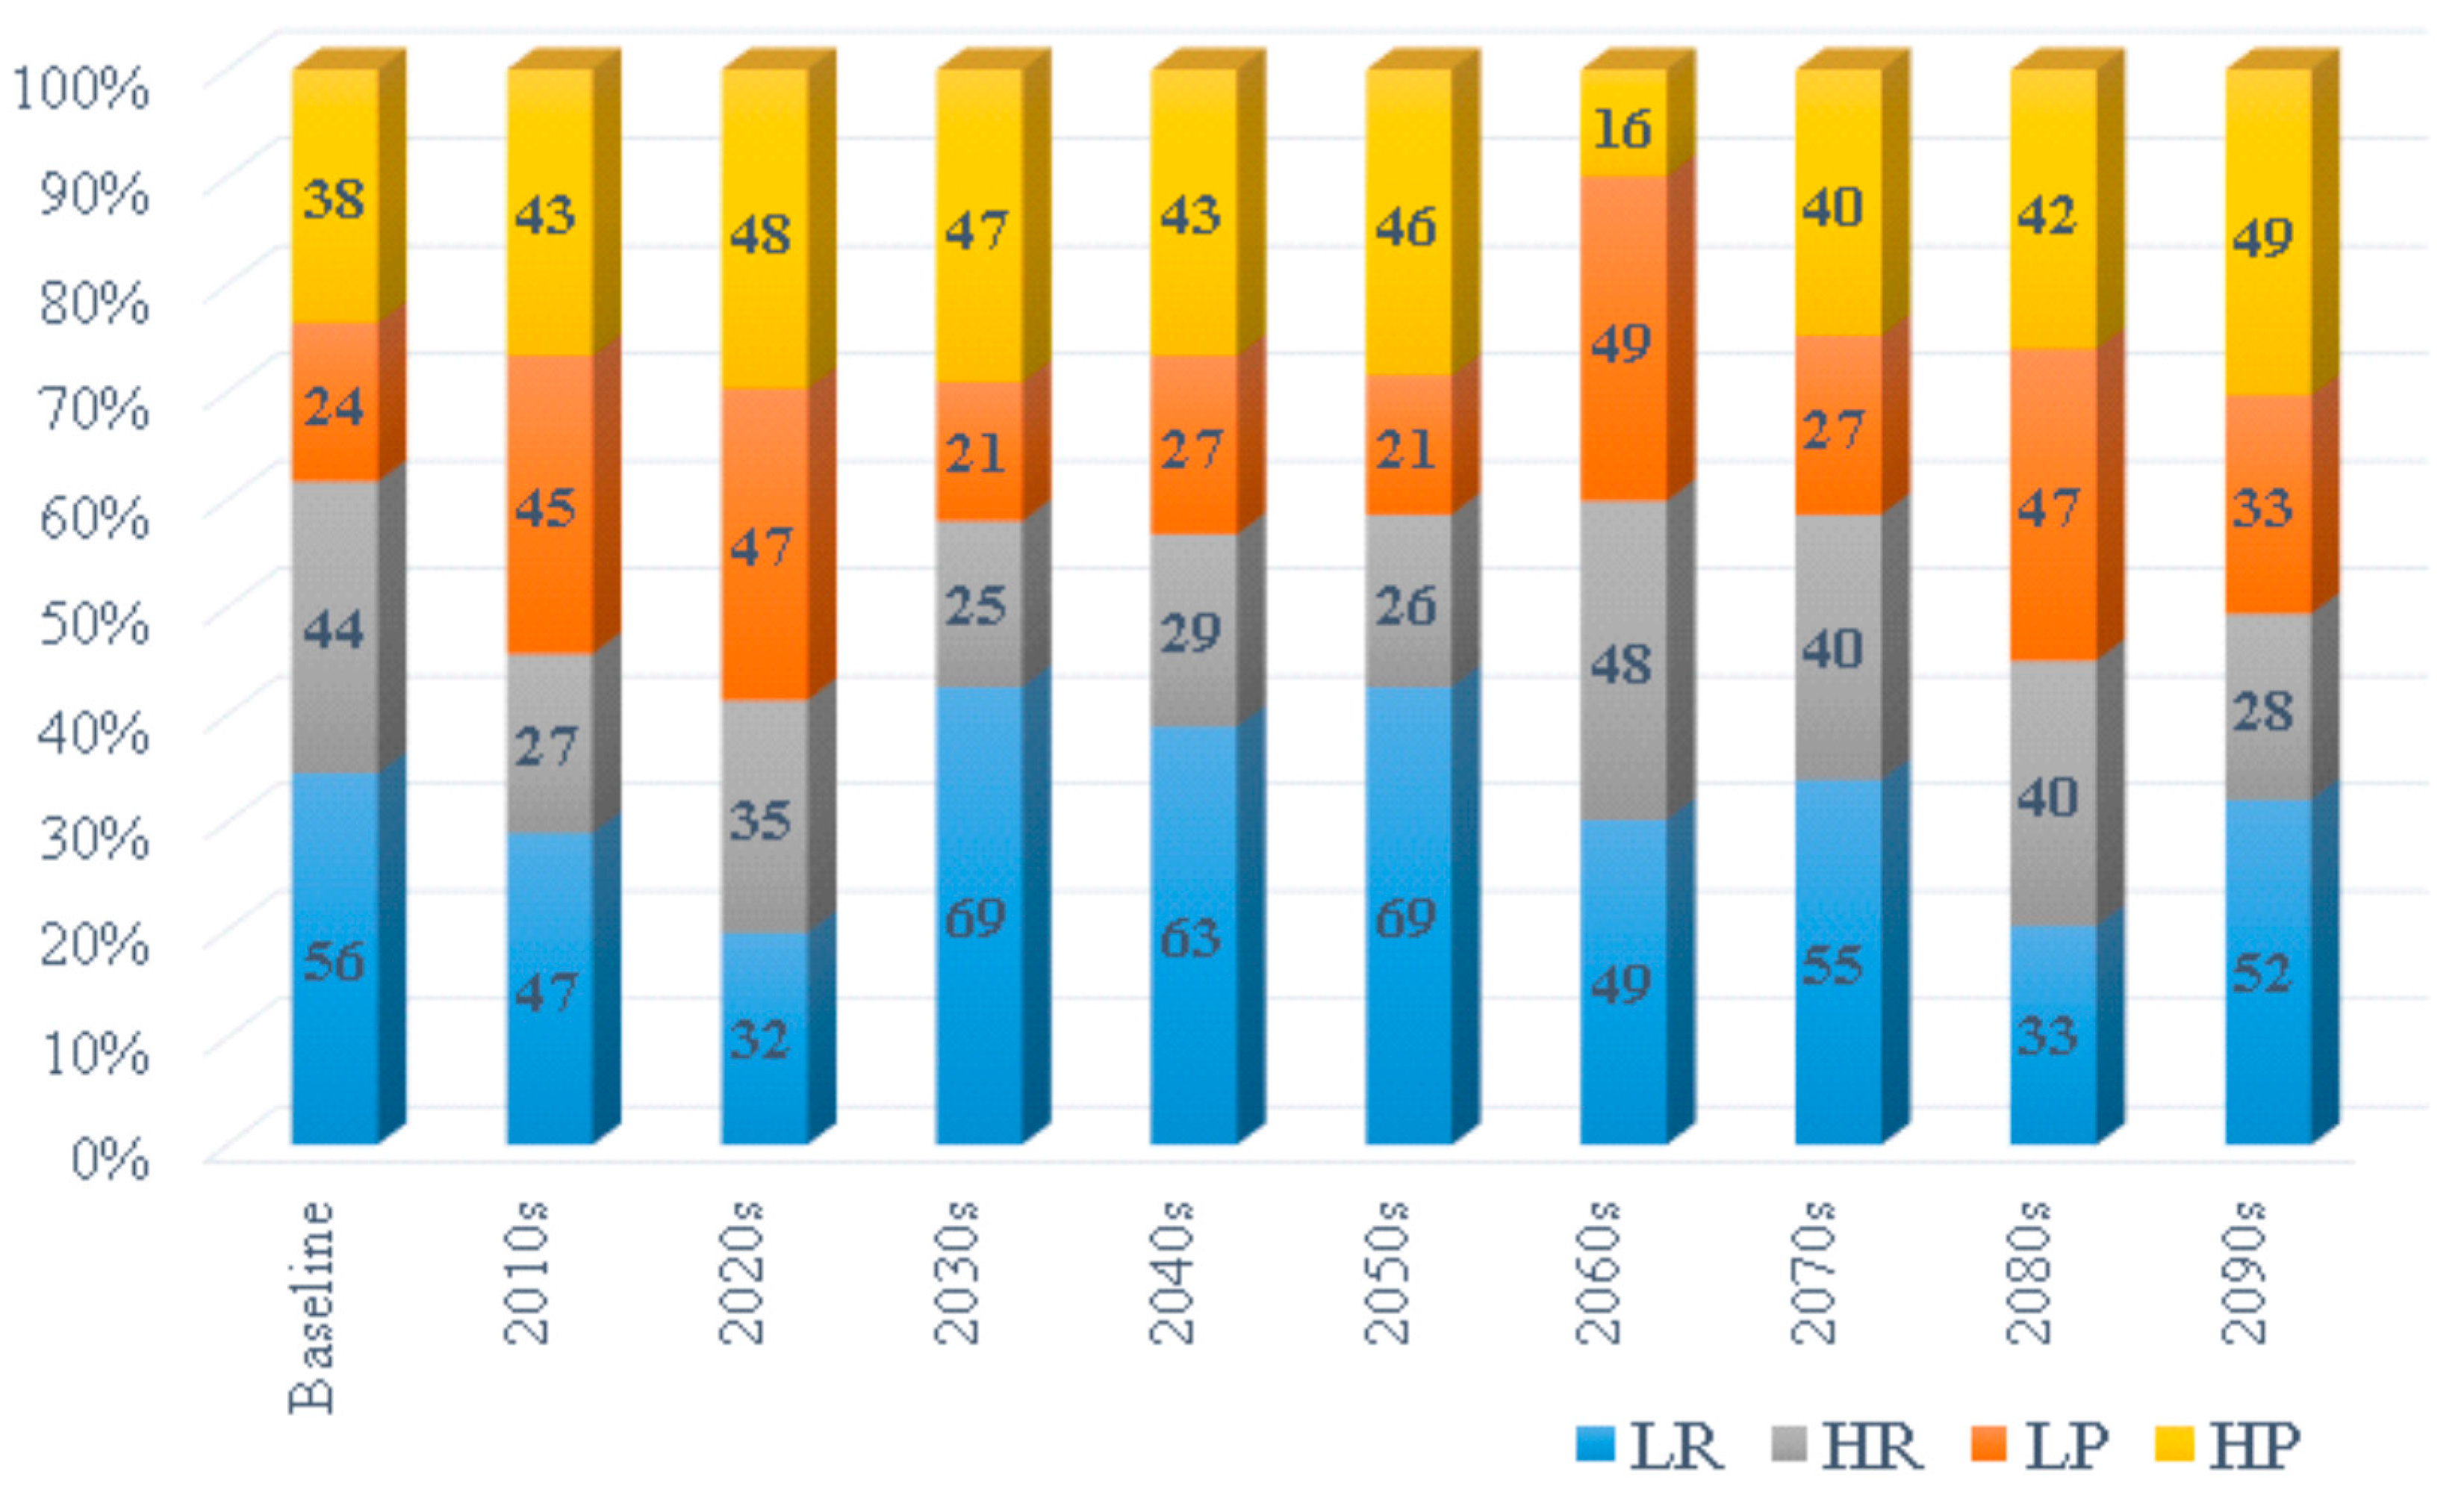
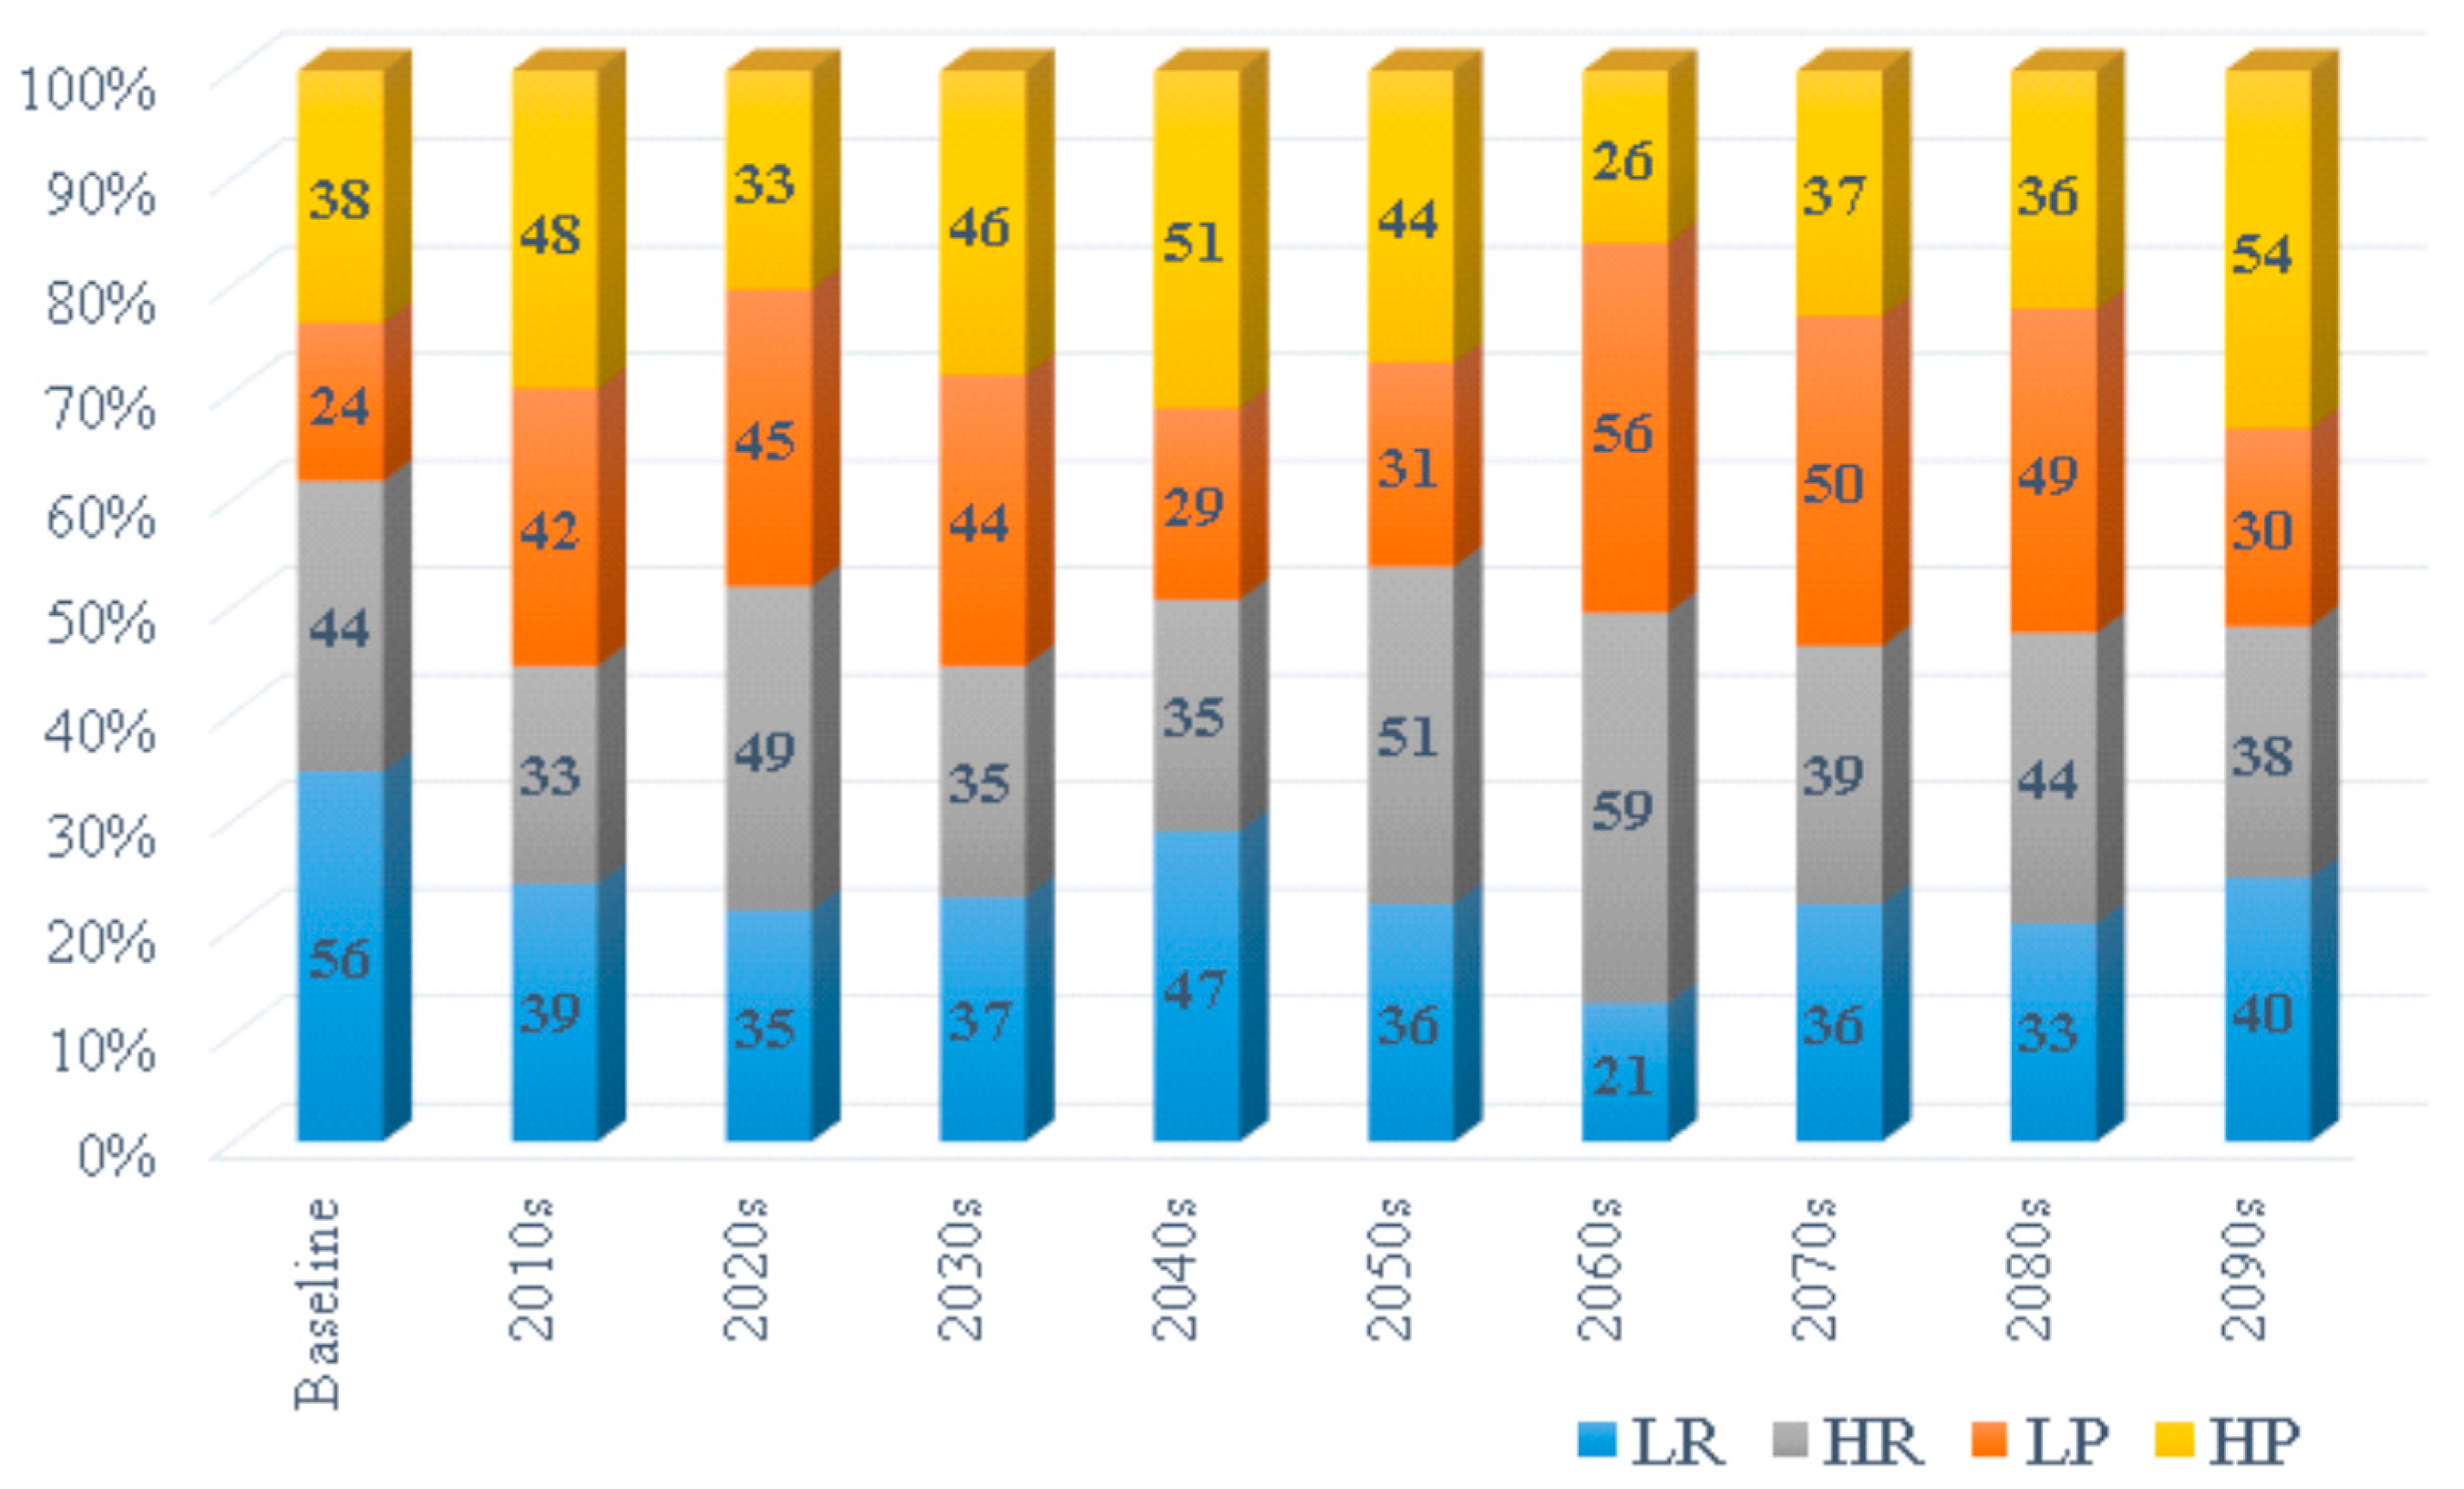
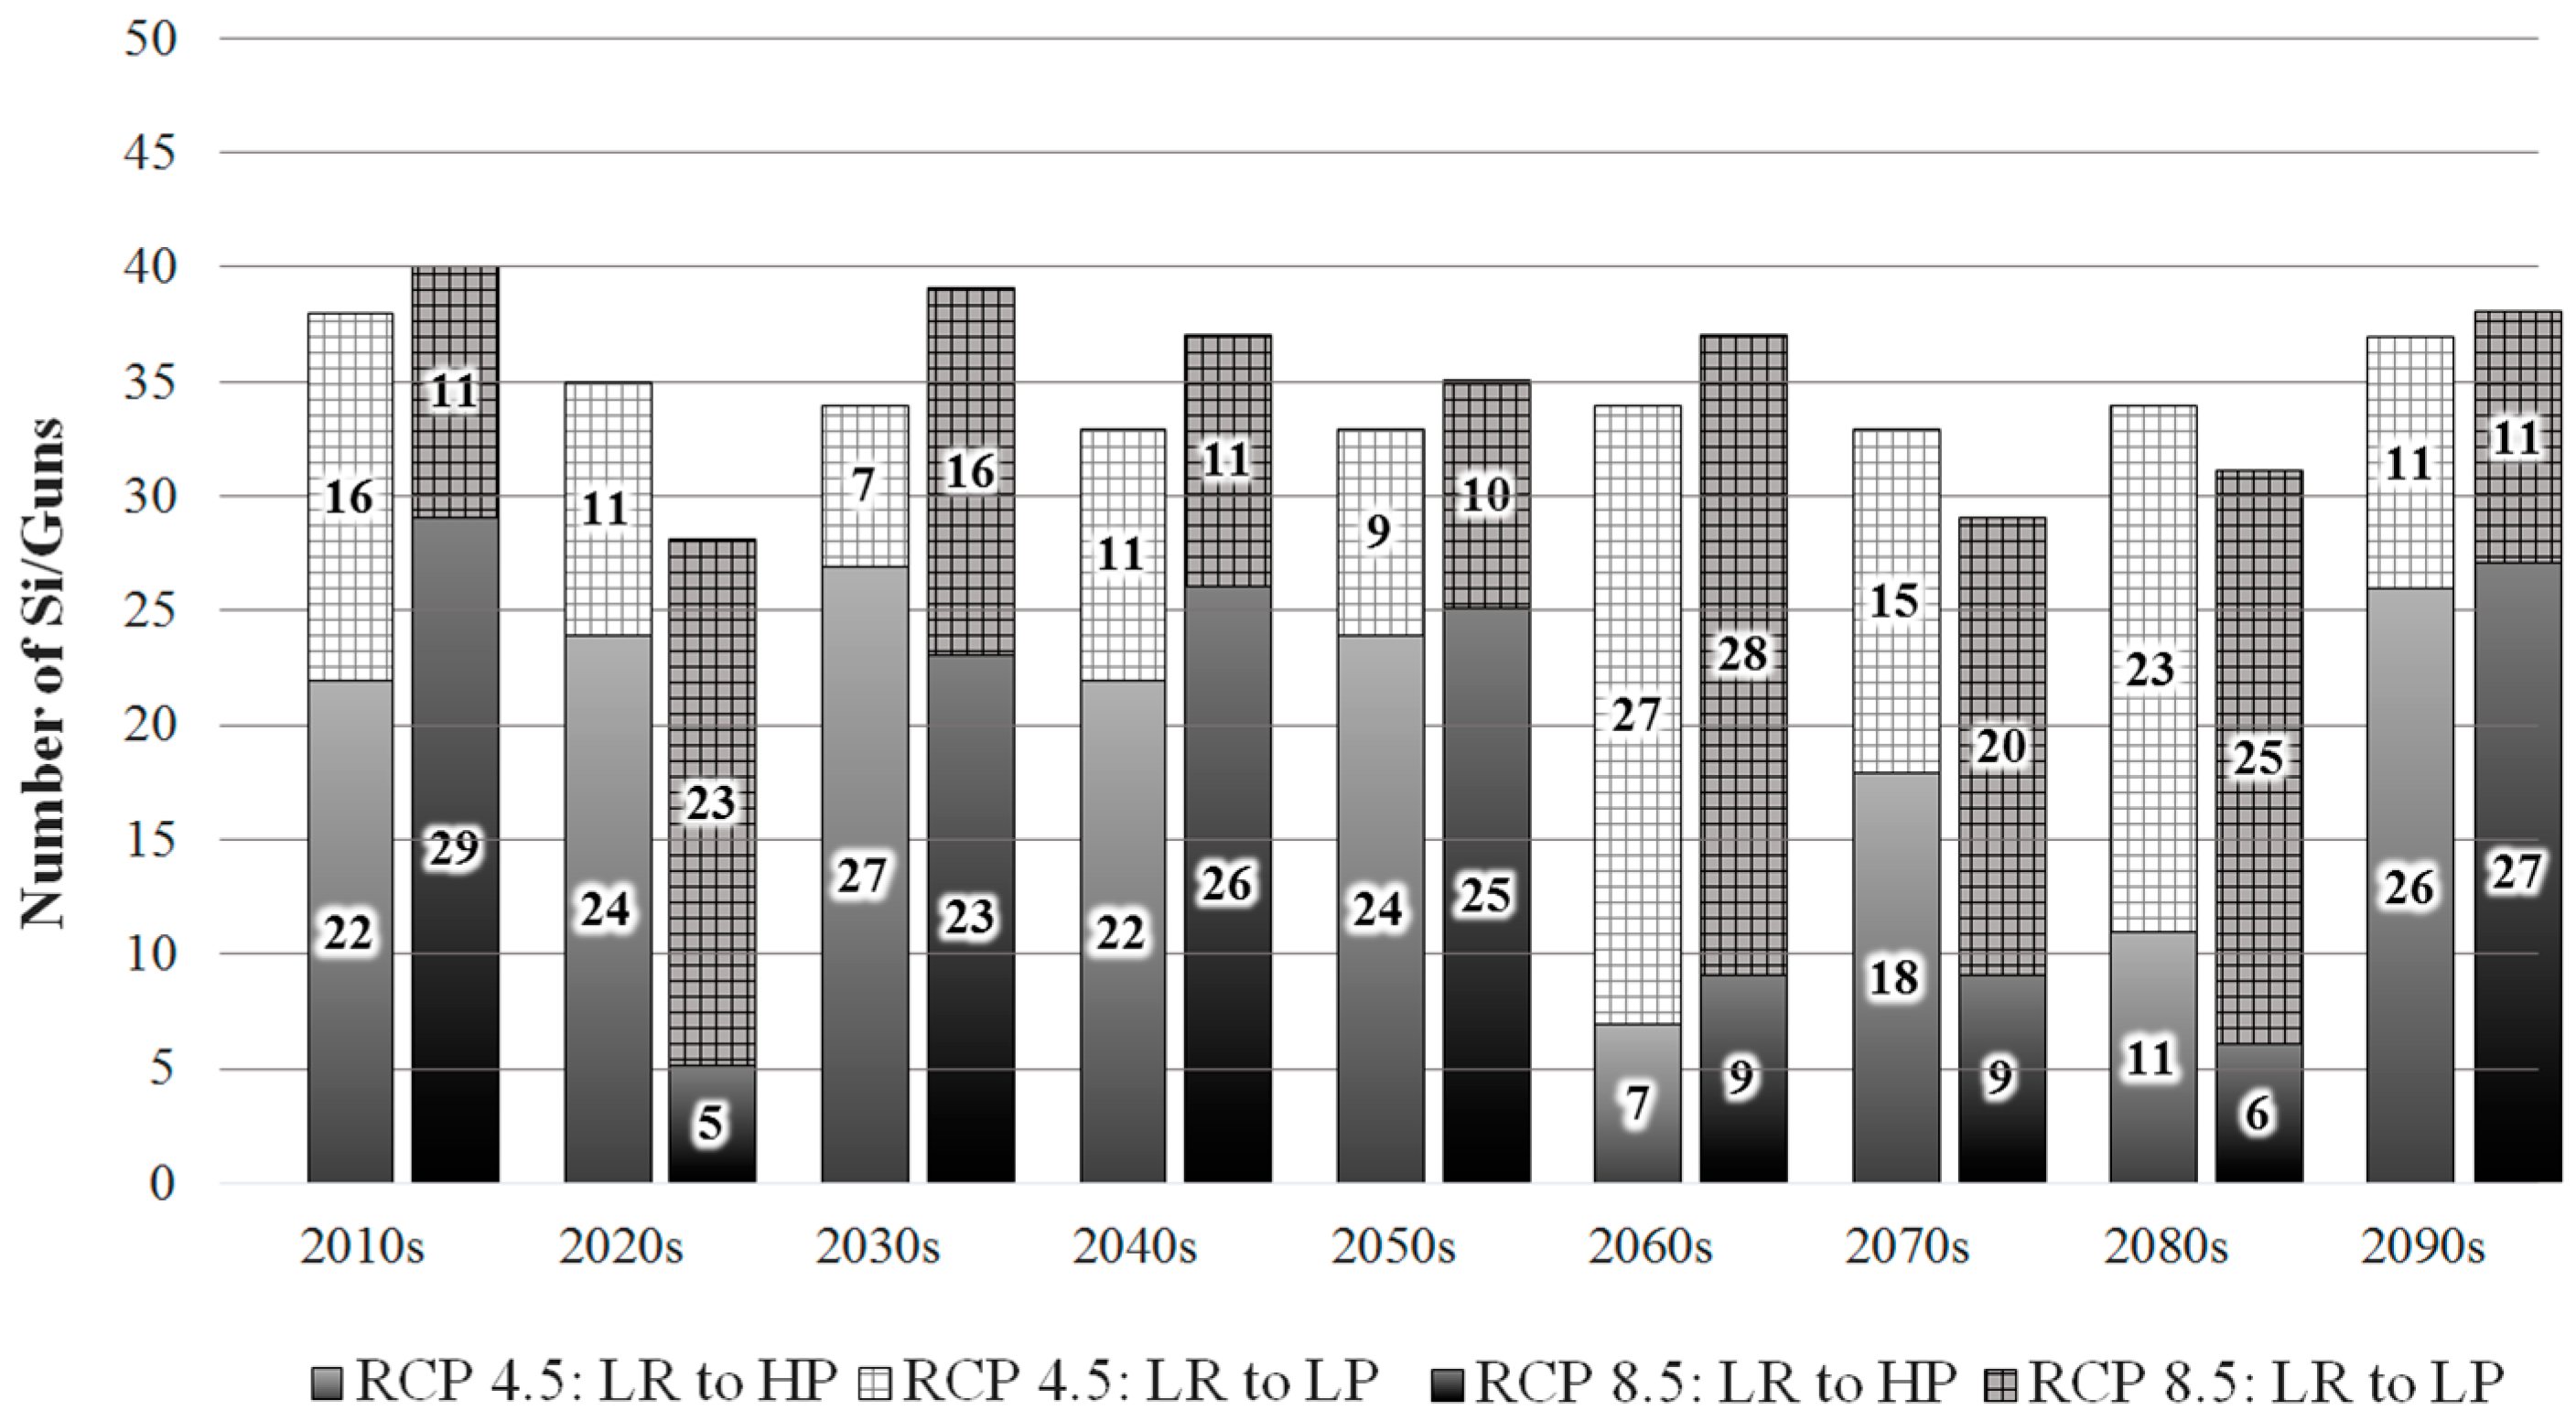
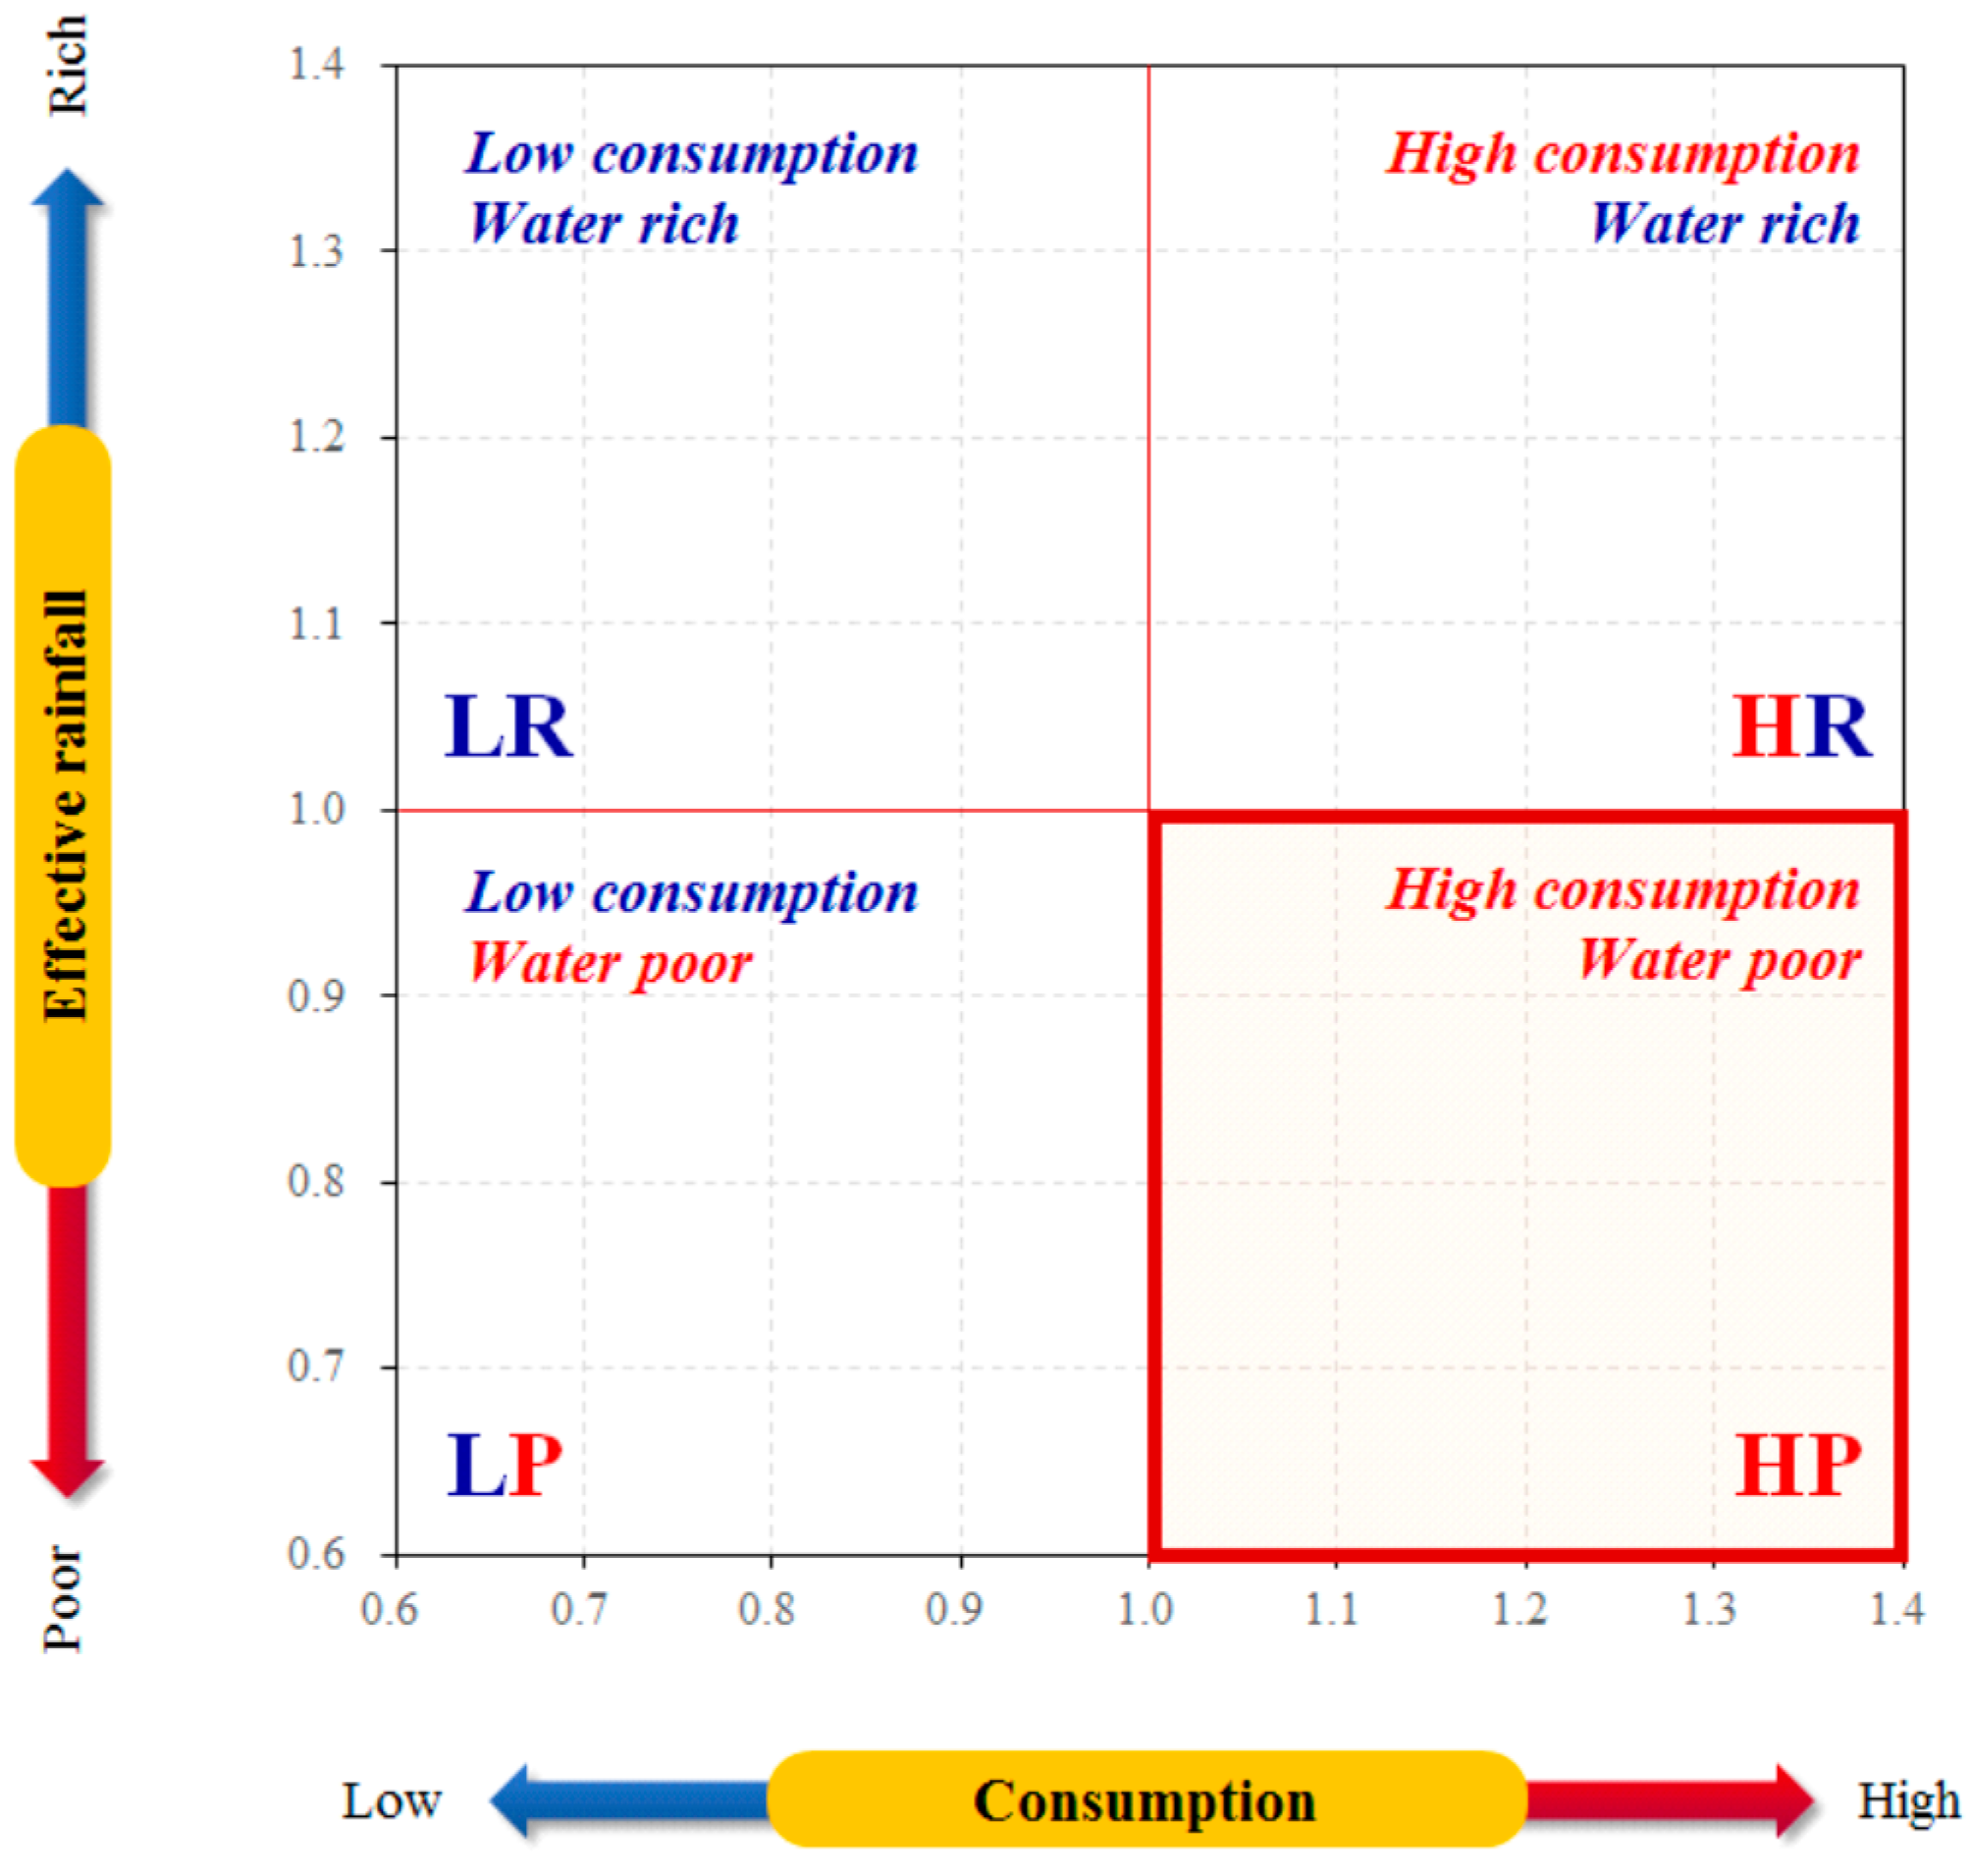
  • Cities and counties were categorized into four sensitivity types using the REIP: low consumption–water rich (LR), low consumption–water poor (LP), high consumption–water poor (HP), and high consumption–water rich (HR). In both RCP scenarios, the number of water-poor regions (LP and HP) increased overall compared to the present. The number of cities and counties that changed from LR to HP over an extended period was highest in the U1 region, which indicated that this region should be a priority for measures to adapt to climate change. However, the M3 region showed a high number of changes from HP to LR, and was predicted to experience the least adverse effects of climate change.
Increases in temperature and rainfall with climate change can alter farming practices, such as transplantation and the growth period, which in turn affect paddy irrigation requirements. This study predicted changes in agricultural water requirements from climate change and provided an index to quantitatively represent the water sensitivity of paddy rice. Furthermore, it provided baseline data for policies and adaptive solutions for agricultural water resources. However, climate change scenarios include some degree of uncertainty and different information can be provided depending on the downscaling techniques or spatial resolution used [20,21,22,23]. Therefore, sensitivity analysis can produce different results. In addition, since the changes in other factors, such as cultivation area or cropping system, from climate change were not considered [24], future studies should address these aspects.

Acknowledgments

This work was supported by the Korean Institute of Planning and Evaluation for Technology in Food, Agriculture, Forestry, and Fisheries (IPET) through Agri-Bio industry Technology Development Program, funded by Ministry of Agriculture, Food, and Rural Affairs (MAFRA) (grant number 313018-3).

Author Contributions

All authors contributed to the design and development of this manuscript. Min-Won Jang and Seungjong Bae conceived and designed the study; Soojin Kim carried out the modeling and data analysis; Seung-Hwan Yoo analyzed the future climate change scenarios; Sorae Kim conducted the statistics analysis and produced the map figures; Soojin Kim and Min-Won Jang wrote the manuscript.

Conflicts of Interest

The authors declare no conflict of interest.

References

  1. Parry, M.; Canziani, O.; Palutikof, J.; van der Linden, P.; Hanson, C. Climate Change 2007: Impacts, Adaption and Vulnerability; Cambridge University Press: Cambridge, UK, 2007. [Google Scholar]
  2. Korea Institute of Construction and Transportation Technology Evaluation and Planning (KICTTEP). Planning Research of Flood Defense Technology for Next Generation; Ministry of Land, Transport and Maritime Affairs: Anyang, Korea, 2008.
  3. Doll, P. Impact of climate change and variability on irrigation requirements: A global perspective. Clim. Chang. 2002, 54, 269–293. [Google Scholar] [CrossRef]
  4. Xiong, W.; Holman, I.; Lin, E.; Conway, D.; Jiang, J.; Xu, Y.; Li, Y. Climate change, water availability and future cereal production in China. Agric. Ecosyst. Environ. 2010, 135, 58–69. [Google Scholar] [CrossRef]
  5. Gondim, R.; Maia, M.; de Castro, M. Climate change and irrigation water need sensitivity analysis. Proc. Soc. Behav. Sci. 2010, 2, 7666–7667. [Google Scholar] [CrossRef]
  6. Li, Y.; Wu, W.; Ge, Q.; Zhou, Y.; Xu, C. Simulating Climate Change Impacts and Adaptive Measures for Rice Cultivation in Hunan Province, China. J. Appl. Meteorol. Climatol. 2016, 55, 1359–1376. [Google Scholar] [CrossRef]
  7. Chung, S.O. Climate change impacts on paddy irrigation requirement in the Nakdong river basin. J. Korean Soc. Agric. Eng. 2009, 51, 35–41. [Google Scholar] [CrossRef]
  8. Yun, D.-K.; Chung, S.-O.; Kim, S.-J. Climate change impacts on paddy water requirement. J. Korean Soc. Agric. Eng. 2011, 53, 39–47. [Google Scholar] [CrossRef]
  9. Lee, T.S.; Choi, J.Y.; Yoo, S.H.; Lee, S.H.; Oh, Y.G. Analyzing consumptive use of water and yields of paddy rice by climate change. J. Korean Soc. Agric. Eng. 2012, 54, 47–54. [Google Scholar] [CrossRef]
  10. Yoo, S.H.; Choi, J.Y.; Lee, S.H.; Oh, Y.G.; Park, N.Y. The impacts of climate change on paddy water demand and unit duty of water using high-resolution climate scenarios. J. Korean Soc. Agric. Eng. 2012, 54, 15–26. [Google Scholar] [CrossRef]
  11. McCarthy, J.J.; Canziani, O.F.; Leary, N.A.; Dokken, D.J.; White, K.S. Climate Change 2001: Impacts, Adaptation and Vulnerability; Cambridge University Press: Cambridge, UK, 2001. [Google Scholar]
  12. Fűssel, H.M.; Klein, R.J.T. Climate change vulnerability assessments: An evolution of conceptual thinking. Clim. Chang. 2006, 75, 301–329. [Google Scholar] [CrossRef]
  13. Fűssel, H.M. Review and Quantitative Analysis of Indices of Climate Change Exposure, Adaptive Capacity, Sensitivity, and Impacts; World Bank: Washington, DC, USA, 2010. [Google Scholar]
  14. Fellman, T. The assessment of climate change-related vulnerability in the agricultural sector: Reviewing conceptual frameworks. In Building Resilience for Adaptation to Climate Change in the Agriculture Sector, Proceedings of a Joint FAO/OECD Workshop, Rome, Italy, 23–24 April 2012; FAO: Rome, Italy, 2012; pp. 37–61. [Google Scholar]
  15. Korea Meteorological Administration (KMA). Korean Climate Change Assessment Report 2014; Korea Meteorological Administration: Seoul, Korea, 2014.
  16. Allen, R.G.; Pereira, L.S.; Raes, D.; Smith, M. Crop Evapotranspiration—Guidelines for Computing Crop Water Requirements—FAO Irrigation and Drainage Paper 56; Food and Agriculture Organization of the United Nations: Rome, Italy, 1998. [Google Scholar]
  17. Yoo, S.H.; Choi, J.Y.; Jang, M.W. Estimation of design water requirement using FAO Penman—Monteith and optimal probability distribution function in South Korea. Agric. Water Manag. 2008, 95, 845–853. [Google Scholar] [CrossRef]
  18. Lee, N.H. Simulating Daily Operation of Water Management System of Irrigation Districts. Ph.D. Thesis, Seoul National University, Seoul, Korea, 1988. [Google Scholar]
  19. Jang, M.W.; Chung, H.W.; Choi, J.Y.; Park, K.W.; Bae, S.J. Development a single reservoir agricultural drought evaluation model for paddy. J. Korean Soc. Agric. Eng. 2004, 46, 17–30. [Google Scholar]
  20. Choi, J.Y.; Yoo, S.H.; Oh, Y.G.; Lee, S.H.; Yun, D.K. Evaluation of the future agricultural water demand under the climate change scenarios. In Water for Future; Korea Water Resources Association: Seoul, Korea, 2012; Volume 45, pp. 73–83. [Google Scholar]
  21. Chen, J.; Brissette, F.P.; Leconte, R. Uncertainty of downscaling method in quantifying the impact of climate change on hydrology. J. Hydrol. 2011, 401, 190–202. [Google Scholar] [CrossRef]
  22. Deser, C.; Phillips, A.; Bourdette, V.; Teng, H. Uncertainty in climate change projections: The role of internal variability. Clim. Dyn. 2012, 38, 527–546. [Google Scholar] [CrossRef]
  23. Oh, S.G.; Suh, M.S.; Lee, Y.S.; Ahn, J.B.; Cha, D.H.; Lee, D.K.; Hong, S.Y.; Min, S.K.; Park, S.C.; Kang, H.S. Projections of high resolution climate change for South Korea using multiple-regional climate models based on four RCP scenarios. Part 2: precipitation. Asia-Pac. J. Atmos. Sci. 2016, 52, 171–189. [Google Scholar] [CrossRef]
  24. Li, Z.; Liu, W.; Zhang, X.; Zheng, F. Impacts of land use change and climate variability on hydrology in an agricultural catchment on the Loess Plateau of China. J. Hydrol. 2009, 377, 35–42. [Google Scholar] [CrossRef]
Figure 1. Procedures for evaluating sensitivity of paddy rice to climate change.
Water 08 00554 g001
Figure 2. Categorizing model for sensitivity types of paddy rice.
Water 08 00554 g002
Figure 3. The nine regions corresponding to provinces (U1: Gyeonggi, U2: Gangwon, M1: Chungcheongnam, M2: Chungcheongbuk, M3: Gyeongsangbuk, L1: Jeollabuk, L2: Jeollanam, L3: Gyeongsangnam, and L4: Jeju).
Water 08 00554 g003
Figure 4. Temporal and regional changes in the REIP for climate change scenario RCP 4.5.
Water 08 00554 g004
Figure 5. Temporal and regional changes in the REIP for climate change scenario RCP 8.5.
Water 08 00554 g005
Figure 6. Spatial distribution of the REIP under different RCP Scenarios: (a) distribution of average REIP during the baseline period (1971–2010); (b) the 2060s with the most favorable REIP under the RCP 4.5 scenario; (c) the 2090s with the least favorable REIP under the RCP 4.5 scenario; (d) the 2040s with the most favorable REIP under the RCP 8.5 scenario; and (e) the 2060s with the least favorable REIP under the RCP 8.5 scenario.
Water 08 00554 g006
Figure 7. Regional distribution of sensitivity types for scenario RCP 4.5. Water-poor regions were highest in the 2020s and LR regions were highest in the 2030s and 2050s.
Water 08 00554 g007
Figure 8. Regional distribution of sensitivity types for scenario RCP 8.5. The 2030s had the highest number of water-poor regions and the 2010s and 2030s had the highest number of LR regions.
Water 08 00554 g008
Figure 9. Comparison of changes in sensitivity types (LR to HP, HP to LR) with future climate change scenarios.
Water 08 00554 g009
Figure 10. Results of regional sensitivity changes according to RCP scenarios (Red: LR to HP, Blue: HP to LR), (a) under RCP 4.5 Scenario and (b) under RCP 8.5 scenario.
Water 08 00554 g010
Table 1. Past climate data and future climate change scenarios used in this study.
PeriodNo. of Meteorological StationsClimate DataSource
1970s (1971–1980)62ObservedKMA
1980s (1981–1990)68ObservedKMA
1990s (1991–2000)72ObservedKMA
2000s (2001–2010)81ObservedKMA
2010s (2011–2020) to 2090s (2091–2100)60Climatic change scenarios (RCP 4.5 and 8.5)KMA
Note: KMA: Korea Meteorological Administration.
Table 2. Crop coefficients for calculating AET (actual crop evapotranspiration) based on Penman-Monteith equation [17].
Days after Transplanting102030405060708090100110120
Crop coefficients0.780.971.071.161.281.451.501.581.461.451.251.01
Table 3. Desirable ponding depth by growth stages for rice paddy [19].
Days Since Seeding30407090110130
Growth stagePre-plantingTrans-plantingTilleringElongationHeadingRipening
Ponding depth20604002030303040400
Table 4. Results of annual precipitation, consumptive use, effective rainfall, and net water requirements for paddy fields under RCP scenarios in South Korea.
PeriodPR (mm)CU (mm)ER (mm)IR (mm)
RCP 4.5RCP 8.5RCP 4.5RCP 8.5RCP 4.5RCP 8.5RCP 4.5RCP 8.5
1970s748547472583
1980s876539498559
1990s890536488562
2000s954522515521
2010s851918576549473492605571
(−1.8%)(5.9%)(7.4%)(2.4%)(−4.1%)(−0.3%)(8.7%)(2.6%)
2020s939893555575485467584623
(8.3%)(3.0%)(3.5%)(7.2%)(−1.6%)(−5.2%)(4.9%)(11.9%)
2030s865848594579492470602626
(−0.2%)(−2.2%)(10.7%)(7.9%)(−0.2%)(−4.6%)(8.3%)(12.6%)
2040s10661057550581541549534548
(22.9%)(21.9%)(2.6%)(8.4%)(9.7%)(11.4%)(−4.0%)(−1.6%)
2050s990996573600518508569602
(14.2%)(14.9%)(6.9%)(11.9%)(5.1%)(3.0%)(2.3%)(8.3%)
2060s1235869564627578499496616
(42.5%)(0.2%)(5.1%)(16.9%)(17.2%)(1.2%)(−10.9%)(10.8%)
2070s10181093600605506532609594
(17.4%)(26.1%)(11.8%)(12.9%)(2.7%)(7.9%)(9.4%)(6.8%)
2080s10621150566597533551538571
(22.5%)(32.7%)(5.5%)(11.4%)(8.2%)(11.7%)(−3.2%)(2.6%)
2090s8861127611641489570620590
(2.2%)(30.0%)(13.9%)(19.5%)(−0.8%)(15.7%)(11.5%)(6.2%)
Notes: PR: Precipitation, CU: Consumptive use, ER: Effective rainfall, IR: Net water requirement; Percentage to the baseline (the average of 1971–2010) in parentheses; bold numbers: the most unfavorable case in terms of water balance.
Table 5. Temporal and regional averages and standard deviations of Rainfall Effectiveness Index for Paddy fields (REIP).
PeriodRCP 4.5RCP 8.5RegionRCP 4.5RCP 8.5
AvgStdAvgStdRegionAvgStdAvgStd
2010s0.910.0780.970.087U10.850.0930.840.049
2020s0.960.1170.900.050U20.910.0910.890.042
2030s0.900.0920.880.056M10.910.0800.890.076
2040s1.060.0731.020.088M20.980.0890.950.069
2050s0.980.0610.930.083M30.990.0890.960.041
2060s1.110.0900.880.081L11.040.0890.970.062
2070s0.930.0720.950.059L21.020.0940.970.092
2080s1.030.0631.000.071L31.090.0811.050.070
2090s0.880.0830.970.091L40.970.0940.970.086
Avg0.970.0810.950.074Avg0.970.0890.950.065
Notes: Avg: Average, Std: Standard deviation, bold: the minimum REIP.

