Article

Assessment of Non-Point Source Total Phosphorus Pollution from Different Land Use and Soil Types in a Mid-High Latitude Region of China

1
State Key Laboratory of Remote Sensing Science, School of Geography, Beijing Normal University, Beijing Key Laboratory for Remote Sensing of Environment and Digital Cities, Beijing 100875, China
2
College of Resource and Environment Engineering, Guizhou University, Guiyang 550025, China
3
Yellow River Institute of Hydraulic Research, Yellow River Conservancy Commission, Zhengzhou 450003, China
4
School of Geography and Environment Science, Guizhou Normal University, Guiyang 550001, China
*
Author to whom correspondence should be addressed.
Water 2016, 8(11), 505; https://doi.org/10.3390/w8110505
Submission received: 4 September 2016 / Revised: 24 October 2016 / Accepted: 27 October 2016 / Published: 3 November 2016
(This article belongs to the Special Issue Water Quality and Health)

Abstract

:
The transport characteristics of phosphorus in soil and the assessment of its environmental risk have become hot topics in the environmental and agricultural fields. The Sanjiang Plain is an important grain production base in China, and it is characterised by serious land use change caused by large-scale agricultural exploitation. Agricultural inputs and tillage management have destroyed the soil nutrient balance formed over long-term conditions. There are few studies on non-point source phosphorus pollution in the Sanjiang Plain, which is the largest swampy low plain in a mid-high-latitude region in China. Most studies have focused on the water quality of rivers in marsh areas, or the export mechanism of phosphorus from specific land uses. They were conducted using experimental methods or empirical models, and need further development towards mechanism models and the macro-scale. The question is how to find a way to couple processes in phosphorus cycling and a distributed hydrological model considering local hydrological features. In this study, we report an attempt to use a distributed phosphorus transport model to analyse non-point source total phosphorus pollution from different land uses and soil types on the Sanjiang Plain. The total phosphorus concentration generally shows an annually increasing trend in the study area. The total phosphorus load intensity is heterogeneous in different land use types and different soil types. The average total phosphorus load intensity of different land use types can be ranked in descending order from paddy field, dry land, wetlands, grassland, and forestland. The average total phosphorus load intensity of different soil types can be ranked in descending order: paddy soil, bog soil, planosol, meadow soil, black soil, and dark brown earth. The dry land and paddy fields account for the majority of total phosphorus load in the study area. This is mainly caused by extensive use of phosphate fertilizer on the cultivated land. This has important implications for future agricultural management and non-point source control in this agricultural area of the mid-high latitude region.

1. Introduction

Phosphorus is one of a large number of elements that are necessary for plant growth and development. It is also the main limiting factor in crop yield [1], and is of significance in global food security. In many parts of the world, in order to meet the growing populations’ demand for food, it is necessary to add mined rock phosphate or artificial phosphorus fertilizer to the cultivated land to maintain food production [2]. A large amount of phosphorus accumulation in the soil enters into water bodies via soil erosion, causing the phosphorus content to become elevated and the water bodies to undergo eutrophication. When the total phosphorus content of water is more than 0.02 mg/L, it is likely to lead to algal blooms [3], and therefore non-point source (NPS) pollution of phosphorus caused by soil erosion has generated wide public concern.
Phosphorus is lost from soils through several processes including leakage, surface runoff, and soil erosion. The loss of phosphorus is closely related to the physical structure of the soil, field capacity, rainfall, vegetation coverage, fertilizer application, and irrigation methods. Phosphorus load from surface runoff is three or four times that from the subsurface flow. Thus, the main part of the phosphorus output is suspended total phosphorus, while the percentage of dissolved total phosphorus and proportion of orthophosphate are very low [4]. Migration of dissolved phosphorus through the soil occurs in two ways: one is a slow flow through normal (matrix) soil pores, and the other is rapid (preferential) flow involving macropores. The two types together contribute to the seepage erosion of soil phosphorus [5].
The Sanjiang Plain is one of the largest grain production bases in China and has experienced rapid land cover change, making it a critical area in assessing the environmental impact of LUCC and proposing strategies for minimizing its impact on non-point source (NPS) pollution. Since the 1950s, the Sanjiang Plain has been subjected to massive agricultural development. A large number of marsh wetlands were drained and transformed into fertile land for cultivation, and deforestation and destruction of local grasslands have taken place. Consequently, significant changes have taken place in the mode of regional land use. The application of pesticides and chemical fertilizers, and changes in farming methods, have destroyed the long-standing soil nutrient equilibrium, and accelerated the migration rate of soil nutrients across the water/soil interface. These nutrients are mainly nitrogen and phosphorus that reach water bodies as pollutants, and have resulted in serious environmental pollution.
In recent years, there are many mechanism models that can be used to simulate and describe the migration and conversion of nutrients, such as the PSYCHIC model, the CREAMS model, the ANSWERS model, the AnnAGNPS model, the EPIC model, and the SWAT model [6,7,8,9,10,11,12]. Among the above models, the SWAT model is the most widely used, and has been applied in North America, Europe, Africa, South Asia and other regions, as well as in China, and other countries. Several case studies analysing the impact of land cover changes on pollution via NPS nutrients have been conducted using SWAT model [13,14,15]. Although the SWAT model is suitable for long-term continuous non-point phosphorus simulation in agricultural areas [16], the SWAT model, which simplifies the model runs by dividing the hydrological response unit, belongs to a semi-distributed model. In addition, the SCS curve method, which is used in the hydrology module of SWAT, is an empirical model, and it has difficulties simulating the effects of best management practices (BMPs) on runoff because of its reliance on curve number methodology [17]. Models such as the ANSWERS model, which can only simulate at the field-scale or small watershed scale, are not suitable for large-scale phosphorus cycle simulations. Although remote sensing technology cannot directly detect water quality, it can obtain the spatial information of NPS pollution model parameters. Spatial data can clearly meet the needs of digital simulation on NPS pollution. Thus, coupling multi-source remote sensing information, data assimilation, and a distributed NPS pollution model is the main trend in NPS pollution model development.
The Ecohydrological Assessment Tool (EcoHAT) [18,19,20,21,22,23,24,25] is a type of ecological hydrology simulation system, which can be used to comprehensively simulate regional ecological and hydrological processes based on physical and chemical mechanisms. With EcoHAT, hydrological cycles, nutrient cycles and plant growth processes are integrated, while nutrient cycling and growth of vegetation are considered in relation to the hydrological cycle. EcoHAT, coupled with a remote sensing model to invert the land surface parameters, provides spatial data for ecological and hydrological process simulation. Driven by remote sensing data, EcoHAT makes full use of remote sensing technology in solving large-scale soil phosphorus, NPS pollution problems with time-series simulations. Meanwhile, EcoHAT integrates GIS spatial analysis tools, which can effectively analyse the simulation results [19].
The NPSs of phosphorus pollution are important, such as leakage (loss of phosphorus), which may cause adverse effects in surface and ground water. The Sanjiang Plain is an important agricultural region with various types of land use and soil. Analysis of the amount of phosphorus load under different land use and soil types is helpful for protecting the water bodies, and for controlling NPS pollution in this agricultural area of the mid-high latitude region [26]. However, there are few studies on non-point pollution by phosphorus in the Sanjiang Plain, and most of these focused on water quality of the river in marsh areas, or on the export mechanisms of phosphorus from specific land uses or specific soil types [27]. The studies were done using experimental methods or empirical models, and the research requires further advances towards mechanism model development at the macro-scale. Questions remain about how to find a way to couple the processes in phosphorus cycling and a distributed hydrological model, with consideration for local hydrological features. Furthermore, studies of the non-point-source pollution by phosphorus in the Sanjiang Plain require solutions that can only be provided by access to the spatial data needed to drive the pertinent models, and to expand their scale.
To ensure good soil quality during agricultural development, the trend of changes in soil phosphorus due to land use change must be assessed. Understanding the characteristics of changes in soil phosphorus content is important for improving agricultural management practices and making land use practice more sustainable. The aims of this study are as follows: (1) to identify the temporal-spatial pattern of land use change occurring from 2000 to 2010 (11a) in the Sanjiang Plain; (2) to explore the transformation of soil phosphorus from six main soil types and five types of land use; and (3) to provide suggestions for future farmland management and establishment of sustainable land use systems while preserving soil phosphorus contents.

2. Materials and Methods
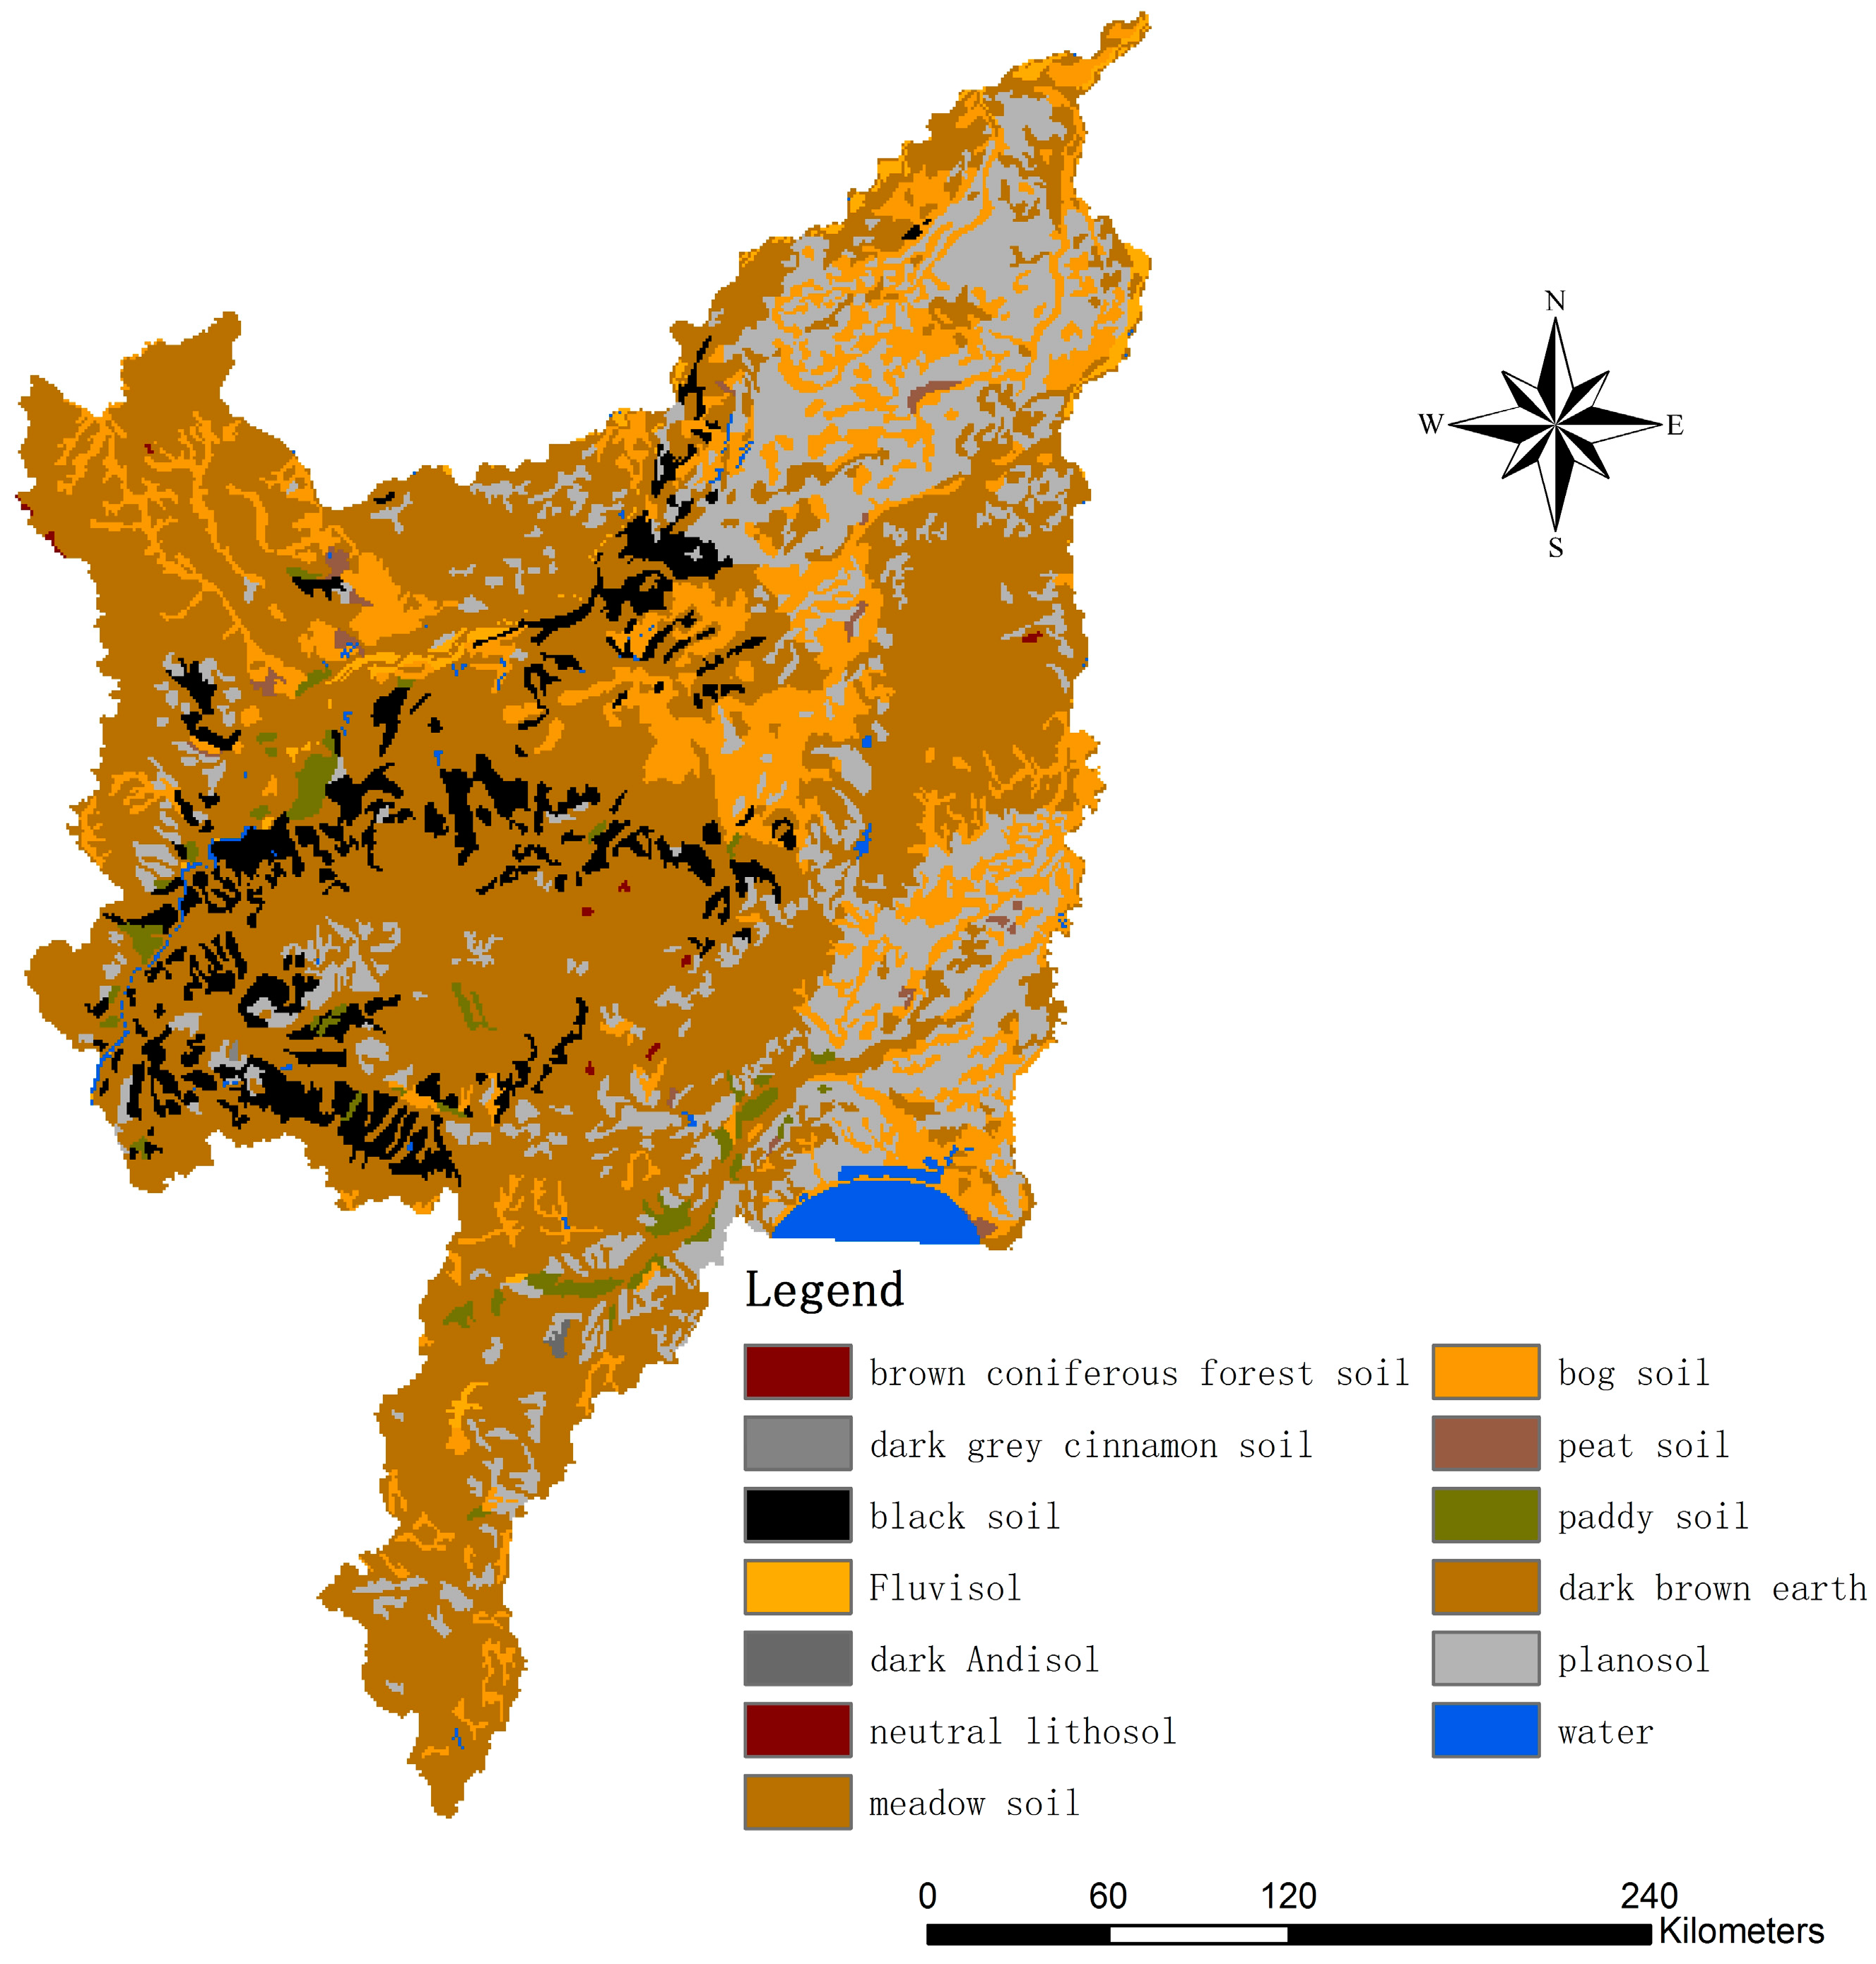
2.1. Study Area

The Sanjiang Plain (43°49′55″–48°27′40″ N; 129°11′20″–135°05′26″ E) is a low elevation plain located in the Heilongjiang Province of the northeast of China (Figure 1). Its total area is about 108,900 km2 and it takes up 22.6% of Heilongjiang Province.
The climate of the Sanjiang Plain, and hence the study area, is “continental monsoon climate”, with four distinct seasons, and with heat and rainfall occurring together. The average annual precipitation is 406 mm, and most rainfall occurs from July to August, a period that accounts for 70% of annul precipitation. The yearly average temperature ranges from 2 to 8 °C. The highest temperatures are registered from June to August, and the average annual summer temperature is 21.6 to 27.2 °C. Under these conditions, vegetation grows from April through September. Average monthly wind speeds vary from 3.1 to 4.1 m·s−1. The research focused only on the 5 km riparian buffer zone around the Sanjiang Plain. The main land use types in this area are dry land, paddy field, forestland, pasture, and wetland (Figure 2). Due to widespread agricultural and domestic NPS pollution, the Sanjiang Plain is a suitable area for studying NPS pollution problems.

2.2. Data

The data (Table 1) used in the model came from multi-source remote sensing data (e.g., Landsat TM or MODIS), in situ experimental data, meteorological data, and survey data. Meteorological data came from public, free, data platforms (e.g., China meteorological data net [28]). Multi-source remote sensing data were also from free public platforms (e.g., USGS: United States Geological Survey [29]). Other data were from in situ experiments and statistics. All original input data were processed by programs written in IDL (Interactive Data Language). Some data were resolved using ENVI4.8 (Harris Corporation, Melbourne, FL, USA) or ArcGIS10.1 (Environmental Systems Research Institute, Redlands, CA, USA). All the input data were converted to images, which were then projected into a uniform coordinate system to render the disparate sets of spatial data consistent. The spatial resolution of the input data was also a key factor, because only if the input data have the same spatial resolution can the P simulation model run smoothly. However, the different input data have very different spatial resolutions. For instance, the spatial resolution of the Landsat TM (Thematic Mapper) data we used is about 30 m, while the spatial resolution of MODIS (Moderate-Resolution Imaging Spectral Radiometer) data is 1000 m. We tried to use GLDAS (Global Land Data Assimilation System) data to improve our spatial-temporal (three-hourly) resolution of meteorological data, but the GLDAS data had a coarse spatial resolution of 25 km. To obtain uniform 1000-m spatial resolution, we needed to input data with different spatial resolutions into the model, so we resampled, and used some downscaling methods [30]. Validation of the downscaling result was satisfactory.
After a three-year land use overlay analysis, the area and distribution of permanent dry land (D-D), permanent paddy field (P-P), permanent forestland (F-F), and permanent wetland (W-W) were identified for the period from 2000 to 2010. In addition, the spatial information on four types of land use conversion in the same period were analysed: dry land reclaimed from forestland (F-D), paddy field reclaimed from dry land (D-P), dry land reclaimed from wetland (W-D), and paddy field reclaimed from wetland (W-P) (Table 2).
According to the USDA soil classification system [31], there are various types of soil in the Sanjiang Plain. These include black, dark brown, swamp, meadow, white pulp, paddy, peat, alluvial, grey brown, rocky, volcanic ash and brown coniferous forest soils. The six main soil types (dark brown, swamp, white pulp, meadow, black and paddy soil) account for 98.7% of the soil area over the entire Sanjiang Plain. The spatial distribution of soil types is shown in Figure 3. Dark brown soils are mainly distributed in hilly areas. White pulp soils are mainly distributed in grade I valleys at all levels on the terrace. The black soil is distributed at the top of the western piedmont platform. Meadow soils are mainly distributed in the floodplain of the main rivers. The paddy soil is found in river flood plains and on grade I terraces. Swamp soils are mainly distributed in the central low-lying areas, and are perennially wet. The lower part of the upper peat soil is mineralized to form grey soils, but if the peat layer thickness is greater than 50 cm, it is defined as a peat soil.
The Sanjiang Plain vegetation types mainly include forest, swamp meadow plants and marsh plants, which belong to the Changbai flora. The low hilly land around the forest is mainly found on the plain, and its vegetation types are divided into coniferous forest, mixed needleleaf–broadleaf, and deciduous broadleaf forest. Natural wetland vegetation is mainly distributed in Heilongjiang. Along the Songhua and Ussuri Rivers and their tributaries, there are flood lands, lakes and lake depressions with mainly aquatic grass, wet meadows and shrubs.

2.3. Methods

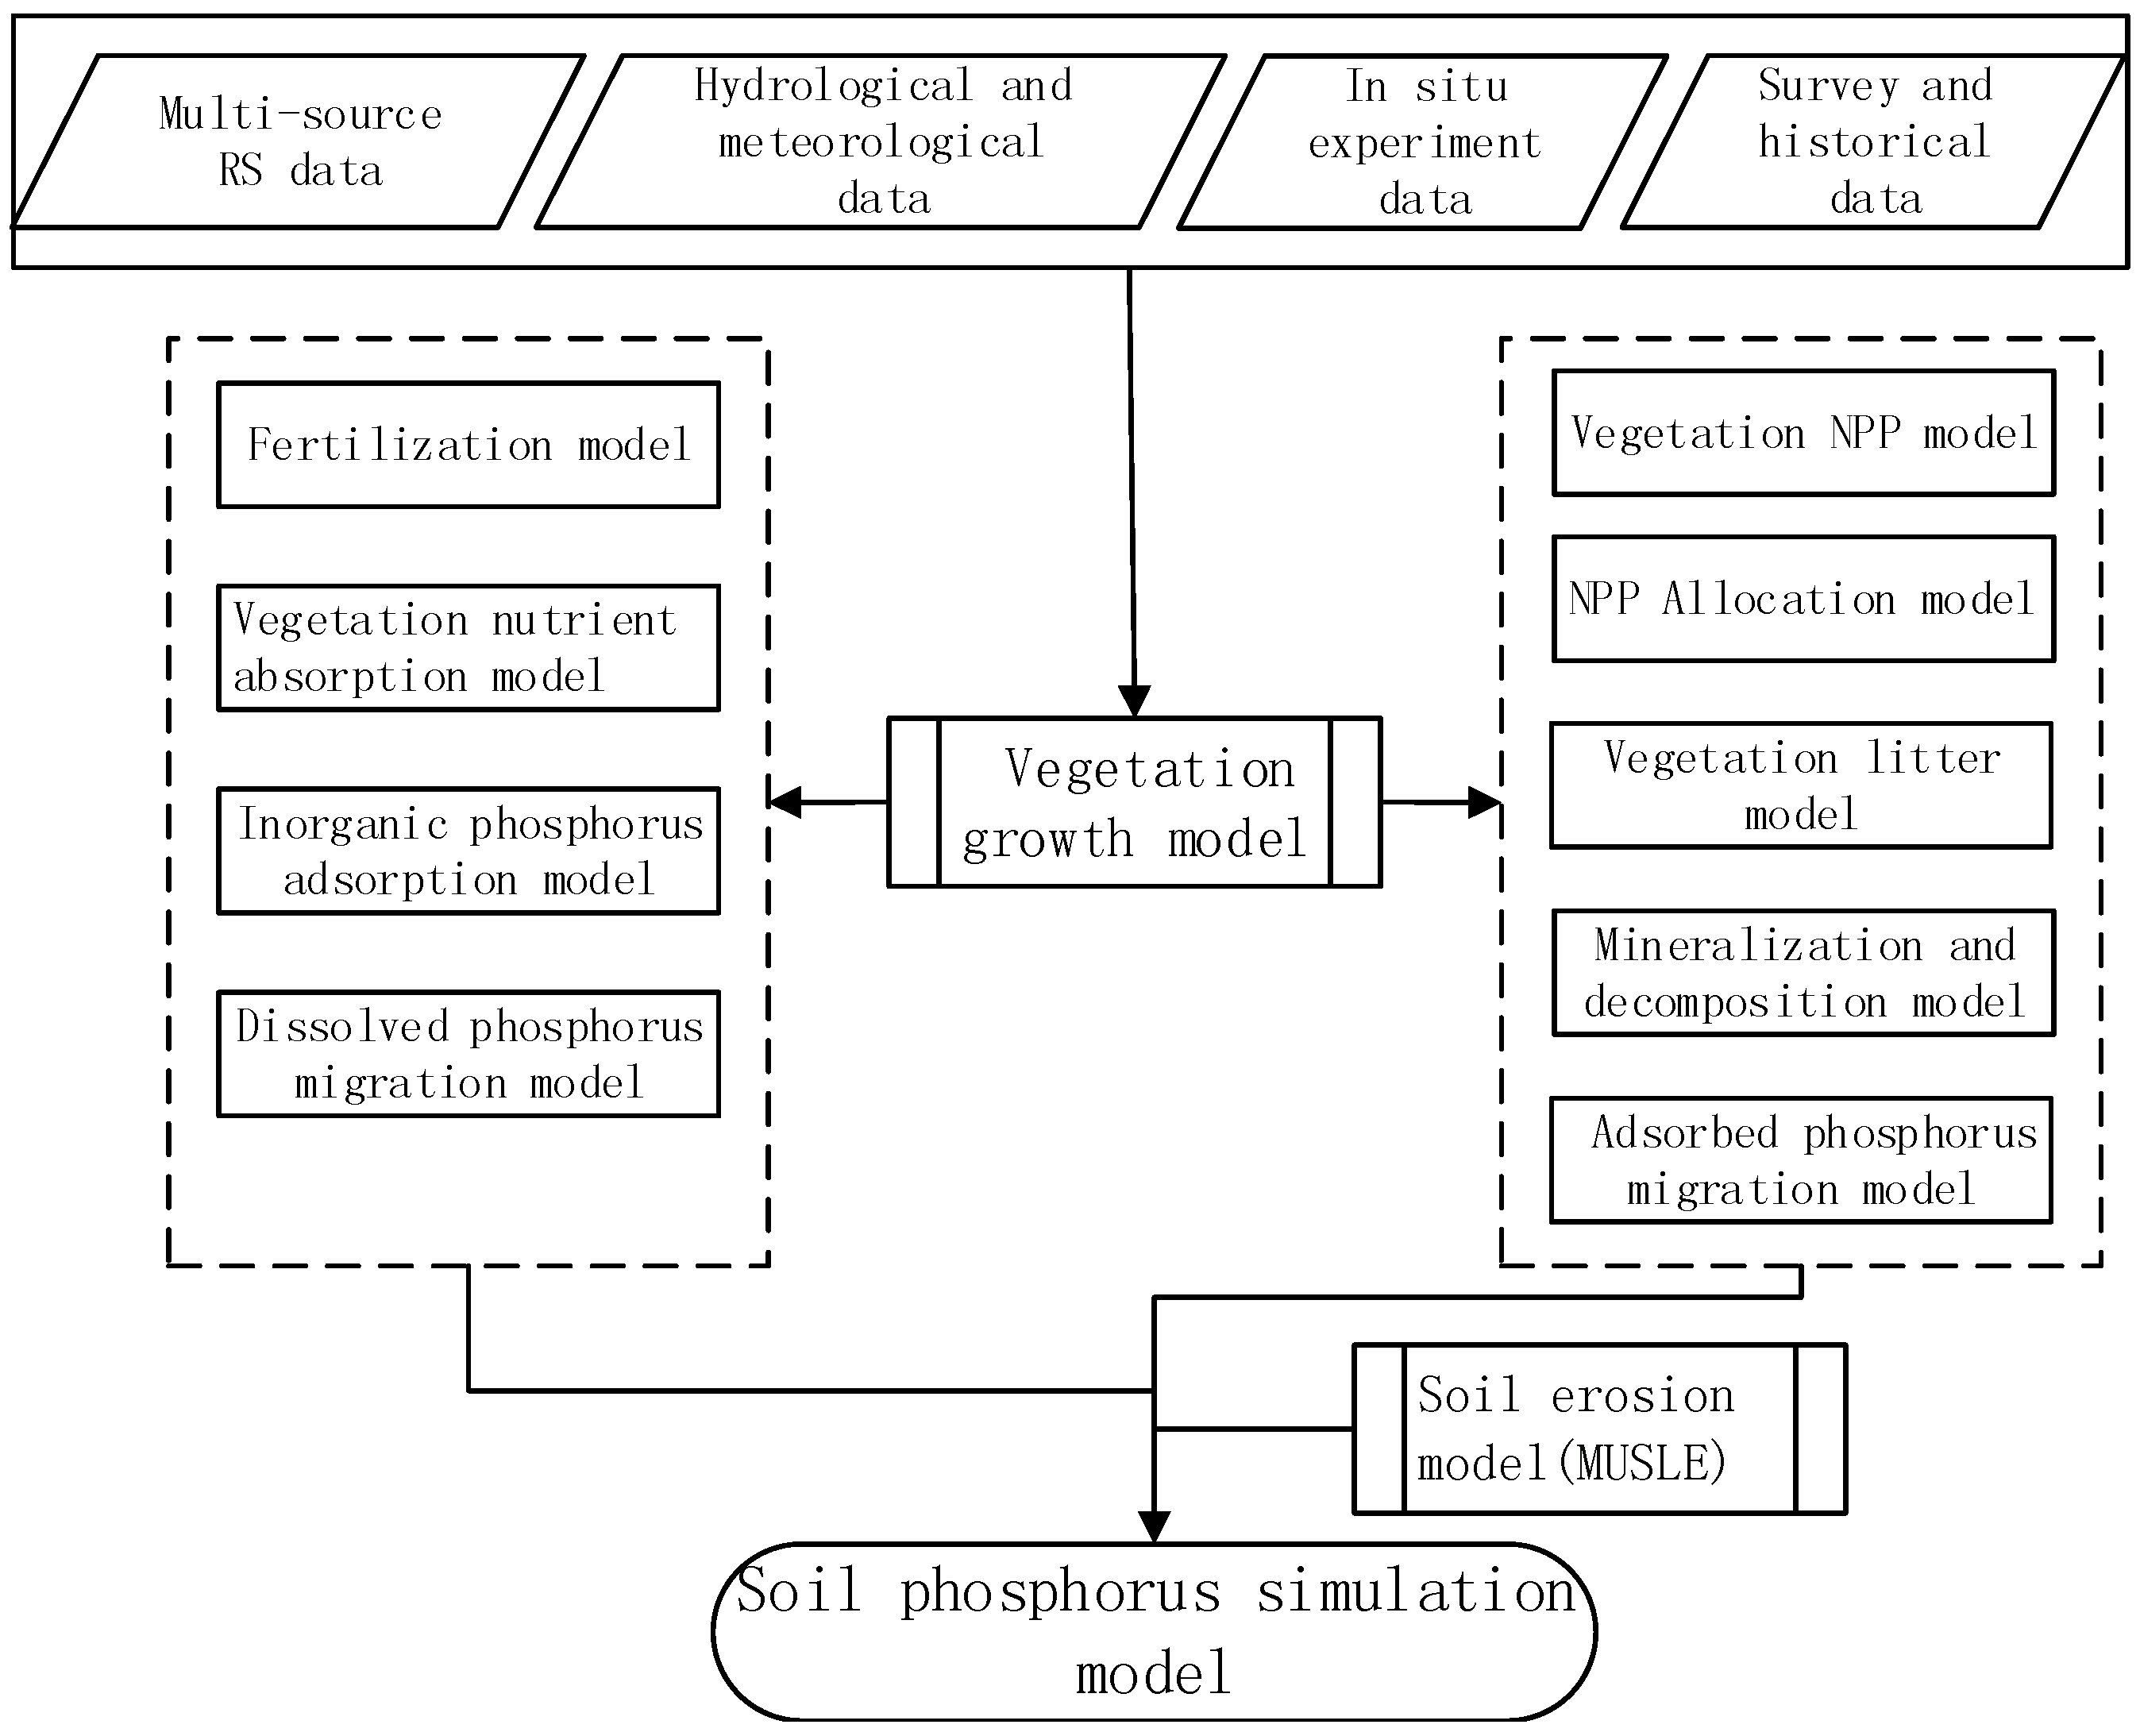
2.3.1. The Phosphorus Model in EcoHAT-P

Total phosphorus (TP) is a measure of all the forms of phosphorus, such as active organic P, dissolved inorganic P, and particulate inorganic P. The increase in phosphorus in the soil is mainly from fertilization and plant litter decomposition. The ways in which phosphorus output from the soil occurs include absorption by plants, surface runoff through rainfall or artificial drainage, soil erosion and leaching. The phosphorus cycle is affected by many reactions and mechanisms. The simulation methods that are usually used, summarize the forms of organic phosphorus and inorganic phosphorus present, generally include the processes of decomposition, fixing/mineralization, adsorption/desorption and plant absorption. Some models increase the leaching and anthropogenic factors.
The phosphorus circular migration module is built up from processes in the nutrient-element cycles, vegetation absorption of nutrients, net primary productivity (NPP), the distribution of productive forces and the process of vegetation littering. We used Rs-DTVGM [32] hydrological models, and MUSLE [33,34] equations coupling with the phosphorus cycle migration module, to set up the distributed phosphorus migration (EcoHAT-P) model (Figure 4).
After we used multi-source remote sensing data, and hydrologic and meteorological observation data to establish an ecohydrological spatial database, a distributed phosphorus migration model driven by remote sensing data was realized. Finally, the content of dissolved phosphorus and adsorbed phosphorus in surface runoff was obtained. The sum of these forms of phosphorus is TP. This provided data for further study on the spatiotemporal changes in phosphorus. The model structure is shown in Figure 4.

2.3.2. Phosphorus Modules in EcoHAT

Most of EcoHAT-P is composed of two modules, the plant phosphorus cycle and the soil phosphorus cycle. Phosphorus biological cycles in vegetation are mainly associated with growth of vegetation. The vegetation growth process can be divided into four sub-models: vegetation net primary productivity (NPP), productivity distribution, nutrient absorption and vegetation litter.
The circular migration model of phosphorus in soil mainly refers to the SWAT model [35], and according to the need of the application, the SWAT model was simplified such that decomposition and mineralization considered only the leaf litter and upper soil fresh litter. Mobility and transfer of phosphorus in soil mainly refers to the phosphorus model with simplified soil and vegetation proposed by Jones [36], which elaborated details about the mobility and migration characteristics of phosphorus at the interface between soil and water. The main functions and parameters in the P model are listed in the Table 3.

3. Results

3.1. Validation of the EcoHAT-P Model

Through the random method, we got 41 sampling points, obtained their geography coordinates, and overlaid the coordinates of sampling points on the simulation images to get the simulated results. In Table 4, the simulated mean value of total phosphorus (TP) is 0.878 g/kg, and the observed mean value is 0.881 g/kg. Other statistical standards, which include the maximum values, standard deviations, and standard error of mean, were also used to show the distribution characteristics between the two data groups. We obtained observed and simulated values and used the data to represent the conditions of this area. In Figure 5, the test results show that R2 of the observed and the simulated data is 0.661, demonstrating that the P model is reliable.

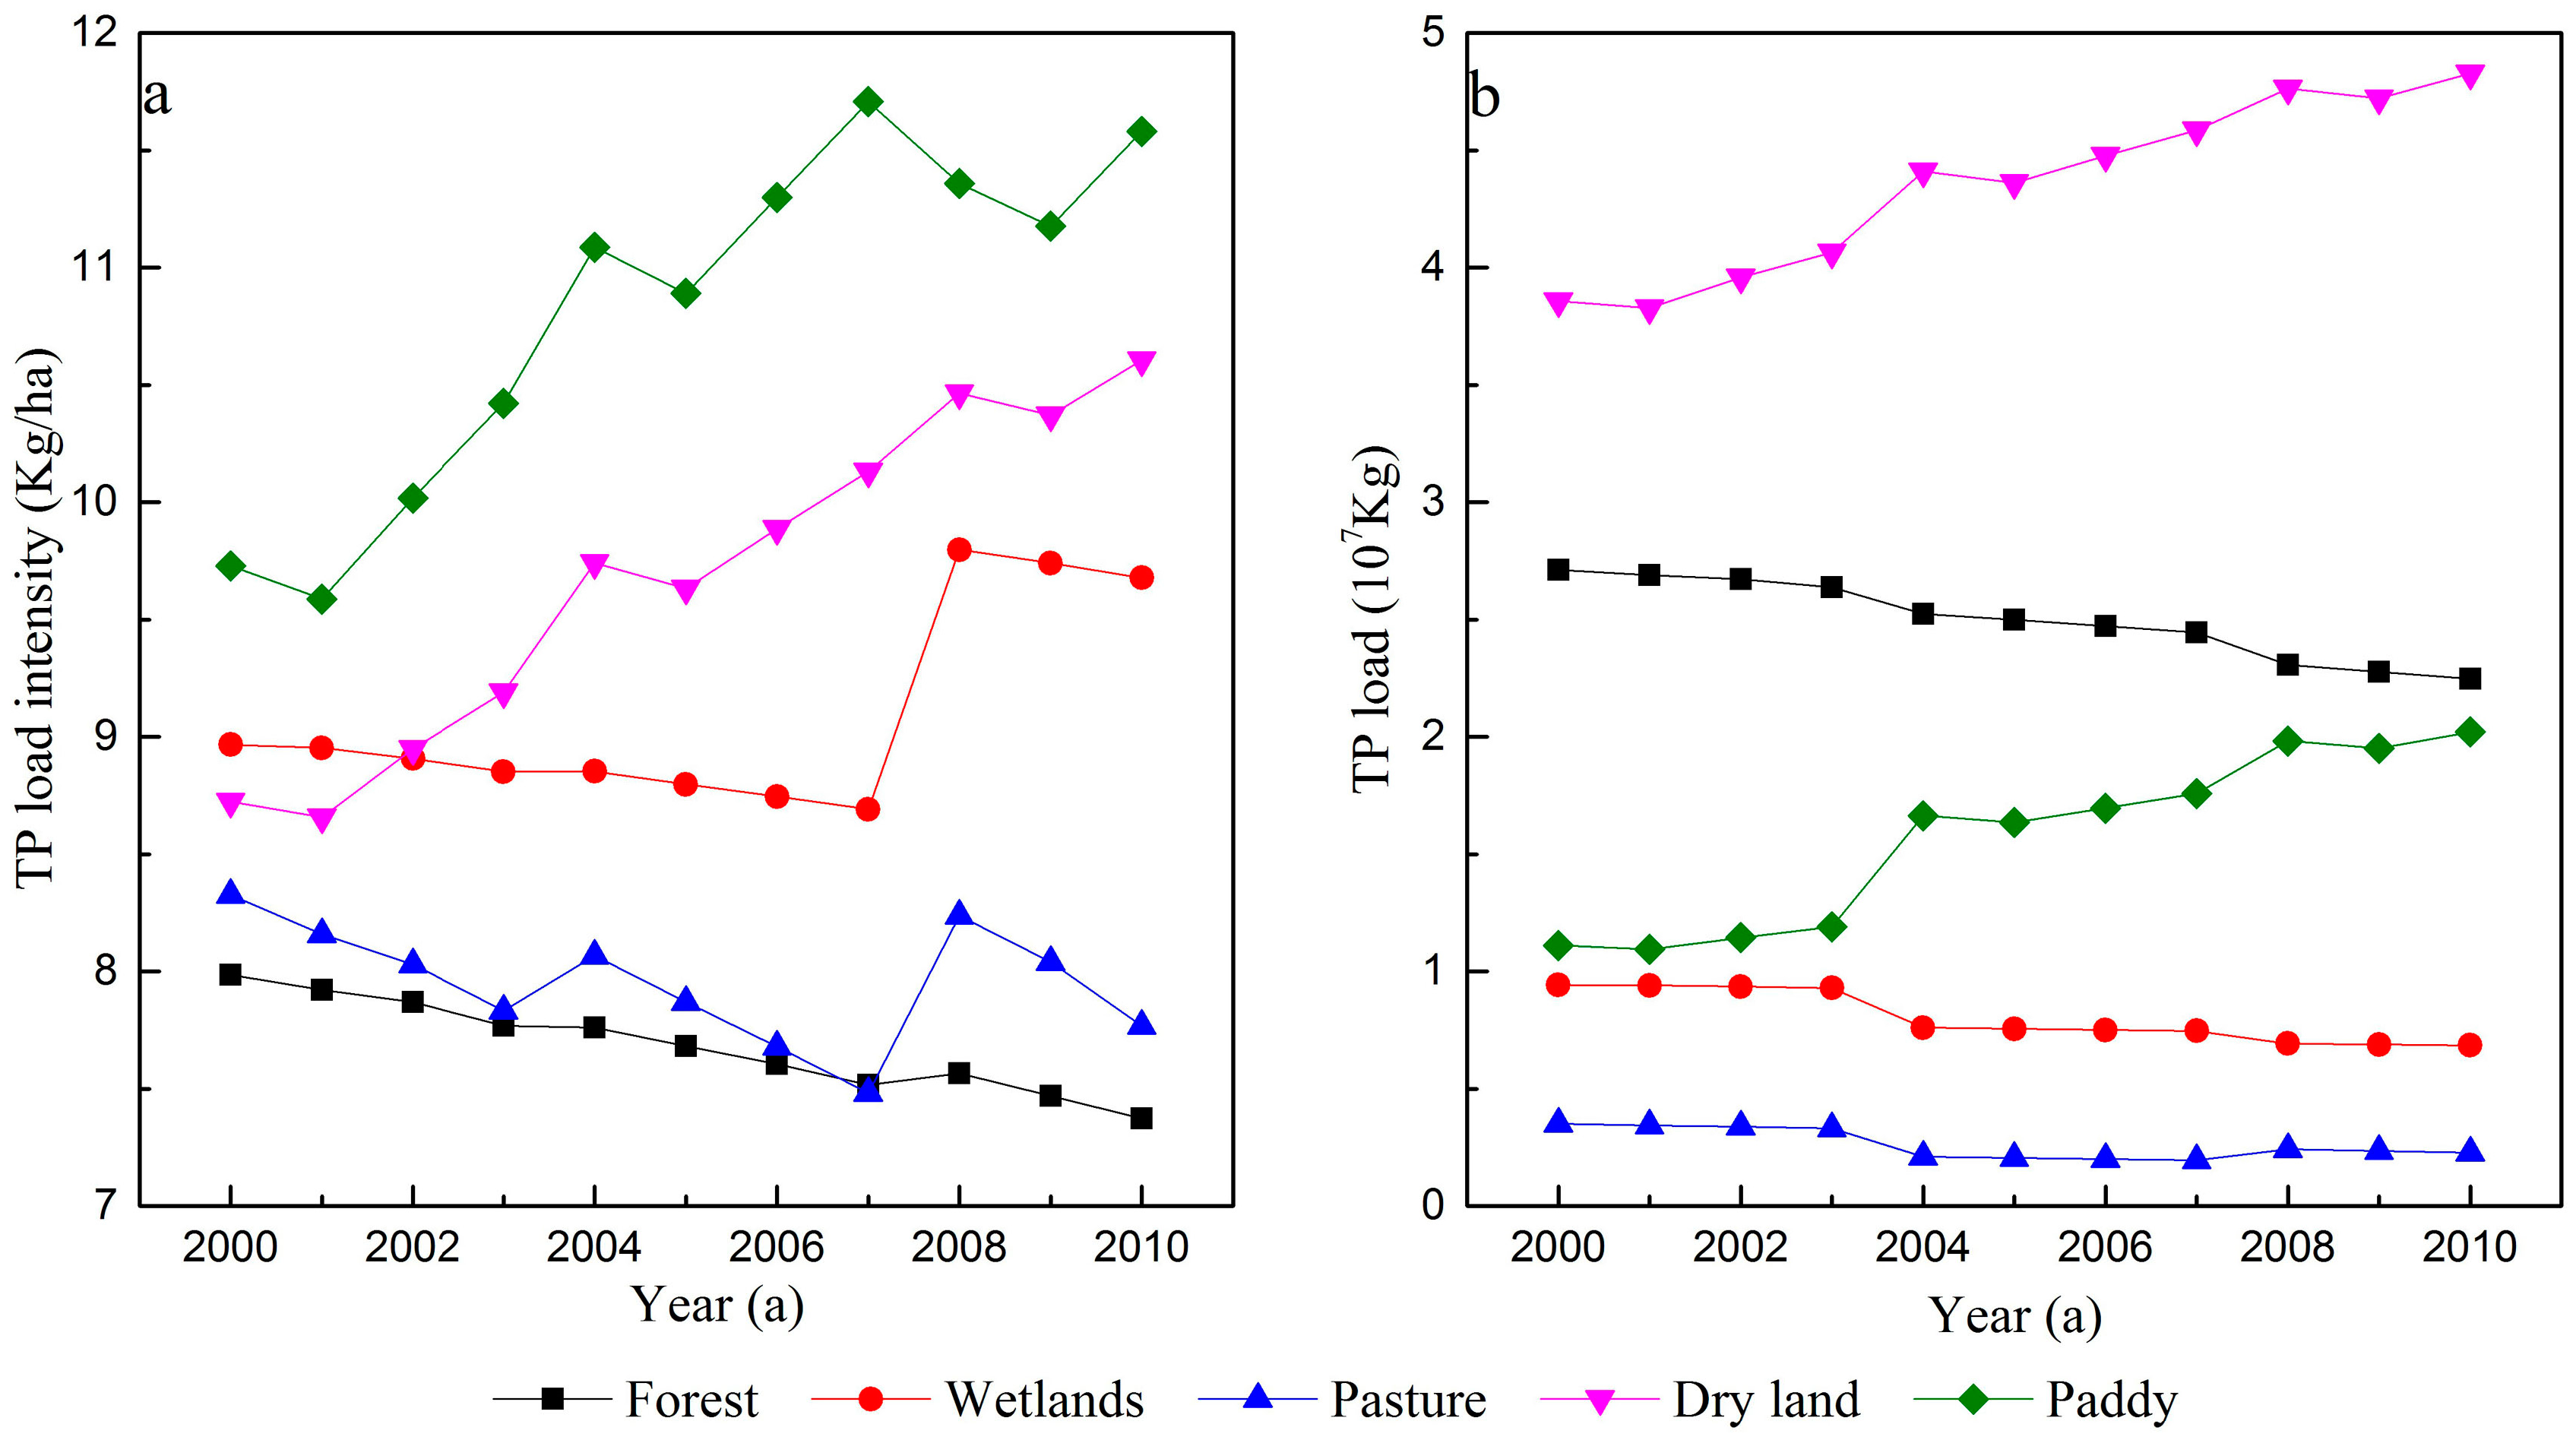
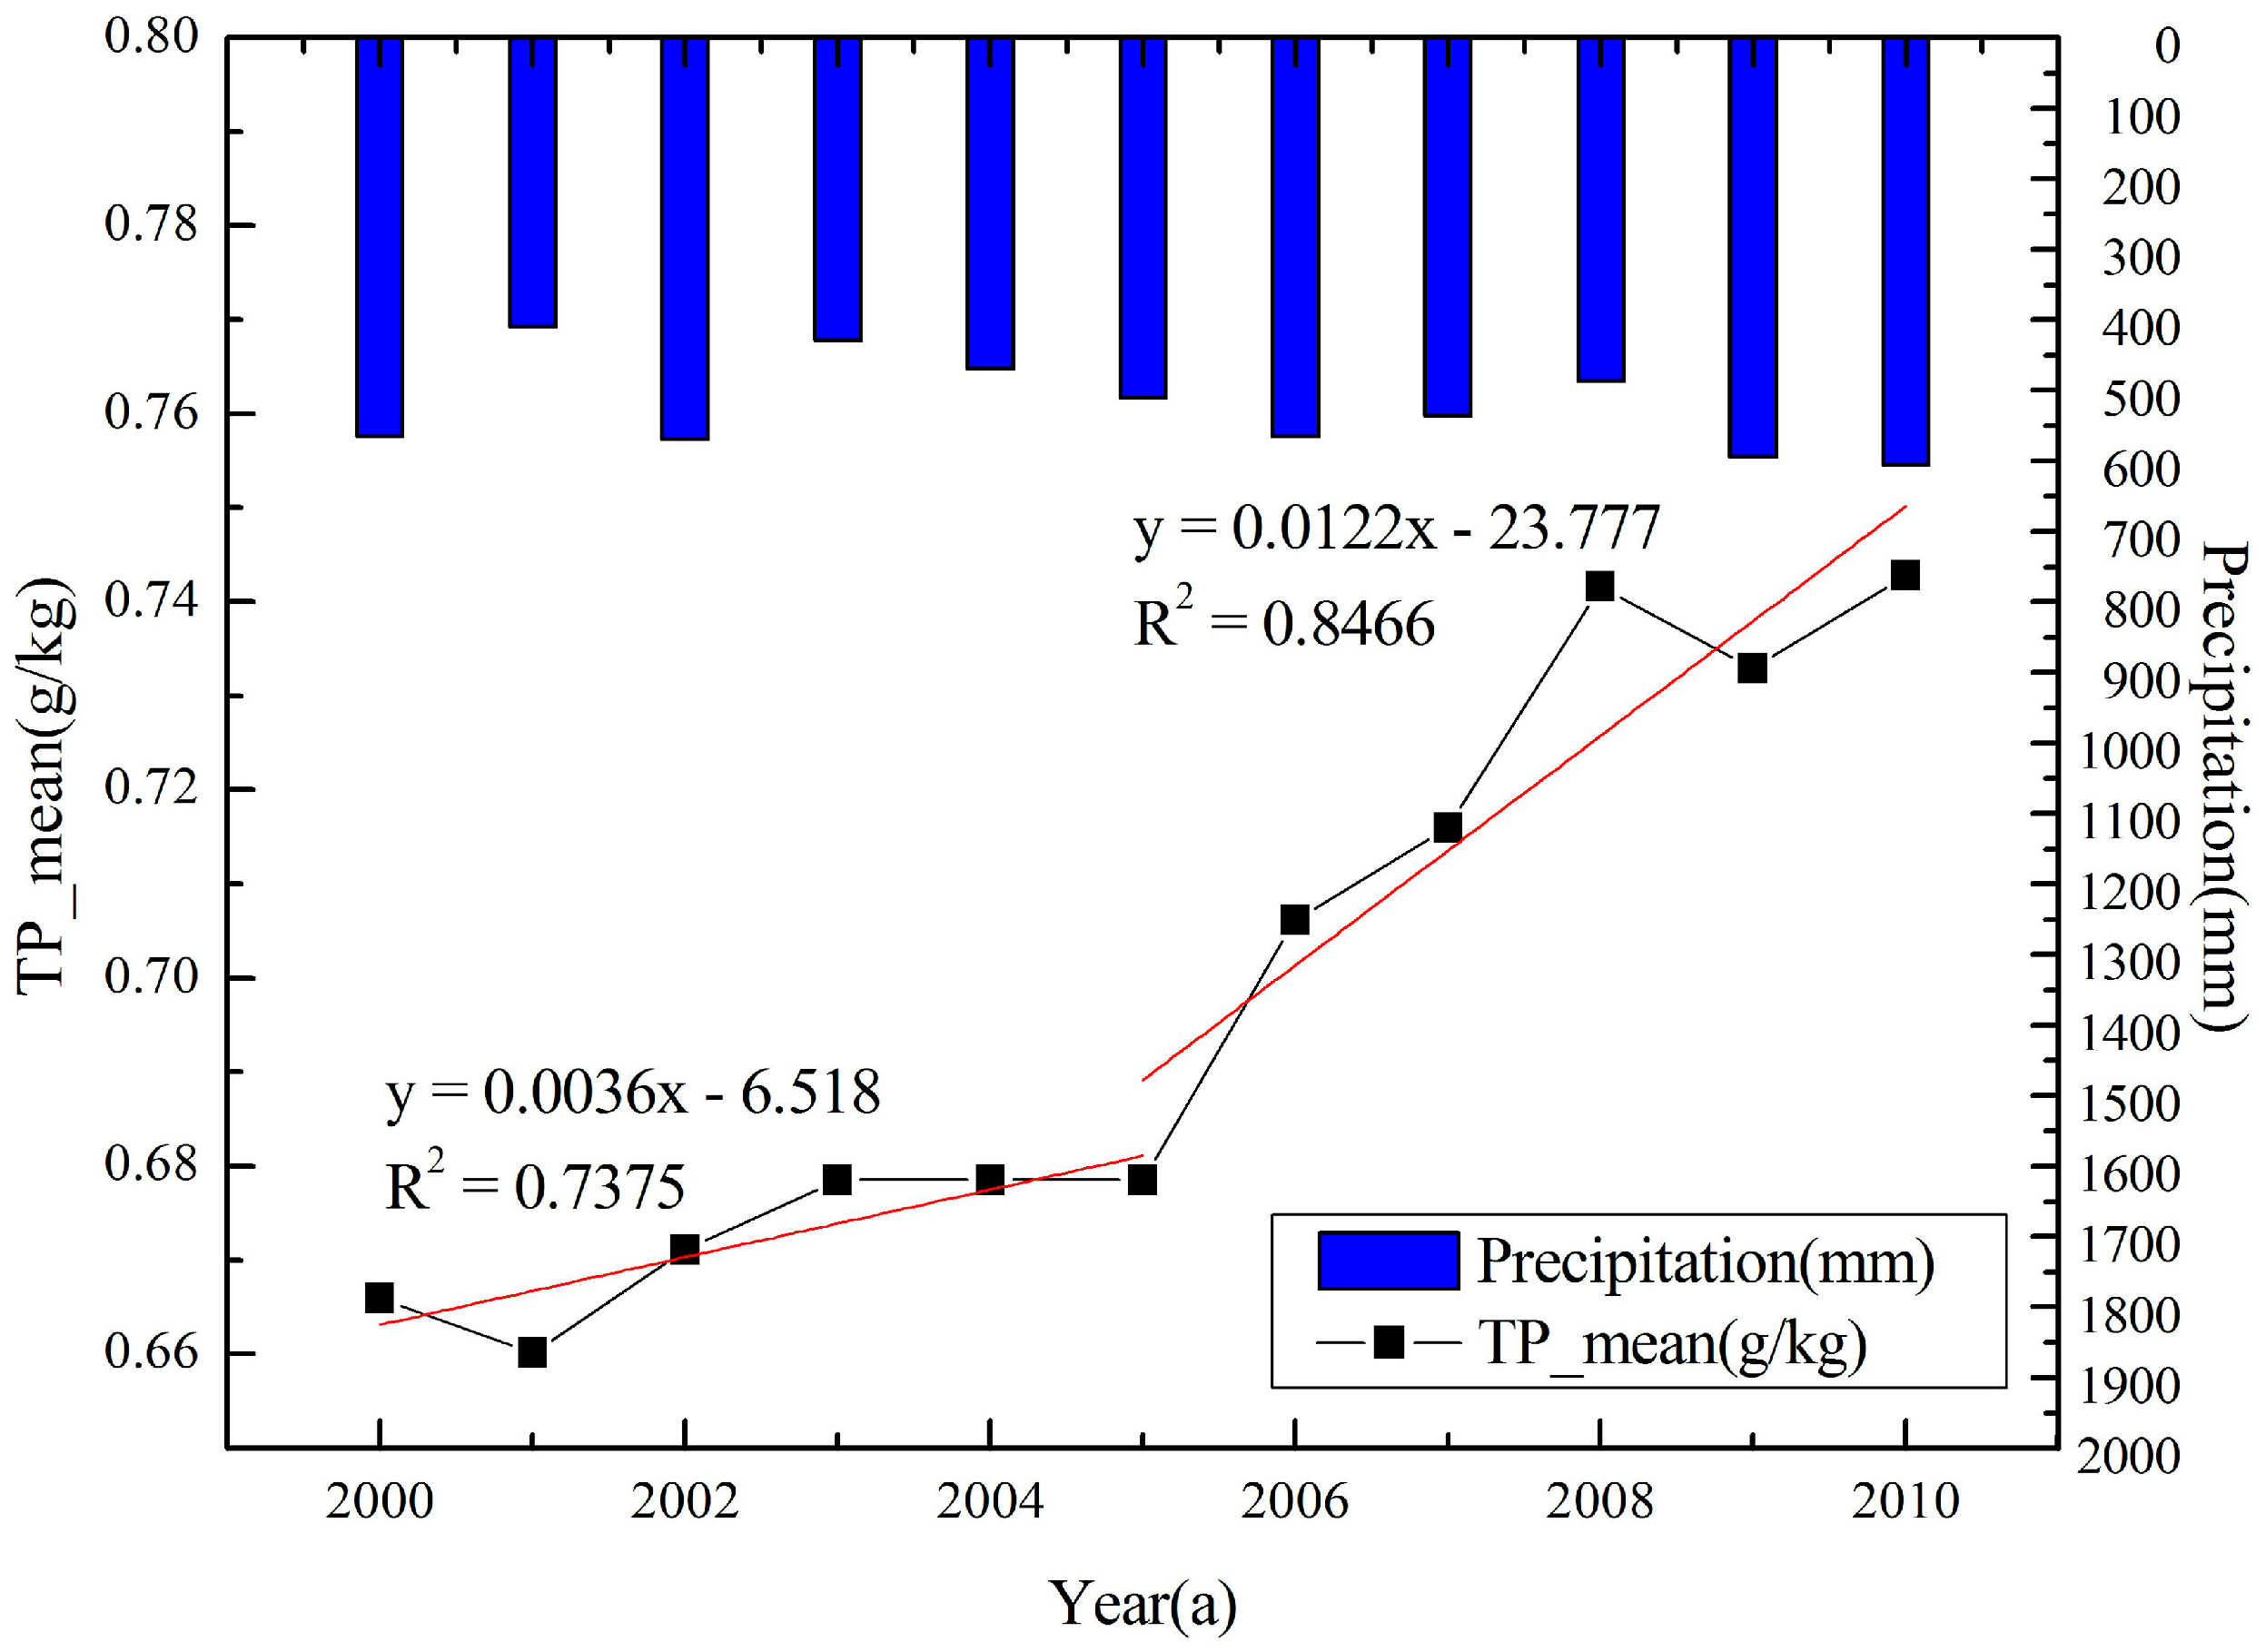
3.2. Total Phosphorus during the Period

In detecting abrupt changes with a non-parameter Mann-Kendall test method, the results showed that the yearly total phosphorus load abruptly changed in 2005. The study period was divided into two intervals: 2000–2005, and 2006–2010. Figure 6 shows that the total phosphorus load in the Sanjiang Plain has a trend of overall increase. The P-load presents a relatively low growth rate during 2000–2005 (0.0036 g/(kg·a)), then increased during 2006–2010 (0.0122 g/(kg·a)). During 2006–2010, the growth rate of the total phosphorus load presented a trend of rapid growth for the Sanjiang Plain. This is because much wetland (~1800 km2), pasture (~1500 km2), and woodland (~1200 km2) were converted to paddy field (~3500 km2) and dry land (~1000 km2), resulting in a rise in the amount of fertilizer application, and thus total phosphorus. The p value was 0.1569, which is larger than 0.01. The overall correlation between NPS mean total phosphorus and precipitation was not significant.

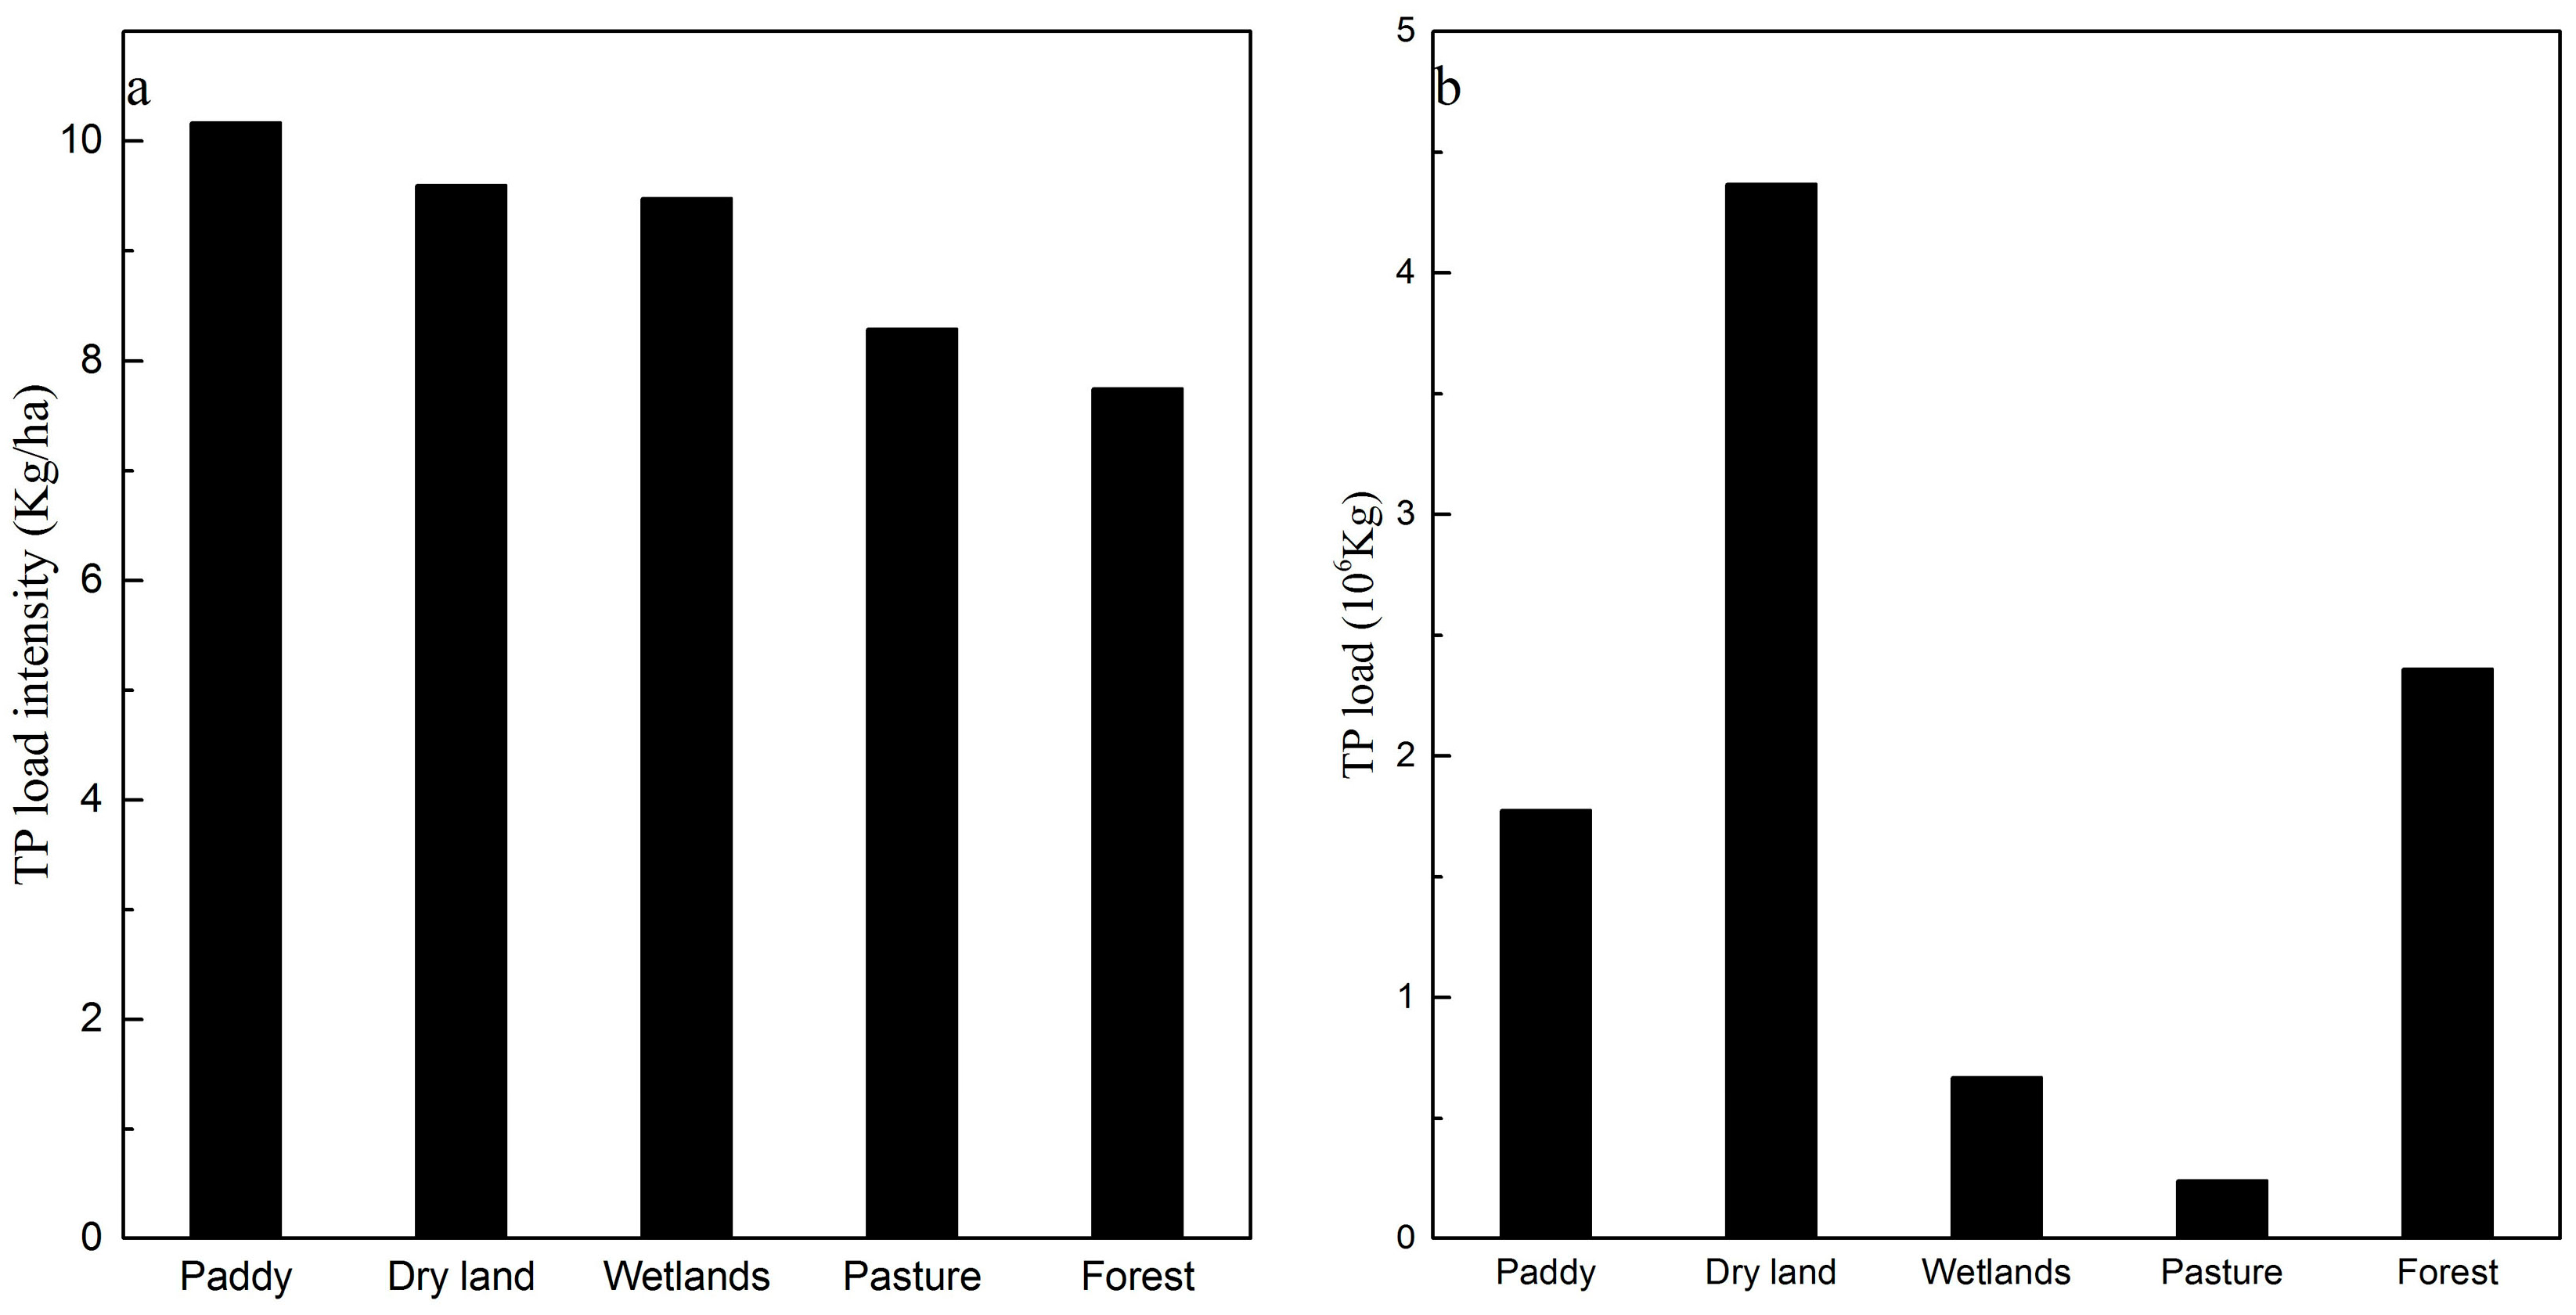
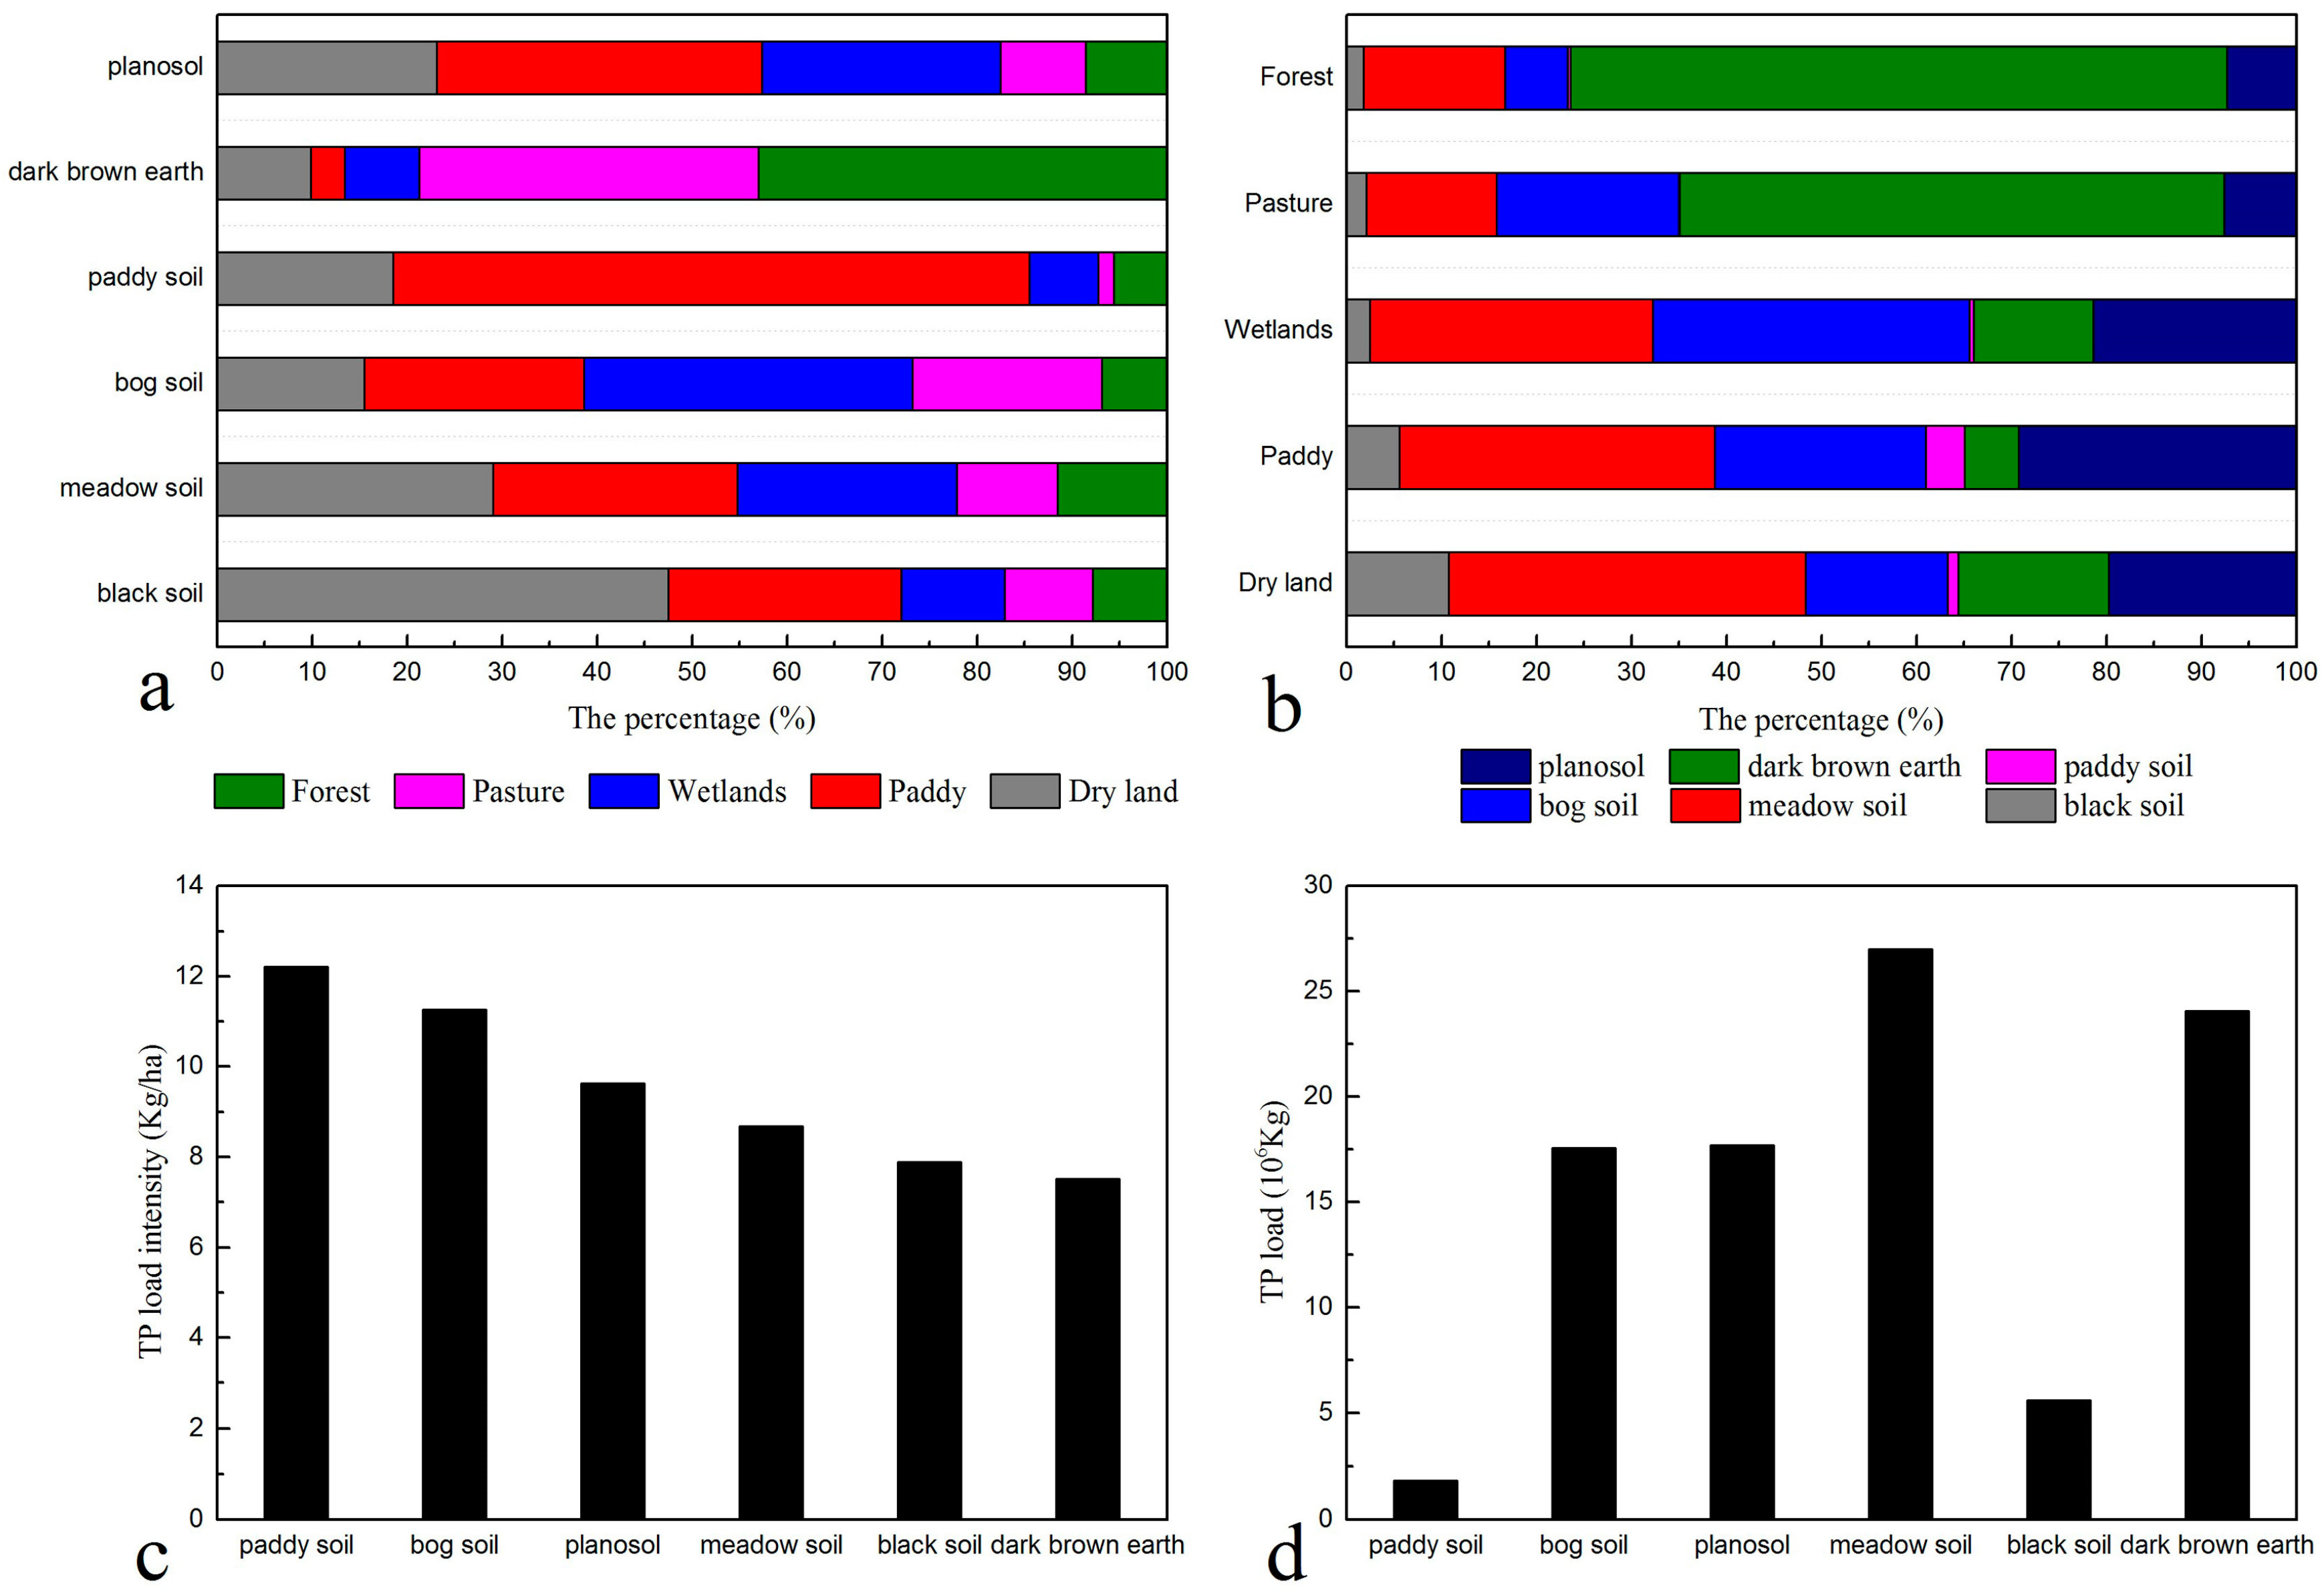
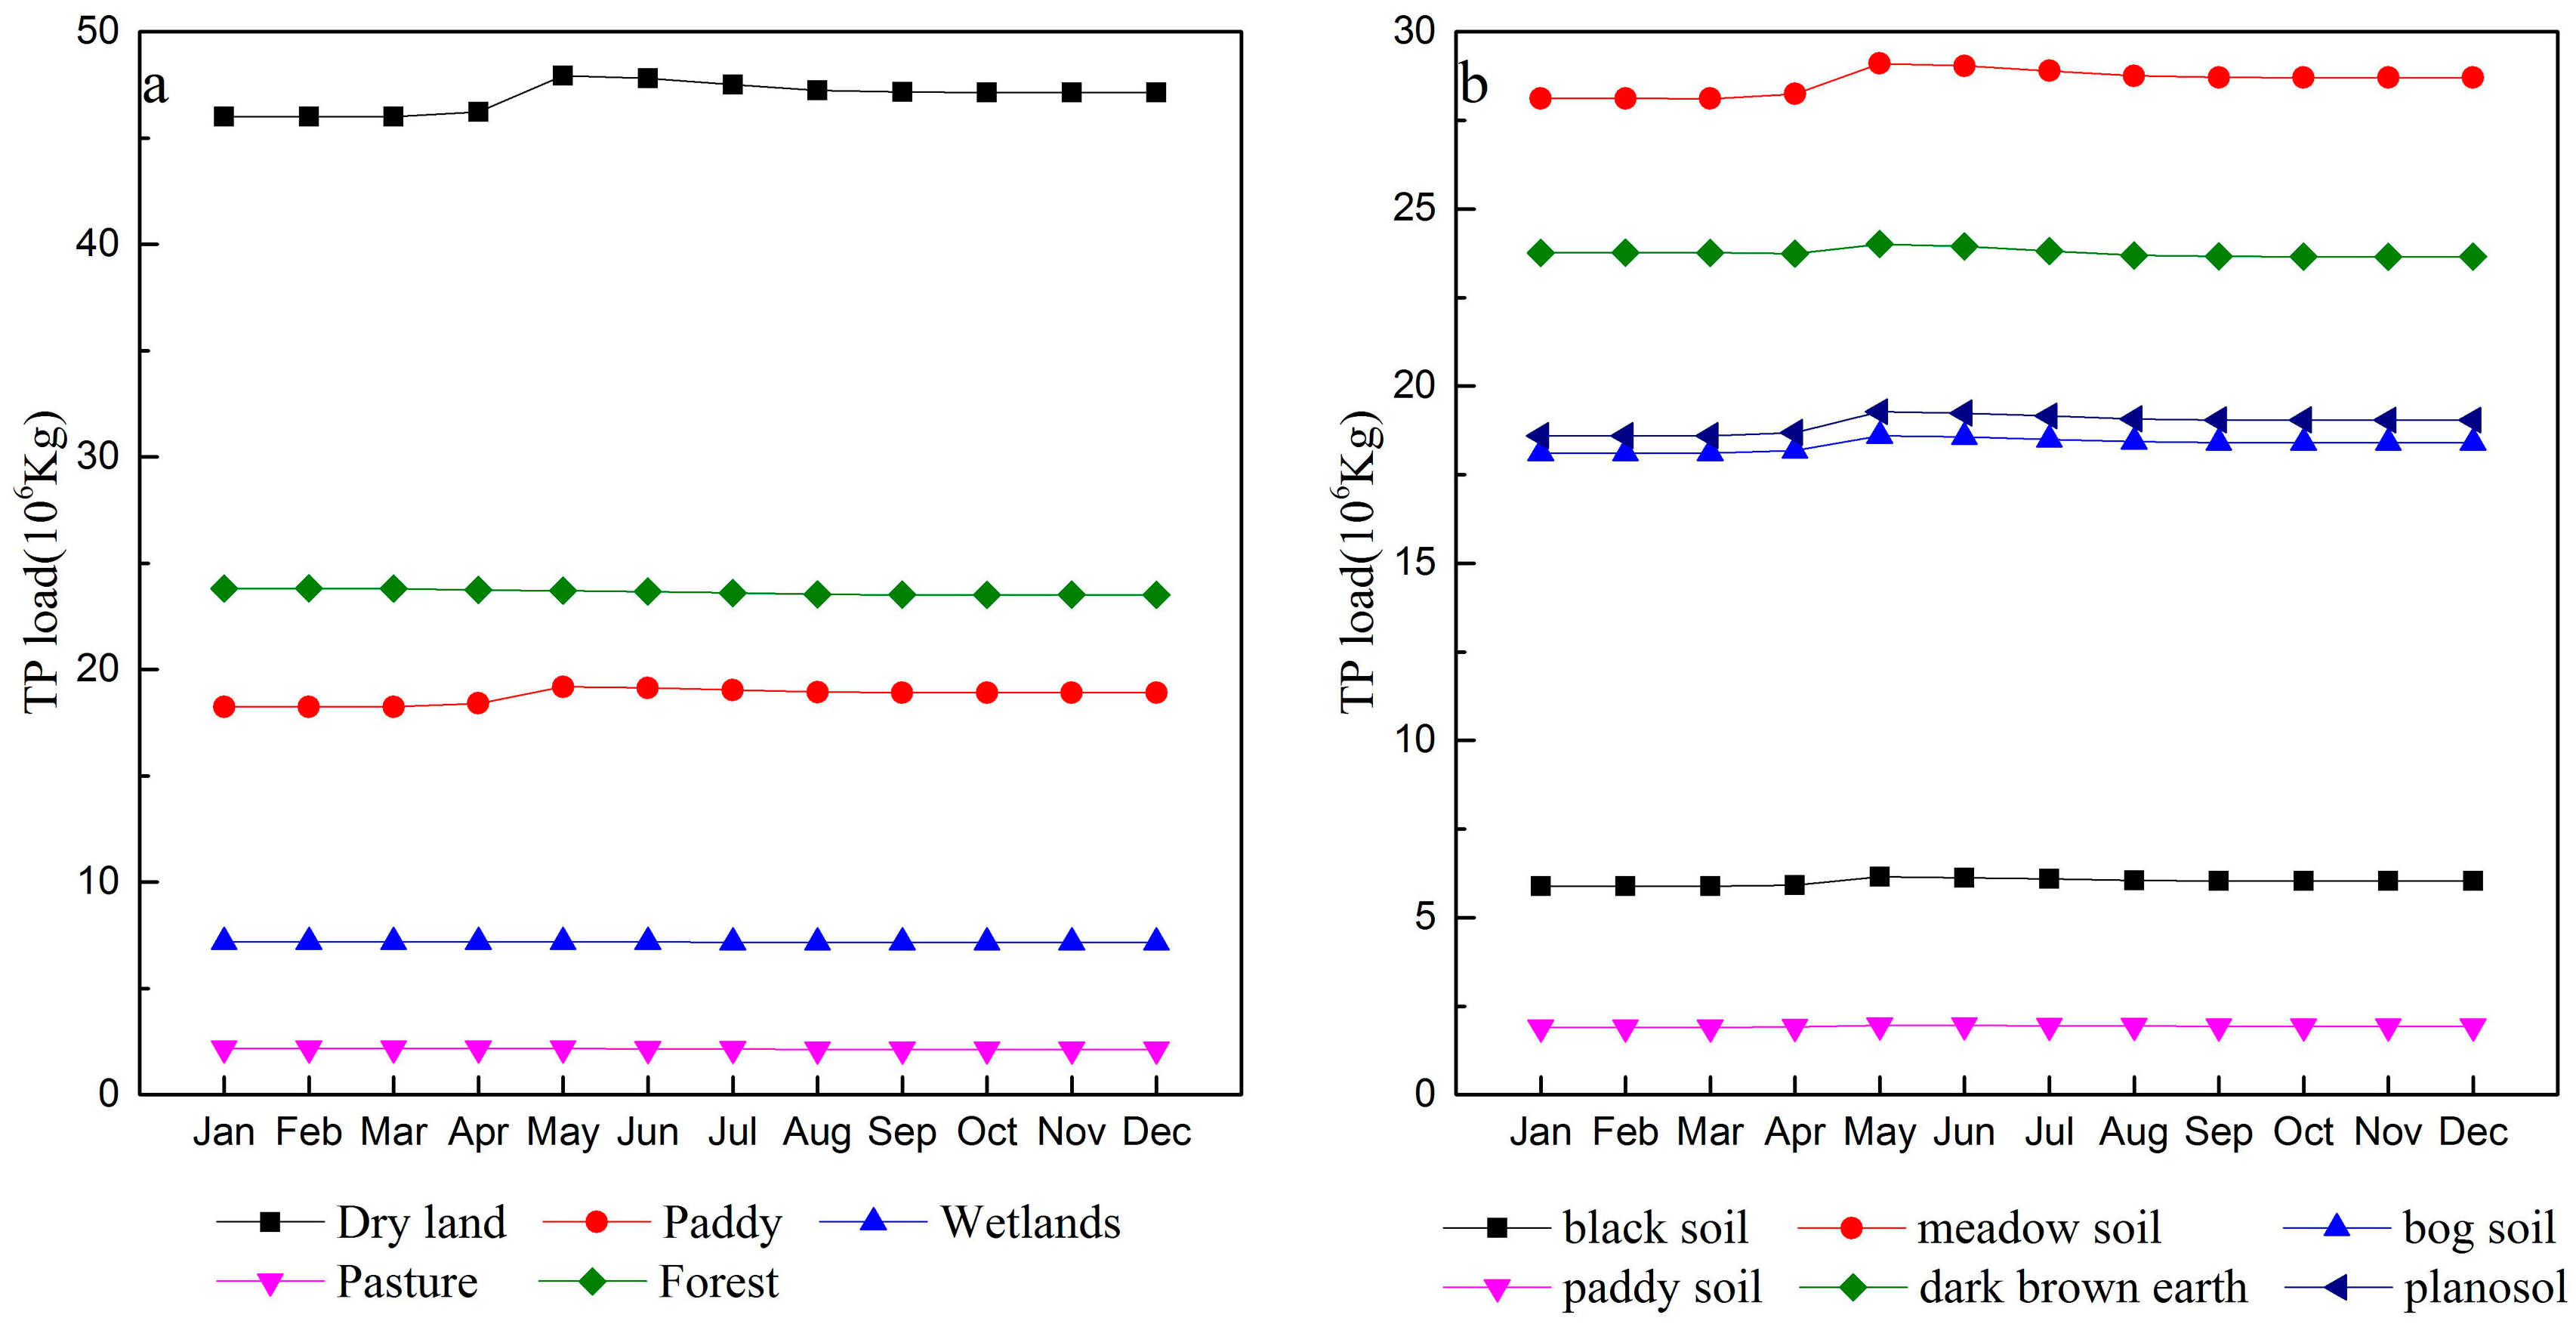
3.3. Total Phosphorus Loads from Different Land Uses

A statistical test (one-way ANOVA) was applied to evaluate the significance of differences in TP load intensity among different land use types. The P value was 0.0012, showing that there was significant difference in TP load intensity among different land use types (p < 0.05). The total phosphorus load intensity is heterogeneous in different land use types. The average value of the total phosphorus load intensity in different land use types can be ranked in descending order as paddy field, dry land, wetlands, grassland, and forestland (Figure 7a).
The total phosphorus load for dry land and paddy field accounted for 64.5%, suggesting that the dominant human agricultural activities have played a major role in the occurrence of phosphorus pollution in the study area. The total phosphorus load of forestland accounted for 25% of that in the study area, but the high forestland total phosphorus load is caused by the decomposition and mineralization of forest litter (Figure 7b).
The total phosphorus load intensity of paddy field increased rapidly, ranging from 9.72821 kg/ha in 2000 to 11.58 kg/ha in 2010, a 0.1683 kg/ha growth per year. The total phosphorus load intensity of dry land increased rapidly, ranging from 8.72307 kg/ha in 2000 to 10.606 kg/ha in 2010, a 0.1712 kg/ha growth per year. The total phosphorus load intensity of wetlands increased rapidly, ranging from 8.9662 kg/ha in 2000 to 9.678 kg/ha in 2010, a 0.0647 kg/ha growth per year. The total phosphorus load intensity of grassland decreased rapidly, ranging from 8.32733 kg/ha in 2000 to 7.7688 kg/ha in 2010, a decline of 0.0508 kg/ha per year. The total phosphorus load intensity of forestland decreased rapidly, ranging from 7.98461 kg/ha in 2000 to 7.3731 kg/ha in 2010, a decline of 0.0556 kg/ha per year.
Based on the data, the total phosphorus load intensity of paddy field and dry land increased year on year, while the other three classes (forestland, pasture and wetland) all showed a declining trend. The increasing trend of the total phosphorus load intensity in the paddy field and dry land is mainly due to the rise in the usage of phosphate fertilizer (Figure 8a).
The total phosphorus load for paddy field and dry land are increasing year on year, while forestland and pasture decline steadily. It appears that there is a smooth trend in wetland after the year 2004. This is because the policies of “Reverting Farmland to Wetland” and “Reverting Farmland to Pasture” on the Sanjiang Plain have been very well implemented. They have reduced the rate of the reduction in the area of wetland and pasture, while the loss of forestland area was still in substantial decline. By contrast, the area of paddy field and dry land showed steady growth (Figure 8b).

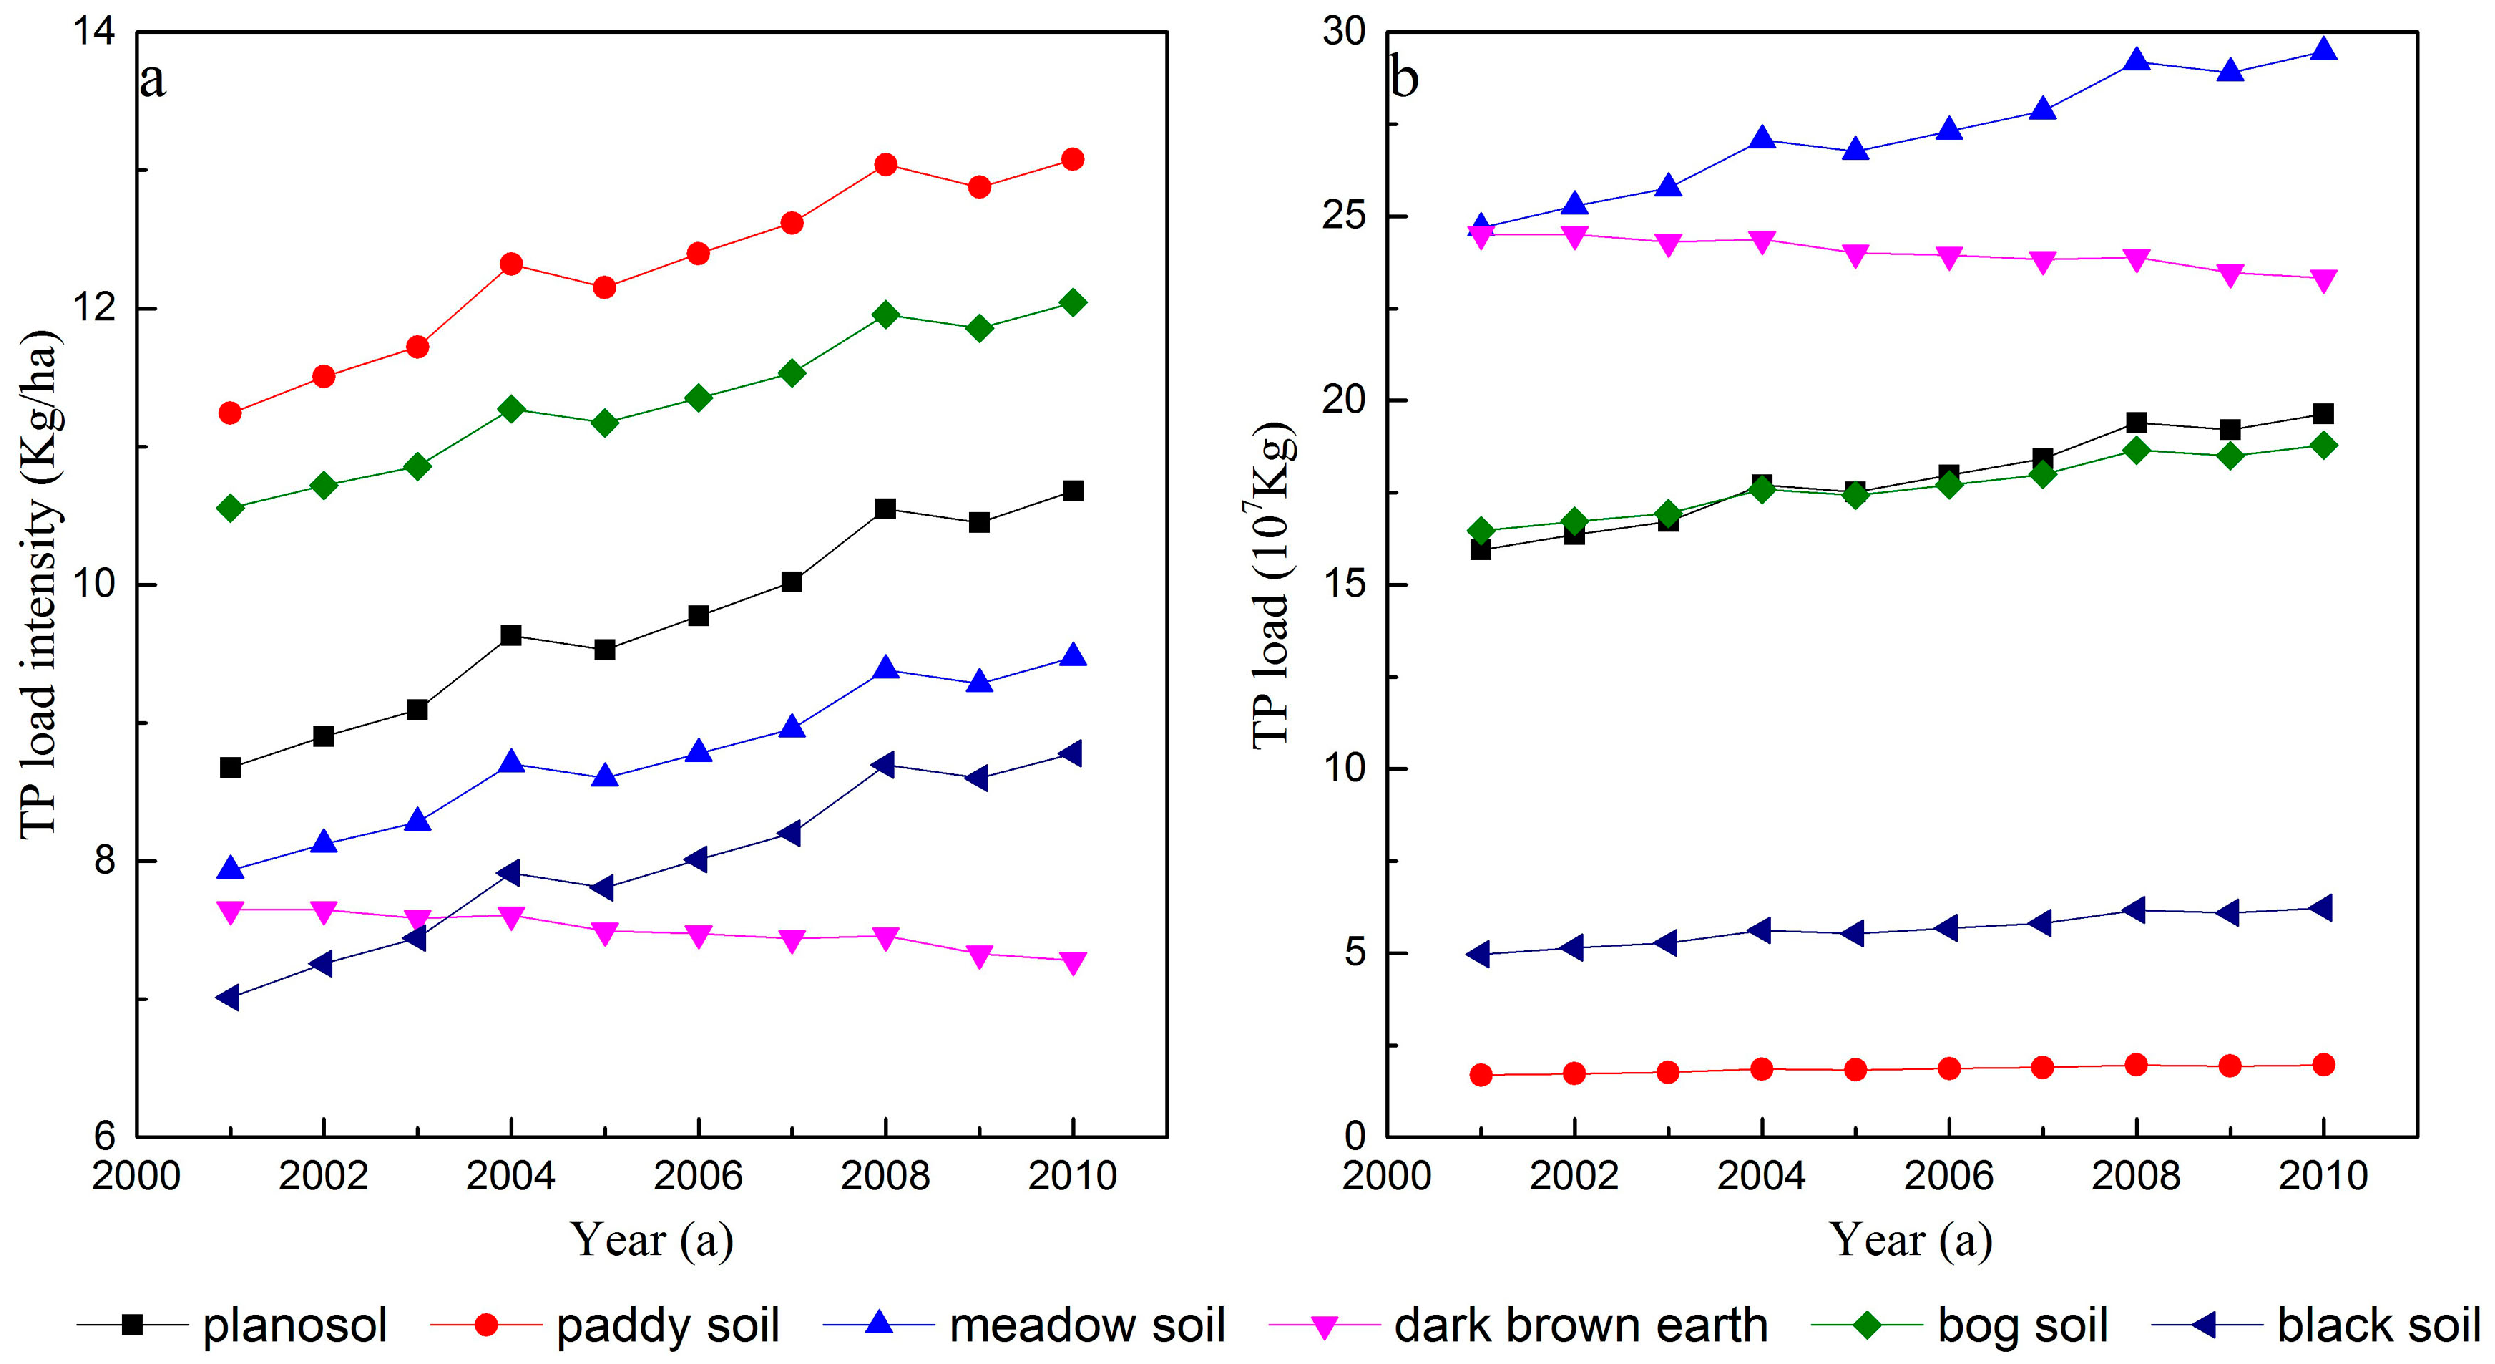
3.4. Total Phosphorus Loads from Different Soil Types

The total phosphorus loads of four soil types (meadow, dark brown, planosol and bog) accounted for 90.84% of the total phosphorus load of all soil types. The largest share of total phosphorus in paddy fields is meadow soil, whereas paddy soil is the main soil component in paddy fields. Meadow soil is the main soil type of dry land (Figure 9a,b).
The one-way ANOVA test was applied to evaluate the significance of differences in TP load intensity among different soil types. The p value was 0.00005, showing that there was significant difference in TP load intensity among different soil types (p < 0.05). The total phosphorus load intensity is heterogeneous among different soil types. The average value of the total phosphorus load intensity in the main soil types can be ranked in descending order as paddy soil, bog soil, planosol, meadow soil, black soil, and dark brown earth between 2001 and 2010 (Figure 9c,d).
The total phosphorus load intensity of paddy soil increased rapidly, ranging from 11.2404 kg/ha in 2001 to 13.0769 kg/ha in 2010, a 0.18365 kg/ha growth per year. The total phosphorus load intensity of bog soil increased rapidly, ranging from 10.5554 kg/ha in 2001 to 12.0433 kg/ha in 2010, a 0.14879 kg/ha growth per year. The total phosphorus load intensity of planosol increased rapidly, ranging from 8.67532 kg/ha in 2001 to 10.677 kg/ha in 2010, a 0.200168 kg/ha growth per year. The total phosphorus load intensity of meadow soil increased rapidly, ranging from 7.93381 kg/ha in 2001 to 9.47273 kg/ha in 2010, a 0.153892 kg/ha growth per year. The total phosphorus load intensity of black soil increased rapidly, ranging from 7.01221 kg/ha in 2001 to 8.77915 kg/ha in 2010, a 0.176694 kg/ha growth per year. The total phosphorus load intensity of dark brown soil decreased rapidly, ranging from 7.65015 kg/ha in 2001 to 7.28174 kg/ha in 2010, a decline of 0.036841 kg/ha per year. Based on the data, the total phosphorus load and total phosphorus load intensity are rising in most of the major soil types, with only dark brown soil showing a declining trend (Figure 10).

4. Discussion

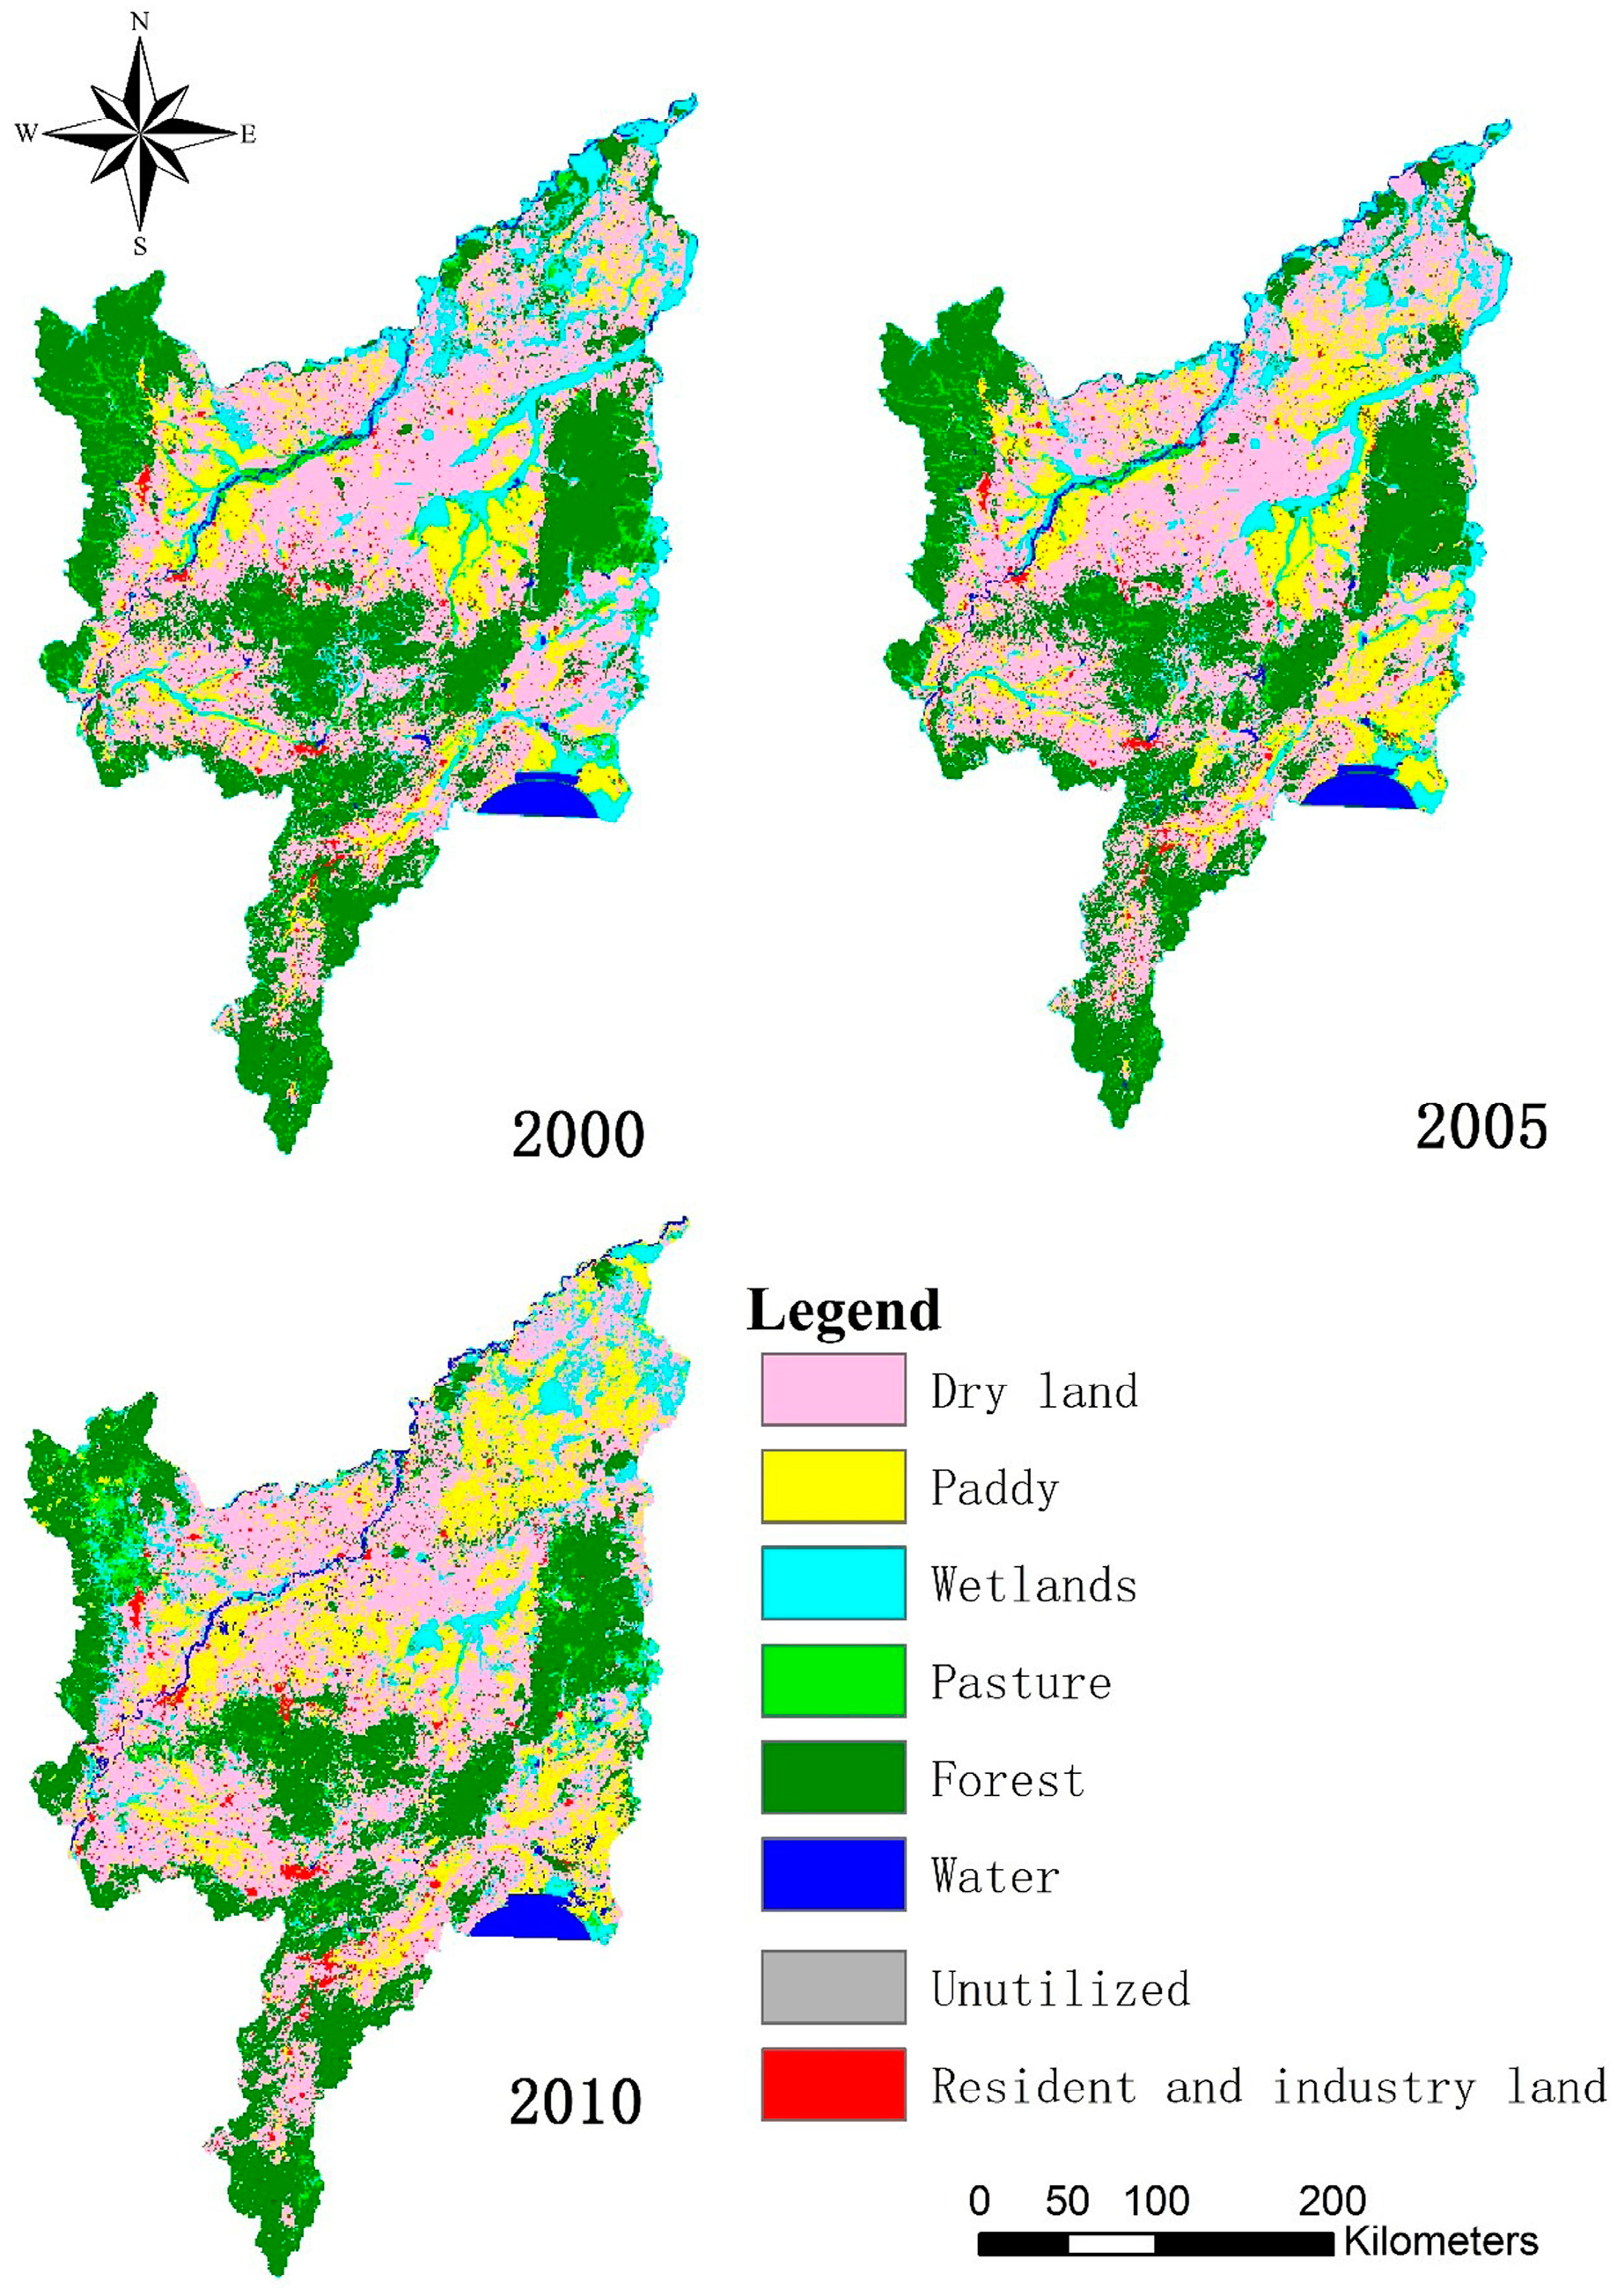
4.1. Effect of Land Use Changes on Total Phosphorus

The transformation of soil types is relatively slow in nature, while the transformation of land use types is more frequent compared with soil types. Since Sanjiang Plain is an important agricultural area, the changes of land use are driven by economic interests (e.g., the economic benefit of rice is high, so much dry land are transformed into paddy field) or by policy (e.g., cultivated fields are transformed into the wetland or pasture). To ensure high yields, fertilizers have generally been applied at very high rates by farmers in this area [41]. We believe that the increased application of phosphate fertilizer is one of the most important reasons for the significant change in P-loading by the end of the year 2005. Even the total phosphorus load strength is relatively stable in different land types, the area changes of some land use types will lead to total phosphorus load changes of different land use types, resulting in change in the total phosphorus load in the study area. In this study, the TP load intensities were 0.778 g/kg (Dryland), 0.814 g/kg (Paddy field), 0.620 g/kg (Forest), and 0.759 g/kg (Wetland). The TP load intensities in Ouyang’s study are 0.878 ± 0.101 g/kg (Dryland), 0.878 ± 0.101 g/kg (Paddy field), 0.841 ± 0.369 g/kg (Forest), and 1.357 ± 0.780 g/kg (Wetland). The content of total phosphorus load intensity is similar to the results of the study by Ouyang et al. [42]. However, it is much more efficient to use the mechanism model EcoHAT-P to estimate the spatial and temporal variations of NPS phosphorus pollution for a large region than the previous regional experimental sampling methods [41,43]. Thus, the model is expected to greatly reduce the management cost in large agriculture regions.

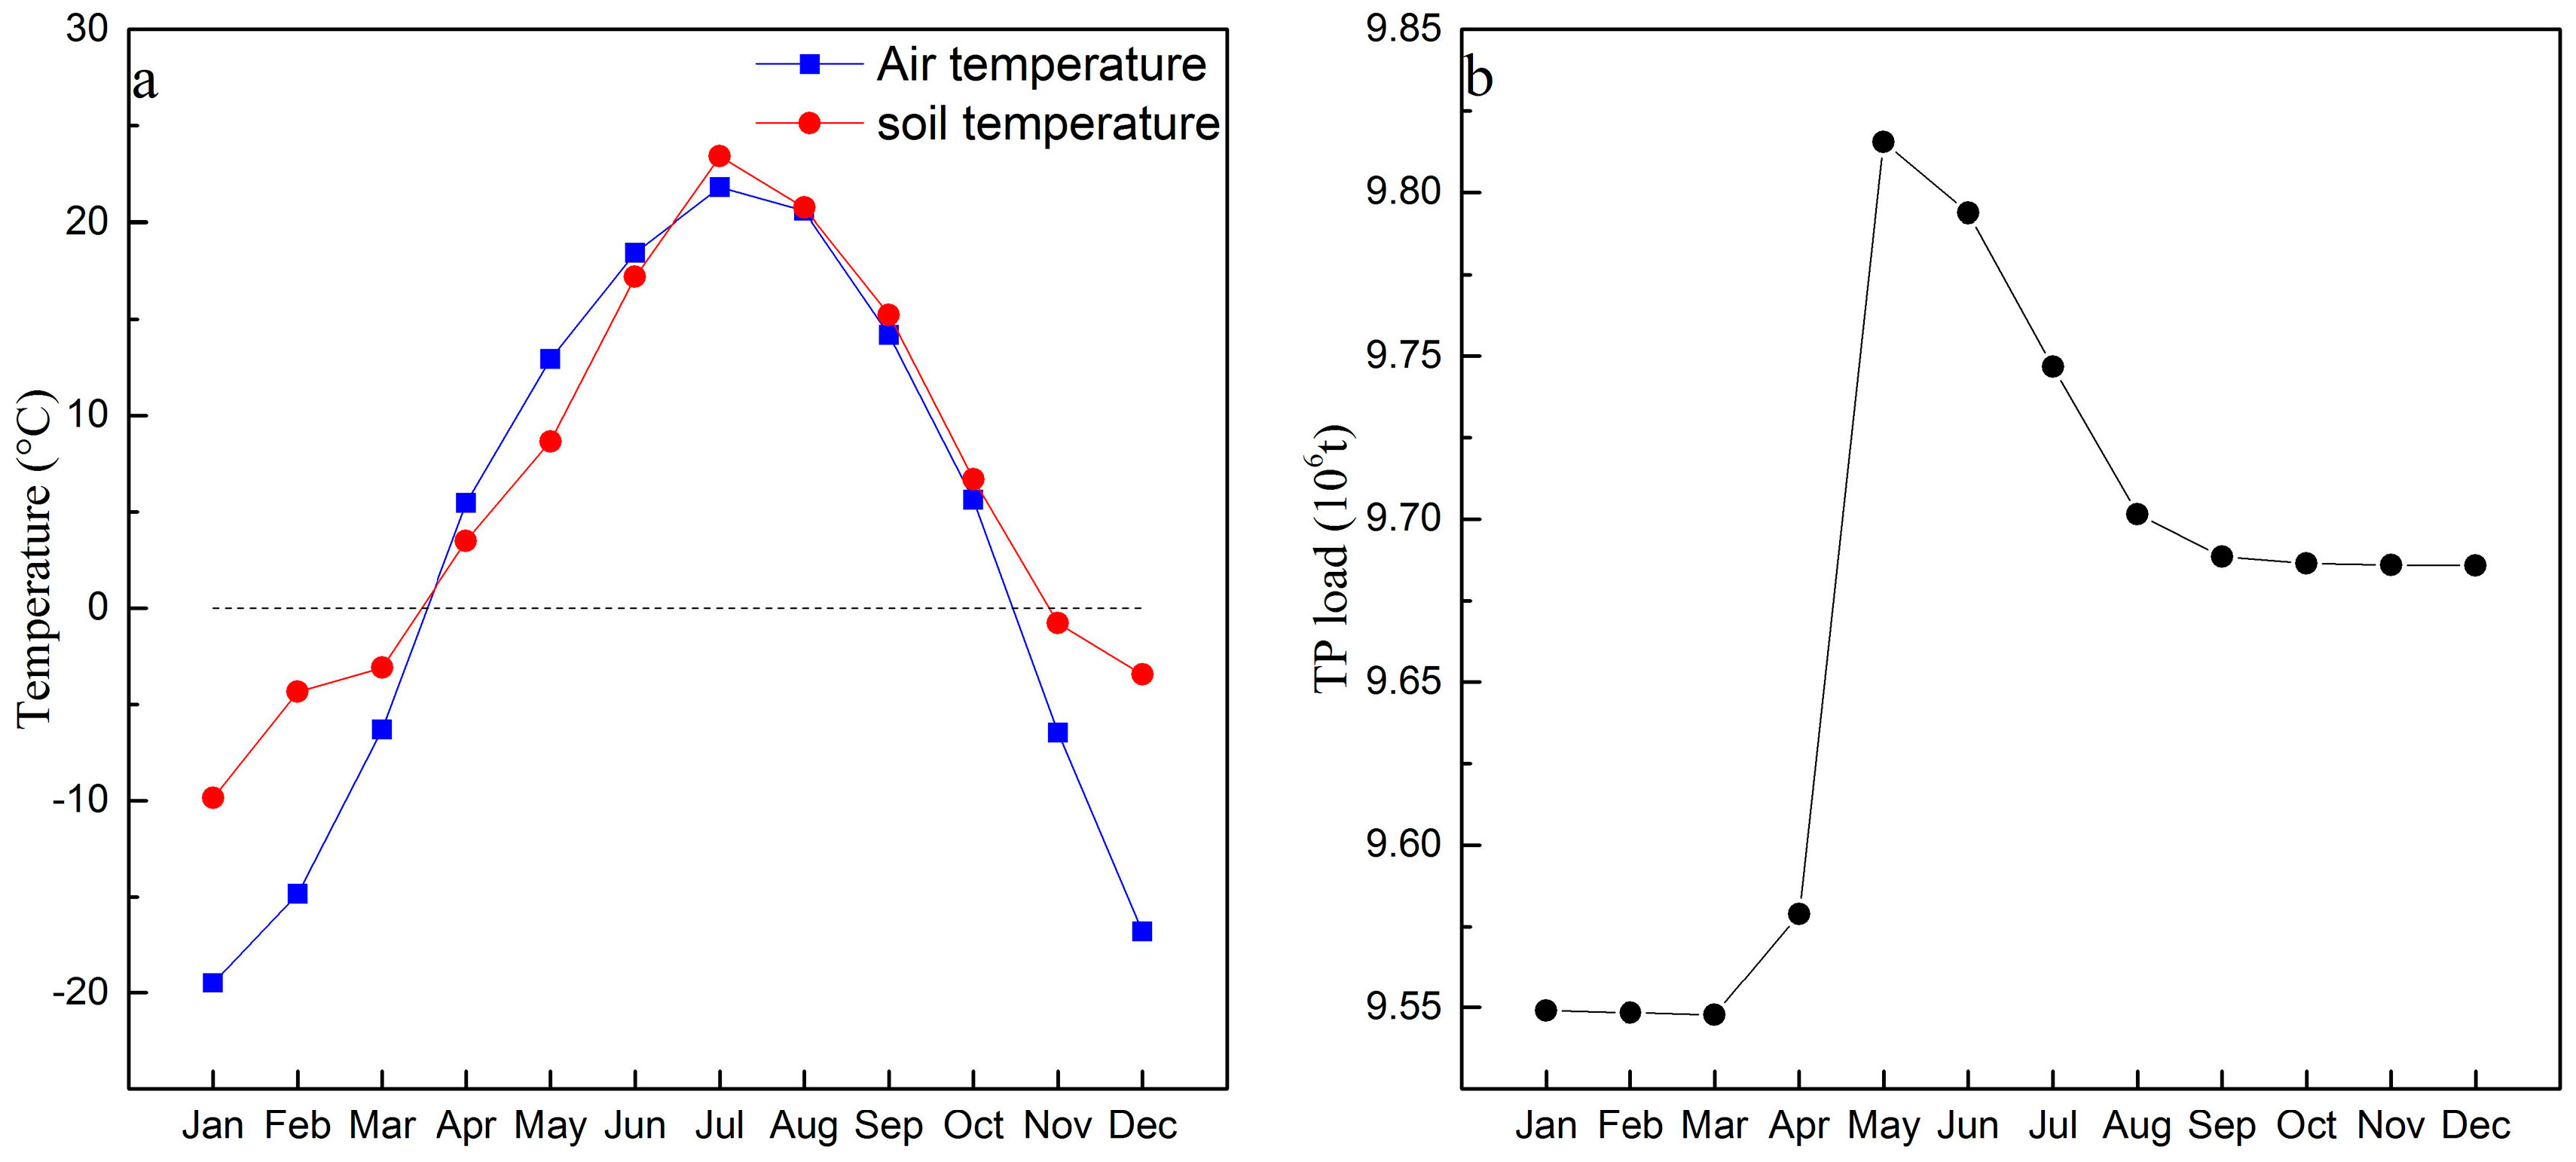
4.2. Response of NPS Phosphorus Load with Temperature

The study area is located at high latitude, as is apparent from Figure 11a. The trend of the average temperature changed in the study area was very similar to the trend of average soil temperature during 2005–2010 (a unimodal distribution). The lowest and highest temperatures were in January and July, respectively, and from November to March of the next year, the air temperature and soil temperatures were below 0 °C. The trend of total phosphorus load appears to be a skewed distribution, with the most severe change mainly in May, June and July. This arises because these months coincide with the cropping season, when the phosphorus is applied (Figure 11b). It can be seen from Figure 12a that the main land use types that exhibited month to month fluctuations were dry land and paddy field. It can be seen from Figure 12b that the main soil types that exhibited month to month fluctuations were meadow soil, planosol and bog soils.
The study area is located at higher latitude in a freeze–thaw region. This provides a possible condition by which to simulate the effect of NPS phosphorus pollution on change in freeze–thaw effects in the watershed.
The variation of NPS phosphorus load with changes in air and ground temperatures is a complex process. In freeze–thaw cycles, biological activity is also closely related with temperature. Normally, with increasing temperature, the rate of biological processes would also increase. The temperature also controls water movement in the soil, and the movement of soil water strongly influences the migration and transformation of NPS phosphorus. In this study, there was a minimum phosphorus value in the April simulation, and in April thawing of the soil occurs when the soil temperature is above the freezing point. The peak value was in May (Figure 11b), which was due to peak fertilization for agriculture. The plot of the NPS phosphorus load had a skewed peak pattern, which is further validation that on-site sampling data are needed for further study.

4.3. Uncertainty for Agricultural NPS Phosphorus Pollution Control

The accuracy of the spatial data is an important factor that impacts on the accuracy of the simulation of phosphorus migration on the Sanjiang Plain. In this study, the main spatial data were derived from multiple-sourced remote sensing products provided by a common platform or model-based remote sensing inversion. Each product itself contains some errors, and remote sensing products from different data sources also have different resolutions in time and space. We used a simple resampling method to transform their scales, which inevitably leads to some errors, increasing the uncertainty of the model. The cumulative errors produce impacts on the final simulation results.
The spraying of chemical fertilizers and pesticides is an important source of agricultural NPS phosphorus pollution. Only phosphorus fertilizer application is considered in this process, and the study does not reflect the impact of spraying pesticides on the NPS phosphorus pollution load. In addition, it does not consider the impacts from farmland ridges and ditches for phosphorus retention. This may also cause uncertainty in the NPS results regarding the phosphorus pollution load.

4.4. Suggestions for Sustainable Agricultural Land Management in the Future

As can be seen from Figure 5, there was a rapid growth trend in the NPS phosphorus pollution load in Sanjiang Plain from 2000 to 2010. This is explained by the increasing amount of phosphate fertilizer used in the cultivated fields. In order to ensure that the NPS phosphorus pollution can be effectively controlled, farmers need to undertake management measures according to the total phosphorus load intensity in different soil types or land use types in the study area (Figure 8a,b). Such actions will reduce the waste of phosphate fertilizer, and avoid the NPS phosphorus pollution caused by them. In addition, farmers need to consider controlling the use of pesticides. In this study, the relationship between the NPS phosphorus load and the temperature is relatively coarse. We can conduct a further study to determine the relationship between the two by increasing the numbers of soil temperature monitoring sites. Then, we will be able to provide data and theoretical support for agricultural NPS pollution control in the area, which is located in the mid-high latitude areas, such as Sanjiang Plain.

5. Conclusions

We applied a distributed NPS model driven by remote sensing data to simulate the phosphorus NPS pollution load on the Sanjiang Plain from 2000 to 2010. The NPS phosphorus pollution load was analysed according to land use types and soil types. We found that the NPS phosphorus pollution load on the Sanjiang Plain shows a trend of increasing year on year, and that the NPS phosphorus pollution load is heterogeneous for different land use types and soil types. The dry land and paddy field account for the majority of total phosphorus load in the study area. This is mainly caused by extensive use of phosphate fertilizers on cultivated land. It can be seen that intensive human agricultural activities play a major role in the phosphorus pollution of the study area. If we do not effectively control the agricultural use of chemical fertilizers, there is a significant risk that the NPS phosphorus pollution load will continue to rise on the Sanjiang Plain.

Acknowledgments

We acknowledge all reviewers and editors for their valuable advice. The authors would like to thank the management of the Bawujiu Farm. The project benefited from the financial support provided by the National Natural Science Foundation of China (Grant Nos. 41271414, 40930740, and 41301496), the Supporting Programme of the “Twelfth Five-Year Plan” for Science & Technology Research of China (2012BAB02B00), and the Fundamental Research Funds for the Central Universities.

Author Contributions

Zhiwei Wang, Shengtian Yang and Changsen Zhao conceived and designed the experiments; Hezhen Lou, Juan Bai, Linna Wu and Guotao Dong performed the experiments; Zhiwei Wang and Ke Chen analysed the data; Qiuwen Zhou contributed analytical tools; and Zhiwei Wang wrote the paper. All authors discussed the structure and commented on the manuscript at all stages.

Conflicts of Interest

The authors declare no conflict of interest. The founding sponsors had no role in the design of the study; in the collection, analyses, or interpretation of data; in the writing of the manuscript, nor in the decision to publish the results.

References

  1. Sims, J.; Edwards, A.; Schoumans, O.; Simard, R. Integrating soil phosphorus testing into environmentally based agricultural management practices. J. Environ. Qual. 2000, 29, 60–71. [Google Scholar] [CrossRef]
  2. Townsend, A.R.; Porder, S. Agricultural legacies, food production and its environmental consequences. Proc. Natl. Acad. Sci. USA 2012, 109, 5917–5918. [Google Scholar] [CrossRef] [PubMed]
  3. McDowell, R.; Sharpley, A. The effects of soil carbon on phosphorus and sediment loss from soil trays by overland flow. J. Environ. Qual. 2003, 32, 207–214. [Google Scholar] [CrossRef] [PubMed]
  4. Sharpley, A. Identifying sites vulnerable to phosphorus loss in agricultural runoff. J. Environ. Qual. 1995, 24, 947–951. [Google Scholar] [CrossRef]
  5. Sims, J.; Simard, R.; Joern, B. Phosphorus loss in agricultural drainage: Historical perspective and current research. J. Environ. Qual. 1998, 27, 277–293. [Google Scholar] [CrossRef]
  6. Beasley, D.; Huggins, L.; Monke, A. Answers: A model for watershed planning. Trans. ASAE 1980, 23, 938–944. [Google Scholar] [CrossRef]
  7. Davison, P.S.; Withers, P.J.; Lord, E.I.; Betson, M.J.; Strömqvist, J. PSYCHIC—A process-based model of phosphorus and sediment mobilisation and delivery within agricultural catchments. Part 1: Model description and parameterisation. J. Hydrol. 2008, 350, 290–302. [Google Scholar] [CrossRef]
  8. Knisel, W.G. Creams: A Field Scale Model for Chemicals, Runoff, and Erosion from Agricultural Management Systems; Conservation Research Report (USA); Department of Agriculture, Science and Education Administration: Washington, DC, USA, 1980.
  9. Neitsch, S.L.; Williams, J.; Arnold, J.; Kiniry, J. Soil and Water Assessment Tool Theoretical Documentation Version 2009; Texas Water Resources Institute: College Station, TX, USA, 2011. [Google Scholar]
  10. Storm, D.; Dillaha, T., III; Mostaghimi, S.; Shanholtz, V. Modeling phosphorus transport in surface runoff. Trans. ASAE 1988, 31, 117–127. [Google Scholar] [CrossRef]
  11. Williams, J.R. The erosion-productivity impact calculator (epic) model: A case history. Philos. Trans. R. Soc. B Biol. Sci. 1990, 329, 421–428. [Google Scholar] [CrossRef]
  12. Yuan, Y.; Bingner, R.; Theurer, F.; Rebich, R.; Moore, P. Phosphorus component in annagnps. Trans. ASAE 2005, 48, 2145–2154. [Google Scholar] [CrossRef]
  13. Ficklin, D.L.; Luo, Y.; Luedeling, E.; Zhang, M. Climate change sensitivity assessment of a highly agricultural watershed using SWAT. J. Hydrol. 2009, 374, 16–29. [Google Scholar] [CrossRef]
  14. Ouyang, W.; Skidmore, A.K.; Toxopeus, A.G.; Hao, F.H. Long-term vegetation landscape pattern with non-point source nutrient pollution in upper stream of yellow river basin. J. Hydrol. 2010, 389, 373–380. [Google Scholar] [CrossRef]
  15. Ouyang, W.; Song, K.Y.; Wang, X.L.; Hao, F.H. Non-point source pollution dynamics under long-term agricultural development and relationship with landscape dynamics. Ecol. Indic. 2014, 45, 579–589. [Google Scholar] [CrossRef]
  16. Saleh, A.; Du, B. Evaluation of SWAT and HSPF within BASINS program for the upper North Bosque River watershed in central Texas. Trans. ASAE 2004, 47, 1039–1049. [Google Scholar]
  17. Bouraoui, F.; Dillaha, T.A. Answers-2000: Non-point-source nutrient planning model. J. Environ. Eng. 2000, 126, 1045–1055. [Google Scholar] [CrossRef]
  18. Dong, G.; Yang, S.; Bai, J.; Wang, Z.; Zhang, Y. Open innovation in the Sanjiang plain: A new paradigm for developing agriculture in china. J. Food Agric. Environ. 2013, 11, 1108–1113. [Google Scholar]
  19. Liu, C.; Yang, S.; Wen, Z.; Wang, X.; Wang, Y.; Li, Q.; Sheng, H. Development of ecohydrological assessment tool and its application. Sci. China Ser. E Technol. Sci. 2009, 52, 1947–1957. [Google Scholar] [CrossRef]
  20. Wang, X.; Yang, S.; Mannaerts, C.M.; Gao, Y.; Guo, J. Spatially explicit estimation of soil denitrification rates and land use effects in the riparian buffer zone of the large guanting reservoir. Geoderma 2009, 150, 240–252. [Google Scholar] [CrossRef]
  21. Wang, X.; Mannaerts, C.M.; Yang, S.; Gao, Y.; Zheng, D. Evaluation of soil nitrogen emissions from riparian zones coupling simple process-oriented models with remote sensing data. Sci. Total Environ. 2010, 408, 3310–3318. [Google Scholar] [CrossRef] [PubMed]
  22. Wang, X.; Wang, Q.; Yang, S.; Zheng, D.; Wu, C.; Mannaerts, C.M. Evaluating nitrogen removal by vegetation uptake using satellite image time series in riparian catchments. Sci. Total Environ. 2011, 409, 2567–2576. [Google Scholar] [CrossRef] [PubMed]
  23. Yang, S.; Dong, G.; Zheng, D.; Xiao, H.; Gao, Y.; Lang, Y. Coupling xinanjiang model and swat to simulate agricultural non-point source pollution in songtao watershed of Hainan, China. Ecol. Model. 2011, 222, 3701–3717. [Google Scholar] [CrossRef]
  24. Zhou, Q.; Yang, S.; Zhao, C.; Cai, M.; Lou, H.; Luo, Y.; Hou, L. Development and implementation of a spatial unit non-overlapping water stress index for water scarcity evaluation with a moderate spatial resolution. Ecol. Indic. 2016, 69, 422–433. [Google Scholar] [CrossRef]
  25. Lou, H.; Yang, S.; Zhao, C.; Zhou, Q.; Bai, J.; Hao, F.; Wu, L. Phosphorus risk in an intensive agricultural area in a mid-high latitude region of china. Catena 2015, 127, 46–55. [Google Scholar] [CrossRef]
  26. Ouyang, W.; Huang, H.B.; Hao, F.H.; Guo, B.B. Synergistic impacts of land-use change and soil property variation on non-point source nitrogen pollution in a freeze-thaw area. J. Hydrol. 2013, 495, 126–134. [Google Scholar] [CrossRef]
  27. Ouyang, W.; Huang, H.; Hao, F.; Shan, Y.; Guo, B. Evaluating spatial interaction of soil property with non-point source pollution at watershed scale: The phosphorus indicator in northeast china. Sci. Total Environ. 2012, 432, 412–421. [Google Scholar] [CrossRef] [PubMed]
  28. China meteorological data net. Available online: http://data.cma.cn/ (accessed on 8 July 2015).
  29. United States Geological Survey. Available online: http://www.usgs.gov/pubprod/ (accessed on 8 July 2015).
  30. Cai, M.Y.; Yang, S.T.; Zhao, C.S.; Zeng, H.J.; Zhou, Q.W. Estimation of daily average temperature using multisource spatial data in data sparse regions of central Asia. J. Appl. Remote Sens. 2013, 7. [Google Scholar] [CrossRef]
  31. Nachtergaele, F. Soil Taxonomy—A Basic System of Soil Classification for Making and Interpreting Soil Surveys: By Soil Survey Staff, 1999, Usda–Nrcs, Agriculture Handbook Number 436, Hardbound; Elsevier: Amsterdam, The Netherlands, 2001. [Google Scholar]
  32. Cai, M.Y.; Yang, S.T.; Zeng, H.J.; Zhao, C.S.; Wang, S.D. A distributed hydrological model driven by multi-source spatial data and its application in the Ili river basin of central Asia. Water Resour. Manag. 2014, 28, 2851–2866. [Google Scholar] [CrossRef]
  33. Singh, V.P. Computer Models of Watershed Hydrology; Water Resources Publications: Highlands Ranch, CO, USA, 1995. [Google Scholar]
  34. Williams, J.R. Sediment routing for agricultural watersheds 1. J. Am. Water Resour. Assoc. 1975, 11, 965–974. [Google Scholar] [CrossRef]
  35. Neitsch, S.L.; Arnold, J.G.; Kiniry, J.R.; Williams, J.R. Overview of Soil and Water Assessment Tool (SWAT) Model; Tier B (All Countries/Territories not Listed Here are in Tier A); World Association of Soil and Water Conservation: Ankeny, IA, USA, 2009; Volume 8, p. 3. [Google Scholar]
  36. Jones, C.A.; Cole, C.V.; Sharpley, A.N.; Williams, J.R. A simplified soil and plant phosphorus model. I. Documentation. Soil Sci. Soc. Am. J. 1984, 48, 800–805. [Google Scholar] [CrossRef]
  37. Zhu, W.Q.; Pan, Y.Z.; Zhang, J.S. Estimation of net primary productivity of Chinese terrestrial vegetation based on remote sensing. Acta Phytoecol. Sin. 2007, 31, 413–424. [Google Scholar]
  38. Zhu, Z.X.; Arp, P.A.; Meng, F.R.; Bourque, C.P.A.; Foster, N.W. A forest nutrient cycling and biomass model (fornbm) based on year-round, monthly weather conditions, part 1: Assumption, structure and processing. Ecol. Model. 2003, 169, 347–360. [Google Scholar] [CrossRef]
  39. Arp, P.A.; Oja, T. A forest soil vegetation atmosphere model (forsva), I: Concepts. Ecol. Model. 1997, 95, 211–224. [Google Scholar] [CrossRef]
  40. Neitsch, S.; Arnold, J.; Kiniry, J.; Williams, J.; King, K. Soil and Water Assessment Tool Theoretical Documentation; Grassland, Soil and Water Research Laboratory: Temple, TX, USA, 2005. [Google Scholar]
  41. Ouyang, W.; Shan, Y.; Hao, F.; Chen, S.; Pu, X.; Wang, M.K. The effect on soil nutrients resulting from land use transformations in a freeze-thaw agricultural ecosystem. Soil Tillage Res. 2013, 132, 30–38. [Google Scholar] [CrossRef]
  42. Ouyang, W.; Xu, Y.; Hao, F.; Wang, X.; Siyang, C.; Lin, C. Effect of long-term agricultural cultivation and land use conversion on soil nutrient contents in the sanjiang plain. Catena 2013, 104, 243–250. [Google Scholar] [CrossRef]
  43. Yang, W.; Cheng, H.; Hao, F.; Ouyang, W.; Liu, S.; Lin, C. The influence of land-use change on the forms of phosphorus in soil profiles from the sanjiang plain of China. Geoderma 2012, 189, 207–214. [Google Scholar] [CrossRef]
Figure 1. Geographical location and DEM (Digital Elevation Model) of the Sanjiang Plain in Northeast China.
Water 08 00505 g001
Figure 2. Land use distributions and conversion from 2000 to 2010.
Water 08 00505 g002
Figure 3. Distribution of soil types in Sanjiang Plain.
Water 08 00505 g003
Figure 4. Conceptual framework of the soil P model.
Water 08 00505 g004
Figure 5. Observed and simulated results for the random sample points.
Water 08 00505 g005
Figure 6. Annual watershed precipitation and NPS mean total phosphorus (TP) yield from 2000 to 2010.
Water 08 00505 g006
Figure 7. Load intensity (a); and load (b) of total phosphorus (TP) from each land use between 2001 and 2010.
Water 08 00505 g007
Figure 8. Load intensity (a); and load (b) of total phosphorus (TP) for each land use between 2000 and 2010.
Water 08 00505 g008
Figure 9. Proportion of soil types in different land use types (a); proportion of land use types in different soil types (b); load (c); and load intensity (d) of total phosphorus (TP) for each soil type between 2001 and 2010.
Water 08 00505 g009
Figure 10. Load (a); and load intensity (b) of total phosphorus (TP) from each soil type between 2001 and 2010.
Water 08 00505 g010
Figure 11. Monthly air and soil temperatures (a); and total phosphorus (TP) load (b).
Water 08 00505 g011
Figure 12. Monthly total phosphorus (TP) load from each: land use type (a); and soil type (b).
Water 08 00505 g012
Table 1. Description of data available for the Sanjiang Plain.
Data TypeScaleData DescriptionSource
Digital Elevation Model1:250,000Elevation, overland and channel slopes and lengthsInstitute of Geographical and Natural Resources Research, Chinese Academy of Sciences; National Geomatics Centre of China
Land Use1:100,000Land use classificationsInstitute of Geographical and Natural Resources Research, Chinese Academy of Sciences
Soil Properties1:1,000,000Physical and chemical properties of soilsInstitute of Soil Science, Chinese Academy of Sciences
Weather Data-Precipitation, daily maximum and minimum air temperature, relative humidity and solar radiationChina Meteorological Administration; Local Bureau of Meteorology
Hydrology and Water Quality-Local hydrographical station and environmental monitoring stationSocial and economic data, population, livestock rearing, fertilizer application, field investigation; statistics yearbook
Table 2. Estimated areas of each land use and land use changes from 2000 to 2010.
Land UseTotal Area (km2)2000–20052000–20102005–2010
200020052010km2%km2%km2%
Unutilized641061064265.64265.600
Urban22462336249990425311.31637
Dry land44,22445,27445,51910502.412952.92450.5
Paddy field11,42015,01617,451359631.5603152.8243516.2
Wetlands10,50485907075−1914−18.2−3429−32.6−1515−17.6
Pasture422026162931−1604−38−1289−30.531512
Forest33,96332,52430,478−1439−4.2−3485−10.3−2046−6.3
Water2183235527581727.957526.340317.1
Table 3. Functions and parameters in the P model.
No.Model NameEquationReference
1NPP Simulation NPP ( x , t ) = APAR ( x , t ) × ε ( x , t ) CASA model [37]
2Production Distribution d F B d t = R L A _ W ε L A d t   d R B d t = K r a ( d NPP d t d F B d t ) ForNBM model [38]
d W B d t = d NPP d t d F B d t d R B d t
3Nutrient Absorption X u p t a l e = m i n ( X a v a i l , X d e m ) ForNBM model [38,39]
4Vegetation Litter L l i t = { a f h F b ,   T a i r > T f a l l F b ,   T a i r < T f a l l a f s F b , T a i r > T f a l l L l i t = { a f l F L ,   T a i r > T f a l l F L ,   T a i r < T f a l l ForNBM model [38]
W l i t = a f w W B   R l i t = a f r R B
5Fertilization P s o l u t i o n , f e r t = f e r t m i n P f e r t o r g P f r s h , f e r t = 0.5 f e r t o r g P f e r t o r g P h u m , f e r t = 0.5 f e r t o r g P f e r t SWAT model [40]
6Mineralization & Decomposition. P m i n a = 1.4 β m i n ( γ t m p , γ s w ) 1 / 2 o r g P a c t Model [36]
7Inorganic P Absorption P s o l / s t a , l y = { P s o l u t i o n , l y m i n P a c t , l y p a i 1 p a i 0.1 ( P s o l u t i o n , l y m i n P a c t , l y p a i 1 p a i ) SWAT model [40]
Notes: APAR(x,t): Plant absorbed photosynthetically active radiation from pixel x in day t (MJ·m−2); ε(x,t): The real efficiency of radiation utilization (g C·MJ−1); NPP: Net Primary Productivity (g C·m−2); FB: NPP the leaf obtains (g C·m−2); RLA_W: Biomass in 1 m2 leaf (g·m−2);   ε L A : Leaf area increment per month (m−2); RB: The NPP root obtains (g C·m−2); Kra: Return coefficient of leaf nutrient, constant; WB: The NPP limb obtains (g C·m−2); Xavail: The plant available amount of element X(X = P)·(g·m−2); Xdem: The plant demand amount of element X(X = P)·(g·m−2); Llit: Leaf wither amount (g C·m−2); afh: Deciduous species wither threshold; afs: Evergreen species wither threshold; afr: Root wither threshold; afw: Limb wither threshold; afl: Herbage wither threshold; Tair: Air temperature (°C); Tfall: The threshold temperature of deciduous species (°C); Rlit: The root wither amount (g C·m−2); Wlit: The limb wither amount (g C·m−2); Llit: Herbage wither amount (g C·m−2); FL: The NPP herbage obtains (g C·m−2); Tfall: The threshold temperature of herbage species (°C); Pslution,fert: The dissolved soil P from fertilization (kg P·ha−1); fertminP: The percentage of mineral P in fertilizer (%); orgPfrsh,fert: The fresh organic P in soil come from fertilization (kg P·ha−1); fertorgP: The percentage of organic P in fertilization (%); orgPhum,fert: The humus organic soil P come from fertilization (kg P·ha−1); fert: The amount of fertilization (kg P·ha−1); Pmina: The phosphorus mineralized from the humus active organic P pool (kg P·ha−1); orgPact: The mount of phosphorus in the active organic pool (kg P·ha−1); β m i n : The rate coefficient for mineralization of the humus active organic nutrients; γ t m p : The nutrient cycling temperature factor; γ s w : The nutrient cycling water factor; Psol/act,ly: Amount of phosphorus transferred between the active and stable mineral pools (kg P·ha−1); Pslution,ly: The amount of phosphorus in solution (kg P·ha−1); minPact,ly: The amount of phosphorus in the active mineral pool (kg P·ha−1); pai: The availability index.
Table 4. Statistical analysis of the observed value and the simulated value.
Data TypeSamplesMean Value (g/kg)Min Value (g/kg)Max Value (g/kg)Standard DeviationStandard-Error of Mean
Observed410.8810.711.120.09720.0152
Simulated410.87860.64831.06700.09020.0141

