Article

The Mitigation Potential of Buffer Strips for Reservoir Sediment Yields: The Itumbiara Hydroelectric Power Plant in Brazil

by
Marta P. Luz
1,*,
Lindsay C. Beevers
2,
Alan J. S. Cuthbertson
2,
Gabriela M. Medero
2,
Viviane S. Dias
3 and
Diego T. F. Nascimento
3
1
Eletrobras Furnas, Pontifical Catholic University of Goiás, BR153, km 510, Zona Rural, Aparecida de Goiânia-Goiás CEP 74923-650, Brazil
2
School of Energy, Geoscience, Infrastructure and Society, Heriot-Watt University, Edinburgh EH14 4AS, UK
3
Pontifical Catholic University of Goiás, Av. Universitária 1.440, Setor Universitário, Goiânia-Goiás CEP 74605-010, Brazil
*
Author to whom correspondence should be addressed.
Water 2016, 8(11), 489; https://doi.org/10.3390/w8110489
Submission received: 5 August 2016 / Revised: 21 October 2016 / Accepted: 25 October 2016 / Published: 28 October 2016

Abstract

:
Soil erosion and deposition mechanisms play a crucial role in the sustainability of both existing reservoirs and newly planned projects. Soil erosion is one of the most important factors influencing sediment transport yields, and, in the context of existing reservoirs, the surrounding watersheds supply both runoff and sediment yield to the receiving water body. Therefore, appropriate land management strategies are needed to minimize the influence of sediment yields on reservoir volume and, hence, the capacity of power generation. In this context, soil erosion control measures such as buffer strips may provide a practical and low-cost option for large reservoirs, but need to be tested at the catchment scale. This paper represents a study case for the Itumbiara hydroelectric power plant (HPP) in Brazil. Four different scenarios considering radially planted buffer strips of Vetivergrass with widths of 20 m, 40 m, 100 m and 200 m are analyzed. A semi-distributed hydrological model, SWAT, was used to perform the simulations. Results indicate a reduction of sediments transported to the reservoir of between 0.2% and 1.0% per year is possible with buffer strip provision, and that this reduction, over the life of Itumbiara HPP, may prove important for lengthening the productivity of the plant.

1. Introduction

Soil erosion and subsequent land degradation is recognized as an internationally important issue that has significant environmental and socio-economic impacts. There are direct links between land management techniques and the rate of sediment erosion, driven by wind and water processes. Focusing on water related processes at the watershed scale, eroded sediment is transported across the land and into receiving water bodies from where it is conveyed through river systems, eventually depositing within the linked fluvial-estuarine-coastal system. In fluvial systems with large anthropogenic interventions (e.g., hydropower dams and reservoirs), sediment deposition can be exacerbated by large impoundments that act as sediment sinks within the watershed. With limited potential for large-scale sediment flushing, this sedimentation can build up over time, reducing available storage and decreasing the efficiency of the reservoir system (e.g., through lower attenuation of flood flows, reduced potential for hydropower production, less water for irrigation supply, or any combination of these) [1].
In agricultural watersheds, inappropriate cultivation practices often accelerate erosion rates and thereby increase sediment movement from the land surface and subsequent transport in streams and rivers. Similarly, the occurrence of large areas of exposed soils between cultivation seasons influences ground infiltration rates and overland surface flows, thus potentially increasing soil erosion rates observed during this period significantly [2,3]. When accelerated sediment erosion occurs in upstream river basins, it can result in detrimental impacts to downstream engineering infrastructure—in particular, reservoirs impoundments and associated hydropower operations [4]. Implementation of best management practices is therefore required in these critical erosion prone areas to control such losses and to protect receiving impoundments from high sediment loads [5,6,7,8]. Thus, improved insight and understanding of the interplay between soil erosion/sedimentation mechanisms within the surrounding watershed and potential land management strategies, such as buffer strip implementation, designed to mitigate these processes (and, hence, reduce sediment transport yields from the watershed), will have a crucial role in formulating “best-practice” design and management to ensure the sustainability of planned or existing reservoirs [9,10].
The government of Brazil is currently investing heavily in large hydropower plants to meet the increasing energy demands of the country. However, the loss of water storage volume within these impoundments due to sedimentation from the surrounding watersheds is recognized as a significant problem for some of these newly constructed reservoirs, impacting upon their useful operating life. In an attempt to address this issue, engineers are involved in developing better management strategies to identify critical regions within the watersheds that contribute most to these land erosion (and subsequent reservoir sedimentation) problems and to propose possible intervention measures to manage water and sediment resources more effectively.
A number of different hydro-mechanical properties can be identified to explain the protective role that vegetation has in promoting slope stabilization, reducing soil erosion risk, and filtering sediment movement through overland flow (i.e., runoff). In this context, a tight, dense cover of grass or herbaceous vegetation can provide superior protection against the impact of water (e.g., arising from precipitation) and wind erosion, whilst filtering and trapping the sediment load carried in overland flow. The deep-rooted, woody vegetation is effective in mitigating or preventing shallow mass stability slope failures. Therefore, the loss or removal of slope vegetation can result in either increased rates of erosion or a higher incidence of mass slope failure.
The use of Vetiver grass (Indian grass) as a vegetation type for delivering such potential sediment or soil erosion mitigation can provide both environmental and financial benefits. It has a root system that is resistant to changes in the water level within the reservoir and does not require frequent maintenance. Furthermore, it will grow virtually anywhere (i.e., not constrained by site conditions), which makes it unique for erosion mitigation and slope stabilization. When planted closely (approximately 10 cm apart) across the slope to form a hedge, its biological growth characteristics provide an effective dense vegetation barrier that filters out run-off sediment, dissipates hydraulic forces, and spreads out excess water evenly across the length of the hedge barrier. These properties make it an ideal vegetation type for buffer strip implementation and can stabilize slopes and filter sediment from overland flow. Figure 1 shows the schematized role of Vetiver grass in interrupting overland flow and trapping/filtering out sediments.
International research and applications of the Vetiver eco-engineering technique have grown since the 1980s in terms of both theory and practice (detailed in Table 1). Standard sites for the application of Indian grass include river banks, reservoirs edges, slopes, and critical erosion areas, such as end zones of flow, where it can form effective buffer strip vegetation. Brazil’s hydropower reservoirs have significant perimeters that make them susceptible to erosion and stabilization issues. Hence, erosion treatments that focus on reducing sediment delivery to the reservoir and do not use significant areas of land must be a priority. In the existing literature on Vetiver grass, while there are variations in the scales of experimental studies conducted to date (see Table 1 for details), the majority of studies have focused on plots between 1 m and 30 m wide. As such, there is no clear consensus in the literature about the large-scale application of Vetiver grass in erosion control and sediment trapping/filtering.
There is therefore a need to upscale these field findings to larger watershed scales in order to understand their effectiveness in reducing sediment delivery to the river basin, hence their ability to control sediment deposition within receiving reservoirs. Consequently, the objective of this study was to identify specific erosion prone areas within a case study watershed—the Itumbiara hydroelectric power plant (HPP) in Brazil—and to investigate the efficiency of the identified potential biostabilization/sediment filtering methods on sediment yields. The paper aims to upscale in situ findings to understand the efficiency of geotechnical interventions at the watershed scale using the Soil and Water Assessment Tool (SWAT), a basin scale modeling approach. Results are presented from the preliminary assessment of the role of edge vegetation in the form of a buffer strips composed of Vetiver (Indian) grasses and in mitigating sediment delivery to the Itumbiara HPP reservoir.

2. Materials and Methods

For the purposes of the study, a semi-distributed, basin-scale hydrological model, capable of simulating surface water and sediment movement was required to analyze sediment delivery (yield) to the reservoir and the potential efficiency of any proposed biostabilization and sediment filtering methods. Over the years, a number of hydrological models (e.g., MIKE SHE, AGNPS, and the Soil and Water Assessment Tool (SWAT)) have been developed [4,17,18,19] to simulate water flow and sediment transport at the river-basin scale. The current study uses SWAT, a process-based hydrological model, developed by the USDA, Agricultural Research Service (ARS), which can be applied to large ungauged basins [20,21,22]. Previous studies using SWAT have addressed a variety of watershed issues (e.g., van Griensven et al. [23]; Gassman et al. [24]; Mishra et al. [5]; Cao et al. [25]; Tuppad et al. [26]; Mukhtar et al. [27]). A detailed description of the SWAT model, and its capabilities for watershed hydrological and sediment modeling can be found in van Griensven et al. [23].

2.1. Study Site: Itumbiara HPP, Brazil

The Itumbiara Dam is an earth-fill embankment dam on the Paranaíba River near Itumbiara city in Goiás, Brazil (Figure 2), incorporating a HPP with an installed capacity of 2082 MW. The impounded reservoir has a plan area of 778 km2 and can store 12.5 km3 of useful water volume for power generation. The upstream watershed of the Itumbiara HPP is approximately 5685 km2. A weather station is located adjacent to the northwest sub-basin (i.e., sub basin 82, Figure 2), which records average annual rainfall of 1638 mm. The sediment erosion characteristics in the reservoir watershed are regarded as being representative of those found around many other Brazilian reservoirs.
A team of researchers from the Institute of Socio-Environmental Studies at the Federal University of Goiás (IESA-UFG) developed an erosion potential map (see Figure 2) for the watershed, as part of a R&D project funded by the HPP operating company (Eletrobras Furnas). This map was created by estimating the density of erosion at the reservoir edge and associated interfluves, using a statistical tool (Kernel, ArcMap software), and combining this with other environmental factors for the watershed sub-basins such as soil classification, coverage and landuse, surface geomorphic character, slope and hypsometry. From the erosion susceptibility map (Figure 2), it is clear that, of the total reservoir watershed (approximately 5685 km2), only about 167 km2 reports significantly high erosion potential. The study used the erosion potential map to focus on this smaller critical area to investigate in detail the potential of Vetiver grass to reduce sediment yield to the reservoir. This detailed analysis (Figure 2) therefore focused on 7 adjacent sub-catchments with significant erosion potential that all drained directly to the reservoir. This sub-area is referred to herein as the study watersheds. Finally, Figure 3a–d show the landuse, soil classification, slope, and digital elevation model for the Itumbiara HPP study watersheds.

2.2. SWAT Model Input Data

The required input data for the SWAT model setup in the current Itumbiara HPP case study is described below:
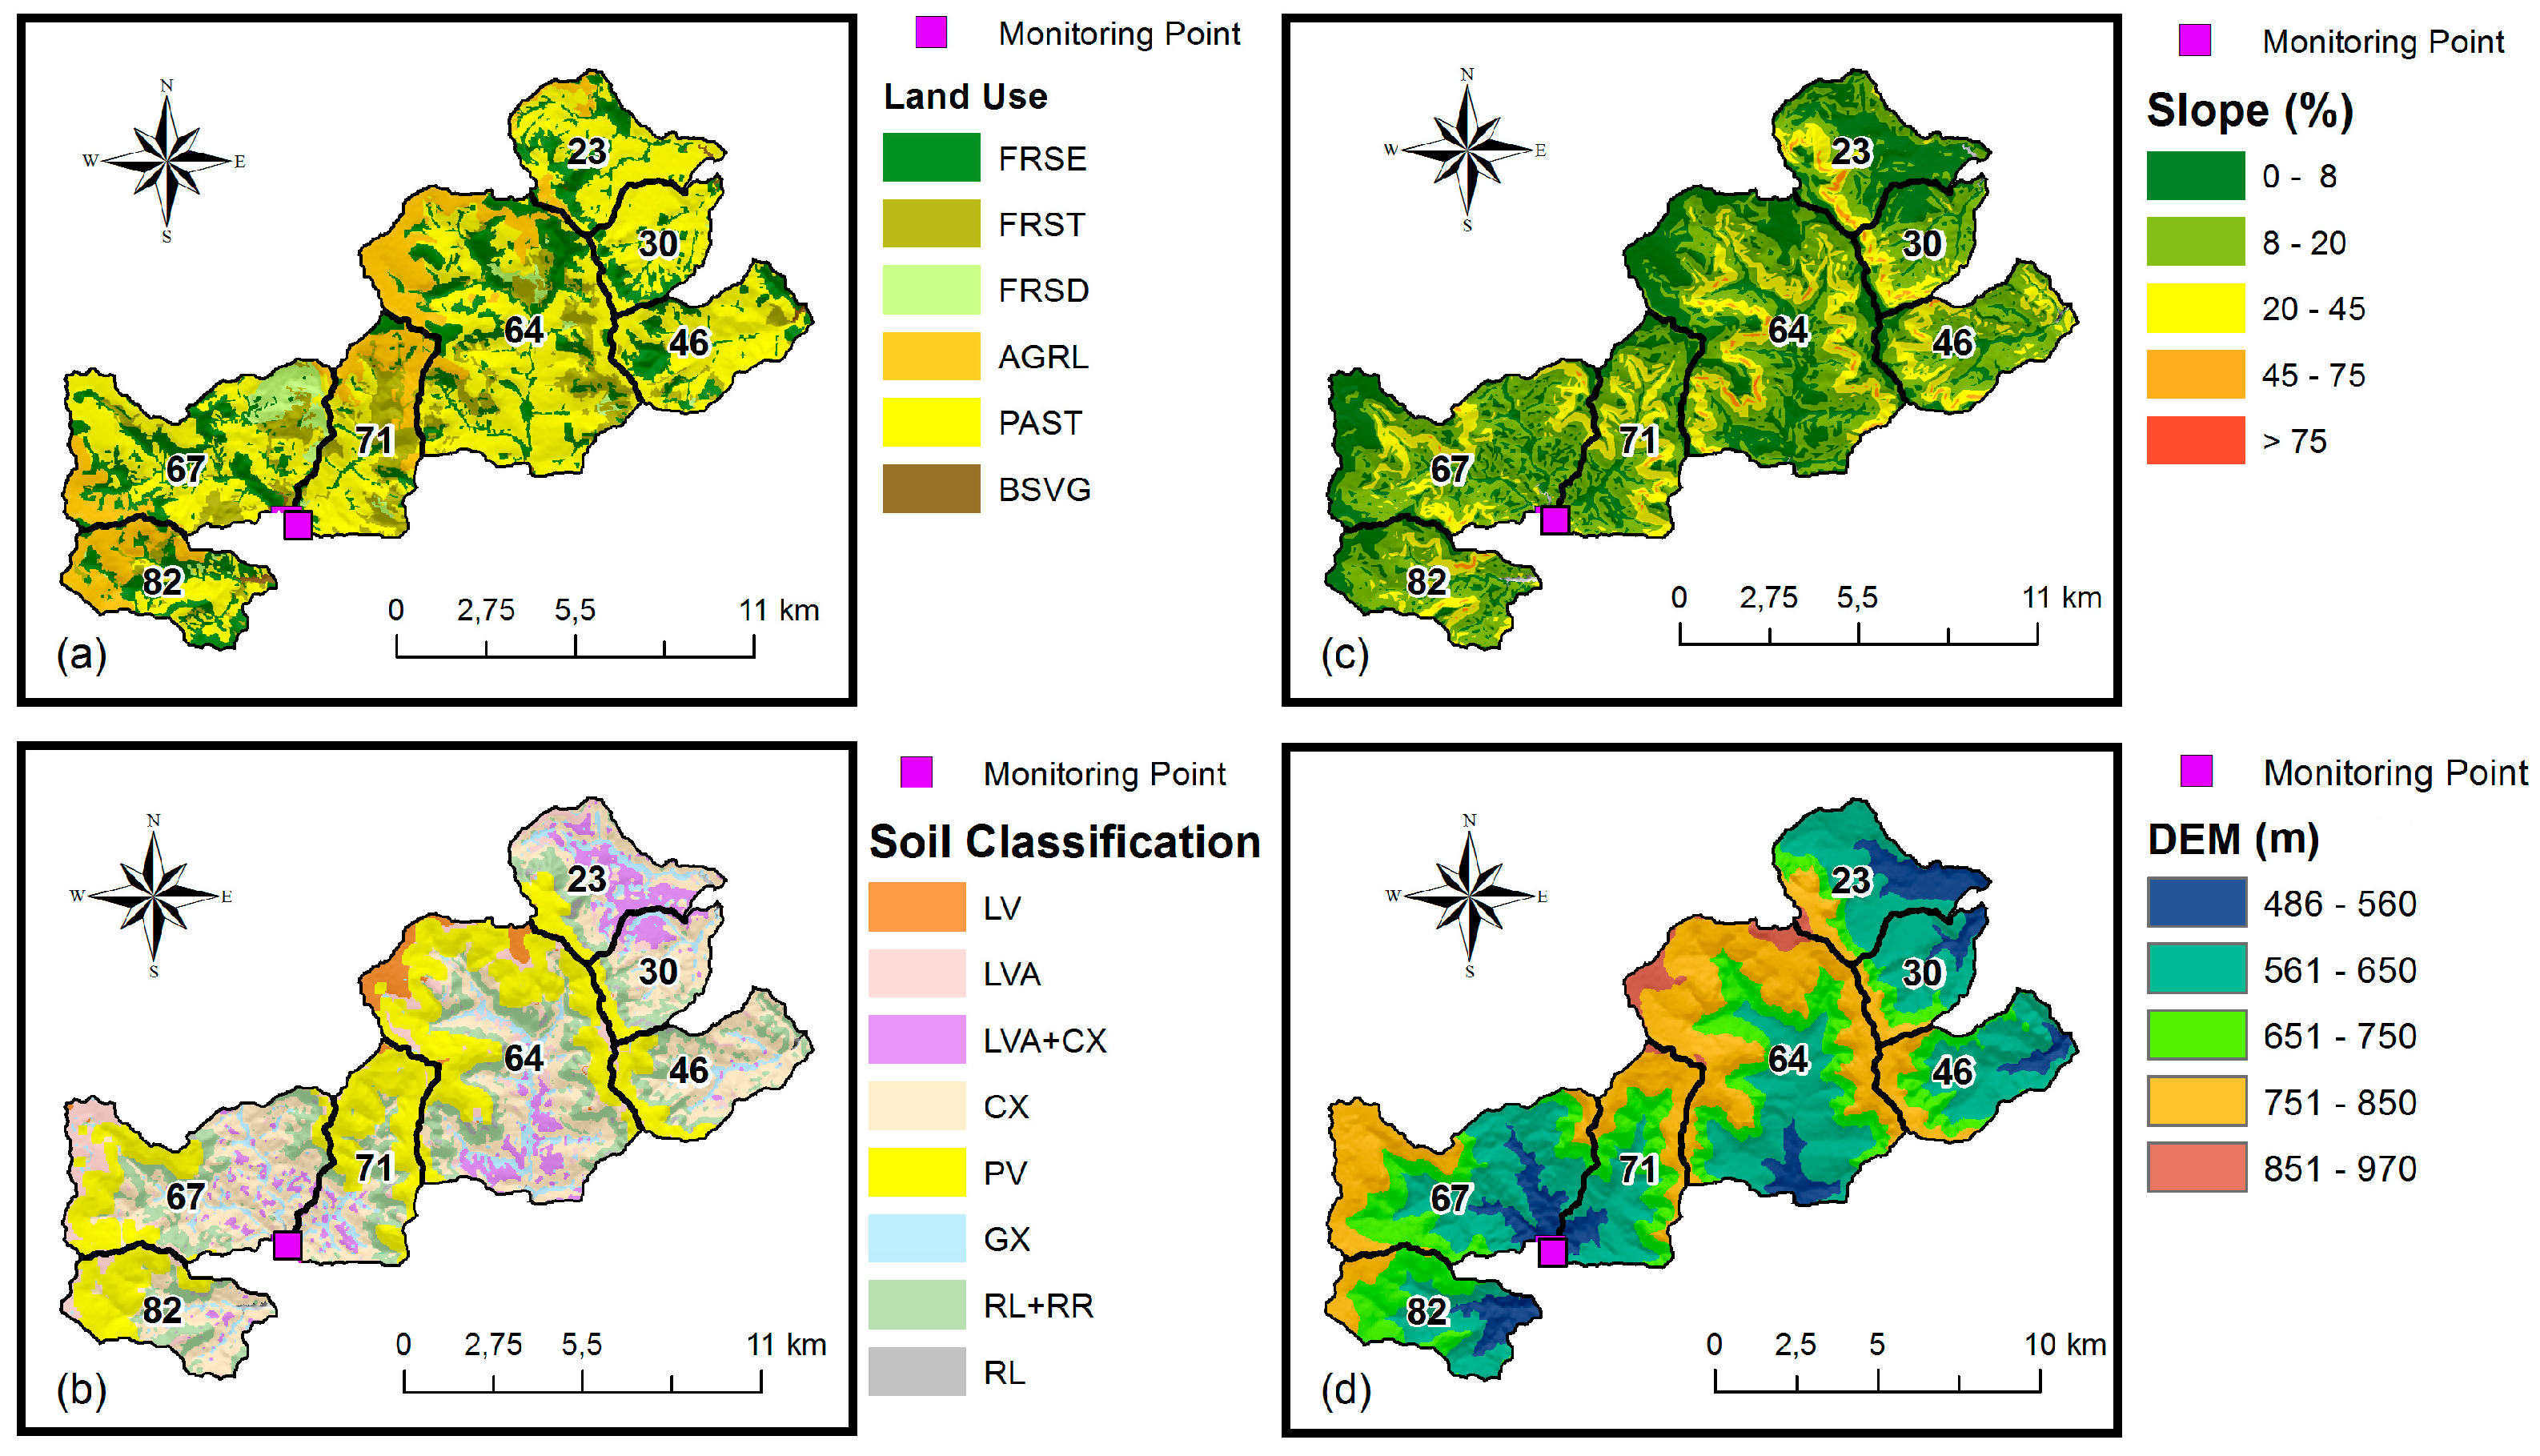
  • Landuse: The landuse map (Figure 3a) used images from INPE via Landsat-5 satellite TM sensor (Thematic Mapper) with a spatial resolution of 30 m. Complementary images from Japanese satellite ALOS were used, with 2.5 m spatial resolution. Field visits were undertaken to validate the images where necessary. The catchment is dominated by pasture—PAST (42.2%), generic agricultural land—AGRL (27.4%), forest-evergreen—FRST (21.4%), forest-mixed—FRST (6.7%), forest-deciduous—FRSD (0.8%), and barren or sparsely vegetated—BSVG (2.3%).
  • Digital elevation model (DEM): A 30 m by 30 m resolution DEM was obtained from the TOPODATA project [28]. The DEM was used to delineate the upstream watershed of the Itumbiara HPP. Sub-watershed parameters such as slope gradient, length, and the stream network characteristics such as channel slope, width, and length were derived from the DEM (Figure 3d).
  • Soil data: The soil data of Itumbiara HPP watershed was added to the SWAT soil database manually (at a resolution of 30 m by 30 m). The soil groups were classified using RADAM BRASIL [29] and the FAO’s (Food and Agricultural Organization of United Nations) texture classification for tropical soils. The average altitude of the survey was 12 km at 690 km/h. The imaging system used GEMS (Goodyear Mapping System 1000), which operates at X-band (wavelengths close to 3 cm and often between 8 and 12.5 GHz). In addition, other methodologies were used to provide information on soil type including infrared and multispectral radar images, low altitude overflights, on-site field visits, and petrographic analysis. The soil map of the study watershed is shown in Figure 3b. For the whole catchment, the following soils are present (with percentage abundance in brackets): hapliccambisol—CX (33%), leptsol-regosol—RL + RR (16.5%), red oxisol—LV (13.6%), ultisol—PV (12.7%), gleysol—GX (10.1%), red yellow oxisol—LVA (8.2%), red yellow oxisol-haplic—LVA + CX (5.7%), leptsol—RL (0.2%).
  • Hydrometeorological data: The data required for the model included rainfall, river discharge, and climate data (temperatures, solar radiation, humidity, and wind speed). Daily rainfall and climate data was available for one station inside the Itumbiara HPP (shown in Figure 2). The analyzed rain gauge provided data over the period from 1987 to 2013.

3. Results

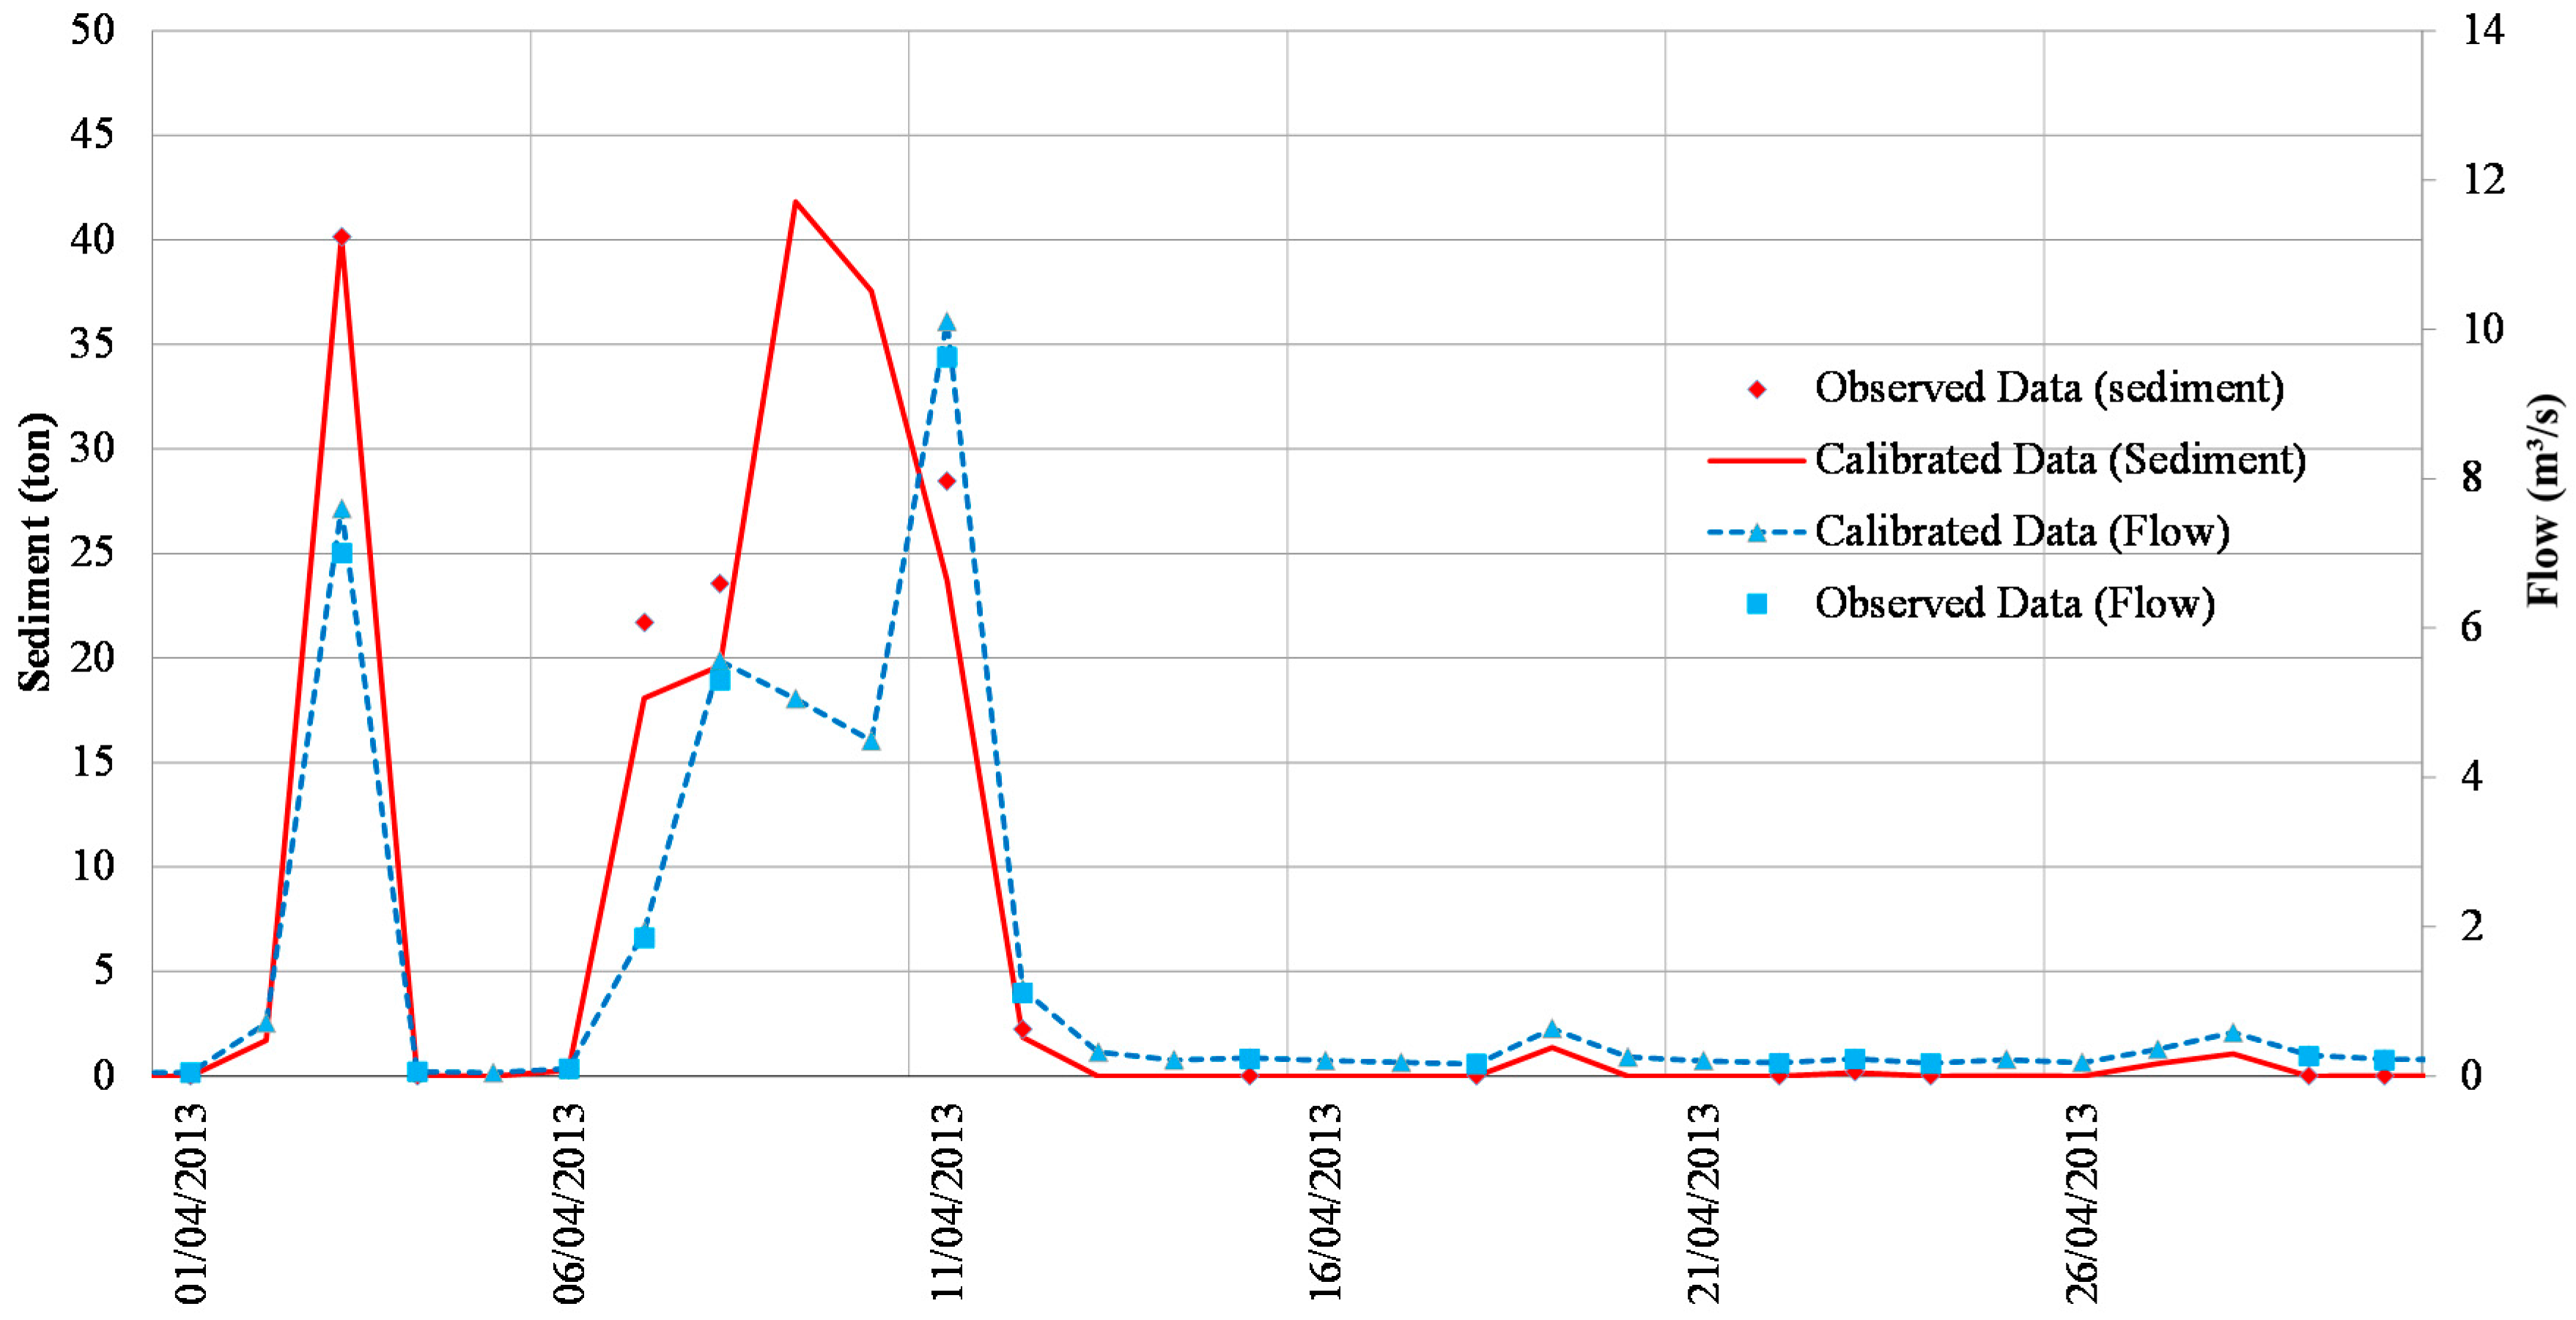
3.1. SWAT Model Calibration

As part of the model calibration, a sensitivity analysis of the SWAT model parameters was performed, using the Latin hypercube one-factor-at-a-time (LH-OAT SWAT option) sampling procedure, to determine the most influential parameters for runoff and sediment yield [23]. The first three years were used as a warm-up period to minimize uncertain initial conditions, as the SWAT manual recommends.
Table 2 presents the results of this sensitivity analysis, showing the ranking and sensitivity level of each parameter tested. The sensitivity index (SI) was defined using the manual mode based on Equation (1) [30]. The higher the obtained sensitivity index value is, the higher the model sensitivity is compared to the parameter, where (a) values larger than 1 indicate high sensibility; (b) values between 1 and 0.8 indicate intermediate sensibility; and (c) values smaller than 0.8 indicate low sensibility. It is valuable to notice that values close to zero indicate that the model does not present sensibility to the parameter.
S I = R 1 R 2 R 12 I 1 I 2 I 12
where SI is the index in relation to the entry parameters; R1 is the obtained result with the model related to the smaller entry data; R2 is the obtained result with the model related to the largest entry data; R12 is the average of the obtained results with smaller and largest entry data; I1 is the smaller entry data; I2 is the largest entry data; I12 is the average of the entry data.
The results indicate that the most important (Rank 1, “excessively sensitive”, Table 2) parameter was Cn2 (initial SCS runoff curve number), suggesting that this parameter directly affects the soil permeability, the landuse, and the antecedent soil water conditions.
Within the study, watershed sub-basin 71, flow (velocity), and sediment (turbidity) data was measured from a sampling campaign at the main basin outlet to the reservoir, which was used for calibration of the SWAT model. The data was in the form of daily spot samples, taken at a depth of 1 m from the surface.
Next, the model was calibrated, using the top three ranked sensitive parameters in the SWAT model (Table 2), against observed field data collected in 2013 (See Figure 4). Manual calibration was undertaken, focusing on the most sensitive parameters. These were varied until reasonable agreement was achieved (Figure 4). The SWAT model performance for the calibration period (April 2013) was evaluated using Nash–Sutcliffe efficiency (NSE), and the results were 0.889 for the flow data and 0.751 for the sediment data. Figure 4 presents the results of the calibration process for both sediment yields and flow over the calibration period, while Table 3 shows the calibrated parameters—Cn2, USLE_P, and SOL_Z—and multiplying factors used. Due to the length of the measured record, validation is not possible in this case.
In cases where validation is not possible, it is standard to undertake an uncertainty or sensitivity assessment of the calibrated model. This was undertaken, and the results indicated that changing the calibrated parameters ±20% reduced the NSE value for sediment to 0.50.

3.2. Land Management Scenario: Buffer Strip Implementation

Once calibrated, the model could be used to implement different Vetiver/Indian grass buffer strip configurations to test their effectiveness in reducing sediment yields. Within the SWAT model, the hydro-mechanical processes (Figure 1) of the Vetiver grass were modeled by implementing a new landuse layer consisting of the Vetiver/Indian grass vegetation type along the perimeter of the reservoir. This captured the interruption of the overland flow process and represented appropriately the sediment filtering/trapping properties of the grass buffer strips (Figure 1). Specifically hydrological parameters were modified in order to do this. Manning’s n (roughness) alongside the SCS runoff curve numbers was modified to represent the buffer strip implementation. The Vetiver/Indian grass was adopted as the treatment method along the perimeter of the reservoir as shown in Figure 5.
In order to upscale the In Situ findings of the influence of Vetiver/Indian grass buffer strips on the reservoir sediment yield, a number of different scenarios were considered and modeled with the SWAT model. Four different scenarios were devised to understand the potential benefits for erosion mitigation and sediment filtering/trapping by implementing this grass biostabilization measure as watershed-scale buffer strips at the Itumbiara HPP site (note: this buffer strip comprises Vetiver/Indian grass at the outflows from critical watersheds, thus avoiding existing forested areas):
  • Baseline Scenario: Existing model with no additional vegetation;
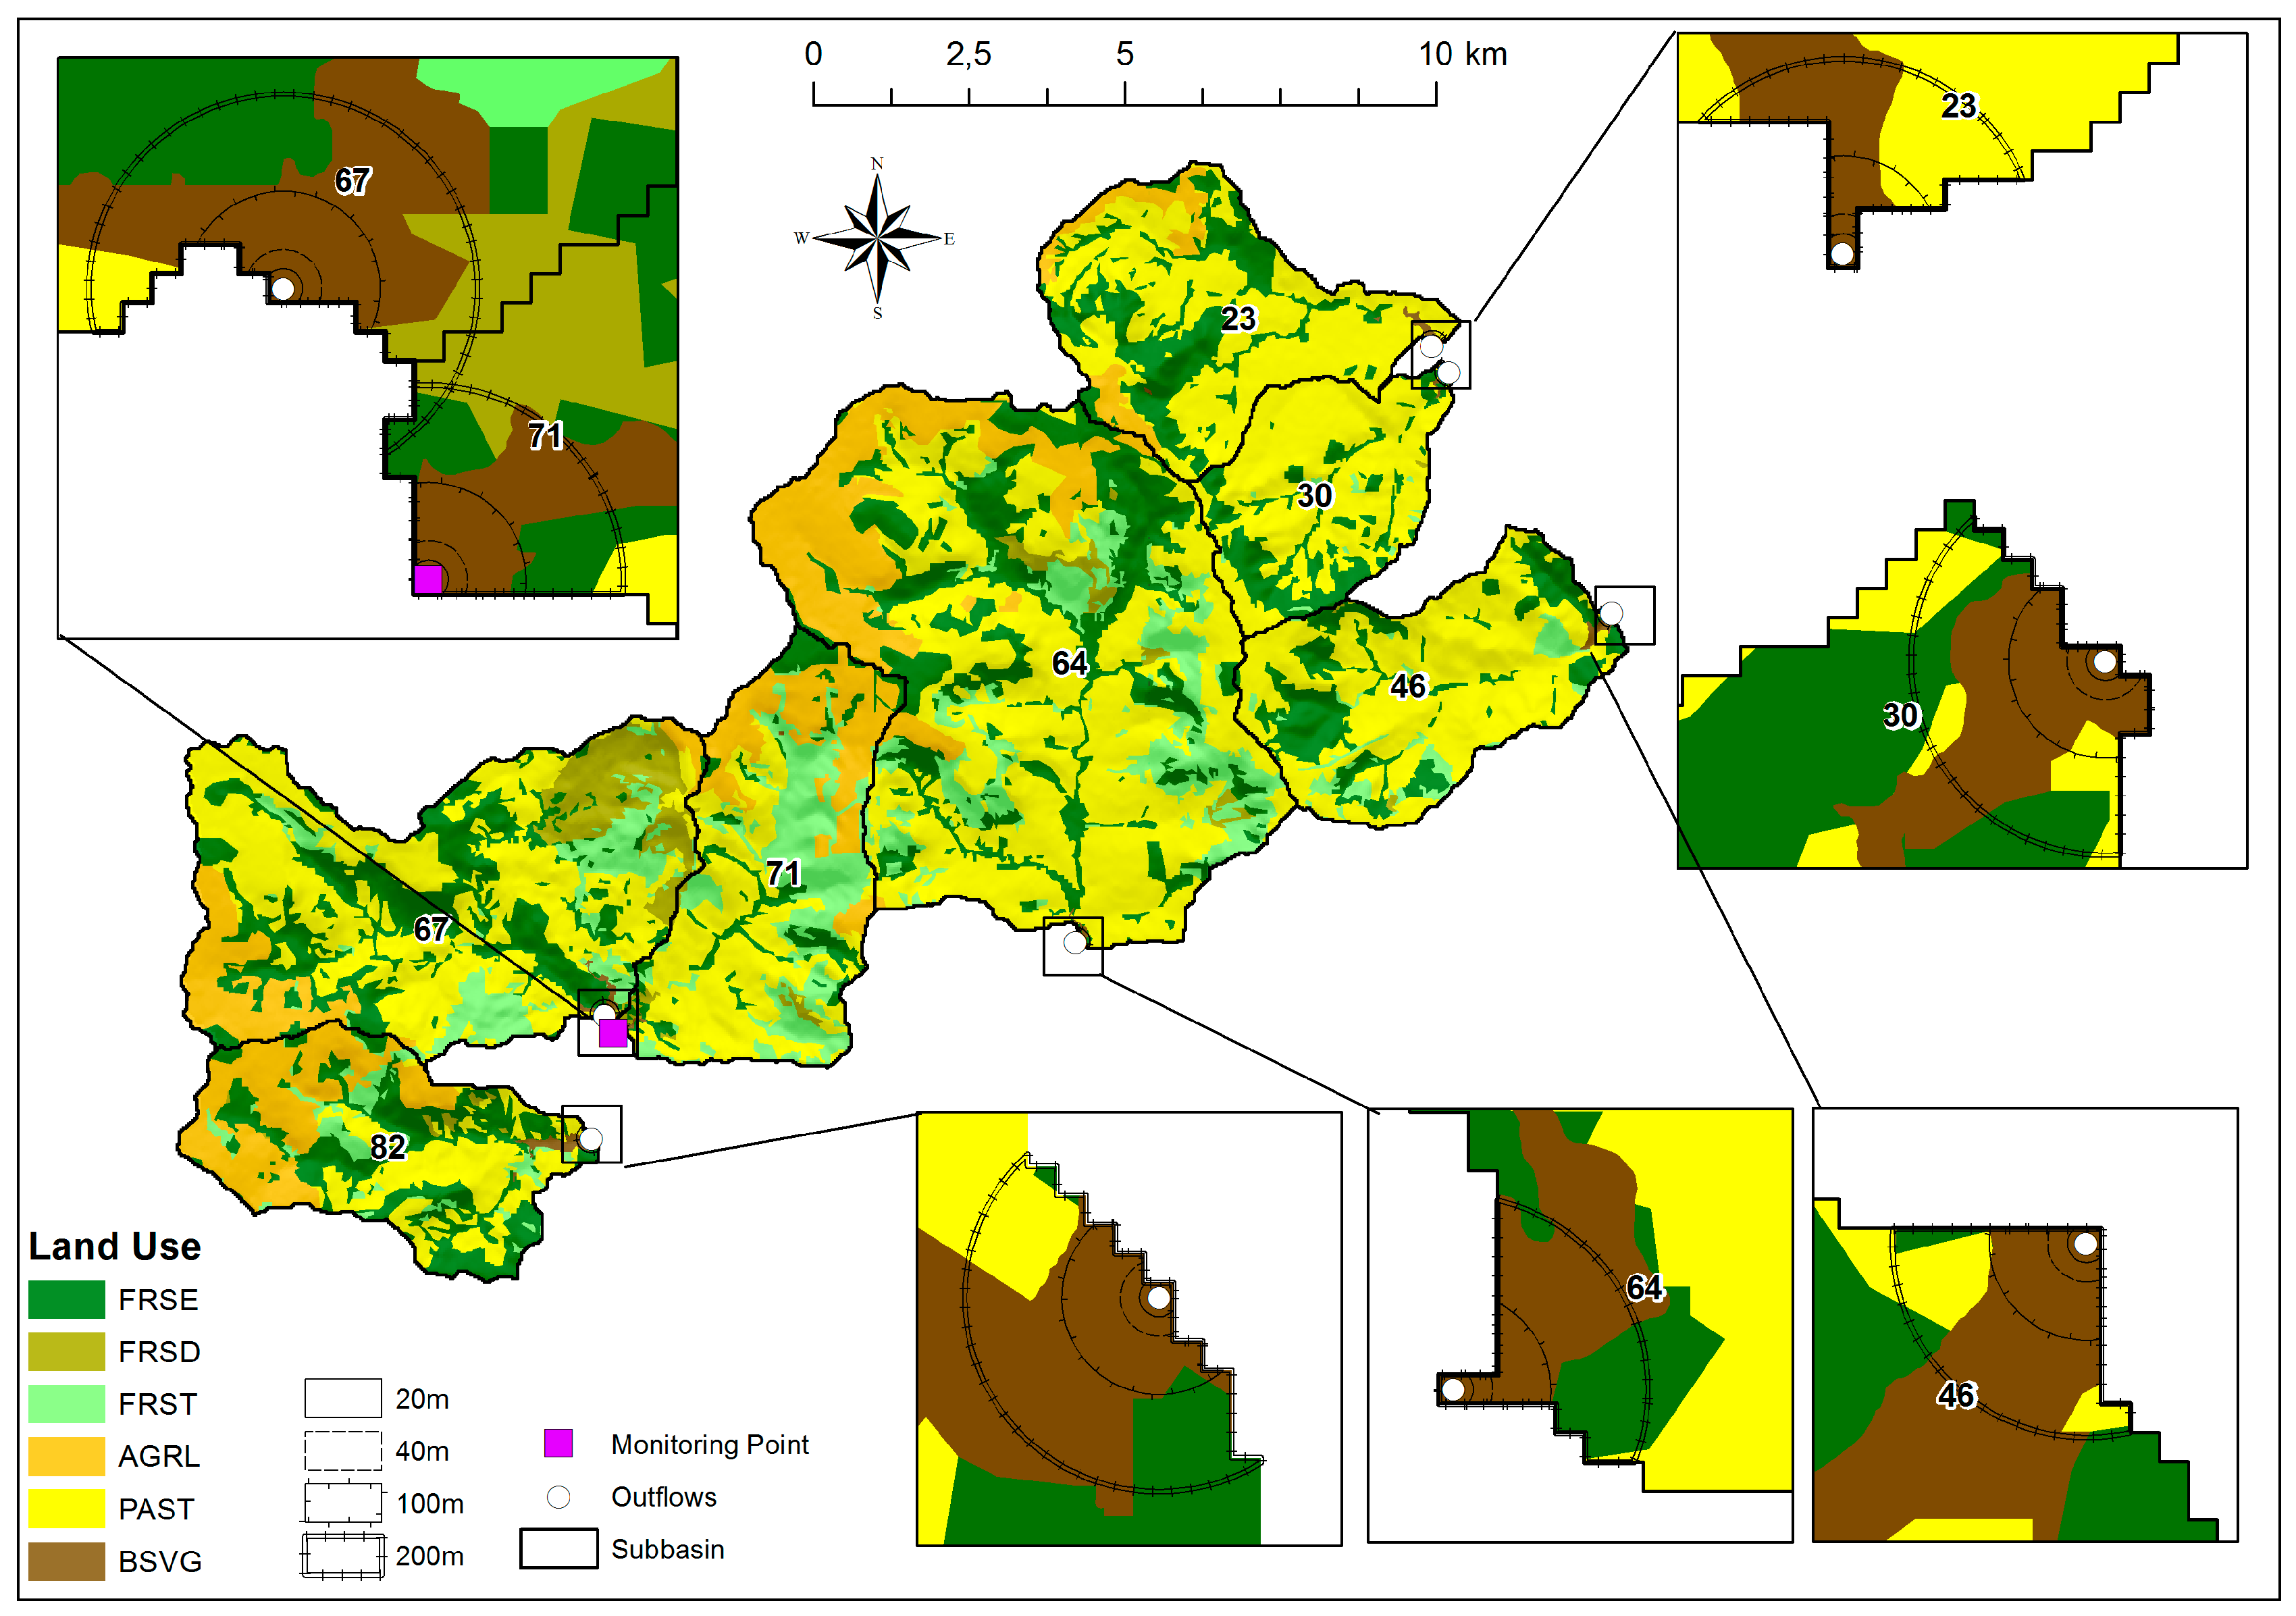
  • Scenario 1: incorporate a 20 m wide buffer strip around the sub-basin outflows into the reservoir;
  • Scenario 2: incorporate a 40 m wide buffer strip around the sub-basin outflows into the reservoir;
  • Scenario 3: incorporate a 100 m wide buffer strip around the sub-basin outflows into the reservoir.
  • Scenario 4: incorporate a 200 m wide buffer strip around the sub-basin outflows into the reservoir.
These scenarios were modeled by changing the landuse adjacent to the reservoir shoreline to implement the buffer strip (Figure 5).

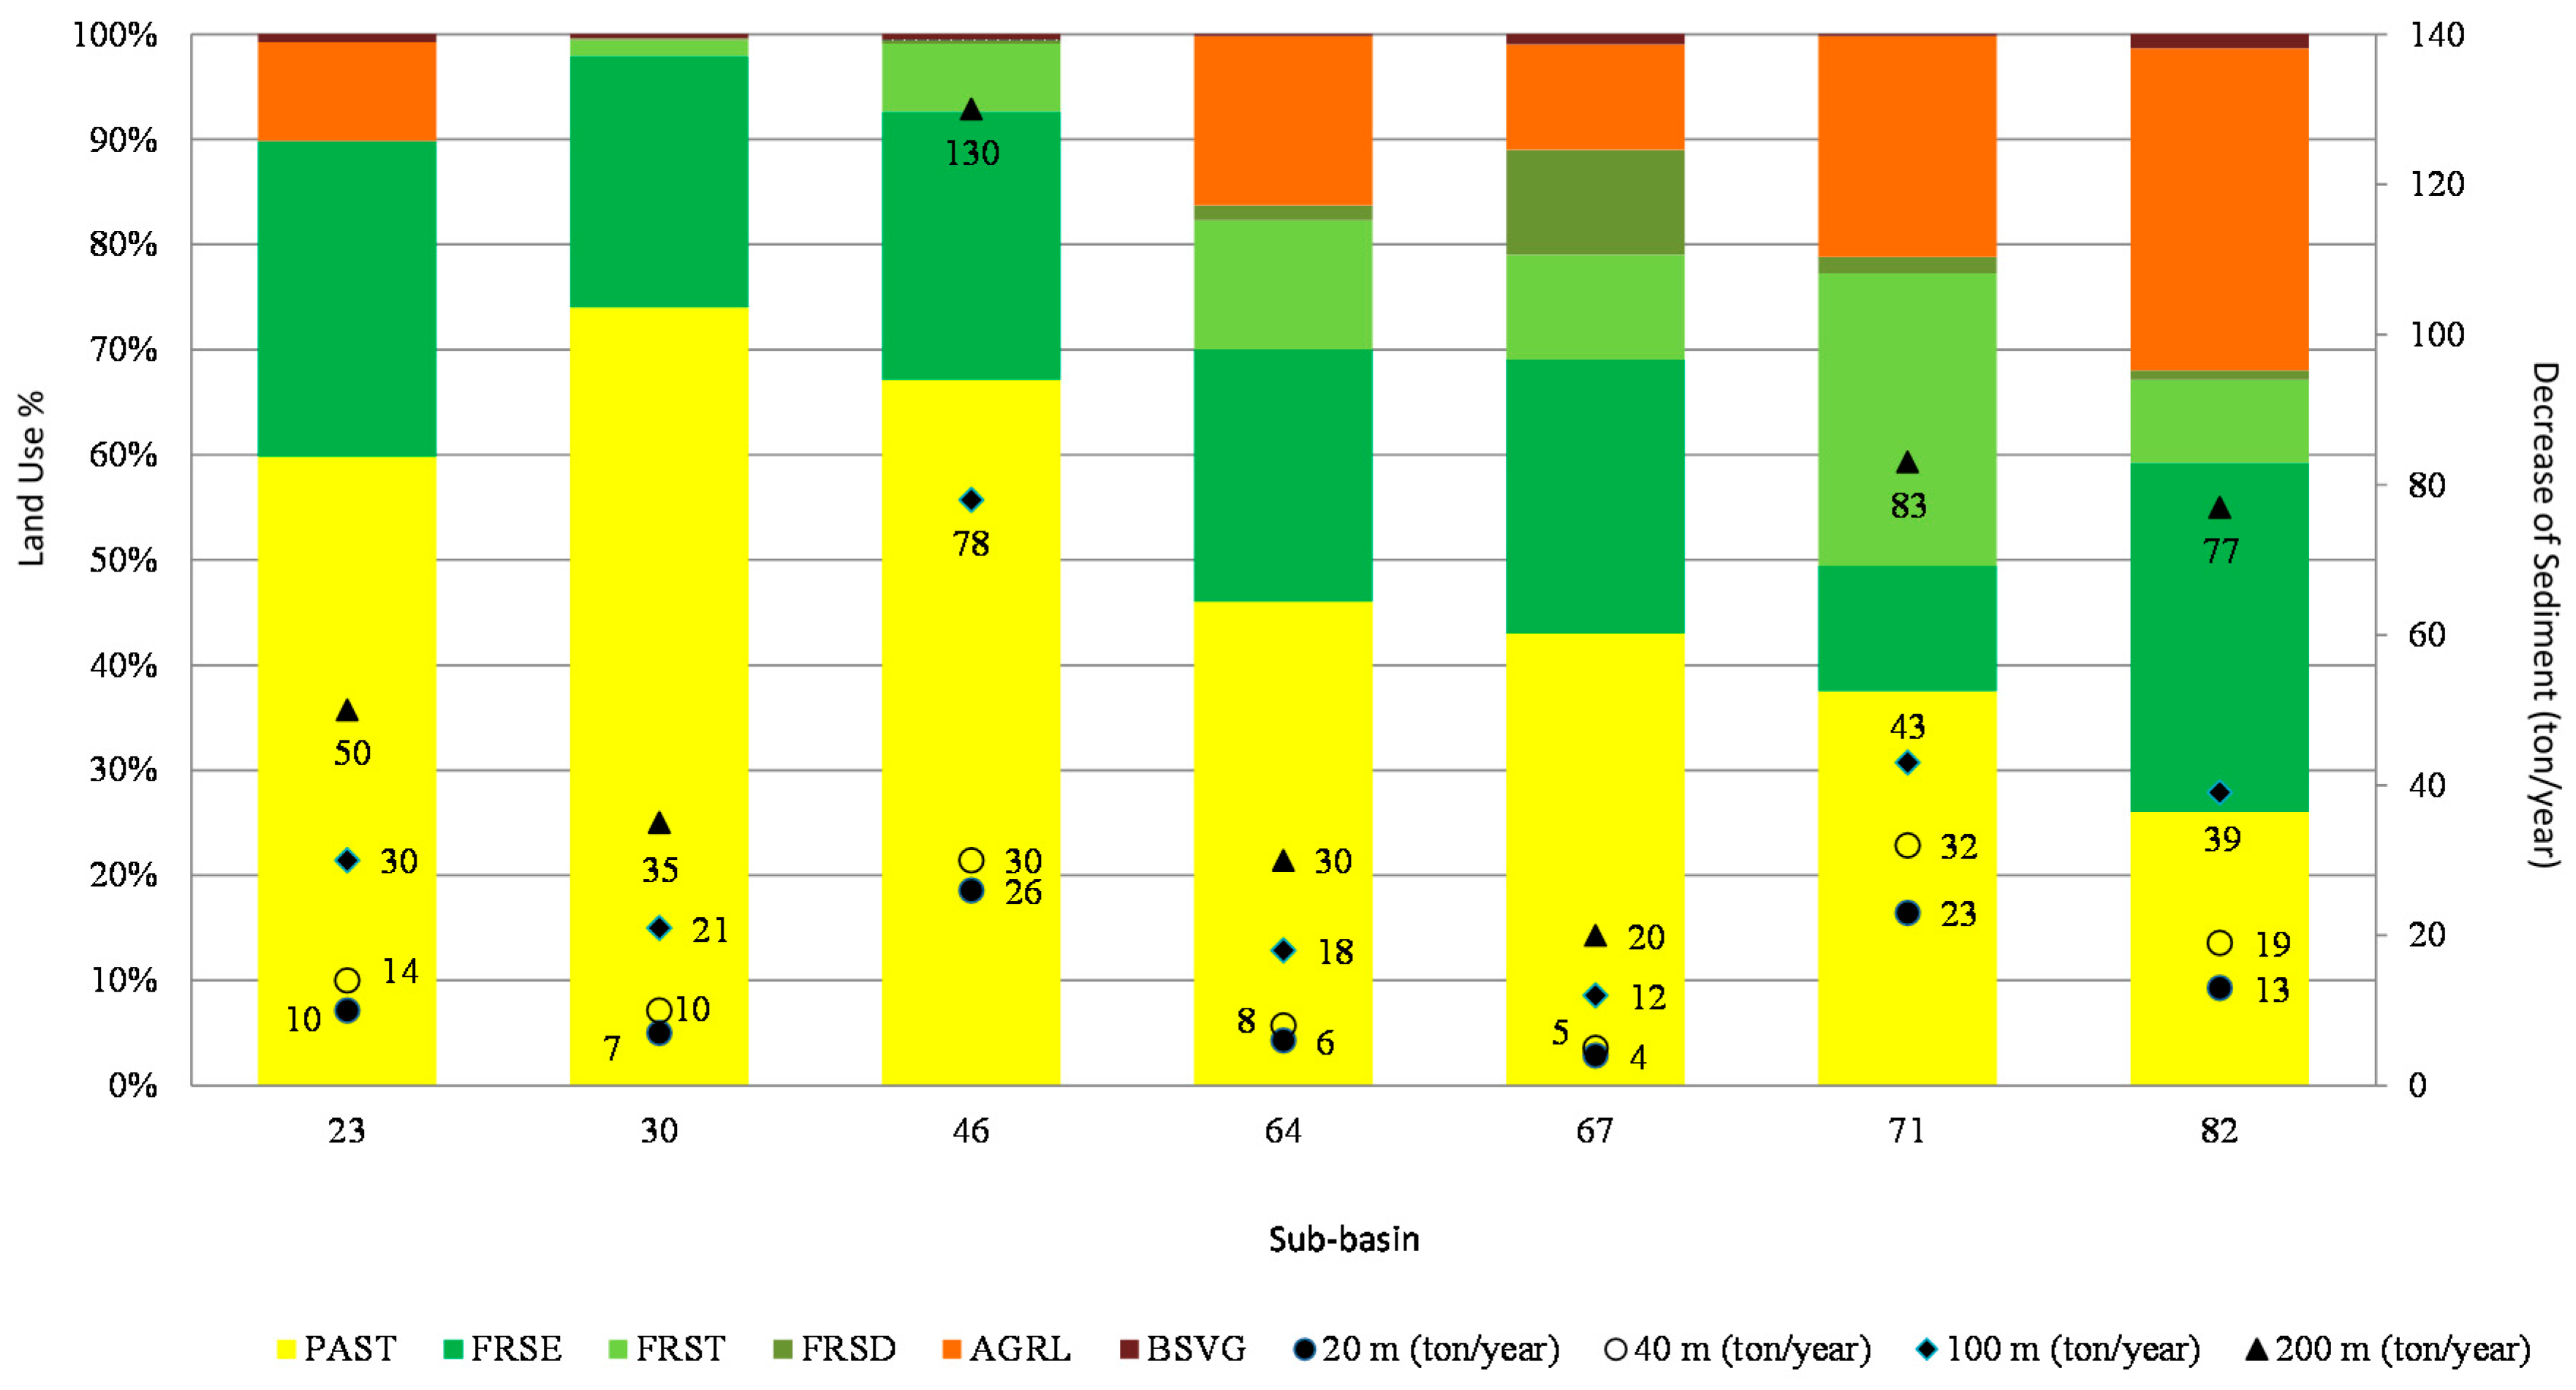
3.3. SWAT Model Simulations with Buffer Strips Implemented

The potential benefits to be gained from varying widths of buffer strips planted with Vetiver (Indian) grass were determined in comparison to the baseline scenario. Table 4 details the sediment production for each sub-basin in the study watershed (Figure 2) and shows the potential reduction in sediment yield obtained for each of the four scenarios (i.e., for increasing buffer radius). It is clear that this is non-linear in some instances (e.g., basins 46 and 71). In order to determine the effectiveness of the buffer strips, Figure 5 shows the actual landuse in the sub-basins in the study watershed. Each sub basin has a different landuse categorization, which is plotted alongside the reduction in sediment delivery for each sub-basin in Figure 6.
From the results, it is possible to understand the influence of replacing the current landuse by a Vetiver (Indian) grass buffer strip in each sub basin. Quantitative variations of the response of each sub basin are complicated by the heterogeneity of landuse, the soil properties, and the slope in each. There is no direct relationship between the area of the sub-basin and Vetiver (Indian) grass efficiency potential (Table 4).

4. Discussion

Each sub-basin has particular characteristics that influence its sediment transport capacity and subsequent delivery, including the distribution of landuse, the slope, the percentage of shoreline to the reservoir, and the soil type. This makes the analysis complex. Results indicate that planting Vetiver/Indian grass at the reservoir sub-basin outflows can contribute to a reduction of carried sediments. Therefore, providing buffer strips of Indian grass on the margins of the Itumbiara HPP reservoir generates a reduction in sediment transportation into the reservoir. In a conservative scenario, considering a typical tropical soil density value (2.65 ton/m3), it is possible to obtain a decrease of around 160.4 m3/annum of soil sediments using Vetiver; taking into consideration that the study area represents around 3% of upstream watershed of the Itumbiara HPP. This indicates that the methodology would be beneficial for the Itumbiara HPP system.
This finding demonstrates the usefulness of buffer strip implementation for reservoir management in erosion susceptible areas. Ignoring the problem of sediment erosion and subsequent sediment delivery to the reservoir could cost up to 30% of the generation capacity of a hydroelectric plant, as evidenced in China, Africa, and the United States [31]. Studies such as the one reported here can provide a useful insight into the role of land management and erosion control practices (in this case, buffer strips) in reducing sediment yield. However, any management techniques identified as successful through a modeling strategy must be accompanied with sufficient and appropriate institutional support to coordinate the correct implementation and maintenance of measures.
In the current study, relatively low percentages of sediment transport reduction at the outflow of each studied sub-basin were observed due to the introduction of the Vetiver/Indian grass in comparison to other studies. This shows some degree of contribution by the introduced methodology but also demonstrates the need for further investigation of potential alternatives of soil use and adoption of larger areas of permanent preservation.
The model has a number of limitations. For example, (i) the paucity of calibration data requires the upscaling in parameterization for the model, and (ii) the buffer strips are currently only implemented on the reservoir outflows from the 7 studied sub-basins out of the 275 hydrological sub-basins comprising the total reservoir watershed. Thus, if there were more widespread sediment management strategies imposed in the form of buffer strips along the full perimeter of each sub-basin that could result in significant reductions to the total sediment reservoir yield. Another constraint to be taken in consideration is that changes to reservoir water level are currently not considered. Added benefits could be realized with the extension of these buffers adjacent to all watercourses through the catchment. In fact, this type of intervention may be more beneficial than increasing the width of the buffer strips at the reservoir outflows. Additionally, the current study only considers the hydrological response to landuse change, but ignores the impact of climate change and human factors on hydrological factors. However, vegetation and land surface hydrology are intrinsically linked with long-term climate change [32], and water abstractions and climate change have resulted in variations in annual runoff [33]. Therefore, in future studies, forcing factors related to climate and human impacts should be introduced into the input layer of the model structure so that future landuse/cover types will be more realistically reflected.

5. Conclusions

To adequately and effectively target and implement erosion control measures to reduce reservoir sedimentation, distributed erosion modeling can be used to support decision making. However, the availability of sufficient data to calibrate and validate streamflow and sediment dynamics is crucial for the successful application of such models. The presented methodology and results indicate that distributed erosion and sediment yield modeling with SWAT, supported by sufficient data on discharge and sediment yields of different points in time and space, can provide quantitative insight into scaling up the effectiveness of site-specific erosion control measures and the subsequent benefit to downstream reservoir sedimentation. Thus, this paper presents a first step towards evaluating the role of buffer strips on sediment yield, demonstrating the benefit of scaling up alternative techniques to treat erosion in reservoirs of hydroelectric plants. However, this is an indicative, exploratory study; further, more detailed studies are required.

Acknowledgments

The work was supported by National Council of Scientific and Technological Development (CNPq) through the program Science without Borders, and National Agency of Electric Power (ANEEL), through Eletrobras Furnas Company, both from Brazil’s government. The authors gratefully acknowledge IESA-UFG (Institute of Socio-environmental Studies of the Federal University of Goiás) for soil data and classifications and the making of the maps (Figure 2 and Figure 3).

Author Contributions

Marta P. Luz and Lindsay C. Beevers wrote the paper and analyzed the data. Alan J. S. Cuthbertson designed the experiments and assisted in the paper preparation; Gabriela M. Medero contributed by analyzing data; Viviane S. Dias and Marta P. Luz performed the experiments; Diego T. F. Nascimento has developed the GIS maps.

Conflicts of Interest

The authors declare no conflict of interest.

References

  1. Petkovsek, G.; Roca, M. Impact of reservoir operation on sediment deposition. Proc. ICE-Water Manag. 2013, 167, 577–584. [Google Scholar] [CrossRef]
  2. Lenhart, T.; Fohrer, N.; Frede, H.-G. Effects of landuse changes on the nutrient balance in mesoscale catchments. Phys. Chem. Earth 2003, 28, 1301–1309. [Google Scholar] [CrossRef]
  3. Lin, Y.-P.; Hong, N.-M.; Wu, P.-J.; Wu, C.-F.; Verburg, P.H. Impacts of landuse change scenarios on hydrology and landuse patterns in the Wu-Tu watershed in Northern Taiwan. Landsc. Urban Plan. 2007, 80, 111–126. [Google Scholar] [CrossRef]
  4. Tripathi, M.P.; Panda, R.K.; Raghuwanshi, N.S. Identification and prioritization of critical sub-watersheds for soil conservation management using SWAT model. Biosyst. Eng. 2003, 85, 365–379. [Google Scholar] [CrossRef]
  5. Mishra, A.; Kar, S.; Singh, V.P. Prioritizing structural management by quantifying the effect of LULC on watershed runoff and sediment yield. Water Resour. Manag. 2007, 21, 1899–1913. [Google Scholar] [CrossRef]
  6. Mishra, A.; Kar, S.; Raghuwanshi, N.S. Modelling non-point source pollutant losses from a small watershed using HSPF model. J. Environ. Eng. 2009, 135, 92–100. [Google Scholar] [CrossRef]
  7. Mishra, A.; Kar, S. Modelling hydrologic processes and NPS pollution in a small watershed in sub-humid subtropics using SWAT. J. Hydrol. Eng. 2012, 17, 445–454. [Google Scholar] [CrossRef]
  8. Sardar, B.; Singh, A.K.; Raguwanshi, N.S.; Chatterjee, C. Hydrological modelling to identify and manage critical erosion prone areas for improving reservoir life: A case study of Barakar basin. J. Hydrol. Eng. 2014, 19, 196–204. [Google Scholar] [CrossRef]
  9. Eckhardt, K.; Breuer, L.; Frede, H.-G. Parameter uncertainty and the significance of simulated landuse change effects. J. Hydrol. 2003, 273, 164–176. [Google Scholar] [CrossRef]
  10. Huisman, J.A.; Breuer, L.; Frede, H.-G. Sensitivity of simulated hydrological fluxes towards changes in soil properties in response to landuse change. Phys. Chem. Earth 2004, 29, 749–758. [Google Scholar] [CrossRef]
  11. Mekonnen, M.; Keesstra, S.D.; Ritsema, C.J.; Stroosnijder, L.; Baartman, J.E.M. Sediment trapping with indigenous grass species showing differences in plant traits in northwest Ethiopia. Catena 2015, 147, 755–763. [Google Scholar] [CrossRef]
  12. Wanyama, J.; Herremans, K.; Maetens, W.; Isabiry, M.; Kahimba, F.; Kimaro, D.; Poesen, J.; Deckers, J. Effectiveness of tropical grass species as sediment filters in the riparian zone of Lake Victoria. Soil Use Manag. 2012, 28, 409–418. [Google Scholar] [CrossRef]
  13. Bu, C.F.; Cai, Q.G.; Ng, S.L.; Chau, K.C.; Ding, S.W. Effects of hedgerows on sediment erosion in Three Gorges Dam Area, China. Int. J. Sediment Res. 2008, 23, 119–129. [Google Scholar] [CrossRef]
  14. Donjadee, S.; Tingsanchali, T. Reduction of runoff and soil loss over steep slopes by using vetiver hedgerow systems. Paddy Water Environ. 2013, 11, 573–581. [Google Scholar] [CrossRef]
  15. Cao, L.; Zhang, Y.; Lu, H.; Yuan, J.; Zhu, Y.; Liang, Y. Grass hedge effects on controlling soil loss from concentrated flow: A case study in the red soil region of China. Soil Tillage Res. 2015, 148, 97–105. [Google Scholar] [CrossRef]
  16. Amare, T.; Zegeye, A.D.; Yitaferu, B.; Steenhuis, T.S.; Hurni, H.; Zeleke, G. Combined effect of soil bund with biological soil and water conservation measures in the northwestern Ethiopian highlands. Ecohydrol. Hydrobiol. 2014, 14, 192–199. [Google Scholar] [CrossRef]
  17. Young, R.A.; Onstad, C.A.; Bosch, D.D.; Anderson, W.P. AGNPS: A nonpoint source pollution model for valuating agricultural watersheds. J. Soil Water Conserv. 1989, 44, 168–173. [Google Scholar]
  18. Refsgaard, J.C.; Storm, B. MIKE SHE. In Computer Models in Watershed Hydrology; Singh, V.P., Ed.; Water Resources Publications: Highland Ranch, CO, USA, 1995; pp. 809–846. [Google Scholar]
  19. Arnold, J.G.; Srinivasan, R.; Muttiah, R.S.; Williams, J.R. Large area hydrologic modelling and assessment Part I: Model development. J. Am. Water Resour. Assoc. 1998, 34, 73–89. [Google Scholar] [CrossRef]
  20. Arnold, J.G.; Allen, P.M. Estimating hydrologic budgets for three Illinois watersheds. J. Hydrol. 1996, 176, 57–77. [Google Scholar] [CrossRef]
  21. Arnold, J.G.; Fohrer, N. SWAT 2000: Current capabilities and research opportunities in applied watershed modelling. Hydrol. Process. 2005, 19, 563–572. [Google Scholar] [CrossRef]
  22. Ndomba, P.; Mtalo, F.; Killingtveit, A. SWAT model application in a data scarce tropical complex catchment in Tanzania. Phys. Chem. Earth 2008, 33, 626–632. [Google Scholar] [CrossRef]
  23. Van Griensven, A.; Popescu, I.; Abdelhamid, M.R.; Ndomba, P.M.; Beevers, L.; Betrie, G.D. Comparation of sediment transport computations using hydrodynamic versus hydrologic models in the Simiyu River in Tanzania. Phys. Chem. Earth 2013, 61–62, 12–21. [Google Scholar] [CrossRef]
  24. Gassman, P.W.; Reyes, M.R.; Green, C.H.; Arnold, J.G. The soil and water assessment tool: Historical development, applications and future research directions. Trans. ASABE 2007, 50, 1211–1250. [Google Scholar] [CrossRef]
  25. Cao, W.; Bowden, W.B.; Davie, T.; Fenemor, A. Modelling impacts of land cover change on critical water resources in the motueka river catchment, New Zealand. Water Resour. Manag. 2009, 23, 137–151. [Google Scholar] [CrossRef]
  26. Tuppad, P.; Kannan, N.; Srinivasan, R.; Rossi, C.G.; Arnold, J.G. Simulation of agricultural management alternatives for watershed protection. Water Resour. Manag. 2010, 24, 3115–3144. [Google Scholar] [CrossRef]
  27. Mukhtar, M.A.; Dunger, V.; Merkel, B. Assessing the impacts of climate change on hydrology of the upper reach of the spree river: Germany. Water Resour. Manag. 2014, 28, 2731–2749. [Google Scholar] [CrossRef]
  28. TOPODATA. Available online: http://www.dsr.inpe.br/topodata/ (accessed on 15 January 2015).
  29. RADAM BRASIL, Projeto RADAM. Parte das Folhas SC.23 Rio São Francisco e SC.24—Aracaju: Geologia, Geomorfologia, Solos, Vegetação e uso Potencial da Terra; Levantamento de Recursos Naturais, v. 01; Ministério de Minas e Energia—Secretaria Geral: Rio de Janeiro, Brazil, 1973. [Google Scholar]
  30. Liu, Y.; Zhang, X.; Xia, D.; You, J.; Rong, Y.; Bakir, M. Impacts of landuse and climate changes on hydrologic processes in the Qingyi River watershed, China. J. Hydrol. Eng. 2013, 18, 1495–1512. [Google Scholar] [CrossRef]
  31. Lelis, T.A.; Calijuri, M.L.; da Fonseca Santiago, A.; de Lima, D.C.; de Oliveira Rocha, E. Análise de sensibilidade e calibração do modelo SWAT aplicado em bacia hidrográfica da regiãosudeste do Brasil. Rev. Bras. Cienc. Solo 2012, 36, 623–634. [Google Scholar] [CrossRef]
  32. Yuang, F.; Ren, L.; Yu, Z.; Zhu, Y.; Xu, J.; Fang, X. Potential natural vegetation dynamics driven by future long-term climate change and its hydrological impacts in the Hanjiang River Basin. China. Hydrol. Res. 2012, 43, 73–90. [Google Scholar] [CrossRef]
  33. Lu, G.B.; Wang, J.; Wang, H. J.; Xia, Z.Q. Impacts of human activities on the flow regime of the Hanjiang River. Res. Environ. Sci. 2009, 15, 12–13. [Google Scholar]
Figure 1. Schematic of the role of Vetiver grass in filtering sediment carried in overland flow.
Water 08 00489 g001
Figure 2. Itumbiara hydroelectric power plant (HPP)—Brazil: left hand figures (top to bottom): Brazil, Goias State in Brazil, location of Itumbiara HPP in Goias Sate; right hand figures (top to bottom): Map of Itumbiara HPP showing sub-basins; zoomed detail of the study area divided into 7 sub-basins (23, 30, 46, 64, 67, 71, and 82), showing laminar erosion susceptibility.
Water 08 00489 g002
Figure 3. Study area detailed data maps (a) Landuse; (b) soils; (c) topography; (d) DEM.
Water 08 00489 g003
Figure 4. Calibrated (simulated) and observed sediment delivery and flow from sub-basin 71.
Water 08 00489 g004
Figure 5. Indication of buffer strip implementation at the sub-basin outflows into the reservoir.
Water 08 00489 g005
Figure 6. Decrease of sediment delivery per sub-basin (and landuse designation breakdown), demonstrating the implementation of varying buffer strip widths.
Water 08 00489 g006
Table 1. Existing literature overview of experimental studies applying Indian grass.
StudyApplicationScaleResults
[11]Experimental investigation of runoff reduction and sediment removal by vegetated filter strips into cropland. Study with grass species including Vetiver grass. (Debre Mewi Basin Ethiopia)Use of 1.5 m wide stripsDesho with the highest tiller number and density, and the second highest in root length revealed better STE than the other grass species, Vetiver (59%), Senbelet (49%), Akirma (36%) and Sebez (20%).
[12]Experimental investigation of runoff reduction and sediment removal by vegetated filter strips into cropland. Effectiveness of tropical grass species (Elephant grass, Lemon grass, paspalum and sugarcane) as sediment filters in the riparian zone of Lake Victoria, Uganda.At filter lengths of 2.5, 5 and 10 m.Under natural rainfall, more than 70% of sediment was trapped in the first 5 m, and lengthening the strip to 10 m only resulted in a marginal increase in sediment trapping effectiveness.
[13]Experimental investigation in Three Gorges Dam Area, China. Contour hedgerows have been used in this area to control soil erosion and to improve hillslope stability in the catchment of this river section.Use of 10 m wide strips.Measured runoffs during natural rainfall events show that all types of plant hedgerow had notable effects on reducing runoff and soil loss. The reduction in soil losses ranged from 18.4% to 70.0% and runoffs were reduced by 17.2% to 70.8%.
[14]Experimental investigation. Reduction of runoff and soil loss over steep slopes by using Vetiver. Field experiments were conducted at Kasetsart University, Thailand.2 m in width, 3 m in vertical height, 10.44, 8.08, and 6.71 m in length.The study found that Vetiver hedgerows reduce runoff volume by 31%–69% and soil loss by 62%–86% on steep slopes of 30%–50%.
[15]Experimental investigation of runoff reduction and sediment removal by vegetated filter strips into cropland. Two types of hedgerow widths (two-row and three-row) were planted for each of three species of vegetation Bahia grass, Vetiver and Daylily. (Red soil region of China)The hedgerows were 10 m long with a spacing of 5 m between the rows.The three selected vegetation types exhibited the similar efficiencies in filtering sediment under the experimental conditions. Generally, the soil loss from the grass hedges was controlled by the characteristics of the grass stems, regardless of the hedge widths.
[16]Experimental investigation of runoff reduction and sediment removal by vegetated filter strips into cropland. Six different treatments: control (without any treatment), soil bund alone, and soil bund combined with tephrosia, Vetiver grass, Elephant grass and a local grass called Sembelet. (northwestern of Ethiopia)Each of the treatments was tested on an area of 180 m2.Soil bund combined with Elephant grass had the lowest runoff (40%) and soil loss (63%) as compared to the other treatments.
Table 2. Result of sensitivity analyses.
ParameterDescriptionRankSensitivity LevelSensitivity Index (SI)
Cn2Initial SCS runoff curve number1High4.25
USLE_PUSLE equation support2High2.90
Sol_ZSoil Depth3High1.31
EscoSoil evaporation compensation4Intermediate0.98
SlopeAverage slope steepness5Intermediate0.96
Sol_AwcAvailable water capacity6Intermediate0.85
CanmxMax canopy storage7Intermediate0.83
BlaiMax potential lead area index8Intermediate0.82
BiomixBiological efficiency9Weak0.63
SurlagSurface runoff lag time10Weak0.55
SlsubbsnAverage slope length11Weak0.28
Table 3. Calibration parameters.
VariableRankingOriginalMultiplying FactorFinal Values
Cn2142.501.1950.58
USLE_P20.293.070.89
Sol_Z (mm)31.310.660.86
Table 4. Sediment yield results.
Sub-BasinArea (ha)Baseline Sed. (ton/Year)Indian Grass Buffer
20 m40 m100 m200 m
Sed. (ton/Year)Reduction (%)Sed. (ton/Year)Reduction (%)Sed. (ton/Year)Reduction (%)Sed. (ton/Year)Reduction (%)
231766369336830.2736790.3836630.8136431.35
301154227222650.3122620.4422510.9222371.54
461719361935930.7235890.8335412.1634893.59
64516710,00499980.0699960.0899860.1899740.30
673318238623820.1723810.2123740.5023660.84
711960246824450.9324361.3024251.7423853.36
821628368236690.3536630.5236431.0636052.09
Sum.16,71228,12428,0350.3228,0060.4227,8830.8627,6991.51

