Article

Assessment of the Latest GPM-Era High-Resolution Satellite Precipitation Products by Comparison with Observation Gauge Data over the Chinese Mainland

1
School of Civil Engineering, Hefei University of Technology, Hefei 230009, China
2
Interdisciplinary Centre for River Basin Environment, University of Yamanashi, Kofu 400-8511, Japan
3
College of Hydrometeorology, Nanjing University of Information Science & Technology, Nanjing 210044, China
*
Author to whom correspondence should be addressed.
Water 2016, 8(11), 481; https://doi.org/10.3390/w8110481
Submission received: 9 June 2016 / Revised: 14 October 2016 / Accepted: 19 October 2016 / Published: 26 October 2016
(This article belongs to the Special Issue Tackling Complex Water Problems in China under Changing Environment)

Abstract

:
The Global Precipitation Mission (GPM) Core Observatory that was launched on 27 February 2014 ushered in a new era for estimating precipitation from satellites. Based on their high spatial–temporal resolution and near global coverage, satellite-based precipitation products have been applied in many research fields. The goal of this study was to quantitatively compare two of the latest GPM-era satellite precipitation products (GPM IMERG and GSMap-Gauge Ver. 6) with a network of 840 precipitation gauges over the Chinese mainland. Direct comparisons of satellite-based precipitation products with rain gauge observations over a 20 month period from April 2014 to November 2015 at 0.1° and daily/monthly resolutions showed the following results: Both of the products were capable of capturing the overall spatial pattern of the 20 month mean daily precipitation, which was characterized by a decreasing trend from the southeast to the northwest. GPM IMERG overestimated precipitation by approximately 0.09 mm/day while GSMap-Gauge Ver. 6 underestimated precipitation by −0.04 mm/day. The two satellite-based precipitation products performed better over wet southern regions than over dry northern regions. They also showed better performance in summer than in winter. In terms of mean error, root mean square error, correlation coefficient, and probability of detection, GSMap-Gauge was better able to estimate precipitation and had more stable quality results than GPM IMERG on both daily and monthly scales. GPM IMERG was more sensitive to conditions of no rain or light rainfall and demonstrated good capability of capturing the behavior of extreme precipitation events. Overall, the results revealed some limitations of these two latest satellite-based precipitation products when used over the Chinese mainland, helping to characterize some of the error features in these datasets for potential users.

1. Introduction

Precipitation is a key determining factor for planetary water cycles, the energy cycle, and many socioeconomic activities, and is also a primary input for hydrometeorological and climate models [1,2]. Therefore, accurate estimation of rainfall amounts at sufficient temporal and spatial resolutions is crucial for a wide range of applications from global climate and hydrological modeling to local weather and flood forecasting [3]. Obtaining reliable precipitation measurements is challenging because of the heterogeneity of precipitation at different spatiotemporal scales. Generally, precipitation datasets obtained from ground-based rain gauge observations have served as the main source of precipitation data for various hydrological, hydrometeorological, and climatological applications because the gauges directly measure precipitation. However, ground-based measurement networks (rain gauges) tend to be distributed unevenly or are sparse, and may be unable to capture the spatial and temporal variability of precipitation systems, especially over remote/rural areas where these measurement networks are, in some cases, nonexistent. This lack of spatial coverage constitutes a significant challenge for applications of gauge-based rainfall estimates at regional and global scales [4,5,6].
Currently, the only practical means for acquiring spatially continuous precipitation estimates on a global basis is through Earth observation satellites [7,8]. Satellite systems that provide precipitation observations can be broadly categorized into geostationary (GEO) satellites equipped with visible and thermal infrared (Vis/IR) sensors, and low earth orbiting (LEO) satellites equipped with passive microwave (PMW) instruments. Vis/IR sensors with high sampling frequency (every 15 min) can capture the movement of clouds and weather systems perfectly, but the accuracy of Vis/IR-based estimates is generally poor because they do not have a direct relationship with rainfall rate [9]. On the other hand, PMW sensors with low temporal sampling rates are better able to infer precipitation because their radiative signatures are more directly linked to precipitation particles [10]. Therefore, the combination of GEO Vis/IR and LEO PMW sensors to retrieve high-quality and high-resolution global precipitation products has been widely recognized and applied [7].
Since the launch of the Tropical Rainfall Measuring Mission (TRMM) in late 1997, the rapid development of precipitation datasets based on PMW, calibrated Vis/IR, and PMW plus Vis/IR observations has resulted in a tremendous amount of quasi-global information for research and applications. To date, a number of satellite precipitation products with various temporal and spatial resolutions have been released to the public. These include the TRMM Multi-satellite Precipitation Analysis product (TMPA) [11], Climate Prediction Center (CPC) morphing technique product (CMORPH) [12], Precipitation Estimation from Remote Sensed Information Using Artificial Neural Networks (PERSIANN) [13], the PERSIANN Cloud Classification System (PERSIANN-CCS) [14], the Naval Research Laboratory (NRL) blended statistical precipitation technique (NRL-Blended) [15], and the Global Satellite Mapping of Precipitation product (GSMap) [16]. These products fall mainly into two categories. The first, such as the NRL-Blended product, depends on PMW to calibrate Vis/IR observations. The second category relies on advection or morphing products, such as TMPA, CMORPH, and GSMap.
Based on the heritage of the TRMM, the Global Precipitation Mission (GPM) ushers in a new era for satellite precipitation estimates. GPM is made up of an international network of satellites that provides the newest generation of global rain and snow products at a spatial resolution of 0.1° × 0.1° and a half-hourly temporal resolution, As the successor to TRMM, the GPM Core Observation network was launched on 27 February 2014 by the U.S. National Aeronautics and Space Administration (NASA) and the Japanese Aerospace Exploration Agency (JAXA). The GPM network consists of the Core Observatory and has had approximately 10 partner satellites during its operational period. The composition of the network changes as partner satellites are launched or fail. The GPM Core Observatory carries a Dual Frequency Precipitation Radar (DPR) and a multi-channel GPM Microwave Imager (GMI) with a frequency range of 10 to 183 GHz, both of which improve precipitation measuring capabilities compared to previous TRMM instruments [8].
As an extension of and also an upgrade to the highly successful TRMM mission, GPM was configured to provide products at four different levels based on various algorithms. One of the precipitation products assessed in this study is the Day 1 multi-satellite precipitation product provided by the Integrated Multi-satellite Retrievals for the GPM (IMERG) algorithm, which is intended to calibrate, merge, and interpolate all microwave estimates from the GPM network, including Vis/IR estimates, gauge observations, and other potential sensor data at a 0.1° × 0.1° spatial resolution and a 30 min temporal resolution [17]. As the Japanese counterpart of GPM IMERG, the latest versions of the GSMap-MVK and GSMap-Gauge (version 6, Earth Observation Research Center, Tsukuba, Japan) products were developed for the GPM mission with a spatial resolution of 0.1° × 0.1° and hourly temporal resolution by adding passive microwave radiometer data from GPM Core GMI to the newly developed algorithm. These products are regarded as the latest advanced High-Resolution Precipitation Products (HRPP).
The promising uses of these HRPPs are ranged widely from near real-time natural hazards monitoring (e.g., flooding, landslide, and drought), to climate research and hydrology-related fields. Additionally, for most developing countries, such as China, with insufficient spatial coverage of in-situ data, long time delays for data processing and availability, and the absence of data sharing across disciplines, the application of satellite-derived precipitation data has shown significant advantages. However, the sources of inherent error associated with these products, which stem from indirect physical estimates of rainfall, have not been well understood to date, especially for the latest HRPP grid data, and would have a significant influence on their application [18]. Therefore, it is essential to evaluate their accuracy and error characteristics by comparing them against observations from precipitation gauges before various applications are utilized. With the support of the International Precipitation Working Group (IPWG) program, a number of evaluation and validation studies have been carried out at a variety of temporal and spatial scales in different parts of the world [19]. All of these studies suggest that different types of satellite-based precipitation products have variable accuracy in different regions. To the best of our knowledge, there has been little detailed exploration of the error characteristics and performance of the latest GPM-era satellite-based HRPP for capturing extreme precipitation events over the Chinese mainland.
Therefore, the aims of this study are to (1) identify the strengths/weaknesses and error characteristics of the two latest GPM-era HRPPs (i.e., GPM IMERG and GSMap-Gauge Ver. 6) over the Chinese mainland; and (2) evaluate the performance of these new products in detecting the characteristics of extreme precipitation events throughout the Chinese mainland. Our study is one of the first that attempts to evaluate these new GPM-era products, and we expect that it will provide basic accuracy information about the latest satellite precipitation products over the Chinese mainland for users who attempt to use them in their research, and that it will prove useful for subsequent investigations.

2. Dataset

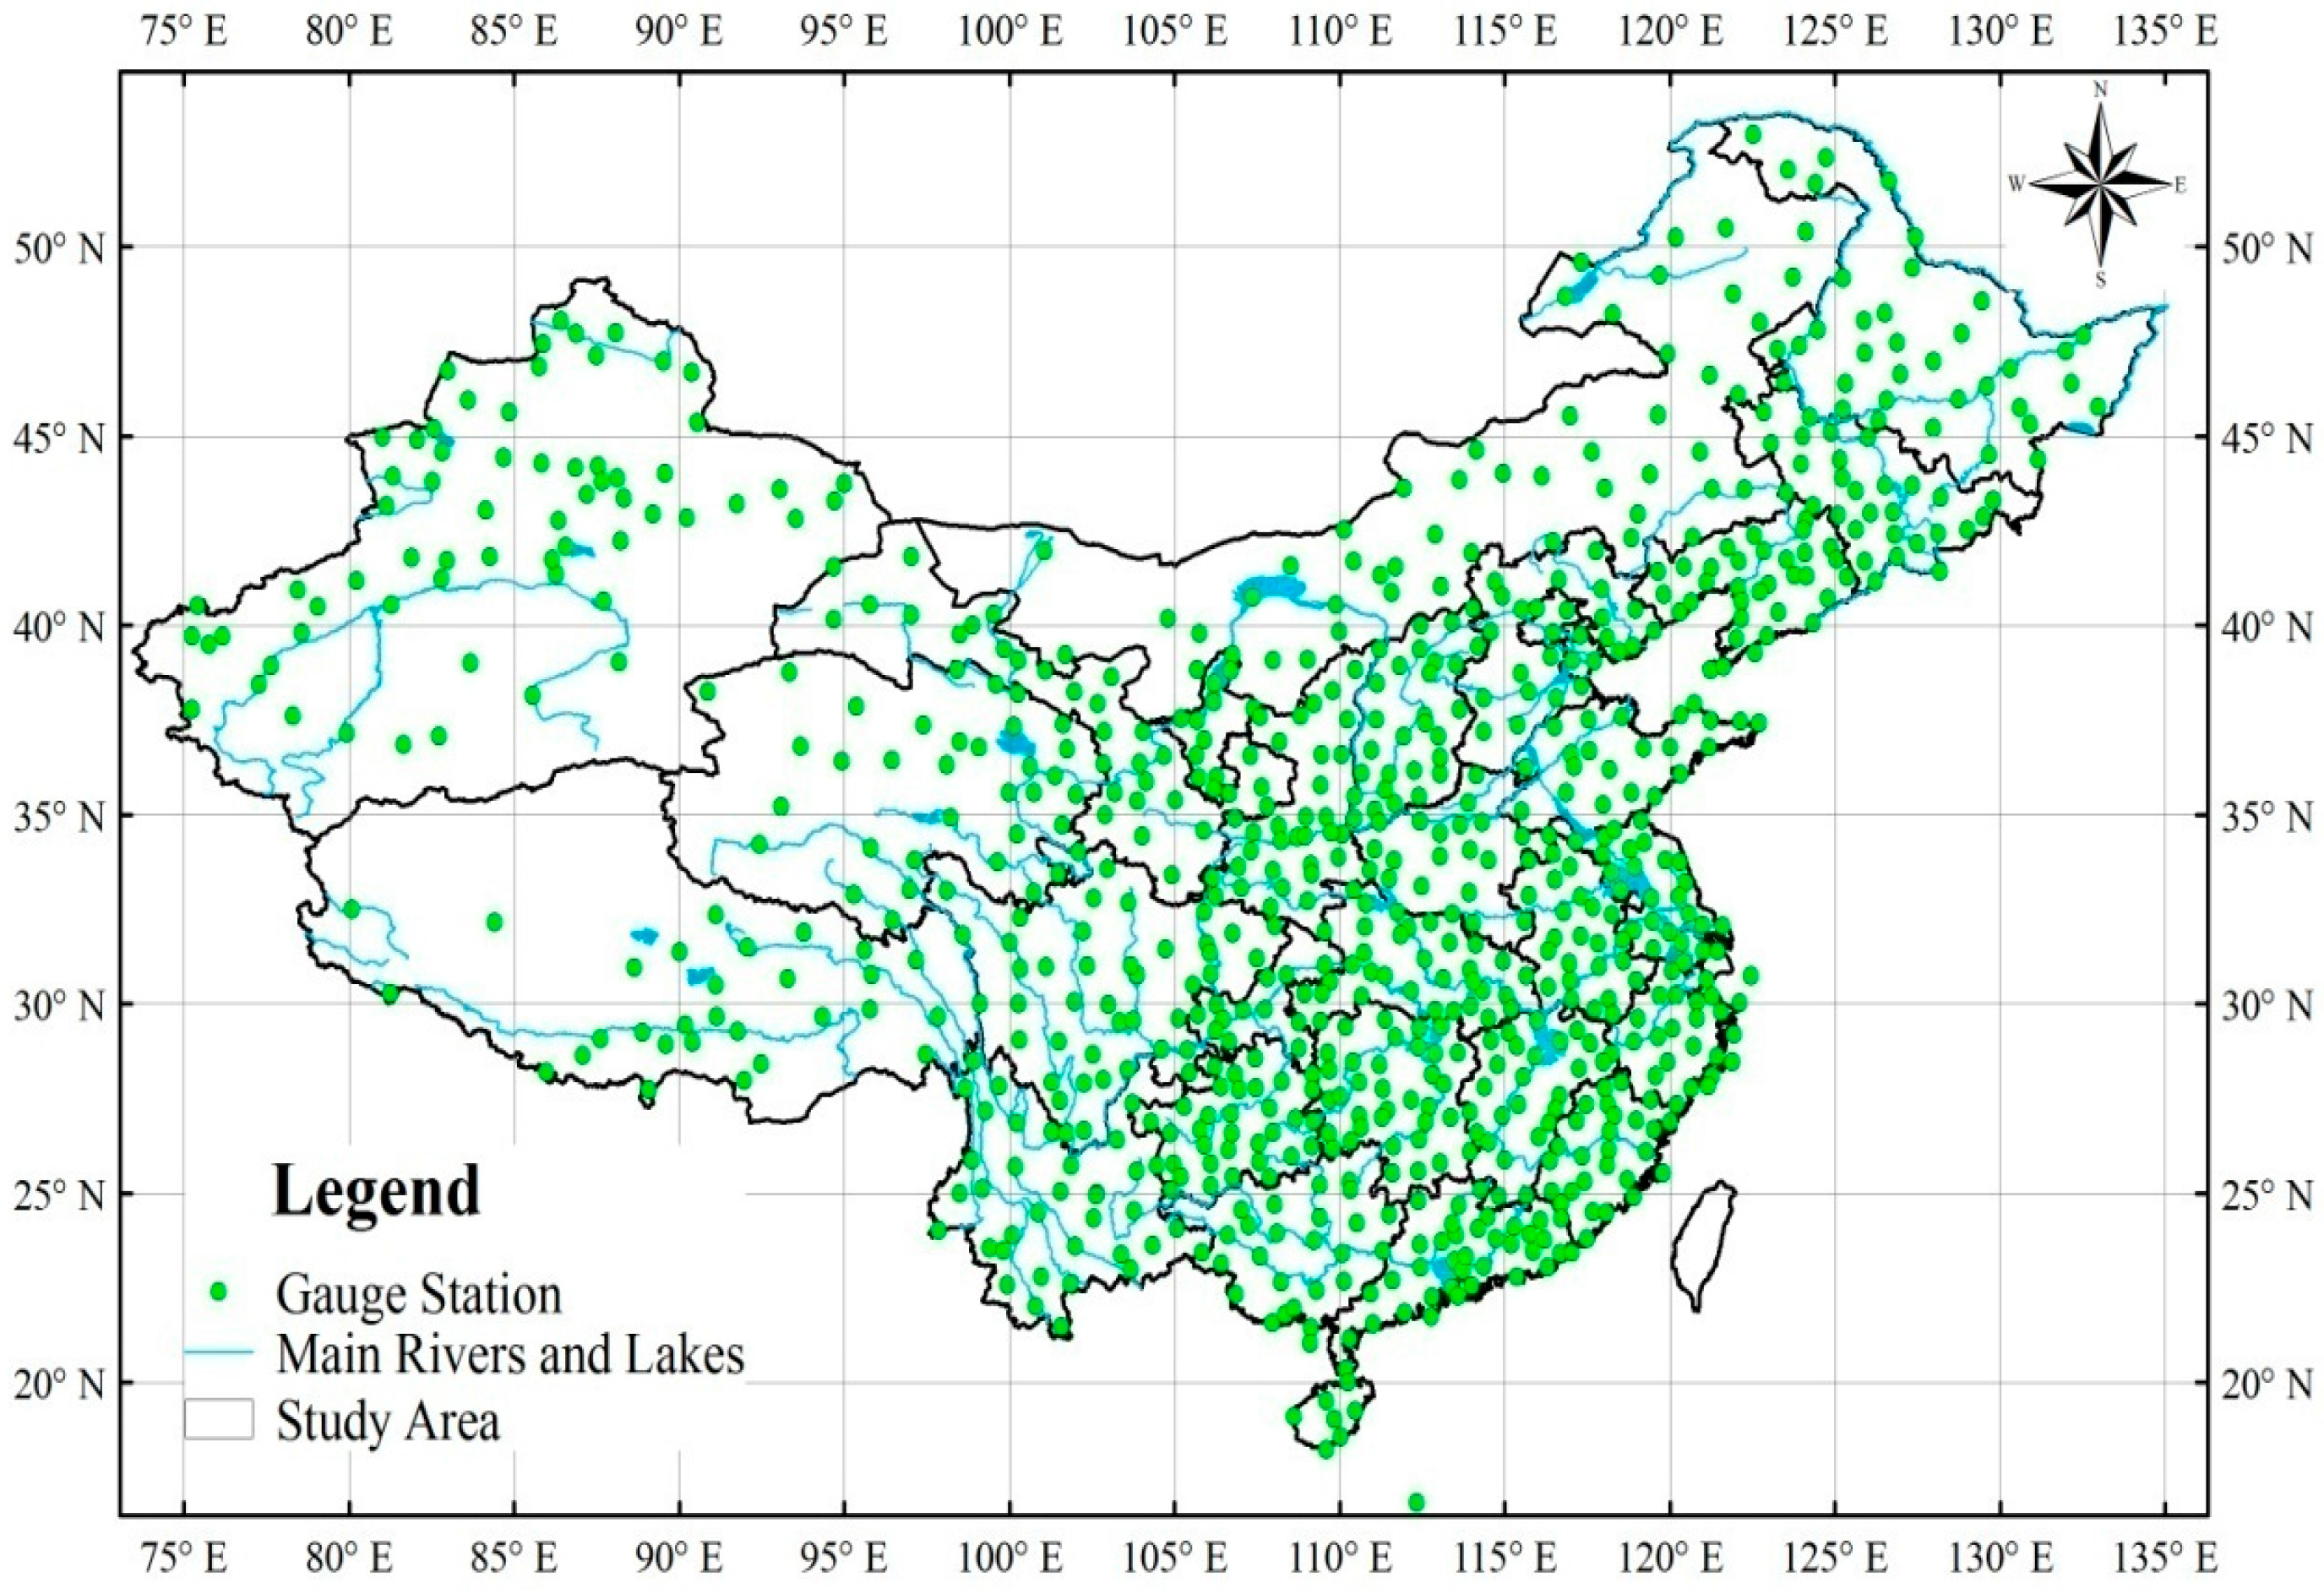
2.1. Ground Reference Data

A total of 840 daily precipitation gauges over a 20 month period, from April 2014 through November 2015, were used in this study (Figure 1). These rain gauges are maintained by the China Meteorological Administration (CMA) and were selected from around 2400 stations based on the following rules: first, that no missing data could exist during the 20 month study period because missing data may influence the accuracy when validating the detection capability for extreme precipitation events; second, to use the independent Global Precipitation Climatology Centre (GPCC) network stations as much as possible because according to the CMA, approximately 200 of the 2400 gauges may also be used in the development of the GPCC product that is used for calibrating monthly GPM IMERG values. Some Global Telecommunications System (GTS) gauges are also among these 2400 gauges and may be used for the NOAA Climate Prediction Center (CPC) analysis and to calibrate the daily GSMap-Gauge product [20].
In addition to the observation gauge network, we acquired the China Gauge-Based Daily Precipitation Analysis (CGDPA) product developed by the National Meteorological Information Center, which is updated in real time at 0.25° resolution from the China Meteorological Data Sharing Service System (http://cdc.nmic.cn) [21]. This spatially interpolated gridded data may introduce some artificiality and make it difficult to verify the “validity” of the gridded data values in regions or periods with none or sparse rain gauges [22,23]. However, the CGDPA data were used only as a benchmark for the spatial comparison of daily mean precipitation values with satellite products.

2.2. GPM-Era Satellite-Based Precipitation Datasets

The GPM mission has been providing level-3 IMERG final run (research) products at 0.1° and half-hourly resolutions since 12 March 2014 (ftp://jsimpson.pps.eosdis.nasa.gov). IMERG is the Day-1 U.S. multi-satellite algorithm for GPM, which is based on components from three prior multi-satellite algorithms from NASA (TMPA), NOAA (CPC Morphing–Kalman Filter; CMORPH-KF), and the University of California Irvine (PERSIANN-CCS) [24]. In brief, the precipitation estimates that are used as inputs are computed from the various satellite passive microwave sensors and calibrated to the GPM Combined Instrument product (because it is presumed to be the best GPM estimate snapshot), then they are “morphed” and combined with microwave precipitation-calibrated GEO-Vis/IR fields, and finally adjusted using monthly surface precipitation gauge analysis data (where available) to provide final products over a domain of 60° N to 60° S. With respect to incorporating the precipitation gauge analysis, IMERG uses the GPCC Monitoring Product (version 4). For the final run, the ratios of the monthly accumulation values from the uncalibrated multi-satellite data and the monthly satellite-gauge field are computed, then each half-hourly field of uncalibrated precipitation estimates in a month is multiplied by the ratio value to generate the final calibrated IMERG precipitation estimates. In contrast to other satellites, for example TRMM, that are not good at measuring light rainfall and snowfall, GPM IMERG uses different sensors (such as GMI, TMI, SSMIS, AMSR2, and MHS) from different satellites to detect both light and heavy rainfall and snowfall [25].
The GSMap algorithm combines precipitation retrievals from TRMM and other polar satellites and interpolates them using cloud-moving vectors derived from Vis/IR images of GEO satellites to produce high resolution (0.1°, 1 hourly) global precipitation estimates over the domain of 60° N to 60° S [16,26,27]. Aside from the conventional satellite stream input, the Japan Meteorological Agency (JMA) Global Analysis (GANAL) data (1.25°, 6 hourly) and JMA Merged Satellite and in-situ Global Daily Sea Surface Temperatures (MGDSST; 1°, daily) are also used in GSMap’s PWM algorithm. First, Kubota et al. [16] developed a simplified, near real-time version of GSMap (GSMap-NRT), which uses fewer PMW input streams and a forward-only cloud advection scheme. To further reduce the total number of retrieval errors, Ushio et al. (2009) employed a new Kalman filter approach to assimilate and refine the Vis/IR-based rainfall rates and thus generated an improved version [GSMap moving vector with Kalman filter (GSMap-MVK)] for nearly all available satellite-borne precipitation-related sensors [28]. Another important difference between these two GSMap products is that GSMap-MVK contains a two-way morphing technique (both forwards and backwards) to propagate the area affected by rainfall using microwave radiometry. Another version of GSMap is the GSMap-Gauge dataset, which integrates the NOAA/CPC gauge-based analysis of global daily precipitation with the GSMap-MVK to create a satellite–gauge combination [29]. Once the GPM mission was launched, a new algorithm was developed by the GSMap project (GPM-GSMap Ver. 6), which includes GPM-Core GMI and contains the newest GPM era GSMap data (Ver. 6, https://www.gportal.jaxa.jp) from March 2014.
The two latest satellite-based precipitation products used in this study are listed in Table 1. They are ready-made, high-level products provided by corresponding organizations. It should be noted that we did not consider the influence of changes to the GPM network that we mentioned above on the consistent quality of these satellite-based precipitation products because of lack of information on satellite transitions. The data from April 2014 to November 2015 were chosen for this study.
In addition, the satellite product grids that cover the locations of the precipitation gauge stations were used for calculation and comparison. In cases in which the grid covered only one station, the comparison between them was carried out directly. However, in cases in which the grid covered more than one station or the station was located in the middle of two grids, the multi-station or two-grid average was used as the basis for comparison.

3. Methodology

3.1. Statistical Assessment Metrics

In this study, we selected several widely used statistical metrics [30] (Table 2) to quantitatively evaluate the performance of different satellite-based precipitation products. The correlation coefficient (CC) was used to evaluate the degree of agreement between satellite-based precipitation measurements and gauge observations. A CC value close to +1 indicates a perfect positive fit. We chose an additional three metrics to indicate the error and bias between precipitation estimates and observation gauges, including the mean error (ME), relative bias (RB), and root mean square error (RMSE). The ME describes the average magnitude of the error, and the RB represents the systematic bias between the two fields. The RMSE measures the average error magnitude.

3.2. Categorical Verification Metrics

Two categorical statistical indices were calculated based on a contingency table (Table 3) to evaluate the precipitation detection capabilities of three HRPPs relative to the reference observation dataset. We chose 1 mm/day to be the threshold between rainfall and no rainfall to calculate these indices [30]. The probability of detection (POD) represents the ratio of the number of precipitation occurrences that are correctly detected by the satellite product (hits) to the number of precipitation occurrences that are observed by the reference data (hits plus misses), which is expressed as a/(a + c). The false alarm ratio (FAR) captures the number of rainfall events that were incorrectly detected, and it can be calculated by the equation b/(a + b) [17].

3.3. Extreme Precipitation Indices

To assess the performance of the three HRPPs in detecting the behavior of precipitation extremes over the Chinese mainland, six extreme precipitation indices were split into three categories: percentile indices, absolute threshold indices, and max indices. Each index was calculated using satellite- and observation-based precipitation data and subsequently compared. Three of the indices (R20mm, Consecutive Wet Days (CWD), and Consecutive Dry Days (CDD)) are defined by the Expert Team on Climate Change Detection and Indices (ETCCDI) [31,32]. The work of the ETCCDI is sponsored jointly by the WMO Commission for Climatology (CCI), the Joint Technical Commission for Oceanography and Marine Meteorology (JCOMM), and the World Climate Research Program (WCRP) on Climate and Ocean. The other three extreme precipitation indices used in this study were RR99p, RR95p, and R20mmTOT. Table 4 describes each of the six extreme precipitation indices.

4. Results and Discussion

4.1. Summary of Satellite-Based Precipitation Product Performance over the Chinese Mainland

In this section, we summarize the use of daily precipitation records obtained from 840 gauges (as shown in Figure 1) to assess the two latest daily satellite-based precipitation products for each 0.1° × 0.1° grid cell that covered at least one rain gauge. In total, 840 pairs of daily gauge- and satellite-based precipitation values for a 20 month period (609 days, from April 2014 to November 2015) were used to calculate the assessment metrics described in Section 3. Table 5 presents the averages of those metrics after they were derived from the 840 value pairs. The ME indicates that GPM IMERG overestimated precipitation by approximately 0.09 mm/day. However, GSMap-Gauge underestimated precipitation by about 0.04 mm/day. Earlier work in China [33] found that the older GSMap product (GSMap-MVK version 4) also underestimated precipitation by about 0.53 mm/day over the period from 2003 to 2006. Although GSMap-Gauge was corrected by observational data in this study, it still resulted in negative ME values. In fact, underestimation of precipitation is a challenge faced by most satellite-based products [34]. For example, the GSMap product underestimated precipitation by about 2.3 mm/day based on research conducted in Colombia [35]. GSMap-Gauge had a lower absolute value of ME than GPM IMERG. It also exhibited a closer alignment with the observed gauge data. The RMSE illustrates the degree to which the estimated values deviate from the observed values. The RMSE of GSMap-Gauge was 4.7 mm/day, a lower value than that of GPM IMERG. The CC measures the degree of linear association between the estimated and observed distributions. A higher CC value means that the estimated distribution is closer to the observed distribution. The CC value of GSMap-Gauge, at 0.79, also performed better than GPM IMERG. The POD measures the fraction of observed events that were correctly detected. A higher POD value indicates better performance of the satellite estimates. FAR is the fraction of estimated precipitation events that were not true precipitation events. The closer the FAR value is to 0, the better performance of the estimation. The POD score result for the GSMap-Gauge product (0.87) is a little bit better than that of the GPM IMERG product. On the contrary, the FAR value for GPM IMERG was lower than that of GSMap-Gauge. The differences in POD and FAR for the two products were not very obvious (Table 5).
In order to determine which product better estimates precipitation over mainland China, Taylor diagrams were plotted to visualize a concise statistical summary of how well each satellite-based product matched the observed gauge data (reference object) in terms of CC, standard deviation, and centered RMSE (Figure 2). The smaller the distance between the reference and comparison objects on a Taylor diagram indicates a closer agreement. Satellite-based precipitation products that agree with reference data are located closest to the black dot on the horizontal axis. As shown in Figure 2, GSMap-Gauge is nearer to the observed values than GPM IMERG, indicating that the daily gauge-corrected product is clearly superior. This could be attributed to two major factors: first, GSMap-Gauge adopts daily CPC data for its bias correction, which performs better than the monthly gauge analyses (GPCC) used in GPM IMERG; second, GSMap-Gauge uses two other datasets (GANAL and MGDSST, as mentioned in Section 2) for calculating its lookup tables, which are referred by the GSMap microwave imager and sounder algorithms.
Previous studies concluded that systematic biases of satellite-derived precipitation values were proportional to the magnitude of the rainfall rate [36]. The spatial distributions of ME and RMSE for satellite-based precipitation products have difficulty illustrating those products’ spatial performance over the Chinese mainland due to its complex spatial pattern of rainfall. Thus, the distribution of CC for each satellite-based product was used qualitatively to characterize each product’s spatial performance. As shown in Figure 3, the CC values of all products were good over most regions of China (most CC values were larger than 0.6), especially in southeastern China where a wet climate prevails. Most of the low CC values for the two products were located in northern China, in regions of higher latitudes, and in arid northwestern China, which illustrates that the performance of satellite-based precipitation products is not good over northern arid and semi-arid China. This result is consistent with previous findings from Qin [33]. Overall, GSMap-Gauge exhibited the best correlation over most of China (almost 90% of CC values were greater than 0.6 and about half of them were greater than 0.8). Comparing with GSMap-Gauge, most CC values (about 72%) of GPM IMERG were in the range of 0.6 to 0.8, and only approximately 6% were larger than 0.8.

4.2. Twenty-Month Spatial Daily Mean Precipitation

In this section, the two latest satellite-based precipitation products are compared to CGDPA over the contiguous Chinese mainland for the 20 month period from April 2014 to November 2015. The 20 month mean precipitation results that are based on the CGDPA dataset and the two satellite-based precipitation products are shown in Figure 4. The precipitation distribution over mainland China is characterized by a decrease from the southeast to the northwest in the mean intensity of daily gauge-based analysis data. Both satellite-based datasets generally captured the spatial pattern of 20 month mean daily precipitation over China (Figure 4b,c). GSMap-Gauge showed a slight underestimation over southern and southeastern China, where typhoons that make landfall and the annual migration of the Asian monsoon season introduce abundant amounts of fresh water. This underestimation could be caused by the fact that heavy rainfall may cause signal attenuation of the PMW sensor, which may result in underestimation by satellite-only precipitation products (GSMap-MVK) from which GSMap-Gauge was developed using a satellite-gauge combination [37]. Another example of underestimation by the satellite-based products is in a small region of the southeastern Tibetan Plateau, where observed daily mean precipitation is around 15 mm/day, but neither GPM IMERG nor GSMap-Gauge were able to adequately capture the heavy rain signal there; this is especially the case for GPM IMERG. Additionally, both products showed poor performance over the arid and semiarid inland region in northwestern China. This may be attributed to the following two factors: raindrops detected by the space-born sensors (PMW and Vis/IR) may partially or totally evaporate before reaching an arid or semi-arid surface, while snow and ice cover over the mountainous regions of northwestern China may interfere with the accuracy of the PMW algorithm for precipitation. Generally, GSMap-Gauge provided a spatial precipitation distribution pattern that was closer to CGDPA than did GPM IMERG.
Figure 5 displays density-colored scatterplots and a quantitative comparison between satellite-based products and gauge observations for the 20 month daily precipitation mean over mainland China. Some of the higher observed values in each of the scatterplots are caused by heavy precipitation events over regions with complex terrain, such as southwestern China, where satellite precipitation products have difficulty estimating precipitation with high accuracy. GSMap-Gauge performed better with improved CC and RMSE values over GPM IMERG (0.97 and 0.42 mm/day, respectively). The RB values indicated that GPM IMERG tended to overestimate precipitation and GSMap-Gauge displayed a small underestimation (RB, −1.3%). This was consistent with the results shown above in Table 5.

4.3. Monthly Time Series Precipitation Analysis

Comparison statistics were calculated for each month during the 20 month period and are displayed in Figure 6 in order to examine the temporal variations of CC, ME, RMSE, POD, and FAR over the Chinese mainland. Monthly mean CC values for GPM IMERG (Figure 6a) showed a season-dependent variability with relatively low values during the time period from November to April when the climate is both dry and cold. The possible reasons behind this may be related to the following: first, more shallow precipitation events that are difficult to measure accurately with PMW sensors occur during this cold season; second, the accuracy of the PWM algorithms are influenced by snow or ice surface cover in winter. However, GSMap-Gauge consistently had the highest CC values (>0.75), with no significant seasonal variation. The RMSEs of the two products were similar, showing obvious seasonal variation, but GSMap-Gauge had smaller RMSE values than GPM IMERG (Figure 6c). The monthly patterns of POD for both products were similar to RMSE values (Figure 6d). In terms of CC, RMSE and POD, GSMap-Gauge performed better and with greater stability than GPM IMERG. The monthly bias corrected algorithm used by GPM IMERG appears to have great potential for improving the detection of precipitation in winter and reduction of error. The two products had opposite patterns for ME, as shown in Figure 6b. It is also worth noting that GPM IMERG overestimated precipitation in nearly all 20 months, except for two months in winter (December 2014 and January 2015); in contrast, GSMap-Gauge seemed to underestimate precipitation primarily during the summer season. GSMap-Gauge displayed relatively stable FAR values for all the seasons, but GPM IMERG had lower FAR values than GSMap-Gauge in summer and the opposite was true in winter, demonstrating obvious seasonal variability.

4.4. Probability Distribution by Occurrence

The frequency distribution for precipitation at different intensities can provide an insight into the characteristics of the precipitation rate-dependent error and the potential error impact on hydrometeorological applications, because the same precipitation amount in the form of long-lasting light rainfall or a short-duration storm can have very different influences on natural hazards, such as landslides and floods. Figure 7 depicts the frequency distribution by precipitation occurrence within different precipitation intensities. The precipitation intensities (PIs) are grouped into seven classes: (1) no-rain and light rain (0 ≤ PI ≤ 1 mm/day); (2) 1 < PI ≤ 4 mm/day; (3) 4 < PI ≤ 8 mm/day; (4) 8 < PI ≤ 16 mm/day; (5) 16 < PI ≤ 32 mm/day; (6) 32 < PI ≤ 64 mm/day; and (7) PI > 64 mm/day.
The gauge observation dataset reports that about 77% of events fell into the no rain and light rain event class during the study period. GPM IMERG showed similar no rain and light rain events as the observation dataset, with only a 1% overestimation (Figure 7a). GSMap-Gauge exhibited much lower percentages of no rain and light rain events than the observation dataset, with values of around 67%. GSMap-Gauge captured more precipitation events than the observation data did in the 1–16 mm/day range (middle and low intensity precipitation events) (Figure 7b). This partially explains the under-detection of no rain and light rain events for GSMap products. We speculate that GSMap employed a morphing technique, which propagates PMW precipitation estimation by using cloud motion vectors derived from Vis/IR data and that may cause greater appearance of low-intensity precipitation events. The performance of GPM IMERG in capturing precipitation events across the 1–16 mm/day range was clearly unstable, sometimes resulting in overestimation and sometimes in underestimation. When the precipitation rate was more than 16 mm/day, the two products, especially GPM IMERG, agreed well with the observation data in terms of occurrence frequency, but GSMap-Gauge products showed slight underestimation.

4.5. Extreme Precipitation Events Comparison

In this section, we evaluate the performance of two satellite-based products in capturing the behavior of extreme precipitation events over the Chinese mainland when compared to precipitation gauge observations. Figure 8a,b show the results of the satellite-based products in capturing the 99th (RR99P) and 95th (RR95P) percentile indices of daily precipitation. In general, the two satellite products captured the two indices well with high correlation coefficients (>0.8). It is noteworthy that GPM IMERG tended to overestimate the two percentile indices, with RB values of 9.81% and 5.68%, respectively. On the contrary, GSMap-Gauge results showed significant underdetection of RR99P and RR95P, even with a CC value as high as 0.92. The same condition was also found in capturing the two absolute threshold indices (R20mm and R20mmTOT) of daily precipitation. These indicated that the latest GSMap algorithm tends to underestimate extreme precipitation and that the bias correction method for GSMap-Gauge can effectively improve the CC by using observation data while also smoothing out the magnitude of extreme precipitation. As for the third category of the extreme precipitation indices, we looked at the maximum indices of precipitation with respect to the duration of the rain/no-rain period. The performance of the two products for capturing CWD and CDD was not as good as for the indices that were discussed previously, with relatively low CC values and points scattered far from the 1:1 line. It should be noted that GSMap-Gauge significantly overestimated CWD, with RB around 63.6%. This may be partially explained by the fact that the bias correction procedures smooth the precipitation time series by identifying more no-rain days as rain events and consequently reducing the amplitude of extreme precipitation events. For CDD, both GPM IMERG and GSMap-Gauge provided similar results. Generally, GPM IMERG detected more extreme precipitation events and extreme precipitation amounts than GSMap-Gauge did (Figure 8a–d).

4.6. Discussion

This paper quantitatively compared the performance of two of the latest high-resolution satellite precipitation products (GPM IMERG and GSMap-Gauge Ver. 6) using an observation gauge-based precipitation dataset. Currently, GSMap-MVK Ver. 6 is one of the latest and most useful GPM-era satellite-based precipitation product that has not been corrected using gauge data such as IMERG and GSMap-Gauge. To facilitate fair assessment, we did not mix the three together. The results of the comparison between GSMap-MVK results and gauge-based precipitation records were provided in Table S1 and Figures S1–S7 (see Supplementary Materials). These results showed that even though bias correction may smooth over extreme precipitation amounts (such as those produced by GSMap-Gauge), it could obviously improve the quality and accuracy of satellite-based precipitation products. Compared with GPM IMERG, GSMap-Gauge exhibited stable performance on daily and monthly scales, with higher values of CC and POD, and lower values of RMSE and ME. Another advantage of GSMap-Gauge is its short latency time for data release (one or two days), compared to GPM IMERG’s two to four months.
It is noteworthy that topography and climate conditions clearly influence the accuracy of retrieval results [38,39]. Our results also supported this view. For example, GSMap-MVK underestimated precipitation in southeastern, lowland rainy regions of China while it overestimated precipitation in the northwestern, mountainous dry regions, as shown in Figure S3. Figure 6a,e showed that performance of satellite precipitation products had distinct and seasonally-dependent variability, with relatively low CC and POD values during the cold season (from November to April) when the climate is both dry and cold. Little research has been done concerning the application of these latest satellite precipitation products in hydrological modeling in China. Tang et al. found that GPM IMERG performed well in hydrological modeling simulation in the mid-latitude Ganjiang River basin in southeast China, outperforming its predecessor TRMM 3B42 [40]. W. Qi et al. applied GSMap-MVK data to perform discharge simulations in the Biliu basin located in northwestern China, and results showed that GSMap-MVK had a huge advantage over TRMM 3B42 for discharge simulations, especially at the monthly and inter-annual scales [18]. The two studies cited above also found that good discharge simulation depended on the appropriate match between the hydrological model and precipitation product, as a better precipitation product did not necessarily guarantee a better discharge simulation. This suggested that, although the satellite-based precipitation products were not as accurate as rain gauge data, they could perform better in discharge simulations when combined with appropriate hydrological models, but it should be further tested with more river basins, and large river basins in particular, in order to account for spatial variability among precipitation products. As more new GPM-era products are released, further studies about their utility in hydrology and associated uncertainty analyses will be important for diverse basins that have distinct physiographic and hydro-climatic conditions. Additionally, there were few studies that have tested or utilized these latest satellite precipitation products to detect extreme weather conditions (e.g., drought and heavy rainfall). Liu compared monthly IMERG product with TRMM monthly product (3B42) in the boreal summer of 2014 and boreal winter of 2014/2015 on a global scale and concluded that the IMERG monthly product could capture major heavy precipitation regions in the Northern and Southern Hemisphere reasonably well [41]. Satya et al. found that the GPM IMERG product, for detecting heavy rainfall event frequency across India at a daily time scale during the southwest monsoon season, showed a notable improvement over TRMM as compared to observation gauge data [42]. The performance of the two latest products in detecting extreme events in our study showed that IMERG tended to overestimate extreme precipitation events but that GSMap-Gauge tended to underestimate them. Those who use these products for extreme precipitation research should take this finding into account. Combining or merging the advantages of different products may play an important role in solving future hydrometeorological problems.
Furthermore, this study focused only on the performance of the two latest satellite-based precipitation products over the Chinese mainland. Two types of precipitation datasets should also be included in evaluation studies. One is a gridded precipitation dataset that is constructed based on the dense network of rain gauges and interpolation modeling, such as APHRODITE. A second precipitation dataset is simulated based on numerical weather prediction models and data assimilation techniques, such as the High Asia Reanalysis (HAR). These two gridded precipitation datasets have been shown to have numerous merits and faults [43]. It is worth performing a comparative analysis of various gridded precipitation datasets, including satellite-based, rain gauge interpolation, and numerical weather model simulation products over the Chinese mainland to explore and test their applicability in different fields such as flood prediction, hydrological modeling and climate analysis.

5. Conclusions

After two years of successful quasi-global precipitation measurements, the Global Precipitation Mission is providing a new generation of global precipitation products. These products can be utilized in a wide range of applications for hydrology, meteorology, and land surface studies. In this paper, the two latest GPM-era satellite-based precipitation products were assessed by comparing them with daily precipitation gauge data over the Chinese mainland during a twenty-month period from April 2014 to November 2015. The main conclusions of the study are summarized below:
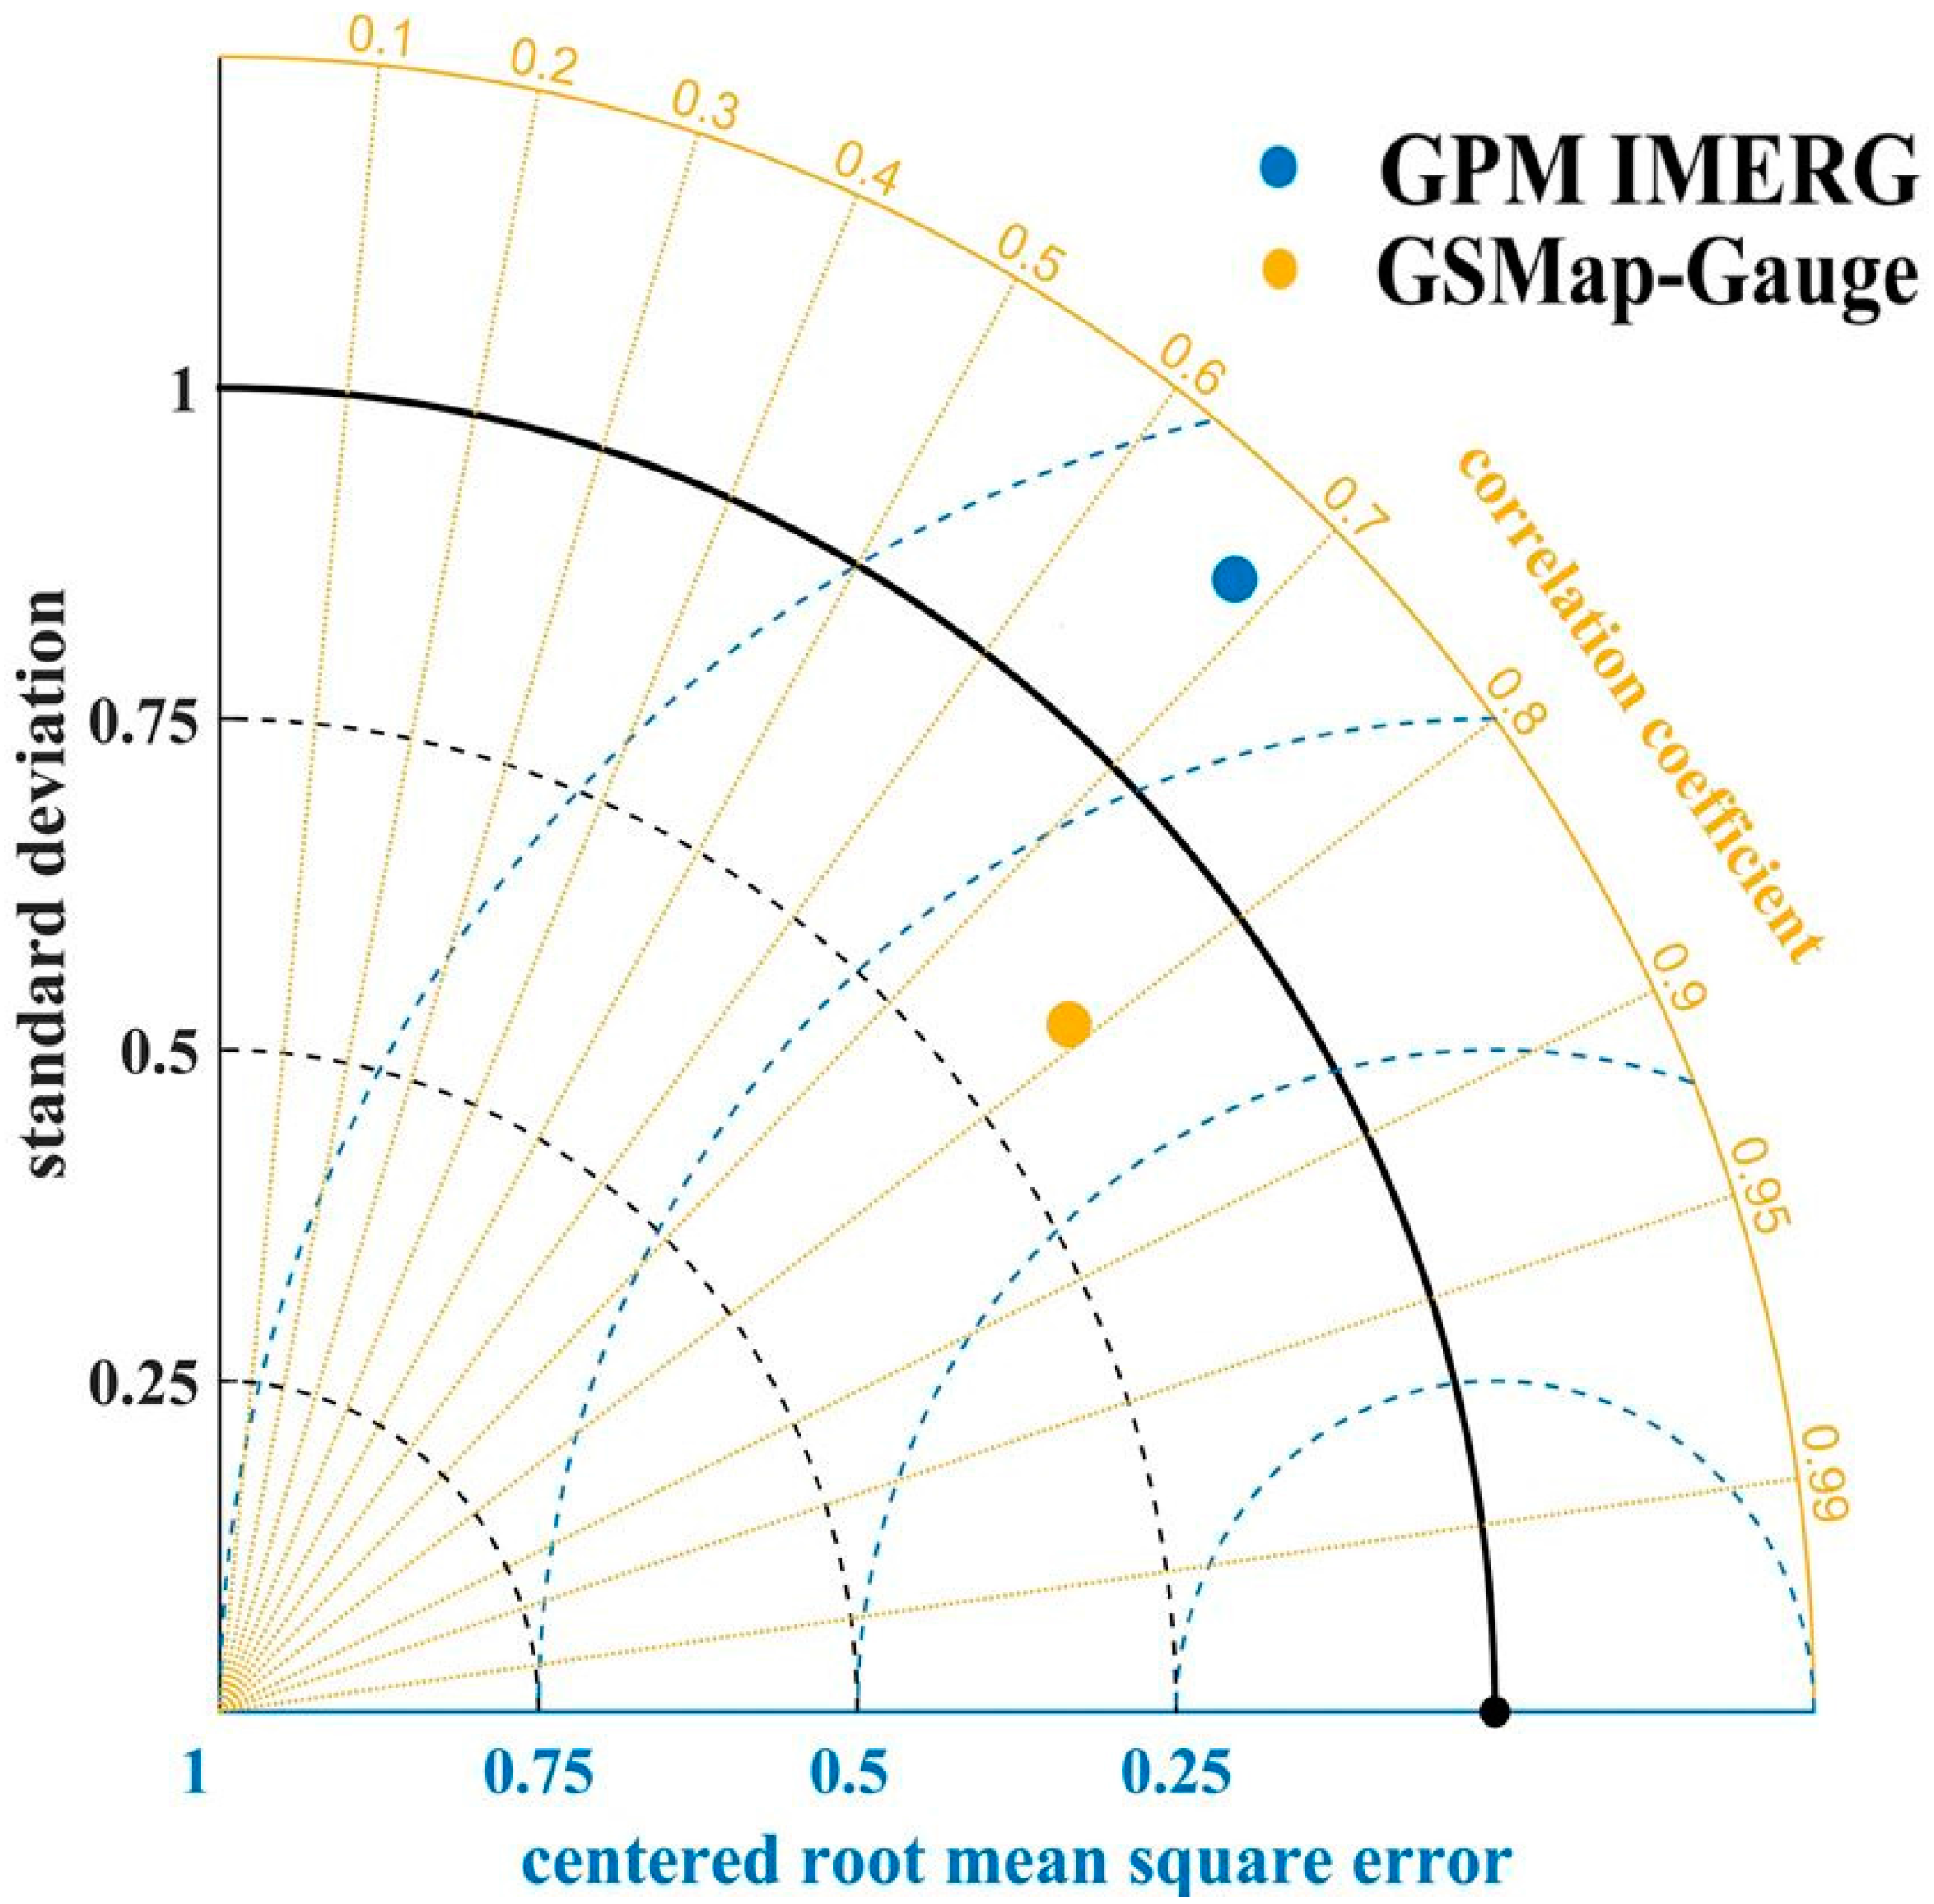
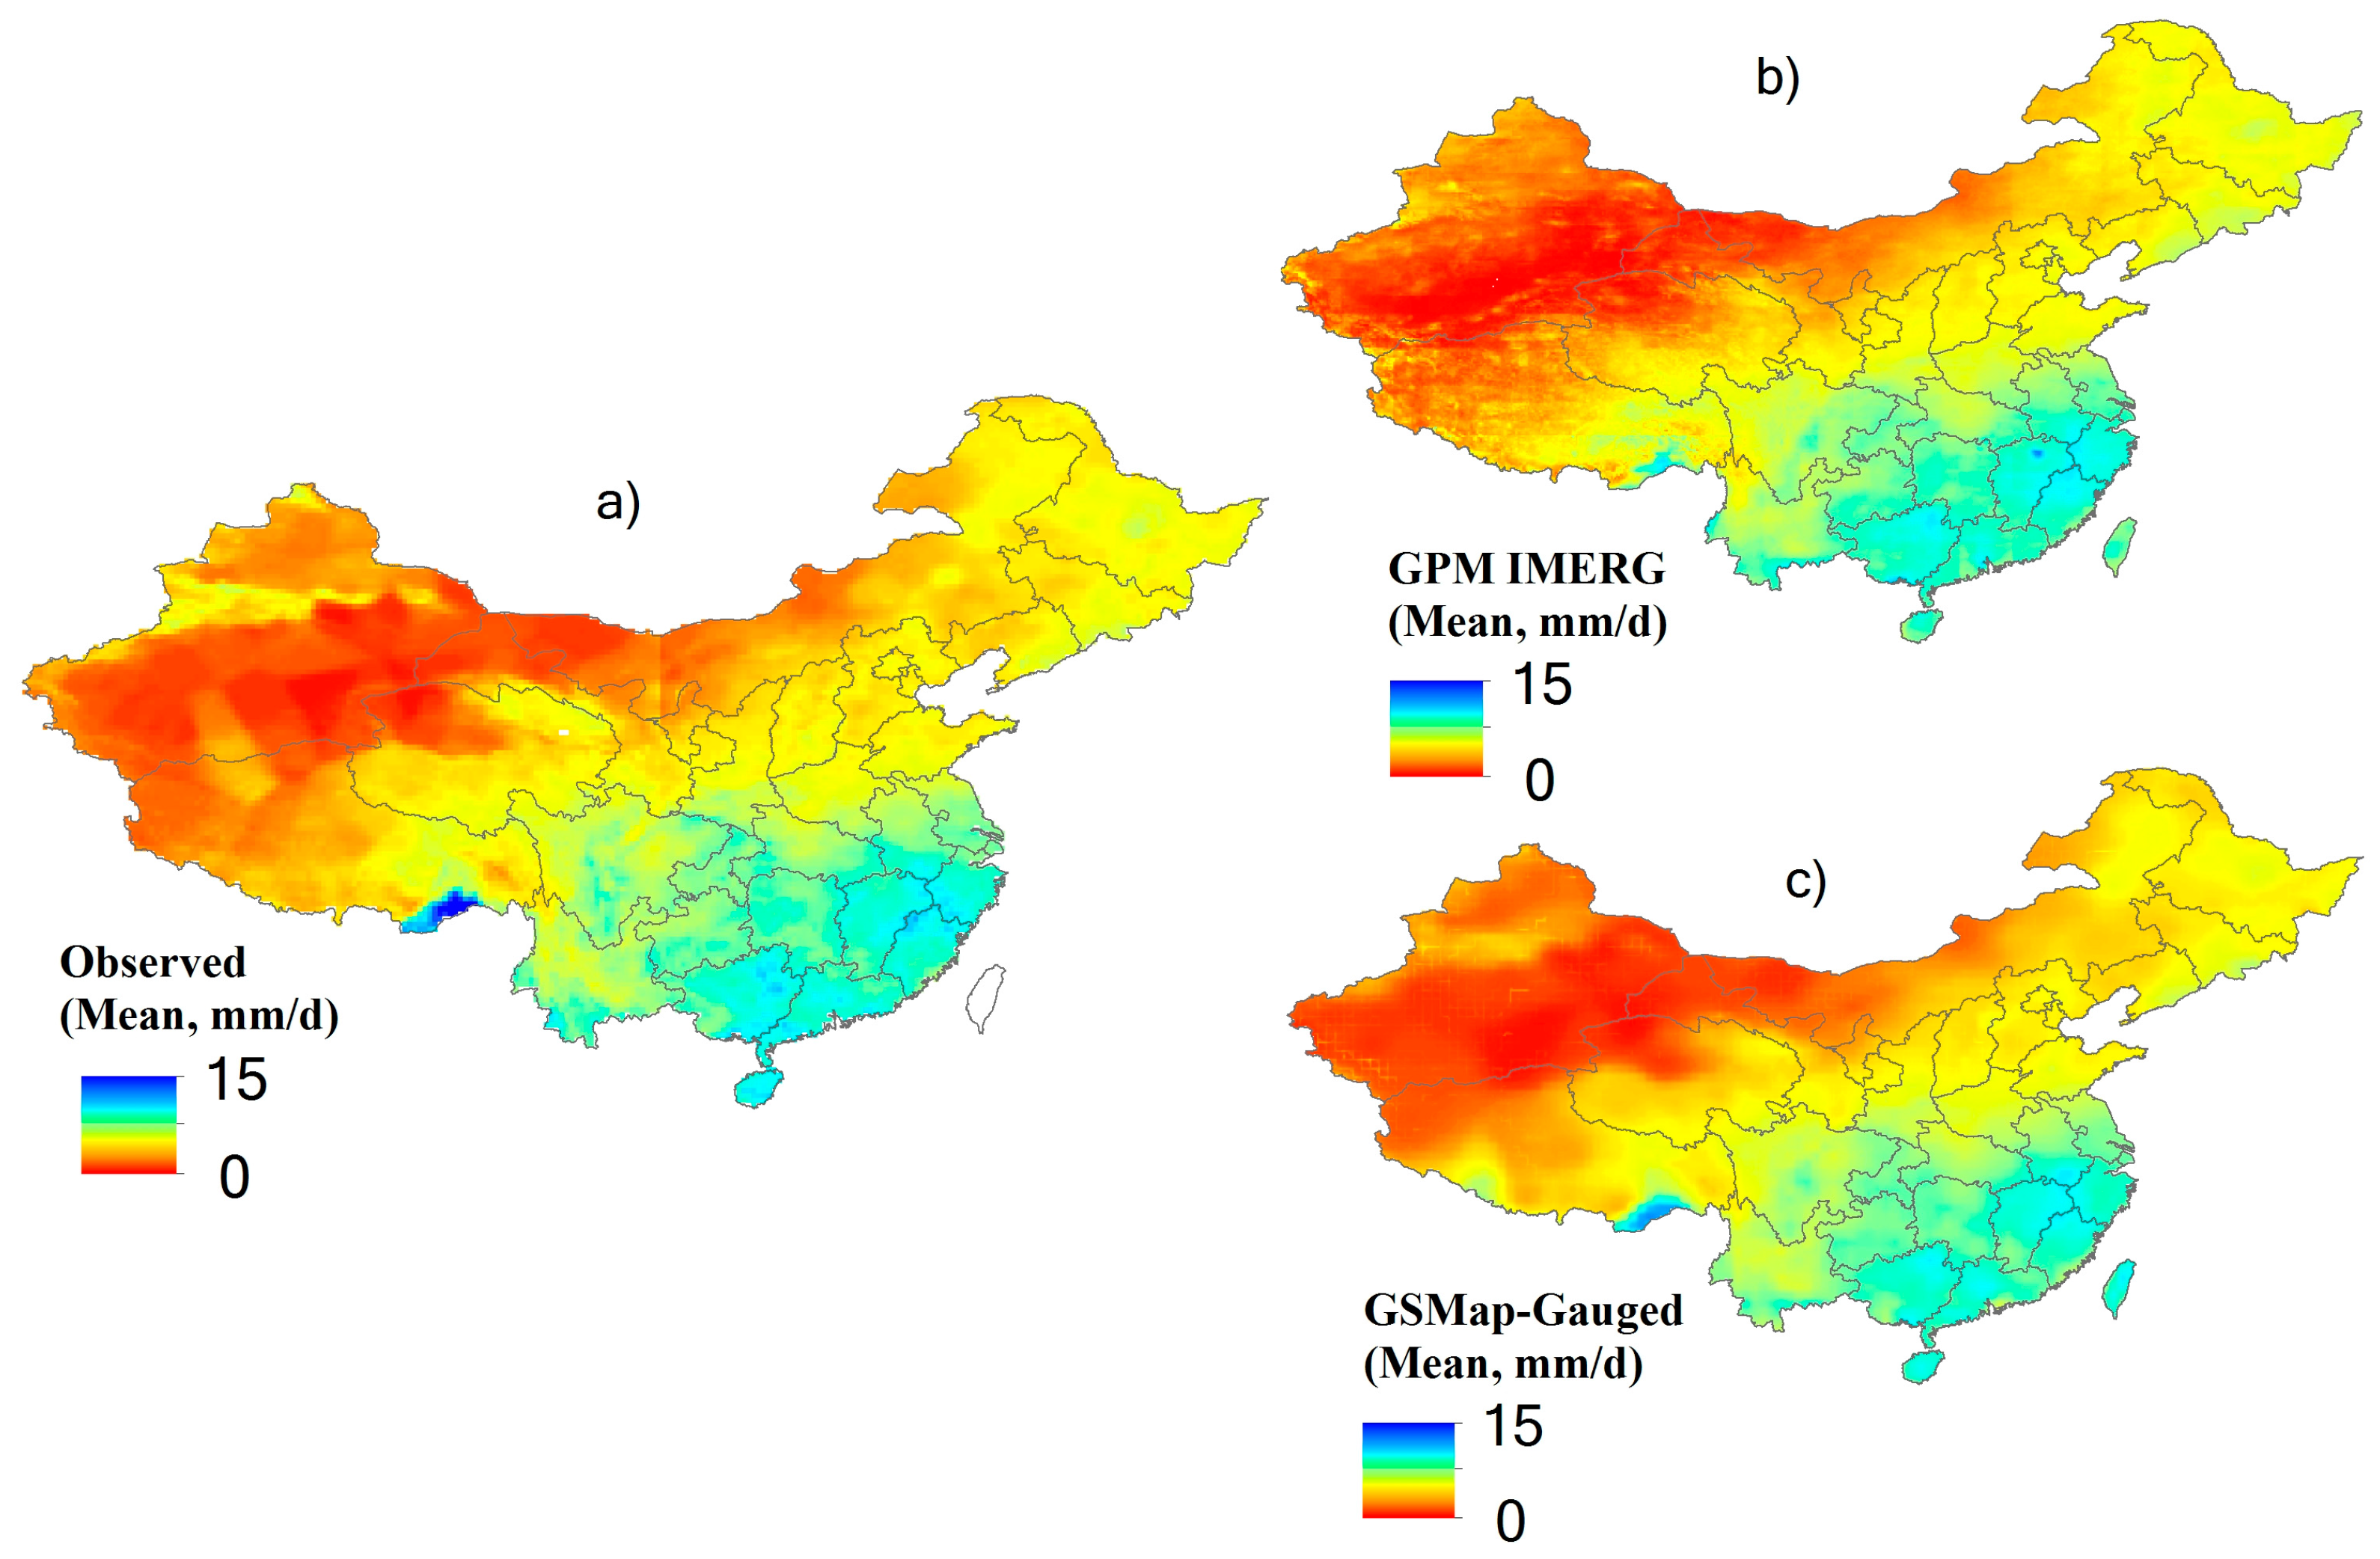
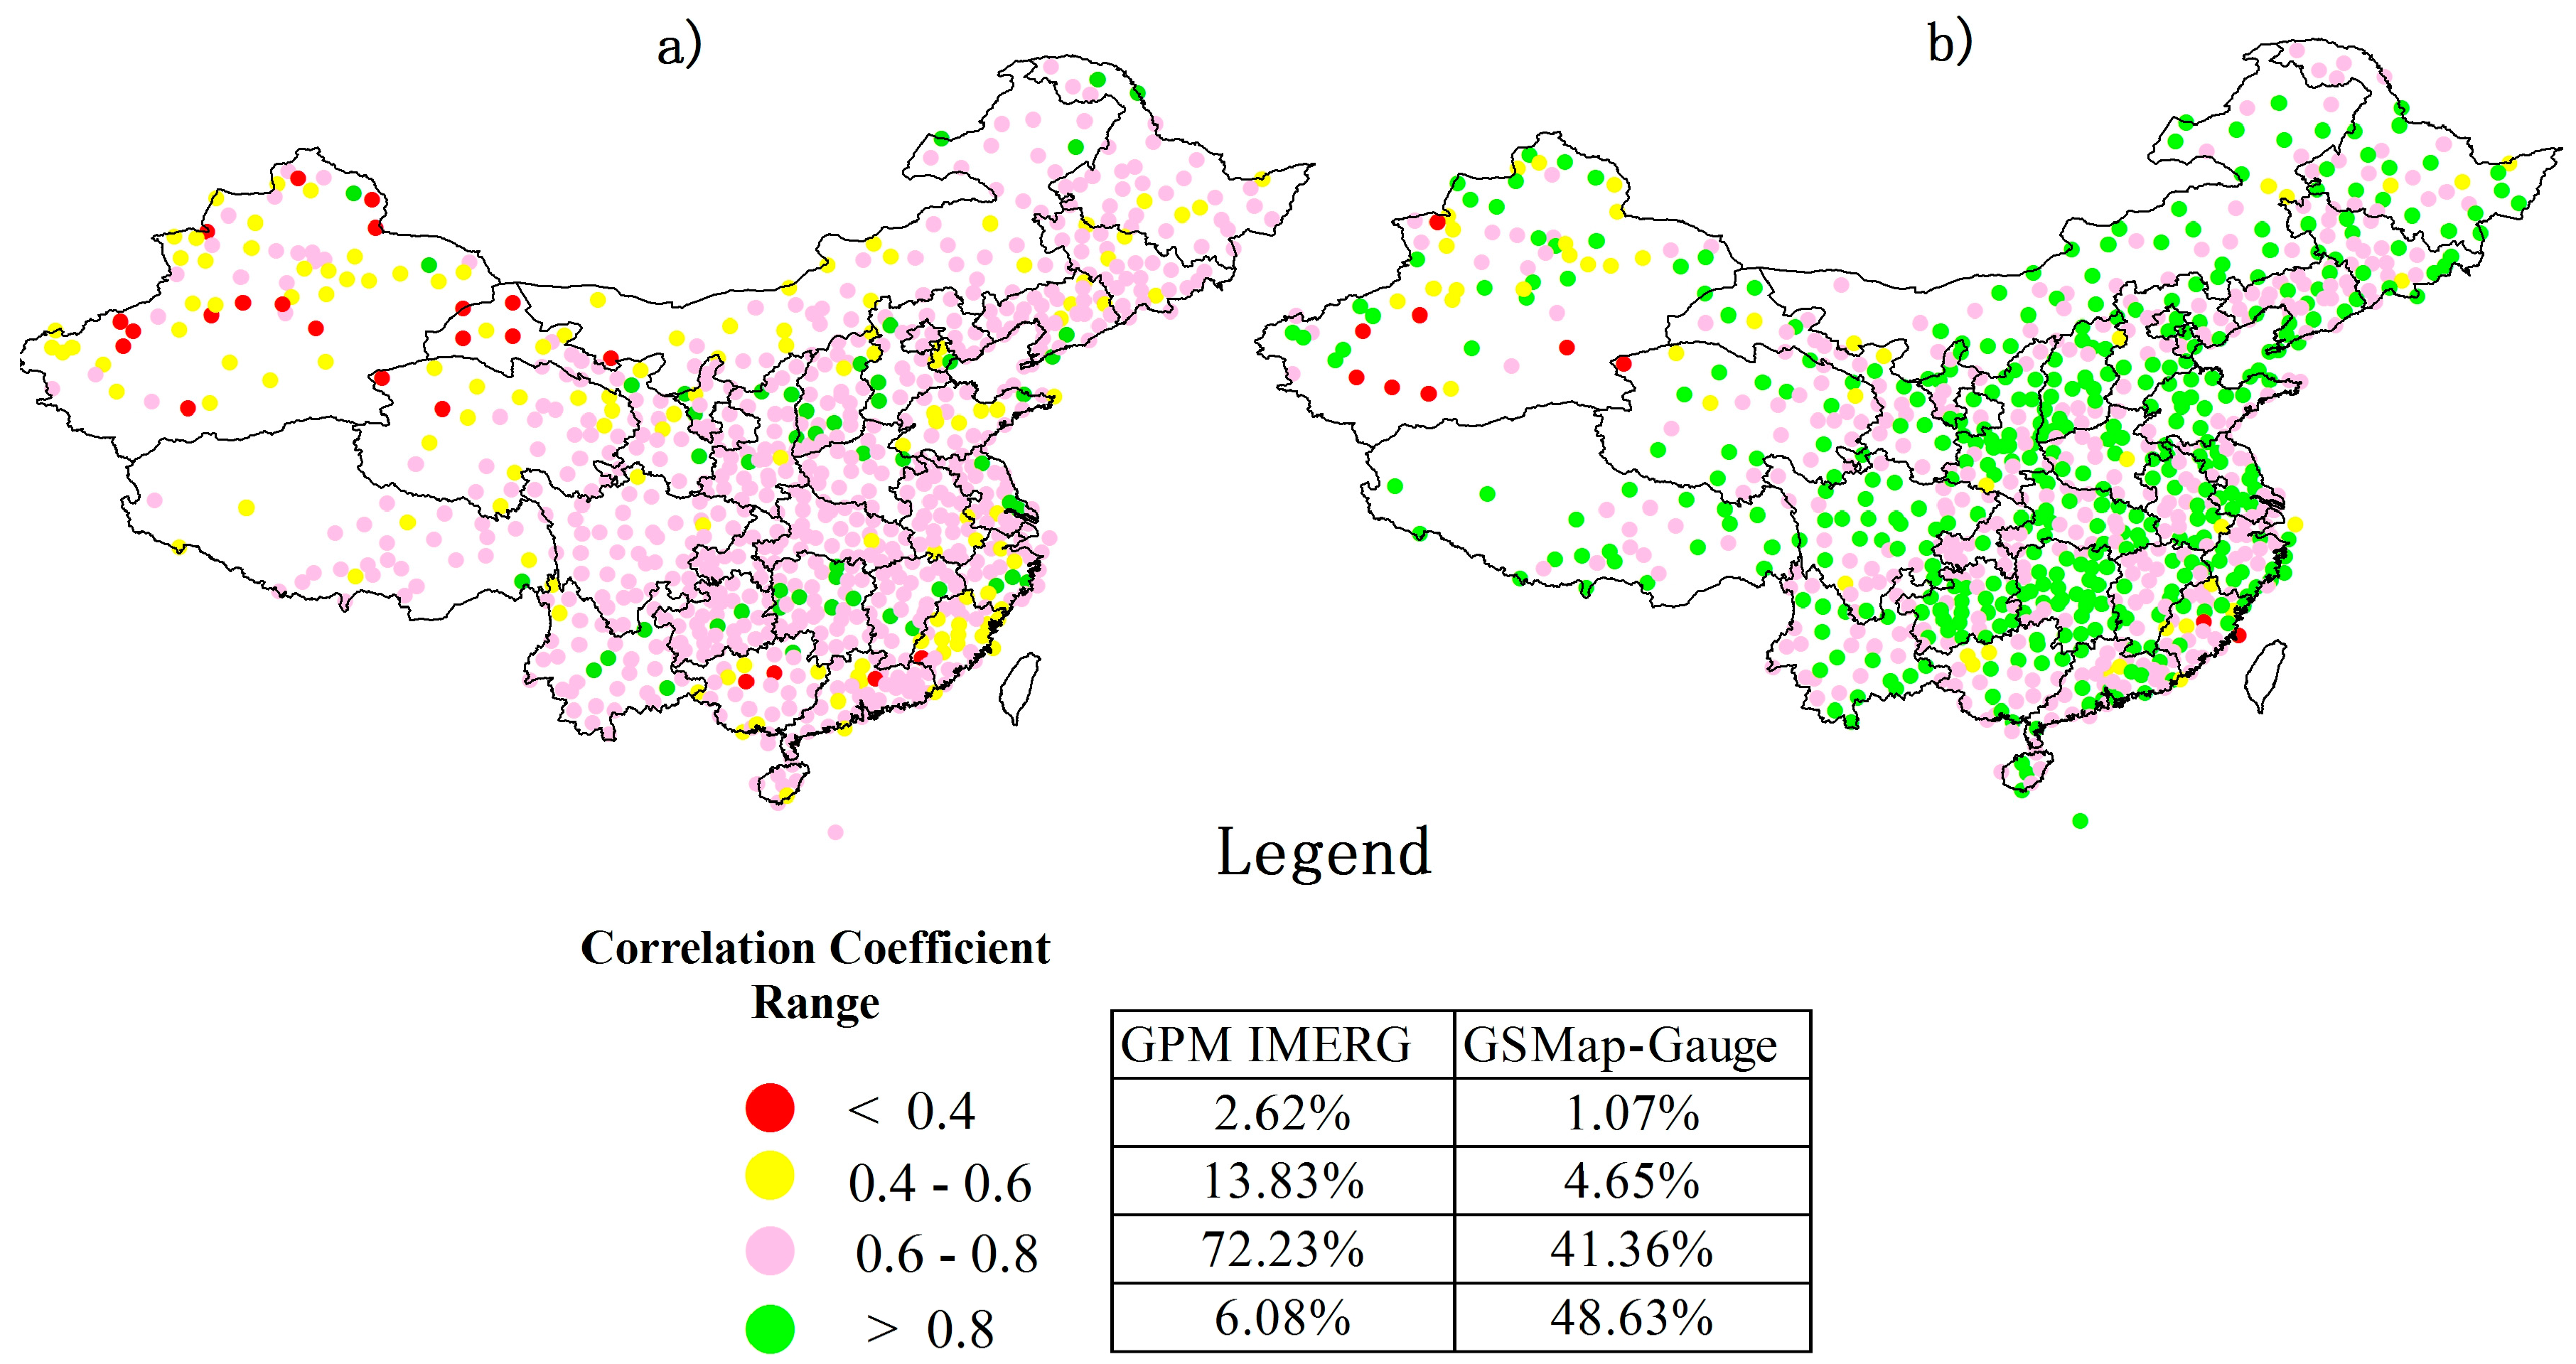
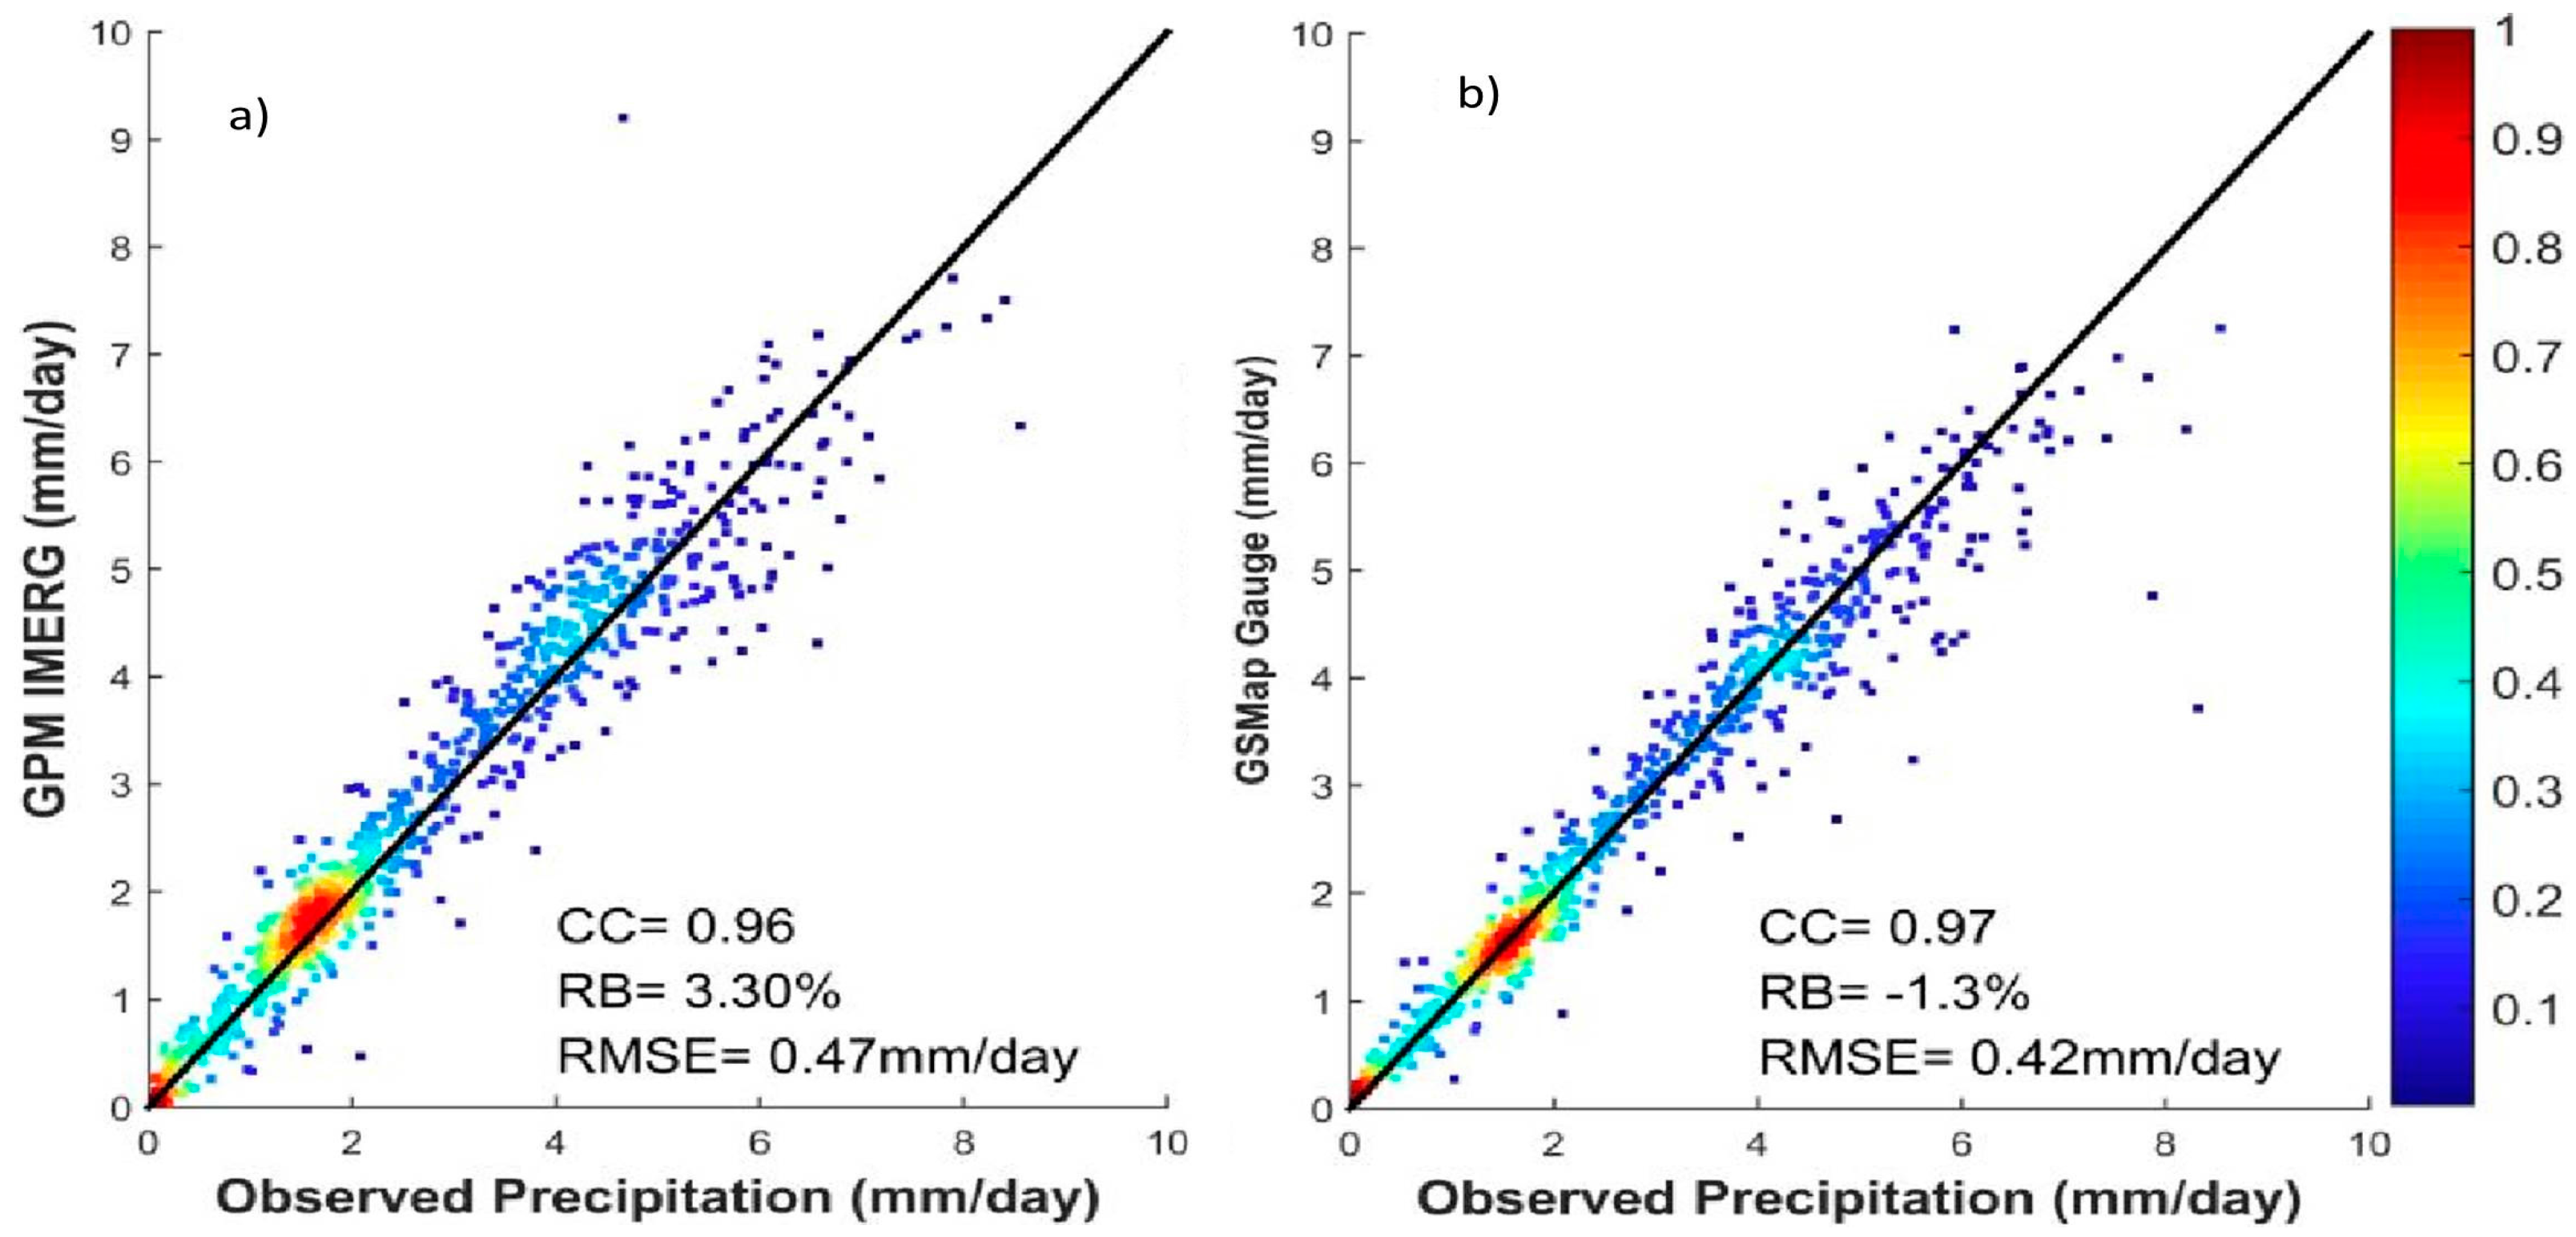
  • In terms of ME, RMSE, CC, and POD, GSMap-Gauge showed better performance at estimating precipitation than GPM IMERG. The Taylor diagram visually demonstrated that GSMap-Gauge results are nearer to the observed values. In a spatial sense, GSMap-Gauge exhibited the best correlation over most of China (almost 90% of CC values were greater than 0.6 and about half of them were greater than 0.8). Both products were capable of capturing the overall spatial pattern of the 20 month mean daily precipitation, although they performed poorly over the arid and semiarid inland region in northwestern China. All products tended to underestimate precipitation significantly in some mountainous region, such as the southeastern Tibetan Plateau. GSMap-Gauge resulted in a spatial precipitation distribution pattern that was closer to CGDPA than GPM IMERG;
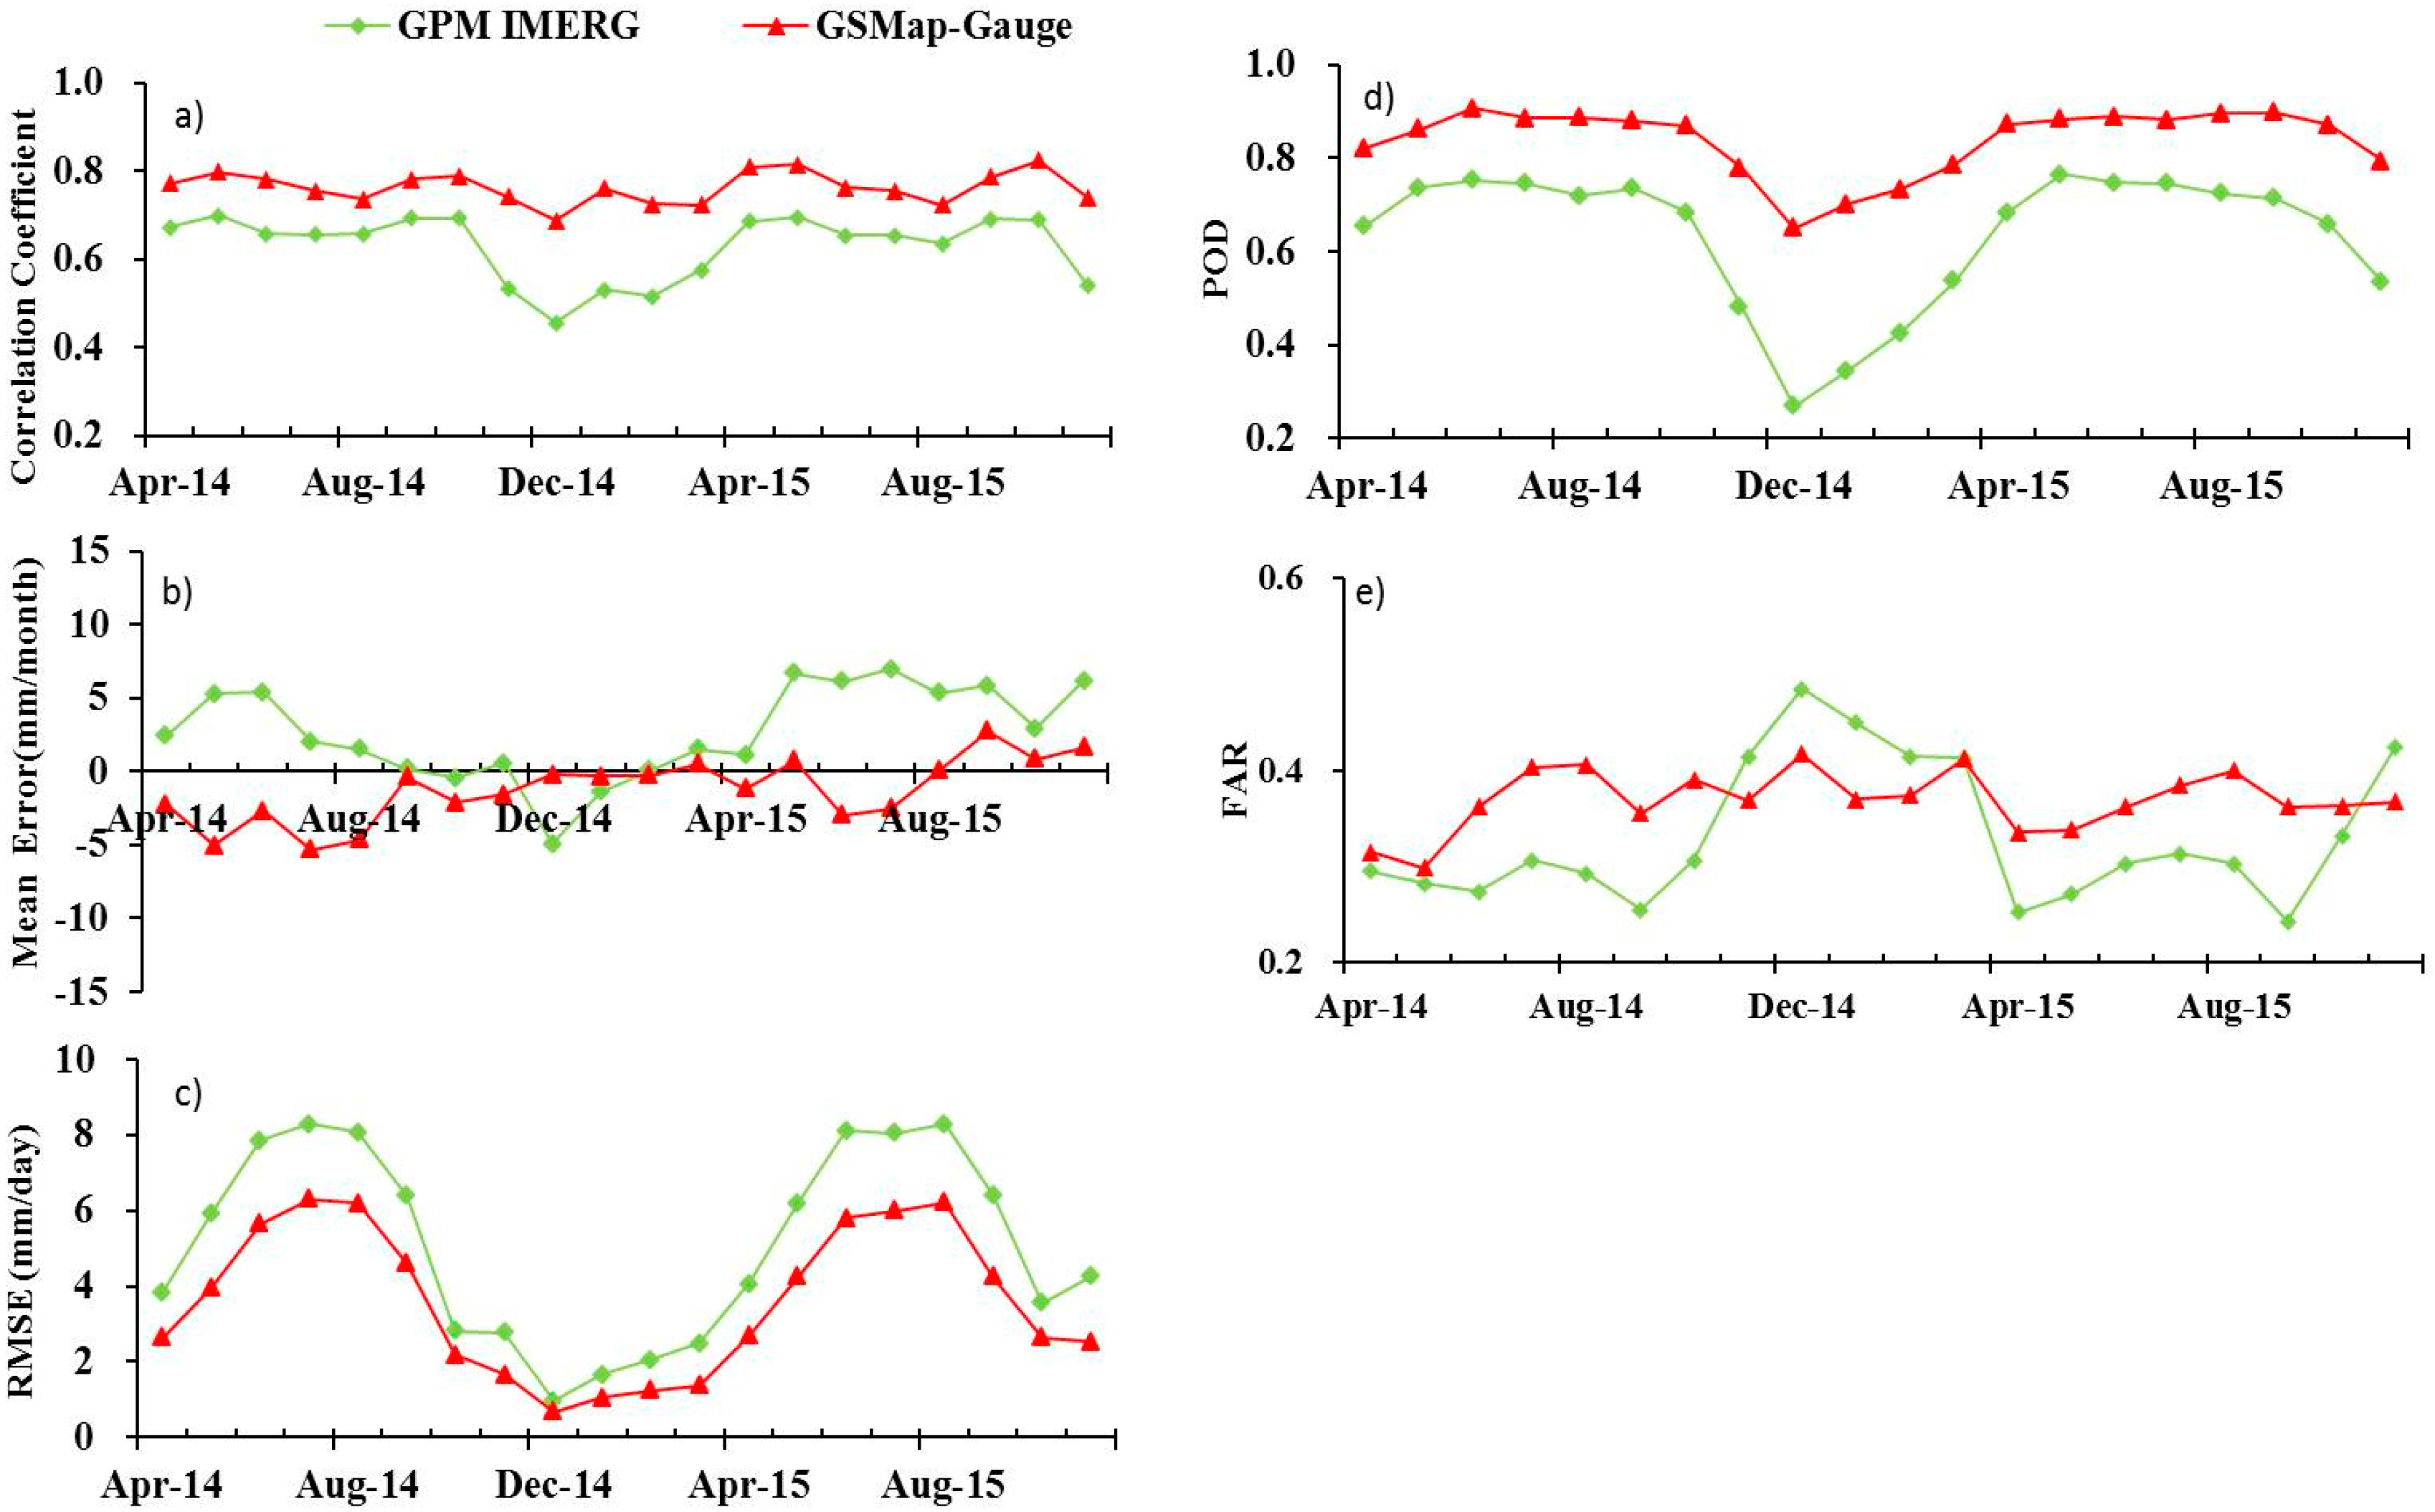
  • GSMap-Gauge exhibited very stable performance when analyzed on a monthly basis, with CC values indicating no significant seasonal variation. The pattern of monthly mean CC and POD for GPM IMERG showed seasonally-dependent variability, with relatively low values in winter. In terms of CC, RMSE, and POD, GSMap-Gauge performance was more stable and generally improved over GPM IMERG. GPM IMERG overestimated monthly precipitation during the rainy season; however, GSMap-Gauge showed the completely opposite trend by underestimating monthly precipitation in summer;
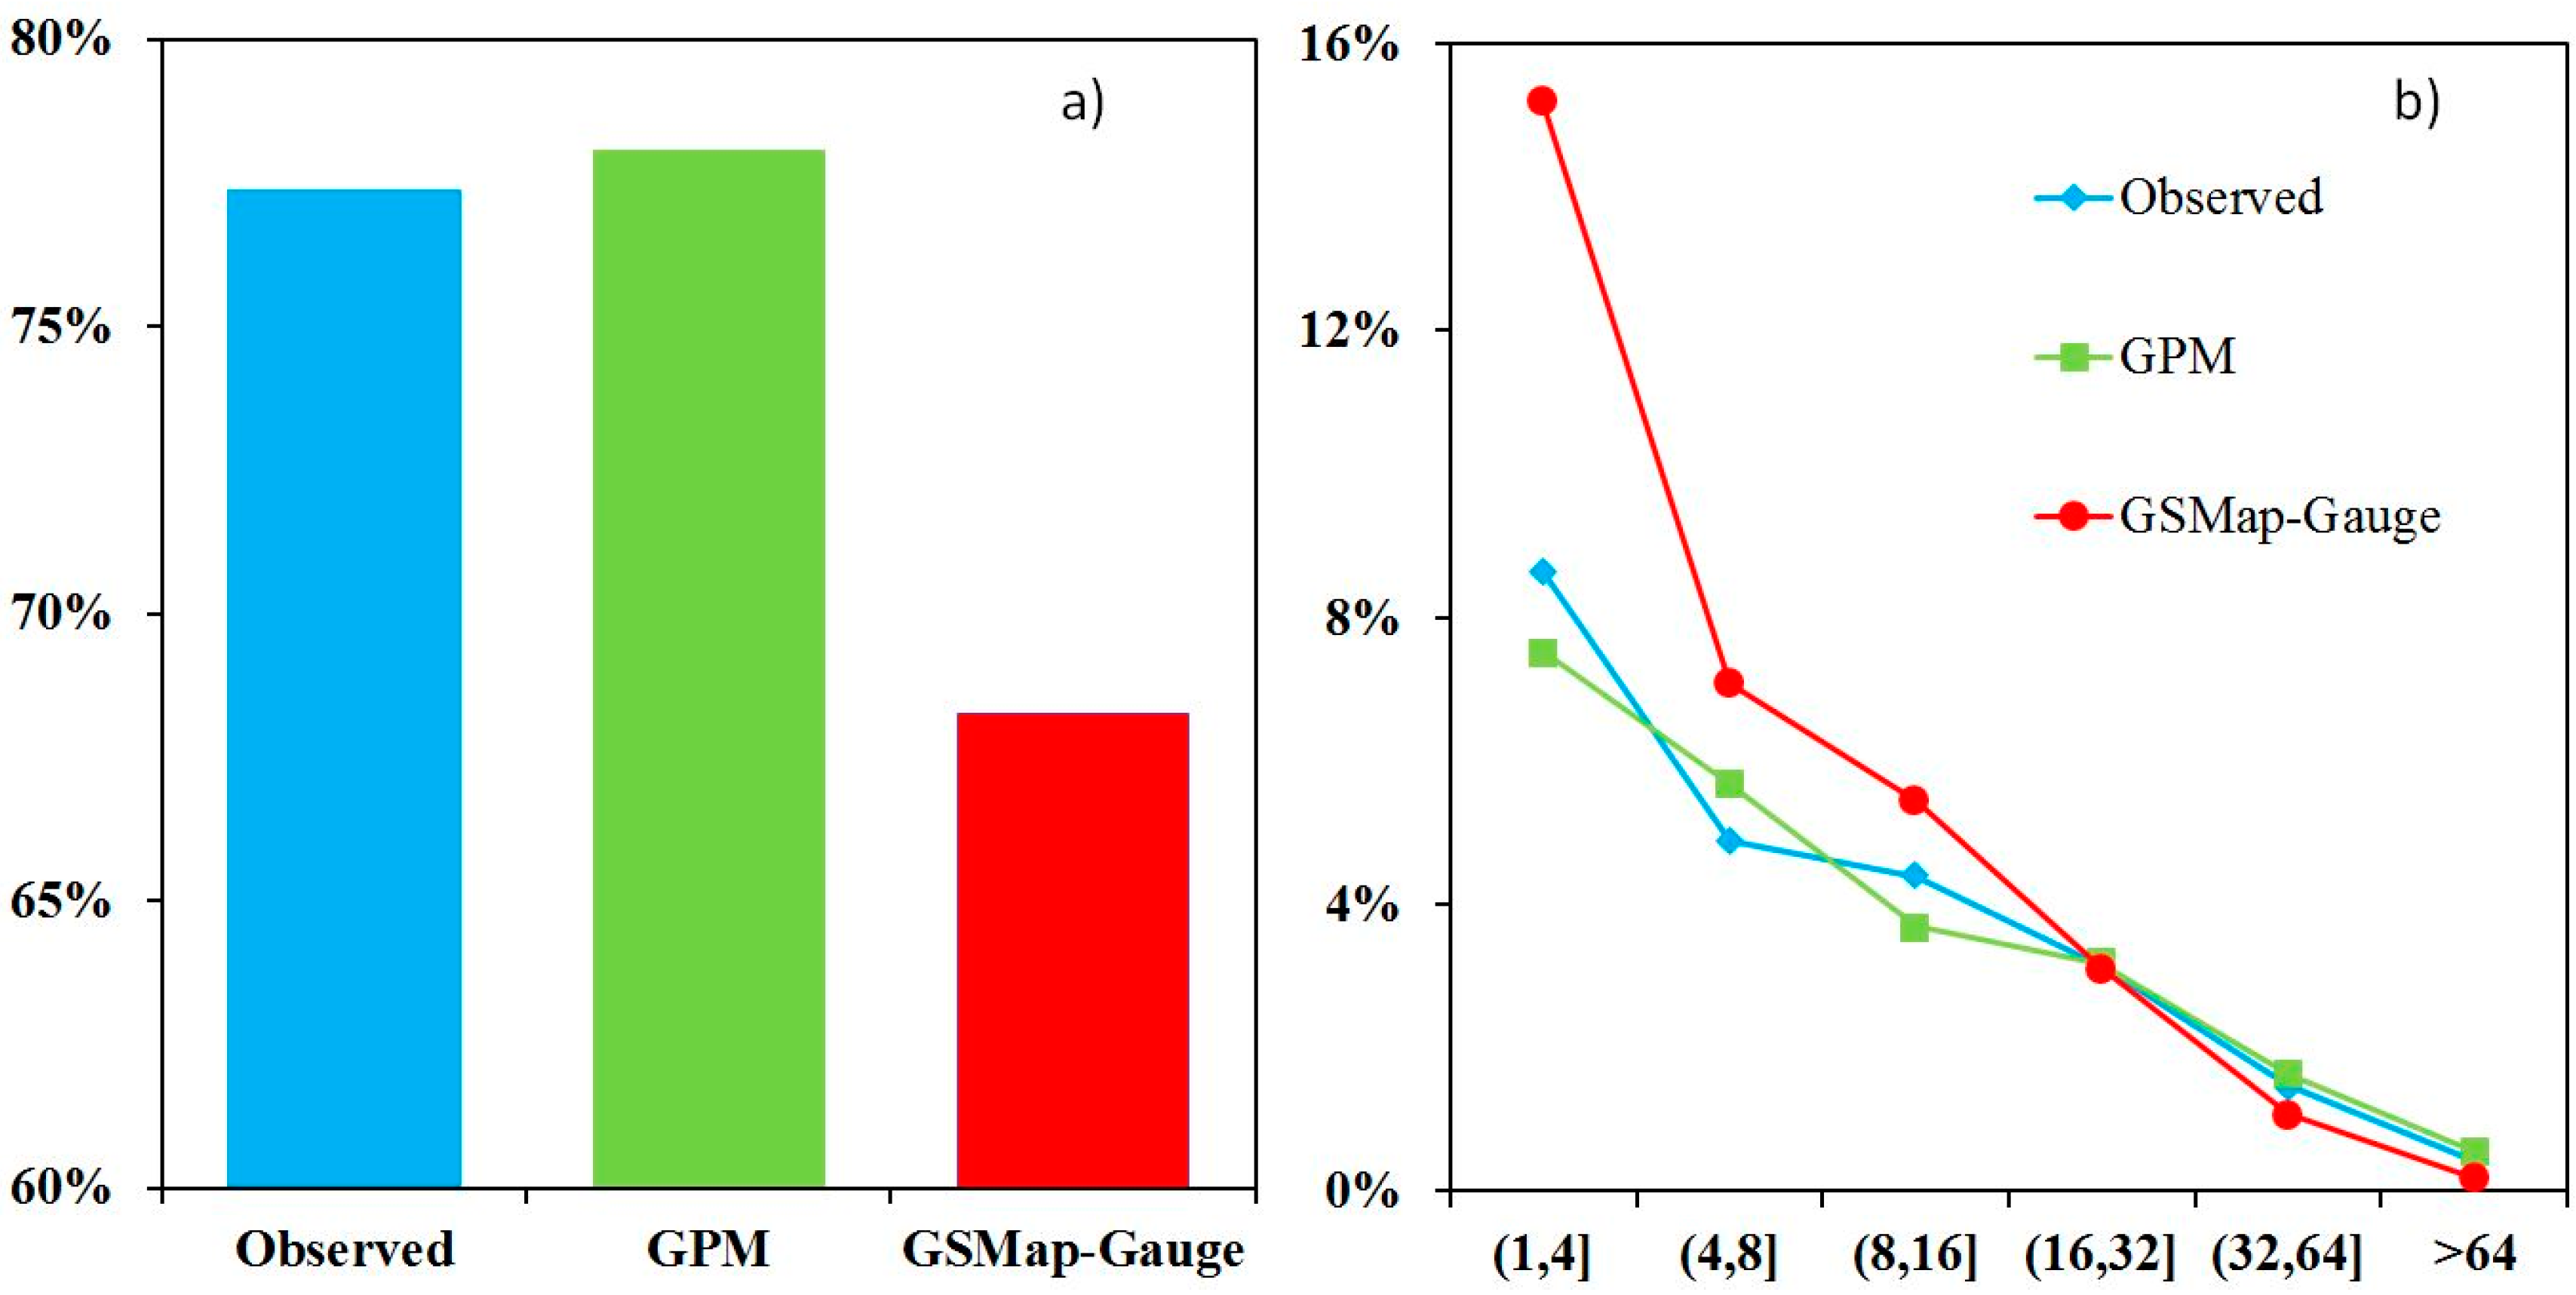
  • About 77% of events were reported by the observation gauge dataset to belong to no rain or light rainfall events (≤1 mm/day) during the 20 month study period. GPM IMERG produced a similar number of no rain and light rain events to the observation gauge dataset, with only a 1% overestimation. The GSMap-Gauge greatly underdetected the occurrence of no rain and light rain events (about 10% lower than observations). GPM IMERG performance for capturing precipitation events in the range of 1–16 mm/day was clearly variable, both overestimating and underestimating events at times. GSMap products captured more precipitation events within the precipitation range of 1–16 mm/day and showed slight underestimation of precipitation events of more than 32 mm/day;
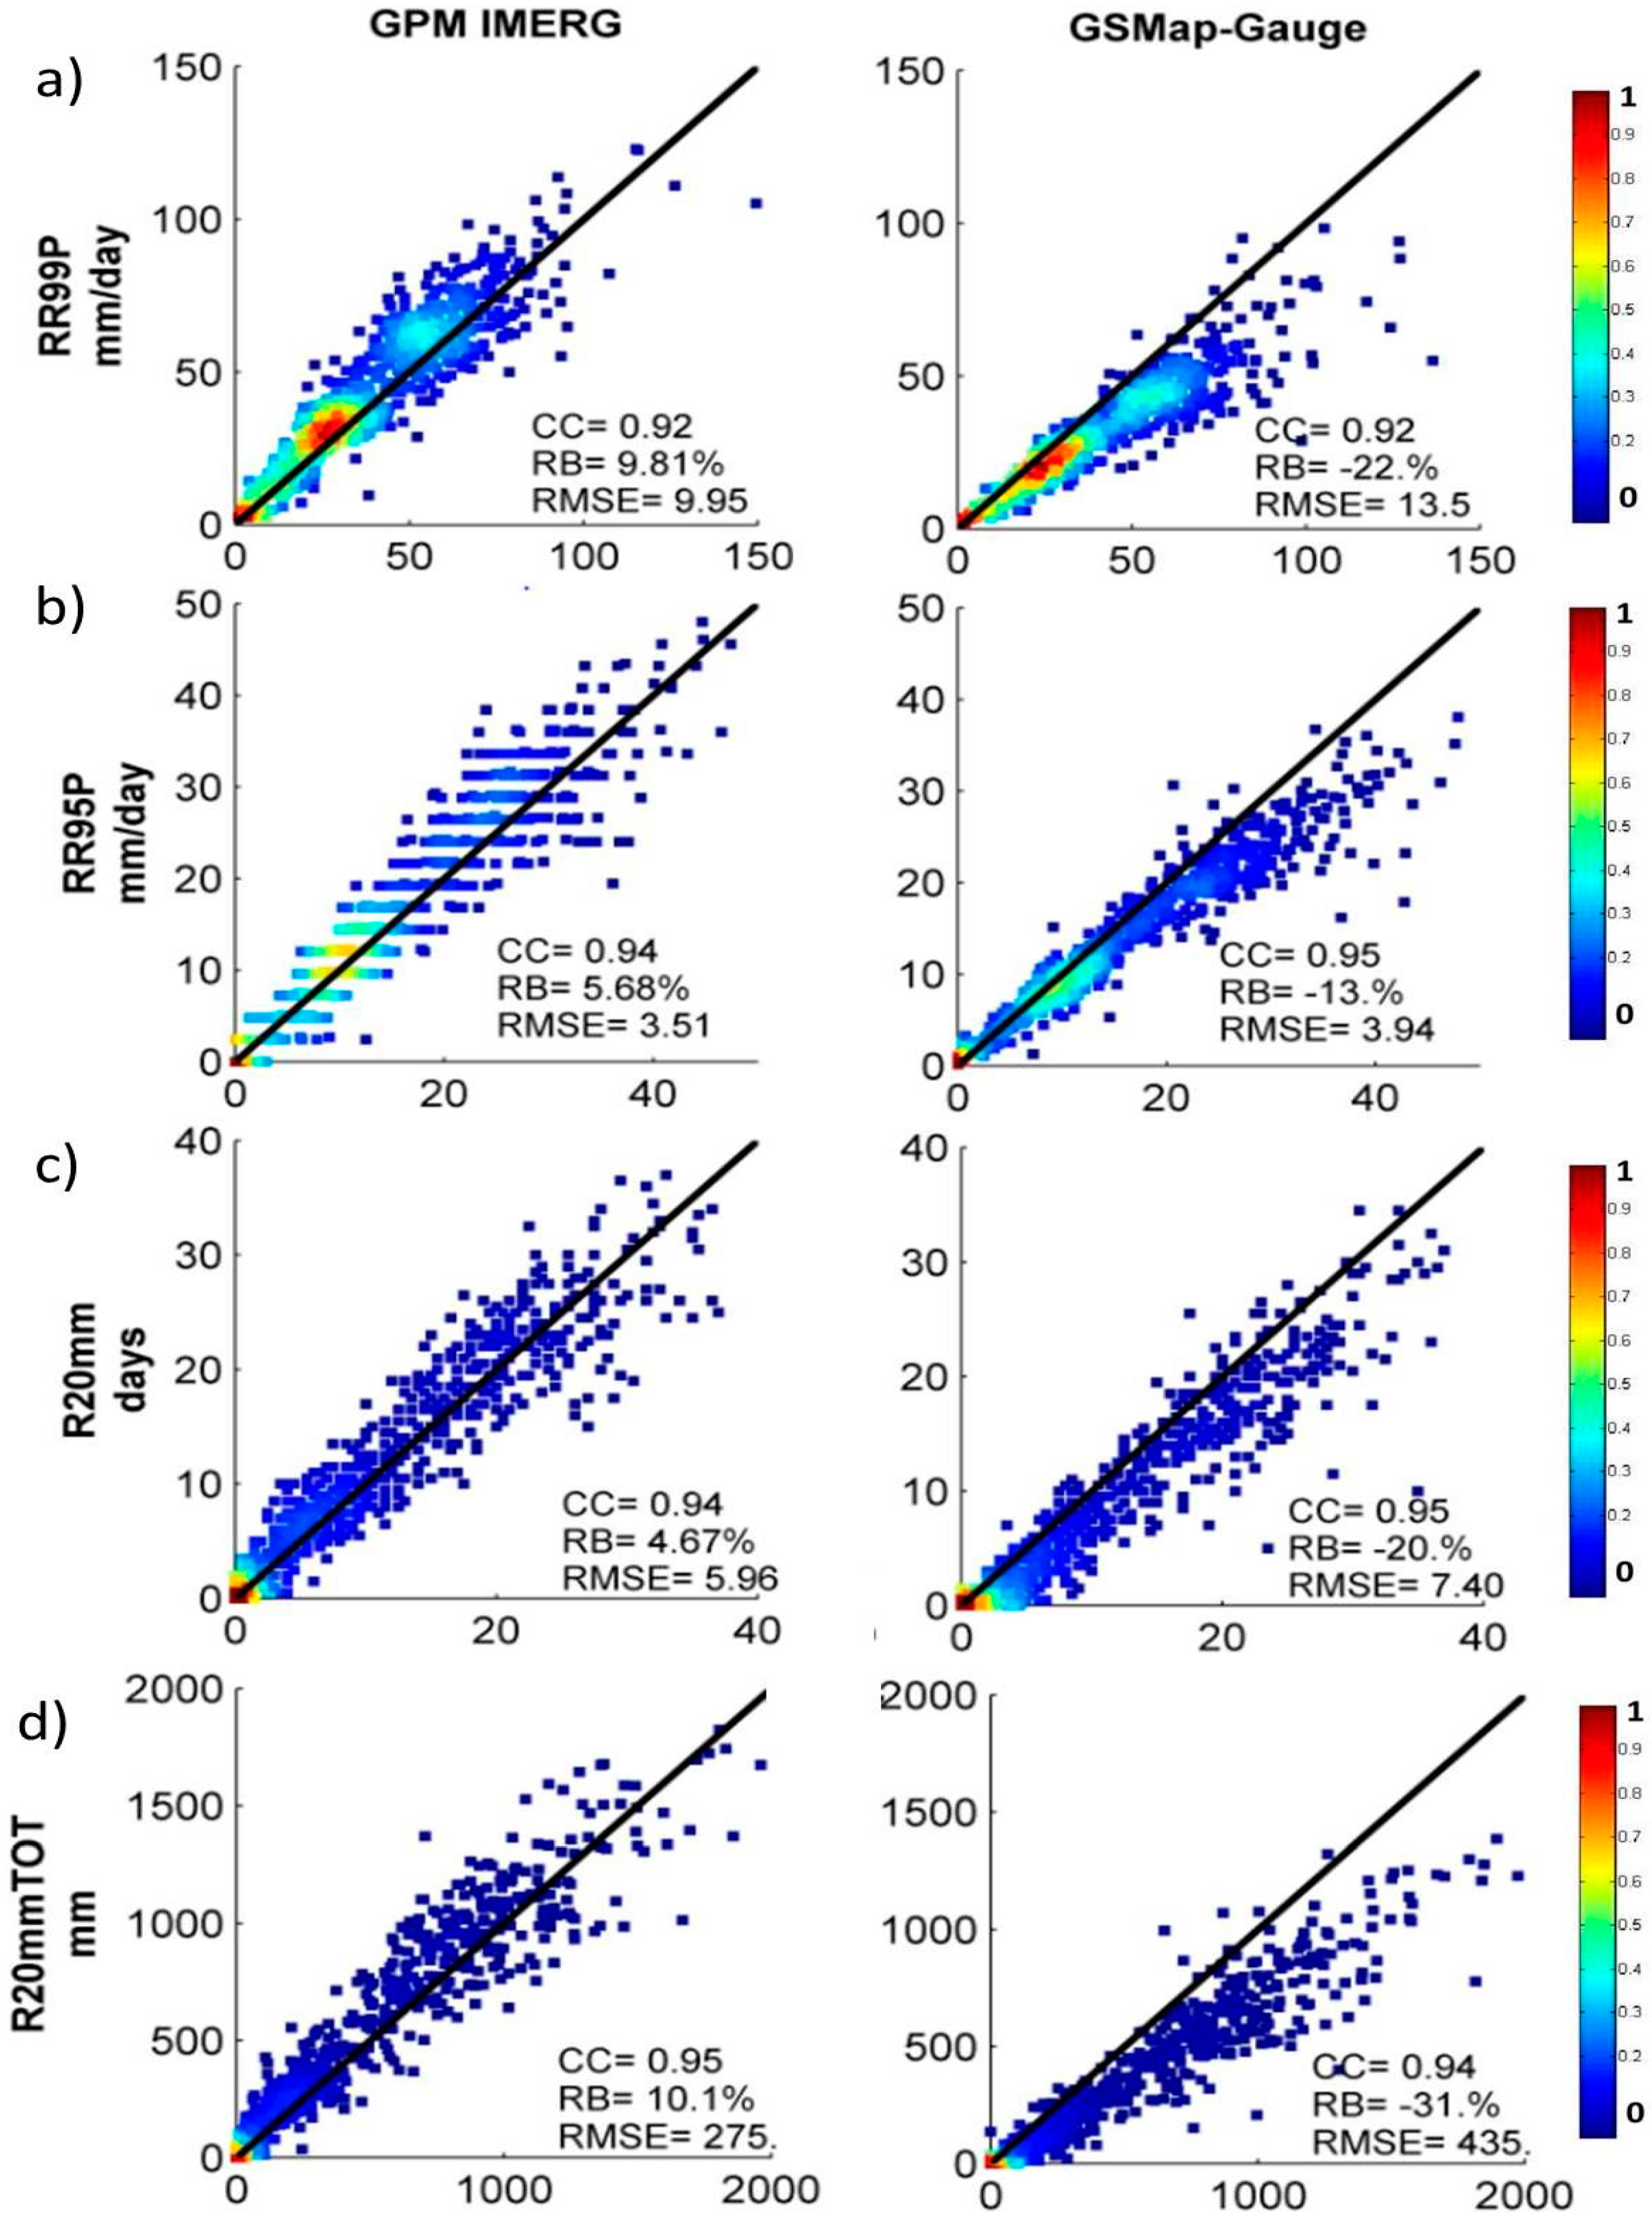
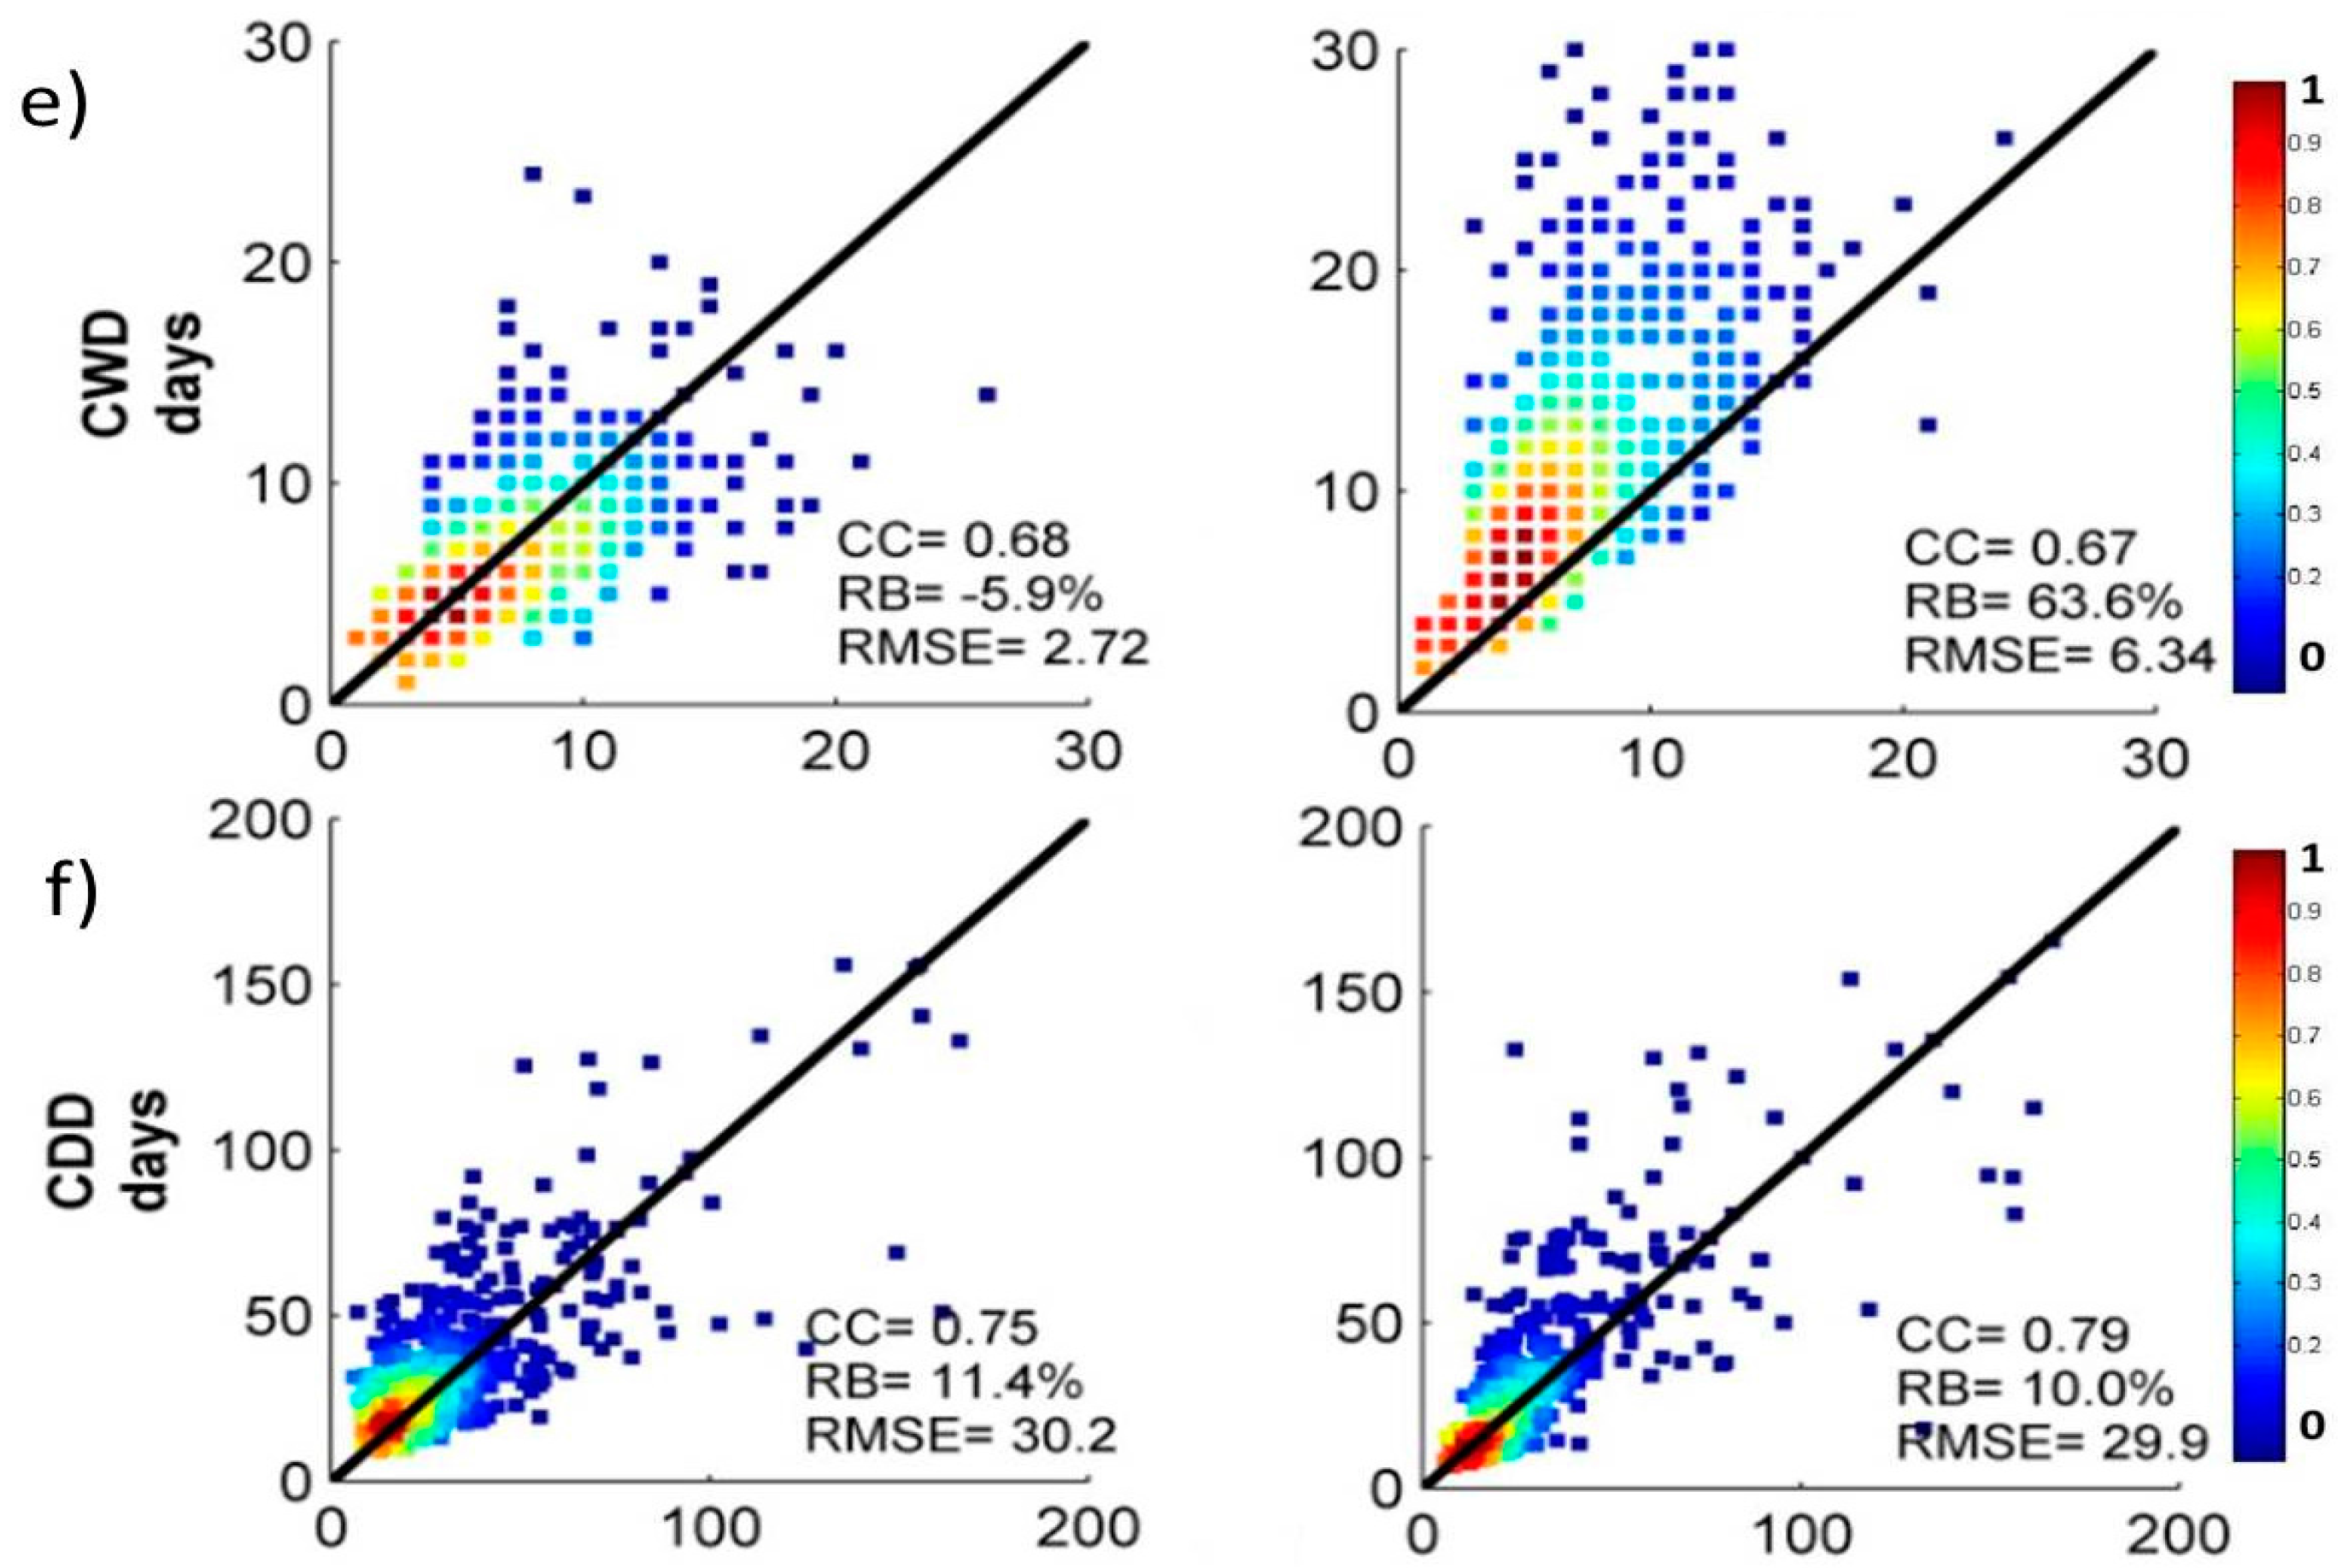
  • Both products captured the four indices (RR99P, RR95P, R20mm, and R20mmTOT) well with high correlation coefficients (>0.8). GPM IMERG tended to overestimate these four indices, with RB values of 9.81%, 5.68%, 4.67% and 10.1%, respectively. On the contrary, GSMap-Gauge showed significant underdetection of these indices, even when CC values were greater than 0.92. GSMap-Gauge significantly overestimated CWD, with RB around 63.6%. For CDD, GPM IMERG and GSMap-Gauge provided similar results.
The identification and quantification of the performance of these two latest GPM-era high-resolution precipitation products (GPM IMERG and GSMap-Gauge Ver. 6) by this study should provide useful information on the uncertainty of the different satellite-based precipitation products in spatial and temporal terms. Further comprehensive work is needed to make decisions about whether, and how, these products should be further processed so that they can be better utilized in specific areas of research.

Supplementary Materials

The following are available online at www.mdpi.com/2073-4441/8/11/481/s1.

Acknowledgments

We are very grateful to the scientists in the National Aeronautics and Space Administration (NASA) and Japan Aerospace Exploration Agency (JAXA) science team, who are responsible for the development of IMERG and GSMap algorithm and for providing satellite precipitation data. Thanks are also given to China Meteorological Administration for providing observation gauge data. This work was partially supported by the National Nature Science Foundation of China under Grant No. 51579059 and Higher Education Supporting Project of China under Grant No. JZ2016YYPY0065.

Author Contributions

Then manuscript was primarily written by Shaowei Ning, with Jie Wang contributing to its preparation and English check. Juliang Jin and Hiroshi Ishidaira supervised the research and critically reviewed the draft.

Conflicts of Interest

The authors declare no conflict of interests.

References

  1. Kidd, C.; Huffman, G. Global Precipitation measurement. Meteorol. Appl. 2011, 18, 334–353. [Google Scholar] [CrossRef]
  2. Su, Z.; Fernandez-Prieto, D.; Timmermans, J.; Chen, X.; Hungershoefer, K.; Roebeling, R.; Schroder, M.; Schulz, J.; Stammes, P.; Wang, P.; et al. Wolters First results of the earth observation Water Cycle Multi-Mission Observation Strategy (WACMOS). Int. J. Appl. Earth. Obs. Geoinf. 2014, 26, 270–285. [Google Scholar] [CrossRef]
  3. Ning, S.; Ishidaira, H.; Udmale, P.; Ichikawa, Y. Remote Sensing Based Analysis of Recent Variations in Water Resources and Vegetation of a Semi-Arid Region. Water 2015, 7, 6039–6055. [Google Scholar] [CrossRef] [Green Version]
  4. Anagnostou, E.N.; Maggioni, V.; Nikolopoulos, E.; Meskele, T.; Hossain, F.; Papadopoulos, A. Bench marking high-resolution global satellite rainfall products to radar and rain-gauge rainfall estimates. IEEE Trans. Geosci. Remote Sens. 2010, 48, 1667–1183. [Google Scholar] [CrossRef]
  5. Buarque, D.C.; De Paiva, R.C.D.; Clarke, R.T.; Mendes, C.A.B. A comparison of amazon rainfall characteristics derived from TRMM, CMORPH and the Brazilian national rain gauge network. J. Geophys. Res. Atmos. 2011, 116. [Google Scholar] [CrossRef]
  6. Chen, S.; Hong, Y.; Cao, Q.; Kirstetter, P.-E.; Gourley, J.J.; Qi, Y.; Zhang, J.; Howard, K.; Hu, J.; Wang, J. Performance evaluation of radar and satellite rainfalls for typhoon Morakot over Taiwan: Are remote-sensing products ready for gauge denial scenario of extreme events? J. Hydrol. 2013, 506, 4–13. [Google Scholar] [CrossRef]
  7. Hong, Y.; Chang, N.B. Hodges Global precipitation estimation and applications. In Multiscale Hydrologic Remote Sensing: Perspectives and Applications; CRC Press: Boca Raton, FL, USA, 2012. [Google Scholar]
  8. Hou, A.Y.; Kakar, R.K.; Neeck, S.; Azarbarzin, A.A.; Kummerow, C.D.; Kojima, M.; Oki, R.; Nakamura, K.; Iguchi, T. The Global Precipitation Measurement Mission. Bull. Am. Meteorol. Soc. 2014, 95, 701–722. [Google Scholar] [CrossRef]
  9. Kummerow, C.; Hong, Y.; Olson, W.; Yang, S.; Adler, R.; McCollum, J.; Ferraro, R.; Petty, G.; Shin, D.B.; Wilheit, T. The evolution of the Goddard Profiling Algorithm (GPROF) for rainfall estimation from passive microwave sensors. J. Appl. Meteorol. 2001, 40, 1801–1820. [Google Scholar] [CrossRef]
  10. Wilheit, T.T.; Chang, A.T.C.; Chiu, L.S. Retrieval of monthly rainfall indices from microwave radiometric measurements using probability distribution functions. J. Atmos. Ocean. Technol. 1991, 8, 118–136. [Google Scholar] [CrossRef]
  11. Huffman, G.J.; Bolvin, D.T.; Neklin, E.J.; Wolff, D.B.; Adler, R.F.; Gu, G.J.; Hong, Y.; Bowman, K.P.; Stocker, E.F. The TRMM Multisatellite Precipitation Analysis (TMPA): Quasi-global, multiyear, combined-sensor precipitation estimates at fine scales. J. Hydrometeorol. 2007, 8, 38–55. [Google Scholar] [CrossRef]
  12. Joyce, R.J.; Janowiak, J.E.; Arkin, P.A.; Xie, P. CMORPH: A method that produces global precipitation estimates from passive microwave and infrared data at high spatial and temporal resolution. J. Hydrometeorol. 2004, 5, 487–503. [Google Scholar] [CrossRef]
  13. Sorooshian, S.; Hsu, K.L.; Gao, X.; Gupta, H.V.; Imam, B.; Braithwaite, D. Braithwaite 2000: Evaluation of PERSIANN system satellite-based estimates of tropical rainfall. Bull. Am. Meteorol. Soc. 2000, 81, 2035–2046. [Google Scholar] [CrossRef]
  14. Hong, Y.; Hsu, K.L.; Sorooshian, S.; Gao, X. Precipitation estimation from remotely sensed imagery using an artificial neural network cloud classification system. J. Appl. Meteorol. 2004, 43, 1834–1852. [Google Scholar] [CrossRef]
  15. Turk, F.J.; Miller, S.D. Toward improved characterization of remotely sensed precipitation regimes with MODIS/AMSR-E blended data techniques. IEEE Trans. Geosci. Remote Sens. 2005, 43, 1059–1069. [Google Scholar] [CrossRef]
  16. Kubota, T.; Shige, S.; Hashizume, H.; Ushio, T.; Aonashi, K.; Kachi, M.; Okamoto, K. Global precipitation map using satellite-borne microwave radiometers by the GSMaP Project: Production and validation. IEEE Trans. Geosci. Remote Sens. 2007, 45, 2259–2275. [Google Scholar] [CrossRef]
  17. Sharifi, E.; Steinacker, R.; Saghafian, B. Assessment of GPM-IMERG and Other Precipitation Products against Gauge Data under Different Topographic and Climatic Conditions in Iran: Preliminary Results. Remote Sens. 2016, 8, 135. [Google Scholar] [CrossRef]
  18. Tang, G.; Zeng, Z.; Long, D.; Guo, X. Statistical and Hydrological Comparisons between TRMM and GPM Level-3 Products over a Midlatitude Basin: Is Day-1 IMERG a Good Successor for TMPA 3B42V7? J. Hydrometeorol. 2016, 17, 121–136. [Google Scholar] [CrossRef]
  19. Scheel, M.L.M.; Rohrer, M.; Huggel, C.; Villar, D.S.; Silvestre, E.; Huffman, G.J. Evaluation of TRMM Multi-satellite Precipitation Analysis (TMPA) performance in the Central Andes region and its dependency on spatial temporal resolution. Hydrol. Earth Syst. Sci. 2011, 15, 2649–2663. [Google Scholar] [CrossRef] [Green Version]
  20. Shen, Y.; Xiong, A.; Wang, Y.; Xie, P. Performance of high-resolution satellite precipitation products over China. J. Geophys. Res. Atmos. 2010, 115. [Google Scholar] [CrossRef]
  21. Shen, Y.; Xiong, A. Validation and comparison of a new gauge-based precipitation analysis over mainland China. Int. J. Climatol. 2016, 36, 252–265. [Google Scholar] [CrossRef]
  22. Tozer, C.R.; Kiem, A.S.; Verdon-Kidd, D.C. On the uncertainties associated with gridded rainfall data as a proxy for observed. Hydrol. Earth Syst. Sci. 2012, 16, 1481–1499. [Google Scholar] [CrossRef]
  23. King, A.D.; Alexander, L.V.; Donat, M.G. The efficiency of using gridded data to examine extreme rainfall characteristics: A case study for Australia. Int. J. Climatol. 2013, 33, 2376–2387. [Google Scholar] [CrossRef]
  24. Huffman, G.J.; Bolvin, D.T.; Braithwaite, D.; Hsu, K.; Joyce, R. Algorithm Theoretical Basis Document (ATBD) Version 4.5: NASA Global Precipitation Measurement (GPM) Integrated Multi-Satellite Retrievals for GPM (IMERG); NASA: Greenbelt, MD, USA, 2015.
  25. Huffman, G.J.; Bolvin, D.T.; Nelkin, E.J. Day 1 IMERG Final Run Release Notes; NASA Goddard Earth Sciences Data and Information Services Center: Greenbelt, MD, USA, 2015.
  26. Okamoto, K.; Takahashi, N.; Iwanami, K.; Shige, S.; Kubota, T. High precision and high resolution global precipitation map from satellite data. In Conference: Microwave Radiometry and Remote Sensing of the Environment, Florence, Italy, 11–14 April 2008.
  27. Aonashi, K.; Awaka, J.; Hirose, M.; Takayabu, Y. GSMaP passive microwave precipitation retrieval algorithm: Algorithm description and validation. J. Meteorol. Soc. Jpn. 2009, 87A, 119–136. [Google Scholar] [CrossRef]
  28. Ushio, T.; Sasashige, K.; Kubota, T.; Morimoto, T. A Kalman filter approach to the Global Satellite Mapping of Precipitation (GSMaP) from combined passive microwave and infrared radiometric data. J. Meteorol. Soc. Jpn. 2009, 87A, 137–151. [Google Scholar] [CrossRef]
  29. Xie, P.; Yatagai, A.; Chen, M.; Hayasaka, T.; Fukushima, Y.; Liu, C.; Yang, S. A gauge-based analysis of daily precipitation over East Asia. J. Hydrometeorol. 2007, 8, 607–626. [Google Scholar] [CrossRef]
  30. Biondi, D.G.; Freni, V.; Iacobellis, G.; Mascaro, A. Montanari Validation of hydrological models: Conceptual basis, methodological approaches and a proposal for a code of practice. Phys. Chem. Earth 2012, 42–44, 70–76. [Google Scholar] [CrossRef]
  31. Tank, A.M.G.K.; Zwiers, F.W.; Zhang, X. Guidelines on Analysis of Extremes in a Changing Climate in Support of Informed Decisions for Adaptation. In Climate Data and Monitoring; World Meteorological Organization: Geneva, Switzerland, 2009. [Google Scholar]
  32. Miao, C. Evaluation of the PERSIANN-CDR Daily Rainfall Estimates in Capturing the Behavior of Extreme Precipitation Events over China. J. Hydrometeorol. 2015, 17, 1387–1395. [Google Scholar] [CrossRef]
  33. Qin, Y.; Chen, Z.; Shen, Y.; Zhang, S.; Shi, R. Evaluation of Satellite Rainfall Estimates over the Chinese Mainland. Remote Sens. 2014, 6, 11649–11672. [Google Scholar] [CrossRef]
  34. Tian, Y.; Peters-Lidard, C.D.; Adler, R.F.; Kubota, T.; Ushio, T. Evaluation of GSMap precipitation estimates voer the contiguous United States. J. Hydrometeorol. 2010, 11, 566–574. [Google Scholar] [CrossRef]
  35. Dinku, T.; Chidzambwa, S.; Ceccato, P.; Connor, S.J. Validation and intercompariosn of satellite rainfall estimates over Colobia. J. Appl. Meteorol. Climatol. 2010, 49, 1004–1014. [Google Scholar] [CrossRef]
  36. Guo, H.; Chen, S.; Bao, A.; Hu, J.; Yang, B.I.; Phillip, M. Stepanian Comprehensive Evaluation of High-Resolution Satellite-Based Precipitation Products over China. Atmosphere 2016, 7, 6. [Google Scholar] [CrossRef]
  37. Guo, H.; Chen, S.; Bao, A.; Hu, J.; Gebregiorgis, A.S.; Xue, X.; Zhang, X. Inter-comparison of High-Resolution Satellite Precipitation Products over Central Asia. Remote Sens. 2015, 7, 7181–7211. [Google Scholar] [CrossRef]
  38. Dinku, T.; Chidzambwa, S.; Ceccato, P.; Connor, S.J.; Ropelewski, C.F. Validation of high-resolution satellite rainfall products over complex terrain. Int. J. Remote Sens. 2008, 29, 4097–4110. [Google Scholar] [CrossRef]
  39. Li, X.; Zhang, Q.; Xu, C.Y. Assessing the performance of satellite-based precipitation products and its dependence on topography over Poyang Lake basin. Theor. Appl. Climatol. 2014, 115, 713–729. [Google Scholar] [CrossRef]
  40. Qi, W.; Zhang, C.; Fu, G.; Sweetapple, C.; Zhou, H. Evaluation of global fine-resolution precipitation products and their uncertainty quantification in ensemble discharge simulations. Hydrol. Earth Syst. Sci. 2016, 20, 903–920. [Google Scholar] [CrossRef] [Green Version]
  41. Prakash, S.; Mitra, A.K.; Pai, D.S.; Aghakouchak, A. From TRMM to GPM: How well can heavy rainfall be detected from space? Adv. Water Resour. 2016, 88, 1–7. [Google Scholar] [CrossRef]
  42. Zhong, L. Comparison of integrated multisatellite retrieval for GPM (IMERG) and TRMM multisatellite precipitation analysis (TMPA) monthly precipitation products: initial results. J. Hydrometeorol. 2016, 17, 777–790. [Google Scholar]
  43. Maussion, F.; Scherer, D.; Molg, T.; Collier, E.; Curio, J.; Finkelnburg, R. Precipitation seasonality and variability over the Tibetan Plateau as resolved by the High Asia Reanalysis. J. Clim. 2014, 27, 1910–1927. [Google Scholar] [CrossRef]
Figure 1. Distribution of rain gauge stations over the Chinese mainland used in this study.
Water 08 00481 g001
Figure 2. Taylor diagram for GPM IMERG versus GSMap-Gauge.
Water 08 00481 g002
Figure 3. Distribution of CC between different satellite-based products and precipitation gauge data over the Chinese mainland: (a) GPM IMERG; (b) GSMap-Gauge.
Water 08 00481 g003
Figure 4. Distribution of daily mean precipitation over the Chinese mainland from April 2014 to November 2015. Units are mm/day. (a) CGDPA; (b) GPM IMERG; and (c) GSMap-Gauge.
Water 08 00481 g004
Figure 5. Density-colored scatterplots of the various products, (a) GPM IMERG; (b) GSMap-Gauge, against the 840 observed precipitation gauge stations. The dark solid line is the 1:1 line of total agreement. The color represents the occurrence possibility and red indicates that a high percentage of total points are located in that area.
Water 08 00481 g005
Figure 6. Monthly time series of (a) CC; (b) ME; (c) RMSE; (d) POD; and (e) PAR.
Water 08 00481 g006
Figure 7. (a) The frequency distribution of daily precipitation by occurrence for no rain and light rain (≤1 mm/day) case; (b) The frequency distribution of daily precipitation by occurrence for the different intensities. Only grids containing at least one gauge station and for which both the reference and the satellite estimates were not missing were selected for calculation.
Water 08 00481 g007
Figure 8. Density-colored scatterplots of six extreme precipitation indices for two satellite-based products throughout China, (a) RR99P; (b) RR95P; (c) R20mm; (d) R20mmTOT; (e) CWD; (f) CDD. The dark solid line is the 1:1 line. As in Figure 5, the color represents the occurrence possibility and red indicates more points that are located in that domain.
Water 08 00481 g008aWater 08 00481 g008b
Table 1. Brief summary of the two latest satellite-based precipitation products used in this study.
NameTemporal ResolutionSpatial ResolutionRegionPeriodCorrected by Gauges
GPM IMERG0.5 h0.1°60° N–Sfrom Mar. 2014Yes (GPCC monthly)
GSMap-Gauge (ver. 6)1 h0.1°60° N–Sfrom Mar. 2014Yes (CPC daily)
Table 2. List of the statistical metrics used in the statistical evaluation.
Statistic MetricEquationPerfect Value
Correlation Coefficient (CC) CC = 1 N n = 1 N ( f n f ¯ ) ( r n r ¯ ) σ f σ n 1
Mean Error (ME) ME = 1 N n = 1 N ( f n r n ) 0
Relative Bias (RB) RB = 1 N n = 1 N ( f n r n ) n = 1 N r n × 1 0
Root Mean Square Error (RMSE) RMSE = 1 N n = 1 N ( f n r n ) 2 0
Notes: Variables: n, number of samples; fn, a test field of f representing a satellite precipitation estimate; rn, a reference field r that stands for precipitation gauge values.
Table 3. Contingency table for evaluating precipitation occurrence by satellite products.
Satellite Products
Rain GaugeYesNo
Hits (a)Misses (c)
False alarms (b)Correct negative (d)
Table 4. Extreme precipitation indices used in the analysis.
CategoryIDDefinitionUnit
Percentile indicesRR99pThe 99th percentile of daily precipitation on wet days (Pre. ≥1 mm)mm/day
RR95pThe 95th percentile of daily precipitation on wet daysmm/day
Absolute threshold indicesR20mmAnnual count of days when daily precipitation is ≥20 mmdays
R20mmTOTAnnual total precipitation when daily precipitation is ≥20 mmmm/day
Max indicesCWDAnnual largest number of consecutive days with daily precipitation ≥1 mmdays
CDDAnnual largest number of consecutive days with daily precipitation <1 mmdays
Table 5. Validation statistics of the two precipitation estimates over mainland China from April 2014 to November 2015.
NameME (mm/Day)RMSE (mm/Day)CCPODFAR
GPM IMERG0.096.430.680.790.30
GSMap-Gauge (ver. 6)−0.044.700.790.870.37

