Article

Flood Reduction in Urban Drainage Systems: Cooperative Operation of Centralized and Decentralized Reservoirs

1
School of Civil, Environmental and Architectural Engineering, Korea University, 306, Eng. Building, Anam-dong, Seongbuk-gu, Seoul 02841, Korea
2
Department of Civil Engineering, Dongshin University, Naju 520-714, Korea
3
Research Center for Disaster Prevention Science and Technology, Seoul 02841, Korea
*
Author to whom correspondence should be addressed.
Water 2016, 8(10), 469; https://doi.org/10.3390/w8100469
Submission received: 5 July 2016 / Revised: 13 October 2016 / Accepted: 17 October 2016 / Published: 22 October 2016
(This article belongs to the Special Issue Water Systems towards New Future Challenges)

Abstract

:
Failure of drainage systems leads to urban flooding; therefore, structural measures such as the installation of additional drainage facilities, including pump stations and detention reservoirs, have been adopted in the past to prevent and mitigate urban flooding. These measures, however, are costly and time consuming. To maximize flood mitigation efficiency, it is essential to also implement non-structural measures such as effective operation of drainage facilities. In this study, we propose a new cooperative operation scheme for urban drainage systems that involves linking centralized reservoir (CR) and decentralized reservoir (DR) operations by sharing water level information at monitoring nodes. Additionally, we develop a resilience index to assess the system's ability to mitigate, restore, and recover from inundation (i.e., failure). Most results show that flood reduction and resilience in cooperative operations are better than the current operation. However, the results of CR operation for 2010 are worse than the current operation at high monitoring node levels (1.4 m–1.5 m), and the results of DR operation for 2011 are worse than the current operation at low monitoring node levels (0.8 m–0.9 m). All results related to flood reduction and resilience in cooperative operation are superior to the current operation.

1. Introduction

In urban areas, various drainage facilities such as pump stations and detention reservoirs have been constructed. Pump stations can prevent the backwater effect in urban streams that leads to flooding in drainage systems. Detention reservoirs can reduce the peak discharge in urban drainage systems. It is difficult, however, to prevent flooding due to extreme rainfall, even though all drainage facilities are designed and constructed using the concept of design flood frequency [1]. Both structural and non-structural measures can be implemented to prevent and reduce flooding. Structural measures are any physical construction used to reduce or avoid possible impacts of flooding, as well as engineering techniques used to achieve flood-resistance and resilience in urban drainage systems. Non-structural measures are any measure not involving physical constructions, which use knowledge or practical operation to reduce flood risks.
Currently, however, drainage facilities are not as effective as expected due to a greater amount of extreme rainfall, impervious areas, and runoff in urban areas. Non-structural measures such as rainfall prediction, flood forecasting, and drainage facility operation have emerged as a new alternative that can support structural measures [2].
Recently, significant attention has been paid to studies on the effectiveness of pump stations and detention reservoirs for disaster prevention. Studies of detention reservoirs have included: optimization of detention facilities using multi-objective genetic algorithms (MOGA) [3], determination of reservoir detention capacity [4], and stochastic rainfall analysis for storm tank performance evaluation in urban drainage systems [5,6]. Studies on reservoir location, parameters, and optimal design capacity have drawn a lot of attention [7,8]. In addition, pump station studies have focused on: the operation of prediction-based rainwater pump stations in urban basins [9], generalized methods for storm water pumping station design [10], and the real time operation of rainwater pump stations [11]. There have also been studies on drainage systems in urban basins, including the assessment of urban drainage system resilience using a hydraulic assessment model [12], and an investigation of the relationships between precipitation and floods [13].
Many studies have investigated the design/operation of rainwater pump stations and the capacity/location of detention reservoirs; however, there have been no previous studies on the cooperative operation of pump stations and detention reservoirs. Cooperative operation is advantageous as pump stations and detention reservoirs are a part of the catchment system and their operation may drastically affect water levels and flooding in the drainage network. This study investigates the cooperative operation of pump stations and detention reservoirs, which are non-structural measures that can compensate for the time-consuming and costly nature of structural measures. Drainage pumps at pump stations and detention reservoirs are operated on the basis of centralized reservoirs (CR) and decentralized reservoirs (DR), with monitoring nodes that consider the drainage system situation and implement cooperative operation when necessary. To maximize flood sharing between each drainage facility, cooperative operation is performed on the basis of the water levels in the pump stations, drainage system, and detention reservoirs. CR operation can improve rapid drainage effectiveness and DR operation can increase detention effectiveness. Cooperative operation between CR and DR combines the advantages of CR/DR operation and effective flood mitigation in urban drainage areas. In addition, we propose and apply the resilience index as a standard for determining the condition of urban drainage systems.

2. Methods

The methodology used in this study consists of five parts. First, monitoring nodes for cooperative operation of drainage facilities are selected. Second, we perform CR operation based on monitoring node levels and review the resulting flood volume. The aim of CR operation is rapid urban area drainage and increased drainage effectiveness. Third, we perform DR operation based on monitoring node levels and review the resulting flood volume. The aim of DR operation is to obtain additional capacity in DR and improve detention effectiveness. Fourth, we review the operation of CR and DR based on monitoring node levels and compare the resulting flood volume with that of current drainage facility operations. The objective of cooperative operation between CR and DR combines the rapid drainage effectiveness of CR and the detention effectiveness of DR. Fifth, we use the resilience index to quantify how well each operation method mitigates the magnitude of failure (i.e., flooding) of the drainage system.

2.1. Overview

Two procedures are used in the selection of monitoring nodes for cooperative operation of drainage facilities. The first step identifies the node where overflow first occurs, and the second identifies nodes where the maximum overflow occurs. Each procedure is described below.
The first flooding node is determined using rainfall probability, as proposed by Huff [14], with selection of an appropriate quartile for the study basin. The Huff formula distributes rainfall in a selected quartile once the event duration is selected. The Storm Water Management Model (SWMM) is run with uniform rainfall depths, starting at 1 mm and increasing by 1 mm until flooding occurs. The node where the first flooding occurs is designated as one of the monitoring nodes. We continue to review the first flooding node as rainfall duration changes. We also identify the maximum flooding node using the Huff distribution.
There are four quartiles in the Huff distribution. Equations (1)–(4) are different from other regions because these are the ones available in Seoul (Korea Precipitation Frequency Data Server, www.k-idf.re.kr) [15]. The quartiles in the Huff distribution represent the peak values in the rainfall data. The appropriate quartile is selected for the study area from among the four quartiles of the Huff distribution, each of which has a different timing of peak rainfall. For example, the maximum value of the first quartile is located between 0% and 25% of the total rainfall duration. The maximum values of the second, third, and fourth quartiles are then located between 25% and 50%, 50% and 75%, and 75% and 100% of the total rainfall duration.
When an appropriate Huff quartile is selected for the basin, synthetic precipitation occurs according to frequency and duration times. Rainfall-runoff simulation depends on rainfall probability. The node with the highest flood volume is selected as the second monitoring node. In the study area of Seoul, the first, second, third and fourth Huff quartiles are determined using Equations (1)–(4), respectively.
y = 29.289 x 6 95.64 x 5 + 119.7 x 4 70.768 x 3 + 18.176 x 2 + 0.2426 x 0.0007
y = 38.505 x 6 + 118.93 x 5 132.67 x 4 + 60.815 x 3 + 8.3001 x 2 + 0.7296 x + 0.0005
y = 37.835 x 6 106.21 x 5 + 105.18 x 4 44.549 x 3 + 9.1084 x 2 0.3603 x + 0.0005
y = 25.498 x 6 + 63.755 x 5 57.196 x 4 + 22.882 x 3 3.4377 x 2 + 0.4955 x 0.0002
where y indicates the accumulated rainfall ratio and x indicates the accumulated time ratio. The time ratio x is cumulative time divided by total rainfall duration. The rainfall ratio y is cumulative rainfall at time ratio x divided by total rainfall. The third quartile of the Huff distribution is selected to review the first and maximum flooding nodes in the target basin. Yoon et al. (2013) suggested that the third quartile in the Huff distribution is appropriate for South Korea [16]. Figure 1 describes the complete process for obtaining rainfall data using the Huff distribution.
Using the process in Figure 1, each rainfall event can be obtained using the Huff distribution. If the total rainfall amount is 100 mm and the duration is 90 min in the third quartile, we can obtain rainfall data using the Huff distribution and use it as input data for the rainfall-runoff model. The total rainfall amount is set to 11 mm, in 1 mm increasing intervals, if there is no flooding after simulation of the rainfall-runoff model. This process is repeated until there is flooding in one node. We call this node the first flooding node.
SWMM, developed by the United States Environmental Protection Agency (US-EPA) in 1971, was used to simulate the rainfall-runoff process and to investigate the first and maximum flooding nodes. SWMM has been developed to simulate the flow volume and water quality within urban drainage systems. SWMM can be used for planning, analysis, and design related to stormwater runoff, combined/sanitary sewers, and other drainage systems in urban areas. Furthermore, it can be used in rural area simulations. It is a comprehensive model that can be used to simulate runoff volume caused by rainfall events and runoff of pollutants in surface and sewer pipes, to trace runoff volume in sewer distribution networks, and to calculate retained volume [17]. Users can select either steady-flow routing, kinematic wave routing, or dynamic wave routing as flow routing options in SWMM.
We analyze the flooding that is contingent on CR operation on the basis of monitoring node levels. When the level at the monitoring node indicates possible flooding of sewer conduits, the backwater effect caused by high CR water level is minimized by operation of drainage pumps in order to reduce the burden on sewer conduits. Thus, flooding is reduced through early operation of pump station drainage pumps to minimize CR levels.
We applied the method of Lee et al. to DR operation analysis based on monitoring node levels [18]. One of the weaknesses of urban detention reservoirs is a vulnerability to continuous rainfall. To counter this, we secure additional space in the DR by operating drainage pumps if the sewer conduit levels, identified by the monitoring node, are low. However, if the level of the DR is higher than the limit (discharge level), discharge in the DR is initiated whilst current drainage facility operations are performed.
We also evaluate cooperative operation of CR and DR based on monitoring node levels. Discharge released in order to secure additional space in the DR is transported to the CR at the basin outlet through the drainage system. Backwater effects of the CR are reduced by early discharge of reserved water. The ultimate goal of cooperative operation is to reduce inundation in urban areas. This is achieved through efficient sharing of flood discharge by linking the operation of drainage facilities, such as upstream detention reservoirs in drainage areas, with other drainage facilities, such as downstream pump stations. In addition, we develop a resilience index to quantify the ability of the system to mitigate inundation (i.e., system failure), and then quantitatively compare current and new operational approaches of drainage facilities. Resilience of drainage systems can be calculated on the basis of patterns from flooding to recovery. Figure 2 summarizes the cooperative operation approach used in our study.

2.2. Components of Urban Drainage Systems in Korea

The pump stations that are currently installed and operational in Korea are divided into two types; those with and without CR. Pump stations without CR are usually installed in small basins that have low maximum inflow, and pump stations with CR are installed in large basins with high maximum inflow. In addition, gate pump stations have recently been introduced, but these are largely limited to basins without CR. The structure of a typical pump station with CR is shown in Figure 3.
For each CR in pump stations, a High Water Level (HWL) and a Low Water Level (LWL) are defined. The initial and total operating levels for drainage pumps are determined between the LWL and the HWL (Figure 3). The LWL is above the base of the CR and the initial operating level is higher than the LWL in order to prevent cavitation of drainage pumps, which may occur when there is no CR inflow.
The DR is located in the midstream and upstream; it is connected to sewer conduits or rivers, and is designed to reduce peak discharge (Figure 4). There are two types of DR, online and offline. An online DR is generally larger and is effective in continuous storms. However, due to its large capacity, it is difficult to install in urban areas. An offline DR is generally smaller, and is not so effective in continuous storms, but its small capacity makes it easy to install in urban areas.
Operation of the offline DR is controlled by inlet and outlet components. The height of the inlet weir directly affects DR operation and its capacity to retain runoff. However, once weir height is determined, there is no way to control inflow volume. With consideration of current design standards (only inflow which goes over the weir at a fixed height can be delivered), it is impossible to control inflow volume during operation. Thus, it is important to focus on controlling outflow volume in order to secure additional space within the DR. Using outflow control, the DR retains rainfall until the rainfall event ends, and then initiates runoff within a designed exclusion time or until the limit for drainage is reached. However, this operation has some disadvantages. As detention or drainage is performed without consideration of the condition of the sewer conduits, it is vulnerable to flooding. In addition, if it continues to rain, the DR retains the first peak inflow and is then full so cannot store additional inflow. To compensate for this, runoff is regulated according to the condition of the sewer distribution network in order to secure space for the first peak inflow as well as additional inflow.

2.3. Operation of Urban Drainage Facilities

Pump stations operate drainage pumps based on the level of the CR. The initial operating level of drainage pumps is set by taking into account cavitation and flood volume. When rainfall occurs, drainage pumps are activated if the CR reaches the initial operating level. After that, the operating level is determined by considering the capacity, number of drainage pumps, CR area, and effective depth. As the CR is operated on a fixed level basis, without considering sewer conduit conditions, it is not effective for reducing inundation.
For operation of the CR proposed in this study, we select monitoring nodes representative of the sewer distribution network (Figure 5). An early operation of drainage pumps at the pump station is determined by water levels at the monitoring nodes in order to maintain the minimum level required to prevent cavitation. Like the CR, the DR is operated independently of other urban drainage facilities. Offline DRs are installed within drainage systems in urban areas and drain only in two cases: first, when the level of the DR reaches full capacity (the limit level), discharge starts by operating drainage pumps; and second, when rainfall is deemed to have ended, runoff is initiated. However, as discussed in Section 2.2, the system has some disadvantages. It is not straightforward to determine whether rainfall has ended. Moreover, when the discharge is released, the condition of the sewer conduits is not considered.
As explained above, current CR and DR operations run independently of each other and of the sewer conduits, and are not effective in reducing urban flooding or adapting during a heavy rainfall event. Cooperative operation of the facilities, involving connecting the DR to the sewer conduits and to the CR, is essential in order to address urban flooding. In order to operate them as one system, the condition of the sewer conduits is examined in real time on the basis of levels at the monitoring nodes (Figure 6).

2.4. Cooperative Operation of Urban Drainage Facilities

For the cooperative operation of urban drainage facilities, a cooperative operation of both the main and the sub pump station is performed. When the capacity of the main pump station is not sufficient to drain the outlet, the sub pump station is added. When natural drainage is carried out, the sewer is directed to the main pump station with a large CR. When drainage is forced using drainage pumps, flooding is mitigated by considering the capacity of each pump station (pump capacity + CR capacity). Such cooperative pump station functions are available when pump stations are connected with a DR through sewer conduits. Cooperative operation with a DR installed in the basin is not considered in this type of cooperative operation between pump stations.
For the cooperative operation of urban drainage facilities proposed in this study, the water level at monitoring nodes is selected on the basis of the early operating level of the CR and the pump stop level of the DR. When sewer conduit levels are elevated and reach the early operating level of the CR, pumps are operated and rainwater is rapidly drained. When the level reaches the pump stop level of the DR, drainage pumps are stopped to remove the burden on sewer conduits.
In this section, we describe three characteristics of cooperative operations between CR and DR in detail. These are: additional space in the DR; reduction of the backwater effect by CR; and flood mitigation of the DR/sewer conduits/CR. First, we can secure additional space in the DR by drainage, based on monitoring node levels. Moreover, we reduce the risk of floods caused by CR backwater effects by performing early drainage in pump stations based on monitoring node levels. In addition, controlling flow delivery based on performance of the DR, sewer conduits, and CR provides efficient flood-mitigation for the entire urban drainage network. As low water levels are maintained due to rapid drainage of urban drainage facilities, including pump stations and detention reservoirs, the CR and DR can be equipped with sufficient capacity to prevent floods caused by continuous rainfall (Figure 7). Cooperative operation is more effective for flood mitigation than both current and new drainage facility operations because of the detention effectiveness of DR, the rapid drainage effectiveness of CR, and the cooperation effectiveness of the monitoring nodes.

2.5. Resilience Index for Urban Drainage Systems

Many indicators have been proposed for quantifying the ability for urban drainage systems to mitigate flooding [19,20,21]. For example, House et al. (1993) suggested an index for receiving water impacts and making better judgments regarding the acceptable performance of CSO (Combined Sewer Overflows). Cembrano et al. (2004) used a performance index for reducing flooding and discharge pollution in containing gates and detention tanks of urban drainage systems. Mitchell (2005) proposed an urban catchment wetness index (UCWI) for mapping hazards related to non-point pollution in urban drainage system.
There are few studies applying the concept of a resilience index for the evaluation of urban drainage systems. Mugume et al. (2014) is the only study to propose a resilience index according to flood depth in urban drainage systems [12]. The resilience index for urban drainage systems evaluates their ability to recover from floods, and flood (failure)–restoration–recovery is considered as one process.
The resilience of urban drainage systems can be defined as the ability to prepare for, recover, and restore after facility malfunction and flooding (failure). For example, failure is defined as the occurrence of flooding in urban areas due to malfunctions of equipment, such as sudden power outages in pump stations and remote control system shut-down of water gates in pump stations. Figure 8 conceptually defines the resilience of a system as a function of failure depth and recovery time.
Resilience is calculated using the performance evaluation function, which is based on the variables of flood volume per minute, accumulated rainfall for a certain time until the present, and basin area. Values of the performance evaluation function range from 0 to 1. When there is no flooding in urban drainage facilities, the value is 1. Equation (5) gives the performance evaluation function u(T)i at the ith minute (arbitrary time).
u ( T ) i = max ( 0 , 1 F i R d × A u )      ( R d = i t c i R i )
where Fi is flood volume (m3), tc is time of concentration (min), Rd is accumulated rainfall during current time (t) and i − tc (10−3 m = mm), and Au is the basin unit area (10−8 m2 = 0.01 km2). High values of the performance evaluation function mean that the urban drainage system has a high ability to recover after flooding (failure) or minor system failure, and low values indicate a low ability to recover. The resilience of the entire urban drainage system is calculated as shown in Equation (6).
R s = 1 T n T 0 T n u ( T ) d T
where Rs is resilience of the entire system, T0 is the start time and Tn is the end time. In this study, we calculate and compare resilience of the current urban drainage system with the DR system and the cooperative system, including pump stations and detention reservoirs. For validation with experimental/measured in-situ data, measurement of the flooding area and flooding depth by aerial photography is essential. Nowadays, drones are employed for this; however, there are several associated problems such as high costs and inaccuracy of measured data.

3. Applications and Results

3.1. Study Area

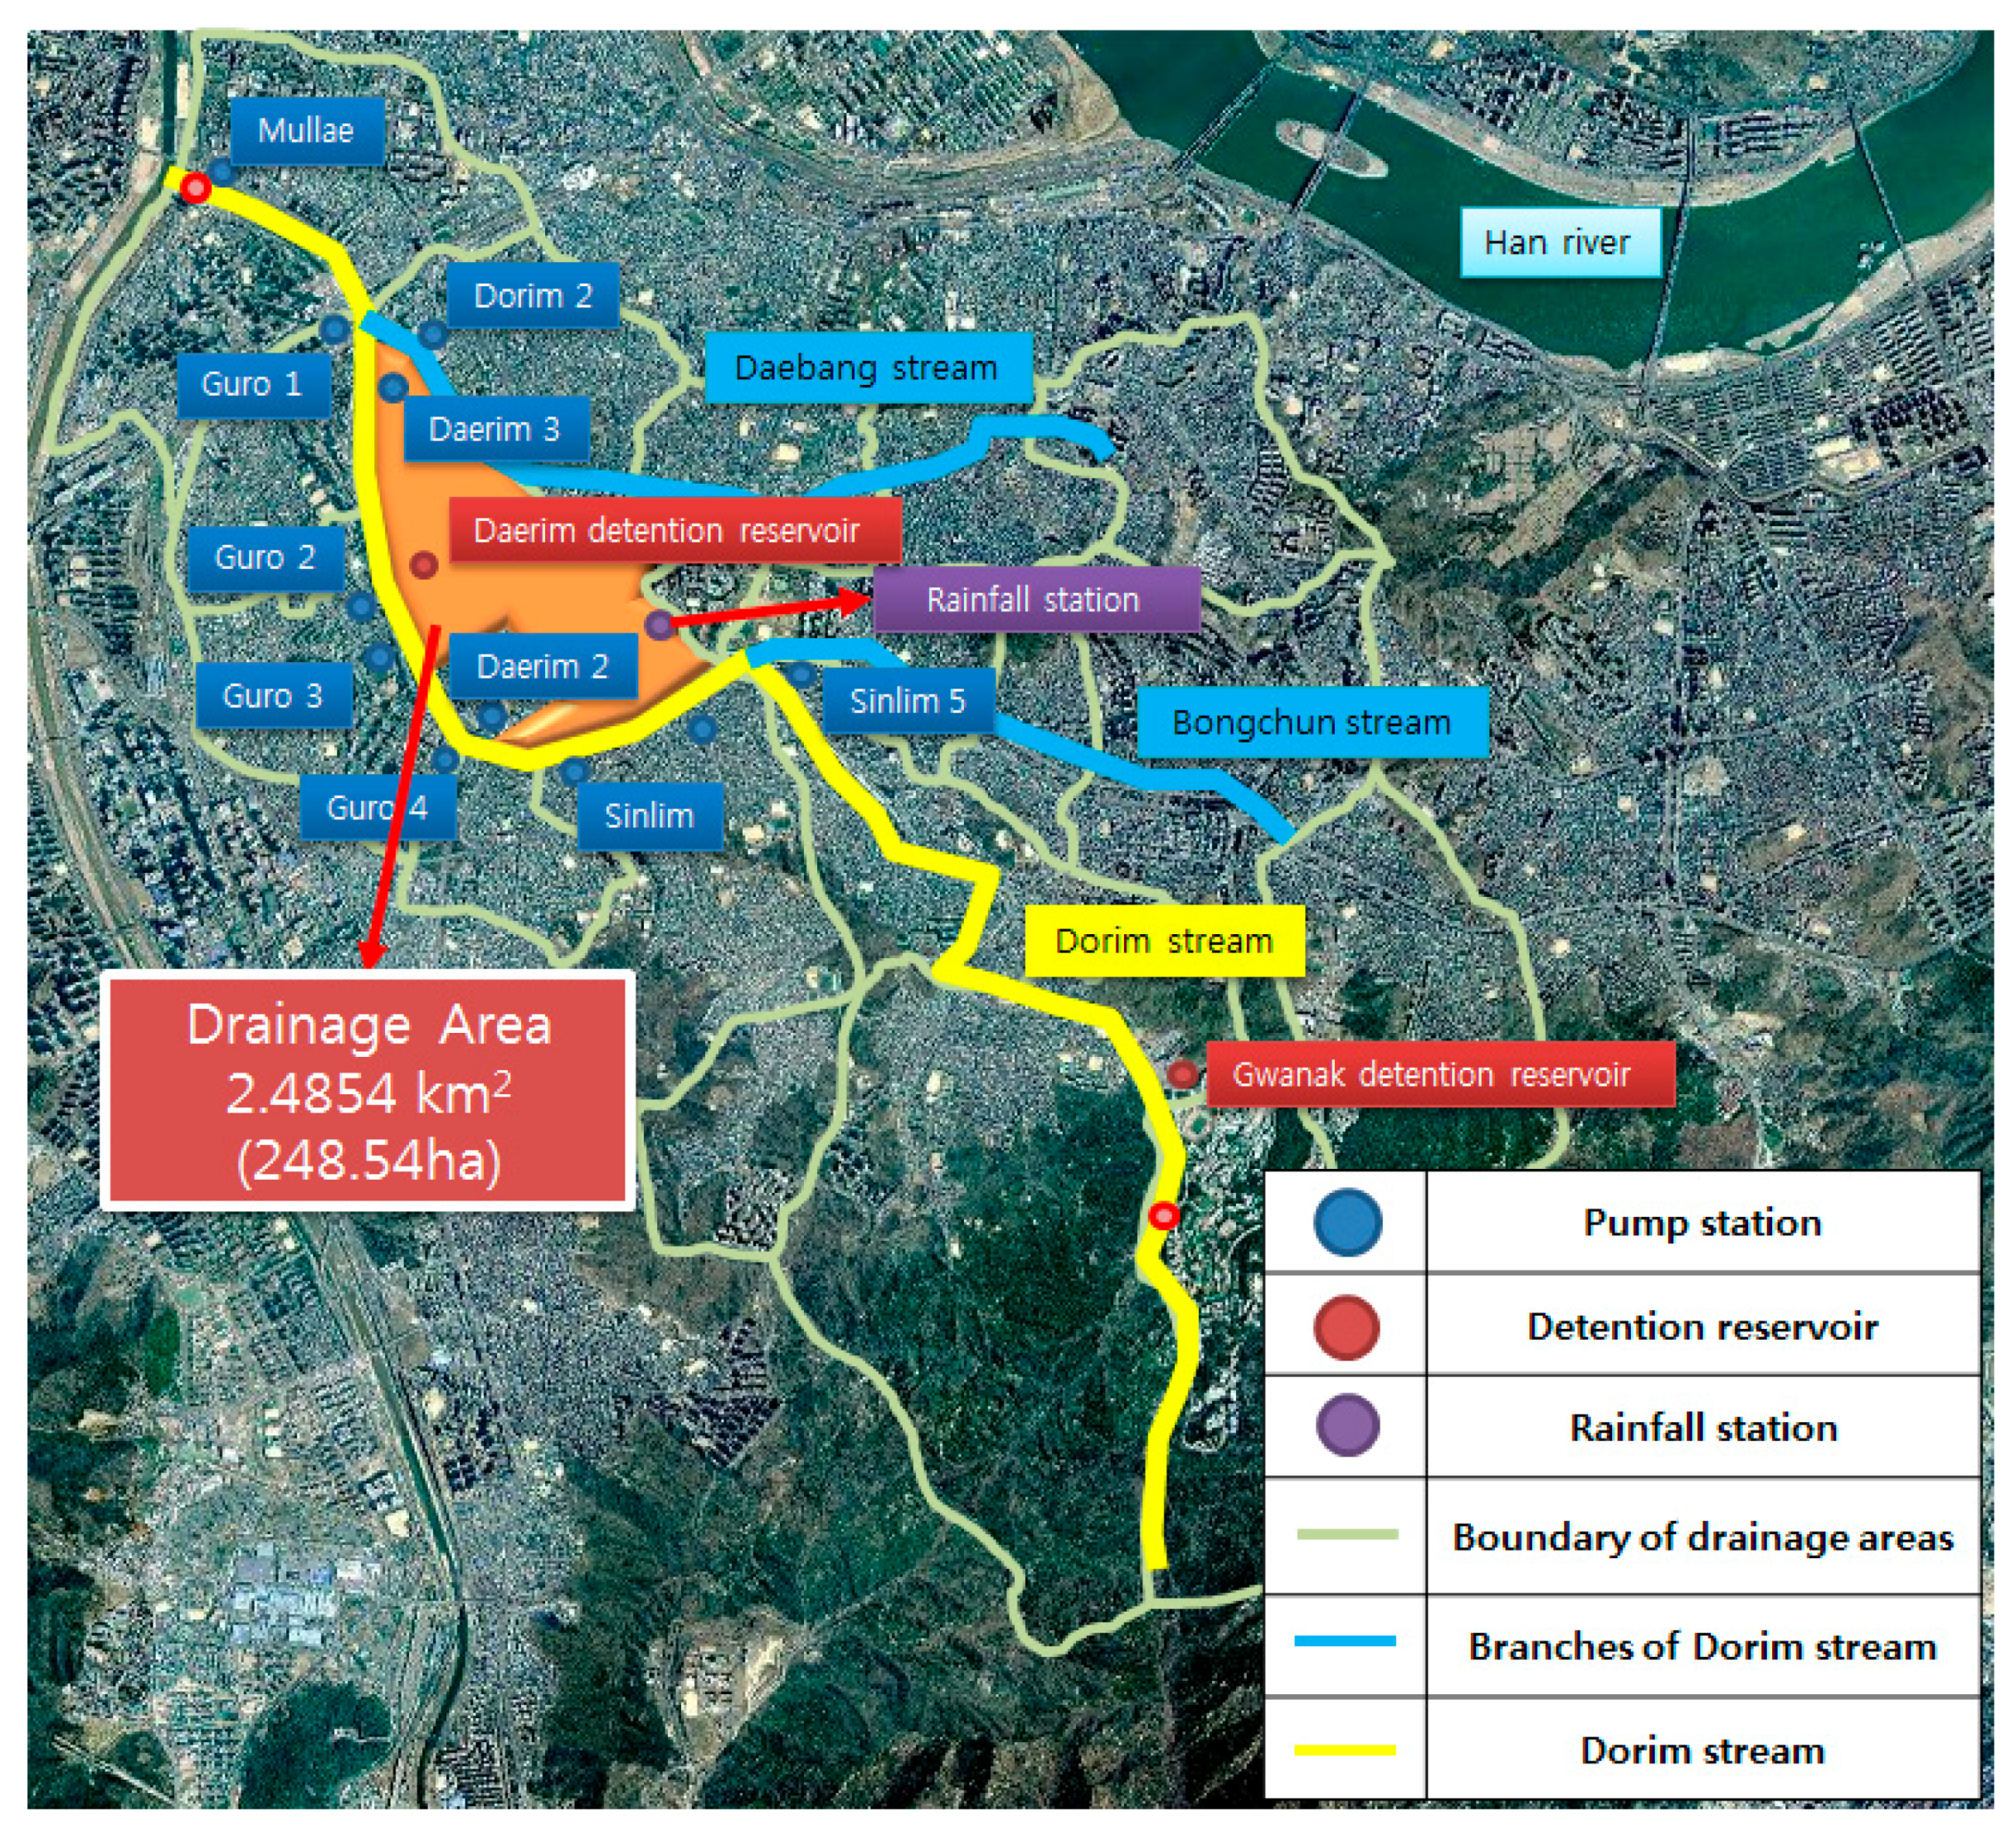
Seoul is one of the most urbanized cities in the world and consists of 25 administrative districts. The Han River flows through the center of Seoul. It has several tributaries, including Banpo stream, Wangsuk stream, Anyang stream, and Jungnang stream. In this study, we select Dorim stream as a target. Dorim stream runs through the Guro-gu, Yeongdeungpo-gu, and Gwank-gu administrative districts, and its tributaries include Daebang-cheon and Bongcheon-cheon.
As shown in 
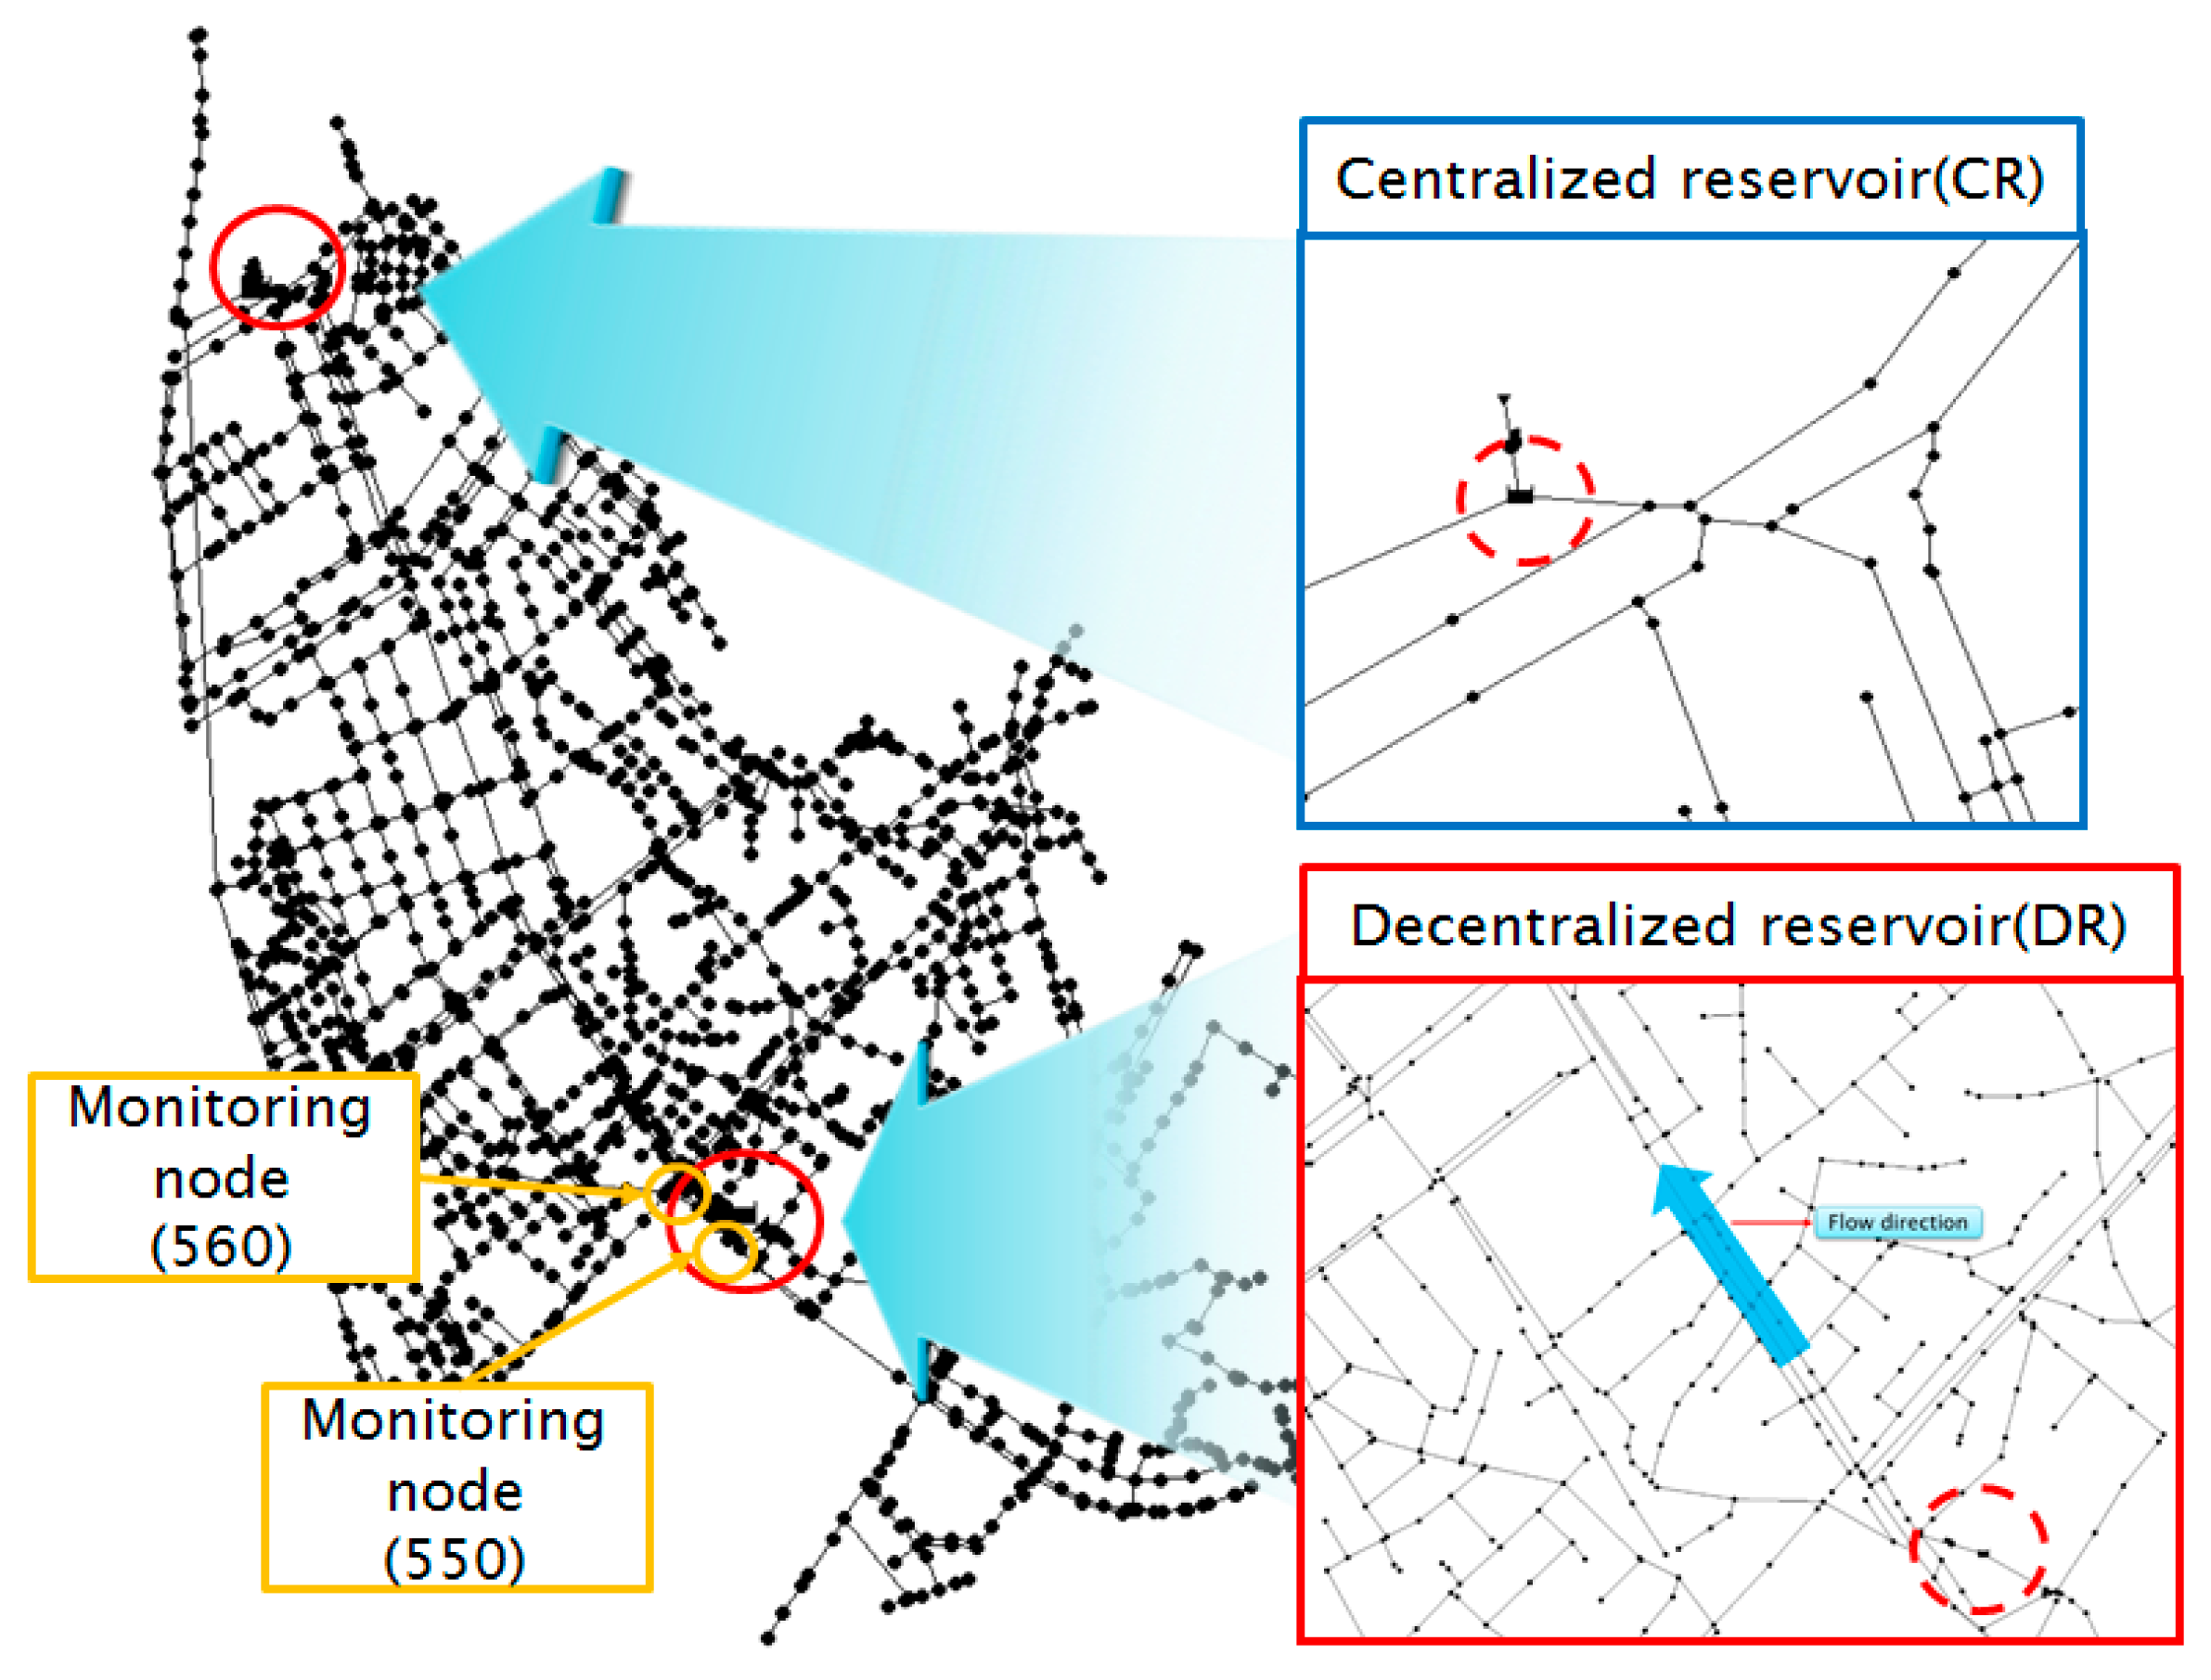
Figure 9, there are 10 pump stations, 2 detention reservoirs, and 2 tributaries in the Dorim stream basin. The basin above Daerim 3 pump station is selected for the application of cooperative operation, as proposed in this study. A detention reservoir is installed in the upstream drainage system connected to Daerim 3 pump station, which is located at the basin outlet. Since the DR was installed in 2009, there have been two episodes of flooding, in 2010 and 2011.
For this study, we select the largest events in the recent flood record in order to compare the different operating systems using disaster year books issued by the Ministry of Public Safety and Security [22,23,24,25,26,27], which contain information on disaster type, area, duration, statistical data, and typhoon trajectories. Table 1 lists rainfall periods from 2008 to 2014, as identified in the disaster year books [22,23,24,25,26,27]. The target basin was damaged in significant events on 23 September 2010 and 27 July 2011. Rainfall duration and frequency, respectively, is estimated as 240 min and 100 years for the 2010 event, and 1080 min and 100 years for the 2011 event.
The design return period for the Daerim 3 pump station is 30 years. A total of 12 drainage pumps (1 pump at 300 kW, 7 at 413 kW, 2 at 450 kW, and 2 at 900 kW) are installed, with a total discharge capacity of 57.02 m3/s. The CR has a total capacity of 33,650 m3, a HWL at 9.0 m, and a LWL at 6.8 m. The first drainage pump at the CR is operated at the initial operating level and all drainage pumps at the CR are operated at all operating level. The time of concentration in the Daerim 3 pump station basin is 30 min [28].
The detention reservoirs in the Daerim basin have a design return period of 20 years. The 5-year-flow is designed to go over the weir and into the reservoir. The weir has a width of 2 m and a height of 0.4 m, and is located on the right side of a rectangular type sewer 2 m wide and 1.5 m high. As a result, the detention reservoir has a total height of 3.2 m, a freeboard of 1 m, and a total detention volume of 2447 m3. It is impossible for the Daerim detention reservoirs to drain naturally; however, they can also drain by operation of a submersible pump at 22 kW, which has a capacity of 9.0 m3/min with a total head of 6.0 m [29].
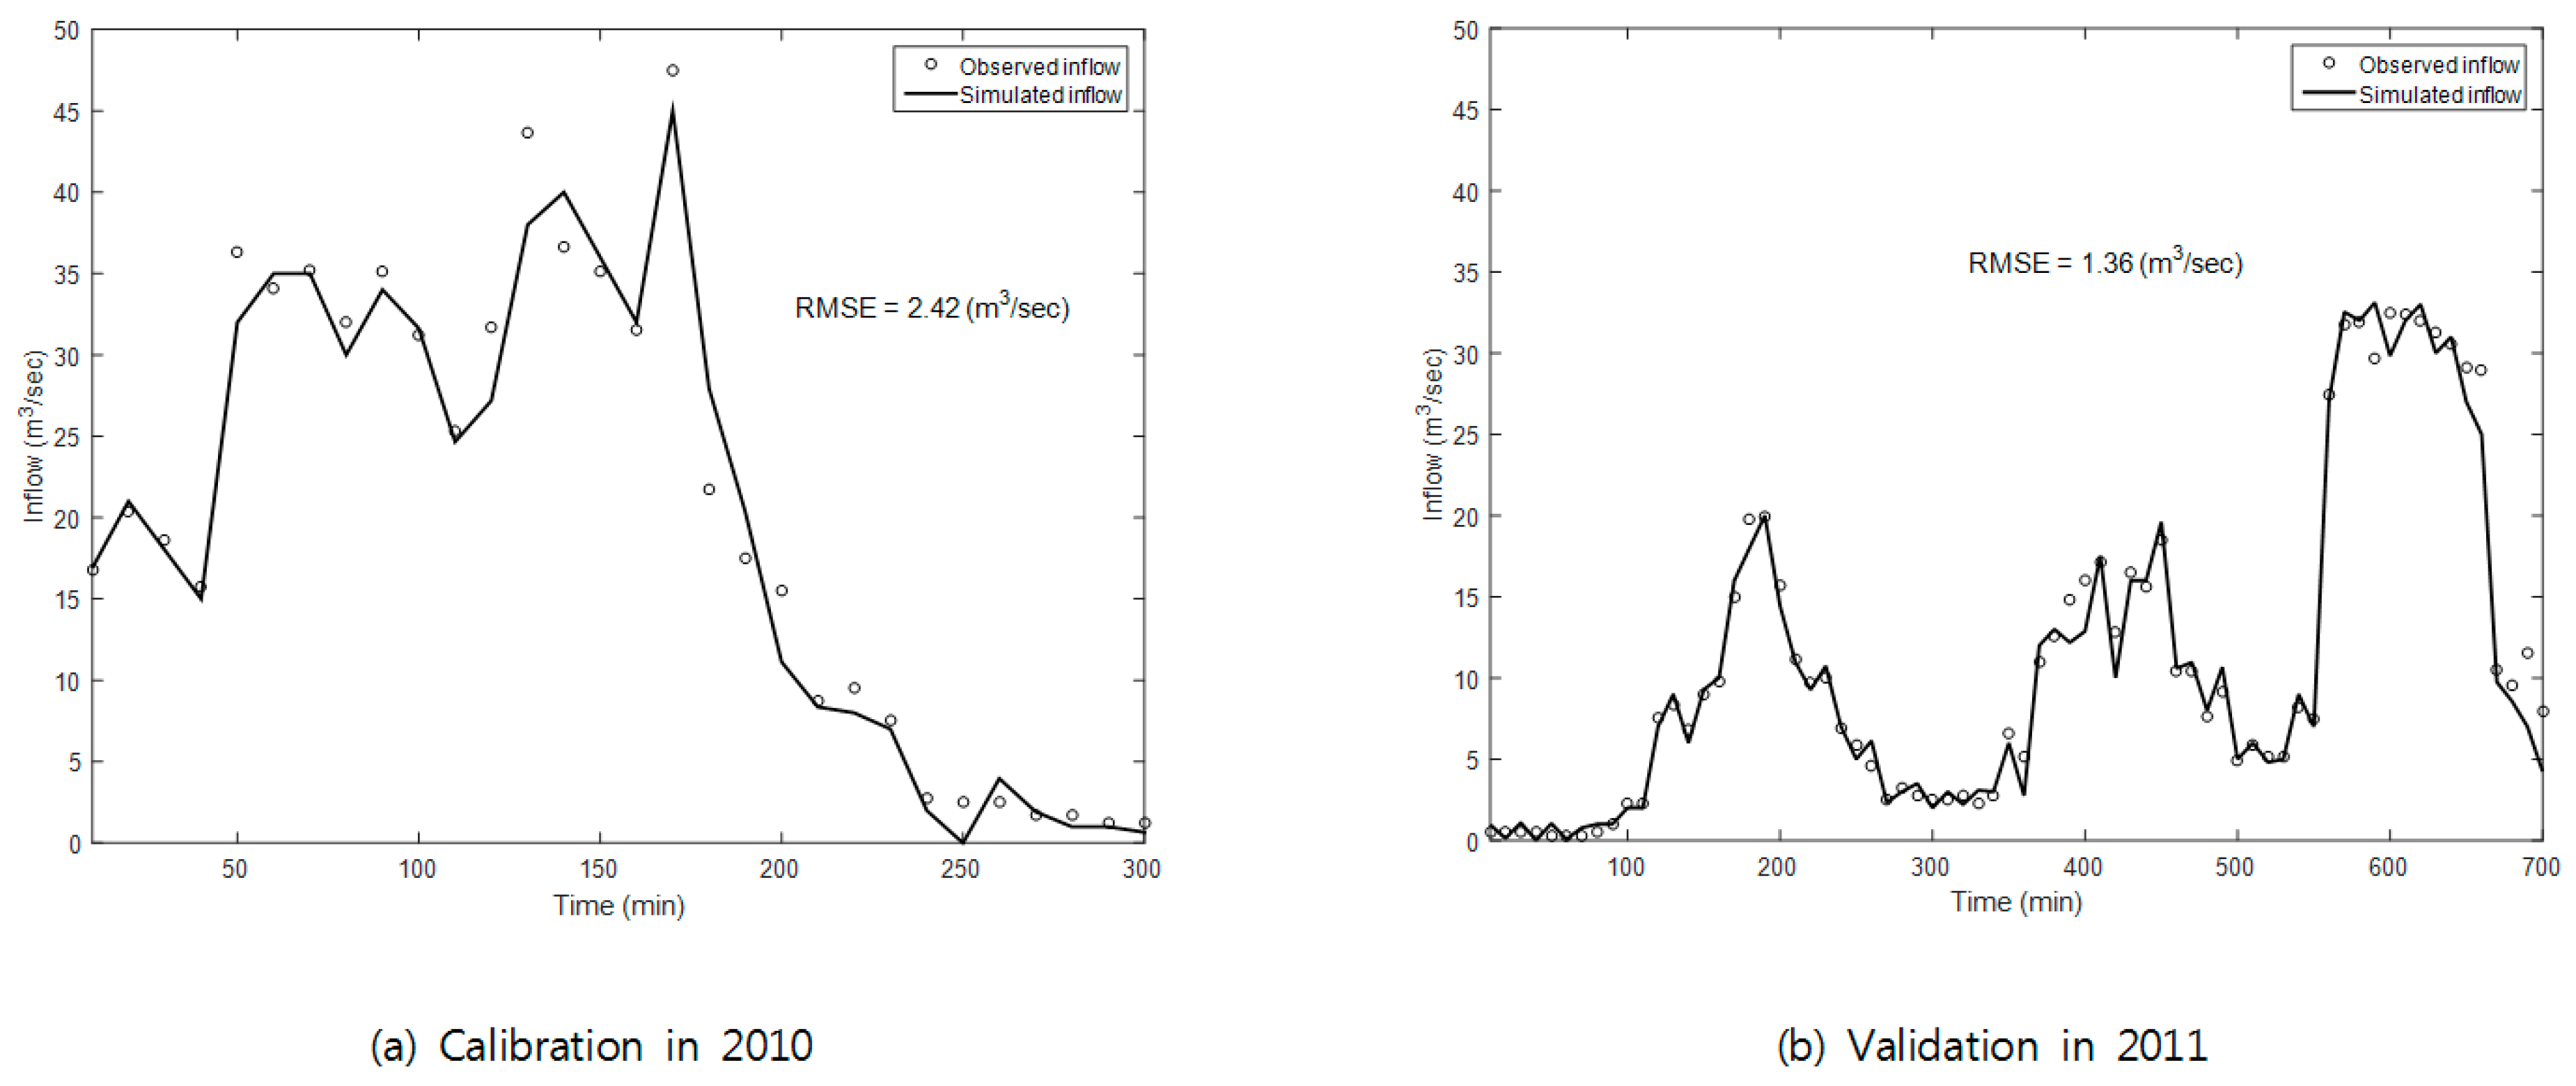
The model is manually calibrated. We focus on four aims when calibrating the model: matching the peak discharge and peak time total runoff volume, and minimizing the Root Mean Square Error (RMSE) between the observed inflow data and the simulated inflow results for 2010 and 2011. First, rainfall data for 21 September 2010 and 27 July 2011 are used for calibration of the rainfall-runoff model. Inflow is estimated using pump operation records and the variance of CR level because CR in the pump station does not measure inflow. Figure 10 describes the observed/simulated inflow hydrograph in the target basin and the accuracy of calibration/validation.
Table 2 shows the types and values of the calibrated parameters in SWMM. For calibration and validation of the target basin, three parameters are used: percentage of the impervious area, width of the subcatchment, and percentage of slopes in the subcatchment. The total number of parameters is 4728 because the total number of subcatchments is 1576. In this study, Manning’s roughness coefficient in the conduits is assumed to be uniformly 0.014 following a technical report written after the recent rehabilitation and maintenance of the Daerim 3 pump station and the design of the Daerim detention reservoir.
The “control” module in EPA-SWMM is used for various simulations of CR and DR operations. It is a simple code whereby, for example “If node DB-1 depth ≥ 2.33 then pump ps1 status = on”. On the basis of GIS data, we construct and simulate sewage networks in Seoul, including the Daerim detention reservoir (Figure 11).

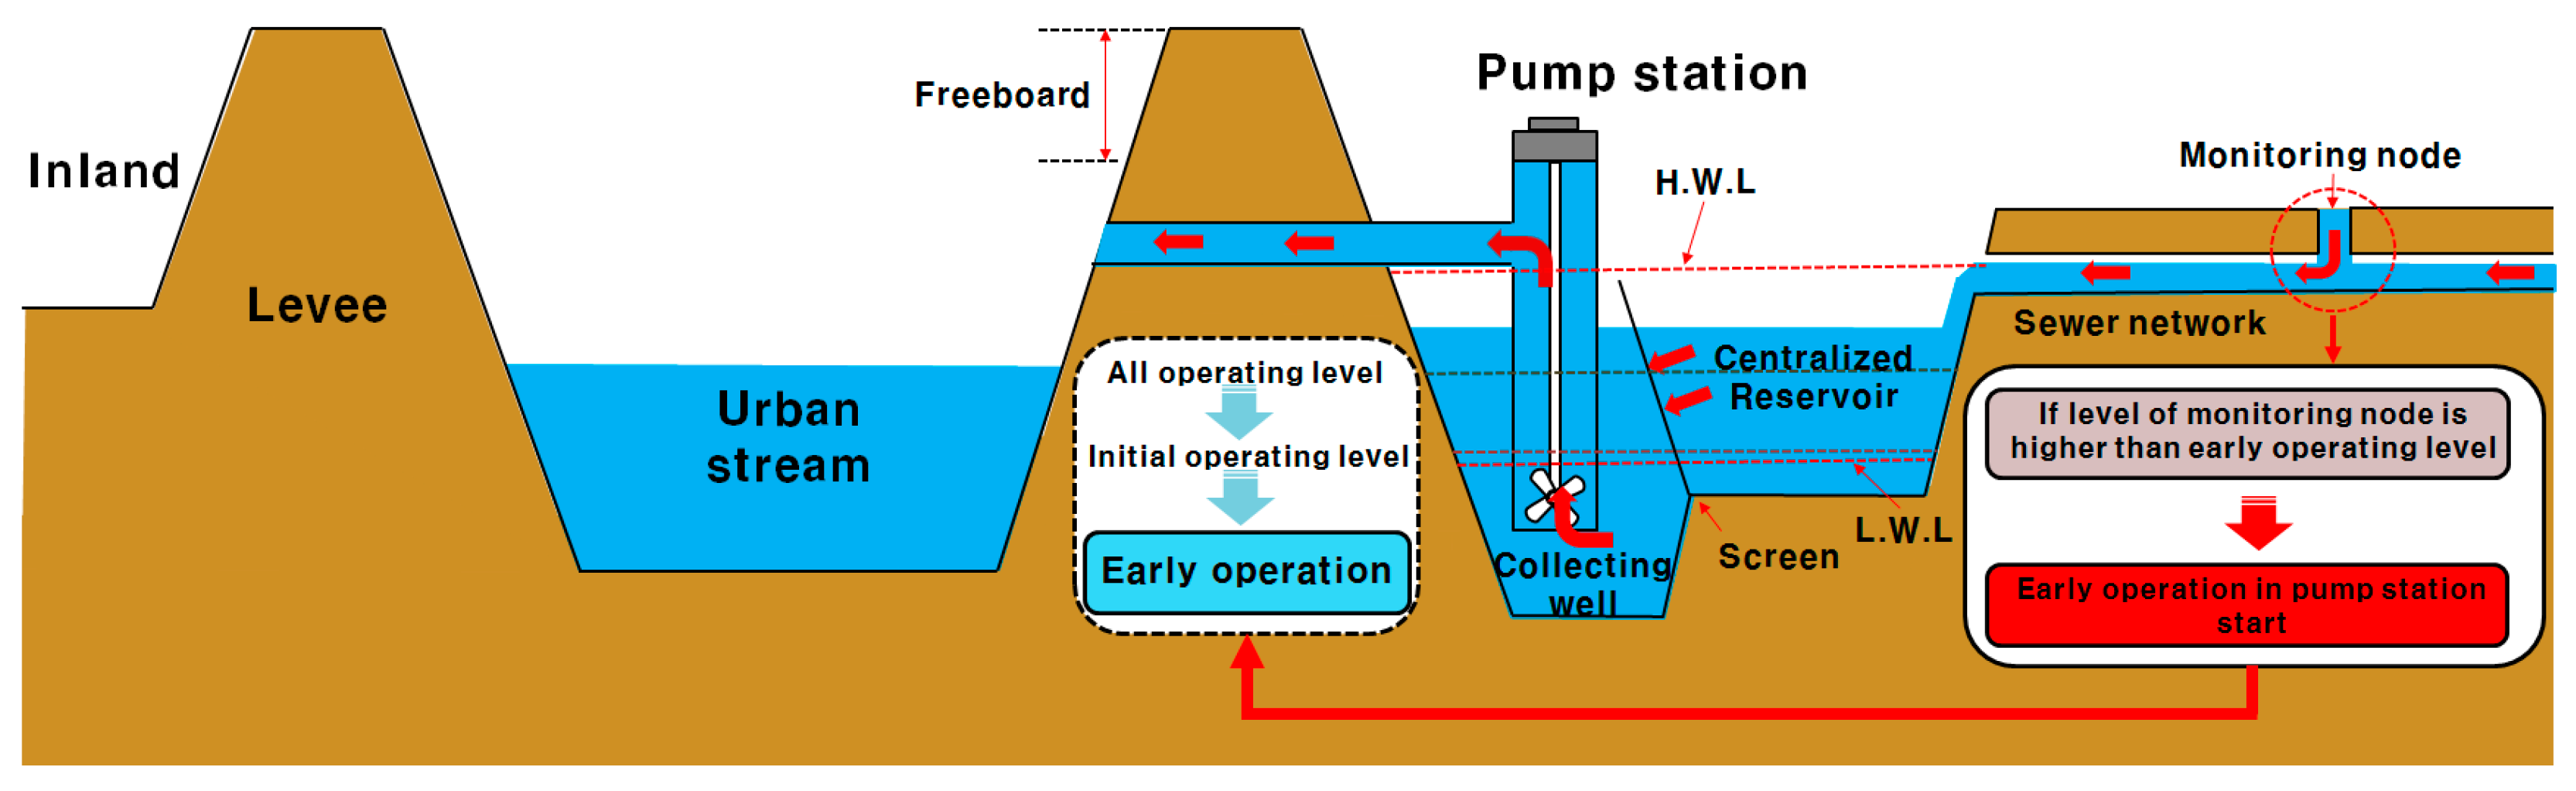
3.2. Selection of Monitoring Nodes for Cooperative Operation of Urban Drainage Facilities

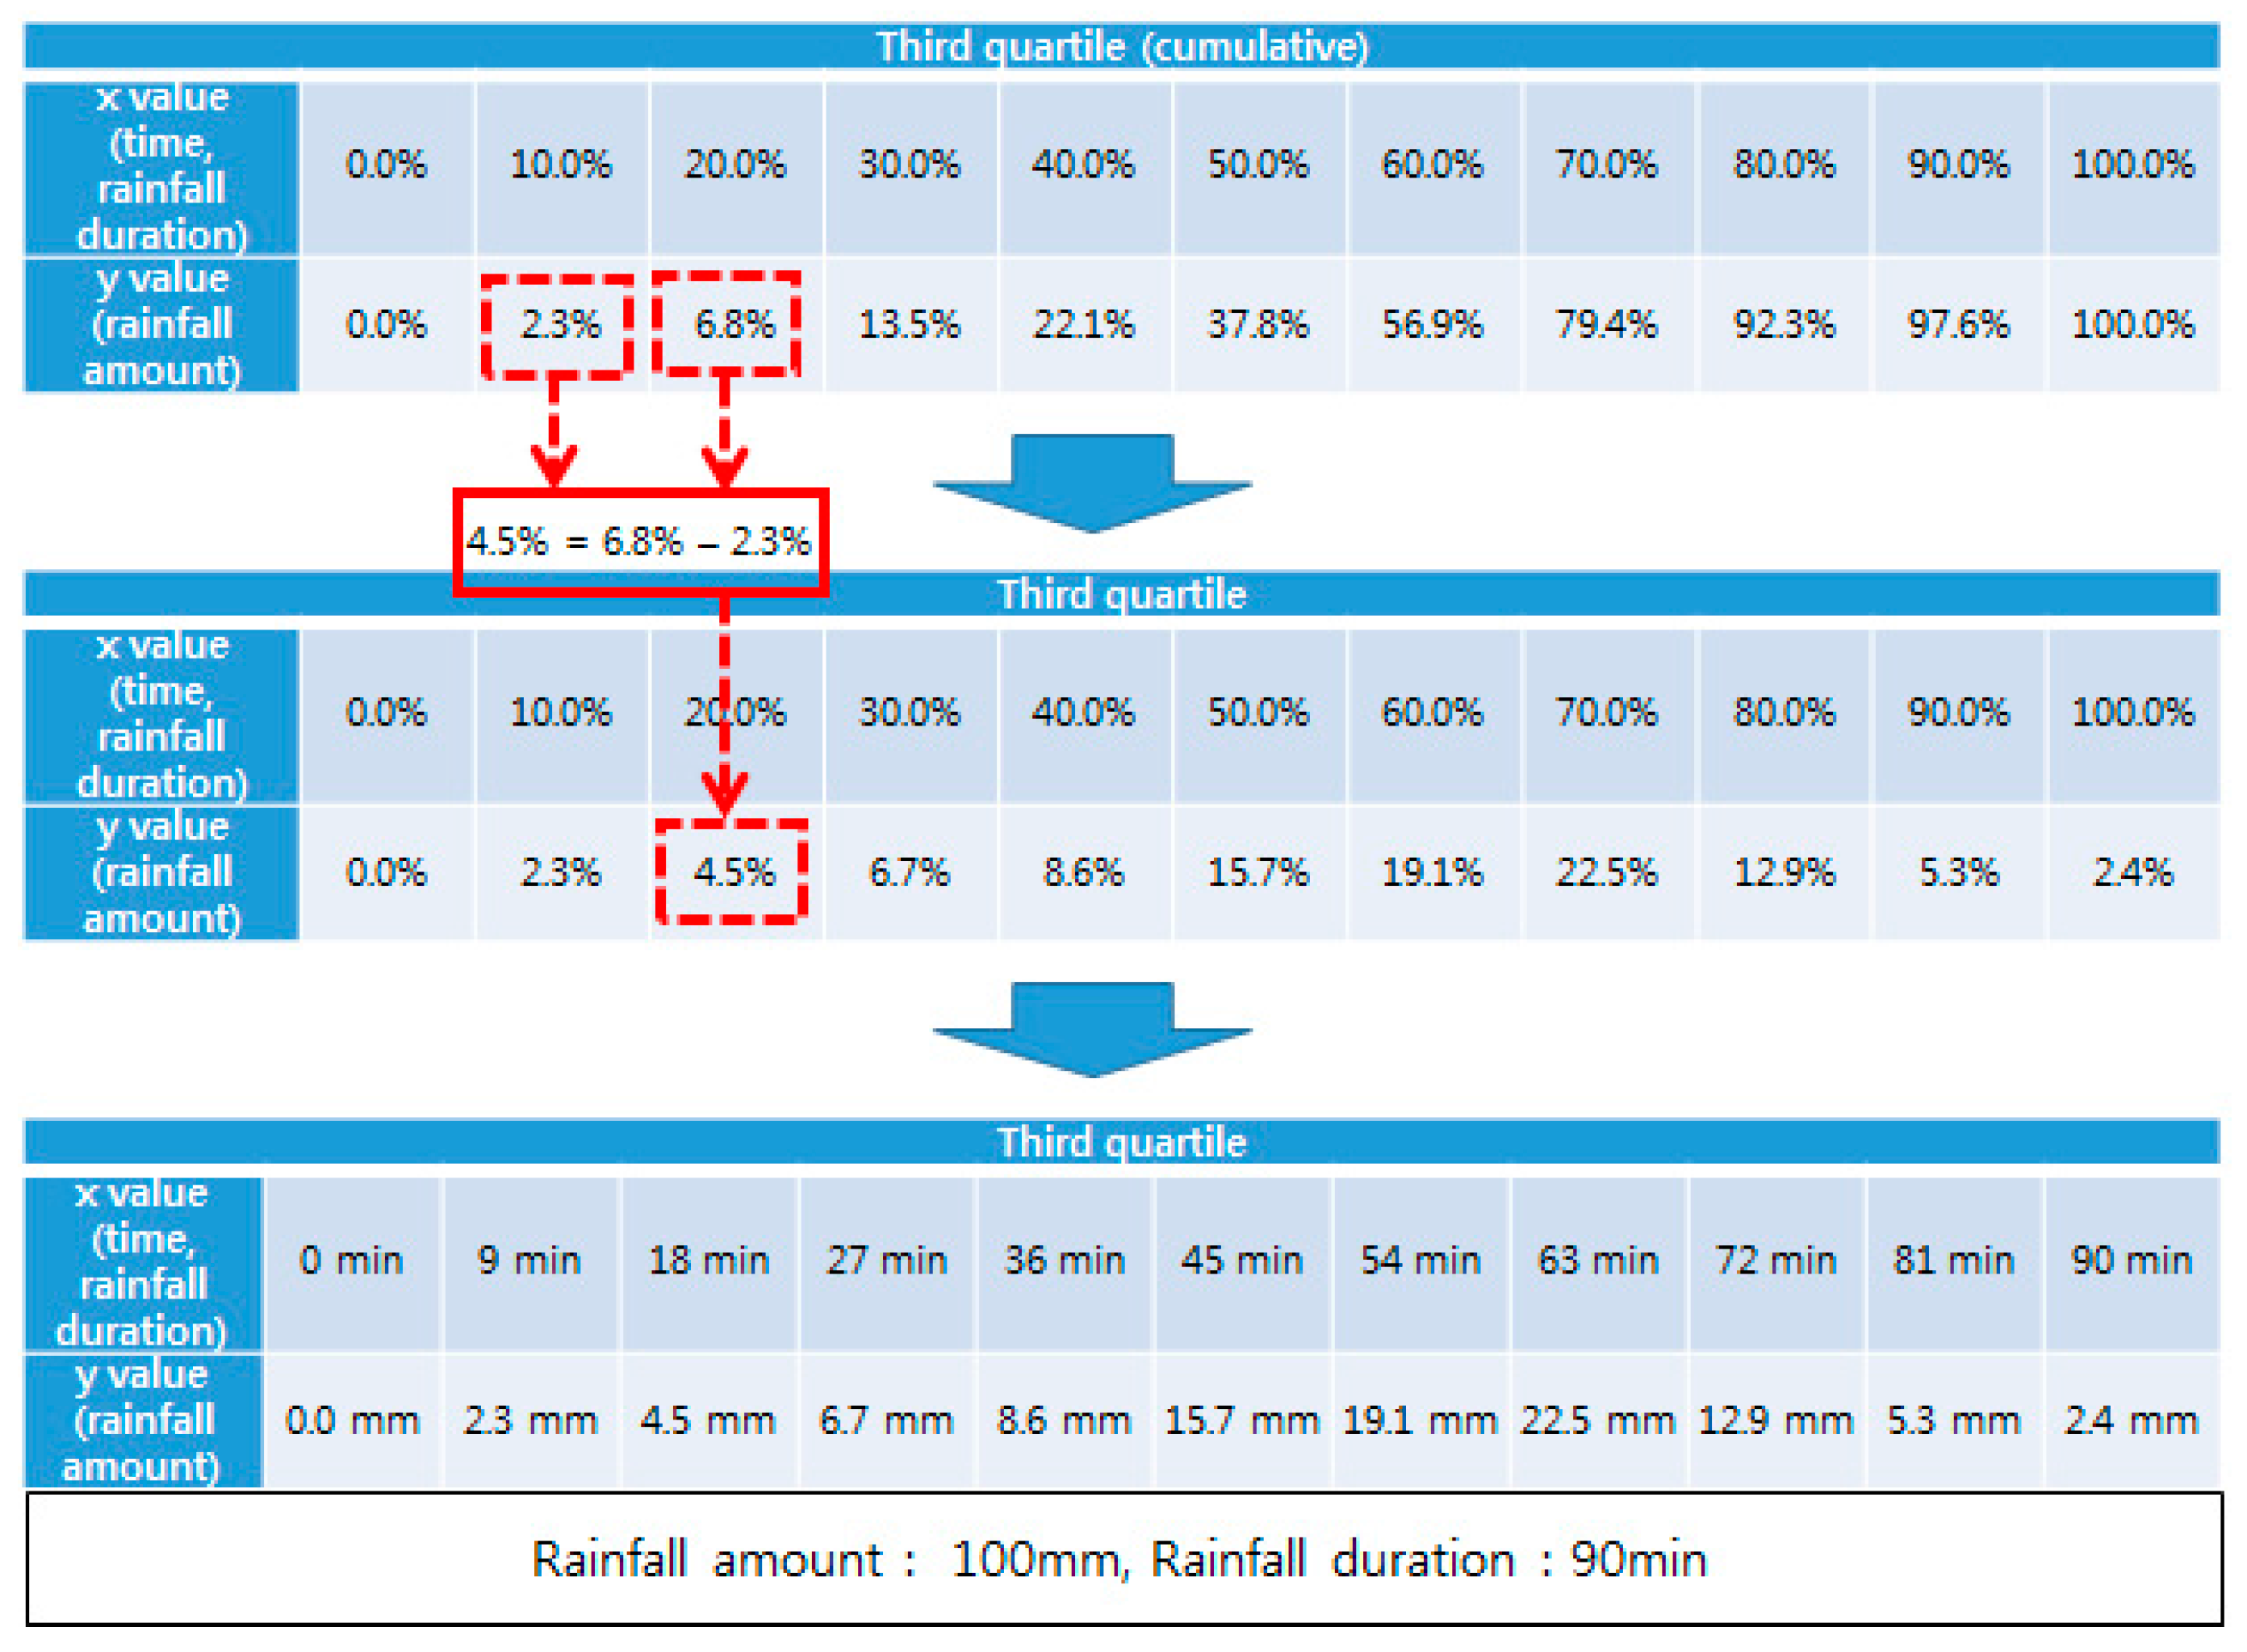
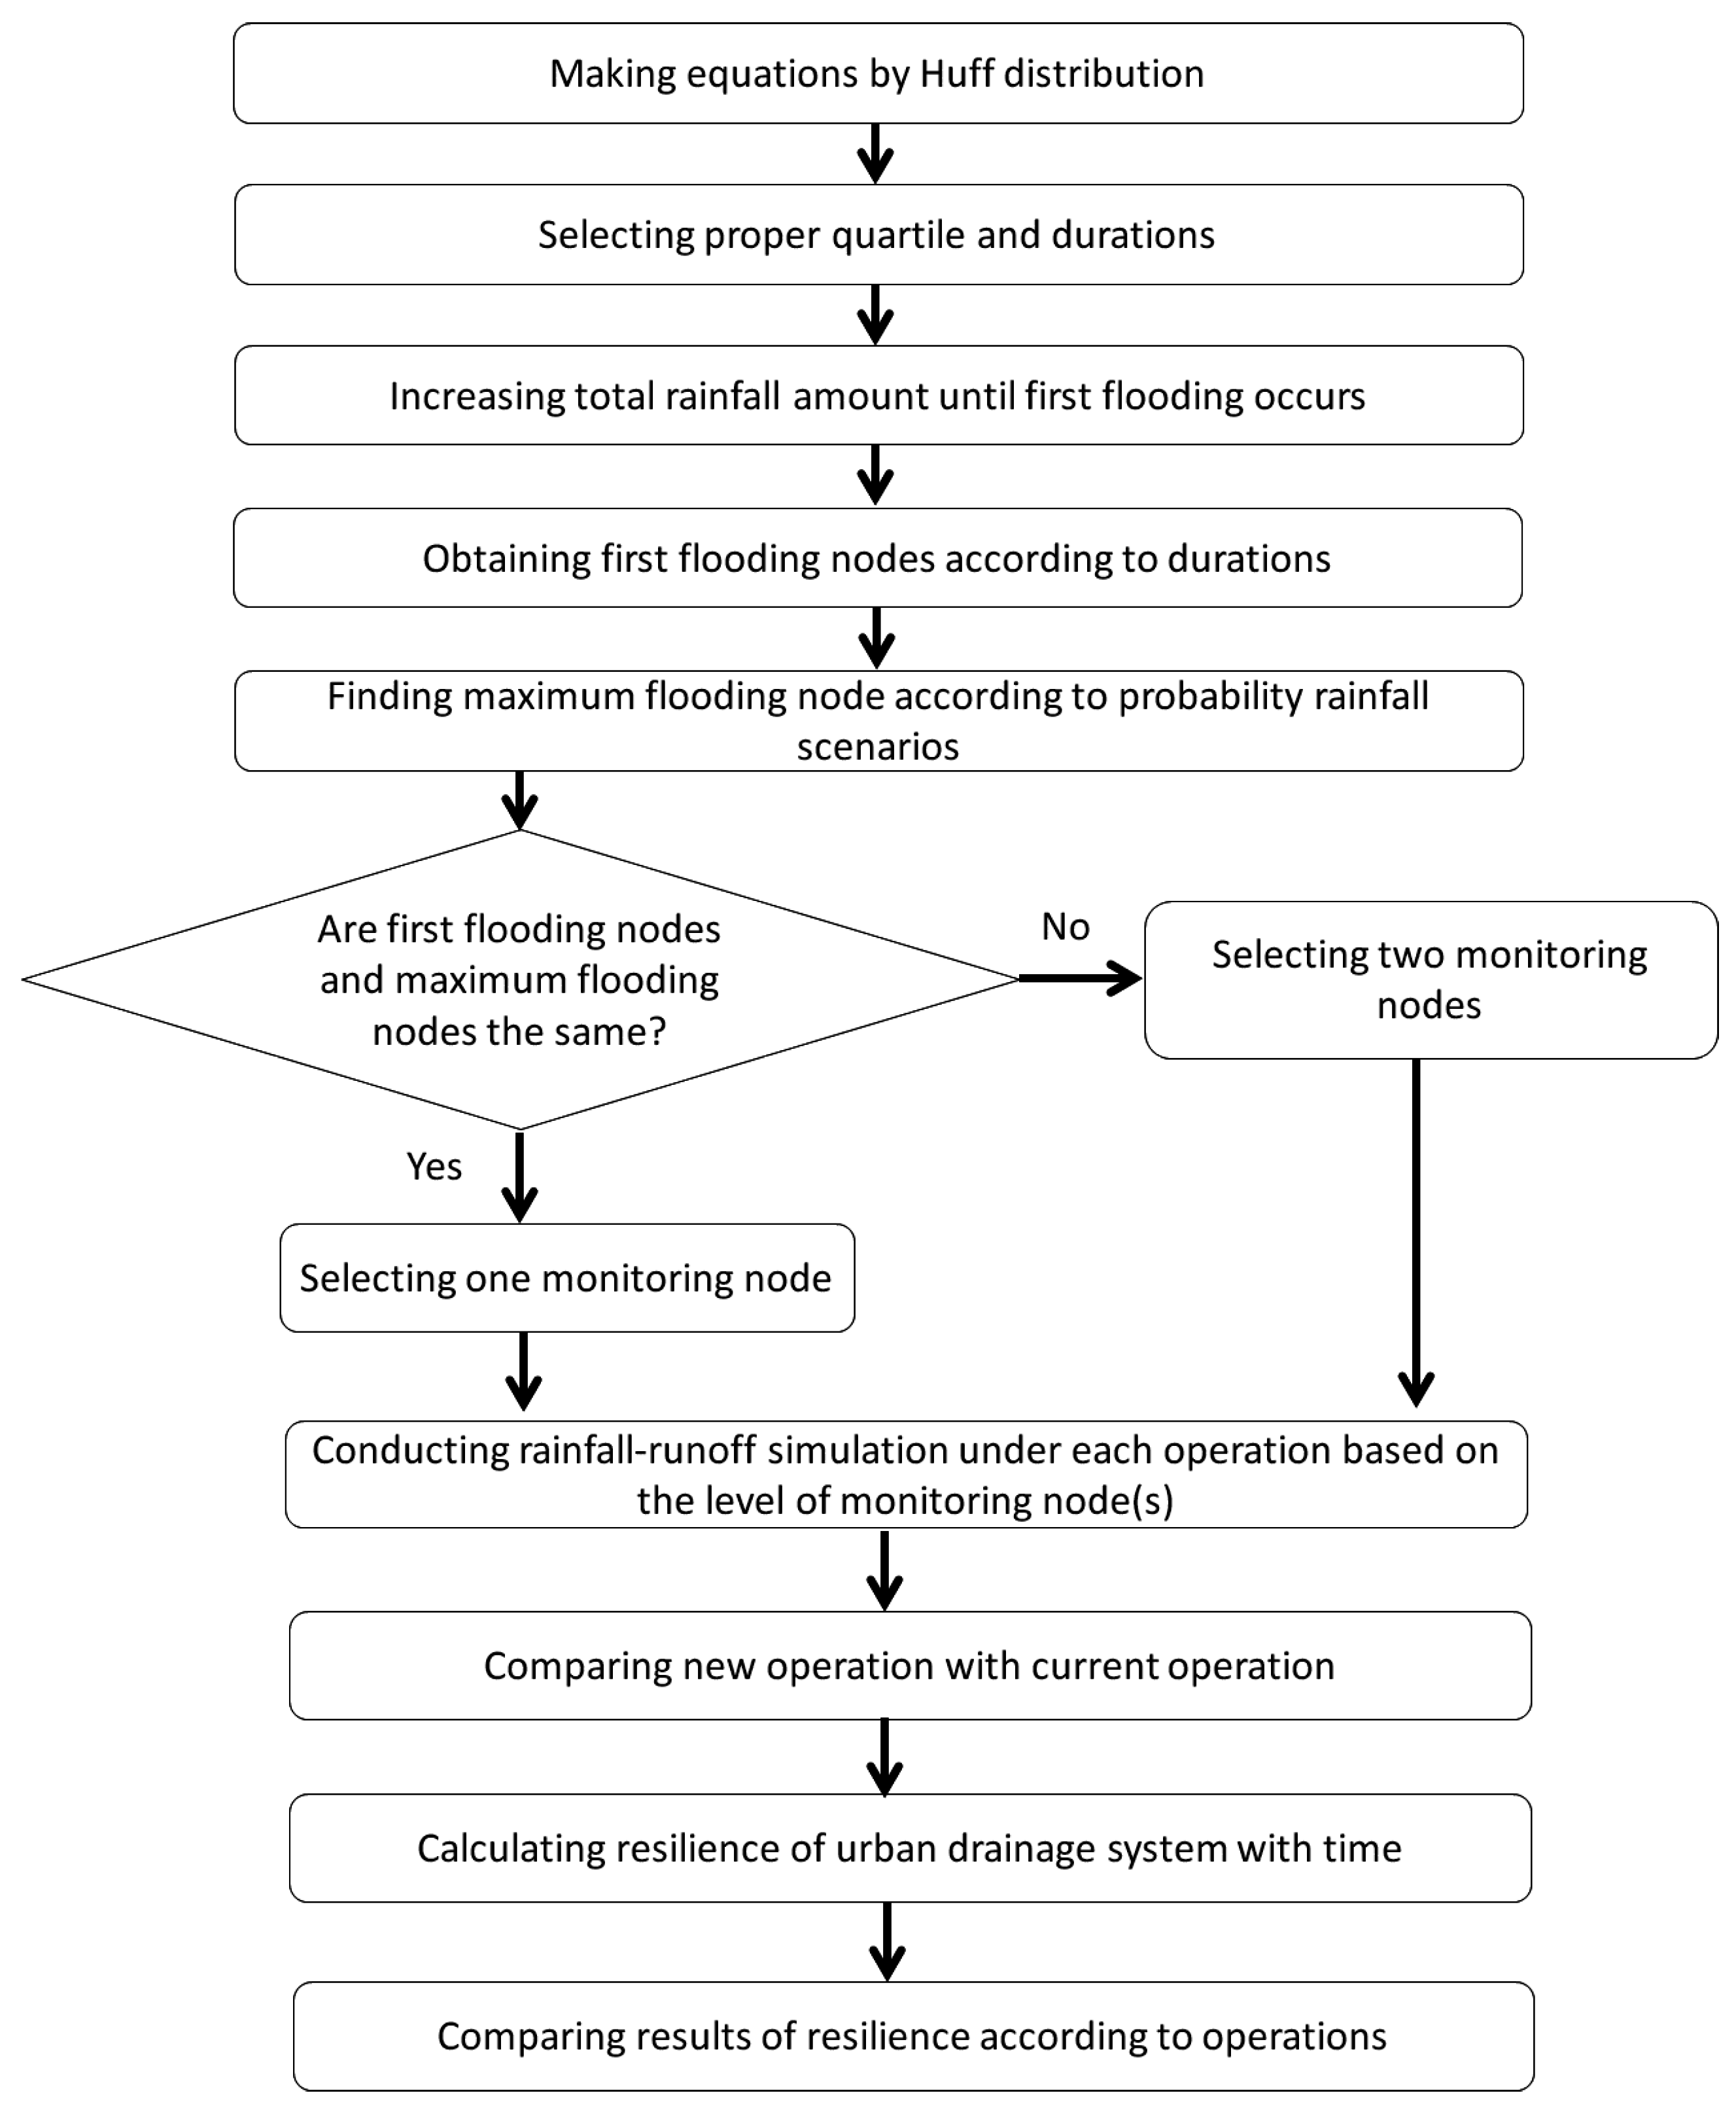
Monitoring nodes are selected on the basis of rainfall probability based on the third quartile of the Huff distribution, as proposed by Yoon et al. Different quartiles of the Huff distributions have different peak locations, and in the case of the third quartile, the peak tends to be in the latter half of the event. We use two methods to select monitoring nodes, based on first and maximum flooding. First, we select three rainfall durations (30, 60, and 90 min) for simulation of the first flooding node, up to three times as long as the time of concentration in the target basin (30 min). For each rainfall duration, we increase total rainfall volume in 1 mm increments until the first flooding occurs, and identify the first flooding node. Sewer conduits in urban areas can be divided into main and branch conduits according to the associated basin area runoff coefficient (C) and drainage area (A). The first flooding generally occurred at branch conduits for which design frequency (CA < 0.12 km2) is only 5–10 years (that of the main conduit is 30 years) and thus the conditions of the whole basin cannot be effectively determined by only considering the branch conduits. Therefore, we increase total rainfall volume until the first flooding occurs in the main conduits (CA ≥ 0.12 km2).
To identify the maximum flooding node, we review a total of nine conditions of rainfall probability frequency and duration (a combination of 30, 50, and 100 year frequencies, and 30, 60, and 90 min durations) in the Huff third quartile distribution. However, the maximum flooding nodes identified in this process are not consistent across all nine conditions, except at Daerim reservoir, and are located in branch conduits making it problematic to use them as monitoring nodes. The maximum flooding nodes that are located in main conduits are all at location 550. Thus, we review maximum flooding nodes on the basis of rainfall on 23 September 2010 and 27 July 2011. The maximum flooding node occurred in the Daerim detention reservoir. However, as the interior level of the detention reservoir is considered in the current operation of drainage facilities, we only count nodes in the main conduits. Therefore, the highest flood volume in both events is observed at location 550. Details of the selected monitoring nodes are shown in Table 3. We select locations 560 and 550, the first and maximum flooding nodes, respectively, as the monitoring nodes for operation of the CR, DR, and cooperative CR/DR. The nodes at 560 and 550 are located within the 2-line main conduits with a height of 1.5 m and width of 2 m.

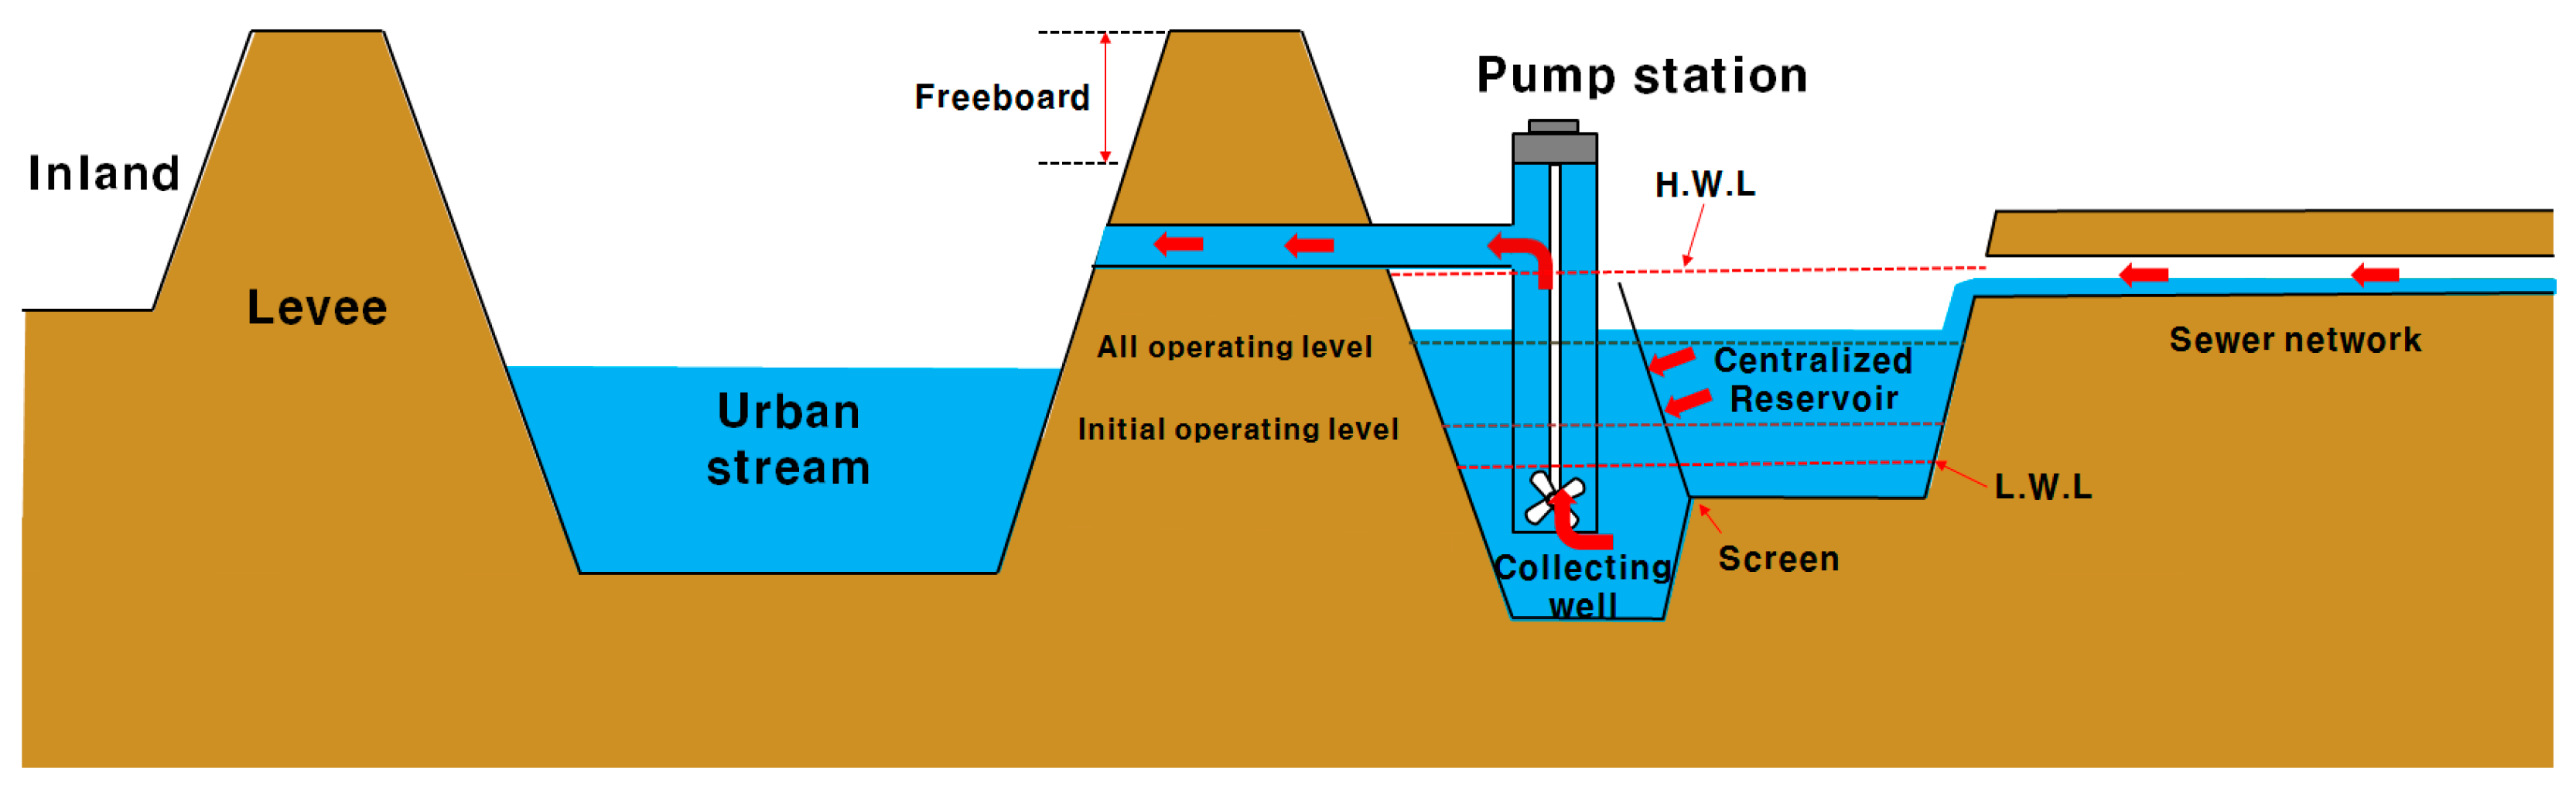
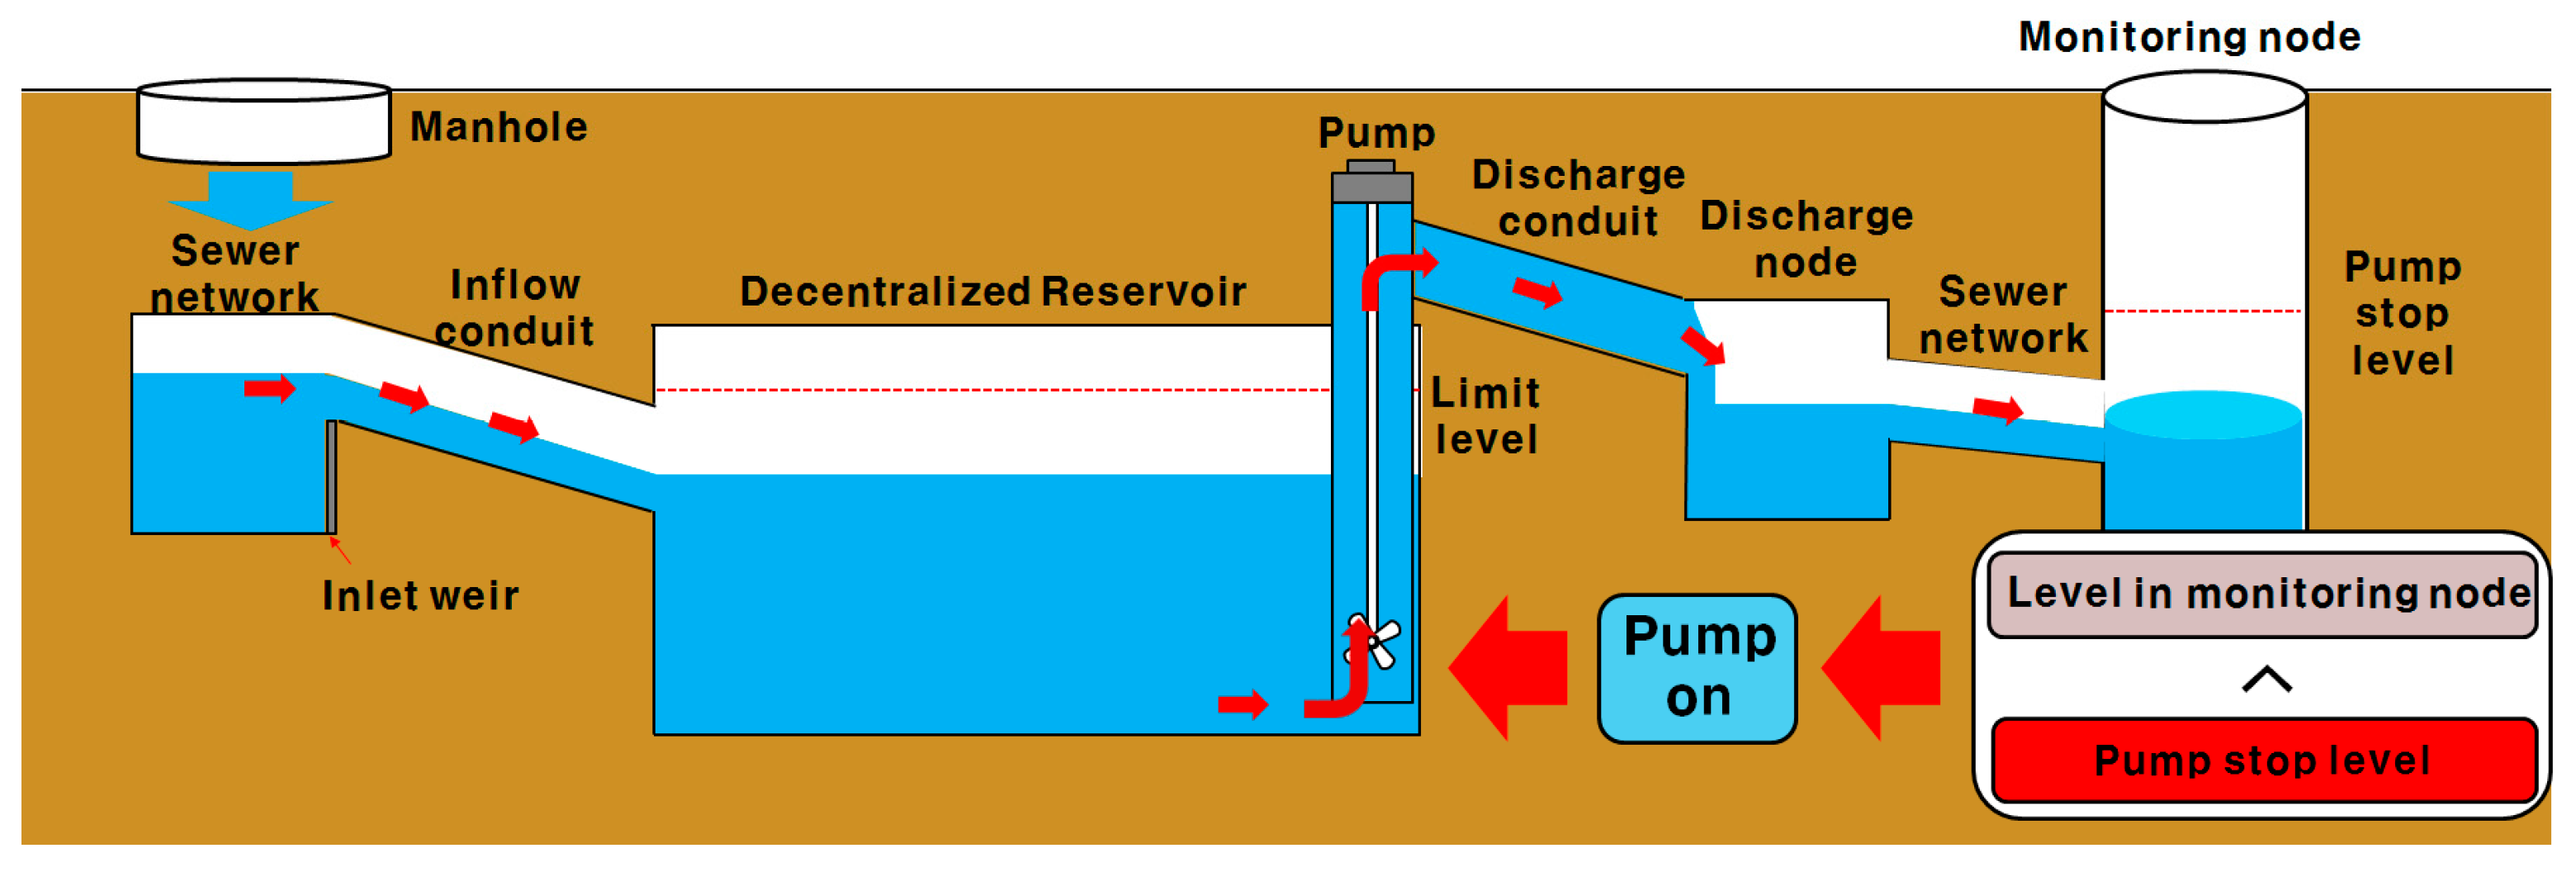
3.3. Operation of CR Based on Monitoring Node Levels

The CR is operated as follows. When stream level is lower than the base of the drainage gate, water in the CR naturally drains through the drainage gate. When stream level is higher than the base of the drainage gate, the gate is closed and water is forced to drain using drainage pumps. When no water enters the CR, drainage pump operation is stopped.
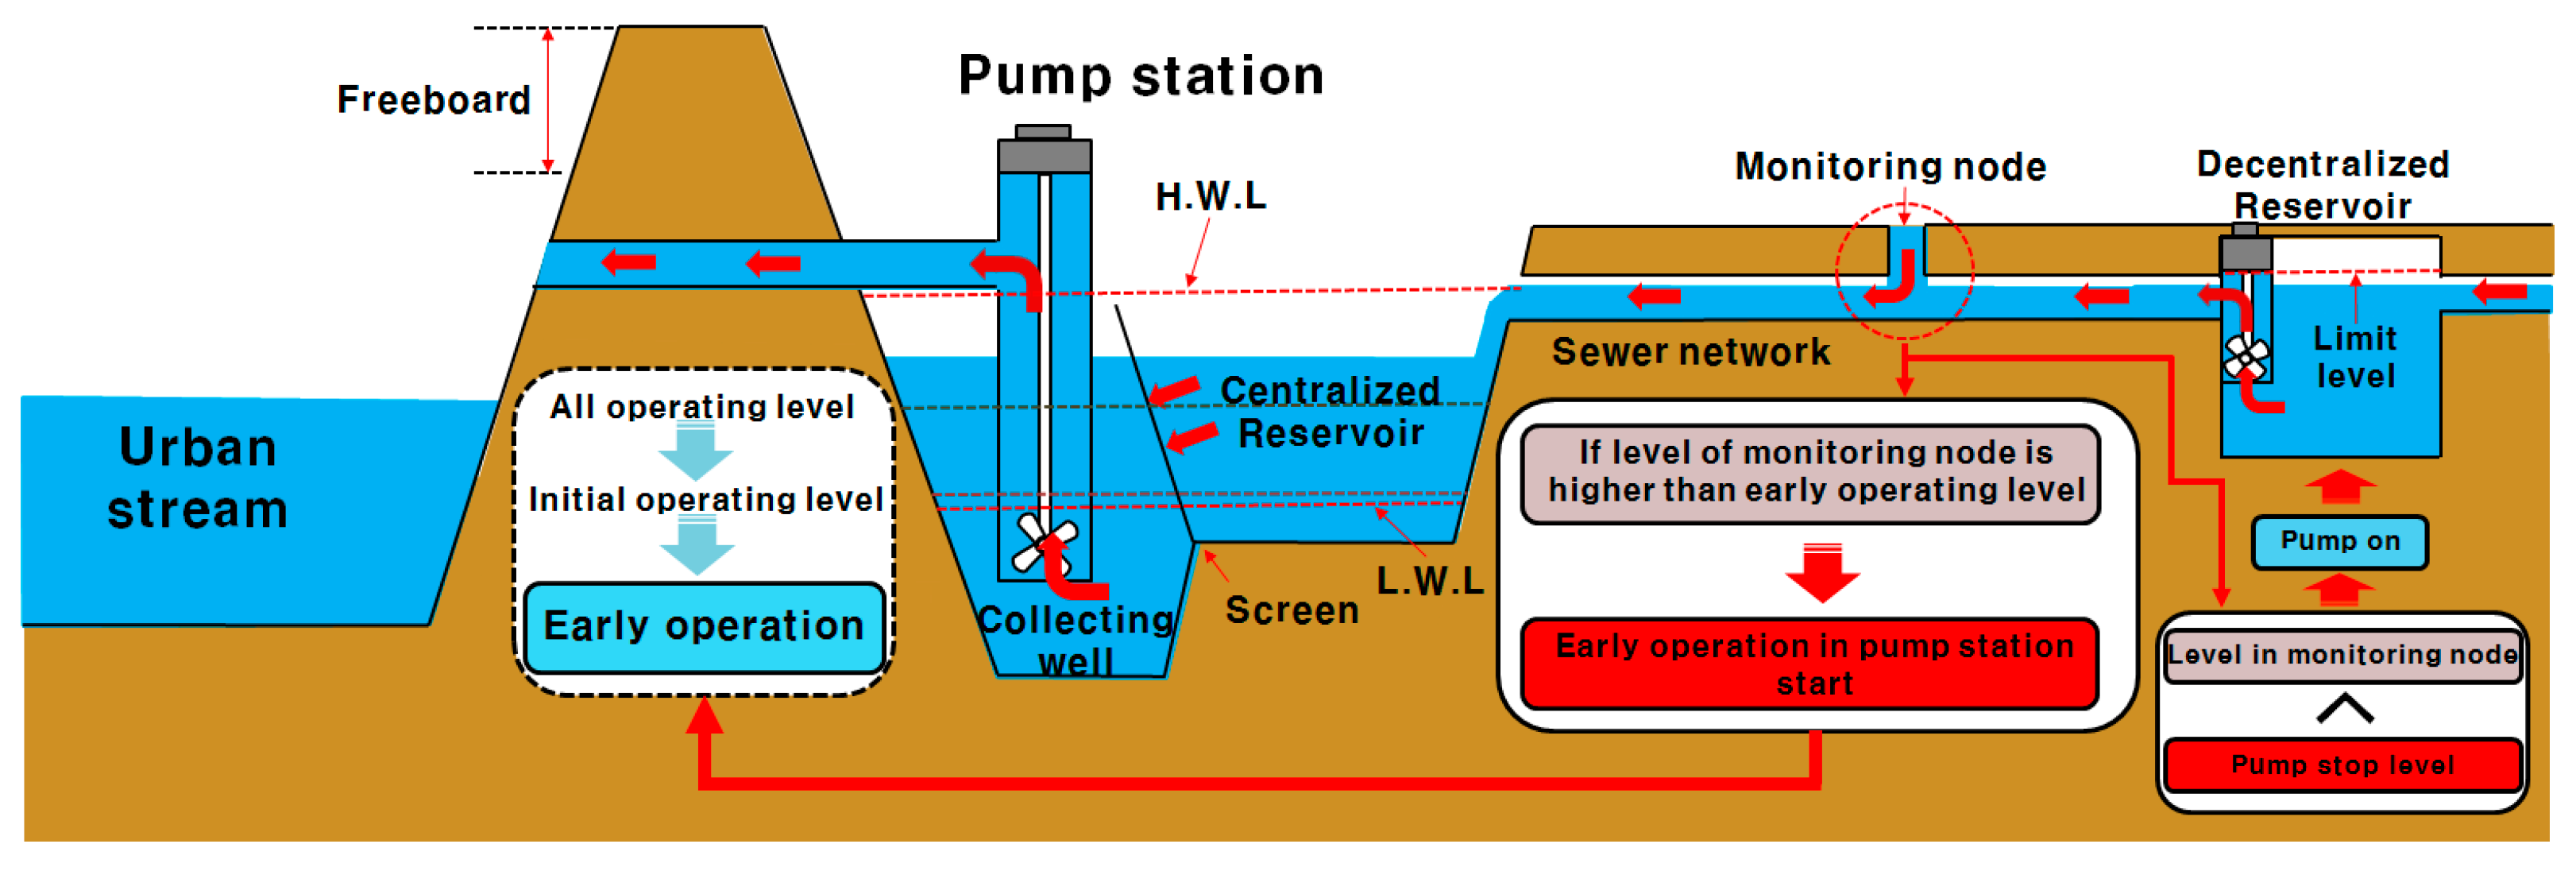
As previously mentioned, drainage pumps in the pump station are activated according to the level of the CR. High CR water levels increase the water level in conduits of the upstream drainage system, resulting in a backwater effect. Low CR water levels decrease the level of upstream sewer conduits. Initial early operating levels for preventing cavitation in the Daerim 3 pump station are calculated using the following procedure. The initial early operating level is calculated as the sum of the required depth (A), the screen head loss (B), and the freeboard for mechanical operation (C). The entire calculation procedure for the initial operating level in the new operation shown in Table 4 is explained below.
The required depth is the minimum depth for the pump operating cycle (A), calculated by dividing the required volume in CR (A1) by the average area in CR (A2). The required volume in CR (A1) is calculated by multiplying the initial pump discharge (3.88 m3/s = 233 m3/min) and the preparation time (30 min), and dividing by four. The required volume in CR (A1) is 1711 m3. The required depth (A, 0.15 m) is the value of the required volume in CR (A1, 1711 m3) divided by the average area in CR (A2, 11,400 m2).
Screen head loss (B) refers to the variance of the level in the collecting well of CR when the initial pump is operated. It generally has a value between 0.1 m and 0.3 m. In this study, 0.1 m is selected as the screen head loss (B). The freeboard for mechanical operation (C) is the freeboard used for mechanical work such as valve opening and pump operation when an initial pump is operated. It is generally from 0.0 m to 0.2 m. In this study, 0.05 m is the freeboard for mechanical operation (C). The last calculation for initial operating depth in the new drainage system operation is the sum (0.3 m) of the required depth (A, 0.15 m), (B, 0.1 m), and (C, 0.05 m), which is added to the elevation in the bed of the CR (6.5 m). The initial operating elevation is set at 6.8 m.
Determination of the initial operating level is complicated because it is closely related to cavitation of the initial operating pump. Excluding calculation of the initial operating level, calculation of the other operating levels is based on the required depth (A). At low elevation, between 6.5 m and 7.3 m, the operating interval is larger than at high elevation because preparation time of longer than 10 min is required. Additionally, we follow the order of pump discharge in the current operation because the order of pump discharge at each pump station is already fixed by the local government. It is determined by considering the pump rotation cycle for maintenance control of the pumps.
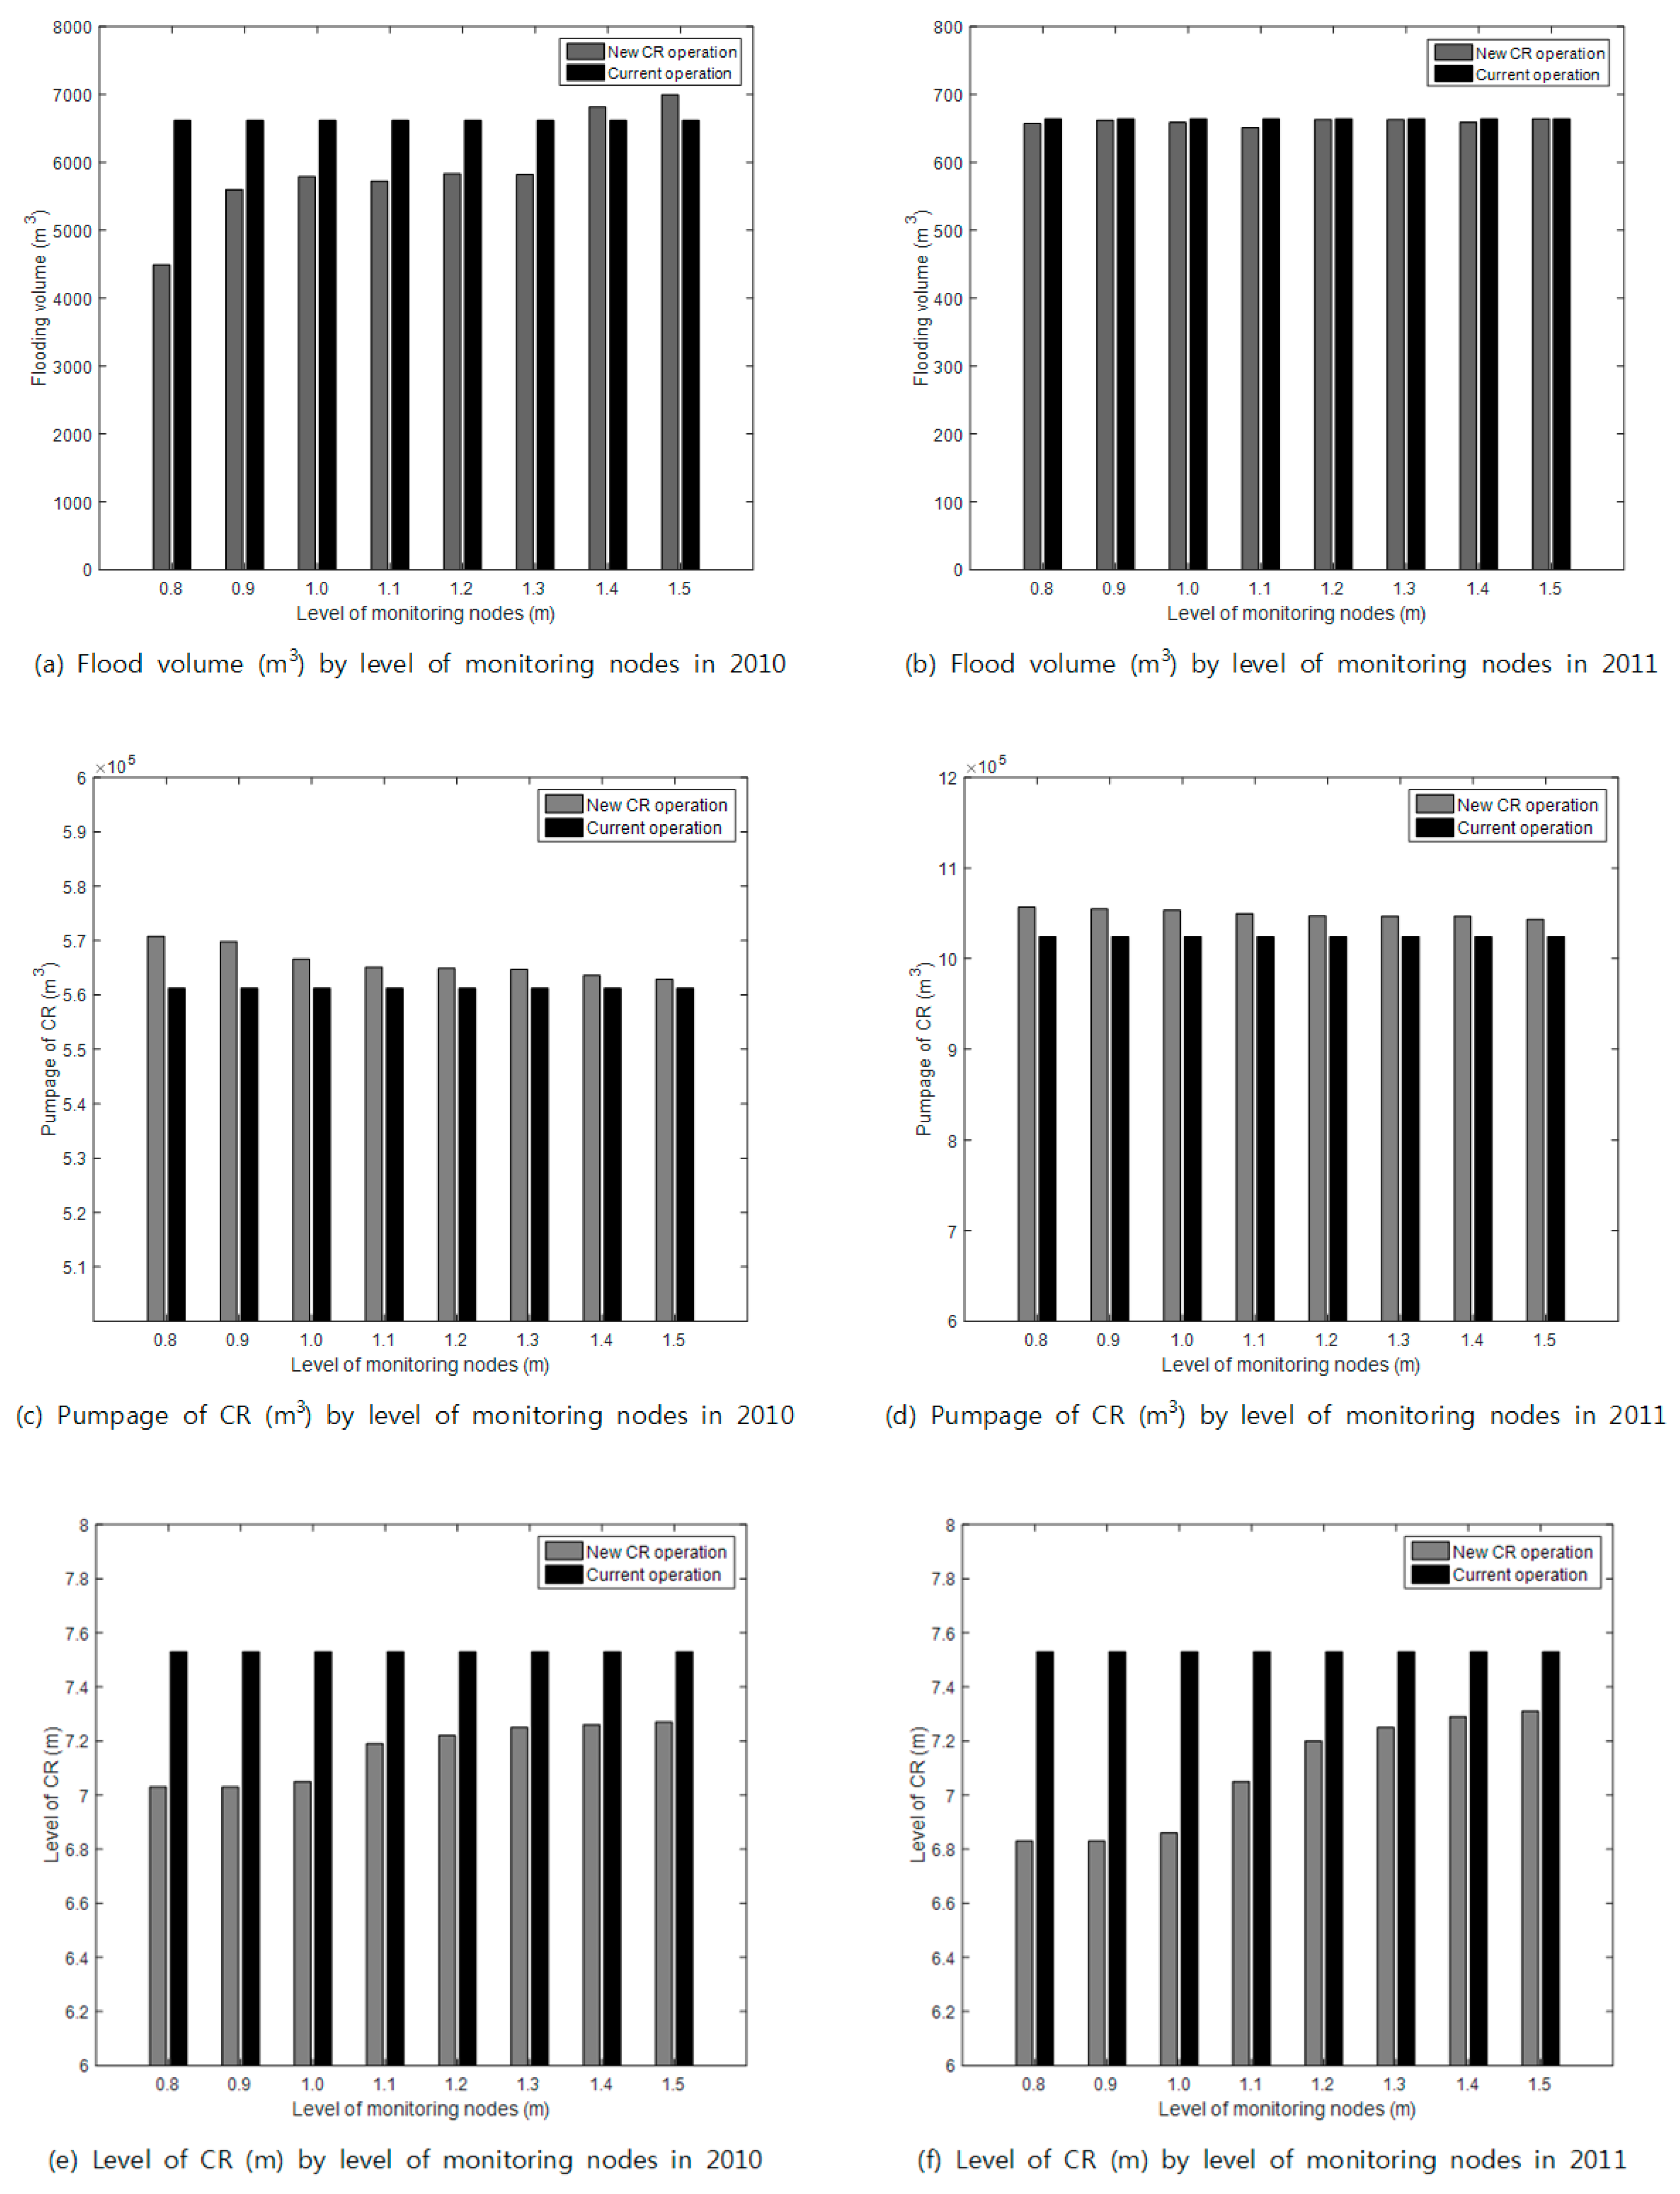
We set the pump discharge level at the monitoring node to 0.5 D (about 0.8 m), where D is total height, increasing to 1.0 D (1.5 m) in increments of 0.1 D, and simulate rainfall-runoff processes and pump operation independently for each case, in order to obtain flood volume. When the monitoring node level is below 0.5 D, the flood volume results are the same as for 0.5 D because reducing the level in CR (reducing the backwater effect) is not related to reducing flooding when the monitoring node level is low. We assess the results by applying rainfall from the two events of 23 September 2010 and 27 July 2011 (Figure 12).
For the 2010 event, the new CR operation resulted in lower flood volume than with the current operation, except at high monitoring node levels (1.4 m–1.5 m) (Figure 12a). Anomalous results at 1.4 m and 1.5 m by CR operation are based on current DR operation. Higher flood volumes than the current operation can be achieved if pumps are operated when monitoring node levels are high because pumps are operated according to DR levels in the current DR operation. For the 2011 event, all flood volumes were lower than those of the current CR operation (Figure 12b) because the CR level was low due to early operation of pumps, and the level decreased in upstream nodes, including flooding nodes. Figure 12b also shows that the largest flood volumes occur in the high and low monitoring node levels, but the smallest flood volumes occur in the medium monitoring node levels.
Figure 12c,d show the pumpage of CR at the time corresponding to the level of monitoring nodes in 2010 and 2011, respectively, and Figure 12e,f show the level of CR in 2010 and 2011, respectively. The results of the new CR operation were compared to that of the current operation. It was confirmed that the pumpage of CR decreases (Figure 12c,d) and the level of CR increases (Figure 12e,f) as the level of monitoring nodes increases. Therefore, total flooding volume is affected by the pumpage of CR triggered by the level of monitoring nodes under the new CR operation in which proactive pumping for the reduction of the backwater effect is capable. On the other hand, the pumpage and level of CR under the current operation do not affected by the level of monitoring nodes.
Flood volume is small if there is enough storage space in DR when the level in the sewer conduits is high. Flood volume is large if there is scant storage space in DR when the level in the sewer conduits is high. However, the CR operation results vary depending on monitoring node levels due to the impact of DR operation; current DR operation is used to compare the current and new CR operations. Current operation of the DR is not related to the level of the sewer conduits, but depends on the interior level of the DR. Thus, if DR discharge coincides with the peak level in the sewer conduits, it augments the flood volume.
Flood volume patterns corresponding to various monitoring node levels for the 2010 and 2011 events differ in Figure 12. Flood volume in the new CR operation is higher than the current operation despite the low level of CR when the level of monitoring nodes are high. It is based on the capacity limitation of CR. There are irregular flooding patterns because the frequency of 2010 and 2011 rainfall events are over 100 years though the design frequency of CR is 30 years. Additionally, it is due to the locations of peak rainfall events and the CR level at the time of the peak rainfall events.

3.4. Operation of DR Based on Monitoring Node Levels

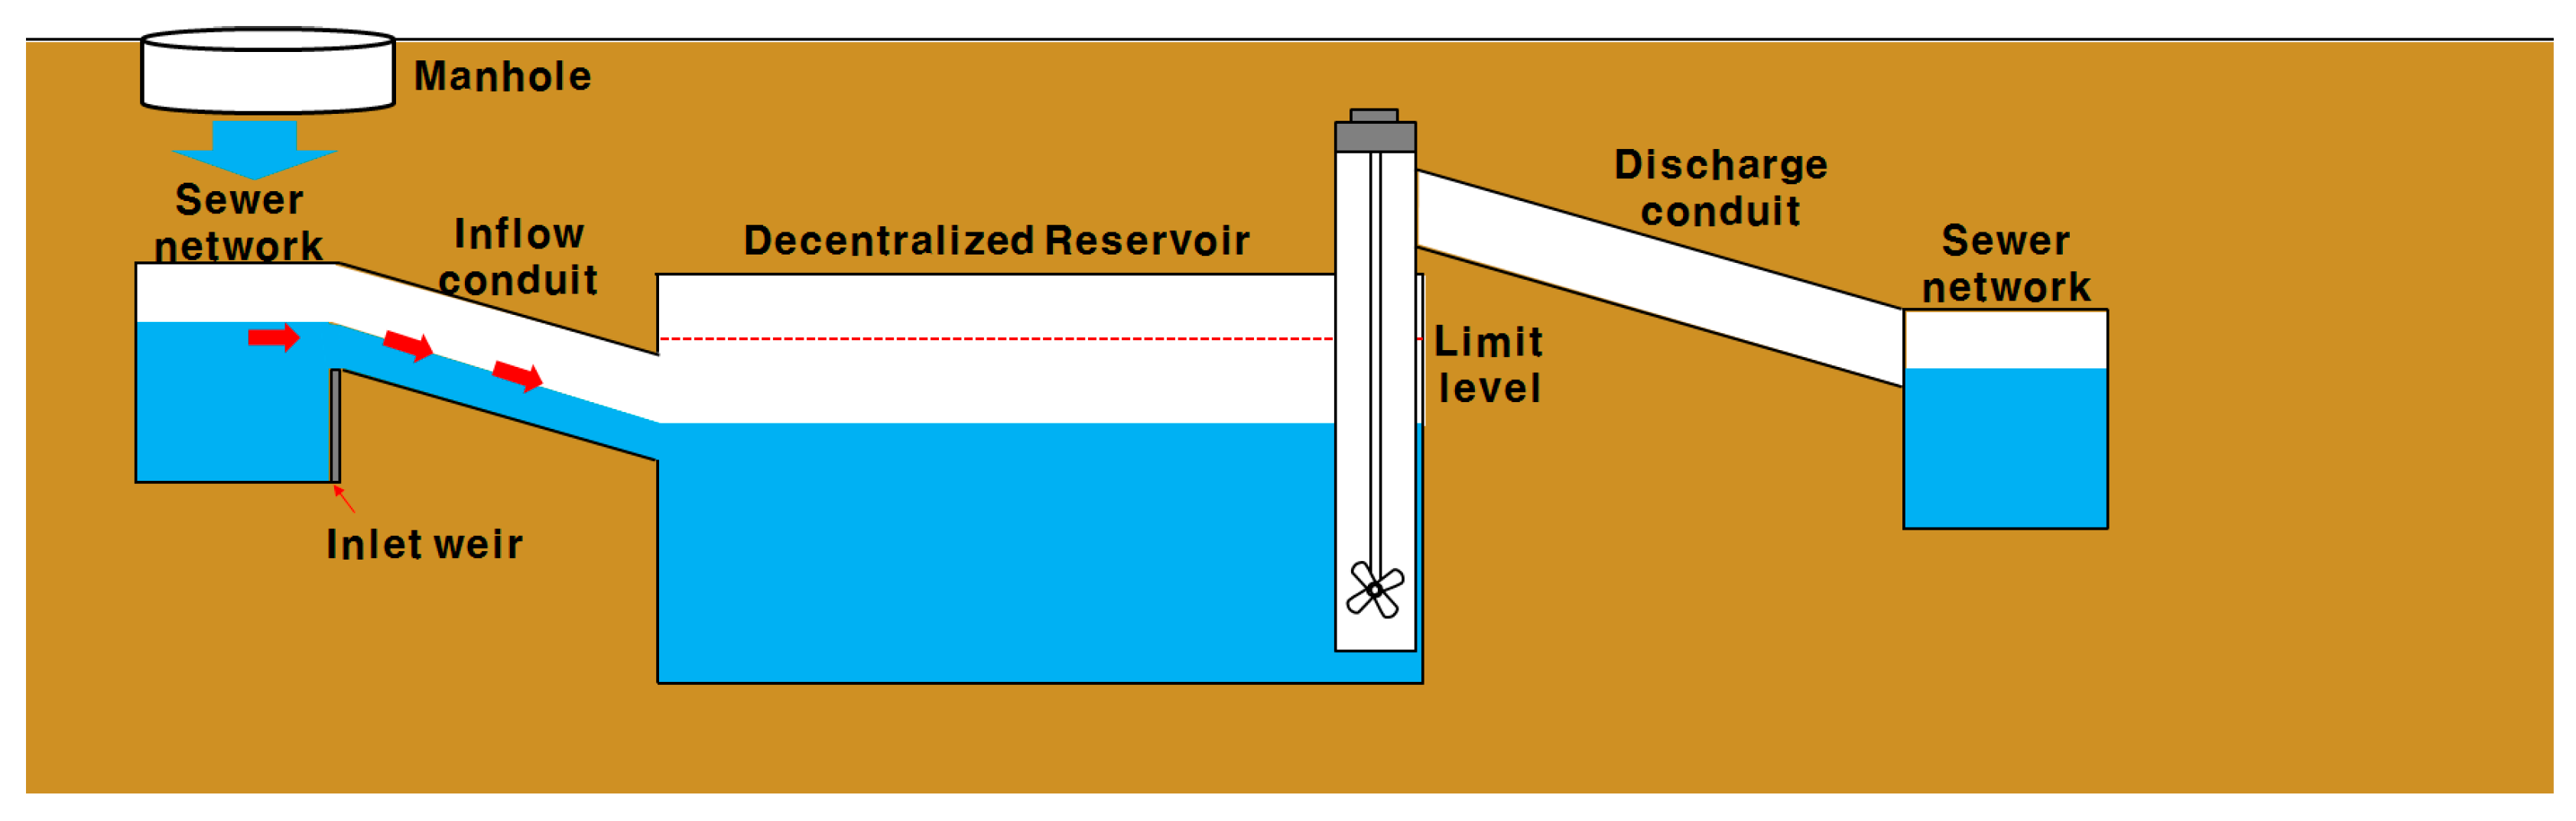
Current operation of the DR is performed as follows. Inflow from sewer conduits enters through the inlet weir. If it is not possible to drain naturally, drainage pumps are used in the detention reservoir. DR operation is controlled by discharge conditions. Discharge from the DR starts when the interior level reaches the limit level, or when the rainfall is determined to have ended. The DRs in urban areas are generally installed to make up for the lack of water delivery capacity in the sewer conduits. Even with low intensity rainfall, water overtops the weir of the inflow conduit, and storage in the DR is initiated. However, if rainfall continues, the DR is already full after the low intensity rainfall and cannot take additional water from the sewer conduits.
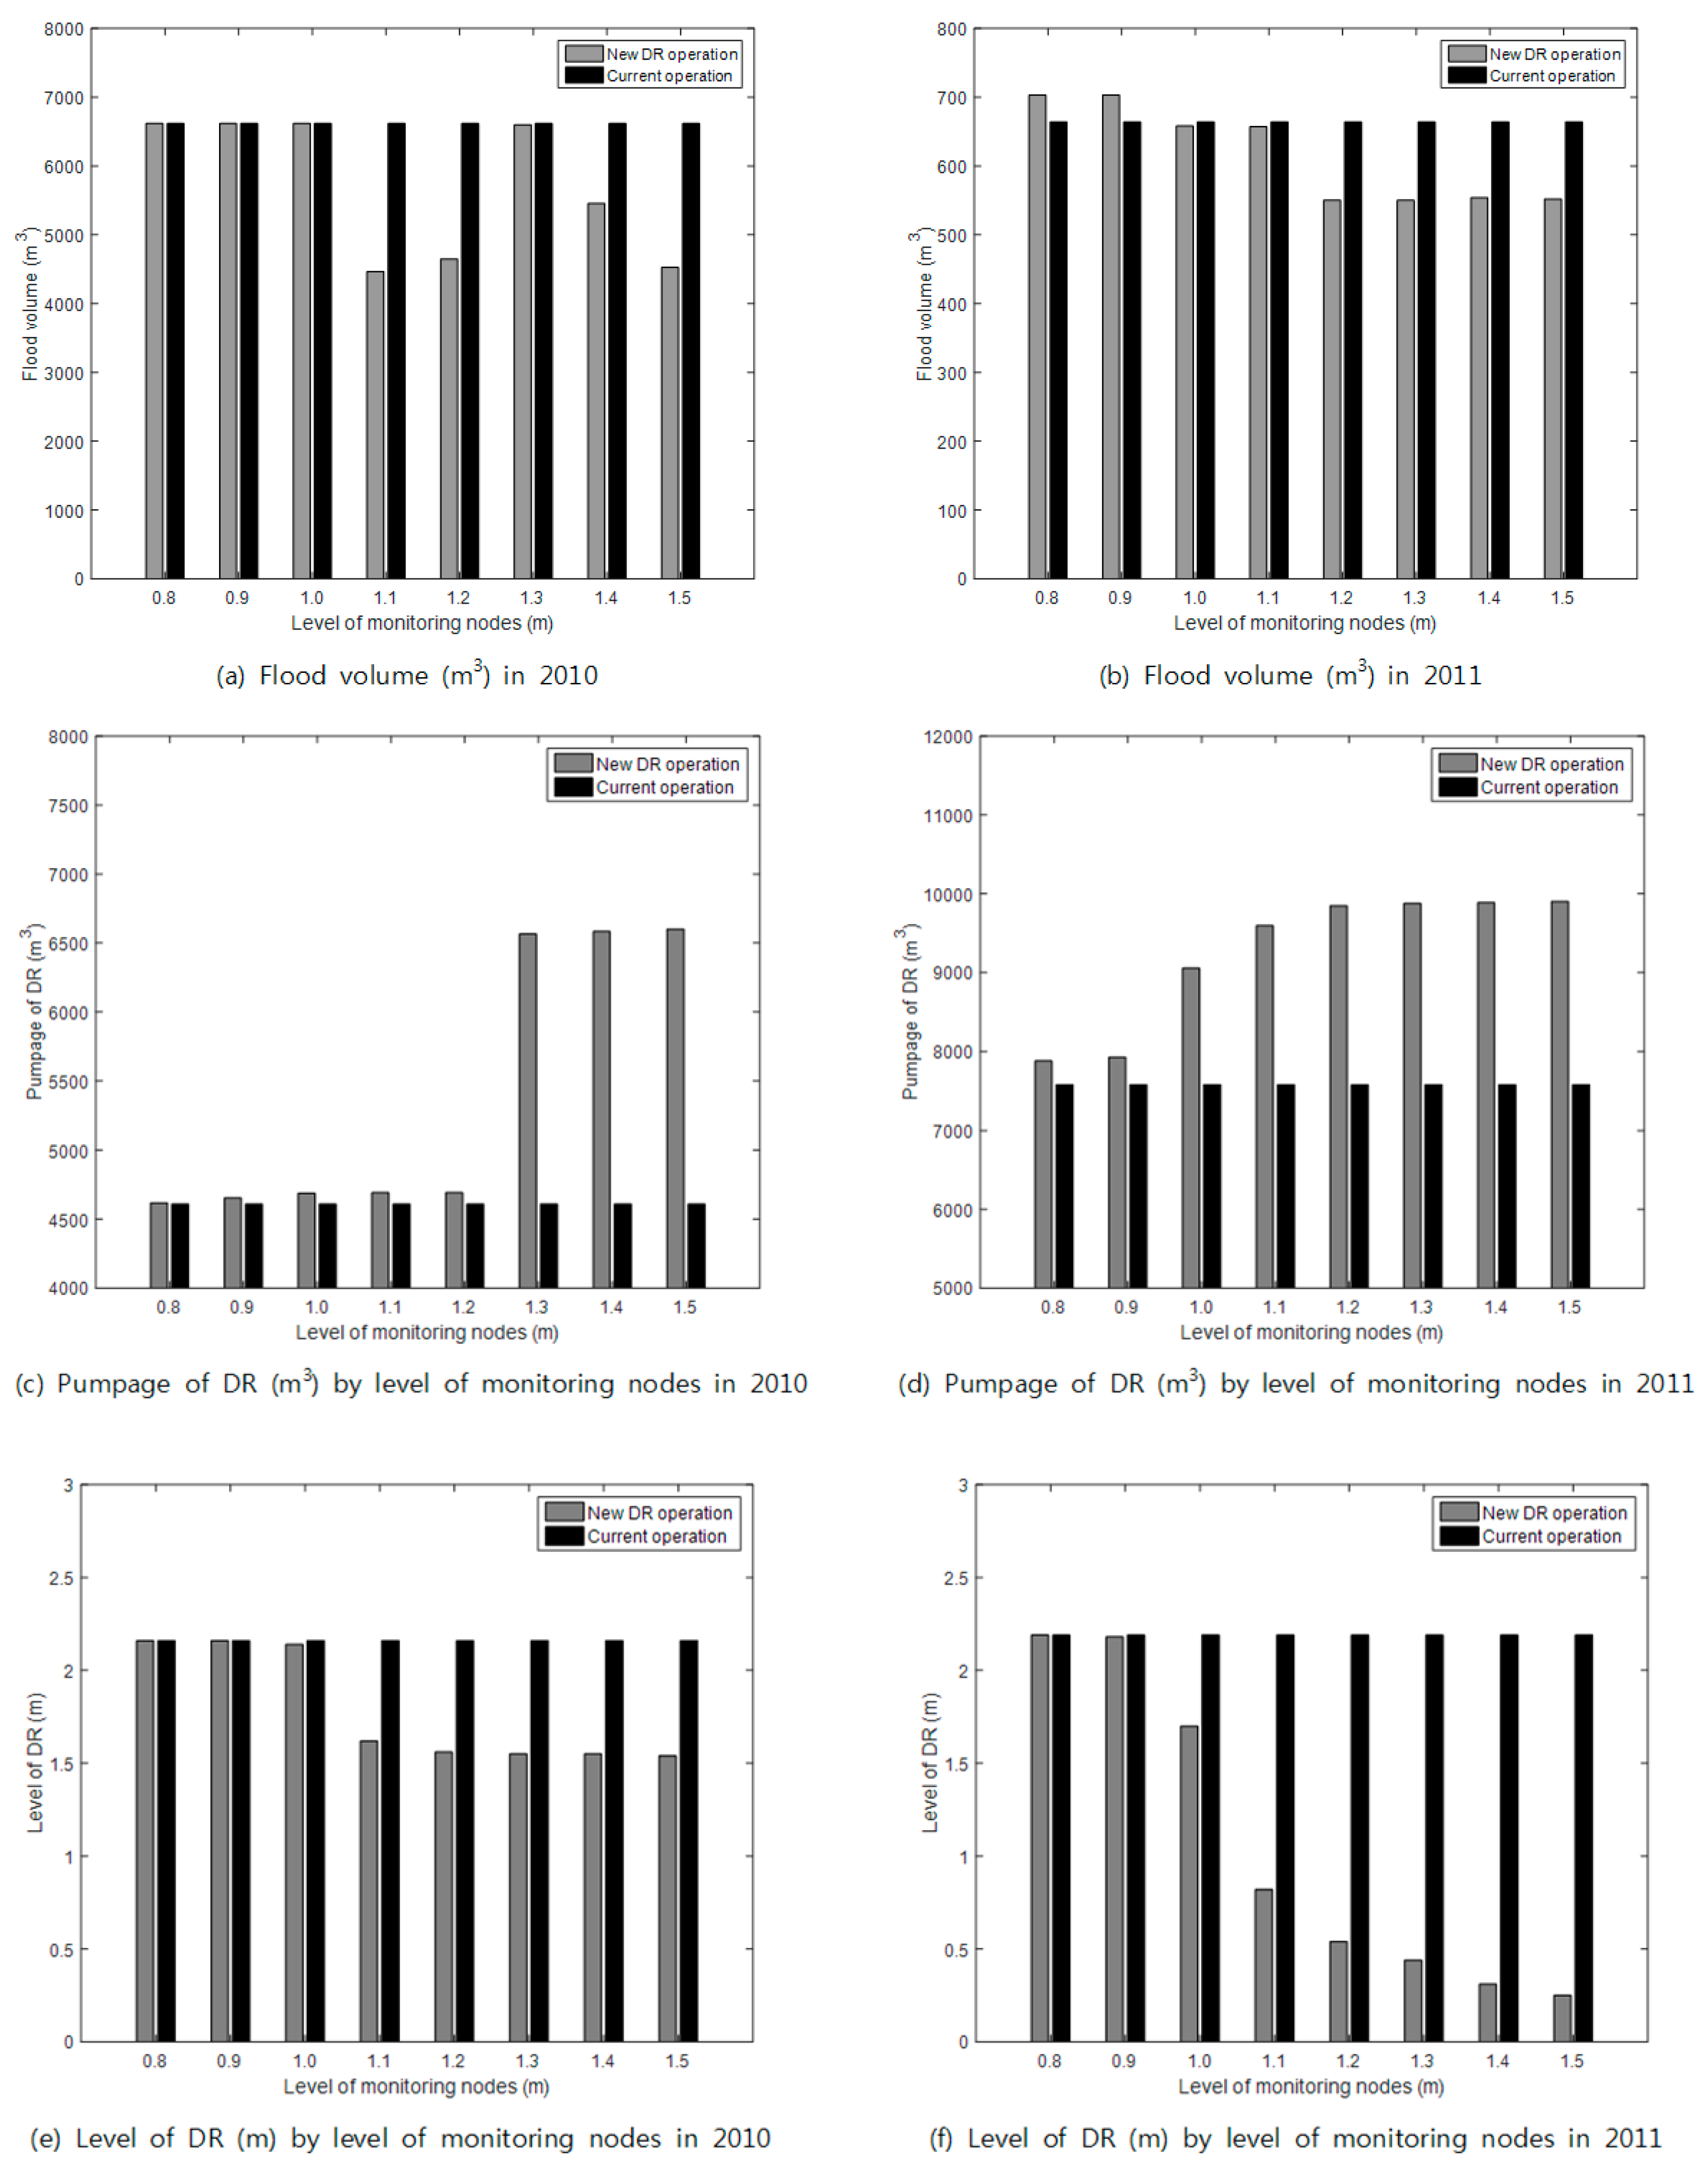
In this section, the new operation is applied to determine DR discharge depending on monitoring node levels (Figure 13). For the 2010 event, results of the new DR operation are improved compared to those of the current CR operation (Figure 13a). Figure 14a also shows that the largest flood volume occurs in high and low monitoring node levels, but the smallest flood volume occurs in medium monitoring node levels, both for the same reason as for the results shown in Figure 12b. Flood volume is small if there is enough storage space in the DR when the level in the sewer conduits is high, and flood volume is large if there is scant storage space in the DR when the level in the sewer conduits is high. For the 2011 event, results at monitoring nodes with levels of more than 0.9 m are better than those of the current operation, but those for the 0.8 m and 0.9 m levels are inferior because pump discharge in the new operation is smaller than pump discharge in the current operation when discharge is ceased at low monitoring node levels. This means that the new operation obtains a smaller additional DR capacity than the current operation at low pump stop levels. The variation in new DR operation results with monitoring node level is due to the design capacity of the DR. Rainfall associated with the 2010 and 2011 events has a maximum return period of up to 100 years, while DR design capacity is only 20 years. Thus, it is difficult to prevent widespread flooding and the operational effects are inconsistent.
Figure 13c,d show the pumpage of DR at the time corresponding to the level of monitoring nodes in 2010 and 2011, respectively, and Figure 13e,f show the level of DR in 2010 and 2011, respectively. The pumpage of DR was significantly increased (Figure 13c,d) and the level of DR were dramatically decreased (Figure 13e,f) if the level of monitoring nodes is higher than or equal to 1.1 m which is identified as the critical level for flooding. The consequence of such operation is low flooding volume (Figure 13a,b).

3.5. Cooperative Operation of Urban Drainage Facilities

Various urban drainage facilities are operated in each area, often regardless of the sewer conduit conditions, and independent of other urban drainage facilities. However, other drainage facilities within the same drainage area should be considered in order to meet the goal of urban area drainage.
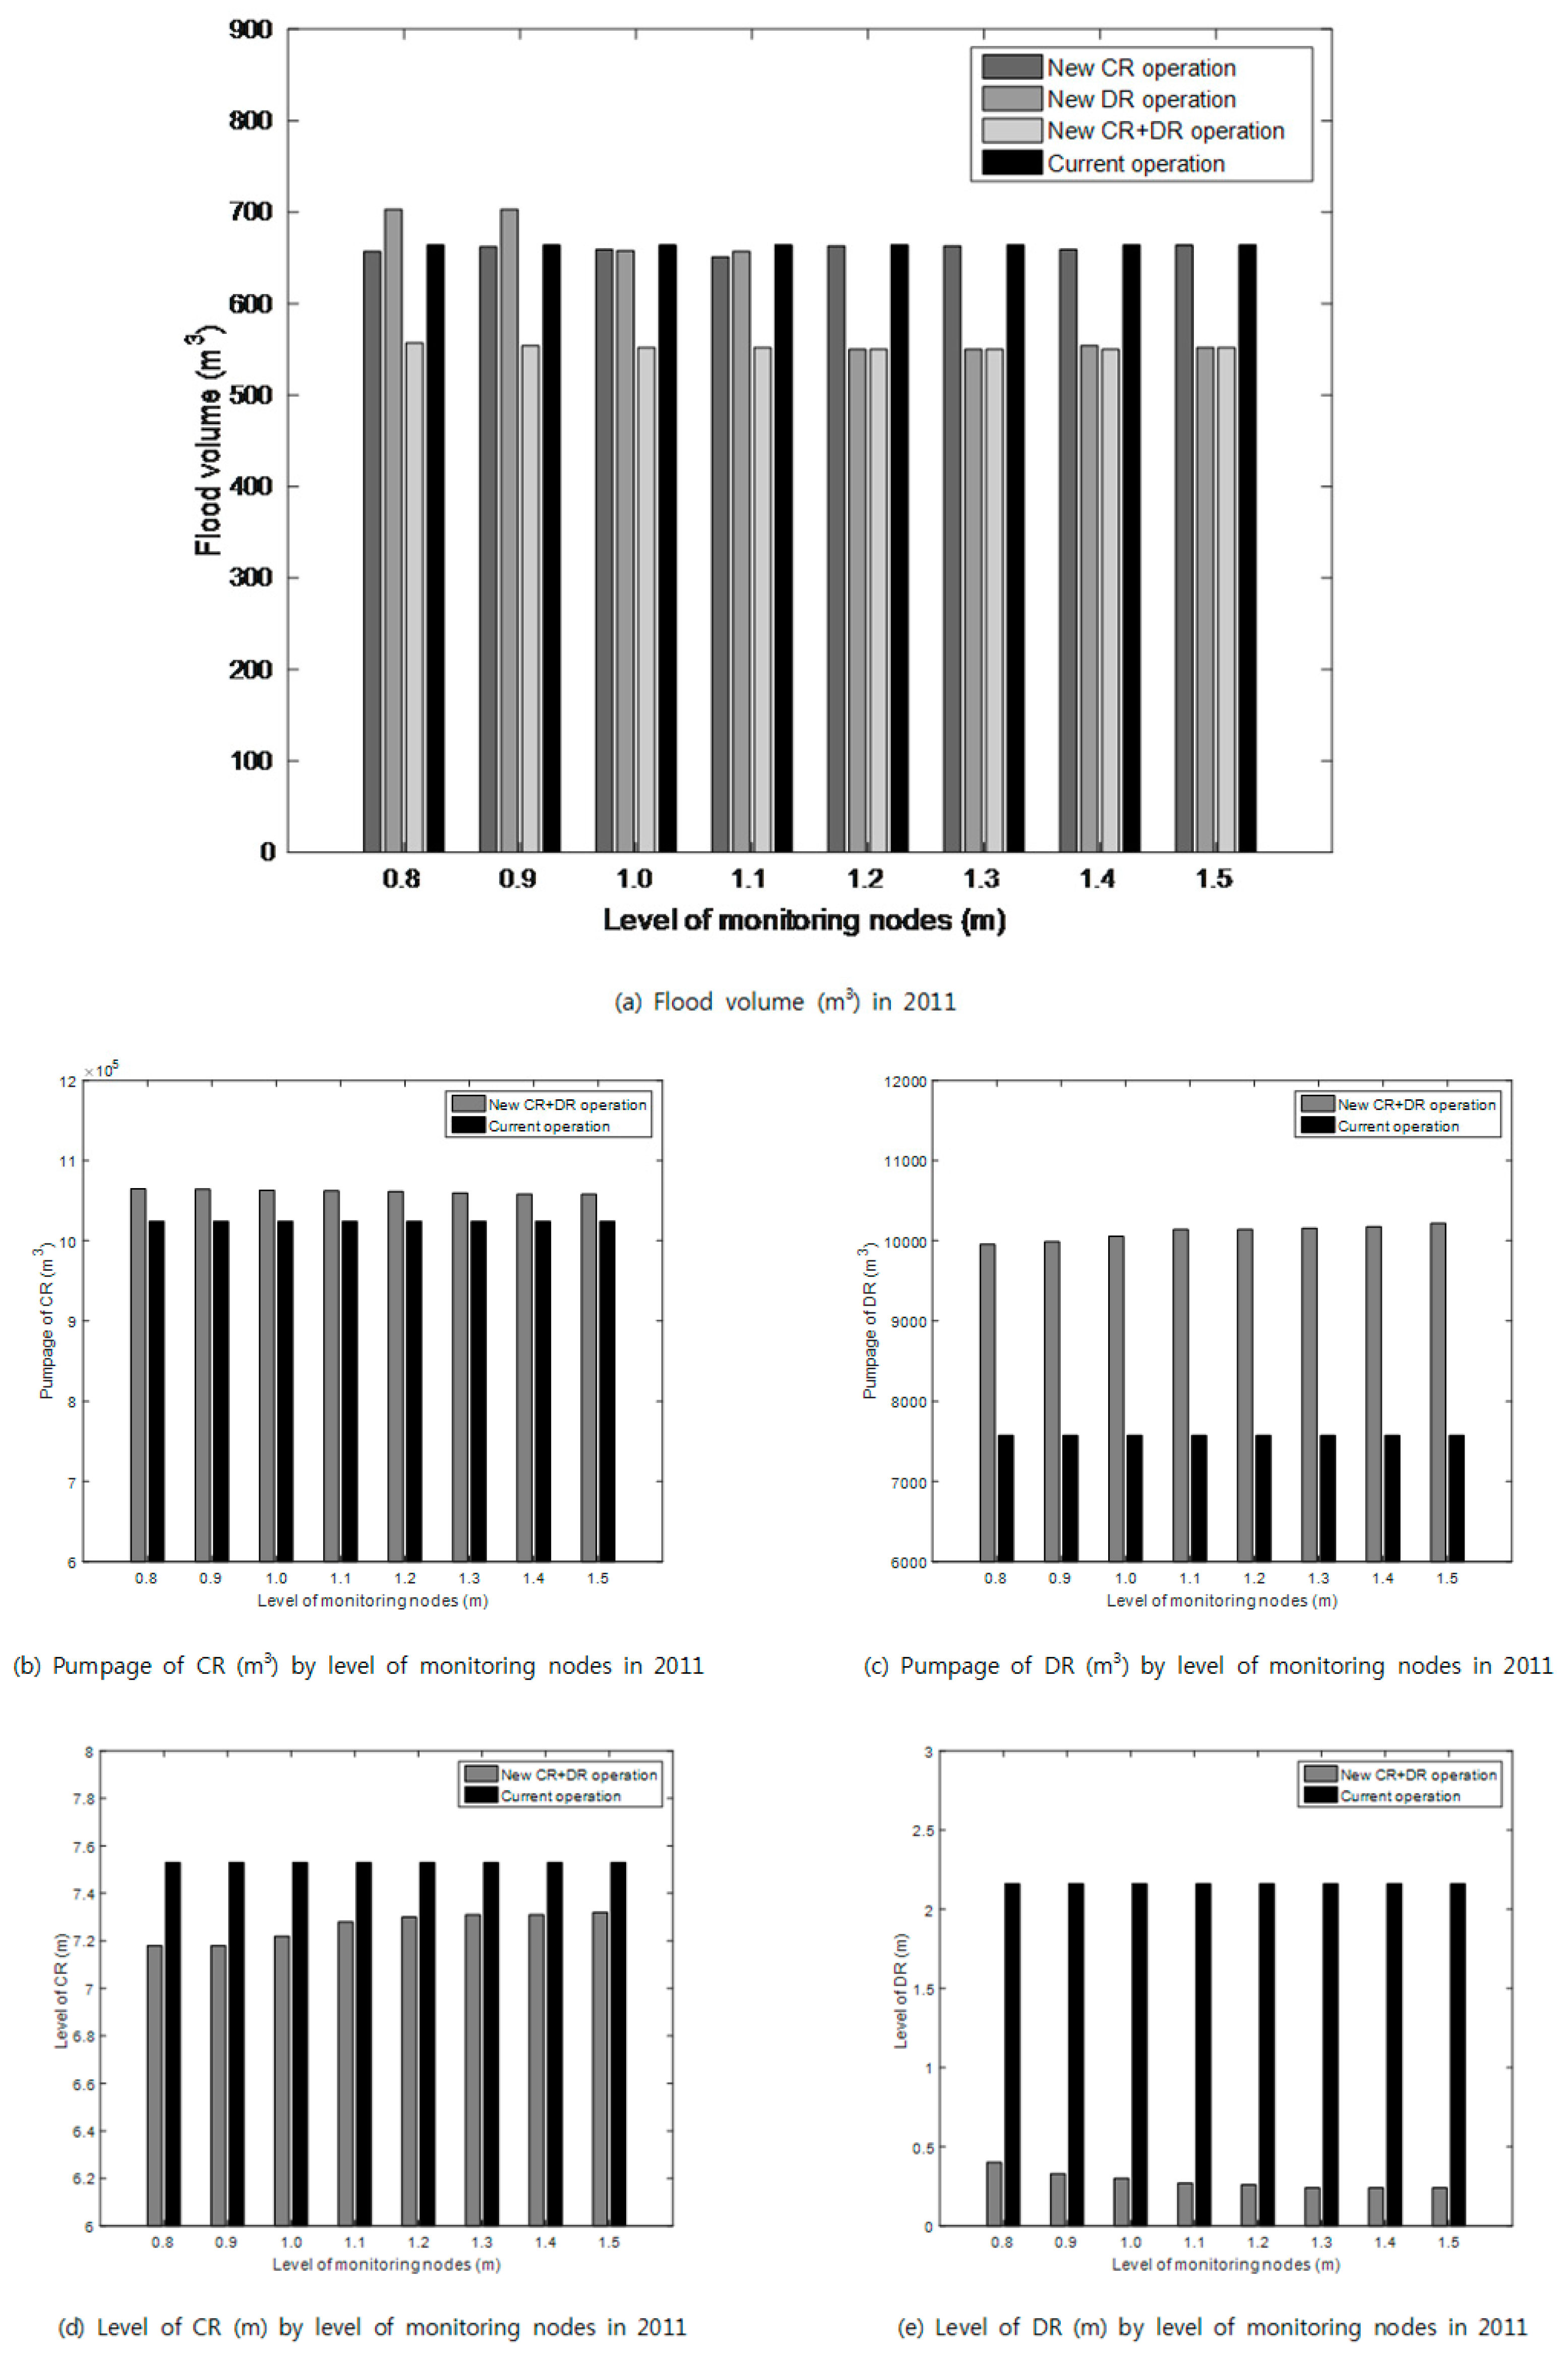
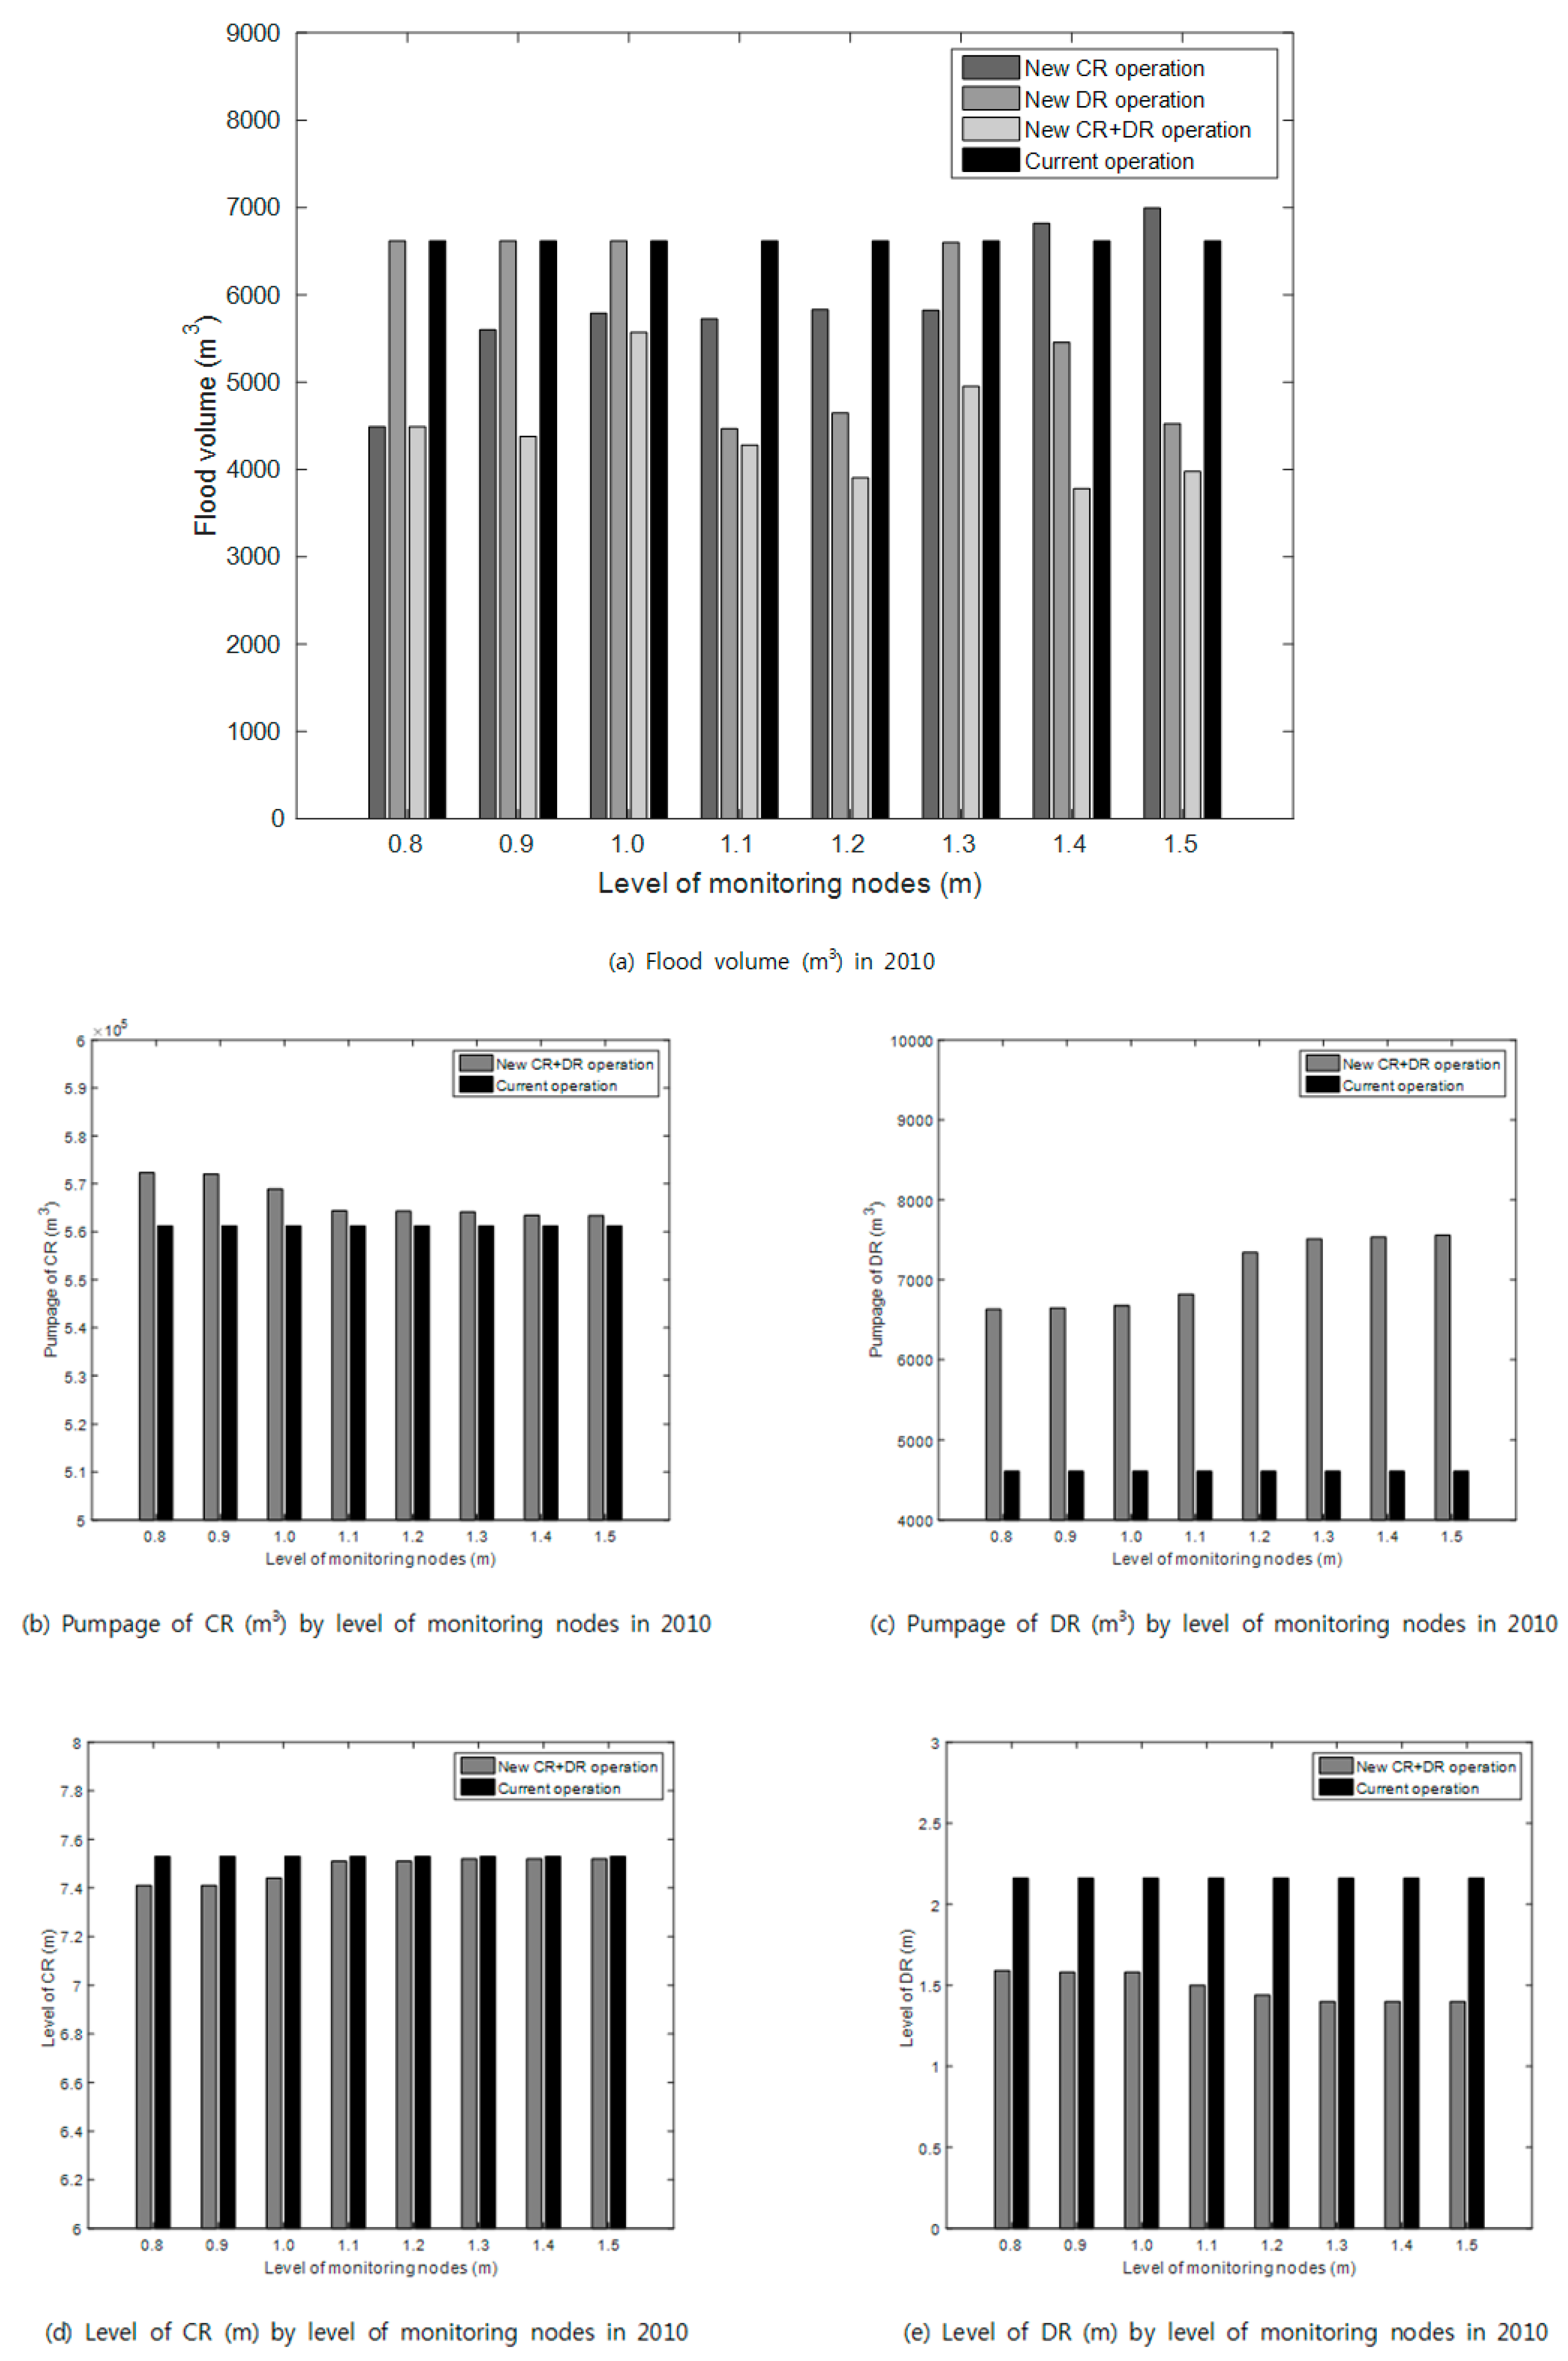
For proper operation of urban drainage facilities, including the CRs and DRs installed in urban areas, it is necessary to prevent flooding, because a lack of capacity increases the flood risk in the drainage system. However, when rainfall is continuous, it is necessary to efficiently share the flood volume across urban drainage facilities. In this section, cooperative operation of the CR and DR is applied at the monitoring nodes, and the results are shown in Figure 14 and Figure 15. For both 2010 and 2011, results of cooperative operation are superior to those of the current operation because CR/DR cooperative operation results in a smaller flood volume than all monitoring node levels of the current operation for 2010 and 2011 (Figure 14a and Figure 15a, respectively). This is due to the detention effectiveness of DR operation and the rapid drainage effectiveness of CR. However, the same variability as the CR and DR operations is observed across the monitoring node levels, due to the way the DR operation is included.
The pumpage of CR and DR and their level under the cooperative operation were compared to those under the current operation. Figure 14b,c show the pumpage of CR and DR, respectively, with respect to the level of monitoring nodes under two operations in 2010. Figure 14d,e show the level of CR and DR in 2010, respectively. Figure 15b,c show the pumpage of CR and DR in 2011, respectively, and Figure 15d,e show the level of CR and DR in 2011, respectively. Regardless of the year of rainfall event, overall pumpage of CR and DR is higher than that of the current operation (Figure 14b,c and Figure 15b,c) and the level of CR and DR is lower than that of the current operation (Figure 14d,e and Figure 15d,e). The pumpage and level of CR and DR in both events show similar patterns (as seen in Figure 12 and Figure 13, although attenuated increase and decrease were observed for the pumpage and level of DR, respectively (Figure 13c–f)). The notable point is that the CR/DR cooperative operation results in high pumpage and low level of CR and DR at all levels of monitoring nodes, compared to the current operation. As we confirmed from the previous two cases (the new CR operation and the new DR operation), it is originated from rapid drainage of CR and detention effectiveness of DR.

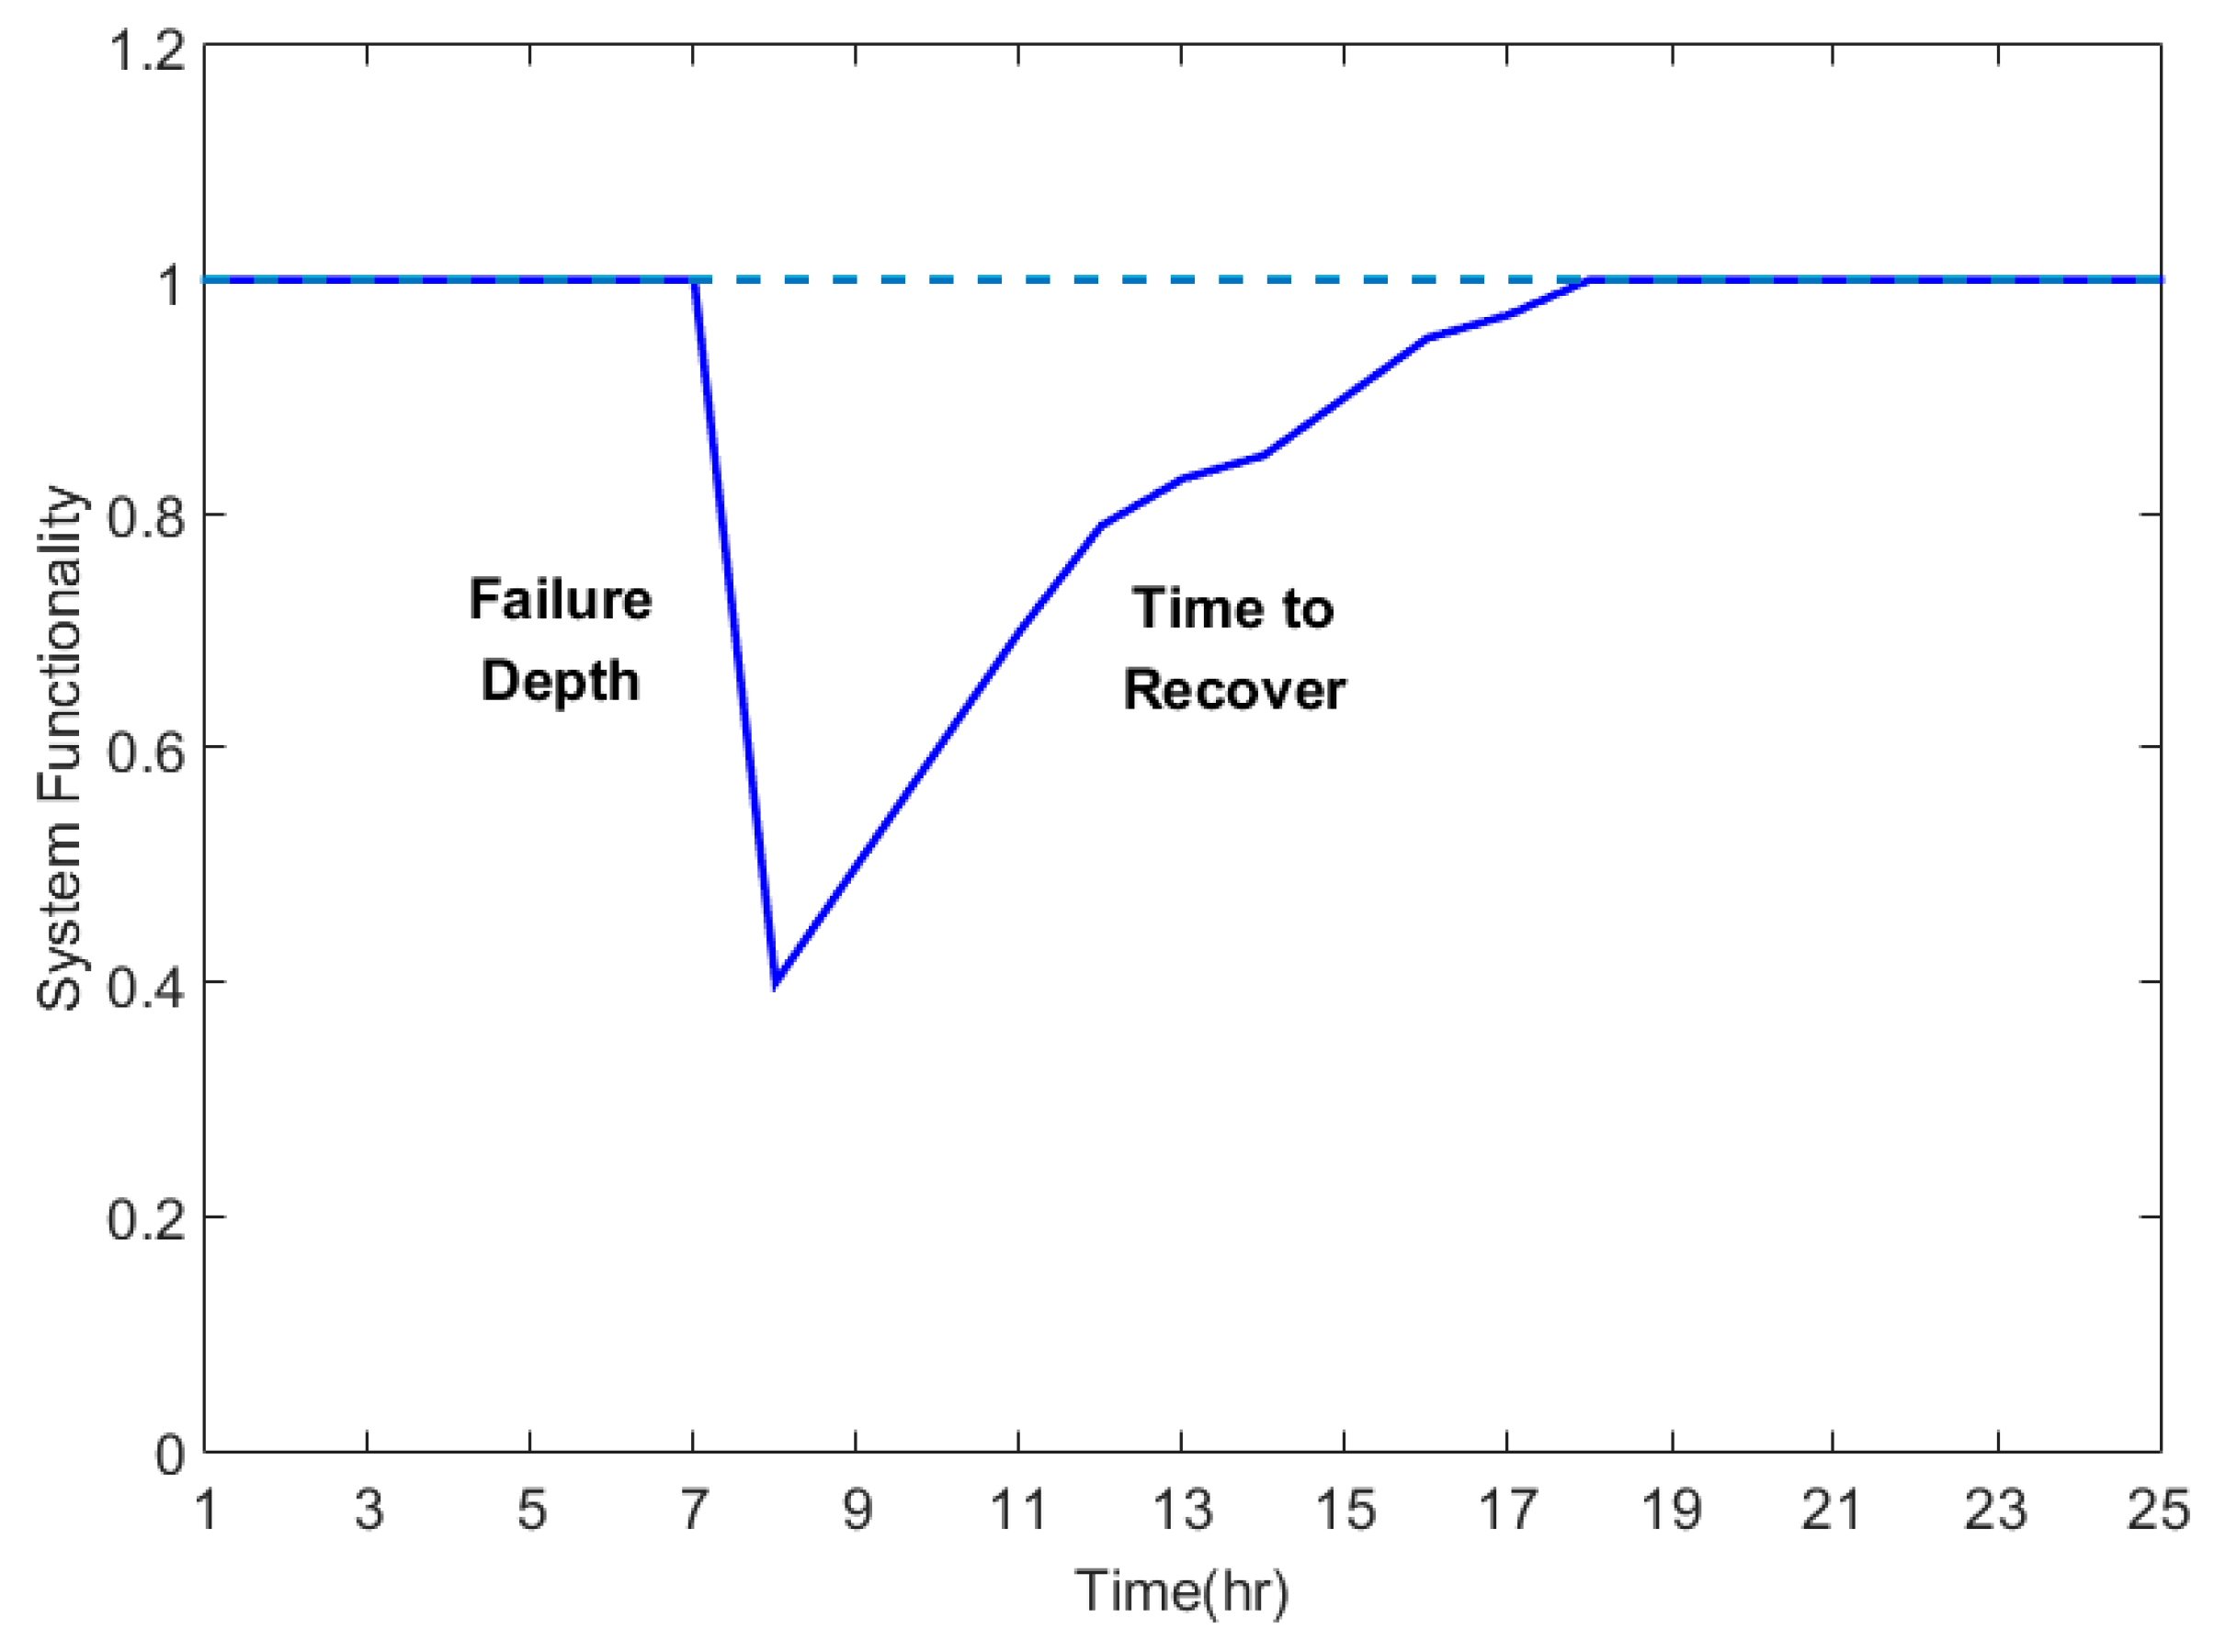
3.6. Evaluation of Urban Drainage System Resilience

Results of resilience evaluations for each operation method are shown in Table 5. We assess resilience at a monitoring node level of 1.1 m for each operation using the 2010 and 2011 rainfall event. It is found that the resilience of the urban drainage system increases in each new operation compared to the current. The highest resilience is obtained under cooperative operation (CR + DR in Table 5).
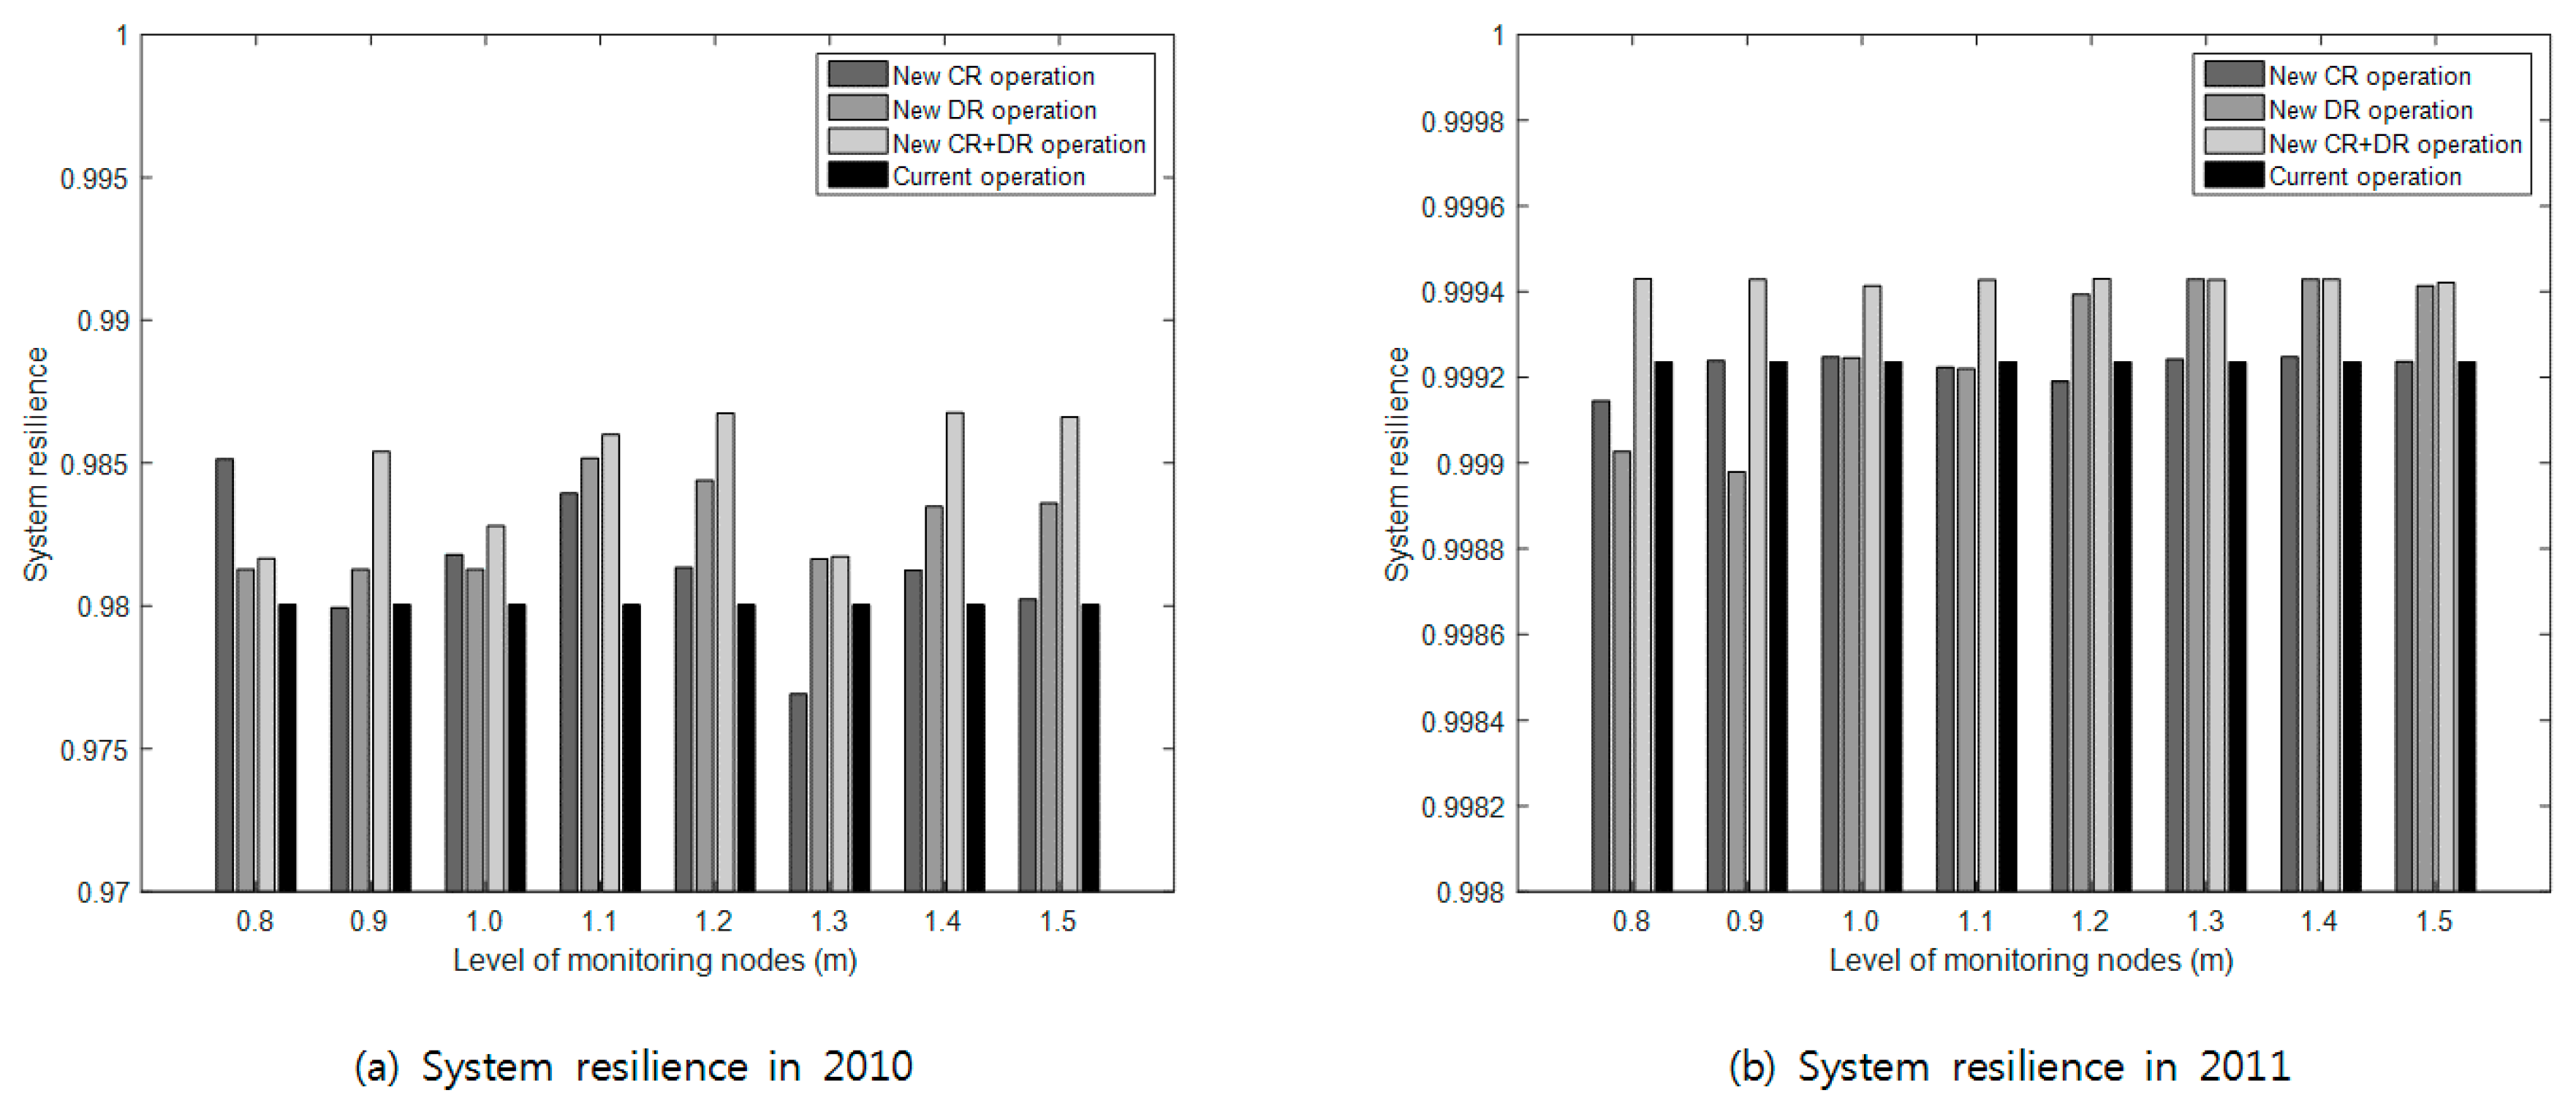
The results of system resilience vary with different monitoring node level, as shown as Figure 16. In the results of 2010, CR operation shows somewhat less resilience than the current operation, though the DR operation shows better resilience than the current operation. When the monitoring node level is 1.1 m, all operations, including CR operation, DR operation, and CR/DR cooperative operation, show better resilience than the current operation.
The irregular patterns related to the monitoring node levels for both 2010 and 2011 are due to the discharge conditions in the DR. Discharge is conducted when the DR level reaches the limit level. The current DR operation and the DR operation in this study include this condition. Furthermore, there are several conduits with a reverse slope in the target basin. Generally, almost all sewer conduits have a slope because flow is induced by gravity; however, the design is a kind of inverted siphon due to the presence of a variety of obstacles, including Internet cables. This can result in irregular flow in the sewer network and therefore irregular patterns of system resilience.
In the results of 2011, individual operations, including CR operation and DR operation, show better results than the current operation in some parts and worse results in other parts, although CR/DR cooperative operation always shows better results than the current operation. The inferior resilience of individual CR and DR operation compared to historical operation is related to the current operation of DR and the available storage capacity in DR during the peak rainfall period. Current DR operation in CR operation starts to discharge based on the DR level, without considering the monitoring node levels. If current DR operation in individual CR operation starts to discharge pumps when monitoring node levels are high, the flood risk will be higher than for both current and cooperative operation, and system resilience will be lower than both current and cooperative operation.
Additionally, individual DR operation is inferior to the current operation in 2011 when the monitoring node levels are 0.8 m and 0.9 m. In DR operation, the DR reserves water if the monitoring node levels are high, though the DR operates the drainage pumps in the current operation when the DR level reaches the limit level. DR operation can show higher flood volumes than the current operation if the peak rainfall period occurs when the monitoring node levels are high, and the DR reserves water in DR operation. The system resilience of DR operation can be lower than both current and cooperative operation because of the available DR storage capacity when during the peak rainfall period. Furthermore, the individual operation of CR and DR over 30 and 20 years, respectively, is insufficient because the maximum return periods for 2010 and 2011 rainfall events are as long as 100 years. Therefore, it is difficult to overcome the drawbacks related to shortages in design size in individual CR and DR operation. For the 2010 rainfall event, the minimum increase for CR/DR cooperative operation compared with the current operation is 0.001612, and the maximum increase is 0.006716. For the 2011 rainfall event, the minimum increase is 0.000177 and the maximum increase 0.000194.
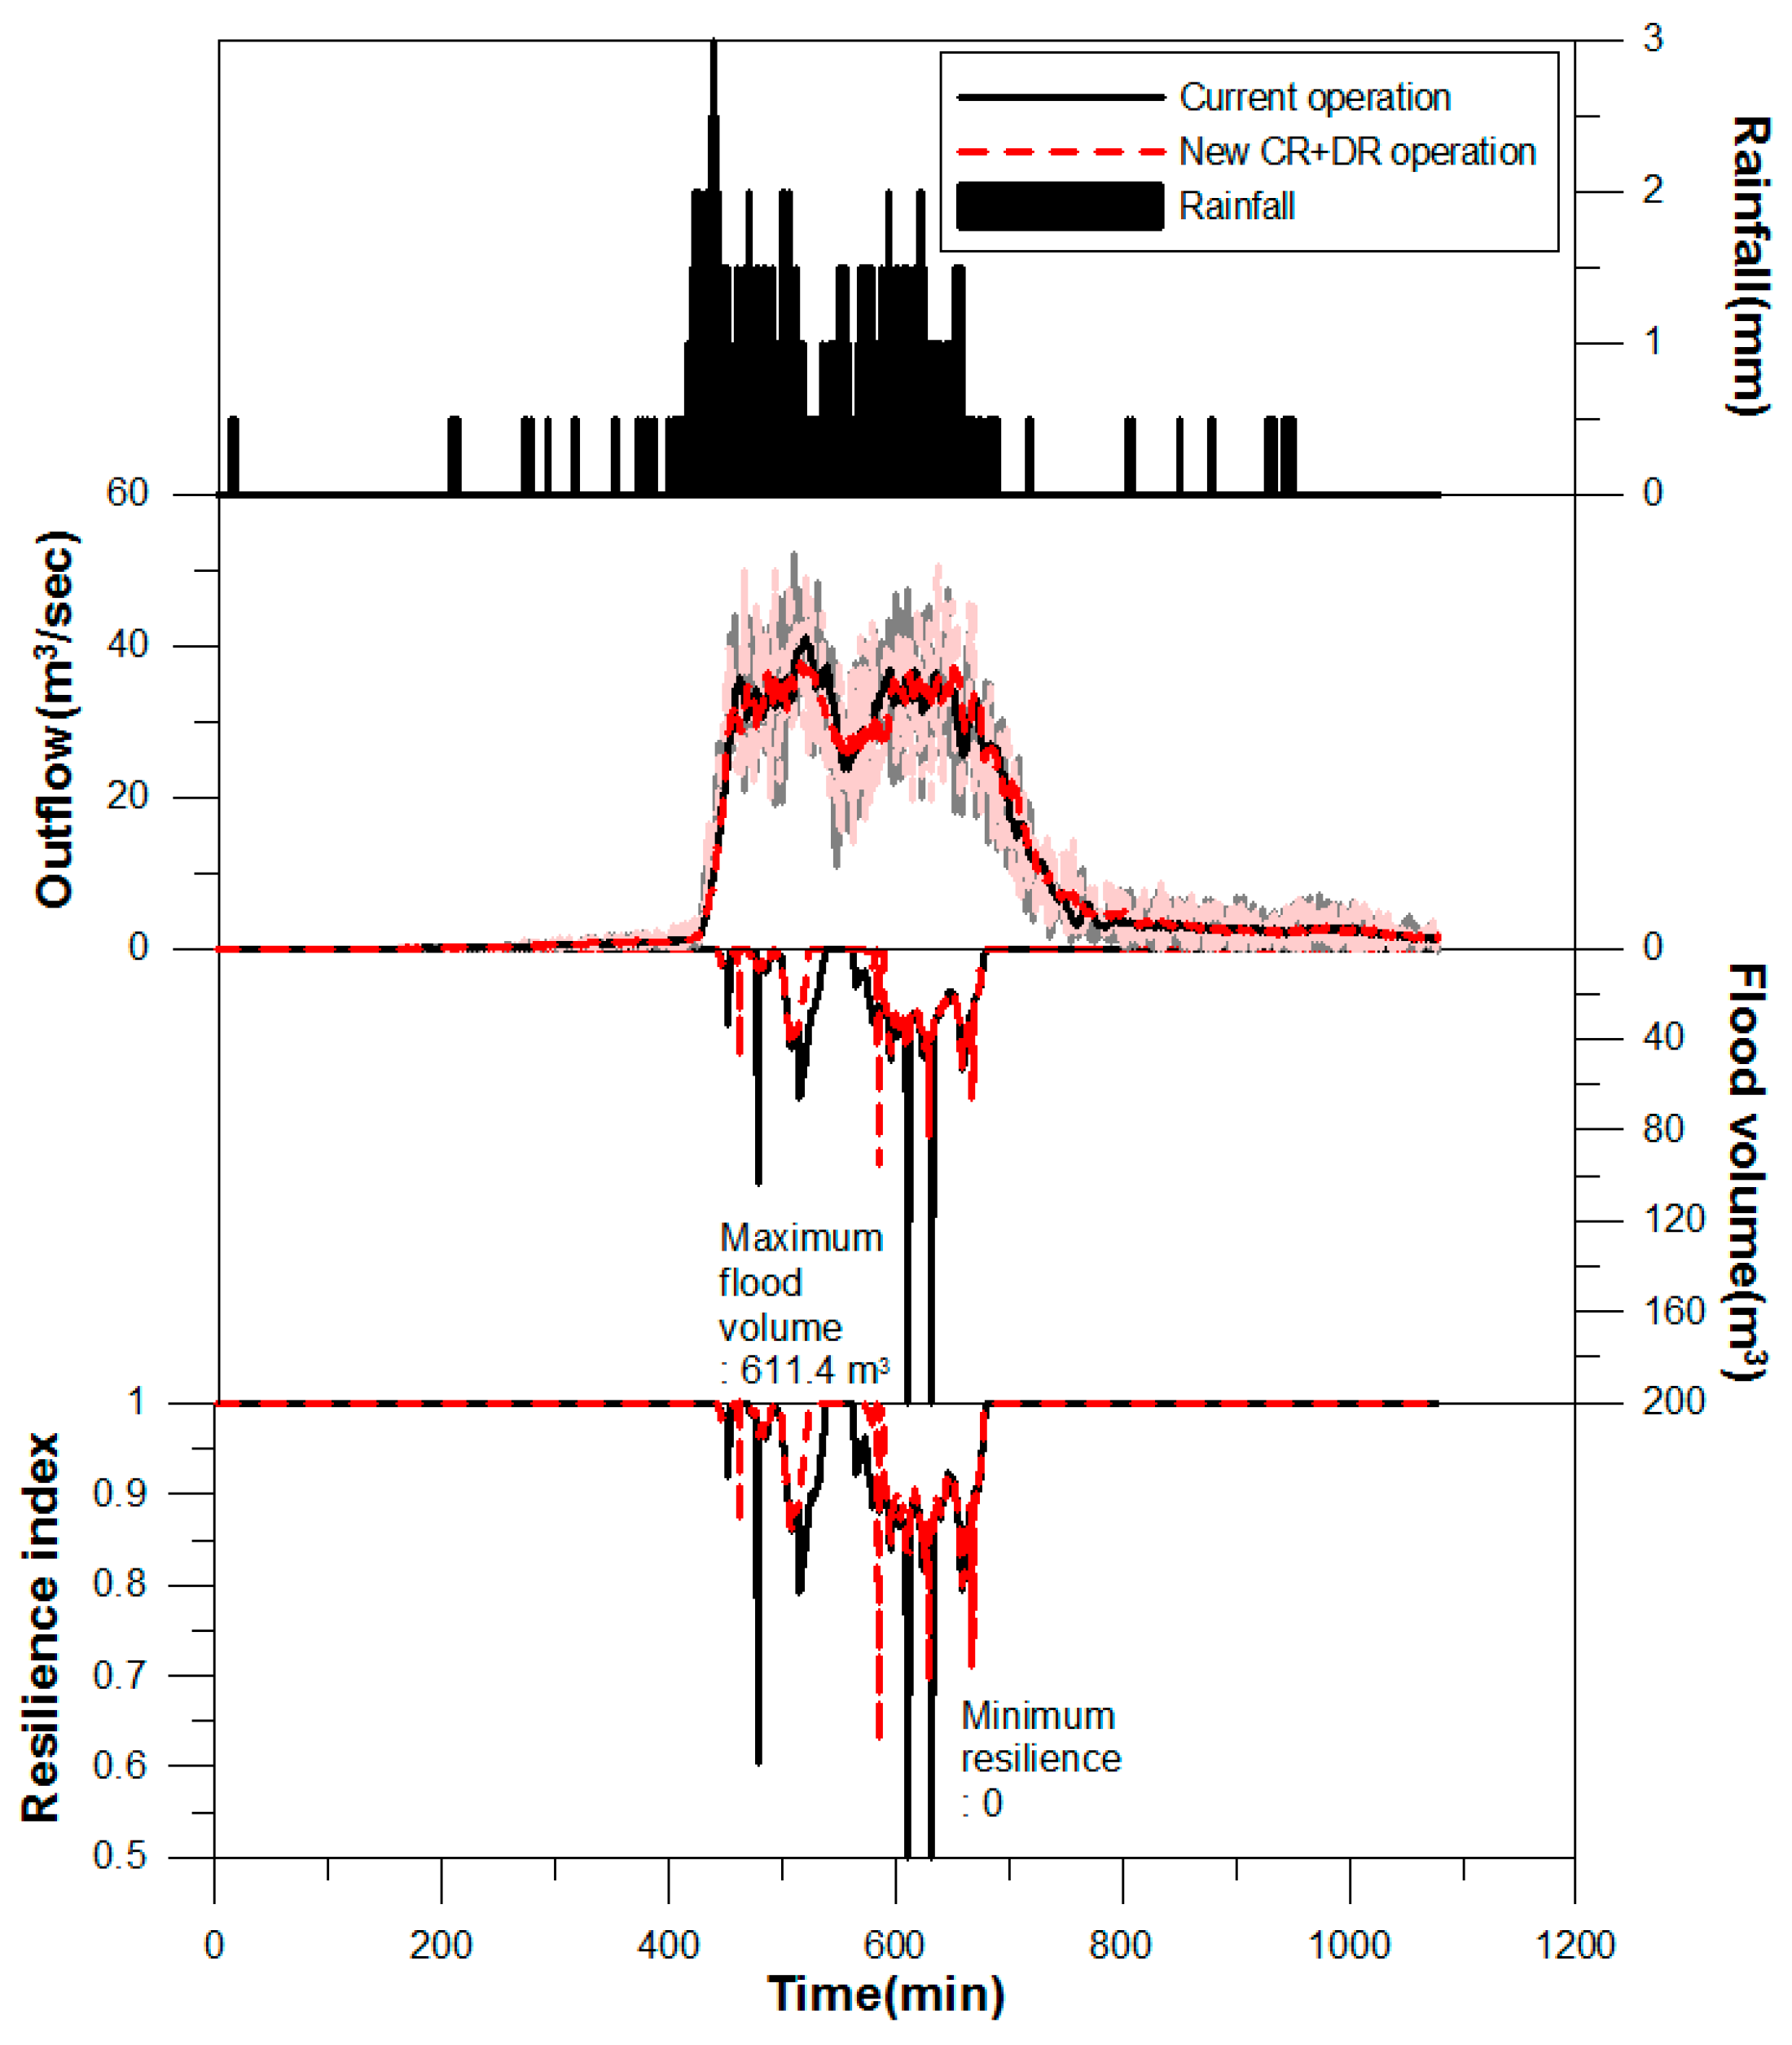
Figure 17 shows variations in rainfall, runoff, flood volume, and resilience over time for the 2010 event. Rainfall and runoff volume has two peaks, at 450 min and 650 min, respectively. Peak runoff volume in the CR, DR, and CR + DR operations is very similar, but is slightly higher under the current operation. Patterns of flood volume over time are similar to those of the resilience index. Considering the differences between the current and new operation in terms of rainfall and runoff relationships, the flood volumes associated with the first rainfall peak are not substantially different, but there is a significant difference associated with the second rainfall peak because the flood volume and resilience index differ greatly between the current operation and the CR/DR cooperative operation. The flood volume at the 650 min peak is 611.4 m3 in the current operation but 100 m3 in the CR/DR cooperative operation, which is the greatest difference for the whole period. The resilience index in the current operation is 0, but the resilience index in the CD/DR cooperative operation is 0.65. One of the reasons for the good results of the cooperative operation is due to draining the CR prior to subsequent storms, which reduces the CR level and mitigates the backwater effects of the CR.

4. Conclusions

The first result is the difference between the current and new operation of the CR. The current operation is controlled by CR level alone, while the new operation is more flexible and controlled by sewer conduit monitoring node levels. If the levels are high at the first and maximum flooding nodes, drainage pumps in the pump station are operated early. This process was applied to the rainfall events of 21 September 2010 and 27 July 2011. The best result was achieved when early operation occurred at a monitoring node level of 0.8 m. CR operation can improve the drainage effectiveness of CR in most cases.
The second notable result is the difference between the current and new DR operation. The current operation is controlled by DR level. The new DR operation is flexibly controlled through the sewer conduit monitoring node levels. When the level is low, discharge from the DR ensures sufficient space for additional inflow. When the level at monitoring nodes is high, drainage pumps in the DR are stopped. However, when the DR level is the same as the current operation, discharge by drainage pumps starts again. When monitoring node levels are around 1.1 to 1.5 m, the new DR operation shows better results than the current operation. DR operation can increase the detention effectiveness of DR in most cases. In some cases, DR operation and CR operation show worse results than the current operation, respectively. To improve flood mitigation effectiveness, cooperative operation between CR and DR is simulated and checked.
The third notable result is the difference between the current operation and the cooperative operation of urban drainage facilities (CR + DR operation). The current operation is performed depending on CR or DR level, but the condition of sewer conduits is not considered. The newly proposed cooperative operation determines storage or discharge at each urban drainage facility, depending on sewer conduit levels (determined at the monitoring nodes). When monitoring node levels are high, storage in the CR prevents flooding associated with backwater effects, and discharge from the DR prevents flooding by obtaining additional capacity. When monitoring node levels are low, the CR operates normally and the DR ensures additional space by discharge, depending on monitoring node levels. The results of cooperative operation for urban drainage facilities are better than those of the current operation. For the 2010 and 2011 events, the best results were observed when the monitoring node level was 1.4 m. Cooperative operation between CR and DR is superior to the current operation in all cases because cooperative operation has the advantages of both CR and DR operation.
Finally, we analyzed resilience as a new index for evaluating urban drainage systems. We calculated the resilience of the entire system using drainage volume and flood volume based on unit rainfall, time of concentration to target basin, and unit basin area. We assessed the resilience results for two significant rainfall events in 2010 and 2011, and found that cooperative operation of urban drainage facilities showed superior performance compared to the current operation.
All urban drainage systems are operated in drainage areas, but this study has shown that it is necessary to control CR drainage pump operation by taking into account urban stream levels. Moreover, it is necessary to conduct further studies on DR inlets, in order to allow the effective control of inflow volume.

Acknowledgments

This research was supported by a grant (13AWMP-B066744-01) from the Advanced Water Management Research Program funded by the Ministry of Land, Infrastructure, and Transport of the Korean government.

Author Contributions

Eui Hoon Lee and Yong Sik Lee carried out the survey of previous studies. Eui Hoon Lee and Donghwi Jung wrote the draft of the manuscript and revised the draft to the final manuscript. Eui Hoon Lee simulated CR operation, DR operation and CR/DR operation. Eui Hoon Lee, Joong Hoon Kim, Donghwi Jung and Jin Gul Joo conceived the original idea of the proposed method.

Conflicts of Interest

The authors declare no conflict of interest.

References

  1. Tingsanchali, T. Urban flood disaster management. Procedia Eng. 2012, 32, 25–37. [Google Scholar] [CrossRef]
  2. Andjelkovic, I. Non-Structural Measures in Urban Flood Management; IHP-V Technical Documents in Hydrology No. 50; UNESCO: Paris, France, 2001. [Google Scholar]
  3. Chung, J.H.; Han, K.Y.; Kim, K.S. Optimization of detention facilities by using multi-objective genetic algorithms. J. Korea Water Resour. Assoc. 2008, 41, 1211–1218. [Google Scholar] [CrossRef]
  4. Al-Hamati, A.A.N.; Ghazali, A.H.; Mohammed, T.A. Determination of storage volume required in a sub-surface stormwater detention/retention system. J. Hydro-Environ. Res. 2010, 4, 47–53. [Google Scholar] [CrossRef] [Green Version]
  5. Andrés-Doménech, I.; Montanari, A.; Marco, J.B. Stochastic rainfall analysis for storm tank performance evaluation. Hydrol. Earth Syst. Sci. 2010, 14, 1221–1232. [Google Scholar]
  6. Andrés-Doménech, I.; Montanari, A.; Marco, J.B. Efficiency of storm detention tanks for urban drainage systems under climate variability. J. Water Resour. Plan. Manag. 2012, 138, 36–46. [Google Scholar] [CrossRef]
  7. Chill, J.; Mays, L.W. Determination of the optimal location for developments to minimize detention requirements. Water Resour. Manag. 2013, 27, 5089–5100. [Google Scholar]
  8. Tao, T.; Wang, J.; Xin, K.; Li, S. Multi-objective optimal layout of distributed storm-water detention. Int. J. Environ. Sci. Technol. 2014, 11, 1473–1480. [Google Scholar] [CrossRef]
  9. Tamoto, N.; Endo, J.; Yoshimoto, K.; Yoshida, T.; Sakakibara, T. Forecast-based operation method in minimizing flood damage in urban area. In Proceedings of the 11th International Conference on Urban Drainage, Edinburgh, Scotland, UK, 31 August–5 September 2008.
  10. Graber, S.D. Generalized method for storm-water pumping station design. J. Hydrol. Eng. 2010, 15, 901–908. [Google Scholar] [CrossRef]
  11. Hsu, N.-S.; Huang, C.-L.; Wei, C.-C. Intelligent real-time operation of a pumping station for an urban drainage system. J. Hydrol. 2013, 489, 85–97. [Google Scholar] [CrossRef]
  12. Mugume, S.; Gomez, D.E.; Butler, D. Quantifying the Resilience of Urban Drainage Systems Using a Hydraulic Performance Assessment Approach. In Proceedings of the 13th International Conference on Urban Drainage, Sarawak, Malaysia, 7–11 September 2014; International Association for Hydro-Environment (IAHR): Perugia, Italy; International Water Association (IWA): Lisbon, Portugal, 2014. [Google Scholar]
  13. Gaudio, R.; Penna, N.; Viteritti, V. A Combined methodology for the hydraulic rehabilitation of urban drainage networks. Urban Water J. 2015, 13, 644–656. [Google Scholar] [CrossRef]
  14. Huff, F.A. Time distribution of rainfall in heavy storms. Water Resour. Res. 1967, 3, 1007–1019. [Google Scholar] [CrossRef]
  15. Korea Precipitation Frequency Data Server. Available online: www.k-idf.re.kr (accessed on 3 March 2016).
  16. Yoon, Y.N.; Jung, J.H.; Ryu, J.H. Introduction of design flood estimation. J. Korea Water Resour. Assoc. 2013, 46, 55–68. [Google Scholar]
  17. United States Environmental Protection Agency (USEPA). Storm Water Management Model User’s Manual Version 5.0; EPA: Washington, DC, USA, 2010.
  18. Lee, E.H.; Lee, Y.S.; Joo, J.G.; Kim, J.H. Development of operation in urban offline detention reservoirs. J. Korean Soc. Hazard Mitig. 2016, 16, 227–236. [Google Scholar] [CrossRef]
  19. House, M.A.; Ellis, J.B.; Herricks, E.E.; Hvitved-Jacobsen, T.; Seager, J.; Lijklema, L.; Aalderink, H.; Clifforde, I.T. Urban drainage—Impacts on receiving water quality. Water Sci. Technol. 1993, 27, 117–158. [Google Scholar]
  20. Cembrano, G.; Quevedo, J.; Salamero, M.; Puig, V.; Figueras, J.; Martı, J. Optimal control of urban drainage systems. A case study. Control Eng. Pract. 2004, 12, 1–9. [Google Scholar] [CrossRef]
  21. Mitchell, G. Mapping hazard from urban non-point pollution: A screening model to support sustainable urban drainage planning. J. Environ. Manag. 2005, 74, 1–9. [Google Scholar] [CrossRef] [PubMed]
  22. Ministry of Public Safety and Security. The Disaster Year Book; Ministry of Public Safety and Security: Seoul, Korea, 2008.
  23. Ministry of Public Safety and Security. The Disaster Year Book; Ministry of Public Safety and Security: Seoul, Korea, 2009.
  24. Ministry of Public Safety and Security. The Disaster Year Book; Ministry of Public Safety and Security: Seoul, Korea, 2010.
  25. Ministry of Public Safety and Security. The Disaster Year Book; Ministry of Public Safety and Security: Seoul, Korea, 2011.
  26. Ministry of Public Safety and Security. The Disaster Year Book; Ministry of Public Safety and Security: Seoul, Korea, 2012.
  27. Ministry of Public Safety and Security. The Disaster Year Book; Ministry of Public Safety and Security: Seoul, Korea, 2013.
  28. Seoul Metropolitan Government. Report on Design and Expansion of Daerim 3 Pump Station; Seoul Metropolitan Government: Seoul, Korea, 2010.
  29. Yeongdeungpo-Gu. Report on Design of Daerim Detention Reservoir; Yeongdeungpo-Gu: Seoul, Korea, 2007.
Figure 1. Process for obtaining rainfall data using the Huff distribution.
Water 08 00469 g001
Figure 2. Flowchart for cooperative operation of urban drainage systems.
Water 08 00469 g002
Figure 3. Structure of a typical pump station with a centralized reservoir.
Water 08 00469 g003
Figure 4. Structure of a typical decentralized reservoir.
Water 08 00469 g004
Figure 5. New operation method for a pump station with a centralized reservoir.
Water 08 00469 g005
Figure 6. New operation method for a decentralized reservoir.
Water 08 00469 g006
Figure 7. Cooperative operation of a centralized and a decentralized reservoir.
Water 08 00469 g007
Figure 8. Conceptual illustration of resilience.
Water 08 00469 g008
Figure 9. Dorim stream study area (from Google Earth Imagery © Google Inc., 2015).
Water 08 00469 g009
Figure 10. Calibration and validation of 2010 and 2011 data.
Water 08 00469 g010
Figure 11. Urban drainage systems in the target area.
Water 08 00469 g011
Figure 12. Results of new centralized reservoir operation.
Water 08 00469 g012
Figure 13. Results of the new decentralized reservoir operation.
Water 08 00469 g013
Figure 14. Results of cooperative operation in 2010.
Water 08 00469 g014
Figure 15. Results of cooperative operation in 2011.
Water 08 00469 g015
Figure 16. Results of system resilience.
Water 08 00469 g016
Figure 17. Rainfall, runoff, flood volume and resilience in the target watershed (2010).
Water 08 00469 g017
Table 1. Large rainfall events between 2008 and 2014 (data from Korea Meteorological Administration).
Year2008200920102011201220132014
Date23/7–25/79/720/9–21/926/7–28/720/8–22/812/7–14/723/8–27/8
Total Precipitation (mm)280312.5256386405.2429384.5
Representative Return Period (year)80100100100150150200
Table 2. Summary of calibration parameters.
TypeParameterRange
SubcatchmentPercentage of impervious area (%)0–100
Width (m)0–60
Percentage of slope (%)0–100
Table 3. First and maximum flooding nodes in the drainage system as potential monitoring nodes.
First Flooding NodesMaximum Flooding Nodes
Duration
(min)
First flooded node in main conduits
(Total precipitation)
DateMaximum flooded node in main conduits
(flood volume)
30560 (79 mm)23/9/2010550 (1597 m3)
60560 (104 mm)27/7/2011550 (143 m3)
90575 (154 mm)--
Table 4. Current and new operation of drainage pumps in the centralized reservoir (CR).
Elevation
(m)
Pump Discharge
(Current Operation, m3/s)
Pump Discharge
(New Operation, m3/s)
Comments
6.5--Bed level of CR
6.8-3.88LWL
7.2-8.05
7.33.8815.48Initial operating level in current operation
7.58.0519.65-
7.615.4823.36-
7.719.6527.08-
7.823.3630.80-
7.927.0857.02-
8.030.8057.02-
8.157.0257.02-
8.357.0257.02All operating level
9.057.0257.02HWL
Table 5. Urban drainage system resilience for real rainfall data (2010, 2011) by each operation method.
EventCurrent OperationCR OperationDR OperationCR + DR OperationIncrease in System Resilience
20100.980042
(98.0042%)
0.985141
(98.5141%)
0.985166
(98.5166%)
0.986758
(98.6758%)
0.006716
(0.6716%)
20110.999236
(99.9236%)
0.999241
(99.9241%)
0.999380
(99.9380%)
0.999444
(99.9444%)
0.000208
(0.0208%)

