Article

Delineating Groundwater Vulnerability and Protection Zone Mapping in Fractured Rock Masses: Focus on the DISCO Index

by
Helen Meerkhan
1,
José Teixeira
1,2,3,
Jorge Espinha Marques
4,
Maria José Afonso
1,2 and
Helder I. Chaminé
1,2,*
1
Laboratory of Cartography and Applied Geology (Labcarga), Department of Geotechnical Engineering, School of Engineering (ISEP), Polytechnic of Porto, 4200-072 Porto, Portugal
2
Centre GeoBioTec|UA—Georesources, Geotechnics and Geomaterials group, University of Aveiro, 3810-193 Aveiro, Portugal
3
Department of Geography, Faculty of Arts, University of Porto (FLUP), 4099-002 Porto, Portugal
4
Institute of Earth Sciences (ICT|UP), Department of Geosciences, Environmental and Land Planning, Faculty of Sciences, University of Porto (FCUP), 4099-002 Porto, Portugal
*
Author to whom correspondence should be addressed.
Water 2016, 8(10), 462; https://doi.org/10.3390/w8100462
Submission received: 14 May 2016 / Revised: 24 September 2016 / Accepted: 10 October 2016 / Published: 18 October 2016

Abstract

:
Hard-rock catchments are considered to be source of valuable water resources for water supply to inhabitants and ecosystems. The present work aims to develop a groundwater vulnerability approach in the Caldas da Cavaca hydromineral system (Aguiar da Beira, Central Portugal) in order to improve the hydrogeological conceptual site model. Different types of information were overlaid, generating several thematic maps to achieve an integrated framework of key sectors in the study site. Thus, a multi-technical approach was used, encompassing field and laboratory techniques, whereby different types of data were collected from fields such as geology, hydrogeology, applied geomorphology and geophysics and hydrogeomechanics, with the fundamental aim of applying the so-called DISCO index method. All of these techniques were successfully performed and an intrinsic groundwater vulnerability to contamination assessment, based on the multicriteria methodology of GOD-S, DRASTIC-Fm, SINTACS, SI and DISCO indexes, was delineated. Geographic Information Systems (GIS) provided the basis on which to organize and integrate the databases and to produce all the thematic maps. This multi-technical approach highlights the importance of groundwater vulnerability to contamination mapping as a tool to support hydrogeological conceptualization, contributing to improving the decision-making process regarding water resources management and sustainability.

1. Introduction

Groundwater in fractured aquifers is considered an important source for irrigation, water supply, and industrial purposes [1]. Moreover, fissured rock mass hydrosystems are considered essential sources of groundwater resources in large areas of the Earth. Fractures have a dual role, since they may act as hydraulic systems, providing preferential flow paths, as well as barriers that prevent flow across them, contributing to control of the transport of contaminants through and into the subsurface [2,3,4,5]. Many factors control the groundwater flow paths and the impact on the potential leakage of contaminants into groundwater, which in turn lead to the vulnerability of groundwater to contamination in varying degrees. These factors include lithology, geostructure, topography, fracture network, slope, weathering grade, permeability, drainage pattern, climate and land use [6].
The term “groundwater vulnerability” was first mentioned in the 1970s [7] and became used on a large scale in the 1980s [8]. Groundwater vulnerability is not a property that can be directly measured in the field. It is a concept that is based on the existence of areas that are more vulnerable to groundwater contamination than others. In fractured aquifers, extreme vulnerability is associated with a shallow water table, where fractures provide low contaminant decrease [9,10,11]. In this case, fractures increase vertical permeability, which affects the recharge rate and decreases the amount of contaminant attenuation. Thus, in fractured hydrosystems where groundwater flow is relatively easy and rapid, contamination may become widely dispersed [12,13].
The assessment of groundwater vulnerability to contamination aims to identify zones with high contamination risk in order to assess the possibility of an aquifer being contaminated [14,15]. Groundwater vulnerability assessments are usually represented by means of a map displaying zones where the resource is vulnerable to contamination from a number of sources. Vulnerability mapping is a suitable technique for assessing hydrogeological factors, among others, with the groundwater for potential contamination in a specific region shown on a map [16]. Displaying zones in different colors is an easy and intuitive way to classify, distinguish and interpret groundwater vulnerability, and it can also be used for delineating protection zones [17]. In short, hydrogeological mapping, groundwater vulnerability mapping and Geographic Information System (GIS) water-related mapping are excellent tools for supporting the description, assessment, modelling and communicating of groundwater resources [9,10,11,16,18,19,20,21,22,23,24].
The main objective of this study is to contribute to the development of a methodology for assessing groundwater vulnerability to pollution and the delineation of protection zones in fractured media. To achieve this goal, groundwater vulnerability indexes were applied to the Caldas da Cavaca site to point out the most vulnerable zones. The research is based on a hydrogeological system case study of Caldas da Cavaca [25,26,27]. The fractured rock media were characterized with GIS-based vulnerability mapping with a multi-technique approach involving geological, morphotectonic, hydrological, hydrogeological, geophysical and geotechnical data. Finally, the collected data allowed the generation of thematic maps, encompassing lithology, weathering grade, tectonic lineaments density, rock hydrogeomechanics, land cover, drainage network density, slope and rainfall.
Due to the great diversity of geological and hydrogeological conditions in such fractured media, it is not possible to delineate protection zones for these groundwater systems by means of a single approach. Thus, several methods were applied, such as GOD-S [10], DRASTIC-Fm [8,28], SINTACS [29,30], SI [31,32] and DISCO [33,34]. Moreover, this study focused on the application and discussion of the importance of the DISCO methodology on wells and spring areas. Finally, this study highlights the role of groundwater vulnerability mapping in developing environmental hydrogeology tools, contributing to the development of water resource management, environmental sustainability and groundwater protection.

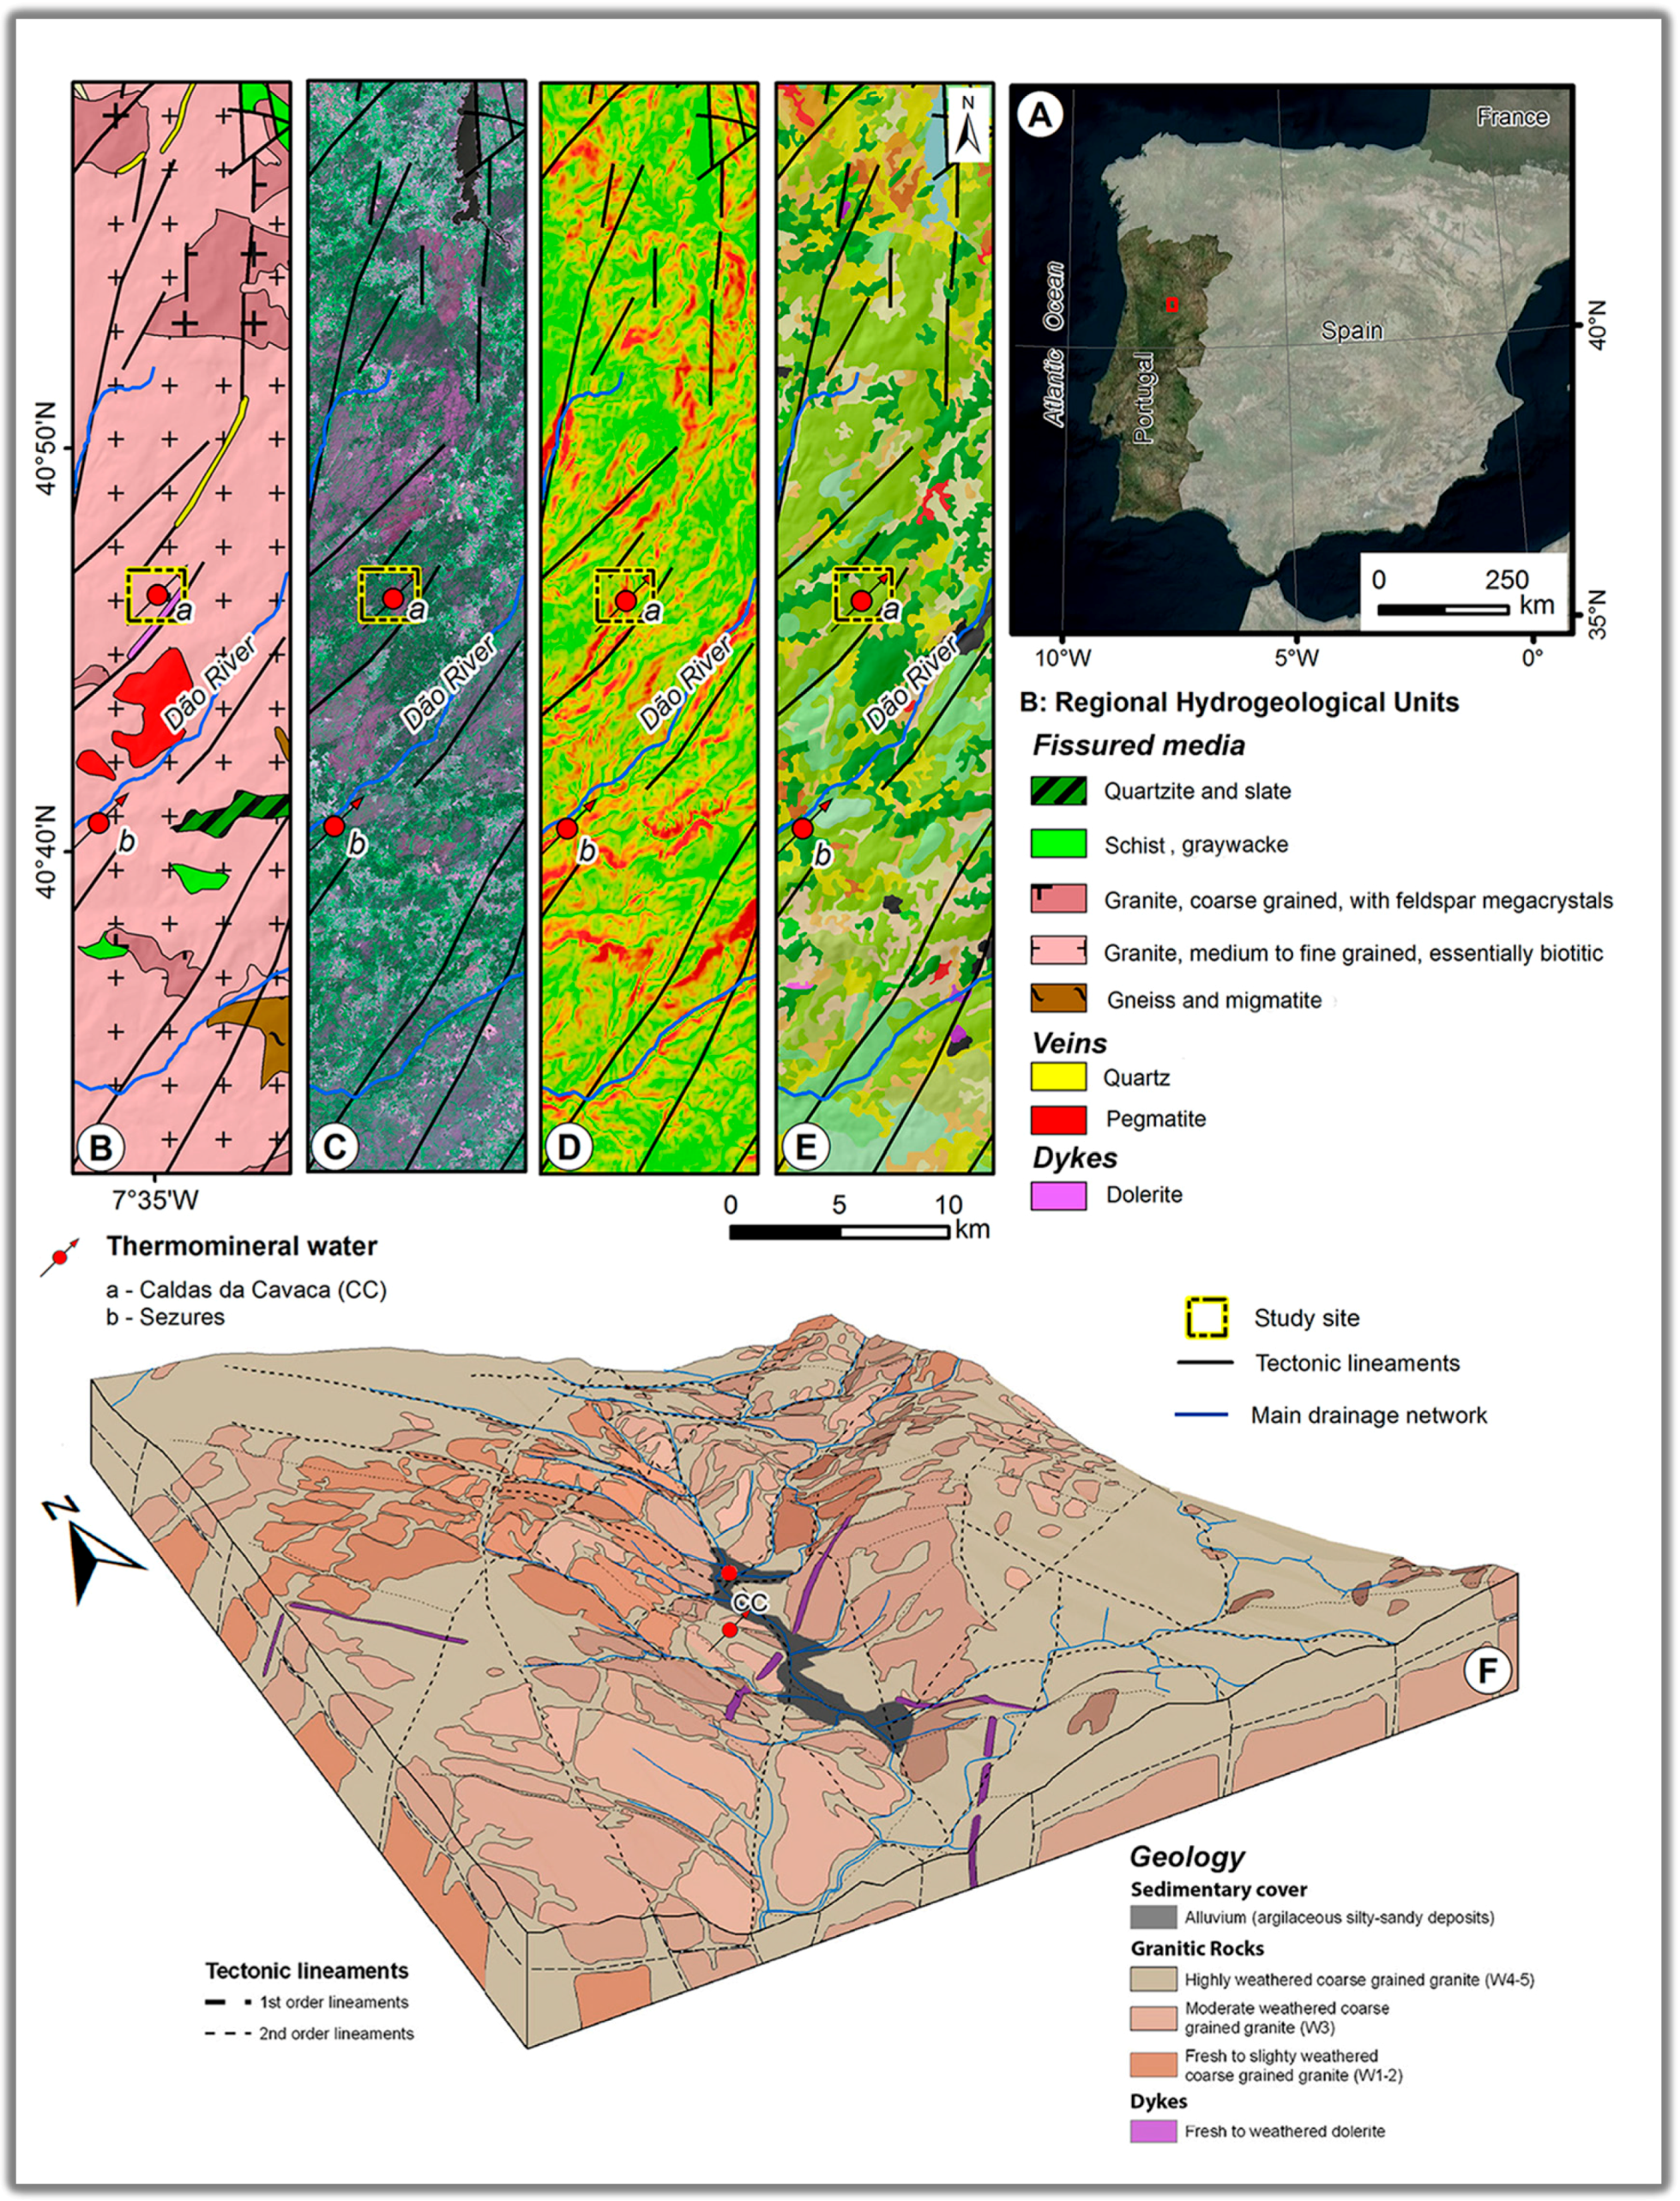
2. Regional Framework: Caldas da Cavaca Hydromineral System

The Caldas da Cavaca site (40°46′ N–40°47′ N latitude and 7°34′ W–7°35′ W longitude) is an area which has had a thermal spa tradition since late nineteenth century [35,36,37,38]. It is situated in Central Portugal, in the municipality of Aguiar da Beira, covering an area of about 10 km2 and belonging to the River Dão catchment, which is part of the basin of Mondego River (Figure 1).
The study region is located in the Central-Iberian Zone and is also considered part of the Dão granitic complex from the Beiras granitic belt [39], close to the western boundary of the Bragança–Vilariça–Manteigas major fault zone [31], following a general trend towards NNE-SSW. The main tectonic structure is the Dão fault zone with a general trend towards NE-SW and fracture network systems, each one affecting the regional drainage network and controlling the thermal water circulation [39]. At the local scale, the Ribeira de Coja fault zone is a main morphotectonic feature, trending NNE–SSW, with steep slopes and altitude difference of about 170 m [40].
The geology of the site comprises thin alluvial deposits (argillaceous silty sandy deposits) and granitic rocks which encompass coarse grained granites occasionally interrupted by quartz veins, pegmatite-aplite veins or dolerite dykes, where most of the basic rocks are exposed and fresh to weathered [39]. Regarding the landscape surrounding the site, it is mainly characterized by the existence of agricultural areas, Pinus pinaster forest and a large area of granitic rock outcrops.
Generally, the climate in Caldas da Cavaca region is moderate, which means a temperate Mediterranean climate with a dry and warm summer (Csb according to Köppen classification [42]). The average annual temperature is 13 °C, ranging from 6.2 °C in January to 20.1 °C in July. The region suffers from water deficit from June to September, particularly in July and August. The average annual rainfall is 1252.4 mm/year, reaching 189 mm in January (the wettest month) and 16 mm in July (the driest month) [40].
The Caldas da Cavaca site is characterized by the presence of shallow groundwaters and hydromineral waters, where the shallow waters correspond to weathered or fractured granitic zones and surface water/groundwater from alluvia. The hydromineral waters are related to deep circulation in rock masses [40,41]. Recently, hydrogeological, applied geomorphological and hydrogeomechanical studies were carried out in this site as a result of the need to improve the management of the thermal water resources (e.g., [25,26,27,41,43]). In the past, water withdrawal relied on a spring and a well which were not able to assure the required thermal water volume and quality. Presently, the thermomineral aquifer is exploited by means of two new wells, constructed according to the best technical procedures [44,45,46].

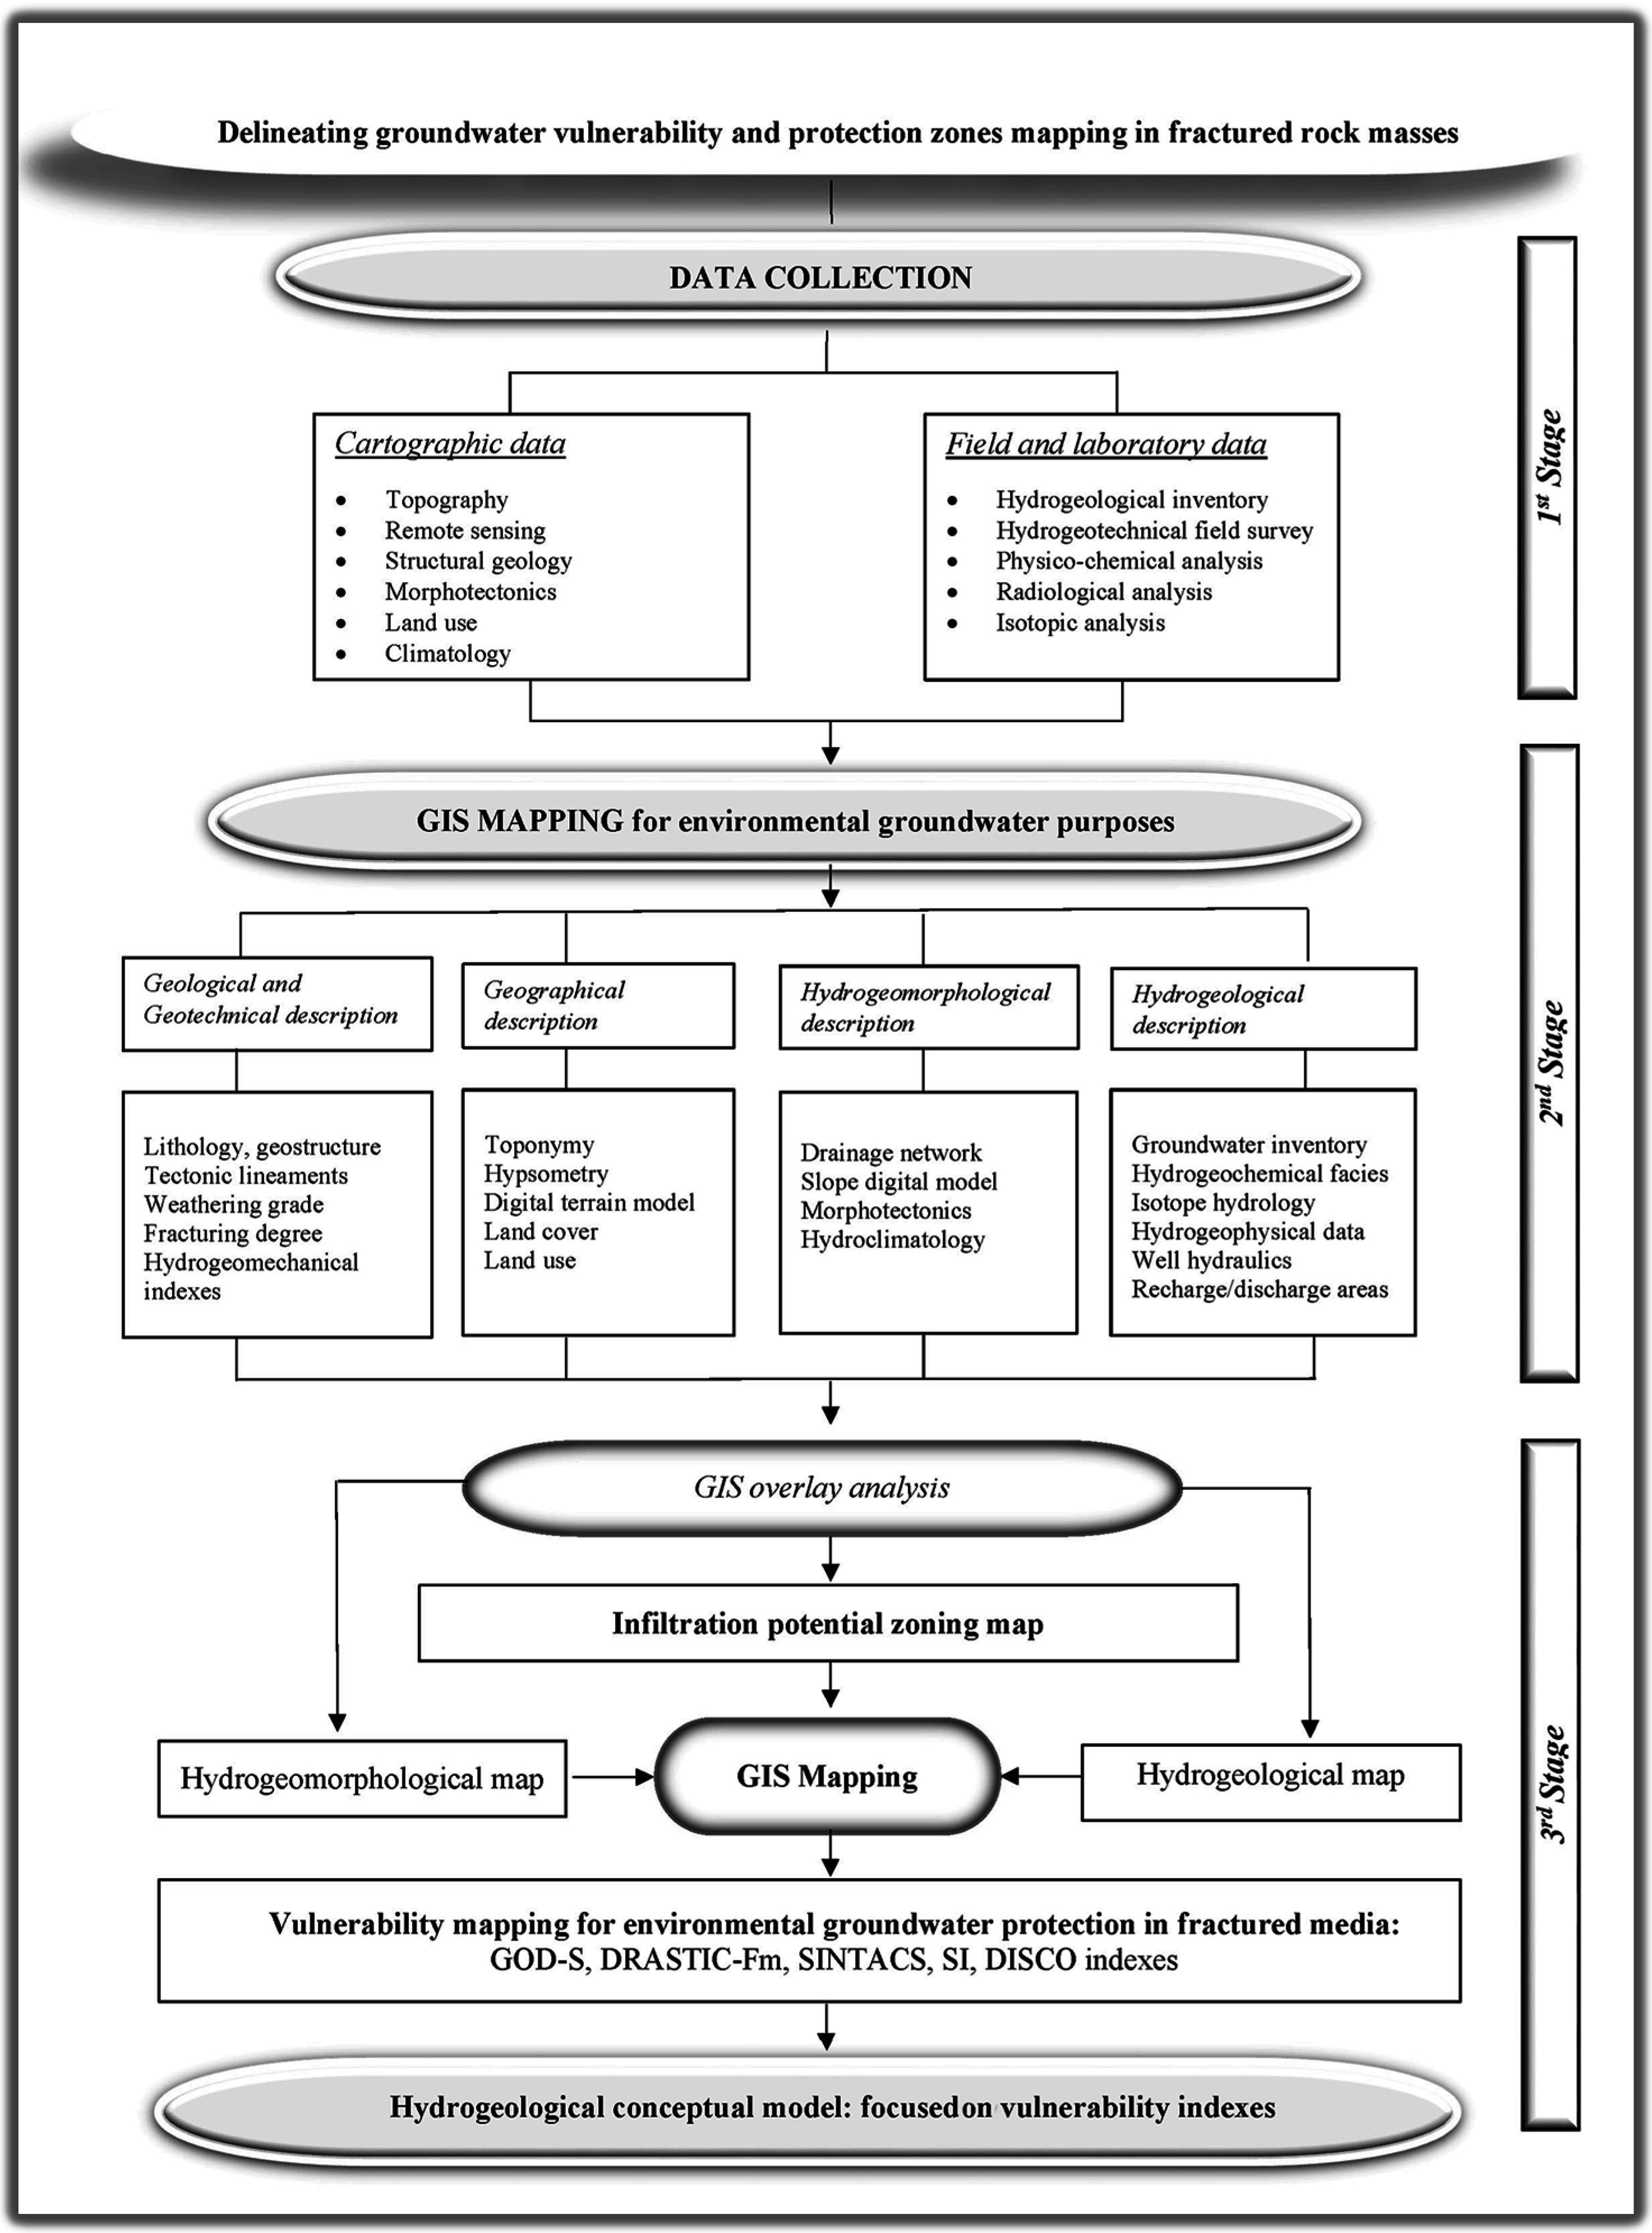
3. Materials and Methods

This study was successfully undertaken through the combination of several major steps, where all the data collection techniques can be classified into two main categories (Figure 2) [21,22,26,47,48]: (i) mapping data: which include topography, remote sensing, morphotectonics, structural geology, land use and climatology; (ii) field and laboratory data: which comprise rock mass geotechnics, hydrogeological inventory, and hydrogeochemical and isotopic analysis.
The field and laboratory data were systematized and assessed in a GIS environment, where the GIS technique mapping provided the geology (i.e., lithology, structure, and weathering grade), drainage, land cover, slope, and rainfall, in order to get a comprehensive framework of the study site and the assessment of groundwater vulnerability areas. These maps were classified into four main categories: (i) geological description of rock masses; (ii) geographical description; (iii) hydrogeomorphological features and (iv) hydrological features.
The infiltration potential is a key parameter in some vulnerability indexes [26,40,48]. Thus, the identification and calculation of the infiltration potential zoning index was very important in this study. The internal scores were evaluated using fieldwork data and the identification of the relative weight and score for each factor was achieved using the Analytical Hierarchy Process (AHP) method to ensure objective weight assignment [24,26,49]. The grid data structure consists of a pixel of 1 m × 1 m.
The importance of GIS-based mapping comes from its ability to produce geodatabases and to create vulnerability maps. Thus, the evaluation of groundwater vulnerability in this study was carried out using several methods, each one adopting a specific set of parameters:
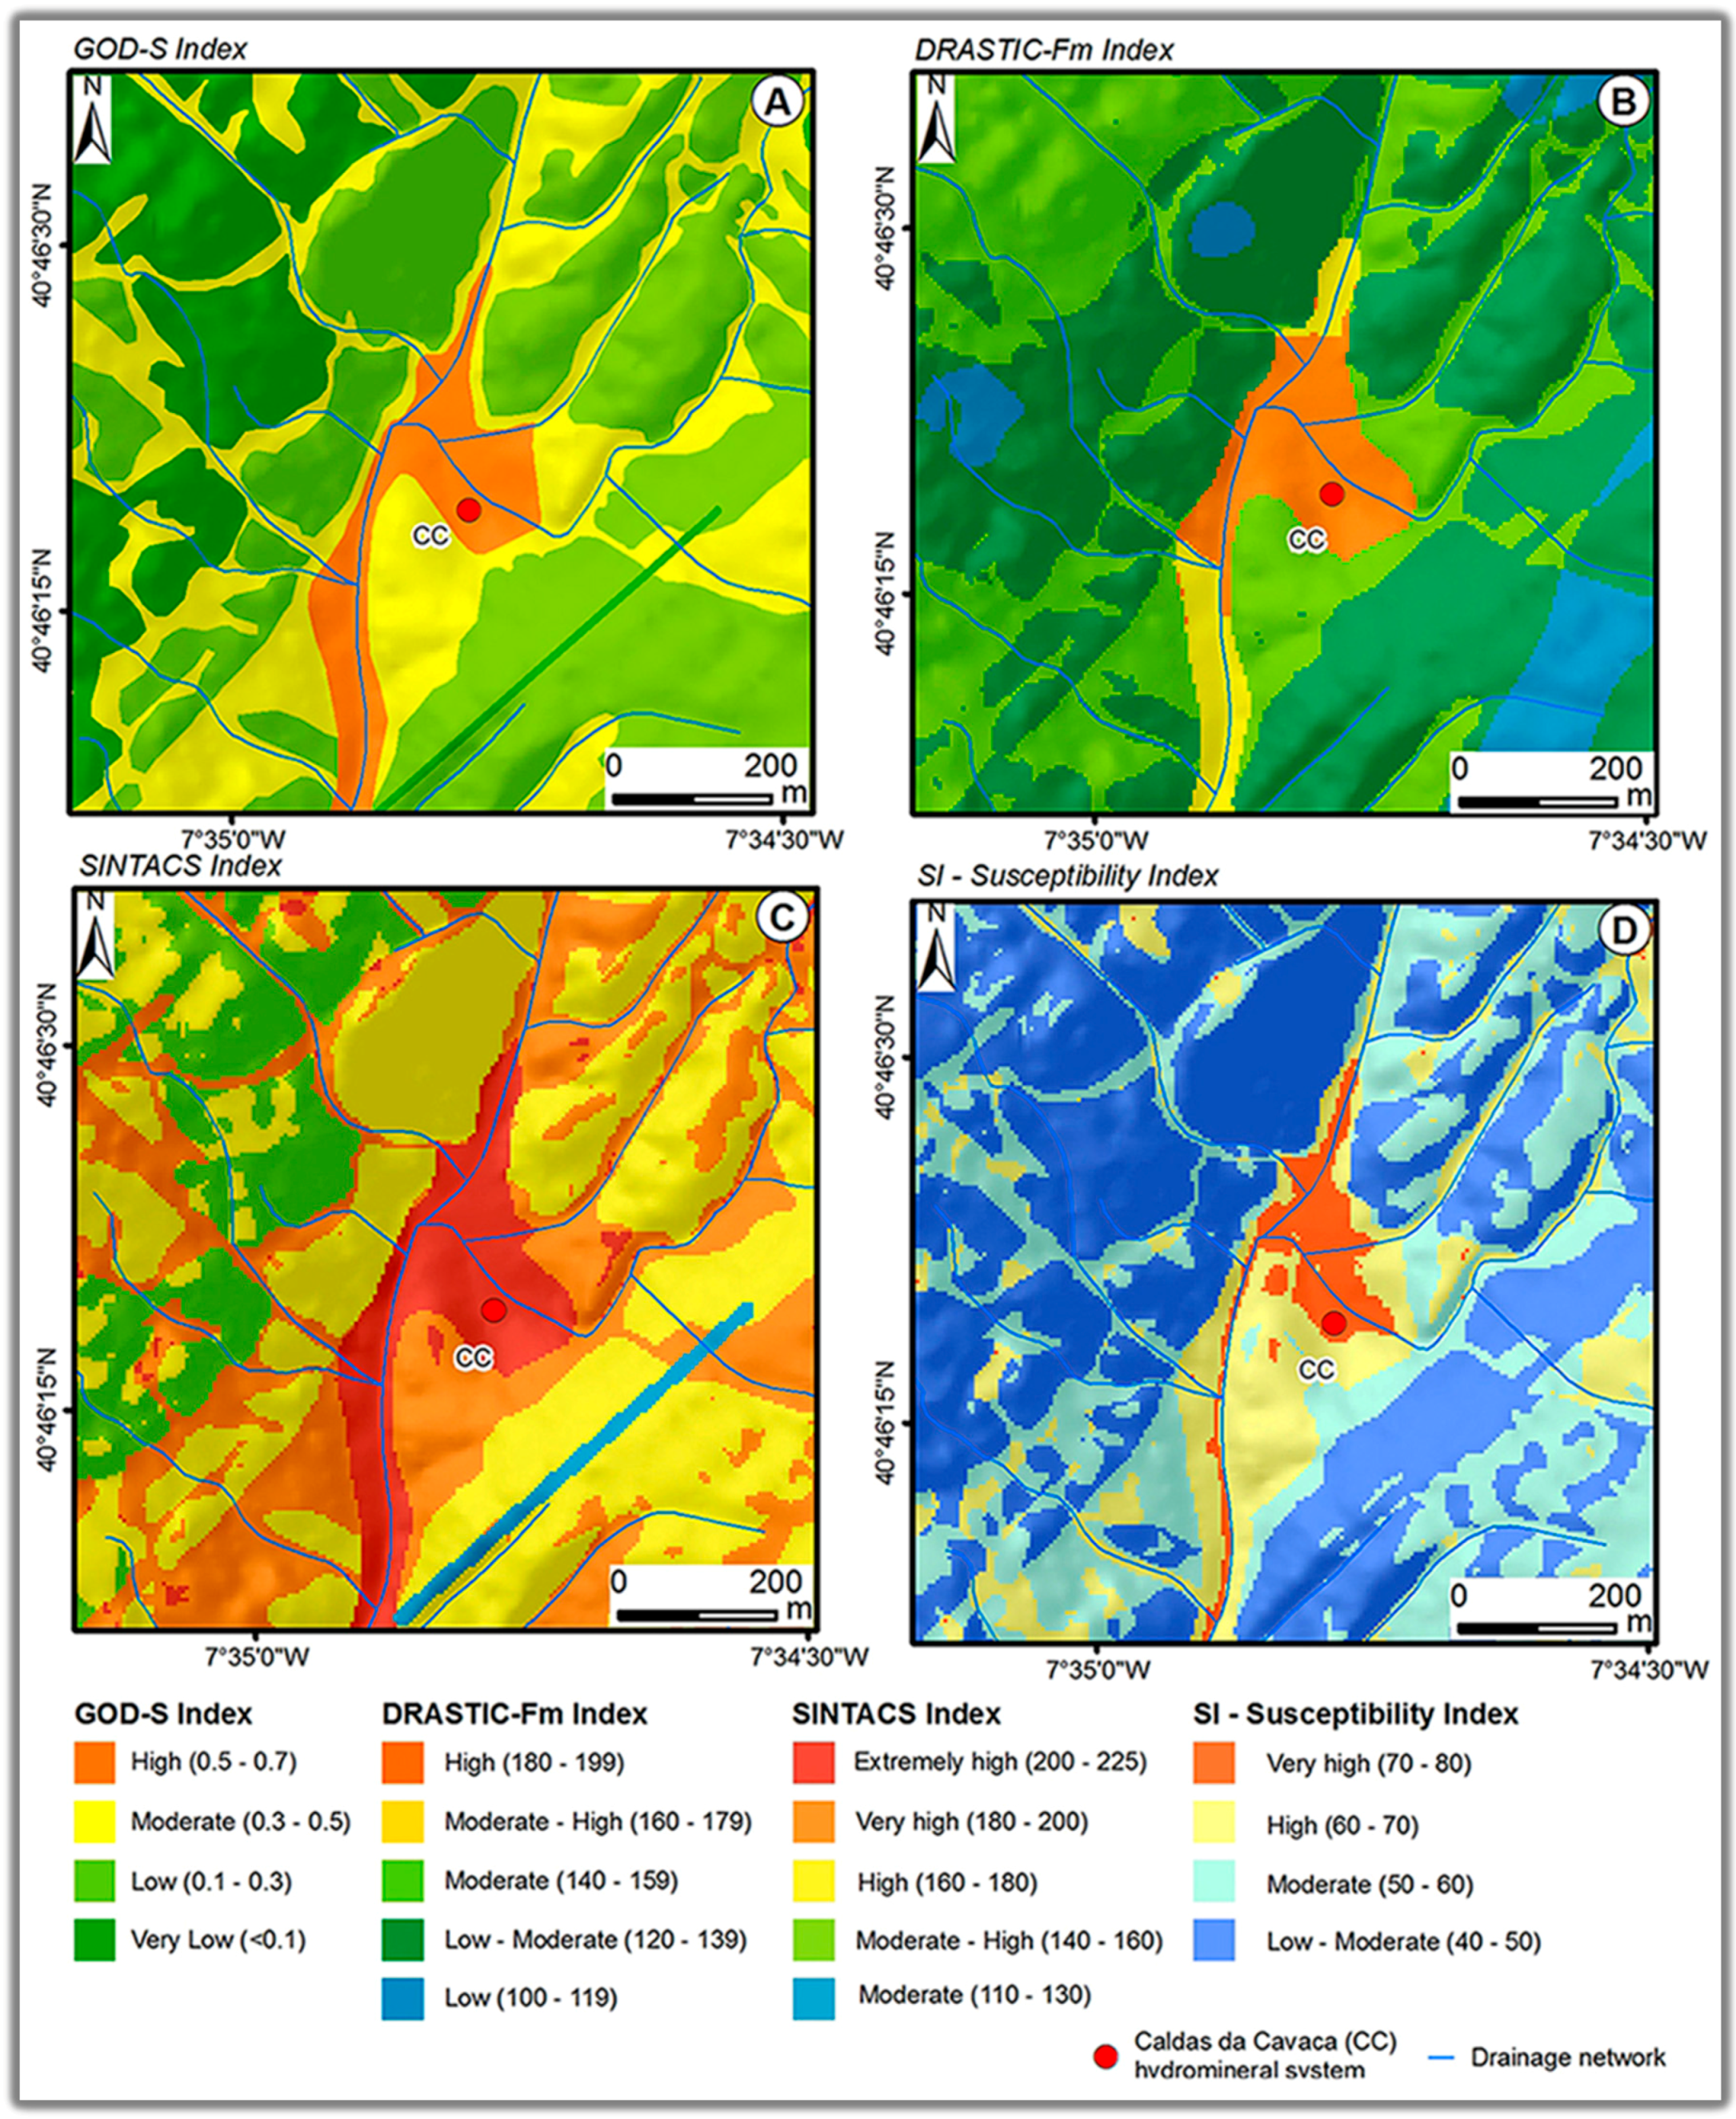
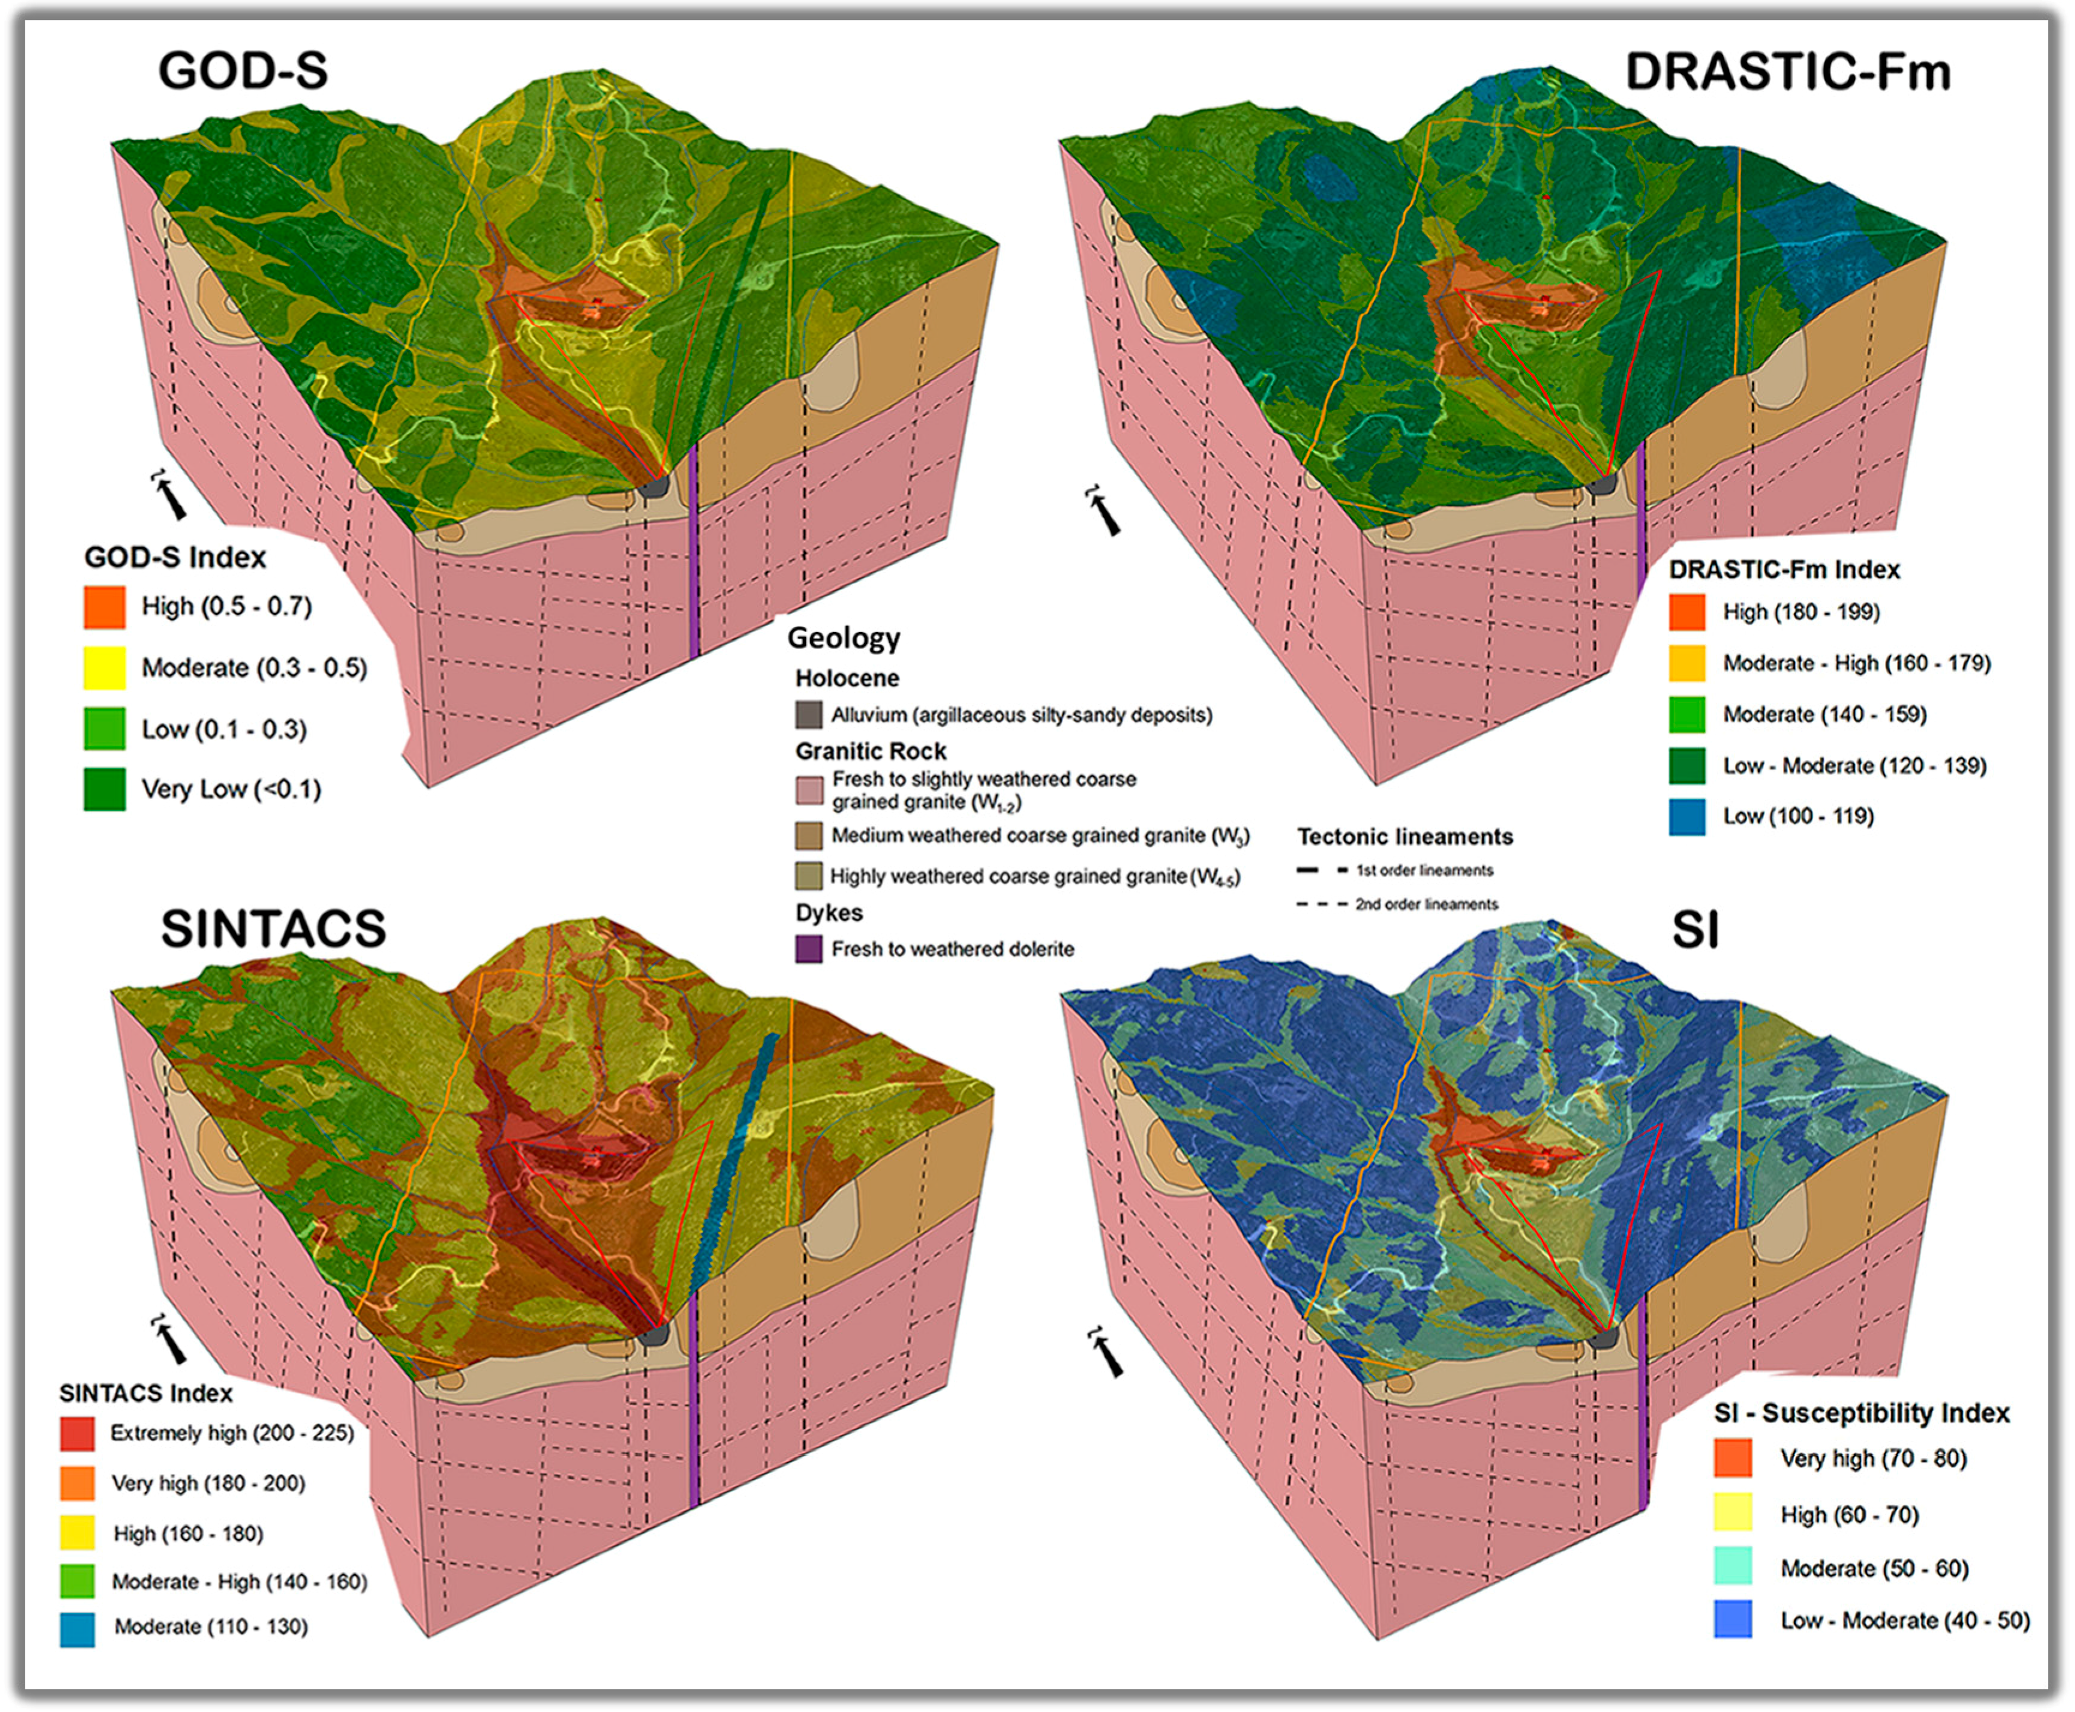
  • GOD-S is an evolution of GOD index, considering soil media properties [10];
  • DRASTIC-Fm is a modified version of DRASTIC, taking into consideration the characteristics of fissured hard-rock aquifers. The fractured media parameter (Fm) was derived from the map of tectonic lineaments density, and collected into four classes, with ratings ranging from 4 to 10, depending on the tectonic lineament density [8,26,28,48,50];
  • SINTACS was created for vulnerability assessments and mapping in medium and large scale maps, and the multiplier weights of normal string were used [29,30];
  • SI, where the Land Use (LU) parameter was derived from land cover maps [32];
  • DISCO is carried out in the vulnerable springs and in the mineral water wells related to a highly heterogeneous and fractured media aquifer [33,34].
The GOD-S, DRASTIC-Fm, SINTACS and SI multi-criteria indexes are often used for local and regional mapping purposes (medium to small-scale), and the DISCO index [34] is very useful for in situ environmental hydrogeological investigations (large-scale maps). The most efficient methodology is an integrative approach encompassing all previous multi-criteria indexes [22].
Finally, a comprehensive approach was achieved in order to provide knowledge of the groundwater systems of the Caldas da Cavaca site and to improve the hydrogeological conceptual model and thus develop environmental sustainability and groundwater protection.

4. Results and Discussion

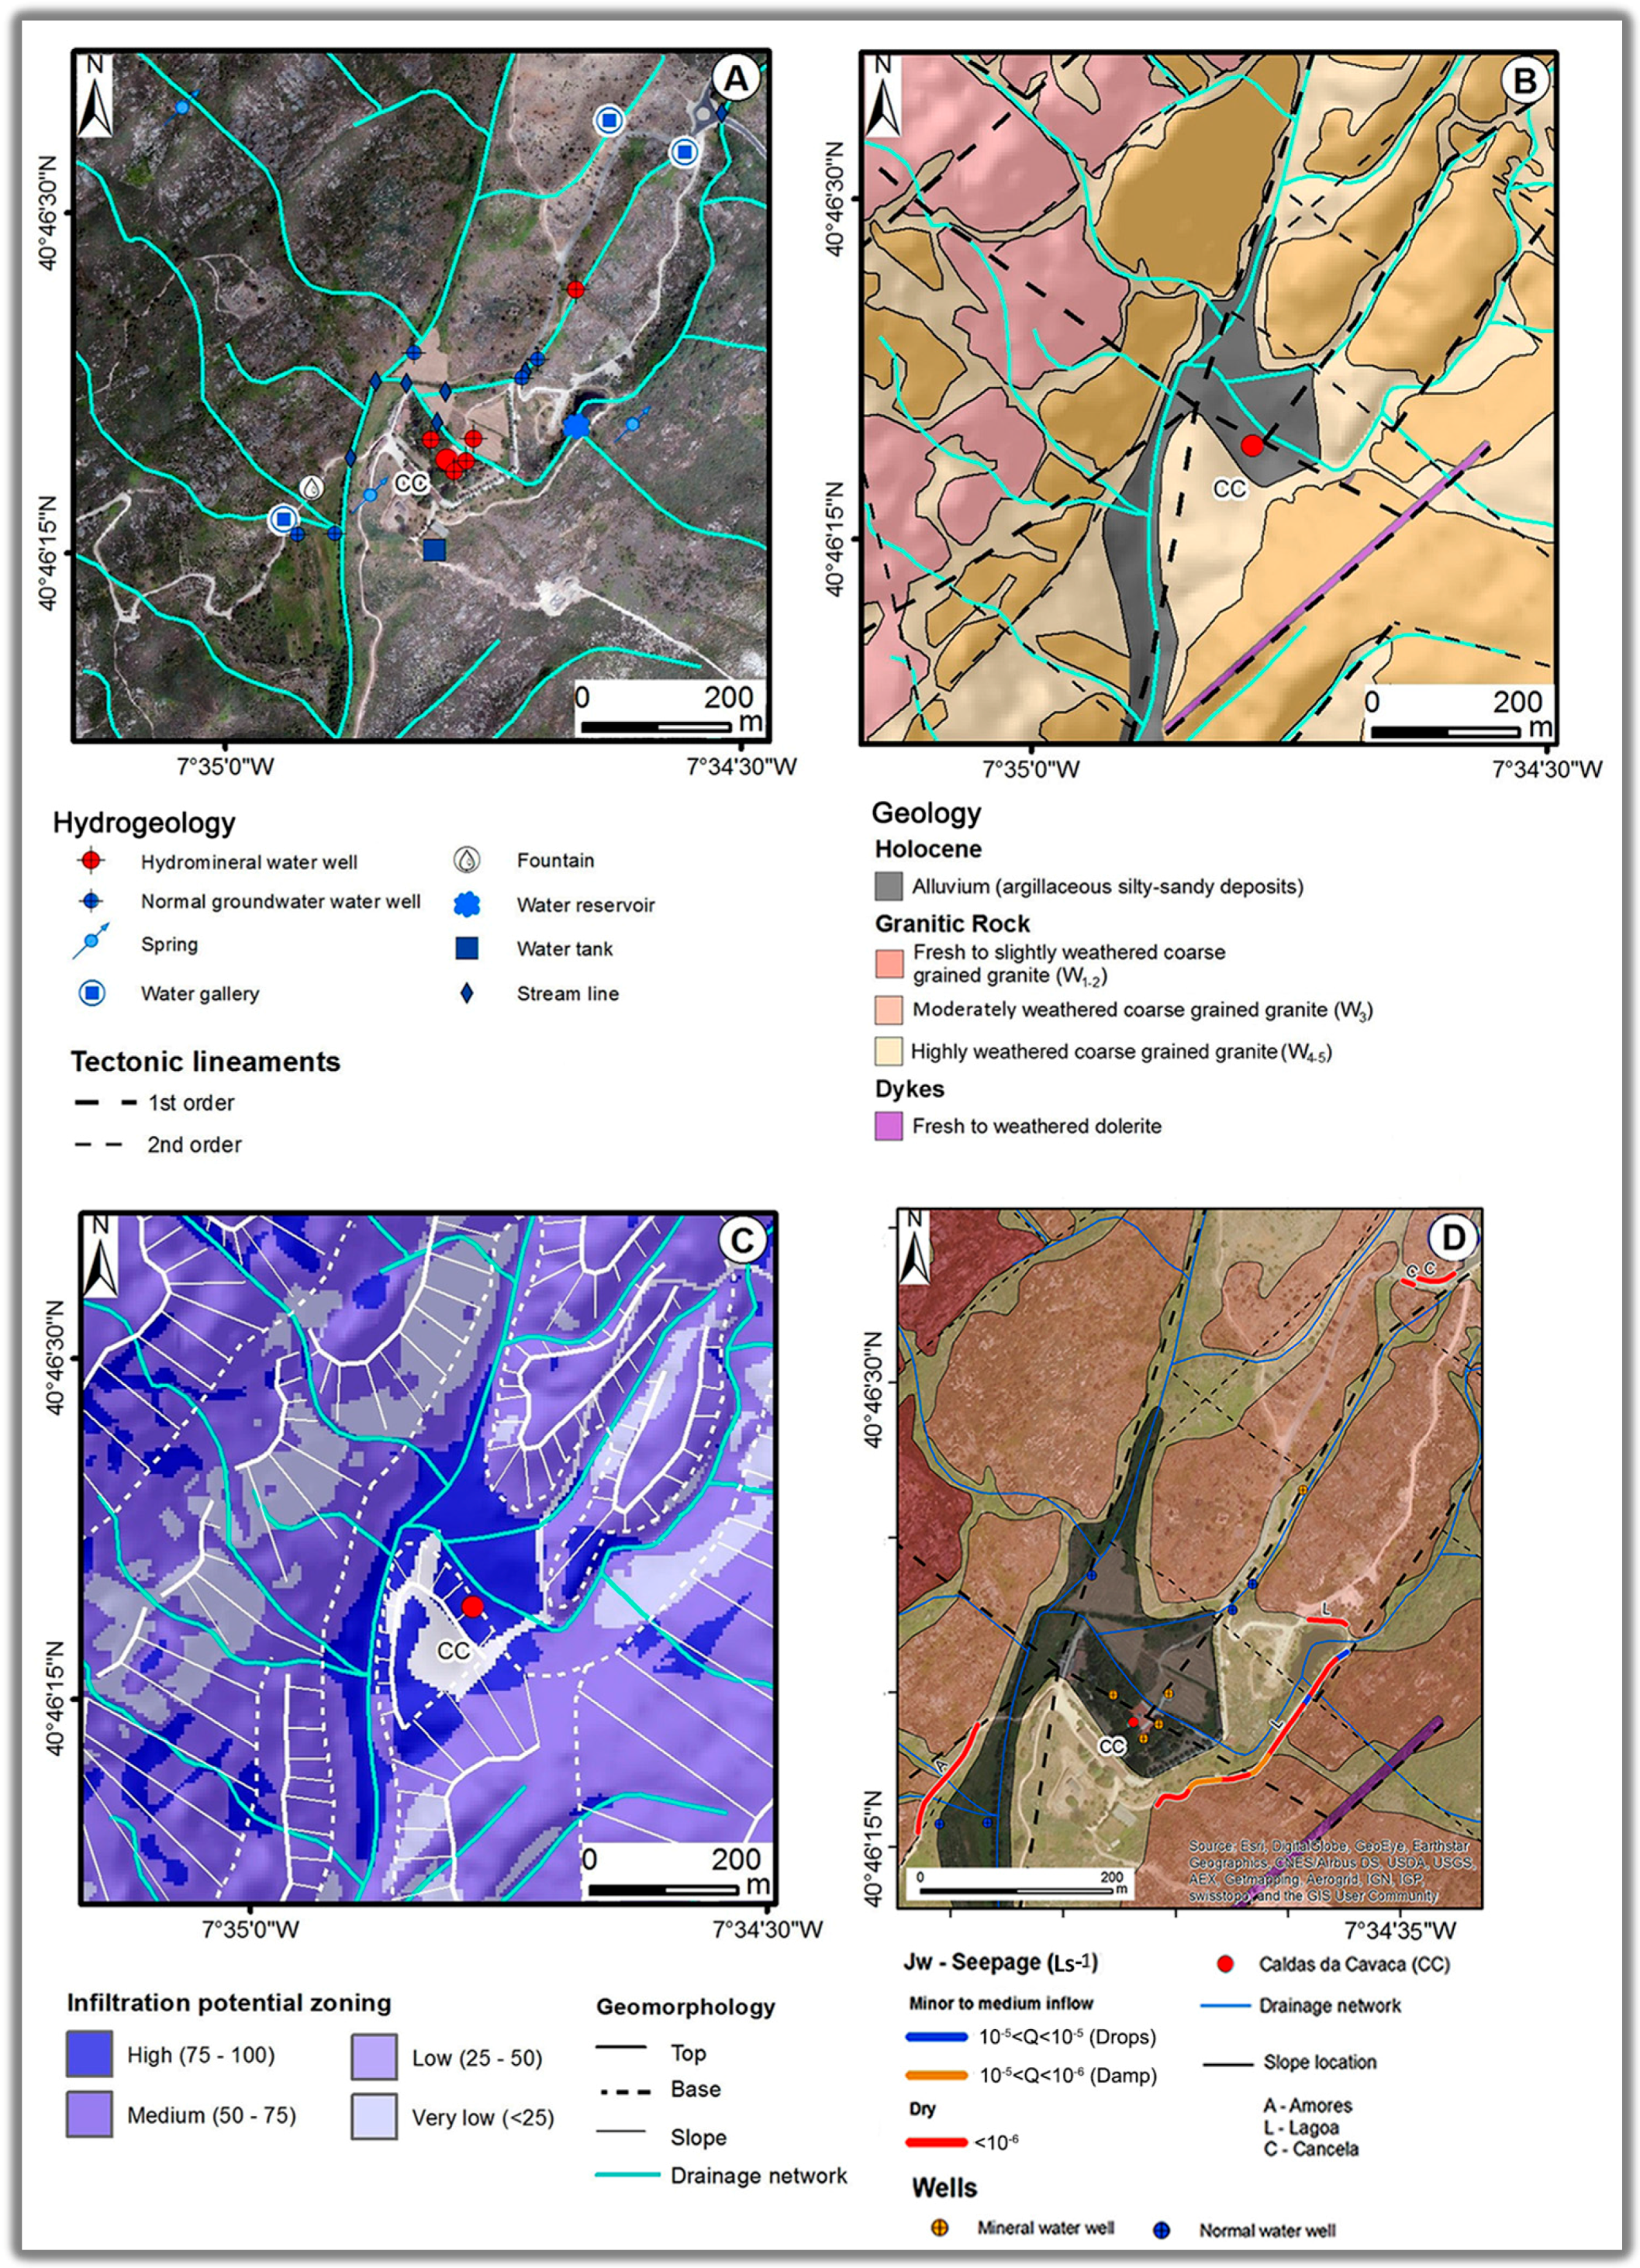
4.1. Local Hydrogeological, Hydrogeomorphological and Hydrogeomechanical Framework

The hydrogeological inventory has proven to be an essential methodology for evaluating the Caldas da Cavaca hydromineral system, and several fieldwork campaigns have been performed. During the fieldwork campaigns, electrical conductivity, yield, water temperature and pH were measured (Figure 3A). It was found that water points are distributed unevenly, located at small depths (less than 5 m), and are connected to the unconfined aquifer [25,26,40]. The springs are sited at 650–700 m, show water temperatures of below 17 °C and discharge between 0.01 and 0.05 L·s−1, as well as having electrical conductivities below 50 μS·cm−1.
Two types of waters are recognized in Caldas da Cavaca [26,40]: (i) sodium chloride to sodium bicarbonate waters related to the water table aquifer and (ii) hydromineral waters (sodium bicarbonate facies) related to the confined aquifer.
The shallow groundwaters have two origins, the first from water circulating in sedimentary deposits (with electrical conductivity up to 20 μS·cm−1 and pH ranging from 5.5 to 6) and the second from groundwater circulating in weathered or fractured granitic zones, with electrical conductivity of 20–50 μS·cm−1 and pH ranging from 5 to 6.5. However, this aquifer has long-term well yields below 1 L·s−1 and transmissivity values below 1 m2/day. The springs in the site also have low yield values (around 0.1 L·s−1) [26,40].
Caldas da Cavaca hydromineral waters are very different to shallow waters due to the following features [43]: (i) high temperature, around 29.8 °C; (ii) relatively high pH values, around 8.5; (iii) high silica contents, around 55 mg/L; (iv) electrical conductivity ranges from 353 to 427 μS·cm−1; (v) Total Dissolved Solids (TDS) contents in the range of 262–272 mg/L; (vi) high fluoride concentrations, reaching 14 mg/L; and (vii) the presence of reduced Sulfur species (HS–Hydrogen Sulfide, c. 0.9 mg/L). The hydromineral water wells are located at the bottom of the valley of Ribeira da Coja, and are characterized by transmissivities ranging from 27 to 136 m2/day, with yields between 1 and 4 L·s−1. These wells intersect the alluvia deposits in the first meters, and reach a maximum depth of 220 m.
The main geological features of the study site (lithology, structure, weathering grade and fracturing degree) are presented in Figure 3B. The dominant rock is a coarse grained granite which, depending on its weathering degree, is categorized into three main groups ([26,27,40]):
  • Fresh to slightly weathered coarse grained granite (W1-2), which dominates in the higher altitudes, around 600–700 m, and shows moderate fracturing degree (F3) with very close to close fracturing degree (F4-5);
  • Moderately weathered coarse grained granite (W3), which dominates in the lower altitudes, around 500–650 m, particularly in a wide corridor between 500 and 1000 m length that is compatible with a general NE–SW trend;
  • Highly weathered coarse grained granite (W4-5), which basically prevails in plateau regions.
The doleritic dykes show NW–SE and NE–SW trending. These basic rocks usually exhibit green to orange color as a result of different degrees of weathering. Locally, the weathering grade in the dominant granitic lithology is very strong, sometimes reaching depths of 50 m, particularly in the trend towards NNE–SSW, where the fault zone of Ribeira de Coja is outcropped and characterized by the presence of sedimentary cover (silty-sandy deposits) at the bottom of the valley, with thickness ranging from 3 to 5 m [40].
The Caldas da Cavaca area shows high infiltration potential (Figure 3C). The majority of the water points examined in the area are compatible with the high infiltration potential zones or with the transition between the moderate and high infiltration potential zones, because of the low slopes, the moderately to highly weathered granite and the moderate to high density of tectonic lineaments. Thus, the bottom of the Ribeira da Coja valley has high infiltration potential, as a result of the alluvial cover and the very low slope of the valley bottom. However, the recharge area of the hydromineral aquifer of Caldas da Cavaca is located at higher altitudes, at more than 675 m. Moreover, the most effective infiltration zones are characterized by highly weathered granite and high thickness arenization, which are found in the NW and SE strips of the Caldas da Cavaca site. To the contrary, the less effective infiltration zones are characterized by less weathered granite and higher slopes, which are found in NE–SW bands [26,40]. The drainage network density is an important factor which helps evaluate the properties of the groundwater infiltration zones, where it reflects important characteristics of the surface and groundwater flows. The Caldas da Cavaca site shows a high drainage network density with the general trend of stream lines towards the NE to SW, especially in the SW sector (Figure 3C).
In order to characterize the shallow hydrogeomechanical behavior in the Caldas da Cavaca site, a detailed study was performed on selected rock slopes (Amores slope, A; Lagoa slope, L; and Cancela slope, C) in the study area [27]. The total length of the rock slopes has an extension of about 484 m, with an altitude that ranges between 1 and 7 m above the road. In addition, the two main orientations of the slopes studied were: N 80°–110° E for the Cancela slope and N 45°–60° E for the Amores and Lagoa slopes (Figure 3D). The rock hydrogeomechanical parameters for the site are summarized ([27,40]):
  • Type of discontinuities: joints are the dominant discontinuities in the rock mass. They are grouped into two sets of joints: the first set has a direction of N 120°–150° E and dip ranges from 75° to 90° NE/SW; and the second set has a general direction towards N 20°–80° E and dips between 55° SE and 90° SE;
  • Weathering grade: In all of the slopes in the area, a moderately weathered rock (W3) prevails and, in addition, a highly weathered rock (W4-5), as well as some fresh to slightly weathered rock (W1-2) on the Amores and Lagoa slopes (Figure 3D);
  • Water seepage content: This is related to flow through the rock mass joints. Although the Lagoa slope displayed small sections classified as wet (10–100 drop per minute) or damp (1–10 drop per minute), most of the slope was classified as dry. As for the Amores slope, small sections were classified as damp (1 ≤ drops/min < 10), while the Cancela slope was completely dry;
  • Fracturing degree: the parameter trend exhibited higher occurrence of wide spacing discontinuities (F1-2) and discontinuities with moderate spacing (F3), as well as a small percentage of close spacing discontinuities (F4-5).

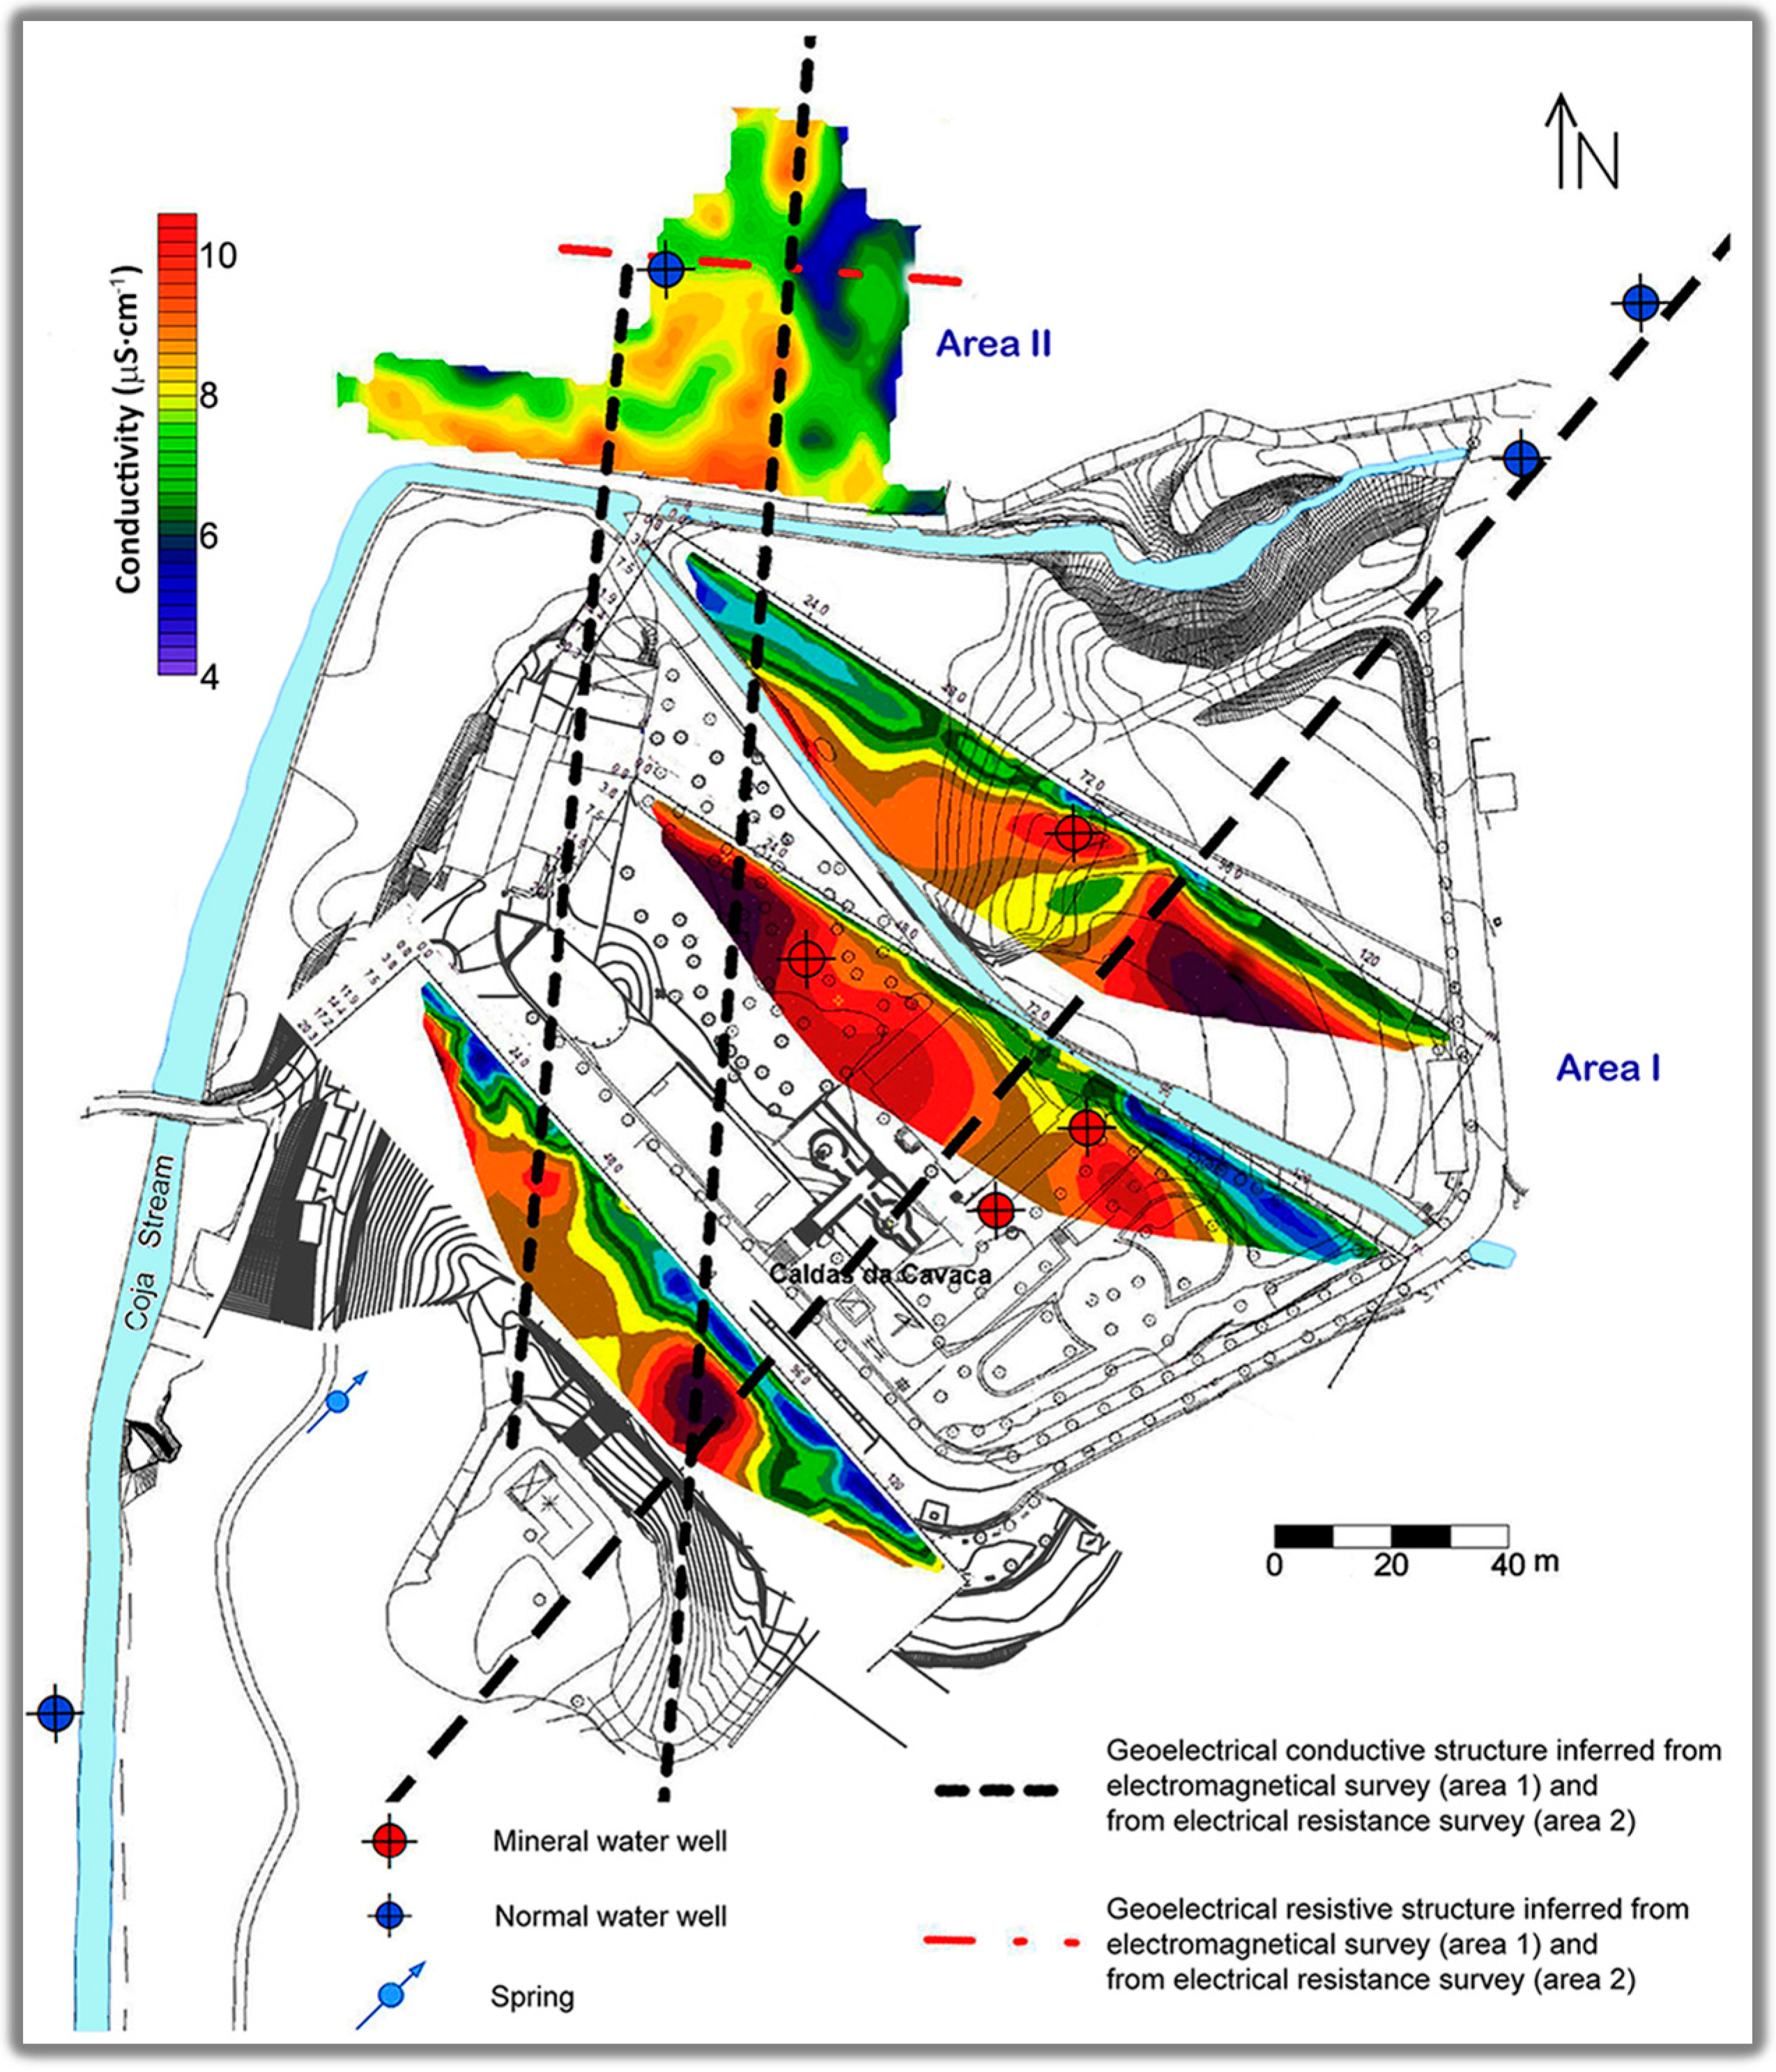
4.2. Geophysical Survey

Two geophysical surveys using geoelectrical methods were analyzed in the discharge zone of the hydromineral aquifer [40,45,46,51,52], (Figure 4): (a) electrical resistivity tomography [44,45]; (b) electromagnetic methods, especially electromagnetic conductivity (using the geophysical device Geonics EM34-3 model) [51,52]. These surveys were used to define potential geostructures, which were determined by high electrical conductivity values through electric conductivity maps and vertical dipole configuration, in addition to the geoelectrical surveys in the study site (Figure 4).
In general, the depths reached in electrical resistivity and electromagnetic surveys did not exceed 50 m, and the electromagnetic survey was carried out with a set of electromagnetic profiles on an area of about 3184 m2 (Figure 4). The trend of the geostructure was determined through the interpretation of structural geology and geomorphological maps, encompassing digital elevation model and field maps, showing that the trend of the geostructure is compatible with the main tectonic lineament systems in the area ([40,44,51]). However, the location of boreholes was determined by coupling hydrogeology and structural geology information from earlier studies [35,37] with new data from the latest groundwater engineering operations carried out in the area [40,45,46,51,52].
The existence of mineral water in boreholes permitted the interpretation of a major geostructure with a N30° E trend, which is considered as a potential hydrogeological trap, sometimes compatible with a higher permeability zone in the rock mass that enables the discharge of mineral water. Permeability increases according to the presence of deep tectonic nodes that develop by the intersection of the main categories of fracture network [26,40,44]: (i) fractures with N–S trend dipping 70° W–80° W; and (ii) fractures with NW–SE trending with subvertical dip. Moreover, the emergence of mineral water is probably related to three factors: (i) the presence of a deep tectonic node; (ii) the occurrence of strong hydraulic heads at depth and (iii) the lower mineral water density as a result of higher temperature and gases in solution.

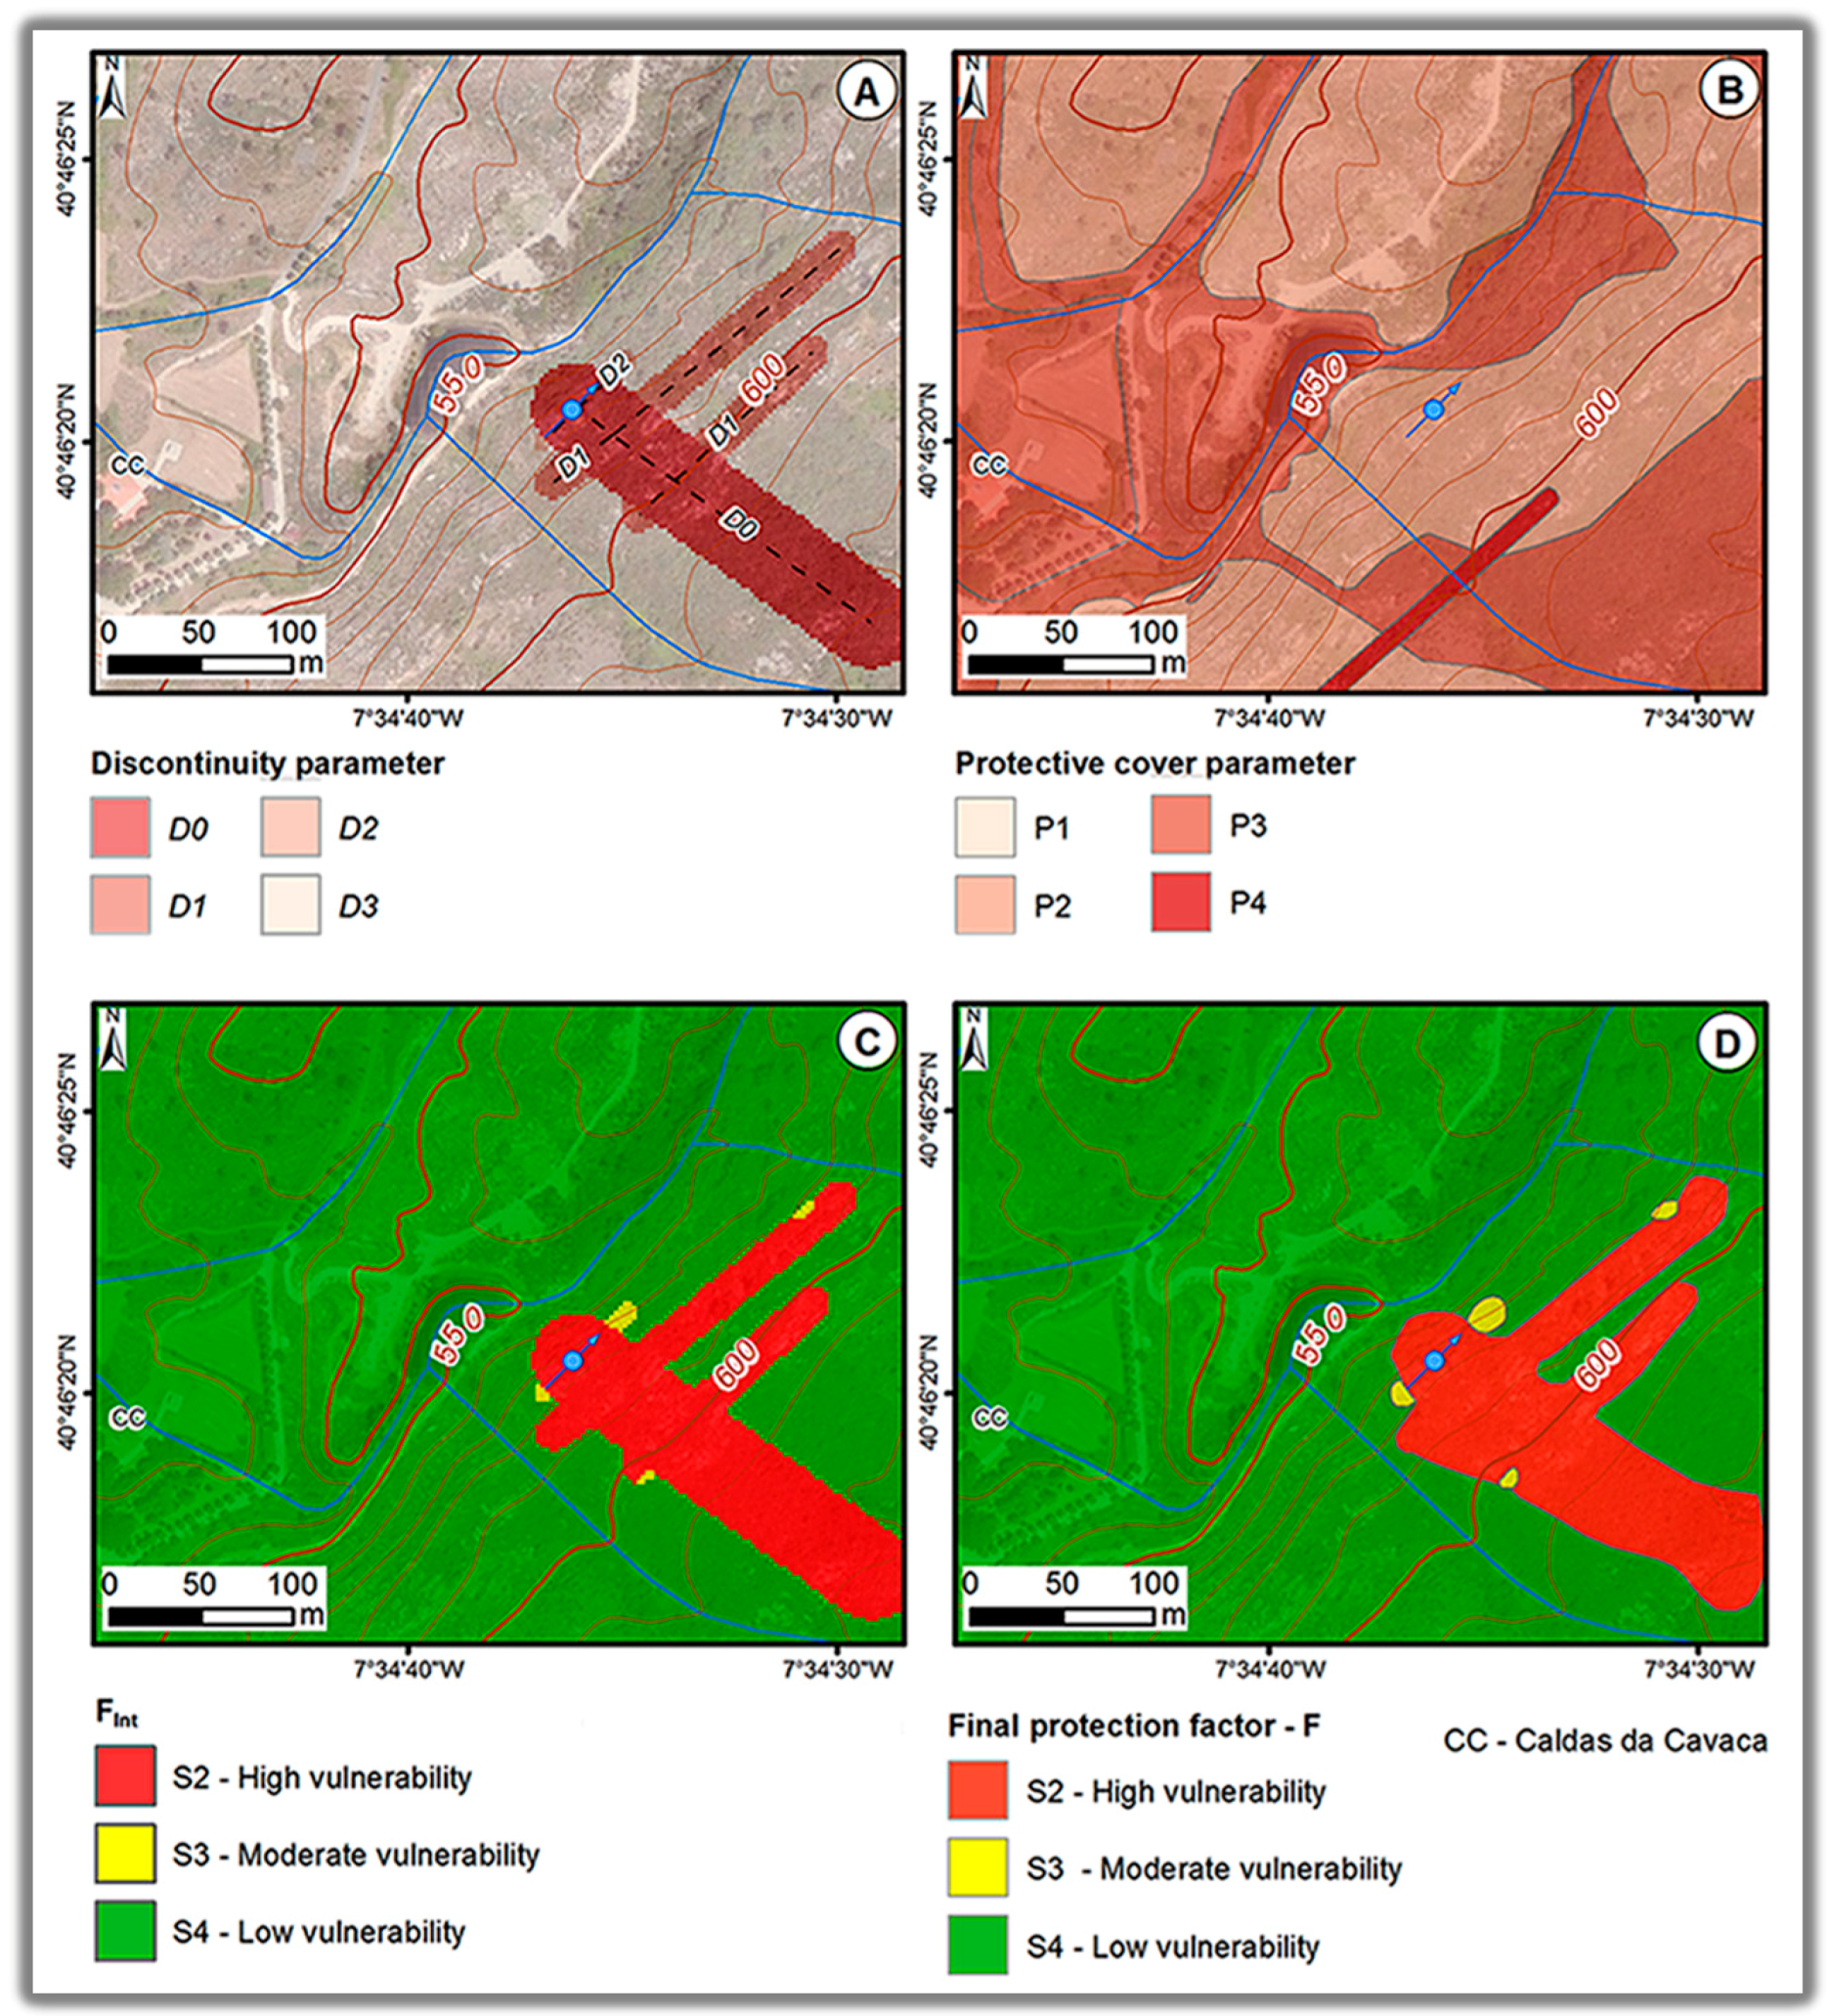
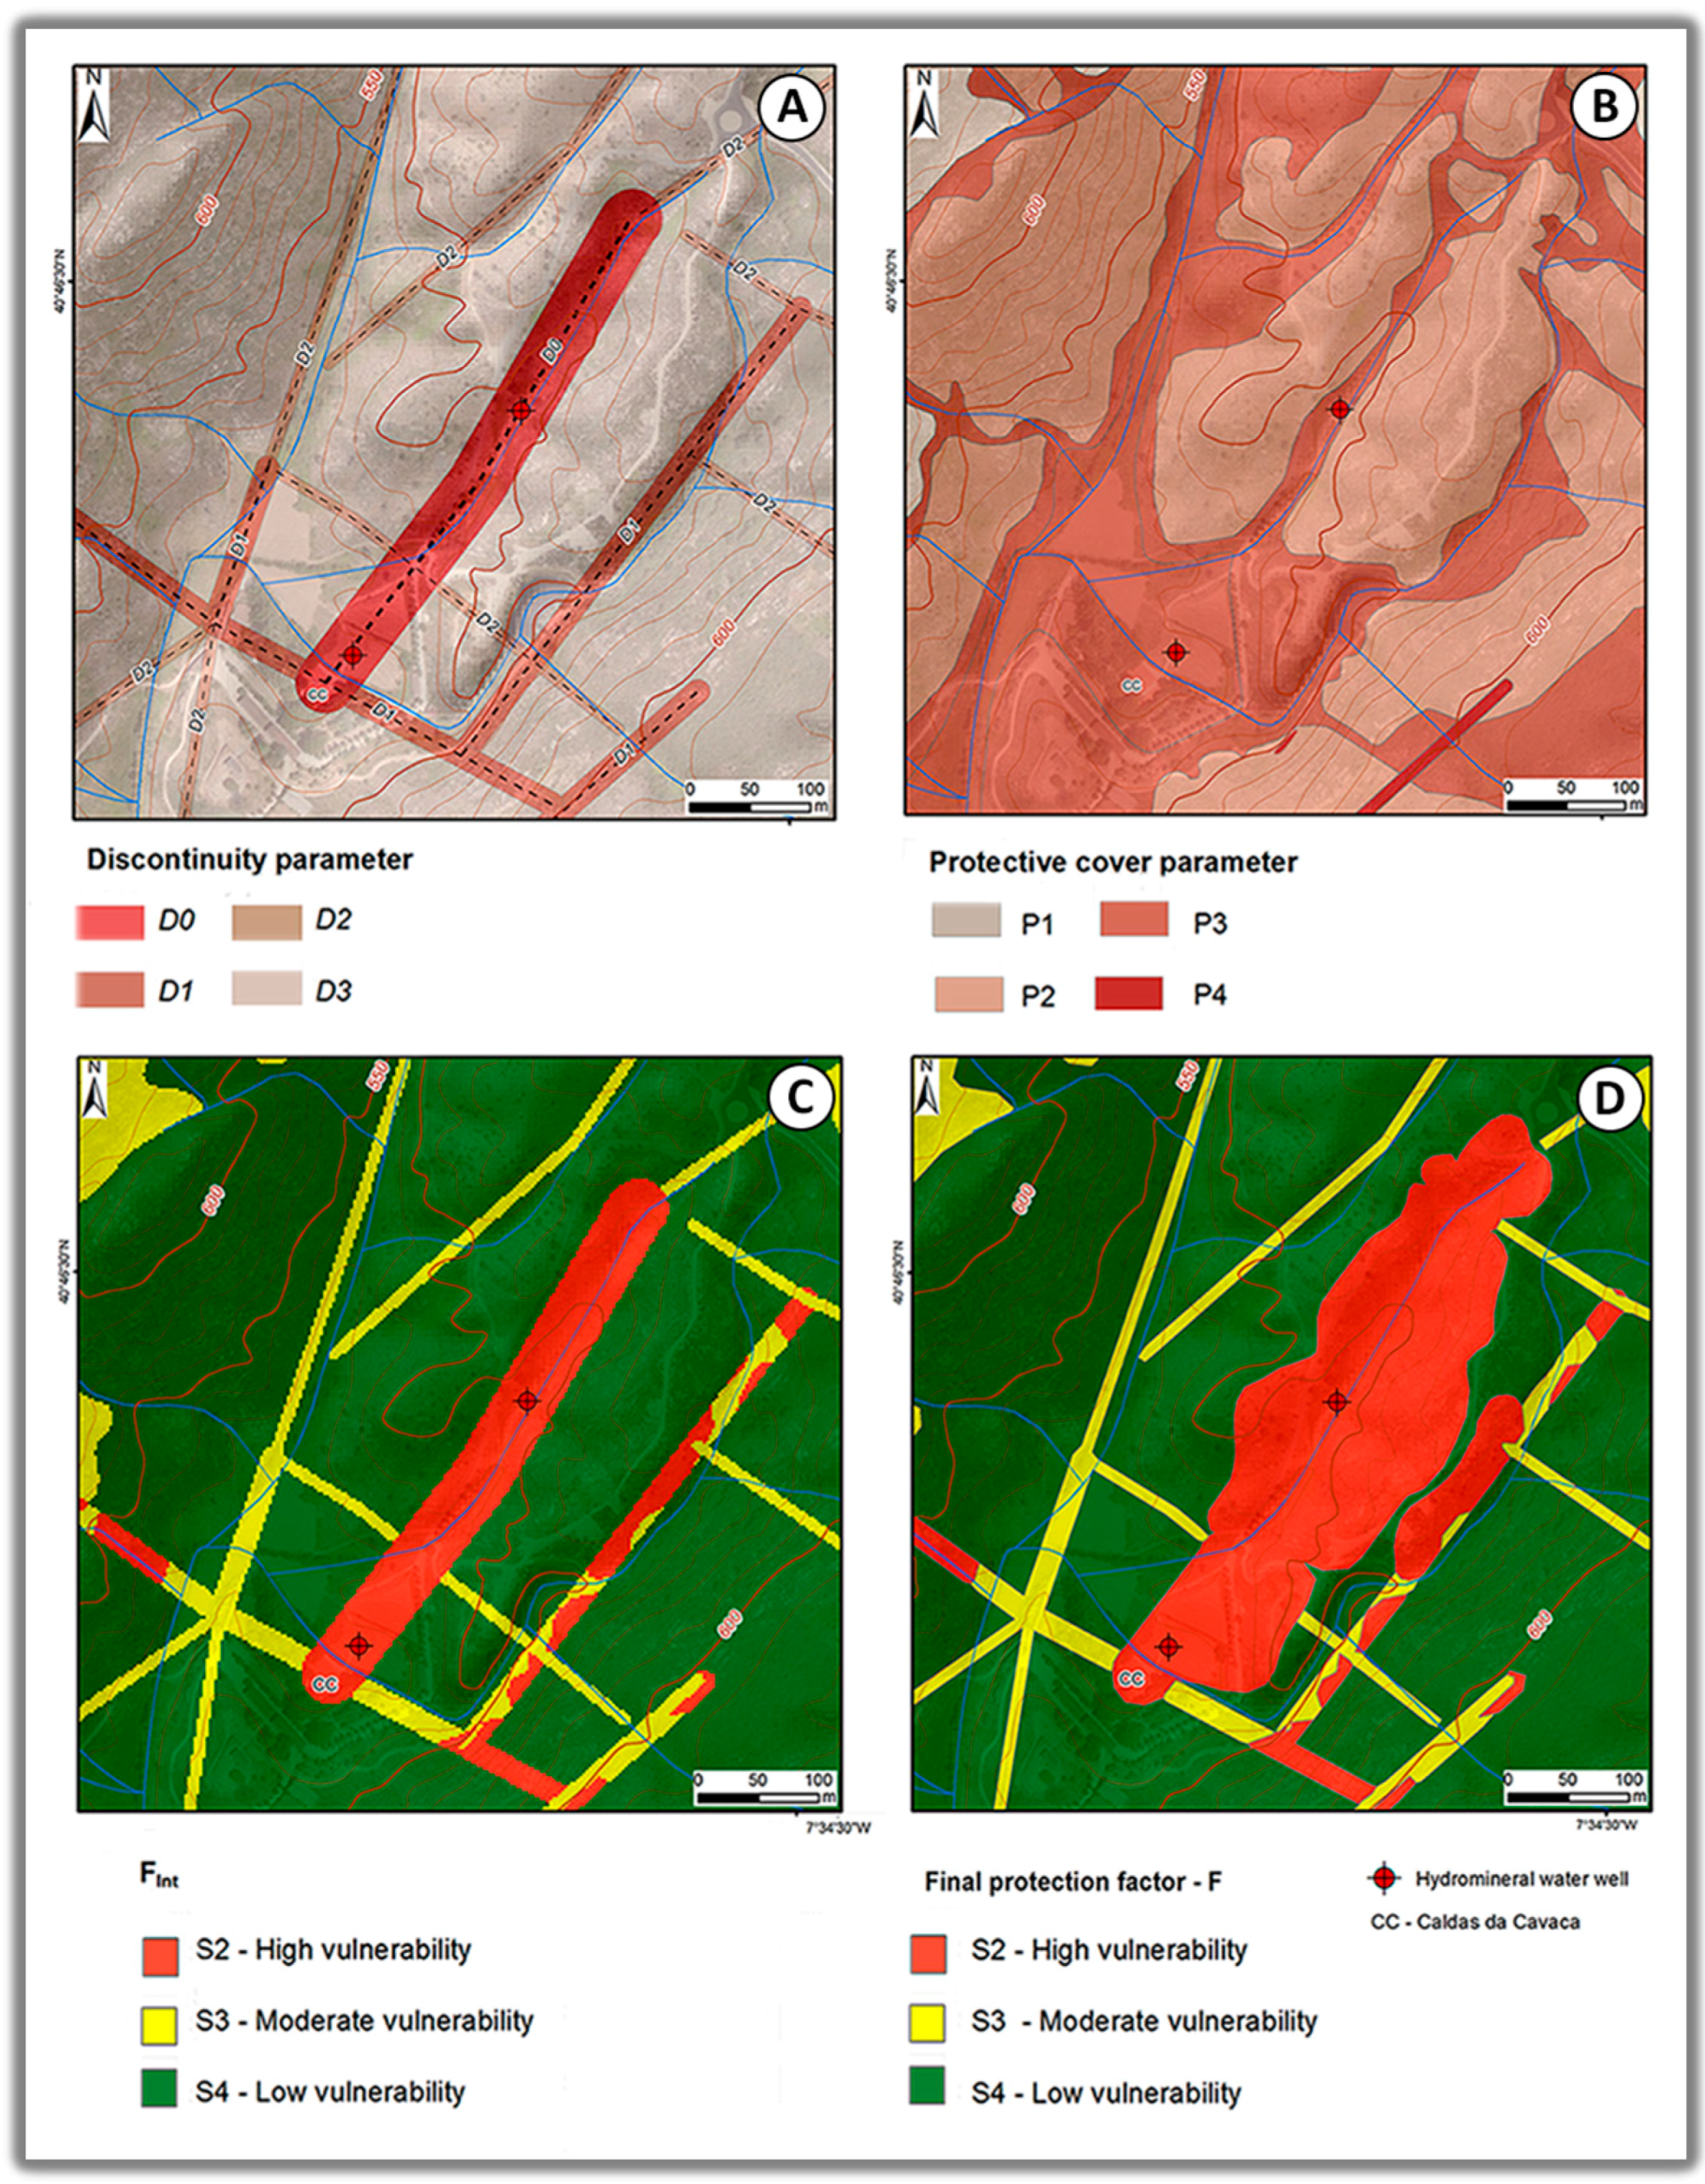
4.3. Multicriteria Intrinsic Vulnerability Assessment

Prior to this study, a variety of methods such as the GOD-S, DRASTIC-Fm, SINTACS and SI indexes (Figure 5) were successfully applied in a larger area by the authors of [26] to assess groundwater vulnerability to contamination for the fractured media in Caldas da Cavaca. Table 1 shows a summary of the parameter description, along with the classification adopted for intrinsic groundwater vulnerability methods, for a more detailed assessment of the present study. Figure 6 presents schematic block diagrams illustrating ground conditions and vulnerability index inputs (GOD-S, DRASTIC-Fm, SINTACS and SI).
The assessment of groundwater vulnerability according to the GOD-S index (Figure 5A) shows that most of the Caldas da Cavaca area fits in a moderate vulnerability category. This category corresponds to the highly weathered granite (W4-5). The high vulnerability category corresponds to the alluvia cover through a narrow strip along the valley bottom. Furthermore, the low and very low vulnerability categories match the moderately weathered (W3) to slightly weathered (W1-2) granite and the dolerite dykes.
The DRASTIC-Fm index (Figure 5B) shows that the flat parts of the valley bottom are associated with the moderate-high and high vulnerability categories, due to the presence of alluvia cover. The NE–SW corridors correspond to the moderate vulnerability category, due to the fracture density, the slope and less weathered granite. Over 50% of the site, especially the NW and SE zones of the study site, near the Caldas da Cavaca site, fits into the low-moderate and low vulnerability categories.
Regarding the SINTACS index (Figure 5C), the surroundings of the Caldas da Cavaca site are comprised of very high and extremely high vulnerability categories due to the low slope values and the presence of alluvia and highly weathered granite. Moreover, the large NE–SW strip along the valley slopes belongs to moderate-high vulnerability categories, as a result of the high slope values and less weathered granite. The low vulnerability category corresponds to the dolerite rocks, and is related to the argillaceous weathering of these dykes. When comparing the SI index results (Figure 5D), an identical pattern to that of SINTACS is revealed. Land use can be clearly seen to be an important parameter, namely around the settlements, where the buildings and agricultural areas are concentrated. These areas have higher slope values (20°–40°) and correspond to high or very high vulnerability categories. On the contrary, the high slope values are related to the less weathered granite and are associated with moderate and low-moderate vulnerability. The SI index shows only a very small area in the high vulnerability category.
In this study a groundwater vulnerability assessment was carried out by means of the DISCO index [34]. The delineation of groundwater protection zones in the study site was applied for two hydromineral water wells (Figure 7) and for an important shallow groundwater spring (0.5–1 L·s−1) (Figure 8). The location of the wells was determined according to the geological, geomorphological and hydrogeological studies carried out previously [25,26,40]. In addition, the location of the springs was controlled by the rock discontinuities network in the groundwater watershed. Locally, both mineral water wells and normal groundwater springs are located along major deep fractures, or near the intersections between tectonic lineaments.
The application of the DISCO method includes three main steps (details in [33,34]):
1. Assessment of the discontinuities (DIS) and protective cover (CO) parameters
The discontinuities parameter (DIS) is based on the tectonic lineaments analysis and on field geostructural and hydrogeomechanical surveys, as well as on hydrogeological and hydrogeophysical data. The delineation of protection zones at the site (D0, D1, D2 and D3) was defined according to the rating and criterion defined by Pochon et al. [34] (Figure 7A). Therefore, buffers were assigned for each category: 25 m for D0, 10 m for D1 and 5 m for D2, while D3 was assigned to the rest of the area.
The protective cover parameter (CO) is based on soil analysis, geomorphological mapping, drilling and hydrogeophysics, and was defined according to the rating and criterion defined by Pochon et al. [34], taking into account soils and geological formations overlying the aquifer (Table 2).
Regarding this approach, the rating values of “P” range from 1 to 4, with increasing values being associated with thick protective cover and low permeability of the formations. In this way, “P” areas correspond to Figure 7B: (i) P1—fresh to slightly weathered coarse grained granite, covered by moderate permeability soils; (ii) P2—moderately weathered coarse grained granite, covered by moderate permeability soils; (iii) P3—highly weathered coarse grained granite and alluvia deposits, covered by moderate to high permeability soils; (iv) P4—fresh to weathered dolerite, covered by low permeability soils.
2. Determination of the intermediate protection factor ( F i n t )
It is possible to calculate the intermediate protection factor ( F i n t ) using Equation (1) [34]. This factor ranged from 2 (low protective effect) to 7 (moderate protective effect).
F i n t   =   2   ×   D   +   P
Depending on the conversion between the protection factor F and the groundwater protection zones defined by Pochon et al. [34], the relation between F i n t and groundwater protection zones (S) is the following (Figure 7C): (i) Zone S2 is compatible with F L o w (2, 3, 4) where the values 2, 3 and 4 are related to lineaments and to the moderately to highly weathered coarse grained granite ( W 3 to W 4 - 5 ) ,   respectively ; (ii) Zone S3 is compatible with F M o d e r a t e (5, 6, 7) where the values 5 and 6 are related to some lineaments and value 7 is related to the fresh to slightly weathered coarse grained granite ( W 1 - 2 ) .
3. Protection zone delineation (F)
Because of the influence of slope topography and the low permeability cover over some parts of the study site, it is important to modify the F i n t map, taking the runoff into consideration. Consequently, the protection zone map (Figure 7D) shows that: (i) zones S2 (high vulnerability) were assigned to the first order lineaments; (ii) zones S3 (moderate vulnerability) were assigned to the second order lineaments in the site; and (iii) zones S4 (low vulnerability) were assigned to the rest of the site.
A similar approach, presented in Figure 8, was applied to a spring of normal groundwater located on the slope to east of the spa. The discontinuity parameter is mapped in Figure 8A, the protective cover parameter corresponds to Figure 8B, the intermediate protection factor (Fint) is represented in Figure 8C and the final protection factor (F) is mapped in Figure 8D. In the F factor map once again, the close control of the spatial distribution of the high and moderate vulnerability classes (S2 and S3) by the first order and second order tectonic lineaments is clear. The remaining area, without any hydraulic connection to this spring, shows the low vulnerability class (S4).

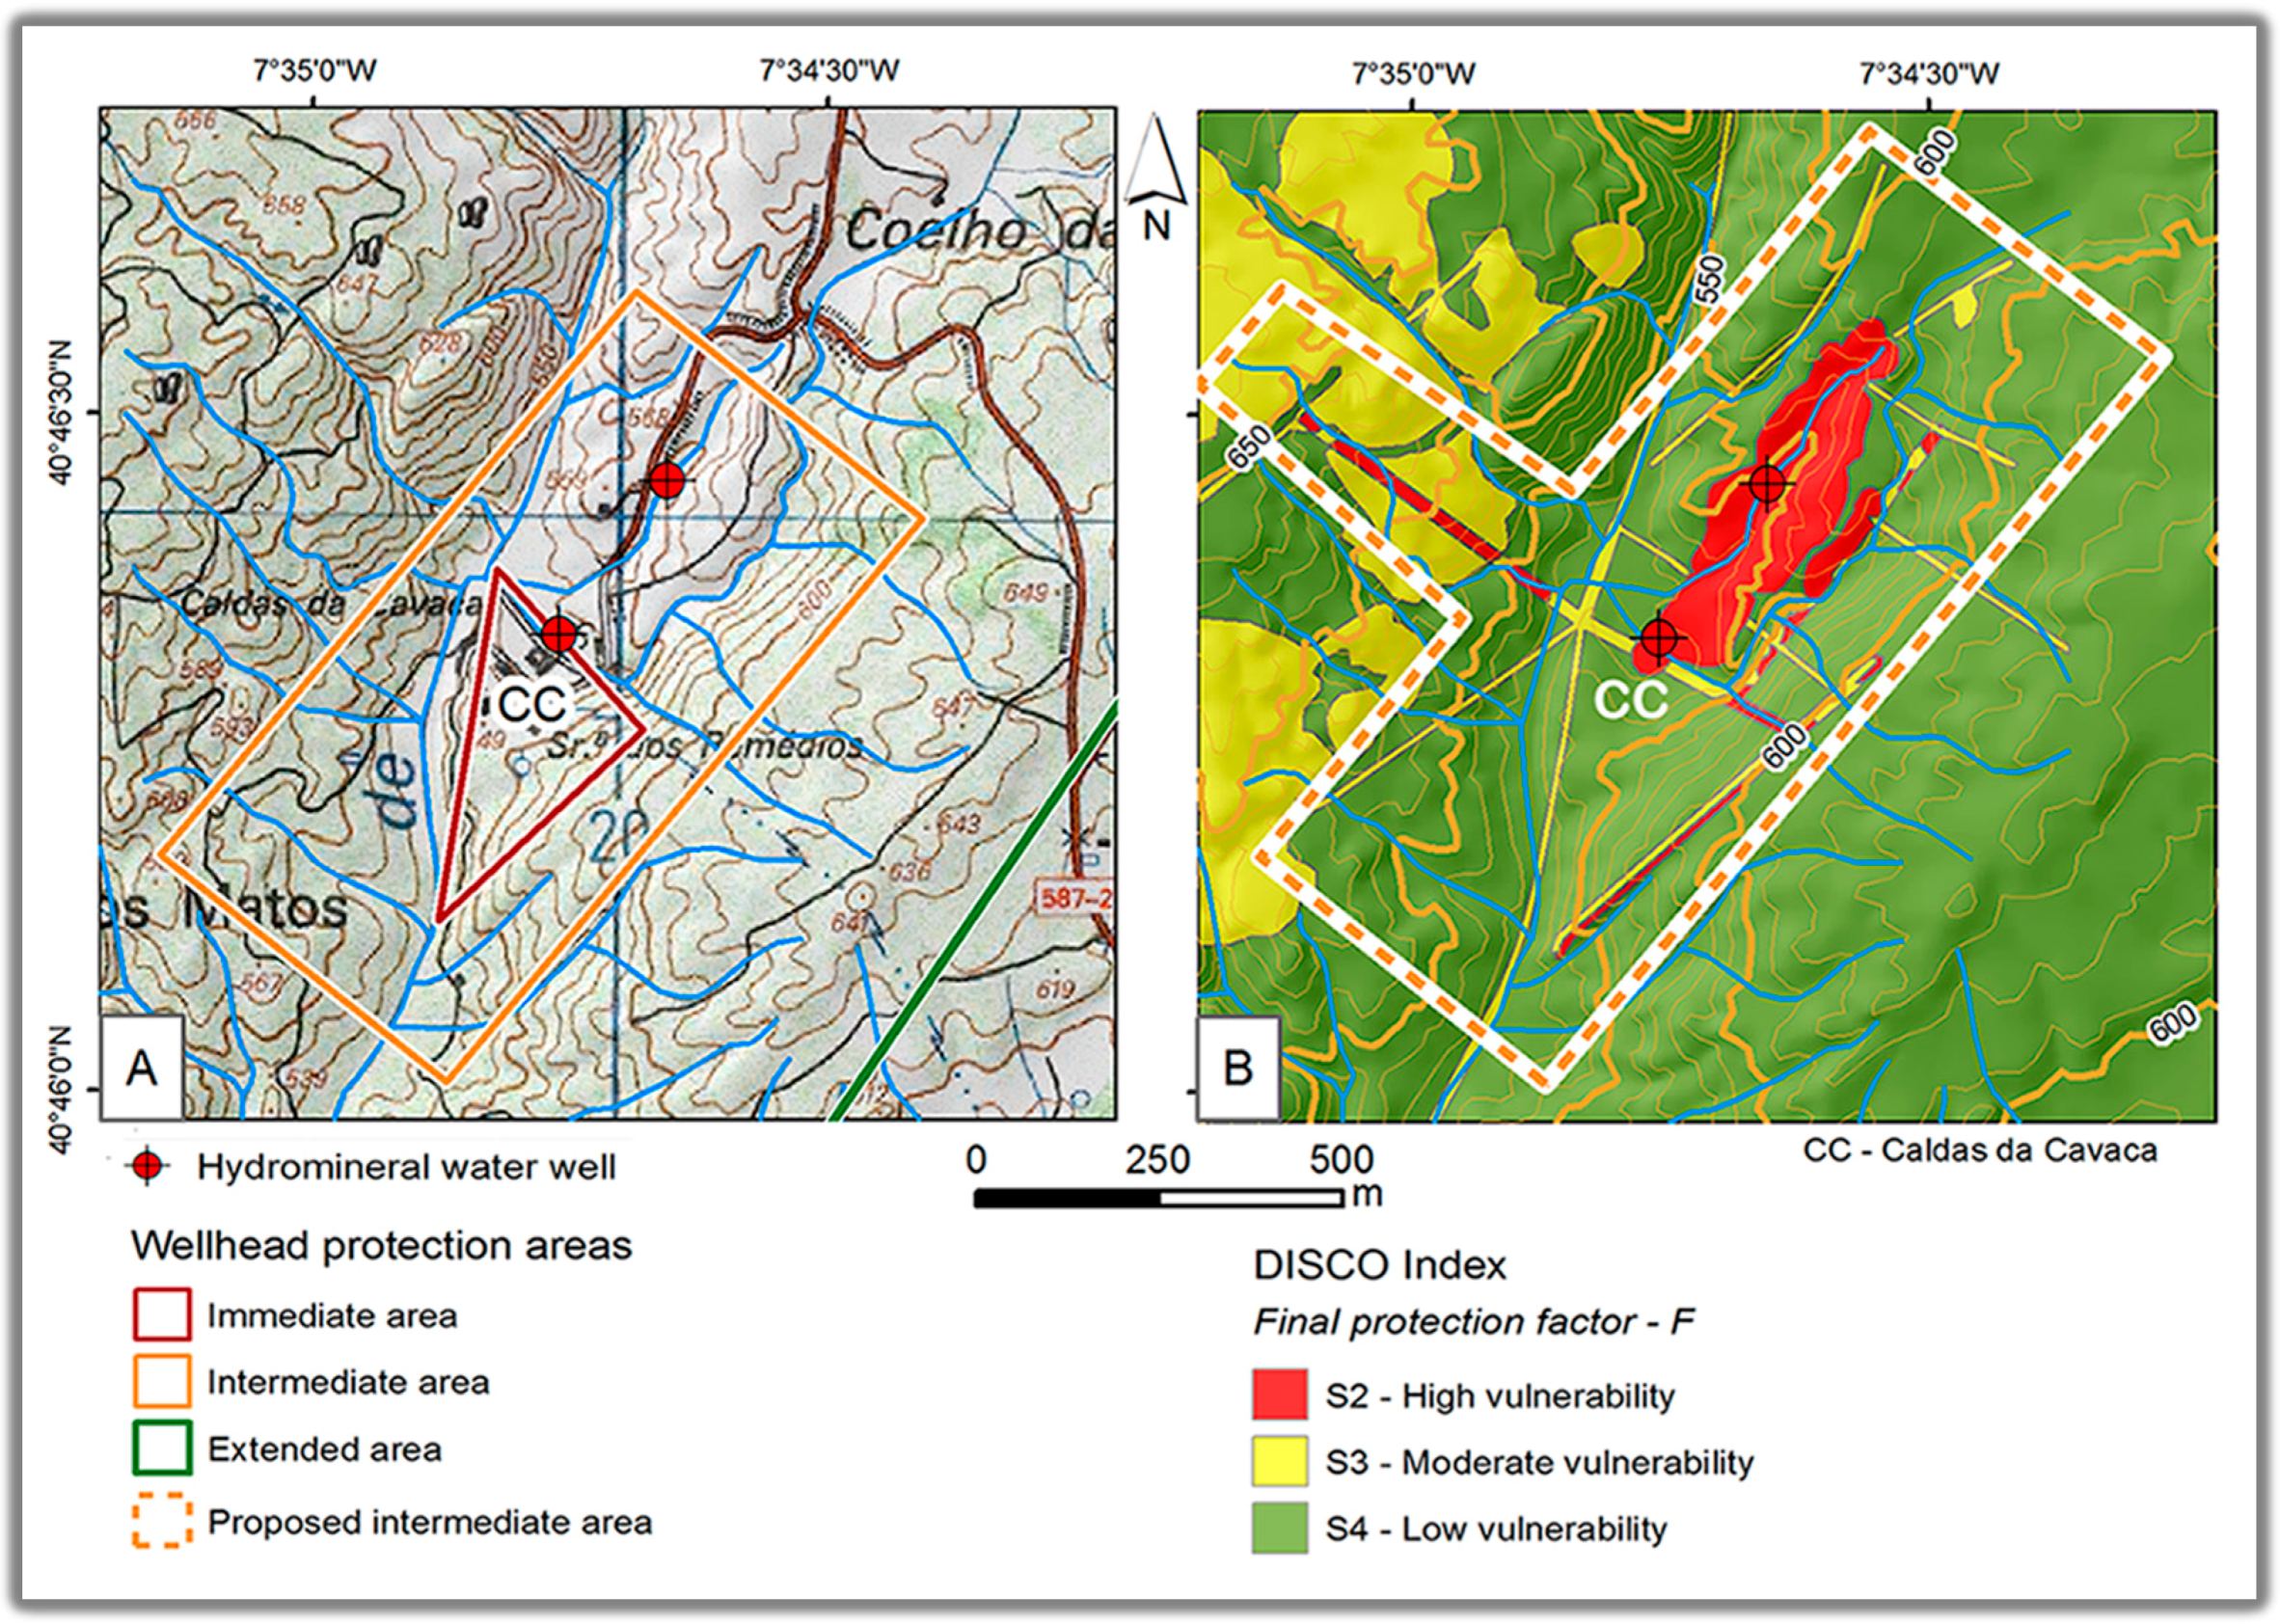
4.4. Wellhead Protection Zones: An Updated Proposal

According to the Portuguese law (D.L. 382/99; L. 58/2005; P. 702/2009), a wellhead protection area is to be established considering the hydrogeological conditions and comprises the following: (i) the immediate protection zone, where all activities not related to groundwater exploitation are forbidden (the corresponding area is normally protected by a fence); (ii) the intermediate protection zone, where all activities or facilities which may contaminate the groundwater, whether by the infiltration of contaminants or by changing the flow paths, are forbidden or at least strictly controlled; (iii) the extended protection zone, where the constraints to activities and facilities are still applied but in a less severe way.
At Caldas da Cavaca, the existing wellhead protection area was defined for the former mineral water well in 1996 using simple criteria, (Figure 9). Since then, new wells have been drilled and knowledge of the hydrogeological system has improved significantly, e.g., [25,26,40,44]. The results of the DISCO methodology provide a solid basis for the review of the wellhead protection area in order to adjust it to the present exploitation conditions and to the updated hydrogeologic conceptual model. Given the results of the DISCO index, the intermediate protection zone is the most critical. This zone should be expanded to NE and to NW (Figure 9) with the purpose of encompassing all the high vulnerability zones (S2), as well as the most important moderate vulnerability zones (S3). The existing extended vulnerability zone should retain its limits because it is large enough to include all the relevant deep-crustal geostructures and the related vulnerability zones. The immediate protection zone should be restricted to the vicinity of the new mineral water wells.

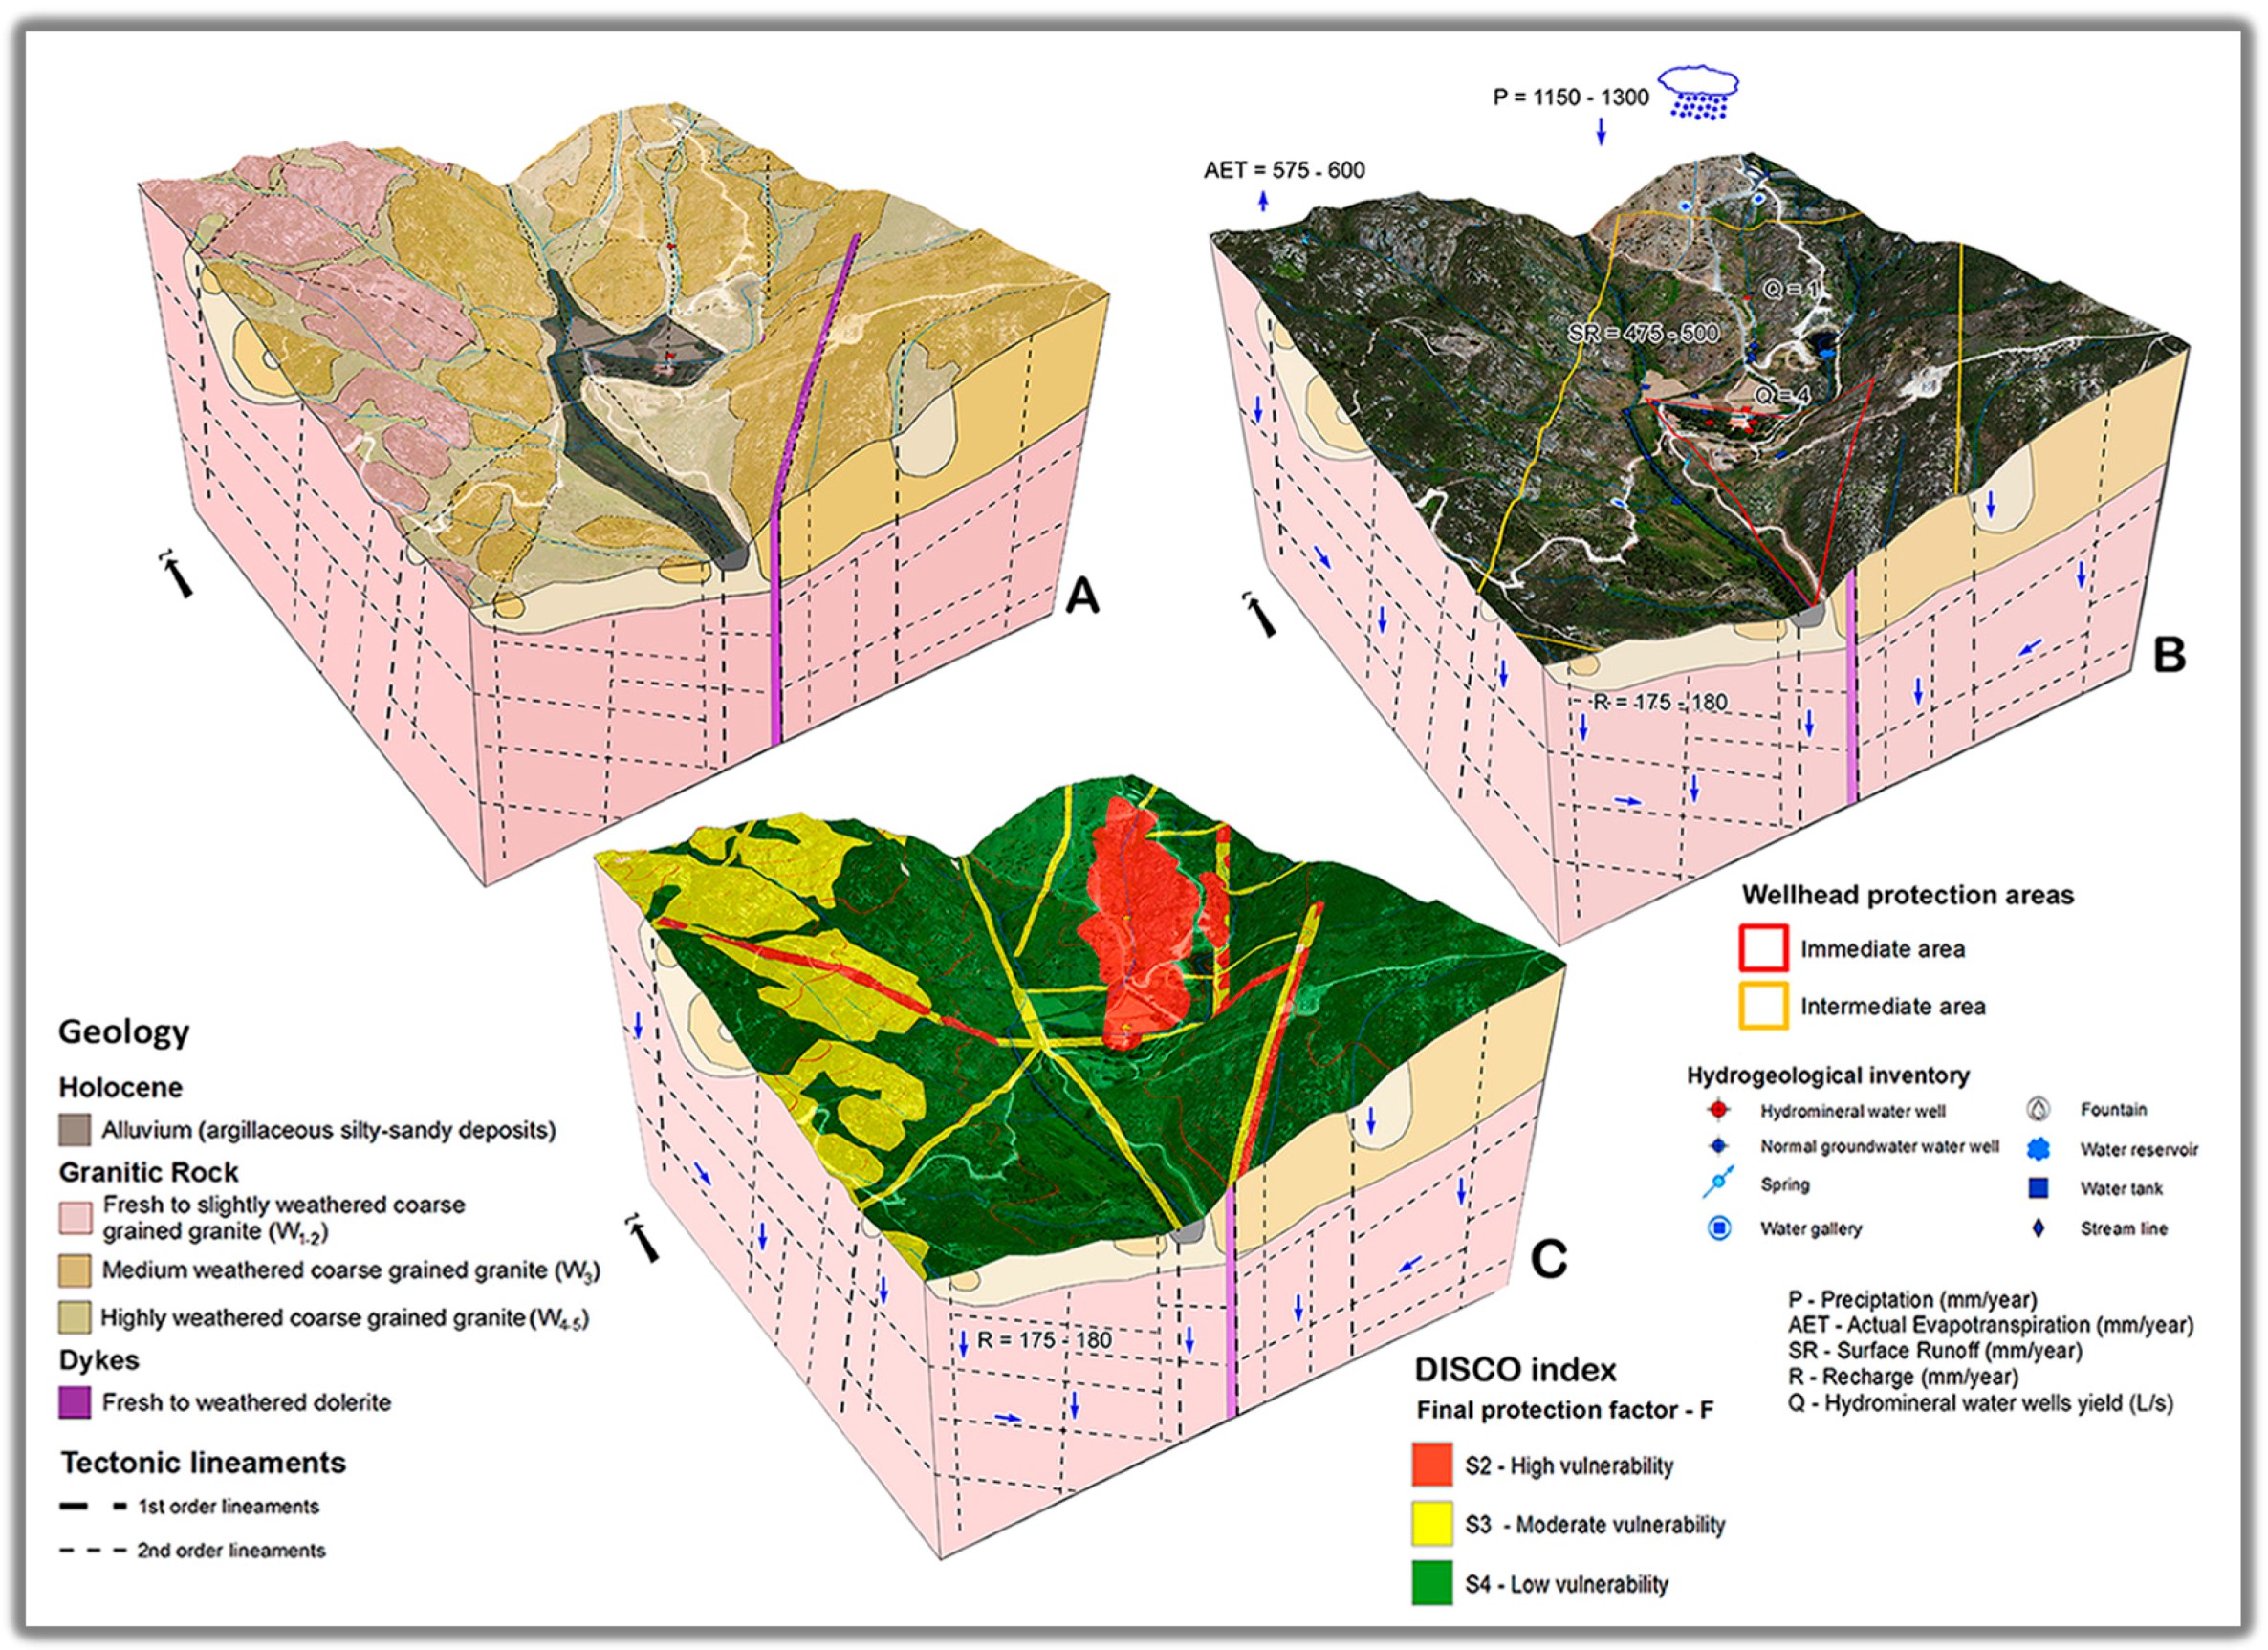
4.5. Hydrogeology Conceptual Site Model: Inputs from Intrinsic Vulnerability Mapping

The discharge zone of the Caldas da Cavaca hydromineral system is characterized by three aquifer types represented in the hydrogeological conceptual model of Figure 10, as follows [26,40,44,53]:
  • Shallow and unconfined aquifer: this is located in the bottom of the valley, associated with the alluvial deposits. The groundwater (sodium chloride to sodium bicarbonate facies) of this aquifer is characterized by pH of around 5–6.5 and very low mineralization, with electrical conductivity under 20 μS/cm; the temperature of the water is similar to the mean monthly air temperature. The intrinsic vulnerability to contamination of this aquifer varies from high to very high.
  • Unconfined to semi-confined aquifer: this is located in the fractured and weathered granitic with transmissivity lower than 1 m2/day and very low water yields (less than 0.05 L·s−1). The groundwater from this aquifer is characterized by a sodium chloride facies, with pH around 5–6.5 and low mineralization, with electrical conductivity between 20 and 50 μS/cm. The vulnerability to contamination is moderate to high.
  • Deep confined hydromineral aquifer: this is located in the fresh granite dominated by a deep fault zone with transmissivity ranging from 27 to 136 m2/day. The Ribeira de Coja fault zone is considered the main structure of the hydromineral water reservoir. These waters are characterized by pH of around 8.4–8.6, temperatures around 29 °C and intermediate mineralization with electrical conductivity ranging from 350 to 430 μS/cm. Moreover, the hydromineral waters of this aquifer have an alkaline reaction, are fluoridated and sulfurous, and have sodium bicarbonate hydrogeochemical facies. The intrinsic vulnerability to contamination is high in the discharge area (wellhead site), but very low in the deep hydromineral reservoir.
The results of the application of the DISCO methodology (the final protection factor, F) make it possible to improve the Caldas da Cavaca hydrogeological conceptual model. Figure 10C shows the hydrogeological conceptual site model depending on the vulnerability DISCO index inputs. In a broad sense, the DISCO index results are compatible with the other vulnerability indexes studied, especially GOD-S, DRASTIC-Fm, SINTACS and SI (see Figure 6). However, the DISCO map, particularly regarding the high and moderate vulnerability areas, reflects much more effectively the role of the main tectonic structures in the groundwater circulation. Thus, high vulnerability was assigned to the first order lineaments, moderate vulnerability was assigned to the second order lineaments in the site (related fractures and joints) and low vulnerability was assigned to the rest of the site.

5. Conclusions

Vulnerability assessment mapping is an essential step in assessing intrinsic groundwater vulnerability to contamination and in delineating wellhead protection areas. In addition, this approach provides a visual analysis and a practical tool for helping planners and decision makers in order to achieve the sustainable management of water resources.
Intrinsic groundwater vulnerability studies are often based on multi-technical studies to achieve a comprehensive model of groundwater vulnerability to contamination. GIS-based mapping methodology provides an accurate approach for evaluating groundwater vulnerability, as well as for delineating the hydrogeological conceptual site model. Furthermore, comparative and detailed studies applying different scale mapping and methodologies are a valuable approach to the effective evaluation of the intrinsic groundwater vulnerability. The more frequent multicriteria indexes, GOD-S, DRASTIC-Fm, SINTACS and SI, are often used in local to regional-scale study areas. The DISCO index [34] is more suitable to local-scale site hydrogeological investigations related to wellhead protection areas and springs. The integrated multi-technical approach has been demonstrated to be suitable for fractured media, mainly in contexts of data scarcity.
This comprehensive study highlights the need to perform a merging balance of the most common multicriteria intrinsic vulnerability evaluation techniques, used generally in larger areas, along with the DISCO index, more suitable for local-scale investigations. In addition, the design of a methodological GIS mapping approach, particularly focused on supporting the local-scale site management and protection of groundwater resource areas, is an essential task which provides valuable output. Finally, the integrative approach generates more realistic hydrogeological conceptual site models, which are of greater interest in the scope of water resource management, especially for mineral water exploitation, encompassing mineral water bottling, thermal spa activities and the related tourism with respect to health and wellness.

Acknowledgments

This study was carried out under the framework of the projects Labcarga|ISEP re-equipment program (IPP-ISEP|PAD’2007/08), Centre GeoBioTec|UA (UID/GEO/04035/2013), and HydroSPOT|Labcarga (ESA-ID5750). Helen Meerkhan was supported by GPSS|Foundation Casa do Regalo (Lisbon), particularly Jorge Sampaio and Helena Barroco, as well as by P. Porto-Polytechnic of Porto (Rosário Gâmboa) and ISEP-School of Engineering of Porto (João Rocha). Jorge Espinha Marques was supported by the IES (UID/GEO/04683/2013), through the project ICT (POCI-01-0145-FEDER-007690). Special thanks are given to our colleagues José Martins Carvalho, Rui Moura, Ricardina Moura, Liliana Freitas, João Meirinhos and Robin Nagano. The authors are grateful to the Aguiar da Beira Council, Caldas da Cavaca SA Spa, TARH Lda and GeoSonda Lda for their support in some stages of the research. We acknowledge the anonymous reviewers for the constructive comments that helped to improve the focus of the manuscript.

Author Contributions

Helen Meerkhan, Helder I. Chaminé, Maria José Afonso designed the research. José Teixeira, Jorge Espinha Marques and Helder I. Chaminé gave input on the fields of hydrogeology, hydrogeomorphology, hydrogeomechanics, wellhead protection areas and GIS mapping of the study site. All authors contributed to the data analysis and interpretation and discussed results. Helen Meerkhan, Helder I. Chaminé and Maria José Afonso wrote the manuscript with contributions of all authors.

Conflicts of Interest

The authors declare no conflict of interest.

References

  1. Richter, H.E.; Gungle, B.; Lacher, L.J.; Turner, D.S.; Bushman, B.M. Development of a shared vision for groundwater management to protect and sustain baseflows of the Upper San Pedro River, Arizona, USA. Water 2014, 6, 2519–2538. [Google Scholar] [CrossRef]
  2. Committee on Fracture Characterization and Fluid Flow (CFCFF). Rock Fractures and Fluid Flow: Contemporary Understanding and Applications; National Academy of Sciences: Washington, DC, USA, 1996. [Google Scholar]
  3. Scesi, L.; Gattinoni, P. Water Circulation in Rocks; Springer: Dordrecht, The Netherlands, 2009. [Google Scholar]
  4. Singhal, B.S.; Gupta, R.P. Applied Hydrogeology of Fractured Rocks, 2nd ed.; Springer: Heidelberg, Germany, 2010. [Google Scholar]
  5. Gustafson, G. Hydrogeology for Rock Engineers; BeFo and ISRM: Stockholm, Sweden, 2012. [Google Scholar]
  6. Jaiswal, R.K.; Mukherjee, S.; Krishnamurthy, J.; Saxena, R. Role of remote sensing and GIS techniques for generation of groundwater prospect zones towards rural development—An approach. Int. J. Remote Sens. 2003, 24, 993–1008. [Google Scholar] [CrossRef]
  7. Albinet, M.; Margat, J. Cartographie de la vulnérabilité à la pollution des nappes d’eau souterraine. Bull. BRGM (Paris) 1970, 2, 13–22. [Google Scholar]
  8. Aller, L.; Bennet, T.; Lehr, J.H.; Petty, R.J. DRASTIC: A Standardized System for Evaluating Groundwater Pollution Potential Using Hydrologic Settings; Robert, S., Ed.; Technical Report; U.S. EPA Report, 600/2-87/035; Kerr Environmental Research Laboratory: Ada, OK, USA, 1987. [Google Scholar]
  9. Vrba, J.; Zaporozec, A. Guidebook on Mapping Groundwater Vulnerability; International Contributions to Hydrogeology; Velrag Heinz Heise: Hannover, Germany, 1994; Volume 16. [Google Scholar]
  10. Foster, S.; Hirata, R.; Gomes, D.; Delia, M.; Paris, M. Groundwater Quality Protection: A Guide for Water Utilities, Municipal Authorities, and Environment Agencies; The International Bank for Reconstruction and Development; The World Bank: Washington, DC, USA, 2002. [Google Scholar]
  11. Witkowski, A.; Kowalczyk, A.; Vrba, J. (Eds.) Groundwater Vulnerability Assessment and Mapping; Taylor & Francis Group: London, UK, 2007.
  12. Morris, B.; Lawrence, A.; Chilton, J.; Adams, B.; Klinck, B.; Calow, R. Groundwater and Its Susceptibility to Degradation: A Global Assessment of the Problem and Options for Management; United Nations Environment Programme: Nairobi, Kenya, 2003. [Google Scholar]
  13. Robins, N.S.; Chilton, P.J.; Cobbing, J.E. Adapting existing experience with aquifer vulnerability and groundwater protection for Africa. J. Afr. Earth Sci. 2007, 47, 30–38. [Google Scholar] [CrossRef]
  14. Gemitzi, A.; Petalas, C.; Tsihrintzis, V.; Pisinaras, V. Assessment of groundwater vulnerability to pollution: A combination of GIS, fuzzy logic and decision making techniques. Environ. Geol. 2006, 49, 653–673. [Google Scholar] [CrossRef]
  15. Pisinaras, V.; Polychronis, C.; Gemitzi, A. Intrinsic groundwater vulnerability determination at the aquifer scale: A methodology coupling travel time estimation and rating methods. Environ. Earth Sci. 2016, 75, 85. [Google Scholar] [CrossRef]
  16. Daly, D.; Warren, W.P. Mapping Groundwater Vulnerability: The Irish Perspective; Geological Survey of Ireland: Dublin, Ireland, 1998. [Google Scholar]
  17. González, A.; Sánchez, A.L.; Requena, P.M.; Varela, M.S. Assessment of the microbiological quality of groundwater in three regions of the Valencian Community (Spain). Int. J. Environ. Res. Public Health 2014, 11, 5527–5540. [Google Scholar] [CrossRef] [PubMed]
  18. Jha, M.K.; Chowdhury, A.; Chowdary, V.; Peiffer, S. Groundwater management and development by integrated remote sensing and geographic information systems: Prospects and constraints. Water Resour. Manag. 2007, 21, 427–467. [Google Scholar] [CrossRef]
  19. Saaty, T.L. Decision making with the analytic hierarchy process. Int. J. Serv. Sci. 2008, 1, 83–98. [Google Scholar] [CrossRef]
  20. Margat, J.; van der Gun, J. Groundwater around the World: A Geographic Synopsis; Taylor & Francis Group: Boca Raton, FL, USA, 2013. [Google Scholar]
  21. Chaminé, H.I. Water resources meet sustainability: New trends in environmental hydrogeology and groundwater engineering. Environ. Earth Sci. 2015, 73, 2513–2520. [Google Scholar] [CrossRef]
  22. Chaminé, H.I.; Carvalho, J.M.; Teixeira, J.; Freitas, L. Role of hydrogeological mapping in groundwater practice: Back to basics. Eur. Geol. J. 2015, 40, 34–42. [Google Scholar]
  23. Junior, R.F.; Varandas, S.G.P.; Fernandes, L.F.S. Multicriteria analysis for the monitoring of aquifer vulnerability: A scientific tool in environmental policy. Environ. Sci. Policy 2015, 48, 250–264. [Google Scholar] [CrossRef]
  24. Sahoo, S.; Dhar, A.; Kar, A.; Chakraborty, D. Index-based groundwater vulnerability mapping using quantitative parameters. Environ. Earth Sci. 2016, 75, 522. [Google Scholar] [CrossRef]
  25. Teixeira, J.; Chaminé, H.I.; Espinha Marques, J.; Gomes, A.; Carvalho, J.M.; Pérez-Alberti, A.; Rocha, F. Integrated approach of hydrogeomorphology and GIS mapping to the evaluation of groundwater resources: An example from the hydromineral system of Caldas da Cavaca, NW Portugal. In Global Groundwater Resources and Management: Selected Papers from the 33rd International Geological Congress; Paliwal, B.S., Ed.; Scientific Publishers: Jodhpur, India, 2010; pp. 227–249. [Google Scholar]
  26. Teixeira, J.; Chaminé, H.I.; Espinha Marques, J.; Carvalho, J.M.; Pereira, A.J.; Carvalho, M.R.; Fonseca, P.E.; Pérez-Alberti, A.; Rocha, F. A comprehensive analysis of groundwater resources using GIS and multicriteria tools (Caldas da Cavaca, Central Portugal): Environmental issues. Environ. Earth Sci. 2015, 73, 2699–2715. [Google Scholar] [CrossRef]
  27. Meirinhos, J. Hydrogeomechanics for Rock Engineering: Coupling Subsurface Hydrogeomechanical Assessment and Hydrogeotechnical Mapping on Fractured Rock Masses. Master’s Thesis, School of Engineering, Polytechnic of Porto, Porto, Portugal, 2015. [Google Scholar]
  28. Denny, S.C.; Allen, D.M.; Journeay, M. DRASTIC-Fm: A modified vulnerability mapping method for structurally-controlled aquifers. Hydrogeol. J. 2007, 15, 483–493. [Google Scholar] [CrossRef]
  29. Civita, M.V.; de Maio, M. Assessing and mapping aquifer vulnerability to contamination: The Italian “combined” approach. Geofísica Internacional 2000, 43, 513–532. [Google Scholar]
  30. Civita, M.V. Le Carte Della Vulnerabilità Degli Acquiferi All’inquinamento; Teoria & Practica Pitagora: Bologna, Italy, 2010. [Google Scholar]
  31. Ribeiro, A.; Munhá, J.; Dias, R.; Mateus, A.; Pereira, E.; Ribeiro, L.; Fonseca, P.E.; Araújo, A.; Oliveira, J.T.; Romão, J.; et al. Geodynamic evolution of the SW Europe Variscides. Tectonics 2007, 26, 1–24. [Google Scholar] [CrossRef]
  32. Stigter, T.Y.; Ribeiro, L.; Dill, A.M. Evaluation of an intrinsic and a specific vulnerability assessment method in comparison with groundwater salinisation and nitrate contamination levels in two agricultural regions in the south of Portugal. Hydrogeol. J. 2006, 14, 79–99. [Google Scholar] [CrossRef]
  33. Pochon, A.; Zwahlen, F. Délimitation des Zones de Protection des Eaux Souterraines en Milieu Fissuré; Technical Report; Office Fédéral de L’environnement: Berne, Switzerland, 2003. [Google Scholar]
  34. Pochon, A.; Tripet, J.-P.; Kozel, R.; Meylan, B.; Sinreich, M.; Zwahlen, F. Groundwater protection in fractured media: A vulnerability-based approach for delineating protection zones in Switzerland. Hydrogeol. J. 2008, 16, 1267–1281. [Google Scholar] [CrossRef]
  35. Freire Andrade, C. Projecto de Modificação de Captagem das Águas das Caldas da Cavaca; Unpublished Technical Report; Serviços Geológicos: Lisboa, Portugal, 1935; p. 11. [Google Scholar]
  36. Freire Andrade, C. Os Vales Submarinos Portugueses e o Diastrofismo das Berlengas e da Estremadura; Serviços Geológicos: Lisboa, Portugal, 1937; p. 236. [Google Scholar]
  37. Freire Andrade, C. Nota Acerca dos Trabalhos Realizados para a Modificação da Captagem das Águas Medicinaes das Caldas da Cavaca; Unpublished Technical Report; Serviços Geológicos: Lisboa, Portugal, 1938; p. 7. [Google Scholar]
  38. Acciaiuoli, L. Le Portugal Hydromineral; Direcção Geral, Serviços Geológicos: Lisbonne, Portugal, 1952; Volume 2. [Google Scholar]
  39. Boorder, H. Petrological Investigations in the Aguiar da Beira Granite Area, Northern Portugal. Ph.D. Thesis, University of Amsterdam, Amsterdam, The Netherlands, 1965. [Google Scholar]
  40. Teixeira, J. Hidrogeomorfologia e Sustentabilidade de Recursos Hídricos Subterrâneos. Ph.D. Thesis, University of Aveiro, Aveiro, Portugal, 2011. [Google Scholar]
  41. Carvalho, J.M. Prospecção e Pesquisa de Recursos Hídricos Subterrâneos no Maciço Antigo Português: Linhas Metodológicas. Ph.D. Thesis, University of Aveiro, Aveiro, Portugal, 2006. [Google Scholar]
  42. Peel, M.C.; Finlayson, B.L.; McMahon, T.A. Updated world map of the Köppen-Geiger climate classification. Hydrol. Earth Syst. Sci. 2007, 11, 1633–1644. [Google Scholar] [CrossRef]
  43. Brum Ferreira, A. Neotectonics in Northern Portugal: A geomorphological approach. Z. Geomorphol. 1991, 82, 73–85. [Google Scholar]
  44. Carvalho, J.M.; Chaminé, H.I.; Afonso, M.J.; Espinha Marques, J.; Teixeira, J.; Cerqueira, A.; Coelho, A.; Gomes, A.; Fonseca, P.E. Prospecção hidrogeológica da área do sistema hidromineral das Caldas da Cavaca (Aguiar da Beira, Portugal Central): Implicações na gestão dos recursos hídricos subterrâneos. In Actas del I Foro Ibérico Sobre Aguas Envasadas y Balnearios; Fernández Rubio, R., Ed.; Asociación Nacional de Empresas de Aguas de Bebida Envasadas: Madrid, Portugal, 2005; pp. 109–121. [Google Scholar]
  45. Espinha Marques, J. Revisão do Plano de Exploração da Concessão Hidromineral HM-11 Caldas da Cavaca (Dezembro); Unpublished Technical Report; Faculdade de Ciências da Universidade do Porto: Porto, Portugal, 2008; p. 24. [Google Scholar]
  46. Espinha Marques, J. Revisão do Plano de Exploração da Concessão Hidromineral HM-11 Caldas da Cavaca (Maio); Unpublished Technical Report; Faculdade de Ciências da Universidade do Porto: Porto, Portugal, 2008; p. 61. [Google Scholar]
  47. Chaminé, H.I.; Carvalho, J.M.; Afonso, M.J.; Teixeira, J.; Freitas, L. On a dialogue between hard-rock aquifer mapping and hydrogeological conceptual models: Insights into groundwater exploration. Eur. Geol. J. 2013, 35, 26–31. [Google Scholar]
  48. Teixeira, J.; Chaminé, H.I.; Carvalho, J.M.; Pérez-Alberti, A.; Rocha, F. Hydrogeomorphological mapping as a tool in groundwater exploration. J. Maps 2013, 9, 263–273. [Google Scholar] [CrossRef]
  49. Saaty, T.L. A scaling method for priorities in hierarchical structures. J. Math. Psychol. 1977, 15, 234–281. [Google Scholar] [CrossRef]
  50. Narany, T.S.; Ramli, M.F.; Aris, A.Z.; Sulaiman, W.N.; Fakharian, K. Spatial assessment of groundwater quality monitoring wells using indicator kriging and risk mapping, Amol-Babol Plain, Iran. Water 2014, 6, 68–85. [Google Scholar] [CrossRef]
  51. Terra, Ambiente & Recursos Hídricos Lda. Estudo Hidrogeológico da Concessão Hidromineral HM-11 Caldas da Cavaca e Terrenos Envolventes; Unpublished Technical Report; TARH—Terra, Ambiente & Recursos Hídricos Lda.: Sacavém, Portugal, 2005; p. 42. [Google Scholar]
  52. GeoSonda Lda. Prospecção Electromagnética nas Caldas da Cavaca; Unpublished Technical Report; GeoSonda Lda.: Santa Maria da Feira, Portugal, 2004; p. 7. [Google Scholar]
  53. Meerkhan, H. Delineating Environmental Groundwater Vulnerability and Protection Zones Mapping in Fractured Rock Masses. Master’s Thesis, School of Engineering, Polytechnic of Porto, Porto, Portugal, 2015. [Google Scholar]
Figure 1. Regional framework of the study area (Caldas da Cavaca hydromineral system, Aguiar da Beira), based on [25,39,40,41]: (A) Regional location of the study site (Central Portugal); (B) shaded relief and regional hydrogeology; (C) Satellite image and tectonic lineaments; (D) Slope; (E) Land cover; (F) Block diagram illustrating the basic geological framework of the study site.
Water 08 00462 g001
Figure 2. Conceptual flowchart representing the methodology used in the study.
Water 08 00462 g002
Figure 3. Local hydrogeological framework of Caldas da Cavaca site, revised and updated from [26,27,40]. Hydrogeological inventory (A); geology and geotechnical framework (B); hydrogeomorphology and infiltration potential zoning (C); hydrogeomechanical assessment based on seepage parameter (JW—joint water reduction) on selected rock masses (D).
Water 08 00462 g003
Figure 4. Synthetic interpretation of geophysical surveys for hydrogeological exploration (geoelectrical methods) in the area of Caldas da Cavaca, updated from [45,46,51,52].
Water 08 00462 g004
Figure 5. Multicriteria intrinsic vulnerability indexes from Caldas da Cavaca groundwater systems and surrounding area: (A) GOD-S; (B) DRASTIC-Fm; (C) SINTACS; (D) SI, revised and updated from [26].
Water 08 00462 g005
Figure 6. Ground conditions and intrinsic vulnerability indexes mapping: GOD-S, DRASTIC-Fm, SINTACS, SI.
Water 08 00462 g006
Figure 7. DISCO vulnerability index from Caldas da Cavaca aquifer systems: (A) discontinuities parameter for the hydromineral water wells; (B) protective cover parameter for the hydromineral water wells; (C) intermediate protection factor for the hydromineral water wells; (D) final protection factor for the hydromineral water wells.
Water 08 00462 g007
Figure 8. DISCO method applied to a spring at the Caldas da Cavaca site: (A) discontinuity parameter; (B) protective cover parameter; (C) intermediate protection factor ( F i n t ); (D) final protection factor (F).
Water 08 00462 g008
Figure 9. Wellhead protection areas for Caldas da Cavaca hydromineral system: (A) wellhead protection areas defined in 1996; (B) proposed intermediate wellhead protection area.
Water 08 00462 g009
Figure 10. Hydrogeological conceptual model from the Caldas da Cavaca hydromineral system: vulnerability DISCO index assessment input: (A) general geology and surface rock mass conditions; (B) hydrogeological conceptual site model, updated from [26]; (C) vulnerability DISCO index inputs. In general, the hydromineral system of Caldas da Cavaca is characterized by a precipitation range of 1150–1300 mm/year; actual evapotranspiration ranges from 575 to 600 mm/year; surface runoff from 475 to 500 mm/year and recharge from 175 to 180 mm/year, while the hydromineral water wells yield [Q] varies from 1 L·s−1 to 4 L·s−1 [26].
Water 08 00462 g010
Table 1. GOD-S, DRASTIC-Fm, SINTACS and SI (DRAT-LU) parameters used in the surrounding area of the Caldas da Cavaca site, adapted from [26].
Hydrogeological Units
Sands and GravelsHighly Weathered Coarse Grained Granite (W4-5)Moderately Weathered Coarse Grained Granite (W3)Fresh to Slightly Weathered Coarse Grained Granite (W1-2)Fresh to Weathered Dolerite Dyke (W1-2 to W4-5)
Gunconfinedconfined/semi-confinedconfined/semi-confinedconfined/semi-confinedconfined
Oalluvial sands/gravelsigneous formationsigneous formationsigneous formationsigneous formations
D<55–205–20<55–20
|Ssilty-sandsilty-claysiltthin/absentsilty-clay
D1.5–4.64.5–94.5–91.5–4.64.6–9.1
R250175175175175
Asand and graveligneous/weathered igneousigneous/weathered igneousigneousigneous/weathered igneous
Ssandy loamclay loamsilty-loamsandy loamclay loam
T0%–60%0%–60%0%–60%0%–60%0%–60%
Isand and gravel with significant claysand and gravel with significant clayigneousigneousigneous
C<4.1 m/day<4.1 m/day<4.1 m/day<4.1 m/day<4.1 m/day
Fm0–25 km of lineament/km20–25 km of lineament/km20–5 km of lineament/km20–25 km of lineament/km20–25 km of lineament/km2
S1.5–4.64.5–94.5–91.5–4.64.6–9.1
I250175175175175
Ncoarse alluvial depositfissured plutonic rockfissured plutonic rockfissured plutonic rockfissured plutonic rock
Tsandy-loamclay-loamsilty-loamsandy-loamclay-loam
Acoarse alluvial depositfissured plutonic rockfissured plutonic rockFissured plutonic rockfissured plutonic rock
C5 × 10−5–1 × 10⁻⁴<5 × 10⁻⁵<5 × 10⁻⁵<5 × 10⁻⁵<5 × 10⁻⁵
SThe rating for this parameter is variable since slope values are calculated for each pixel of the ArcGIS raster dataset
D1.5–4.64.5–94.5–91.5–4.64.6–9.1
R250175175175175
Asand and graveligneous/weathered igneousigneous/weathered igneousigneousigneous/weathered igneous
TThe rating for this parameter is variable since slope values are calculated for each pixel of the ArcGIS raster dataset
LUThe rating for this parameter is variable since land use is calculated for each pixel of the ArcGIS raster dataset
Table 2. Protective cover parameter evaluation taking into consideration geological formations and soils overlying aquifers in the Caldas da Cavaca site, adapted from [53].
Hydrogeological Units
Alluvia (Silty-Sandy Deposits)Highly Weathered Coarse Grained Granite ( W 4 - 5 )Moderately Weathered Coarse Grained Granite ( W 3 )Fresh to Slightly Weathered Coarse Grained Granite ( W 1 - 2 )Fresh to Weathered Dolerite Dyke (W1-2 to W4-5)
Protective cover (CO): pedological soilDescriptionHigh permeability soil (sand, pebbles)Moderate permeability soil (silt, loam)Moderate permeability soil (silt, loam)Moderate permeability soil (silt, loam)Low permeability soil (loam, clay)
Thickness (m)>5>10.2–0.50–0.2>1
Class P 1 P 1 P 0 P 0 P 3
Protective cover (CO): geological formationsDescriptionCombined with P 1 soilCombined with P 1 soilCombined with P 0 soilCombined with P 0 soilCombined with P 3 soil
Thickness (m)>2>21–2<1>2
Class P 3 P 3 P 2 P 1 P 4
Rating33214

