
Climate Change Will Make Recovery from Eutrophication More Difficult in Shallow Danish Lake Søbygaard

 ,
,  , ,
, ,
Abstract
:1. Introduction
2. Methods
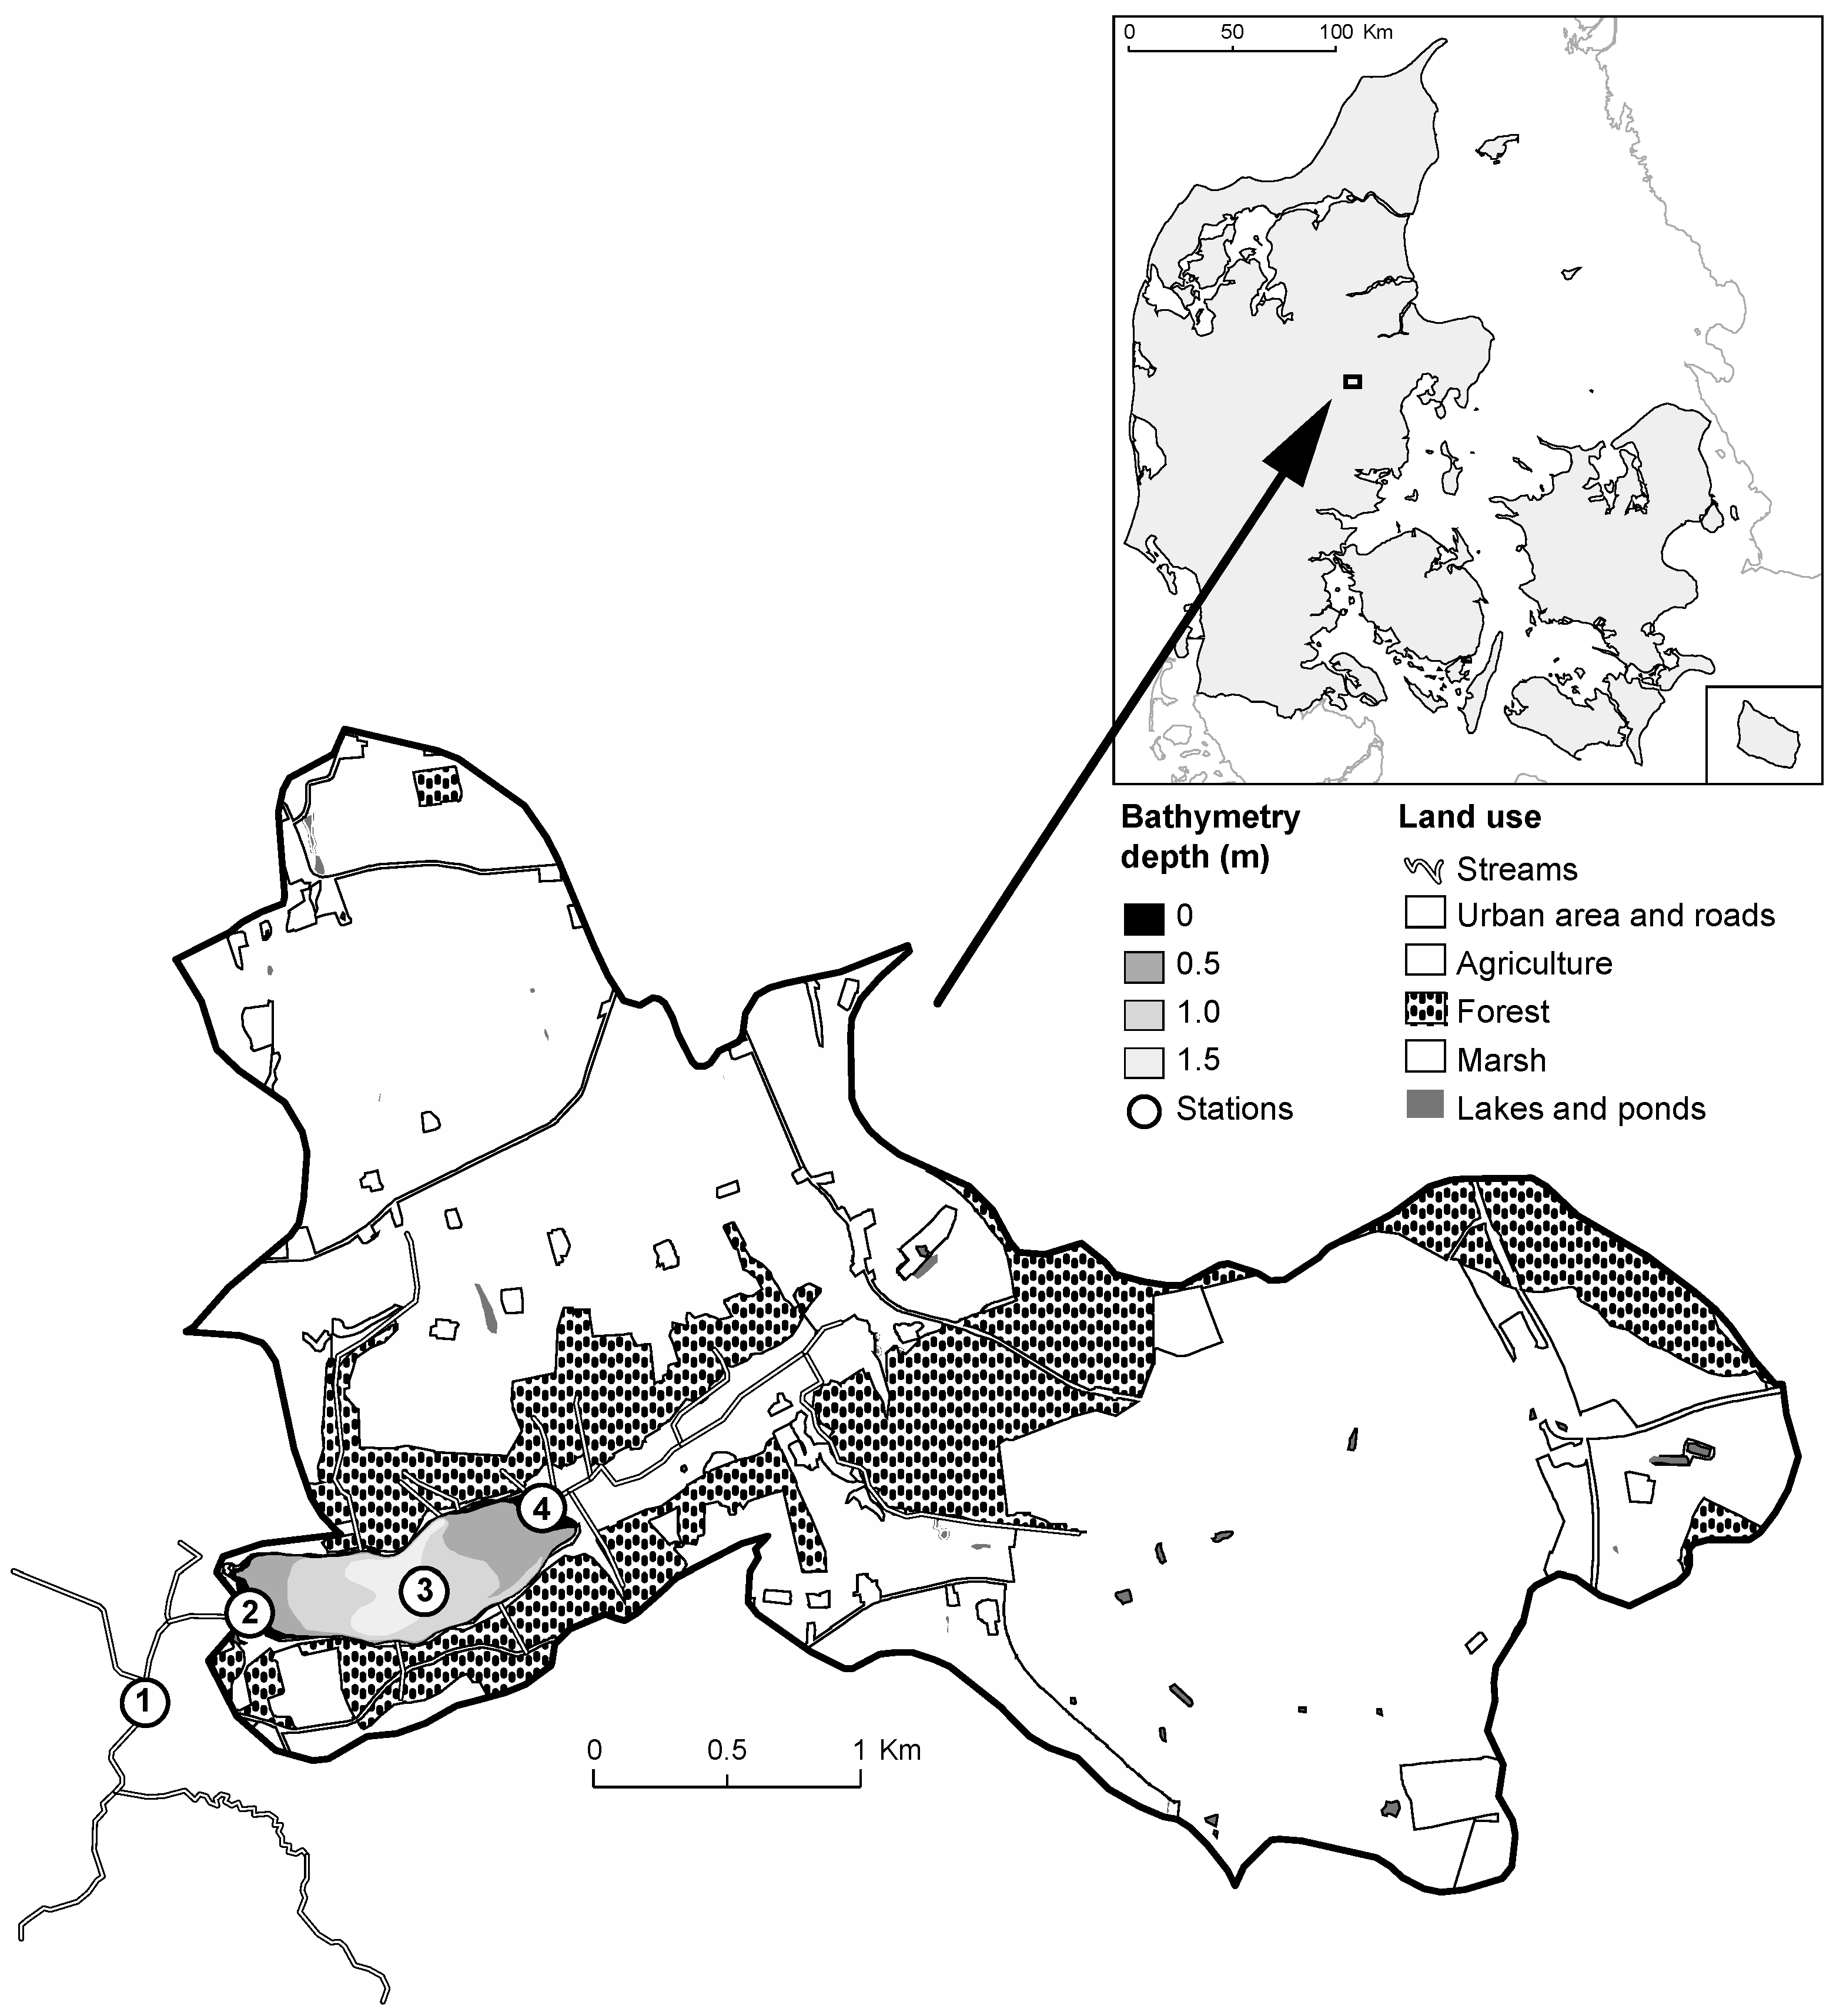
2.1. Study Site
2.2. Model Description
PCLake
2.3. General Lake Model
2.4. Model Input
2.4.1. Meteorological Data
2.4.2. Water Flow and Biochemical Properties
Model Parameters and Calibration
2.4.3. Climate Change and Nutrient Loading Scenarios
3. Results
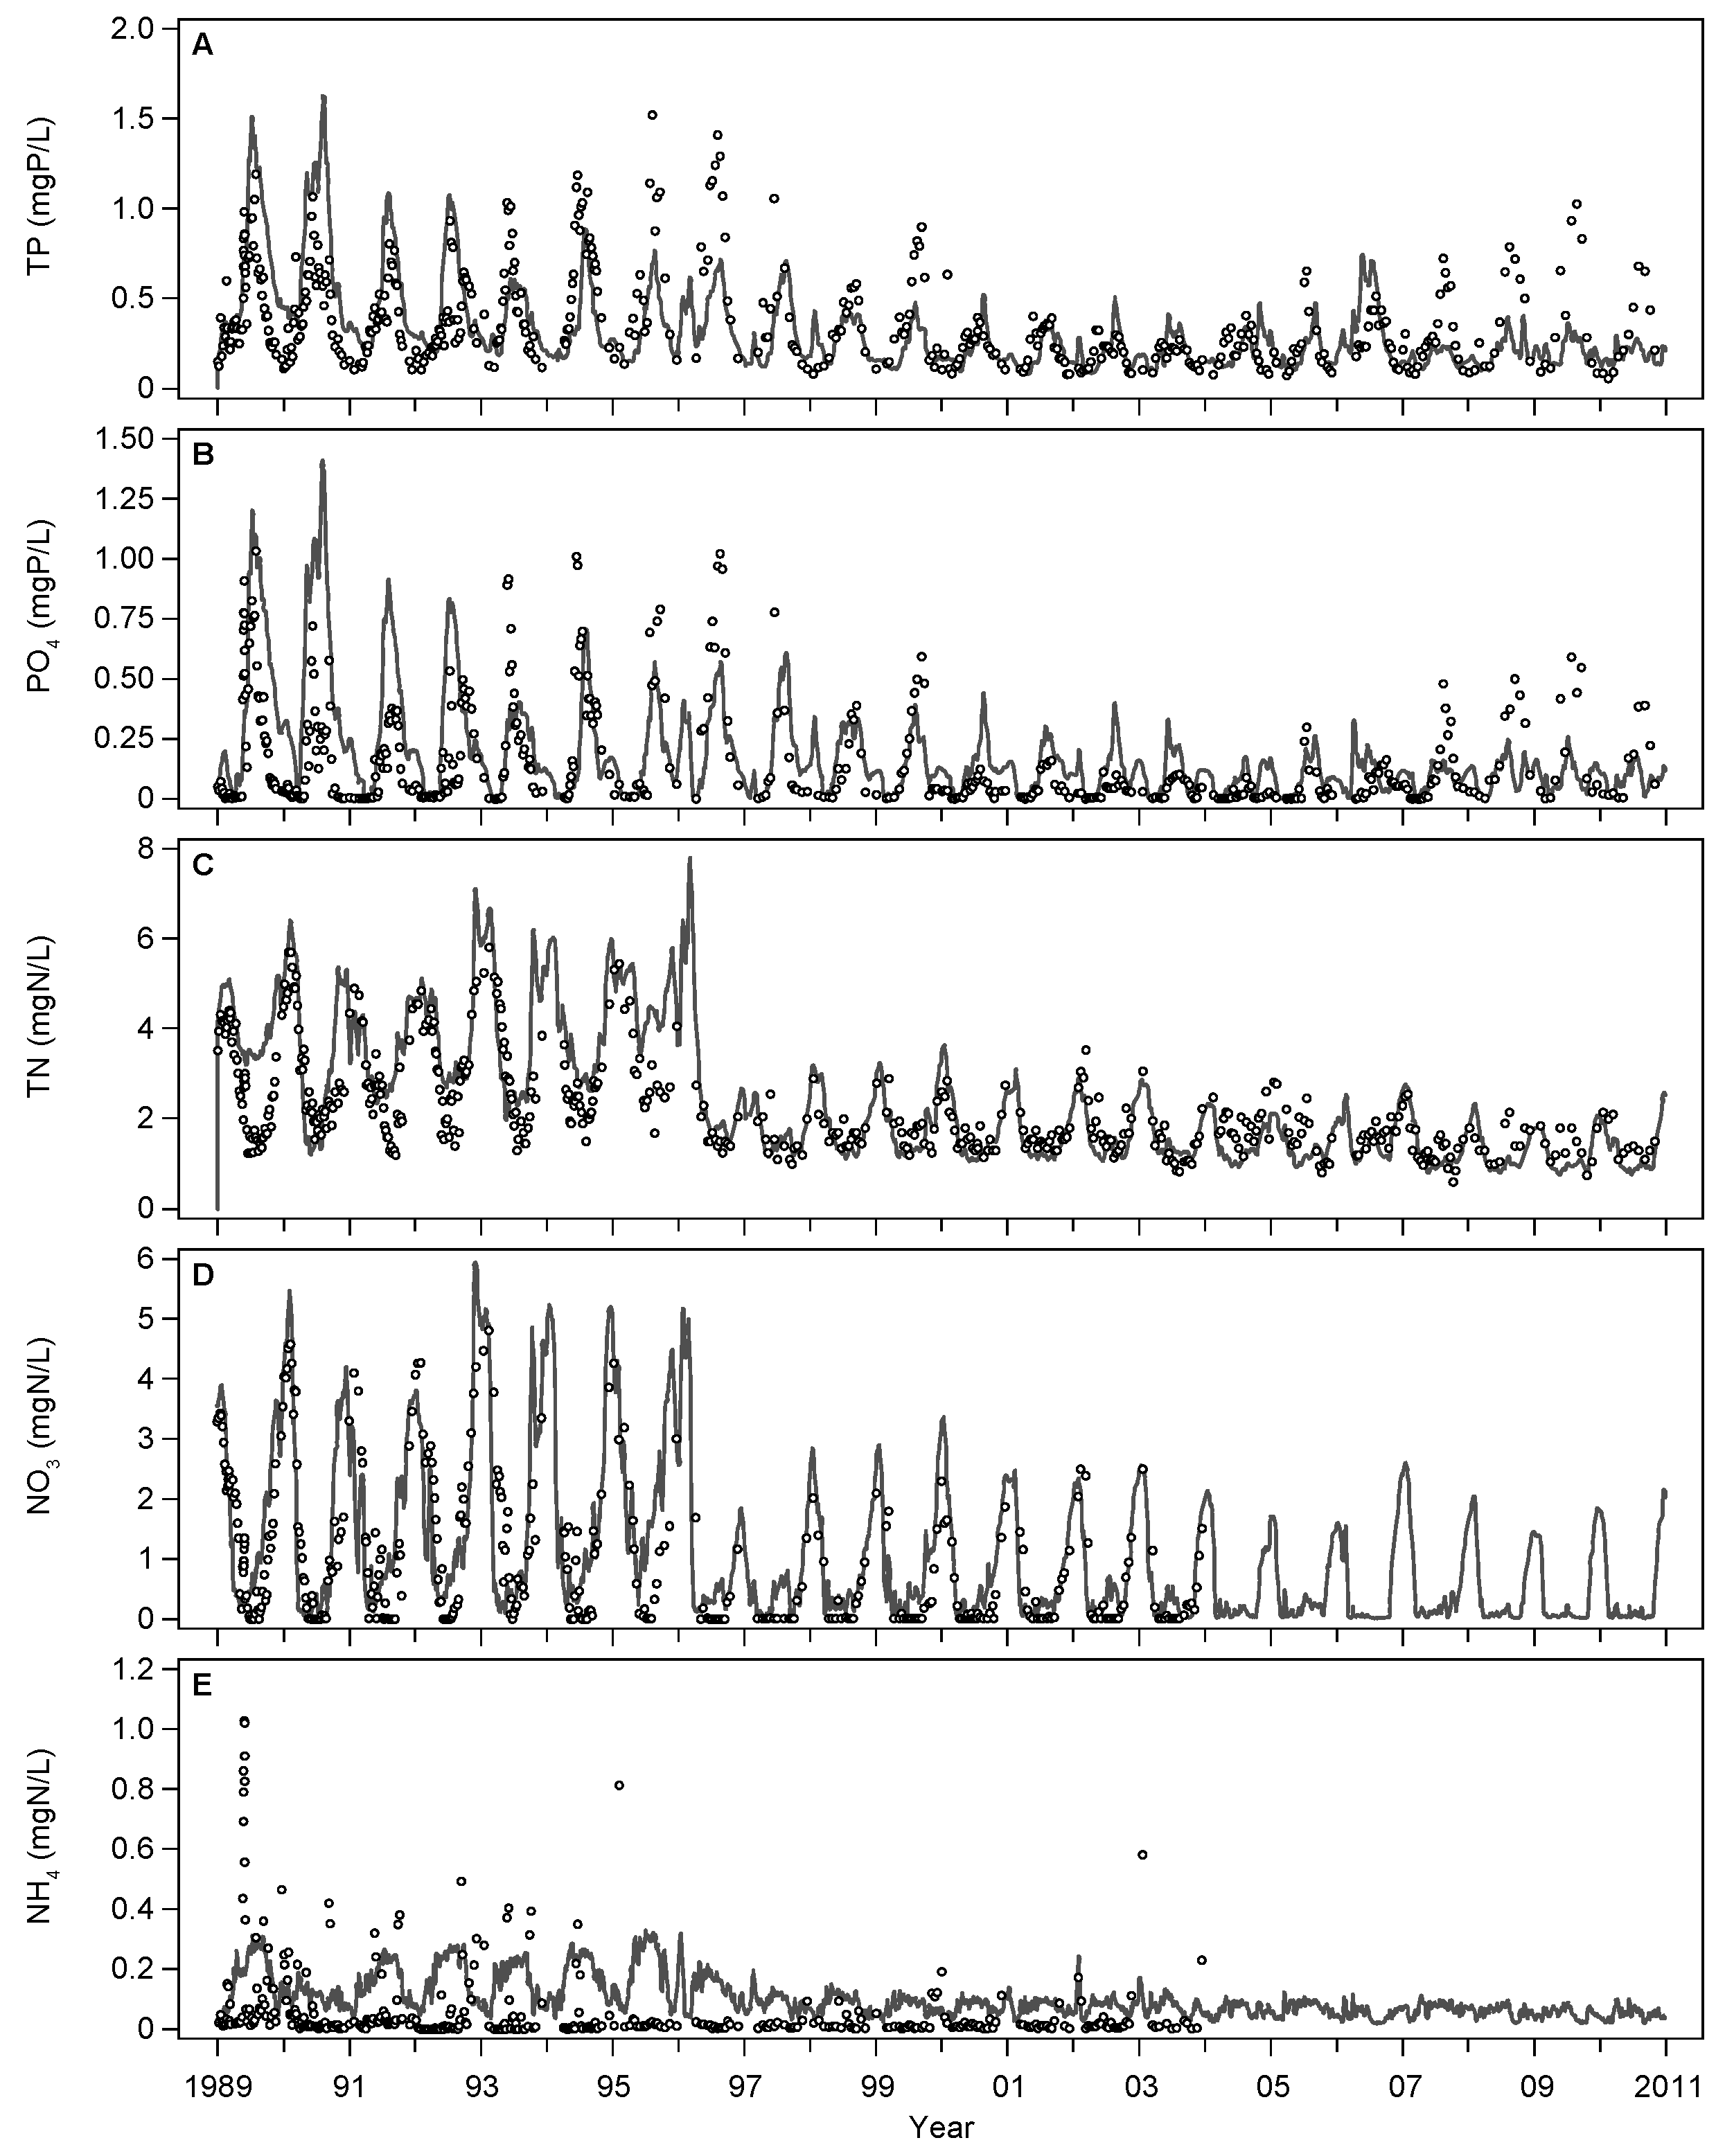
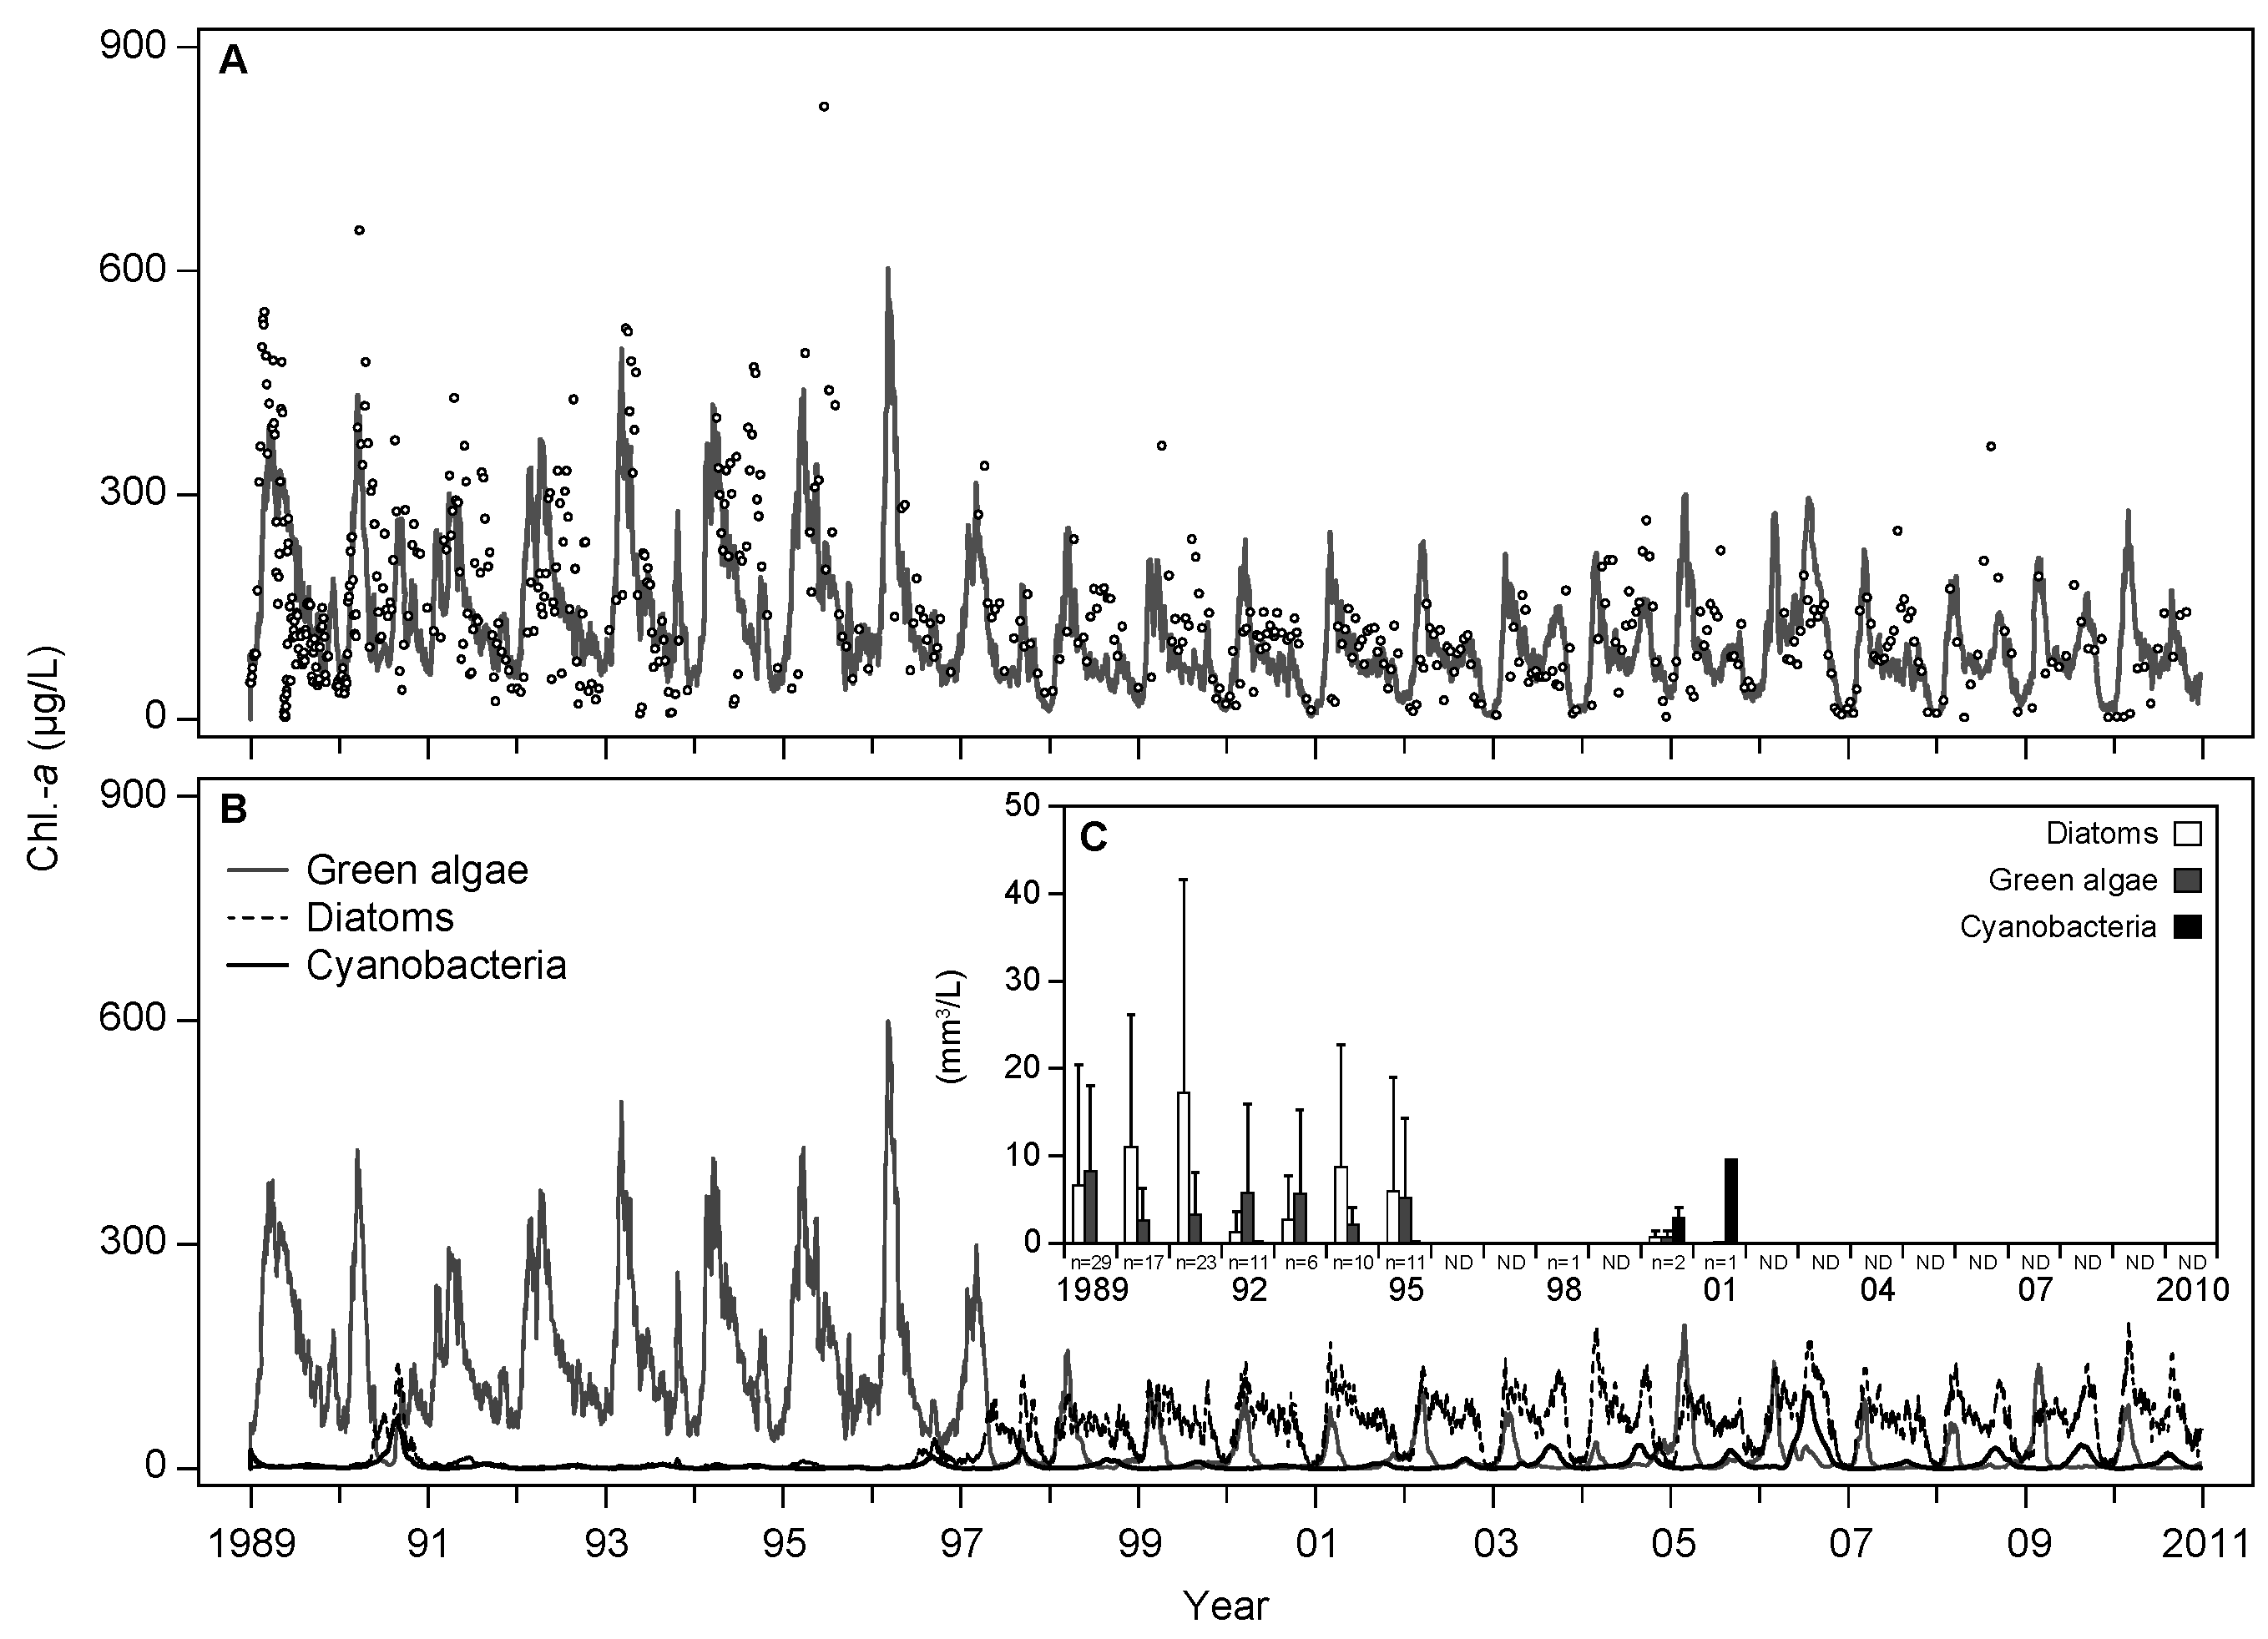
3.1. Base Scenario Calibration
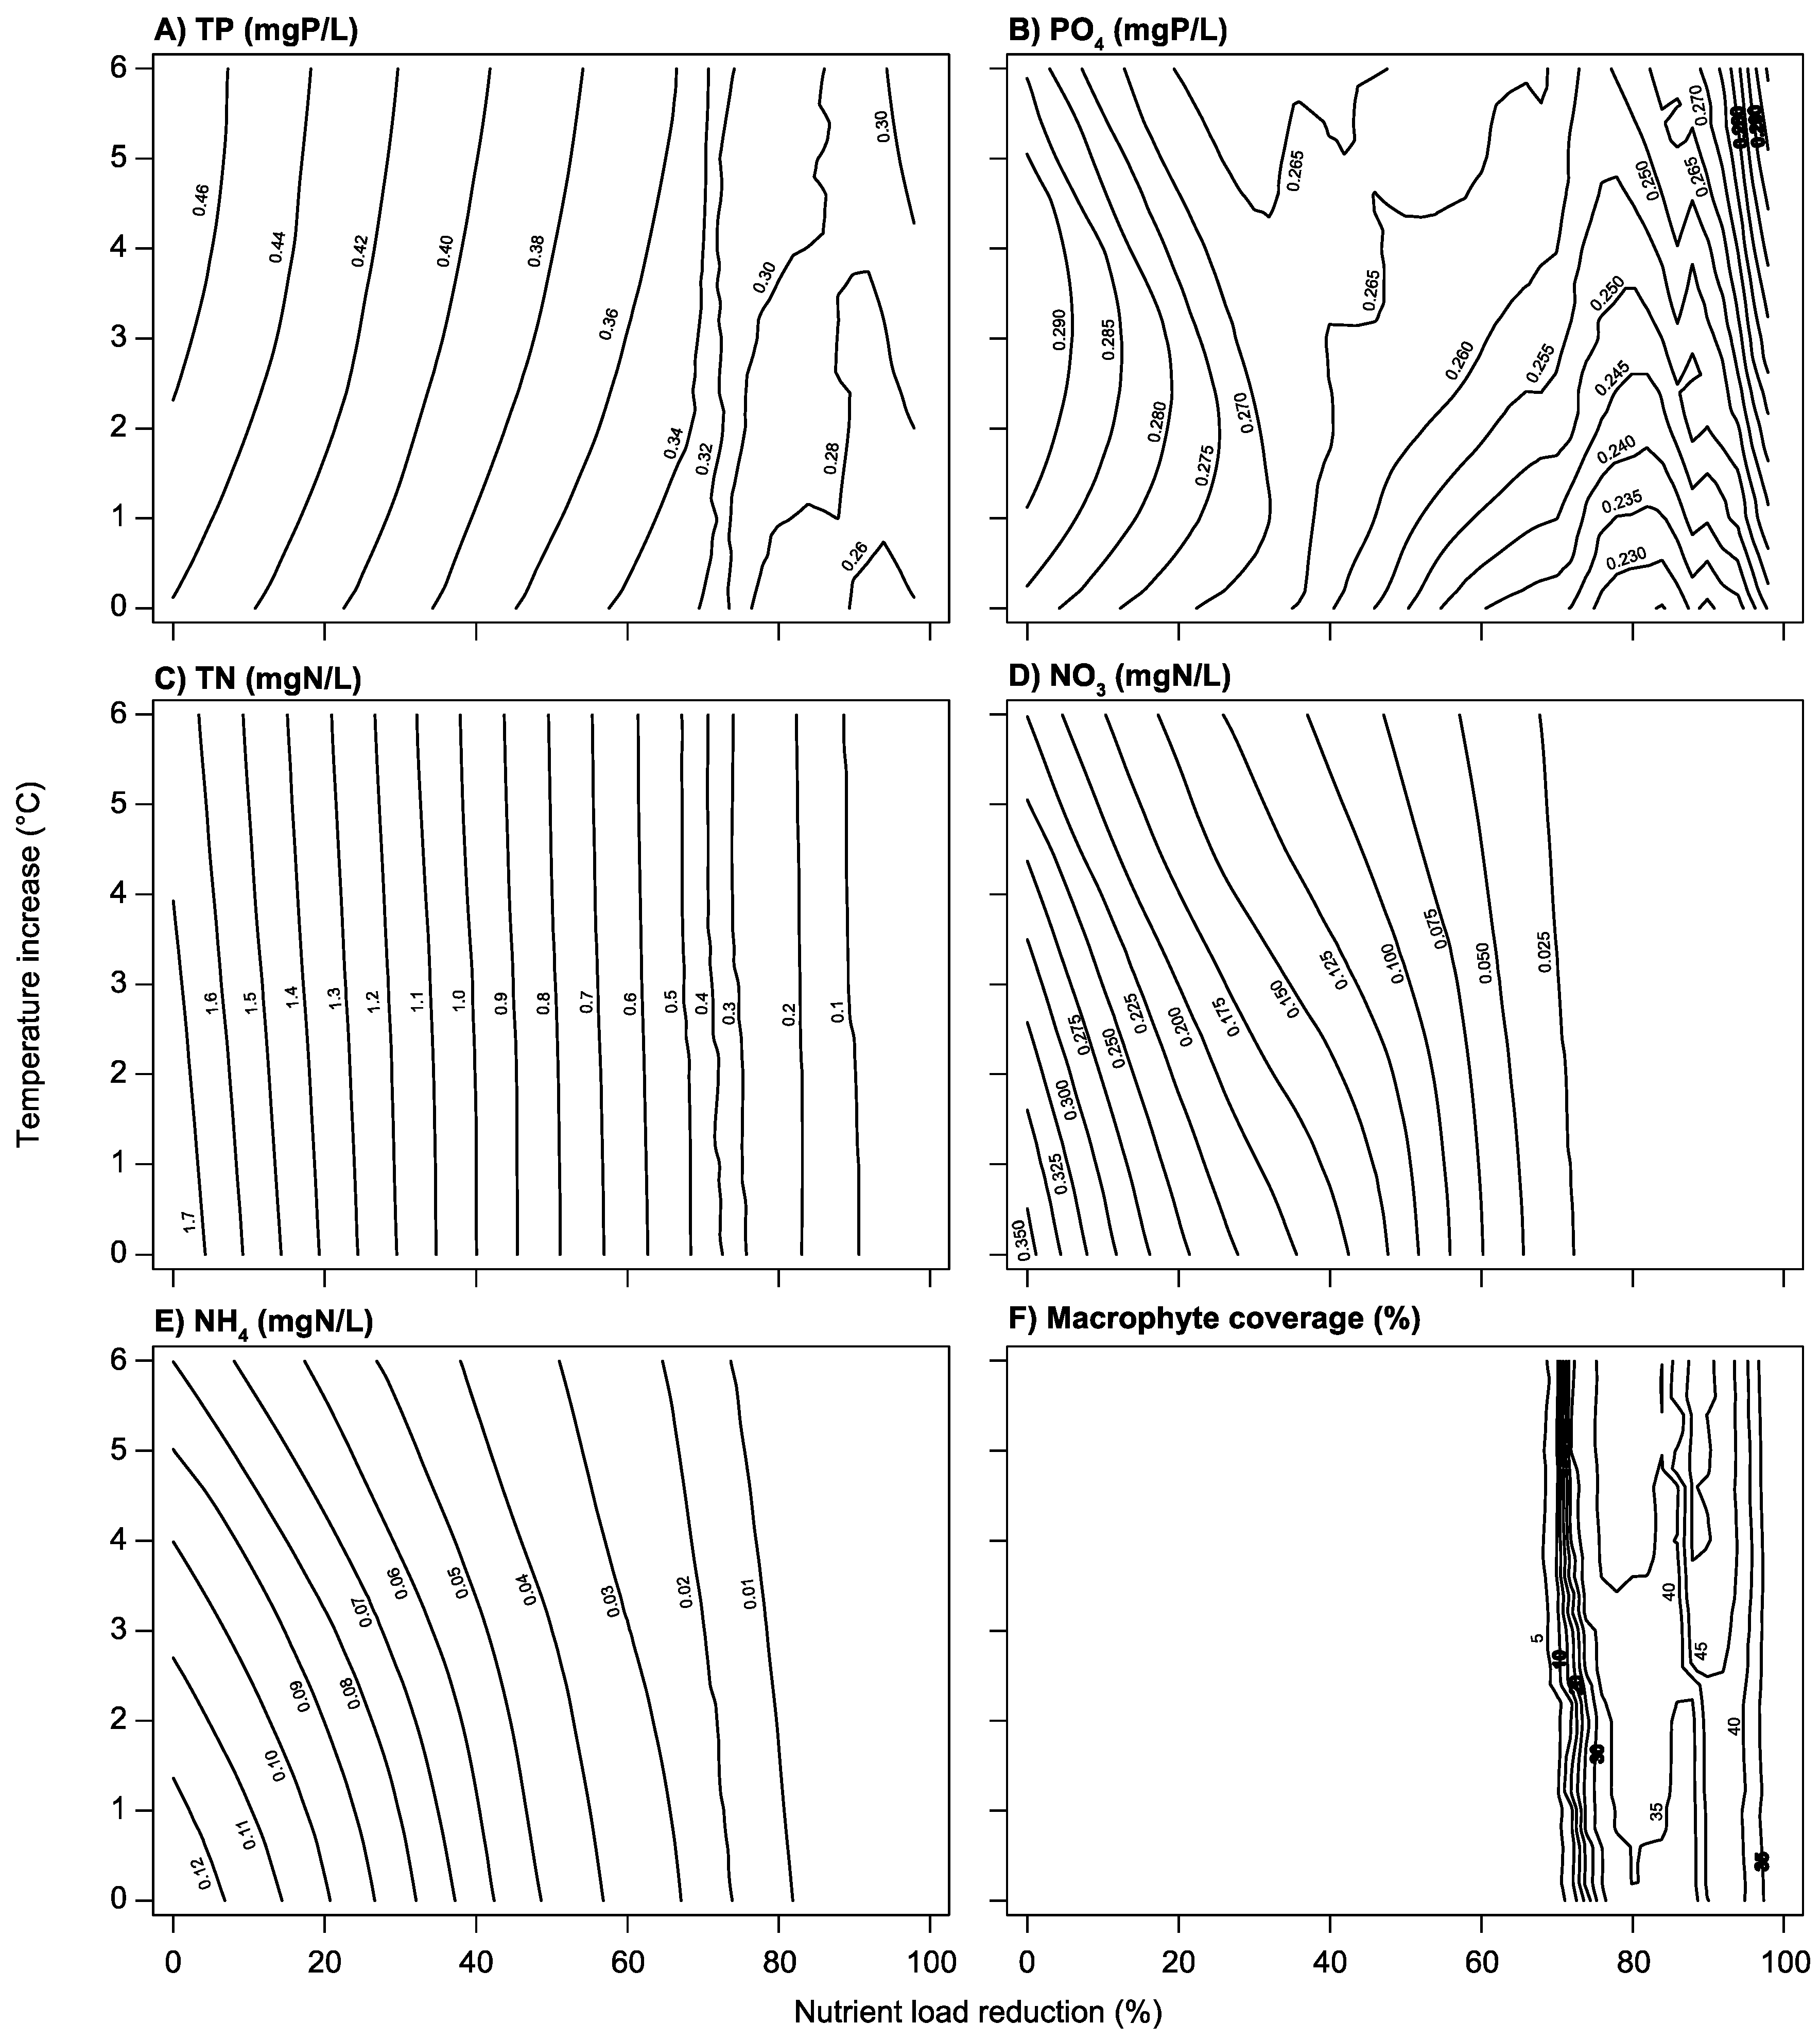
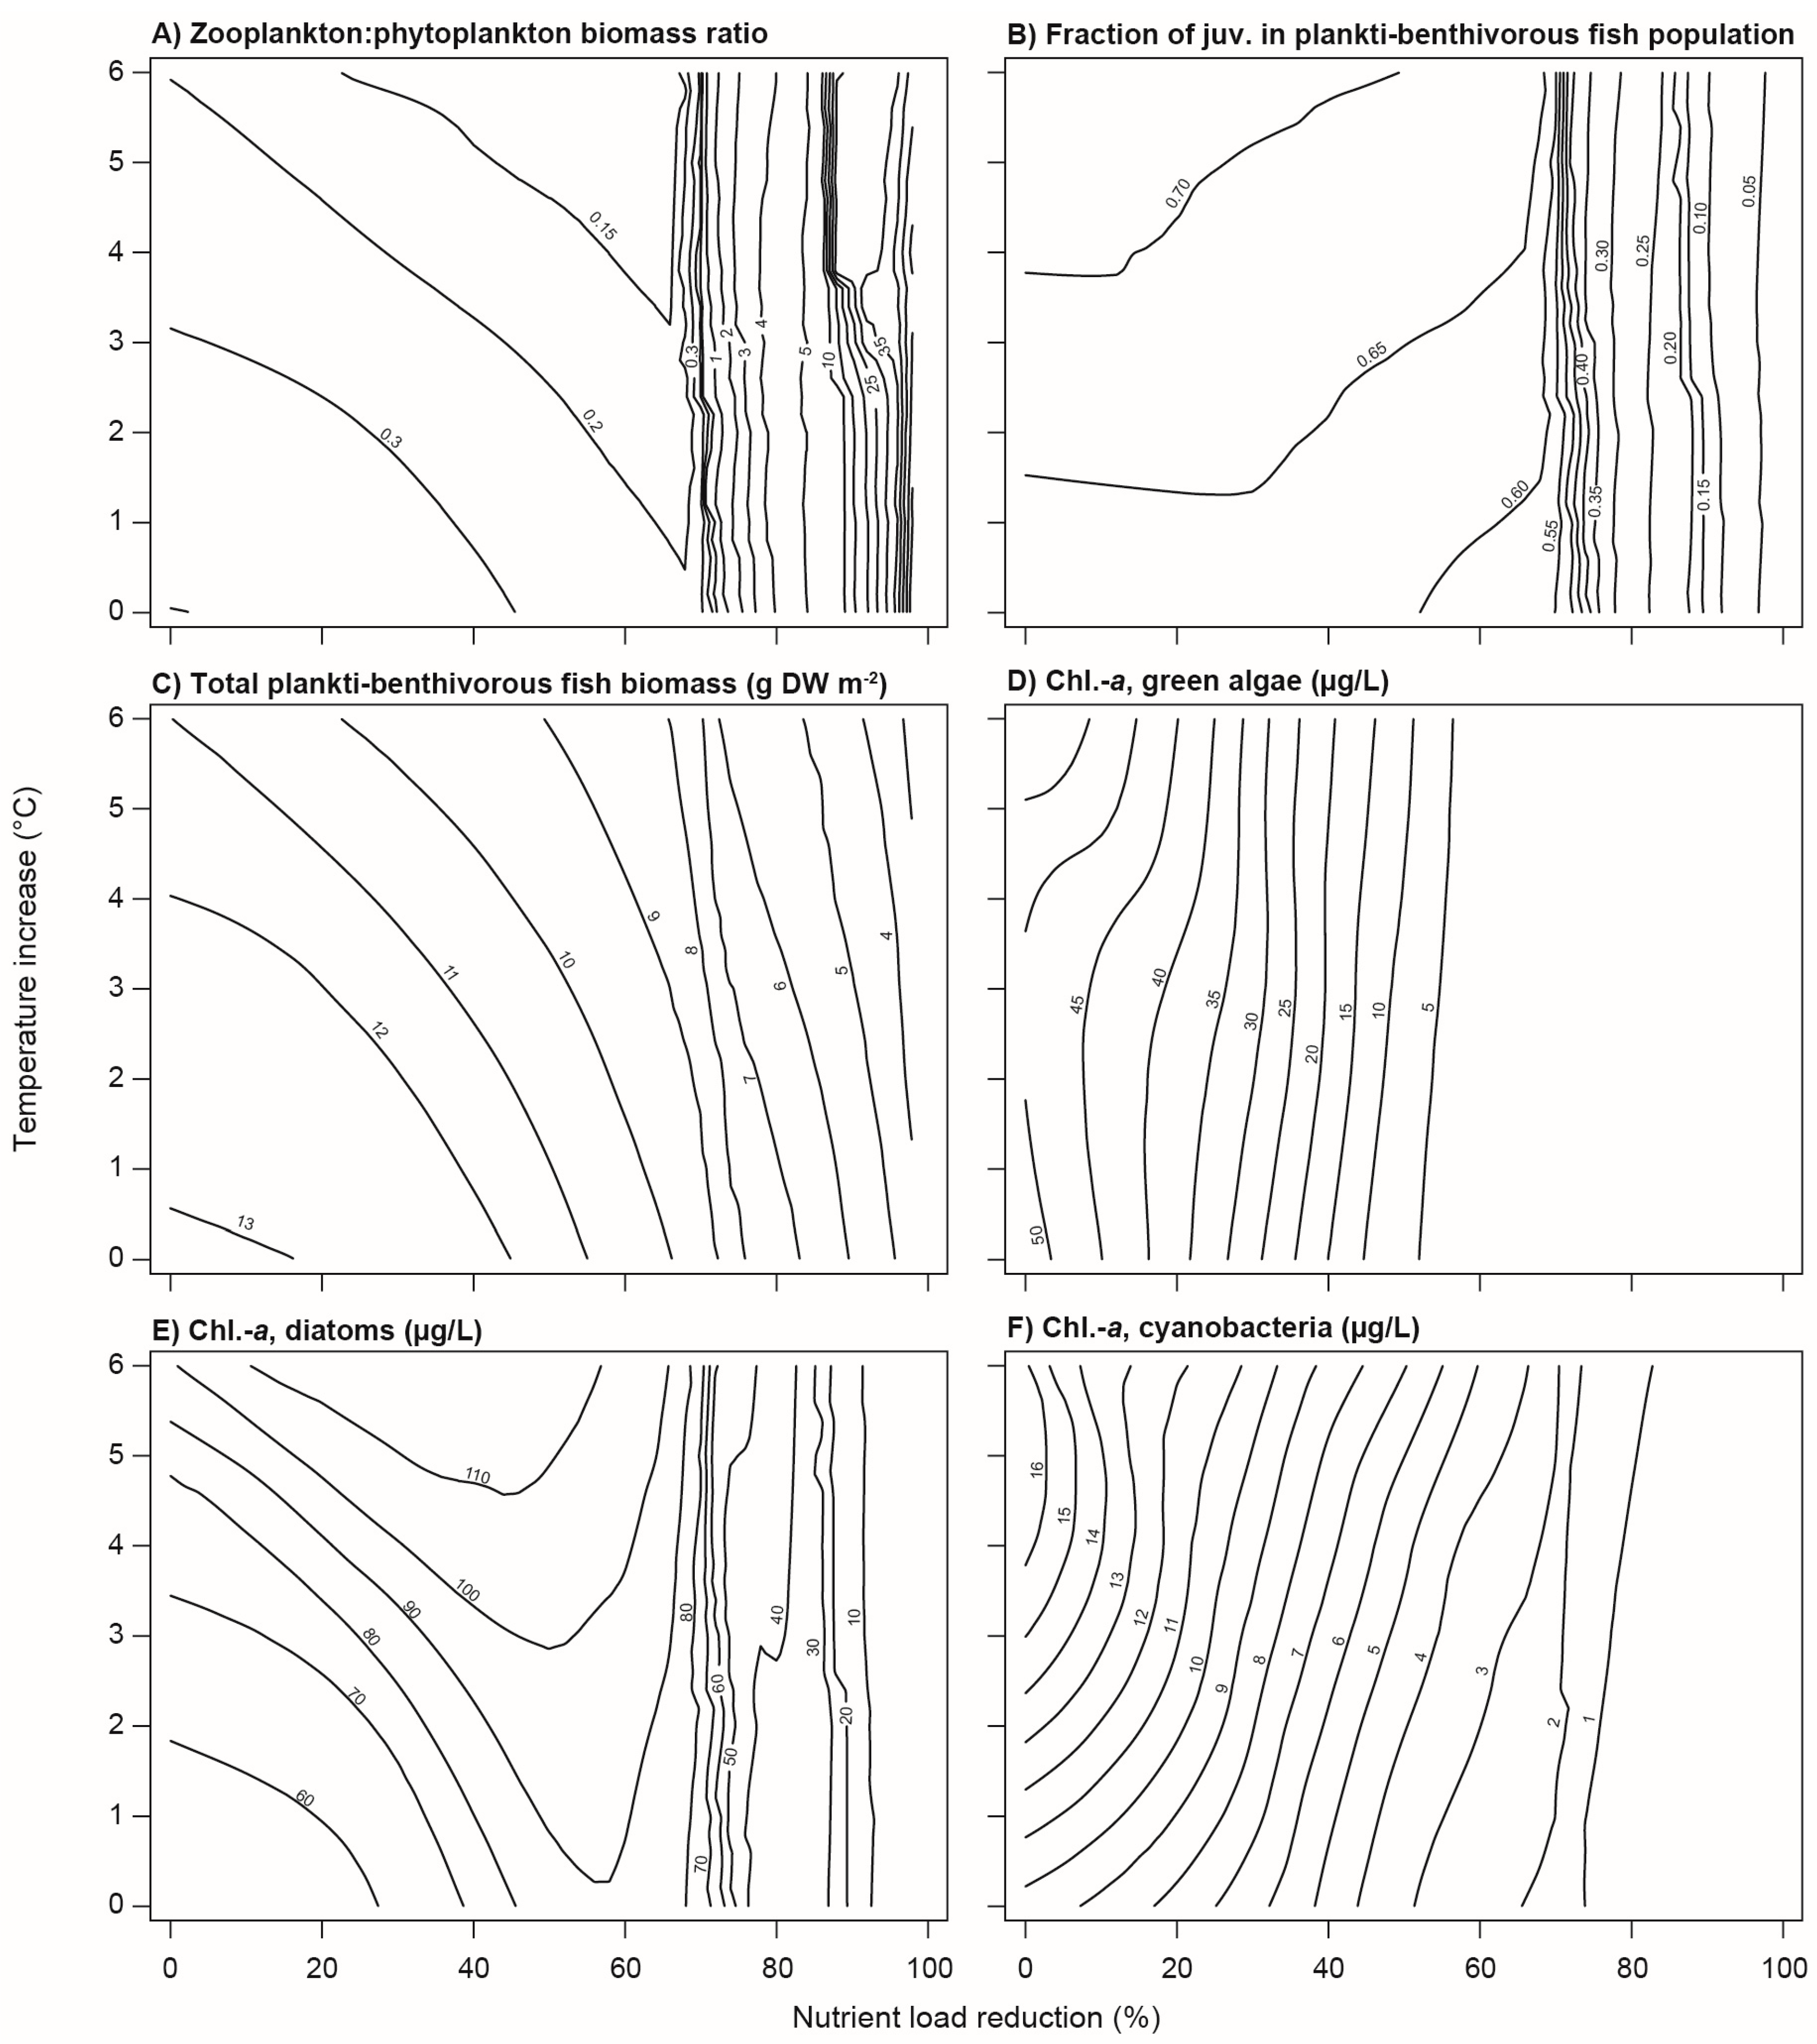
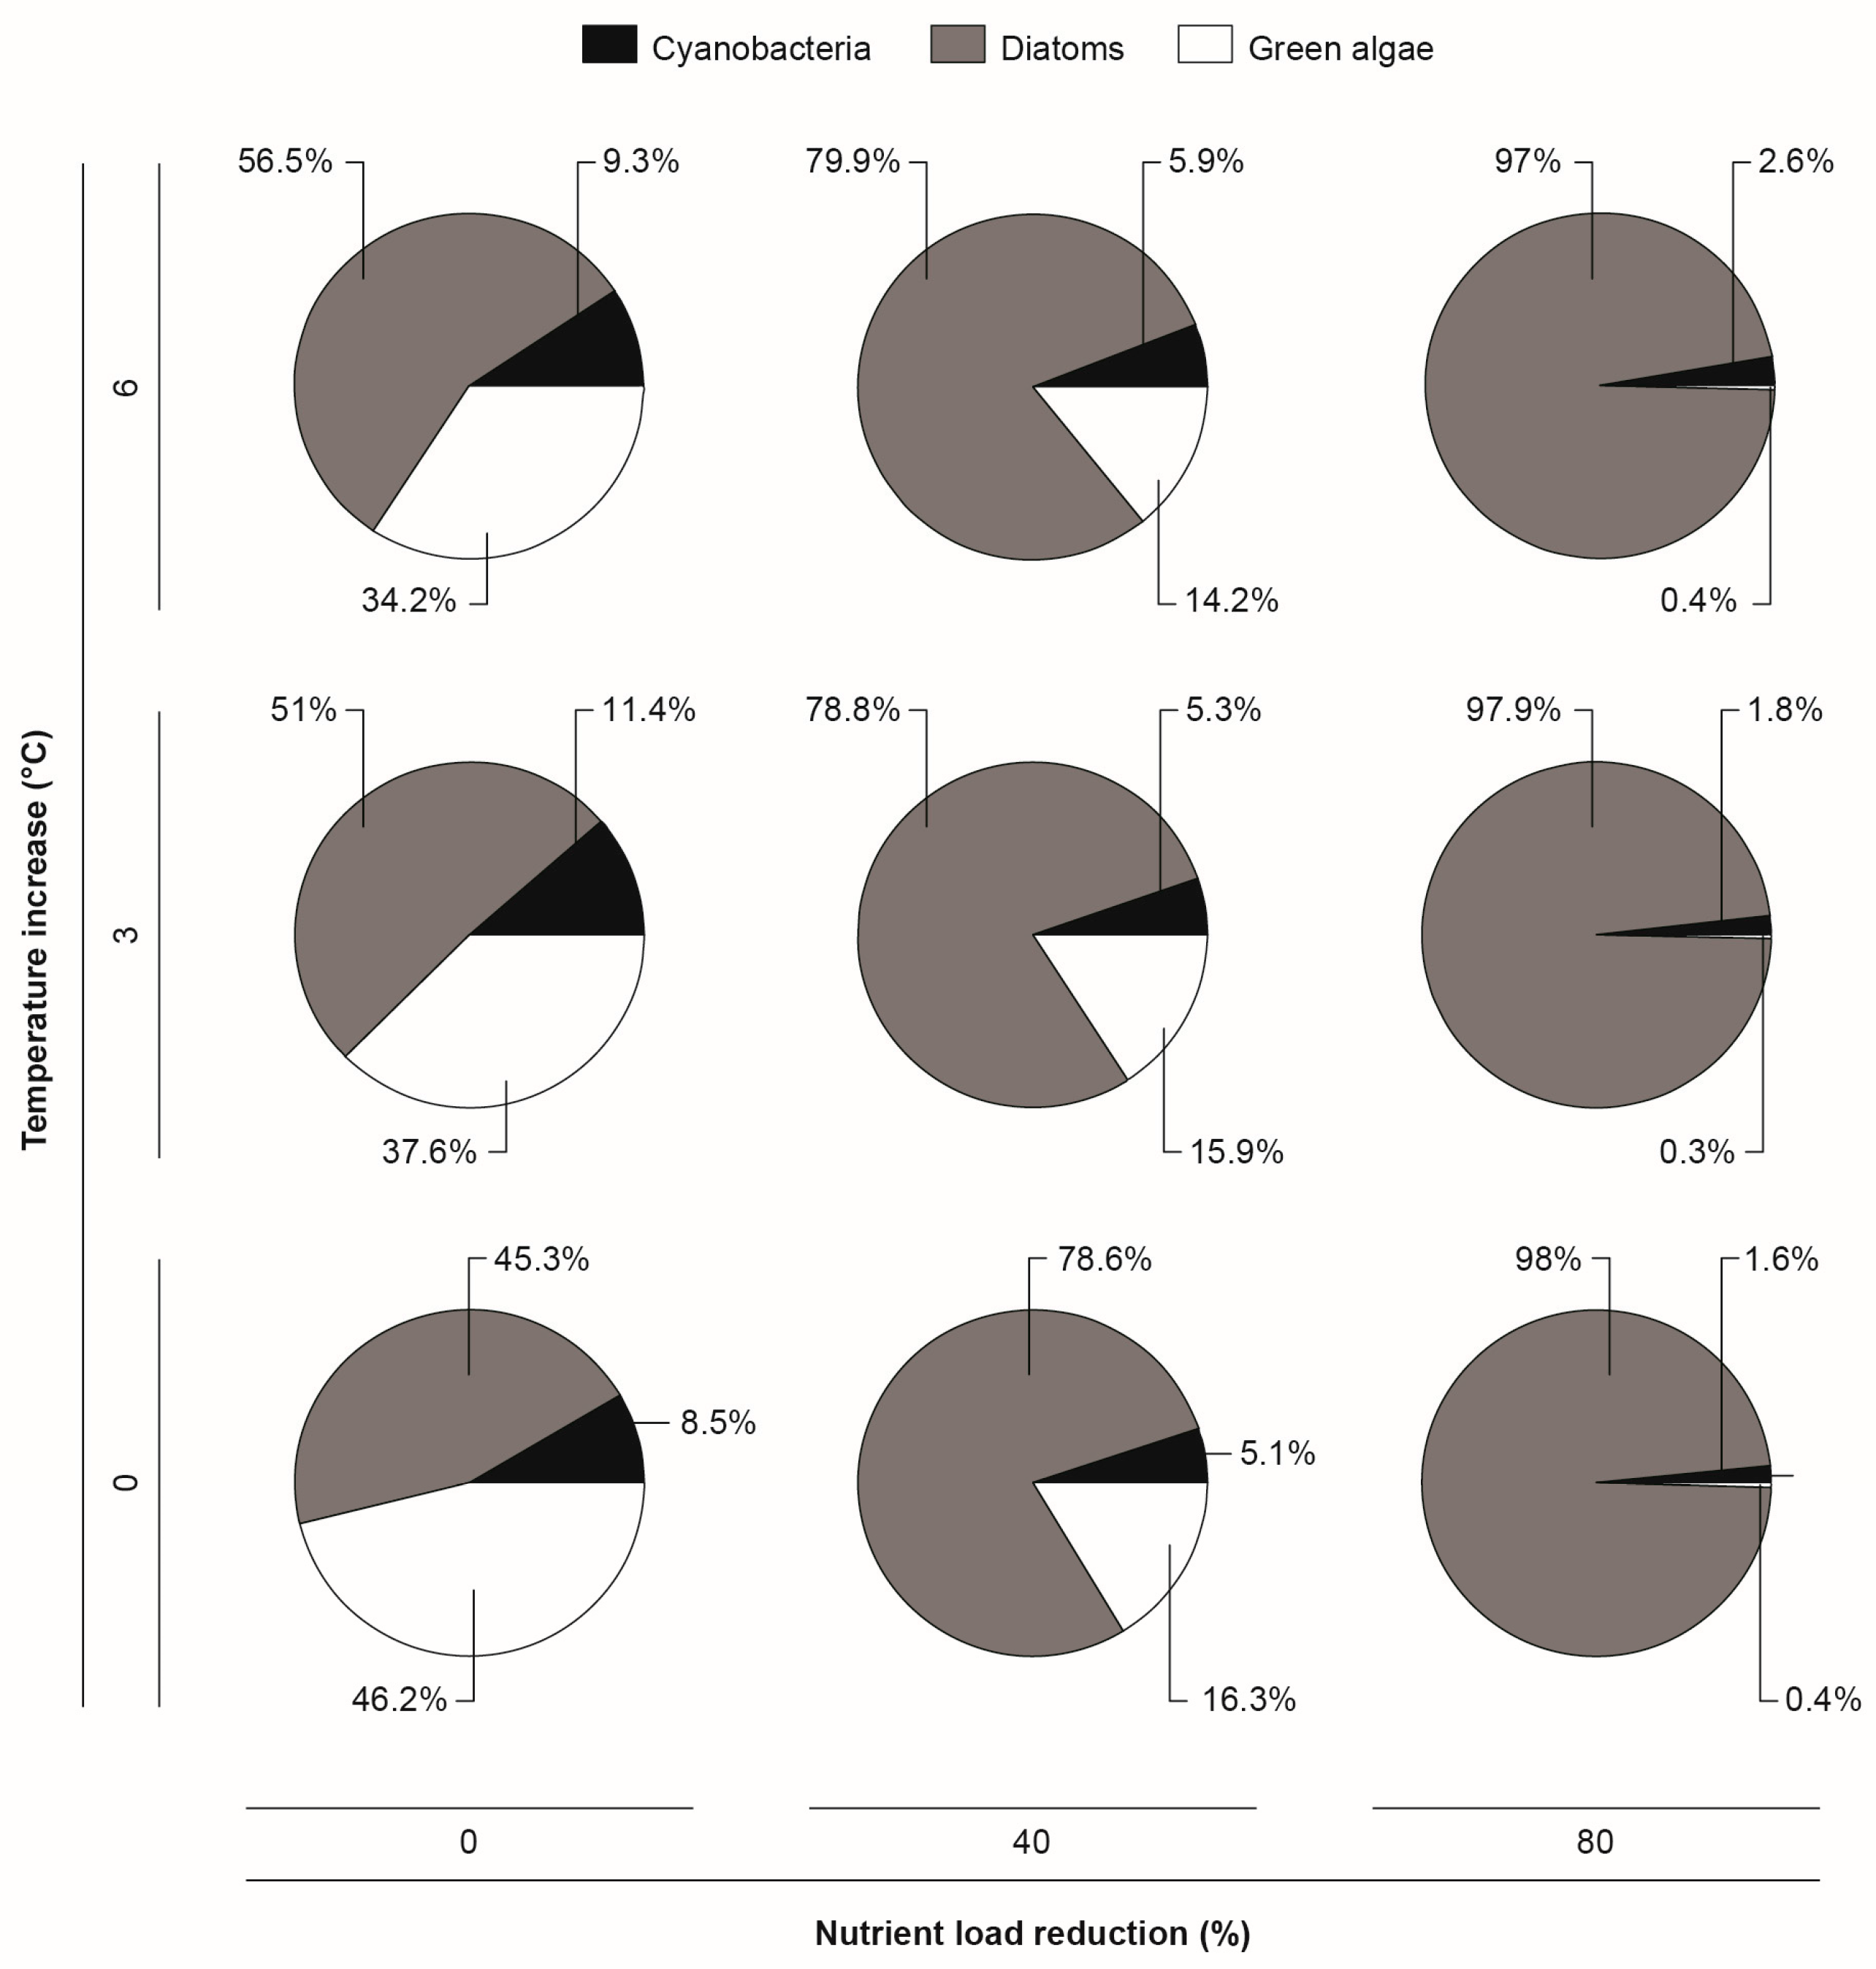
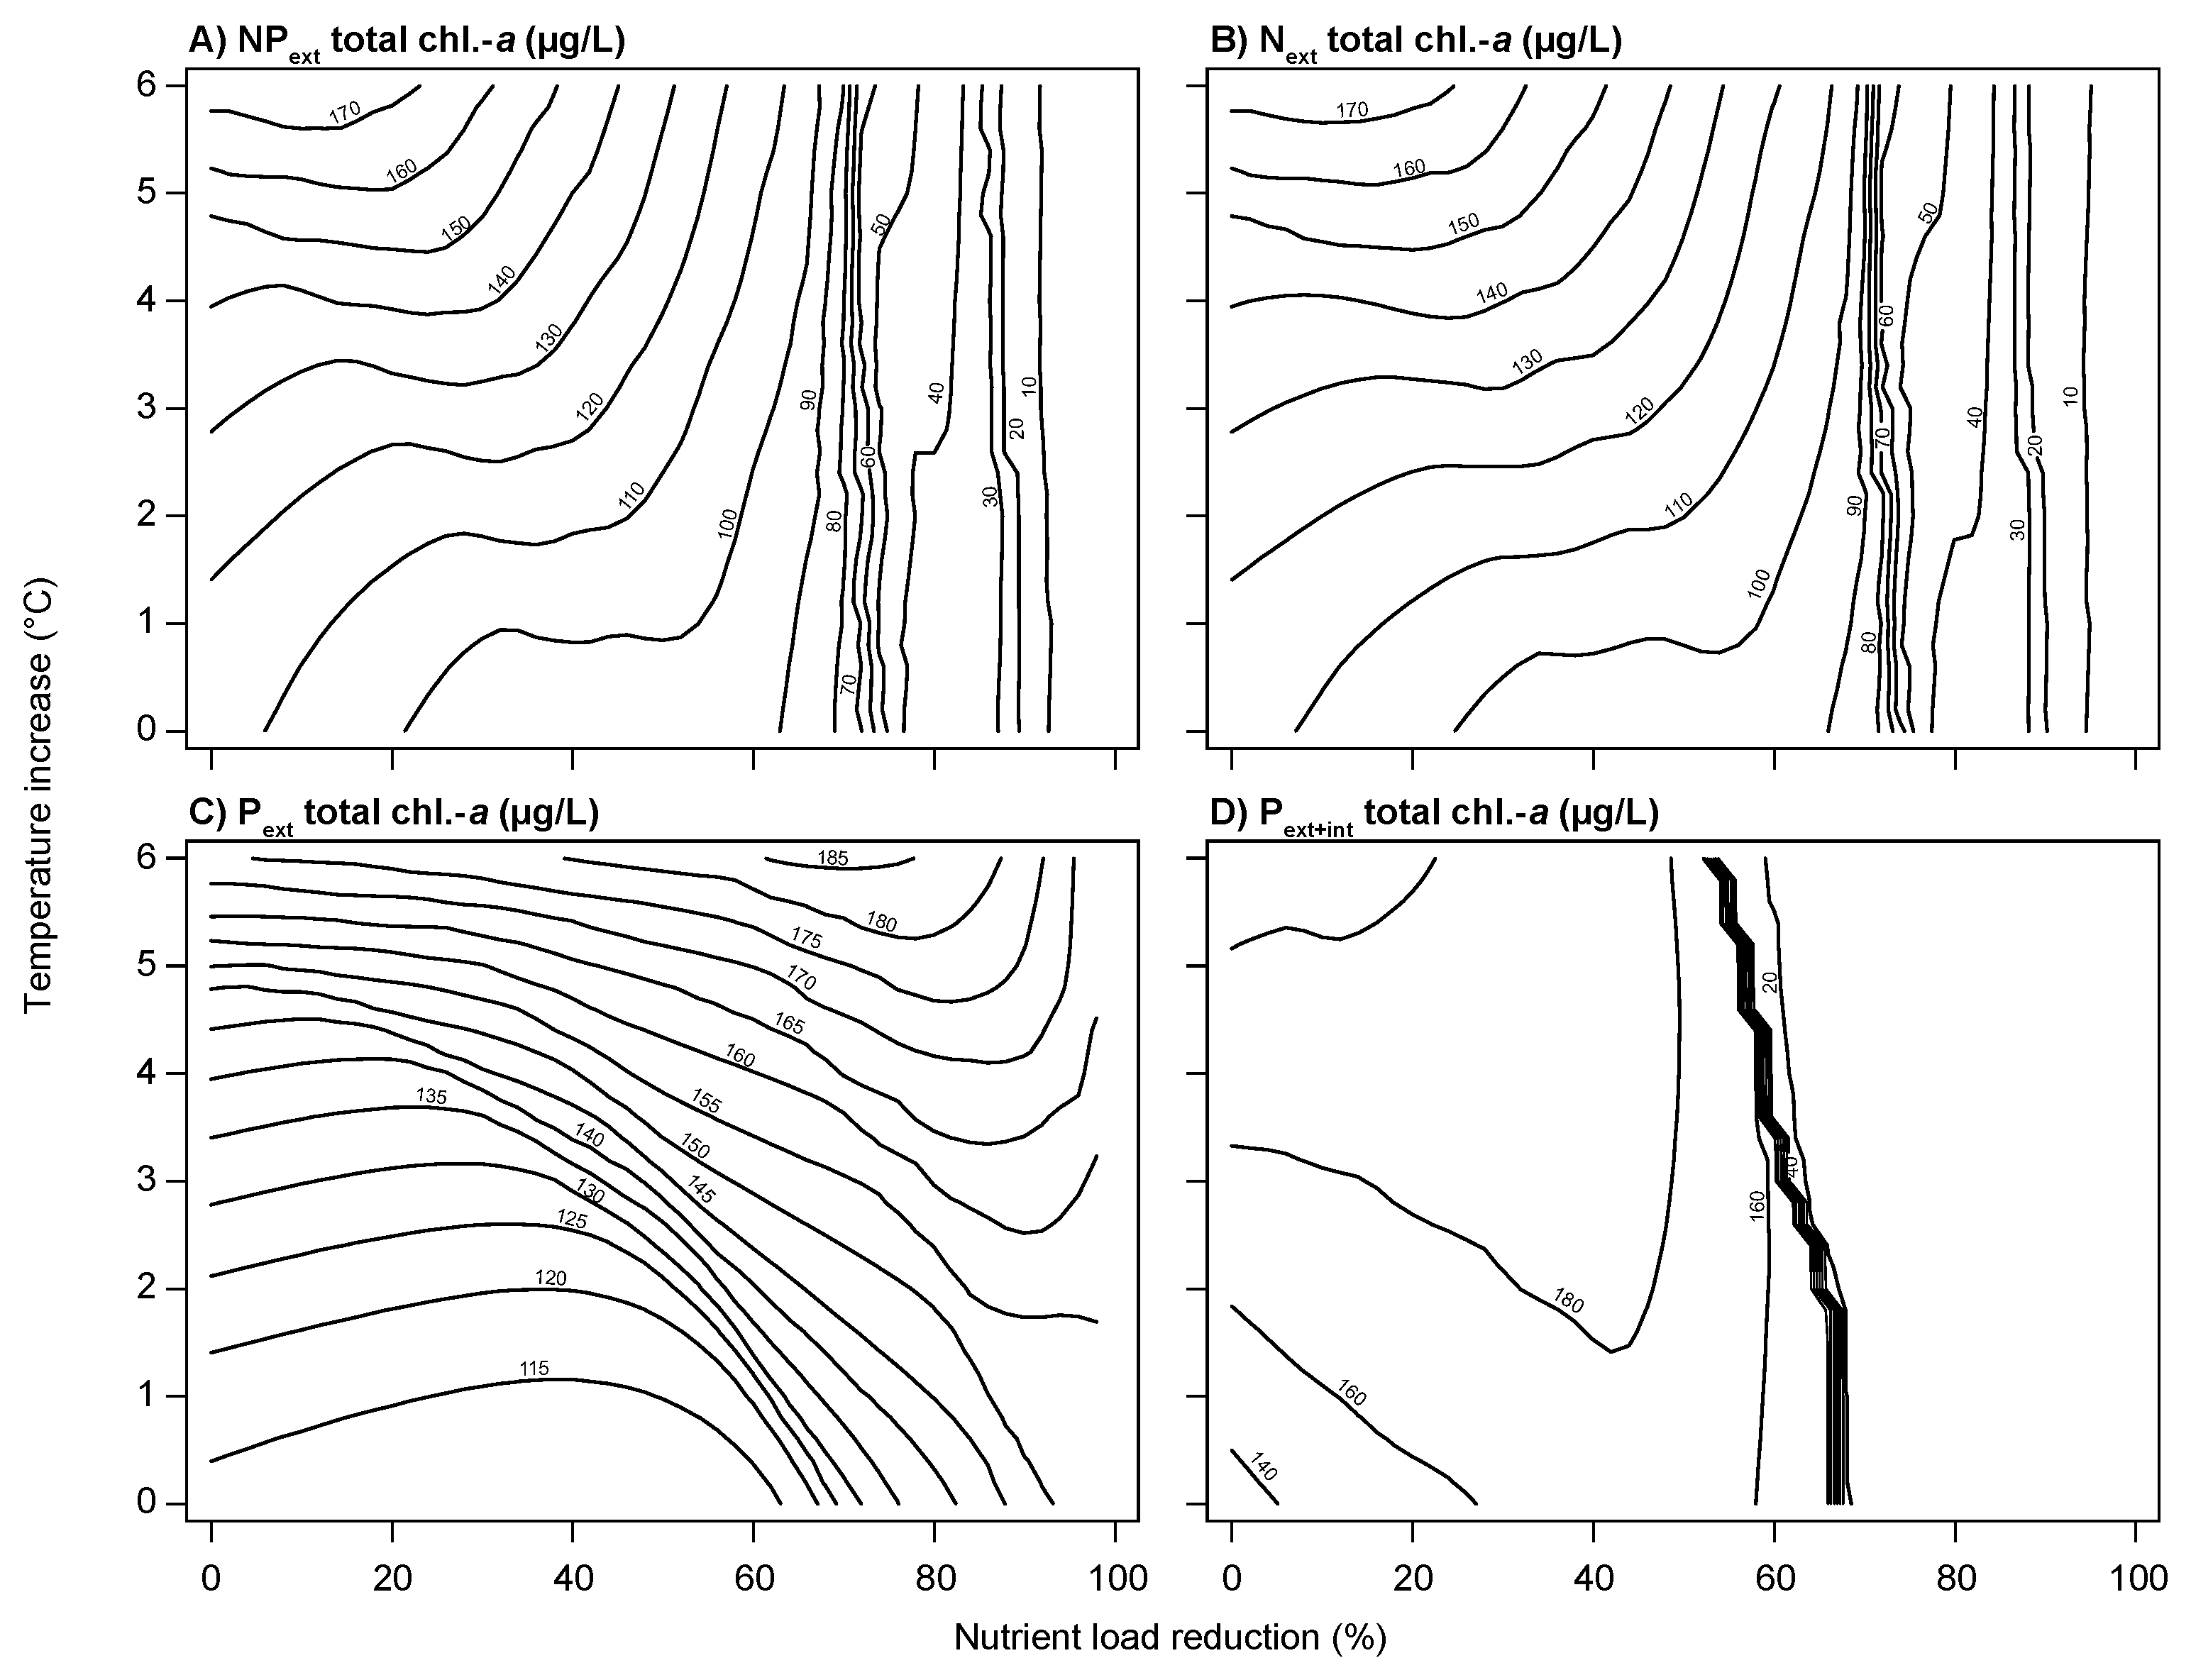
3.2. Climate Change and Nutrient Loading Scenarios
4. Discussion
4.1. Model Calibration and Performance
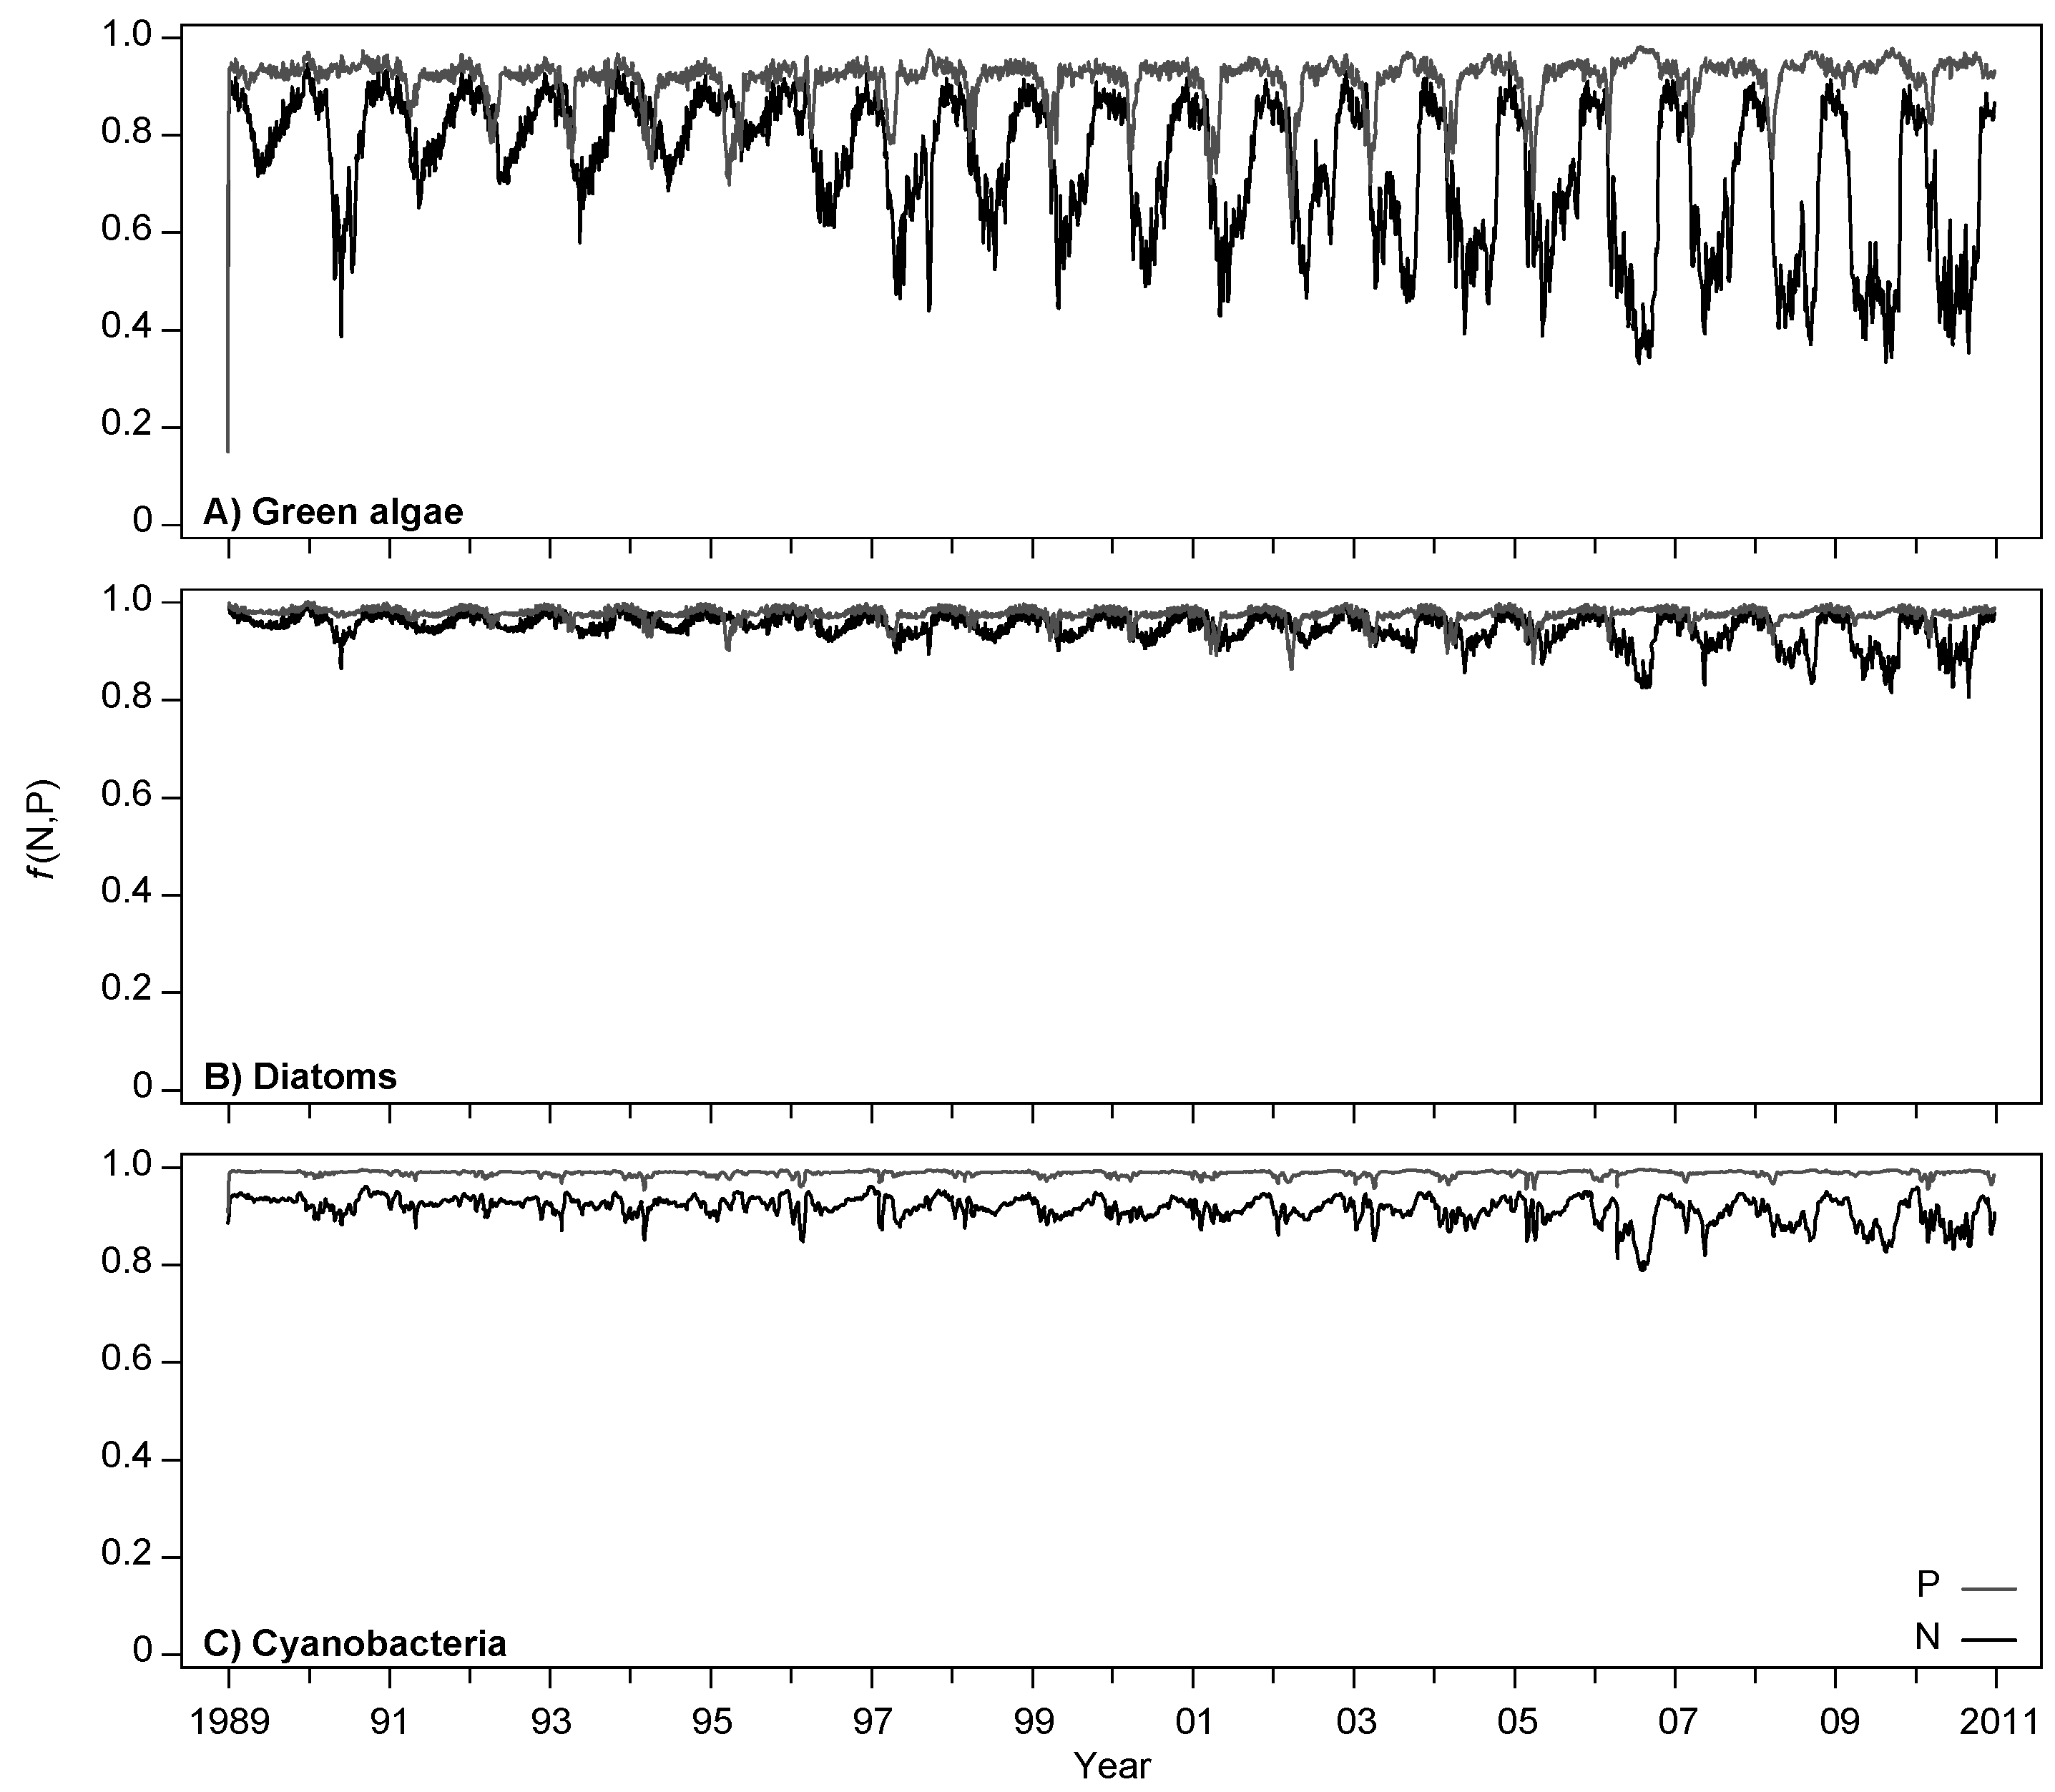
4.2. Effects of Increasing Temperatures and Reduced Nutrient Loading
4.3. Validity of Climate Scenarios
5. Conclusions
Acknowledgments
Author Contributions
Conflicts of Interest
References
- Intergovernmental Panel on Climate Change (IPCC). Climate Change 2014: Synthesis Report; Core Writing Team, Pachauri, R.K., Meyer, L.A., Eds.; Contribution of Working Groups I, II and III to the Fifth Assessment Report of the Intergovernmental Panel on Climate Change; IPCC: Geneva, Switzerland, 2014; p. 151. [Google Scholar]
- European Union. Directive 2000/60/EC of the European Parliament and of the Council Establishing a Framework for the Community Action in the Field of Water Policy. European Commission. Off. J. Eur. Commun. 2000, L327, 1. Available online: http://eur-lex.europa.eu/legal-content/EN/TXT/?uri=CELEX:32000L0060 (accessed on 12 October 2016). [Google Scholar]
- Adrian, R.; O’Reilly, C.M.; Zagarese, H.; Baines, S.B.; Hessen, D.O.; Keller, W.; Livingstone, D.M.; Sommaruga, R.; Straile, D.; Van Donk, E.; et al. Lakes as sentinels of climate change. Limnol. Oceanogr. 2009, 54, 2283–2297. [Google Scholar] [CrossRef] [PubMed] [Green Version]
- Jeppesen, E.; Moss, B.; Bennion, H.; Carvalho, L.; DeMeester, L.; Feuchtmayr, H.; Friberg, N.; Gessner, M.; Hefting, M.; Lauridsen, T.L.; et al. Interaction of Climate and Eutrophication. In Climate Change Impacts on Freshwater Ecosystems; Kernan, M., Battarbee, R., Moss, B., Eds.; Blackwell: Oxford, UK, 2010. [Google Scholar]
- Moss, B.; Kosten, S.; Meerhoff, M.; Battarbee, R.W.; Jeppesen, E.; Mazzeo, N.; Havens, K.; Lacerot, G.; Liu, Z.W.; De Meester, L.; et al. Allied attack: Climate change and eutrophication. Inland Waters 2011, 1, 101–105. [Google Scholar] [CrossRef]
- Jeppesen, E.; Kronvang, B.; Meerhoff, M.; Søndergaard, M.; Hansen, K.M.; Andersen, H.E.; Lauridsen, T.L.; Liboriussen, L.; Beklioglu, M.; Ozen, A.; et al. Climate Change Effects on Runoff, Catchment Phosphorus Loading and Lake Ecological State, and Potential Adaptations. J. Environ. Qual. 2009, 38, 1930–1941. [Google Scholar] [CrossRef] [PubMed]
- Gutierrez, M.F.; Devercelli, M.; Brucet, S.; Lauridsen, T.L.; Søndergaard, M.; Jeppesen, E. Is recovery of large-bodied zooplankton after nutrient loading reduction hampered by climate warming? A long-term study of shallow hypertrophic Lake Søbygaard, Denmark. Water 2016, 8. [Google Scholar] [CrossRef]
- Yu, J.; Liu, Z.; Li, K.; Chen, F.; Guan, B.; Hu, Y.; Zhong, P.; Tang, Y.; Zhao, X.; He, H.; et al. Restoration of shallow lakes in subtropical and tropical China: Response of nutrients to biomanipulation by fish removal and submerged plant transplantation. Water 2016, 8. [Google Scholar] [CrossRef]
- Jeppesen, E.; Kronvang, B.; Olesen, J.E.; Audet, J.; Søndergaard, M.; Hoffmann, C.C.; Andersen, H.E.; Lauridsen, T.L.; Liboriussen, L.; Larsen, S.E.; et al. Climate change effects on nitrogen loading from cultivated catchments in Europe: Implications for nitrogen retention, ecological state of lakes and adaptation. Hydrobiologia 2011, 663, 1–21. [Google Scholar] [CrossRef]
- Jeppesen, E.; Meerhoff, M.; Holmgren, K.; Gonzalez-Bergonzoni, I.; Teixeira-de Mello, F.; Declerck, S.A.J.; De Meester, L.; Søndergaard, M.; Lauridsen, T.L.; Bjerring, R.; et al. Impacts of climate warming on lake fish community structure and potential effects on ecosystem function. Hydrobiologia 2010, 646, 73–90. [Google Scholar] [CrossRef]
- McKee, D.; Atkinson, D.; Collings, S.E.; Eaton, J.W.; Gill, A.B.; Harvey, I.; Hatton, K.; Heyes, T.; Wilson, D.; Moss, B. Response of freshwater microcosm communities to nutrients, fish, and elevated temperature during winter and summer. Limnol. Oceanogr. 2003, 48, 707–722. [Google Scholar] [CrossRef]
- Christoffersen, K.; Andersen, N.; Søndergaard, M.; Liboriussen, L.; Jeppesen, E. Implications of climate-enforced temperature increases on freshwater pico- and nanoplankton populations studied in artificial ponds during 16 months. Hydrobiologia 2006, 560, 259–266. [Google Scholar] [CrossRef]
- Anneville, O.; Gammeter, S.; Straile, D. Phosphorus decrease and climate variability: Mediators of synchrony in phytoplankton changes among European peri-alpine lakes. Freshw. Biol. 2005, 50, 1731–1746. [Google Scholar] [CrossRef]
- Jeppesen, E.; Søndergaard, M.; Jensen, J.P.; Havens, K.E.; Anneville, O.; Carvalho, L.; Coveney, M.F.; Deneke, R.; Dokulil, M.T.; Foy, B.; et al. Lake responses to reduced nutrient loading—An analysis of contemporary long-term data from 35 case studies. Freshw. Biol. 2005, 50, 1747–1771. [Google Scholar] [CrossRef]
- Elliott, J.A.; Jones, I.D.; Thackeray, S.J. Testing the sensitivity of phytoplankton communities to changes in water temperature and nutrient load, in a temperate lake. Hydrobiologia 2006, 559, 401–411. [Google Scholar] [CrossRef]
- Mooij, W.M.; Janse, J.H.; De Senerpont Domis, L.N.; Hulsmann, S.; Ibelings, B.W. Predicting the effect of climate change on temperate shallow lakes with the ecosystem model PCLake. Hydrobiologia 2007, 584, 443–454. [Google Scholar] [CrossRef]
- Mooij, W.M.; Trolle, D.; Jeppesen, E.; Arhonditsis, G.; Belolipetsky, P.V.; Chitamwebwa, D.B.R.; Degermendzhy, A.G.; DeAngelis, D.L.; De Senerpont Domis, L.N.; Downing, A.S.; et al. Challenges and opportunities for integrating lake ecosystem modelling approaches. Aquat. Ecol. 2010, 44, 633–667. [Google Scholar] [CrossRef] [Green Version]
- Janse, J.H.; De Senerpont Domis, L.N.; Scheffer, M.; Lijklema, L.; Van Liere, L.; Klinge, M.; Mooij, W.M. Critical phosphorus loading of different types of shallow lakes and the consequences for management estimated with the ecosystem model PCLake. Limnologica 2008, 38, 203–219. [Google Scholar] [CrossRef]
- Trolle, D.; Hamilton, D.P.; Pilditch, C.A.; Duggan, I.C.; Jeppesen, E. Predicting the effects of climate change on trophic status of three morphologically varying lakes: Implications for lake restoration and management. Environ. Model. Softw. 2011, 26, 354–370. [Google Scholar] [CrossRef]
- Trolle, D.; Jørgensen, T.B.; Jeppesen, E. Predicting the effects of reduced external nitrogen loading on the nitrogen dynamics and ecological state of deep Lake Ravn, Denmark, using the DYRESM-CAEDYM model. Limnologica 2008, 38, 220–232. [Google Scholar] [CrossRef]
- Elliott, J.A. Is the future blue-green? A review of the current model predictions of how climate change could affect pelagic freshwater cyanobacteria. Water Res. 2012, 46, 1364–1371. [Google Scholar] [CrossRef] [PubMed] [Green Version]
- Rigosi, A.; Carey, C.C.; Ibelings, B.W.; Brookes, J.D. The interaction between climate warming and eutrophication to promote cyanobacteria is dependent on trophic state and varies among taxa. Limnol. Oceanogr. 2014, 59, 99–114. [Google Scholar] [CrossRef]
- Janse, J.H. Model Studies on the Eutrophication of Shallow Lakes and Ditches. Ph.D. Thesis, Wageningen University, Wageningen, The Netherlands, 2005. Available online: http://edepot.wur.nl/121663 (accessed on 12 October 2016). [Google Scholar]
- Søndergaard, M. Phosphorus release from a hypertrophic lake sediment—Experiments with intact sediment cores in a continuous-flow system. Arch. Hydrobiol. 1989, 116, 45–59. [Google Scholar]
- Søndergaard, M.; Jeppesen, E.; Kristensen, P.; Sortkjaer, O. Interactions between sediment and water in a shallow and hypertrophic lake—A study on phytoplankton collapses in Lake Søbygaard, Denmark. Hydrobiologia 1990, 191, 139–148. [Google Scholar] [CrossRef]
- Søndergaard, M.; Kristensen, P.; Jeppesen, E. 8 years of internal phosphorus loading and changes in the sediment phosphorus profile of Lake Søbygaard, Denmark. Hydrobiologia 1993, 253, 345–356. [Google Scholar] [CrossRef]
- Jensen, J.P.; Jeppesen, E.; Kristensen, P.; Bondo, P.; Søndergaard, C.; Søndergaard, M. Nitrogen loss and denitrification as studied in relation to reductions in nitrogen loading in a shallow, hypertrophic lake (Lake Søbygaard, Denmark). Int. Rev. Gesamten Hydrobiol. 1992, 77, 29–42. [Google Scholar] [CrossRef]
- Janse, J.H.; Aldenberg, T. Modelling the Eutrophication of the Shallow Loosdrecht Lakes. Verh. Int. Ver. Limnol. 1991, 24, 751–757. [Google Scholar]
- Janse, J.H. A model of nutrient dynamics in shallow lakes in relation to multiple stable states. Hydrobiologia 1997, 342, 1–8. [Google Scholar]
- Nielsen, A.; Trolle, D.; Bjerring, R.; Søndergaard, M.; Olesen, J.E.; Janse, J.H.; Mooij, W.M.; Jeppesen, E. Effects of climate and nutrient load on the water quality of shallow lakes assessed through ensemble runs by PCLake. Ecol. Appl. 2014, 24, 1926–1944. [Google Scholar] [CrossRef]
- Aldenberg, T.; Janse, J.H.; Kramer, P.R.G. Fitting the dynamic model PCLake to a multi-lake survey through Bayesian statistics. Ecol. Model. 1995, 78, 83–99. [Google Scholar] [CrossRef]
- Janse, J.H.; Scheffer, M.; Lijklema, L.; Van Liere, L.; Sloot, J.S.; Mooij, W.M. Estimating the critical phosphorus loading of shallow lakes with the ecosystem model PCLake: Sensitivity, calibration and uncertainty. Ecol. Model. 2010, 221, 654–665. [Google Scholar] [CrossRef]
- Hipsey, M.R.; Bruce, L.C.; Boon, C.; Bruggeman, J.; Bolding, K.; Hamilton, D.P. GLM-FABM v0.9a Model Overview and User Documentation; Technical Manual; The University of Western Australia: Perth, Australia, 2012. [Google Scholar]
- Hamilton, D.P.; Schladow, G.; Fisher, I.H. Controlling the indirect effects of flow diversion on water-quality in an Australian reservoir. Environ. Int. 1995, 21, 583–590. [Google Scholar] [CrossRef]
- Bennett, N.D.; Croke, B.F.W.; Guariso, G.; Guillaume, J.H.A.; Hamilton, S.H.; Jakeman, A.J.; Marsili-Libelli, S.; Newham, L.T.H.; Norton, J.P.; Perrin, C.; et al. Characterising performance of environmental models. Environ. Model. Softw. 2013, 40, 1–20. [Google Scholar] [CrossRef]
- Arhonditsis, G.B.; Brett, M.T. Evaluation of the current state of mechanistic aquatic biogeochemical modeling. Mar. Ecol. Prog. Ser. 2004, 271, 13–26. [Google Scholar] [CrossRef]
- Bowie, G.; Mills, W.; Porcella, D.; Campbell, C.; Pagenkopf, J.; Rupp, G.; Johnson, K.; Chan, P.; Gherini, S.; Chamberlin, C. Rates, Constants, and Kinetics Formulations in Surface Water Quality Modelling, 2nd ed.Enviromental Research Laboratory Office of Research and Development U.S. Enviromental Protection Agency: Athens, GA, USA, 1985.
- Jørgensen, S.; Nielsen, S.; Jørgensen, L. Handbook of Ecological Parameters and Ecotoxicology; Elsevier: Amsterdam, The Netherlands, 1991. [Google Scholar]
- Ramm, K.; Scheps, V. Phosphorus balance of a polytrophic shallow lake with the consideration of phosphorus release. Hydrobiologia 1997, 342, 43–53. [Google Scholar] [CrossRef]
- Kunikane, S.; Kaneko, M.; Maehara, R. Growth and nutrient-uptake of green algae, Scenedesmus dimorphus, under a wide range of nitrogen/phosporus ratio—1. Water Res. 1984, 18, 1299–1311. [Google Scholar] [CrossRef]
- Jensen, H.S.; Andersen, F.Ø. Importance of temperature, nitrate, and pH for phosphate release from aerobic sediments of 4 shallow, eutrophic lakes. Limnol. Oceanogr. 1992, 37, 577–589. [Google Scholar] [CrossRef]
- Boström, B.; Jansson, M.; Forsberg, C. Phosphorus release from lake sediments. Arch. Hydrobiol. Beih. Ergebn. Limnol. 1982, 18, 5–59. [Google Scholar]
- Lijklema, L. Considerations in modeling the sediment water exchange of phosphorus. Hydrobiologia 1993, 253, 219–231. [Google Scholar] [CrossRef]
- Søndergaard, M. Seasonal variations in the loosely sorbed phosphorus fraction of the sediment of a shallow and hypertrophic lake. Environ. Geol. Water Sci. 1988, 11, 115–121. [Google Scholar] [CrossRef]
- Søndergaard, M.; Bjerring, R.; Jeppesen, E. Persistent internal phosphorus loading during summer in shallow eutrophic lakes. Hydrobiologia 2013, 710, 95–107. [Google Scholar] [CrossRef]
- Jensen, J.P.; Kristensen, P.; Jeppesen, E. Relationships between Nitrogen Loading and in-Lake Nitrogen Concentrations in Shallow Danish Lakes; E Schweizerbart’sche Verlagsbuchhandlung: Stuttgart, Germany, 1990. [Google Scholar]
- Saunders, D.L.; Kalff, J. Nitrogen retention in wetlands, lakes and rivers. Hydrobiologia 2001, 443, 205–212. [Google Scholar] [CrossRef]
- Kamp-Nielsen, L. Mud-water exchange of phosphate and other ions in undisturbed sediment cores and factors affecting exchange rates. Arch. Hydrobiol. 1974, 73, 218–237. [Google Scholar]
- Kristensen, P.; Jensen, P. Sedimentation og Resuspension i Søbygård Sø; Botanisk Institut, Aarhus Universitet, Miljøstyrelsens Ferskvandslaboratorium: Silkeborg, Denmark, 1987. (In Danish) [Google Scholar]
- Andersen, F.Ø.; Jensen, H.S. The Influence of Chironomids on Decomposition of Organic Matter and Nutrient Exchange in a Lake Sediment; E Schweizerbart’sche Verlagsbuchhandlung: Stuttgart, Germany, 1991. [Google Scholar]
- Andersen, F.Ø.; Jensen, H.S. Regeneration of inorganic phosphorus and nitrogen from decomposition of seston in a freshwater sediment. Hydrobiologia 1992, 228, 71–81. [Google Scholar] [CrossRef]
- Schindler, D.W. Evolution of phosphorus limitation in lakes. Science 1977, 195, 260–262. [Google Scholar] [CrossRef] [PubMed]
- Kronvang, B.; Aertebjerg, G.; Grant, R.; Kristensen, P.; Hovmand, M.; Kirkegaard, J. Nationwide monitoring of nutrients and their ecological effects—State of the Danish aquatic enviroment. Ambio 1993, 22, 176–187. [Google Scholar]
- Kohler, J.; Hilt, S.; Adrian, R.; Nicklisch, A.; Kozerski, H.P.; Walz, N. Long-term response of a shallow, moderately flushed lake to reduced external phosphorus and nitrogen loading. Freshw. Biol. 2005, 50, 1639–1650. [Google Scholar] [CrossRef]
- Moss, B.; Barker, T.; Stephen, D.; Williams, A.E.; Balayla, D.J.; Beklioglu, M.; Carvalho, L. Consequences of reduced nutrient loading on a lake system in a lowland catchment: Deviations from the norm? Freshw. Biol. 2005, 50, 1687–1705. [Google Scholar] [CrossRef]
- Paerl, H.W.; Xu, H.; McCarthy, M.J.; Zhu, G.W.; Qin, B.Q.; Li, Y.P.; Gardner, W.S. Controlling harmful cyanobacterial blooms in a hyper-eutrophic lake (Lake Taihu, China): The need for a dual nutrient (N & P) management strategy. Water Res. 2011, 45, 1973–1983. [Google Scholar] [PubMed]
- Howarth, R.W.; Marino, R.; Lane, J.; Cole, J.J. Nitrogen-fixation in fresh-water, eustarine, and marine ecosystems. 1. Rates and importance. Limnol. Oceanogr. 1988, 33, 669–687. [Google Scholar]
- Jeppesen, E.; Søndergaard, M.; Jensen, J.P.; Mortensen, E.; Hansen, A.M.; Jørgensen, T. Cascading trophic in-teractions from fish to bacteria, and nutrients after reduced sewage loading: An 18-year study of a shallow hypertrophic lake. Ecosystems 1998, 1, 250–267. [Google Scholar] [CrossRef]
- Mooij, W.M.; De Senerpont Domis, L.N.; Janse, J.H. Linking species- and ecosystem-level impacts of climate change in lakes with a complex and a minimal model. Ecol. Model. 2009, 220, 3011–3020. [Google Scholar] [CrossRef]
- Fragoso, C.R.; Marques, D.; Ferreira, T.F.; Janse, J.H.; van Nes, E.H. Potential effects of climate change and eutrophication on a large subtropical shallow lake. Environ. Model. Softw. 2011, 26, 1337–1348. [Google Scholar] [CrossRef]
- Beven, K. A manifesto for the equifinality thesis. J. Hydrol. 2006, 320, 18–36. [Google Scholar] [CrossRef] [Green Version]
- Veraart, A.J.; de Klein, J.J.M.; Scheffer, M. Warming can boost denitrification disproportionately due to altered oxygen dynamics. PLoS ONE 2011, 6. [Google Scholar] [CrossRef] [PubMed]
- Jeppesen, E.; Kristensen, P.; Jensen, J.; Søndergaard, M.; Mortensen, E.; Lauridsen, T. Recovery resilience following a reduction in external phosphorus loading of shallow, eutrophic Danish lakes: Duration, regulating factors and methods for overcoming resilience. Mem. Ist. Ital. Idrobiol. 1991, 48, 127–148. [Google Scholar]
- Jensen, J.P.; Pedersen, A.R.; Jeppesen, E.; Søndergaard, M. An empirical model describing the seasonal dynamics of phosphorus in 16 shallow eutrophic lakes after external loading reduction. Limnol. Oceanogr. 2006, 51, 791–800. [Google Scholar] [CrossRef]
- Jensen, H.S.; Kristensen, P.; Jeppesen, E.; Skytthe, A. Iron-phosphorus ratio in surface sediment as an indicator of phosphate release from aerobic sediments in shallow lakes. Hydrobiologia 1992, 235, 731–743. [Google Scholar] [CrossRef]
- Søndergaard, M.; Jensen, J.P.; Jeppesen, E. Internal phosphorus loading in shallow Danish lakes. Hydrobiologia 1999, 408, 145–152. [Google Scholar] [CrossRef]
- Jeppesen, E.; Jensen, J.P.; Jensen, C.; Faafeng, B.; Hessen, D.O.; Søndergaard, M.; Lauridsen, T.; Brettum, P.; Christoffersen, K. The impact of nutrient state and lake depth on top-down control in the pelagic zone of lakes: A study of 466 lakes from the temperate zone to the arctic. Ecosystems 2003, 6, 313–325. [Google Scholar] [CrossRef]
- Jeppesen, E.; Noges, P.; Davidson, T.A.; Haberman, J.; Noges, T.; Blank, K.; Lauridsen, T.L.; Søndergaard, M.; Sayer, C.; Laugaste, R.; et al. Zooplankton as indicators in lakes: A scientific-based plea for including zooplankton in the ecological quality assessment of lakes according to the European Water Framework Directive (WFD). Hydrobiologia 2011, 676, 279–297. [Google Scholar] [CrossRef]
- Meerhoff, M.; Clemente, J.M.; De Mello, F.T.; Iglesias, C.; Pedersen, A.R.; Jeppesen, E. Can warm climate-related structure of littoral predator assemblies weaken the clear water state in shallow lakes? Glob. Chang. Biol. 2007, 13, 1888–1897. [Google Scholar] [CrossRef]
- Teixeira-de Mello, F.; Meerhoff, M.; Pekcan-Hekim, Z.; Jeppesen, E. Substantial differences in littoral fish community structure and dynamics in subtropical and temperate shallow lakes. Freshw. Biol. 2009, 54, 1202–1215. [Google Scholar] [CrossRef]
- Jeppesen, E.; Søndergaard, M.; Meerhoff, M.; Lauridsen, T.L.; Jensen, J.P. Shallow lake restoration by nutrient loading reduction—Some recent findings and challenges ahead. Hydrobiologia 2007, 584, 239–252. [Google Scholar] [CrossRef]
- Rivington, M.; Miller, D.; Matthews, K.B.; Russell, G.; Bellocchi, G.; Buchan, K. Evaluating regional climate model estimates against site-specific observed data in the UK. Clim. Chang. 2008, 88, 157–185. [Google Scholar] [CrossRef]
- Andersen, H.E.; Kronvang, B.; Larsen, S.E.; Hoffmann, C.C.; Jensen, T.S.; Rasmussen, E.K. Climate-change impacts on hydrology and nutrients in a Danish lowland river basin. Sci. Total Environ. 2006, 365, 223–237. [Google Scholar] [CrossRef] [PubMed]
- Søndergaard, M.; Jensen, J.P.; Jeppesen, E. Role of sediment and internal loading of phosphorus in shallow lakes. Hydrobiologia 2003, 506, 135–145. [Google Scholar] [CrossRef]
- Boberg, F. Weighted Scenario Temperature and Precipitation Changes for Denmark Using Probability Density Functions for Ensembles Regional Climate Models; Danish Meteorological Institute: Copenhagen, Denmark, 2010. [Google Scholar]
- Brown, L.C.; Duguay, C.R. The response and role of ice cover in lake-climate interactions. Prog. Phys. Geogr. 2010, 34, 671–704. [Google Scholar] [CrossRef]
- Balayla, D.; Lauridsen, T.L.; Søndergaard, M.; Jeppesen, E. Larger zooplankton in Danish lakes after cold winters: Are winter fish kills of importance? Hydrobiologia 2010, 646, 159–172. [Google Scholar] [CrossRef]
- Ruuhijarvi, J.; Rask, M.; Vesala, S.; Westermark, A.; Olin, M.; Keskitalo, J.; Lehtovaara, A. Recovery of the fish community and changes in the lower trophic levels in a eutrophic lake after a winter kill of fish. Hydrobiologia 2010, 646, 145–158. [Google Scholar] [CrossRef]
- Sørensen, T.; Mulderij, G.; Søndergaard, M.; Lauridsen, T.L.; Liboriussen, L.; Brucet, S.; Jeppesen, E. Winter ecology of shallow lakes: Strongest effect of fish on water clarity at high nutrient levels. Hydrobiologia 2011, 664, 147–162. [Google Scholar] [CrossRef]
- Moss, B.; McKee, D.; Atkinson, D.; Collings, S.E.; Eaton, J.W.; Gill, A.B.; Harvey, I.; Hatton, K.; Heyes, T.; Wilson, D. How important is climate? Effects of warming, nutrient addition and fish on phytoplankton in shallow lake microcosms. J. Appl. Ecol. 2003, 40, 782–792. [Google Scholar] [CrossRef]
- Mooij, W.M.; Hulsmann, S.; De Senerpont Domis, L.N.; Nolet, B.A.; Bodelier, P.L.E.; Boers, P.C.M.; Dionisio Pires, L.M.; Gons, H.J.; Ibelings, B.W.; Noordhuis, R.; et al. The impact of climate change on lakes in The Netherlands: A review. Aquat. Ecol. 2005, 39, 381–400. [Google Scholar] [CrossRef]
- Elliott, J.A. The seasonal sensitivity of Cyanobacteria and other phytoplankton to changes in flushing rate and water temperature. Glob. Chang. Biol. 2010, 16, 864–876. [Google Scholar] [CrossRef]
- Hu, F.; Bolding, K.; Bruggeman, J.; Jeppesen, E.; Flindt, M.R.; van Gerven, L.; Janse, J.H.; Janssen, A.B.G.; Kuiper, J.J.; Mooij, W.M.; et al. FABM-PCLake—Linking aquatic ecology with hydrodynamics. Geosci. Model Dev. Discuss. 2016, 9, 2271–2278. [Google Scholar] [CrossRef]
- Søndergaard, M.; Jeppesen, E.; Jensen, J.P.; Amsinck, S.L. Water framework directive: Ecological classification of Danish lakes. J. Appl. Ecol. 2005, 42, 616–629. [Google Scholar] [CrossRef]
- Janssen, A.G.; Arhonditsis, G.; Beusen, A.; Bolding, K.; Bruce, L.; Bruggeman, J.; Couture, R.M.; Downing, A.; Alex Elliott, J.; Frassl, M.; et al. Exploring, exploiting and evolving diversity of aquatic ecosystem models: A community perspective. Aquat. Ecol. 2015, 49, 513–548. [Google Scholar] [CrossRef]


| ID | Name | Unit | Parameter Value | Definition | References/Remarks | |
|---|---|---|---|---|---|---|
| Default | Calibrated | |||||
| 20 | cAffNUptDiat | L·mgDW−1·d−1 | 0.2 | 0.25 | Initial N uptake, diatoms | Calibration |
| 21 | cAffNUptGren | L·mgDW−1·d−1 | 0.2 | 0.1 | Initial N uptake, greens | Calibration |
| 32 | cChDDiatMax | mgChl/mgDW | 0.012 | 0.01 | Max chlorophyll/C ratio, diatoms | Calibration |
| 60 | cDCarrZoo | mg/L | 25 | 30 | Carrying capacity of zooplankton | Calibration |
| 83 | cExtSpGren | m2/gDW | 0.25 | 0.2 | Specific extinction greens | Calibration |
| 91 | cFiltMax | L·mgDW−1·d−1 | 4.5 | 4.2 | Maximum filtering rate | [37] |
| 104 | cMuMaxBlue | d−1 | 0.6 | 0.7 | Maximum growth rate, bluegreens | [37] |
| 105 | cMuMaxDiat | d−1 | 2 | 2.6 | Maximum growth rate, diatoms | [37] |
| 106 | cMuMaxGren | d−1 | 1.5 | 3.6 | Maximum growth rate, greens | [38] |
| 119 | cNDDiatMax | mgN/mgDW | 0.05 | 0.06 | Maximum N/day ratio, diatoms | Calibration |
| 124 | cNDGrenMax | mgN/mgDW | 0.1 | 0.2 | Maximum N/day ratio, greens | Calibration |
| 125 | cNDGrenMin | mgN/mgDW | 0.02 | 0.03 | Minimum N/day ratio, greens | Calibration |
| 151 | coPO4Max | mgP/L | 1 | 6 | Maximum SRP concentration in pore water | [39] |
| 191 | cPrefGren | - | 0.75 | 0.76 | Selection factor for greens | Calibration |
| 234 | cThetaDif | - | 1.02 | 1.15 | Temperature coefficient for diffusion | Calibration |
| 235 | cThetaMinS | - | 1.07 | 1.15 | Exponential temperature constant of sediment mineralization | Calibration |
| 236 | cThetaMinW | - | 1.07 | 1.15 | Exponential temperature constant of mineralization in water | Calibration |
| 237 | cThetaNitr | - | 1.08 | 1.103 | Temperature coefficient of nitrification | Calibration |
| 253 | cTurbDifNut | - | 5 | 5.5 | Bioturbation factor for diffusion of nutrients | Calibration |
| 254 | cTurbDifO2 | - | 5 | 7 | Bioturbation factor for diffusion of oxygen | Calibration |
| 256 | cVNUptMaxDiat | mgN·mgDW−1·d−1 | 0.07 | 0.1 | Maximum N uptake capacity of diatoms | Calibration |
| 257 | cVNUptMaxGren | mgN·mgDW−1·d−1 | 0.07 | 0.11 | Maximum N uptake capacity of greens | [40] |
| 266 | cVSetDet | m/d | 0.25 | 0.29 | Maximum sedimentation velocity of detritus | Calibration |
| 269 | cVSetIM | m/d | 1 | 2 | Maximum sedimentation velocity of inert organic matter | [38] |
| 281 | fDAssZoo | - | 0.35 | 0.33 | DW-assimilation efficiency of herbivorous zooplankton | [38] |
| 288 | fDepthDifS | - | 0.5 | 0.1 | Nutrient diffusion distance as fraction of sediment depth | Calibration |
| 352 | hFilt | mgDW/L | 1 | 0.94 | Half-saturating food concentration for filtering | [37] |
| 358 | hNO3Denit | mgN/L | 2 | 1 | Quadratic half-saturating NO3 concentration for denitrification | Calibration |
| 360 | hO2Nitr | mgO2/L | 2 | 1 | Quadratic half-saturating NO3 concentration for nitrification | Calibration |
| 367 | kDAssFiAd | d−1 | 0.06 | 0.04 | Maximum assimilation rate of adult fish | Calibration |
| 371 | kDMinDetS | d−1 | 0.002 | 0.003 | Decomposition constant of sediment detritus | Calibration |
| 372 | kDMinDetW | d−1 | 0.01 | 0.02 | Decomposition constant of detritus | [28] |
| 414 | kNitrS | - | 1 | 7 | Nitrification rate constant in sediment | [37] |
| 415 | kNitrW | - | 0.1 | 0.5 | Nitrification rate constant in water | [37] |
| Variable | R2 Day | R2 Month | RE Day | RE Month |
|---|---|---|---|---|
| TP | 0.3 | 0.38 | 0.55 | 0.5 |
| PO4 | 0.25 | 0.34 | 5.24 | 3.54 |
| TN | 0.61 | 0.72 | 0.31 | 0.26 |
| NO3 | 0.61 | 0.7 | 8.01 | 10.82 |
| NH4 | 0.01 | 0.0002 * | 13.91 | 26.41 |
| Chl.-a | 0.21 | 0.35 | 1.9 | 0.8 |
© 2016 by the authors; licensee MDPI, Basel, Switzerland. This article is an open access article distributed under the terms and conditions of the Creative Commons Attribution (CC-BY) license (http://creativecommons.org/licenses/by/4.0/).
Share and Cite
Rolighed, J.; Jeppesen, E.; Søndergaard, M.; Bjerring, R.; Janse, J.H.; Mooij, W.M.; Trolle, D. Climate Change Will Make Recovery from Eutrophication More Difficult in Shallow Danish Lake Søbygaard. Water 2016, 8, 459. https://doi.org/10.3390/w8100459
Rolighed J, Jeppesen E, Søndergaard M, Bjerring R, Janse JH, Mooij WM, Trolle D. Climate Change Will Make Recovery from Eutrophication More Difficult in Shallow Danish Lake Søbygaard. Water. 2016; 8(10):459. https://doi.org/10.3390/w8100459
Chicago/Turabian StyleRolighed, Jonas, Erik Jeppesen, Martin Søndergaard, Rikke Bjerring, Jan H. Janse, Wolf M. Mooij, and Dennis Trolle. 2016. "Climate Change Will Make Recovery from Eutrophication More Difficult in Shallow Danish Lake Søbygaard" Water 8, no. 10: 459. https://doi.org/10.3390/w8100459