1. Introduction
Clogging has long been an issue in managed aquifer recharge (MAR), and particularly so in aquifer storage and recovery (ASR) sites where large volumes of water are injected through a relatively small well perimeter area. A study by Pavelic and Dillon [
1] found that this was the dominant reason for abandonment of ASR projects. With experience, greater wariness has led to improved water treatment prior to injection and improved well rehabilitation methods. Advancing from trial and error to the design of water treatment to manage clogging requires research and investigations. Where there is uncertainty concerning prospects for success of an expensive project, it is normal to undertake laboratory experiments or smaller-scale trials to reduce the level of uncertainty before undertaking large scale capital investment. In this paper this is demonstrated at three Australian ASR recharge projects injecting stormwater or recycled water into siliceous aquifers containing anoxic brackish groundwater.
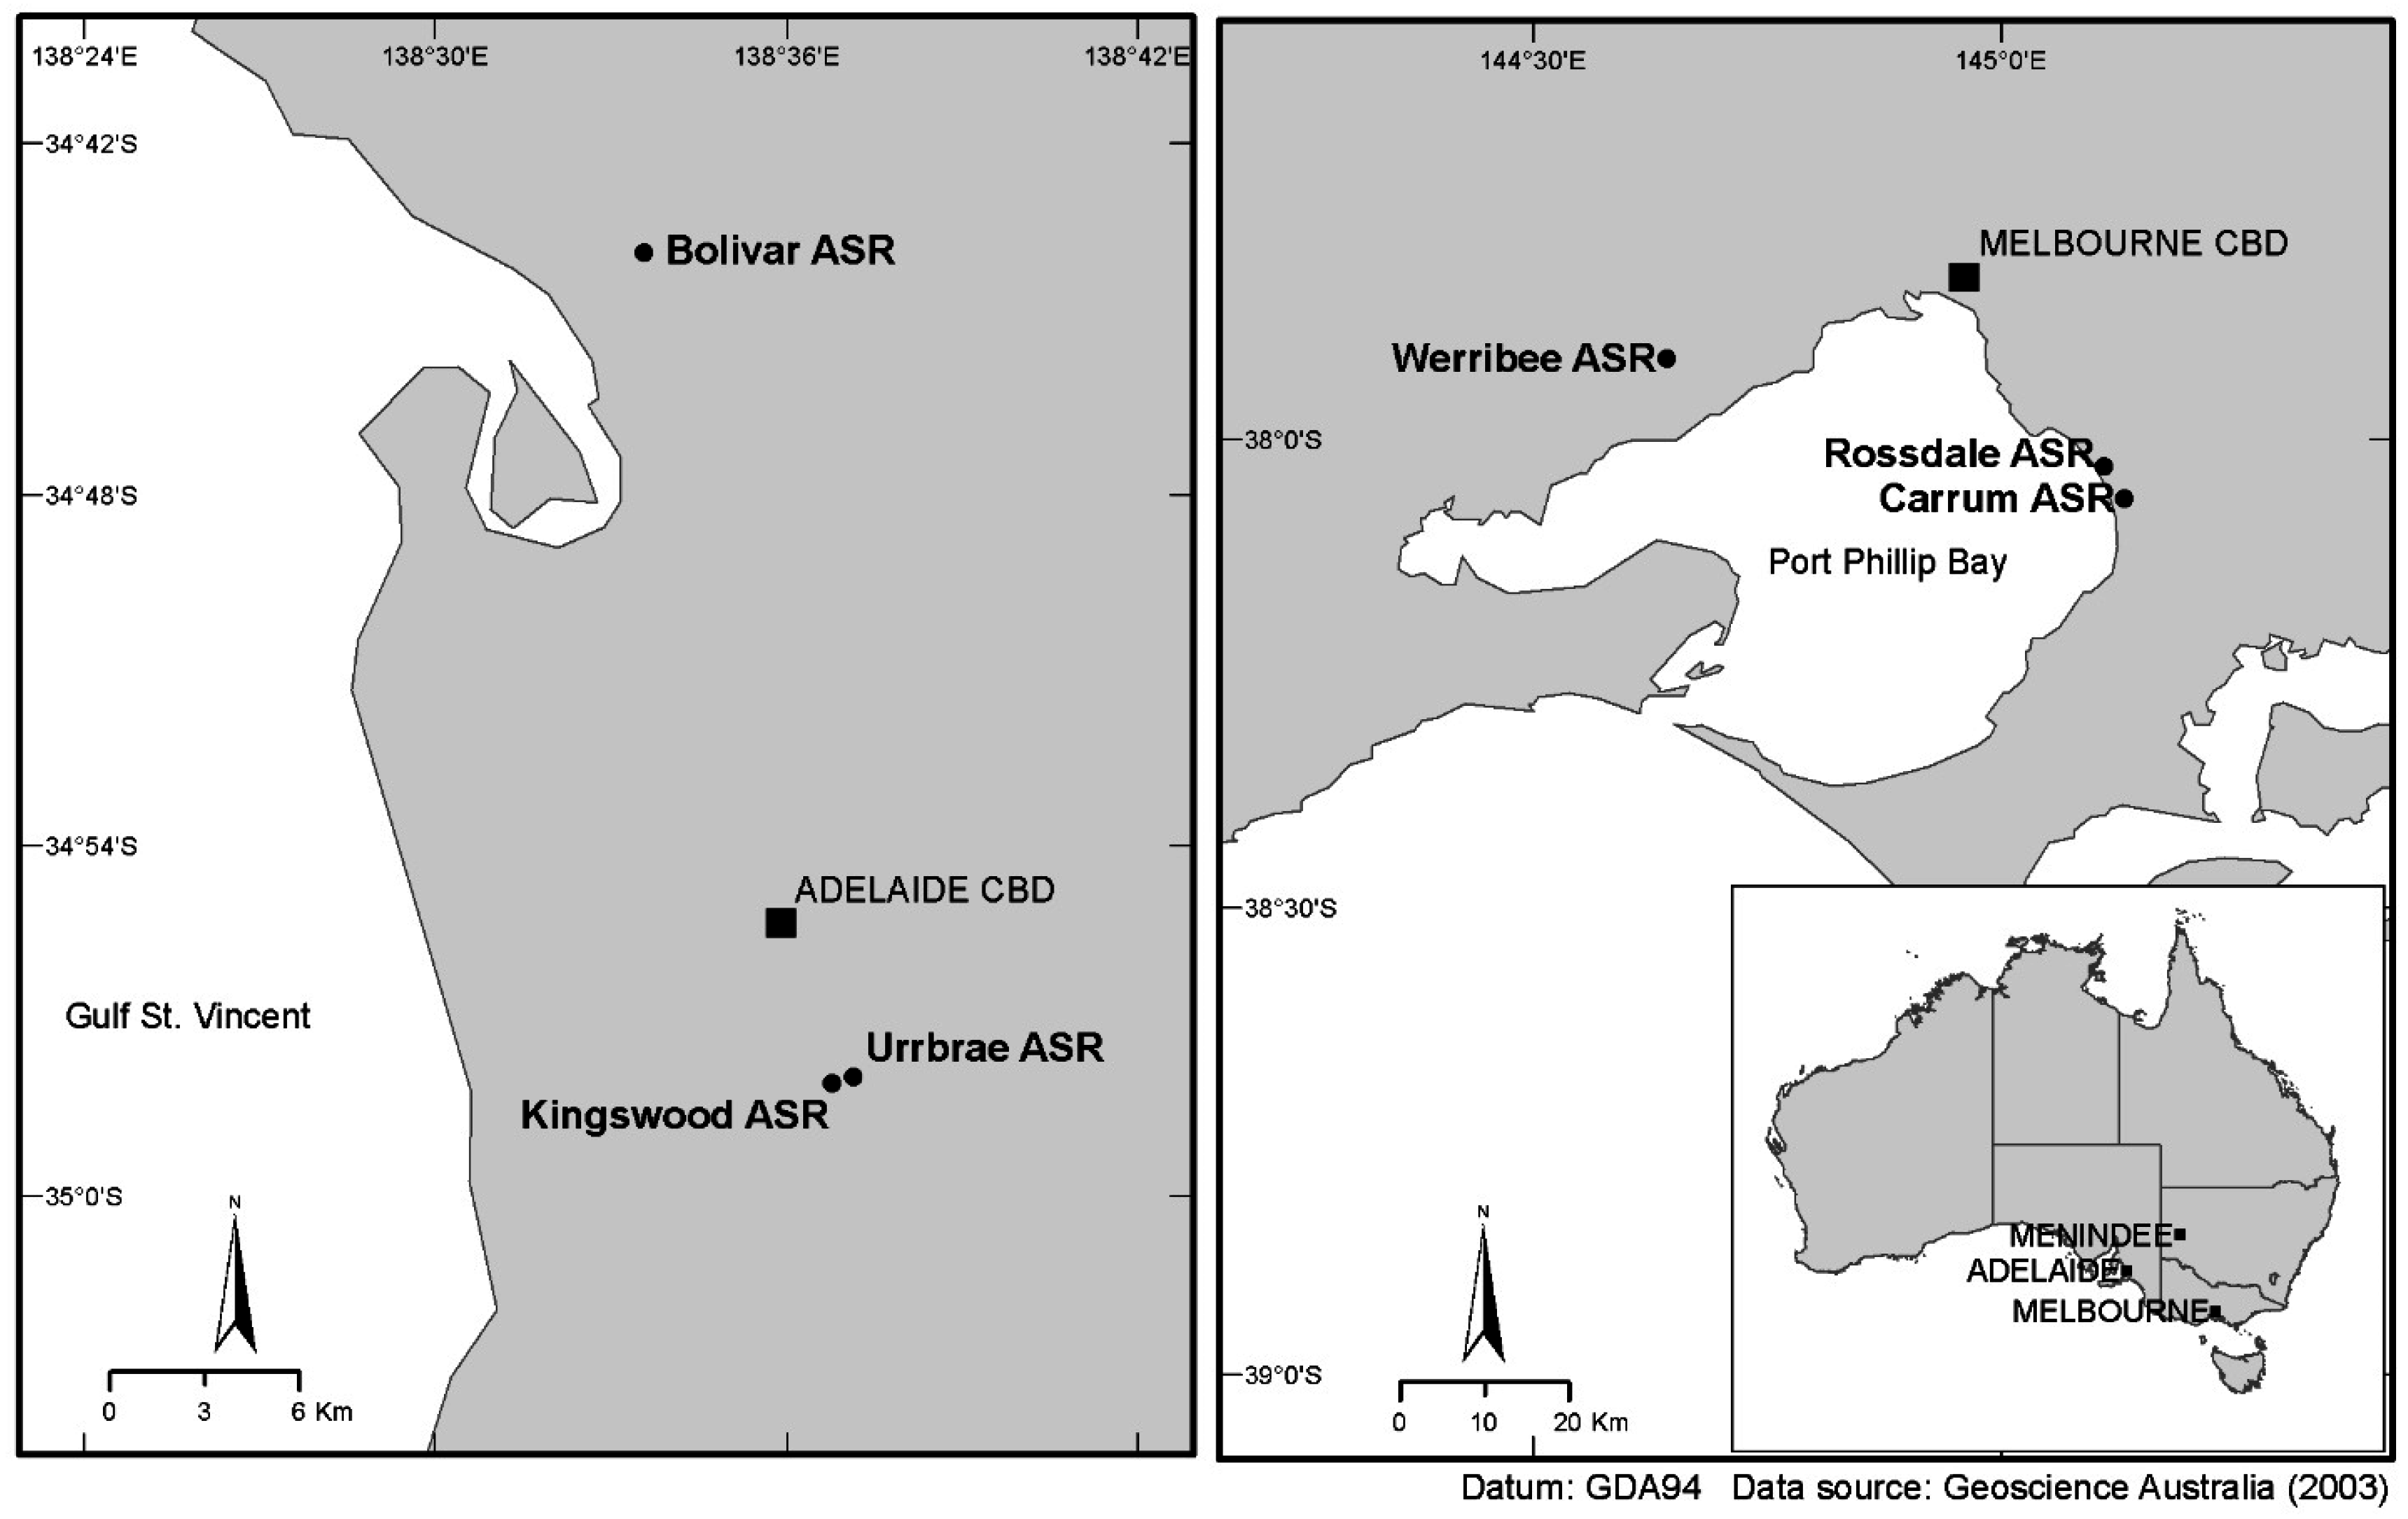
These all involved drilling and aquifer pumping tests. At one site, in Urrbrae, South Australia, this was followed without further investigations by treating stormwater by rapid sand filtration and injecting it. However this proved to be an irrecoverable clogging failure. At a subsequent site, at Rossdale, in Victoria, no aquifer materials could be obtained for conducting column studies to test compatibility of source water and aquifer, so a field trial injection was undertaken with high-quality treated water, and success with that led to the design of stormwater treatments to produce equivalent values for key water quality parameters. At a third site, at Werribee, in Victoria, a short duration trial injection of recycled water with 20 micron disc filtration was undertaken with equivocal results. Subsequently, vibro-core samples of aquifer material enabled laboratory column experiments of clogging with a range of water types representing different treatment options. These suggested a higher level of treatment than originally envisaged, and the next stage is a field trial with the intended injectant quality to resolve remaining uncertainties. Locations of the study sites are shown in
Figure 1.
This paper gives an overview of clogging investigations at these three sites, and a qualitative indicator of the level of confidence in the economic viability of managing clogging as investigations proceeded. This is followed by a discussion on water treatment and well rehabilitation, and a description of Bayesian analysis as applied to clogging investigations to refine estimates of ASR viability. A generic model is developed to link rates of acute and chronic clogging to the volumes of water injected and purged for some basic operational variables. This is followed by a review of Australian research data on rates of clogging of ASR wells in siliceous aquifers as measured in field trials (chronic clogging rates) and in laboratory column experiments (acute clogging rates). This informs further investigations for the Werribee site, and new outcomes from these may be valuable in refining future Bayesian analyses that incorporate a present value net benefit analysis, for selecting the treatment method.
2. Overview of Clogging Investigations at Three Sites
For various reasons, the three projects considered here had different approaches to constraining uncertainty. At Urrbrae, South Australia, a stormwater recharge project failed due to injection commencing before water treatment requirements had been evaluated (Pavelic et al. [
2]) (
Table 1). At Rossdale, Victoria, where a stormwater recharge project commenced at a golf course, no aquifer core could be obtained. A pilot field study was undertaken using drinking water to evaluate clogging (Page et al. [
3]) and recovery efficiency (Miotlinski et al. [
4]), and drinking water was found to not cause clogging. This was followed by laboratory studies of different treatment processes for stormwater to determine the treatment that would produce a similar quality to drinking water (Dillon et al. [
5]). After excluding treatments that gave unacceptable quality in the byproduct water that would prevent discharge to the sewer, and a further treatment that would have resulted in unacceptable clay dispersion in the aquifer, the selected least-cost treatment was then incorporated into a full-scale field trial and evaluated (
Table 1). At the third site, Werribee, Victoria, investigations were undertaken as described by Hudson and Muthukarruppan [
6] to evaluate the recharge of recycled water into a tertiary sand aquifer. This involved drilling and aquifer pumping tests, a short-term trial injection with partially-treated water, as well as aquifer coring with a sonic corer allowing laboratory investigations of clogging of columns of aquifer material with source waters representing different treatments of recycled water (
Table 1).
The probability of success can change as investigations progress. For example, gravel found in sieve samples of drilling mud at Urrbrae was interpreted as inferring good prospects for recharge. However in the subsequent well development a large amount of very fine sand was recovered and, subsequently, the aquifer pumping test revealed very low transmissivity, suggesting that the aquifer would make a poor target for recharge.
3. Water Treatment and Well Rehabilitation
In general, ASR sites are more likely to be most economic when injection (and recovery) rates are high in each well, and when inexpensive treatment is required to avoid clogging and to meet water quality requirements for the aquifer. It is presumed that any source of water can be treated to produce water that will not cause irreversible clogging, but to do so comes at a cost.
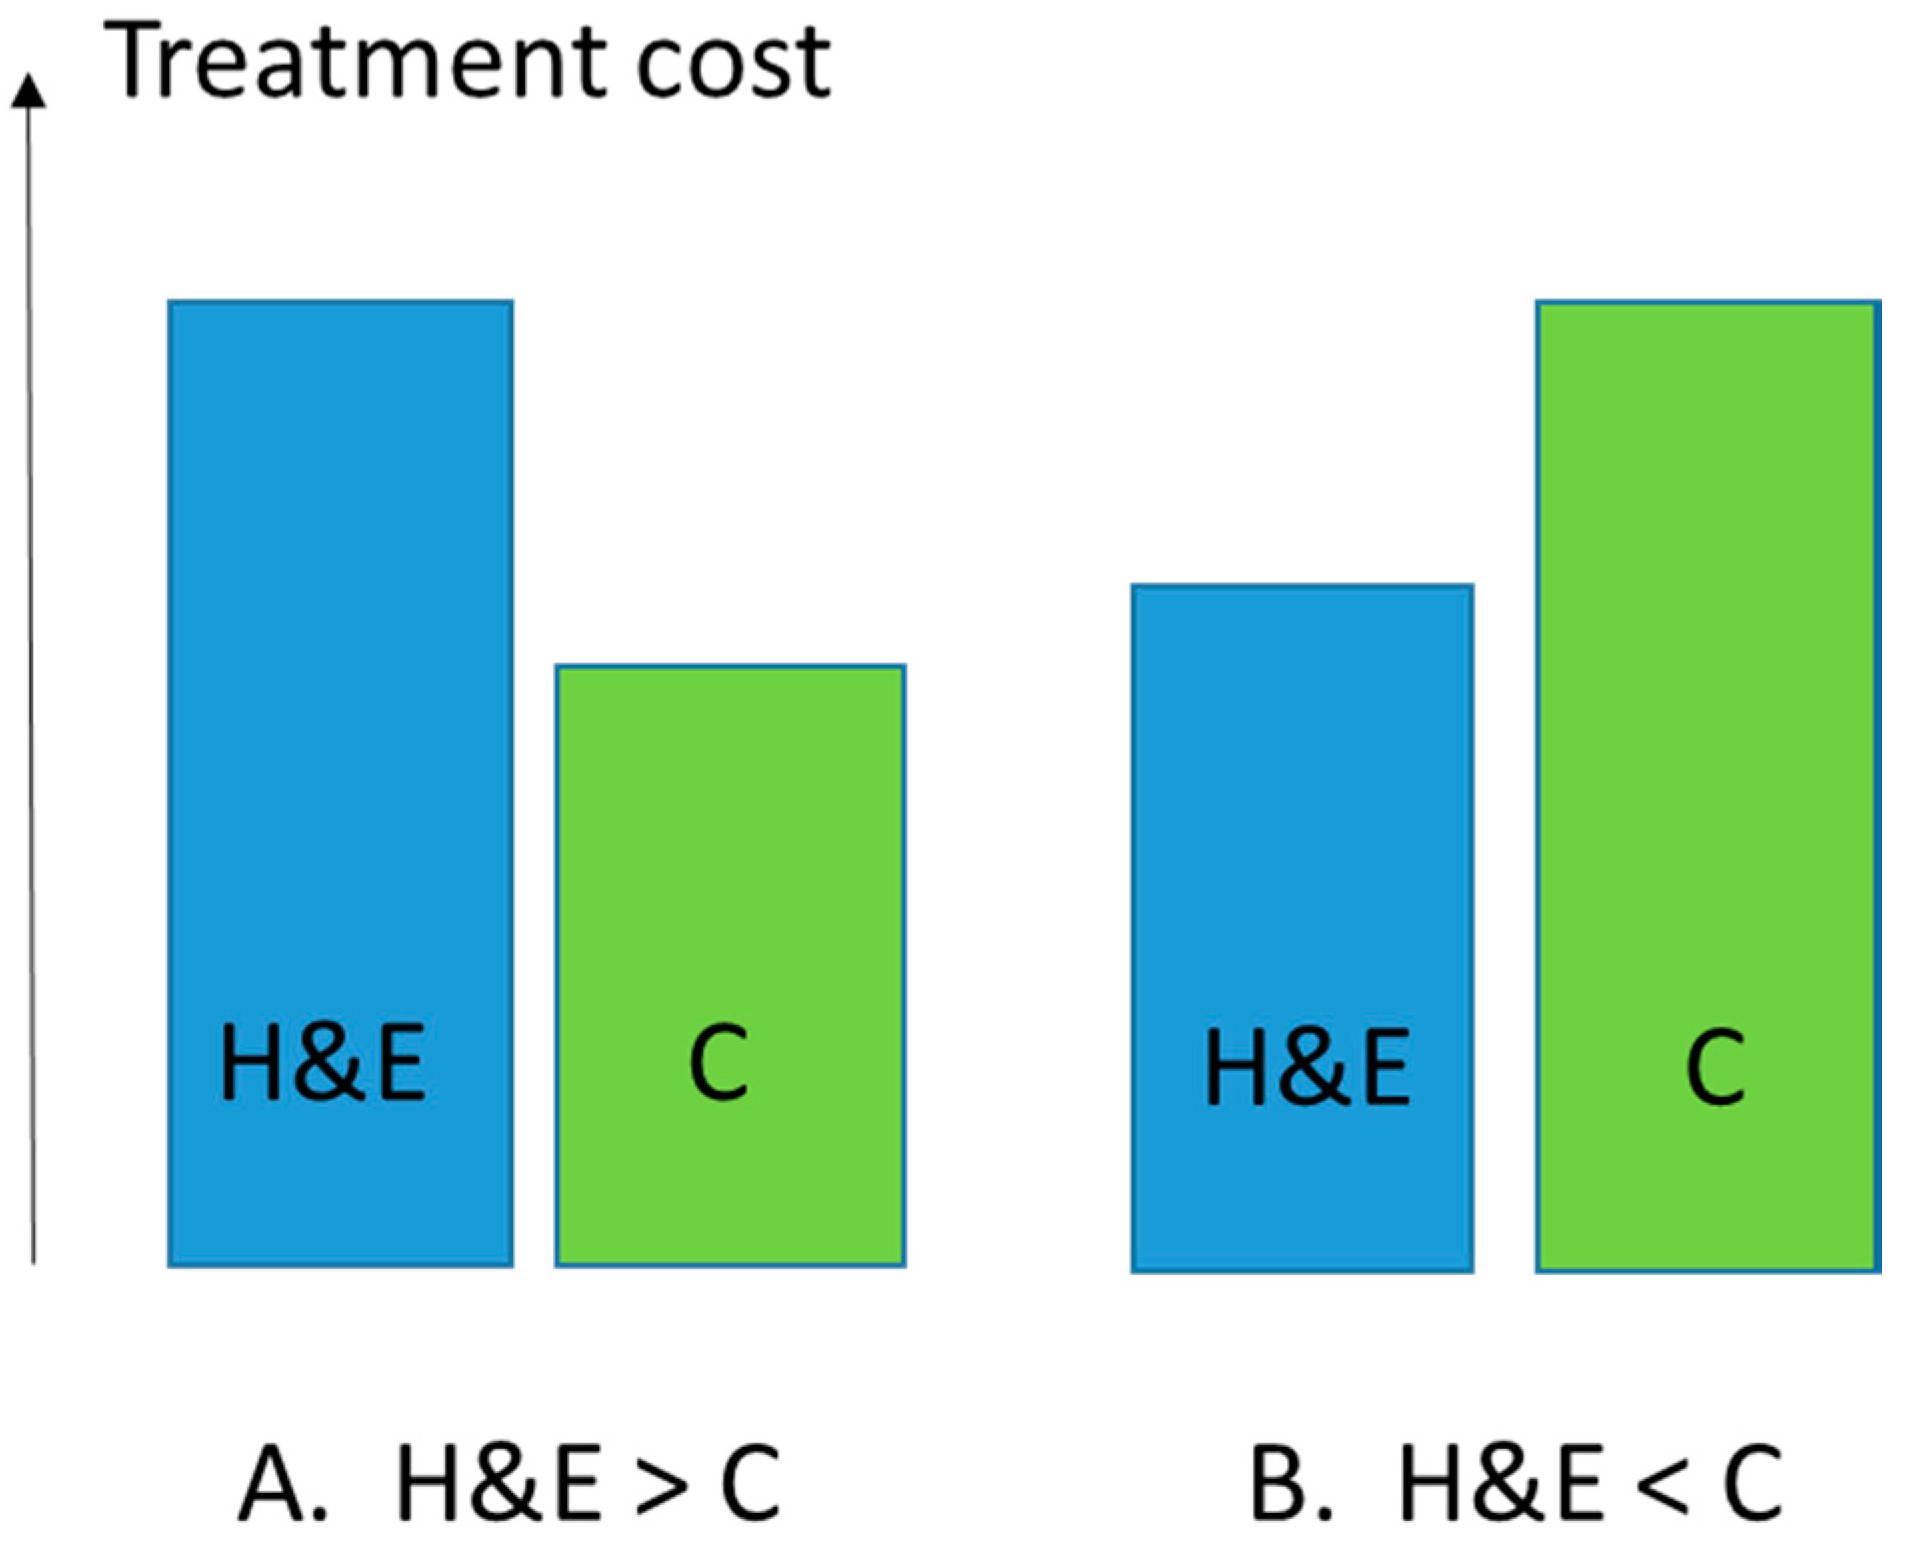
In
Figure 2, generally treatments to address environmental and health impacts of recharged water in an aquifer generally also reduce clogging. Examples are filtration that reduces particulates, including oxidized metals, or biological treatments that reduce nutrients. Counter-examples include chlorination for disinfection causing oxidation of aquifer minerals leading to iron precipitation around the screens. It has also been shown that where coagulants are used for flocculation and filtration to reduce turbidity, the resultant clear water may clog the aquifer faster than the original turbid water due to the presence of residual polysaccharides. Additionally, reverse osmosis can produce permeates with low ionic strength and high sodium adsorption ratios, which may mobilise clay minerals in the aquifer, leading to pore plugging. An understanding of the physical, mineralogical, and hydrogeochemical aspects of the aquifer is needed to anticipate and avoid problems.
In general, where there are membrane treatments within the treatment train, avoidance of clogging of membranes calls for pretreatments that remove excessive particulate matter, nutrients, and labile organic carbon, which also mean that the potential for physical and biological clogging in the aquifer is also reduced. However, as will be shown later, excessive clogging may still occur in aquifer material with injectant that is a membrane permeate (Dillon et al. [
5], Vanderzalm et al. [
7]).
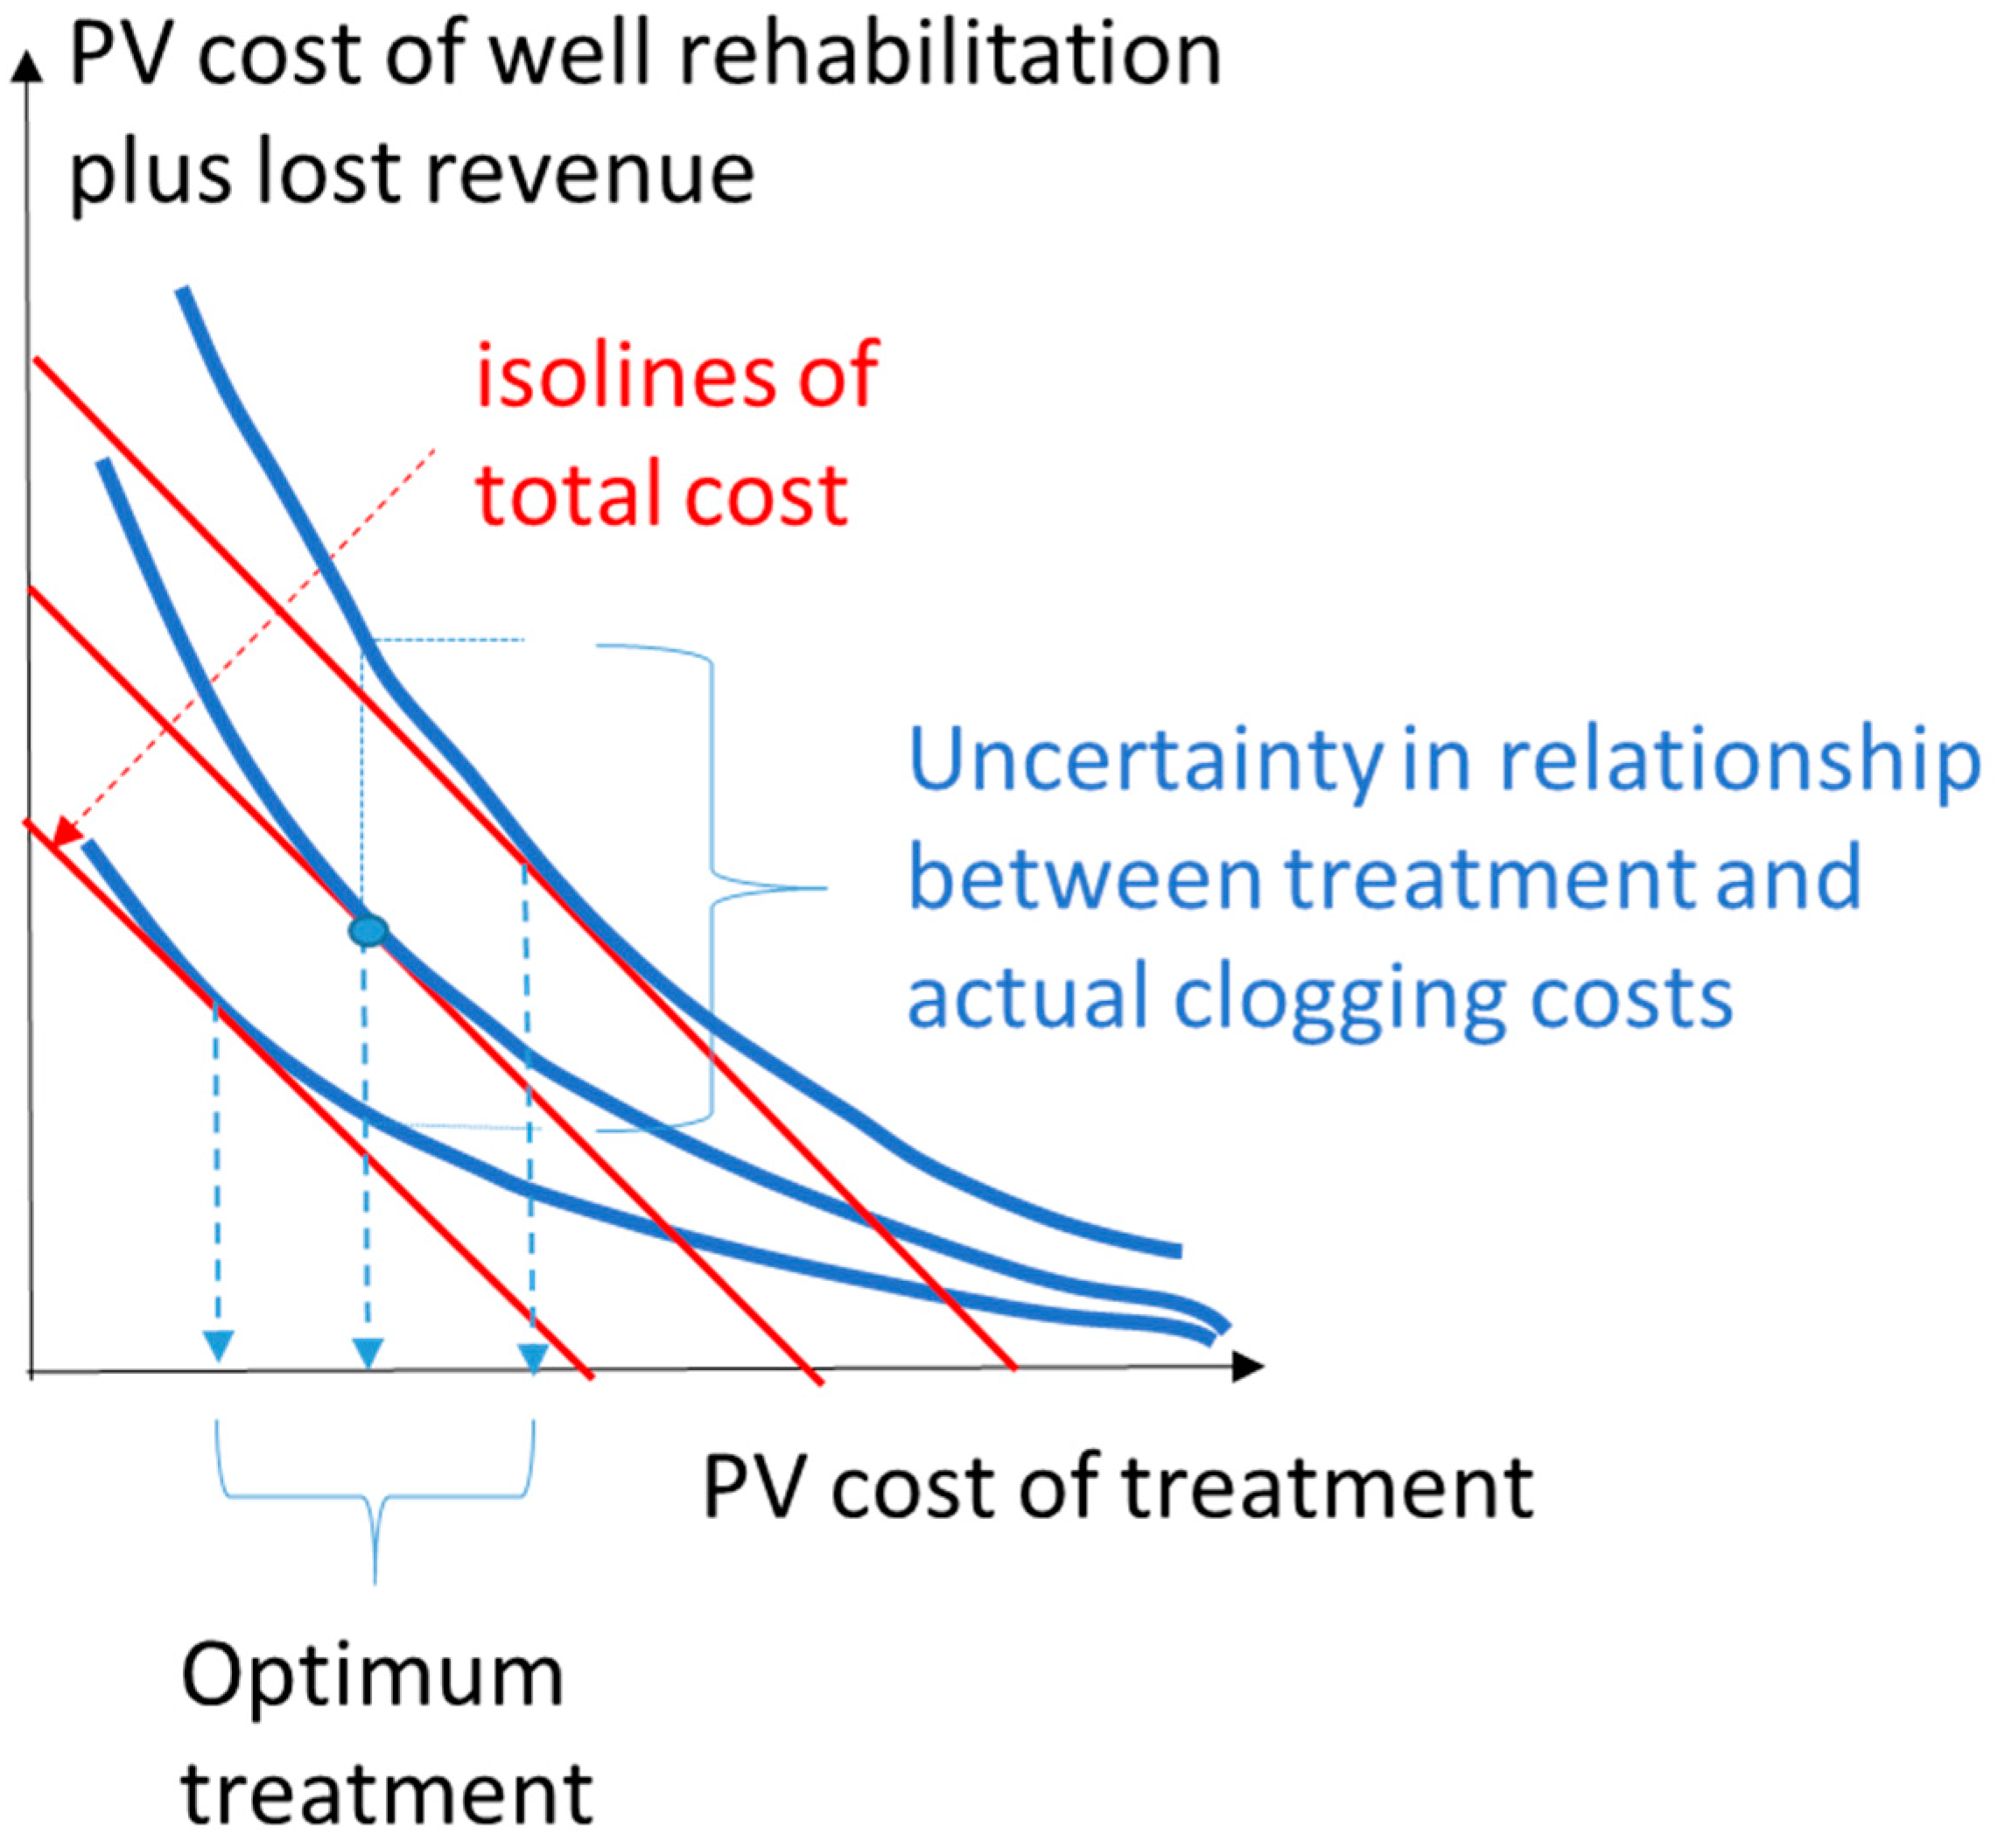
A priori, there is considerable uncertainty in the relationship depicted in
Figure 3, which could result in a large range in costs for the optimal treatment and, hence, a large range of operating costs for whatever treatment is selected. Various techniques have been used in establishing ASR projects to reduce this uncertainty. These include laboratory column experiments and field trials, and often both are used to understand and predict potential problems in the aquifer and inform on the usefulness, or otherwise, of various treatment processes. This leads us to look at a theorem that incorporates the results of such experiments to update expectations of project viability from a clogging perspective.
4. Description of Bayesian Analysis
Reverend Thomas Bayes developed a way of understanding how the probability that a hypothesis is true is affected by a new piece of evidence. If the originally-assumed probability that an ASR site will be economically viable in relation to costs of managing clogging (the
prior probability, P(H)) and an experiment on clogging is conducted that reveals new data, then Bayes’ theorem (Equation (1)) can be used to refine the expected probability that the site will be economically viable. This revised probability, known as the
posterior probability, is the conditional probability P(H|D):
In Equation (1), P(D) is the probability that the experiment will reveal that the rate of clogging can be economically managed. This takes into account that the laboratory experiment is an imprecise measure and while there is a relatively high conditional probability that the experiment will correctly predict economic operations (P(D|H)), there is a complementary probability (1 − P(D|H)), a
false negative) that it will incorrectly suggest that the operation will be uneconomic. In Equation (1), P(NH), the prior probability that ASR will be economically non-viable, is simply (1 − P(H)).
Table 2 is given as an example to help clarify the meaning of the conditional probabilities used in Equation (1). For a well-designed experiment there is expected to be a relatively low probability that the experiment will falsely predict economic operations (P(D|NH)) (
a false positive), and a high complementary probability that it will correctly predict an uneconomic operation (1 − P(D|NH)).
In the example of the experiment shown in
Table 2, if the prior probability of success is, say, 0.3, then Bayes theorem (Equation (1)) would give the posterior probability to be 0.77. In this case, where an experiment is considered a good indicator of future ASR scheme success it may be quite influential in informing on project viability.
The value of undertaking an experiment on clogging is to inform the design and consequent budget concerning necessary treatment, maintenance, and operating costs, in the event that these are more rigorous that those needed to meet the Australian Guidelines for MAR [
8] which ensure protection of the aquifer to satisfy human health and environmental requirements. This is to give confidence to investors in a project if results appear promising, or otherwise allow early exit and avoid operations likely to be put at economic risk by excessive costs in clogging management. Due to both aquifer heterogeneity and temporal variability of source water and treatment reliability, results of laboratory experiments based on small samples of aquifer materials and uniform source water quality cannot be expected to reduce risk completely. That is, false negatives and positives may have moderate probabilities. However, such experiments are considerably cheaper than establishing the infrastructure to conduct a full scale trial. Laboratory experiments are typically performed as a precursor to assist in treatment selection, particularly when a new type of source water is being introduced into an aquifer, or the aquifer has not previously been a target for ASR operations.
In experiments briefly described below, the laboratory columns were composed of selected aquifer materials of finer than average particle size from sonic cores that penetrated the whole thickness of the aquifer. Sonic coring introduces no drilling fluids and preserves aquifer structure. This approach was intended to minimize the potential for false positives at the expense of increasing the possibility of false negatives. This reflects the importance of achieving a successful operation that will be sustainable in the long term. While under-treatment may result in capital savings, it will come at a cost of reducing the useful supply and increased operation and maintenance costs of the MAR operation (as per
Figure 3).
5. Bayesian Analysis of the Value of Clogging Investigations for a Conceptual Example
A simple example is described where a specified supplemental treatment for recycled water prior to injection is
a priori presumed to avoid a non-viable combination of treatment and well rehabilitation costs and lost revenues. Laboratory experiments with aquifer materials and the intended water quality of injectant may be performed to inform on the viability and, therefore, to adjust the posterior probability of a viable operation. The example configuration is given as follows:
Present value of cost of treatment presumed necessary: $1.0 M
Present value of benefit if project proves successful, B(H): $1.5 M (i.e., B/C = 1.5)
Present value of benefit if project proves unsuccessful, B(NH): $0 M
Cost of one clogging experiment to estimate viability: $0.1 M
Table 3 includes the results of conducting up to three independent experiments when the starting prior probability of viability is 0.3. The posterior probability is used to determine the Bayesian expected benefit, E(B), where:
The cost is determined by the experimental costs and by the present value of the treatment cost. This is incurred unless experimental results suggest not to proceed and a “no go” decision is taken.
Expected net benefit is the surplus of expected benefits over costs, and in this example all benefits and costs are discounted to the present value. This is the value that the decision-maker is attempting to maximise. The benefit/cost ratio of the experiments is the difference in expected net benefits with and without the experiments divided by their cost.
For the prior probability of viability of 0.3, the prior expected net benefit is negative, but conducting experiments that reduce uncertainty increases the net expected benefits regardless of whether the experiments suggest viability or non-viability, so long as the decision of whether to proceed is based on experimental results. The first experiment has the highest benefit/cost ratio but the second independent experiment increases expected net benefits by more than the cost of the experiment. A third experiment increases the posterior probabilities only marginally, so the increase in expected benefits is less than the cost of the third experiment, so there is a limit to the value of experiments. In this case the optimum set of experiments costs 20% of the present value of the treatment plant being investigated and have a benefit/cost ratio of approximately four.
When the prior probability is higher (e.g., here, 0.5), it takes less experimentation to achieve the desired level of confidence for optimal expected net benefits. In this case a similar expected net benefit is achieved with one experiment which has a B/C ratio exceeding four.
Note that if the experiments reveal that the project is likely to be nonviable, and there is a sufficient level of confidence in these results, then the proponent would wisely decide not to proceed with that treatment plant (i.e., a ‘no go’ decision) and save the costs of constructing and operating the plant. This would result in avoiding considerable costs that are unlikely to achieve the project benefits, so the benefit/cost ratio of these experiments are still positive.
Clearly, the optimum level of investigations in support of decision-making concerning a new treatment process to avoid clogging is not zero. These results are based on an assumed reliability matrix for laboratory experiments (
Table 2). To populate such a matrix, i.e., find the values of false positives and false negatives, requires that a systematic methodology is applied to a number of projects in an international arena. In the Australian government’s Commonwealth Scientific and Industrial Research Organisation (CSIRO) the same laboratory column clogging study methodology has been applied to a number of Australian projects over almost 20 years, and could provide a suitable basis for international comparative studies. If experimental predictive reliability is believed by decision-makers to be site-specific, then an accumulation of site-specific data would be needed to build confidence in a Bayesian approach but, until then, consistent experimental methodology would be needed to allow for future advances.
6. Linkage between Clogging Rate and Volumes of Water Recharged and Purged
A simplistic conceptual model was developed to characterize clogging on the basis of a number of field studies of ASR sites in Australia. In the absence of clogging, the initial injection rate, q
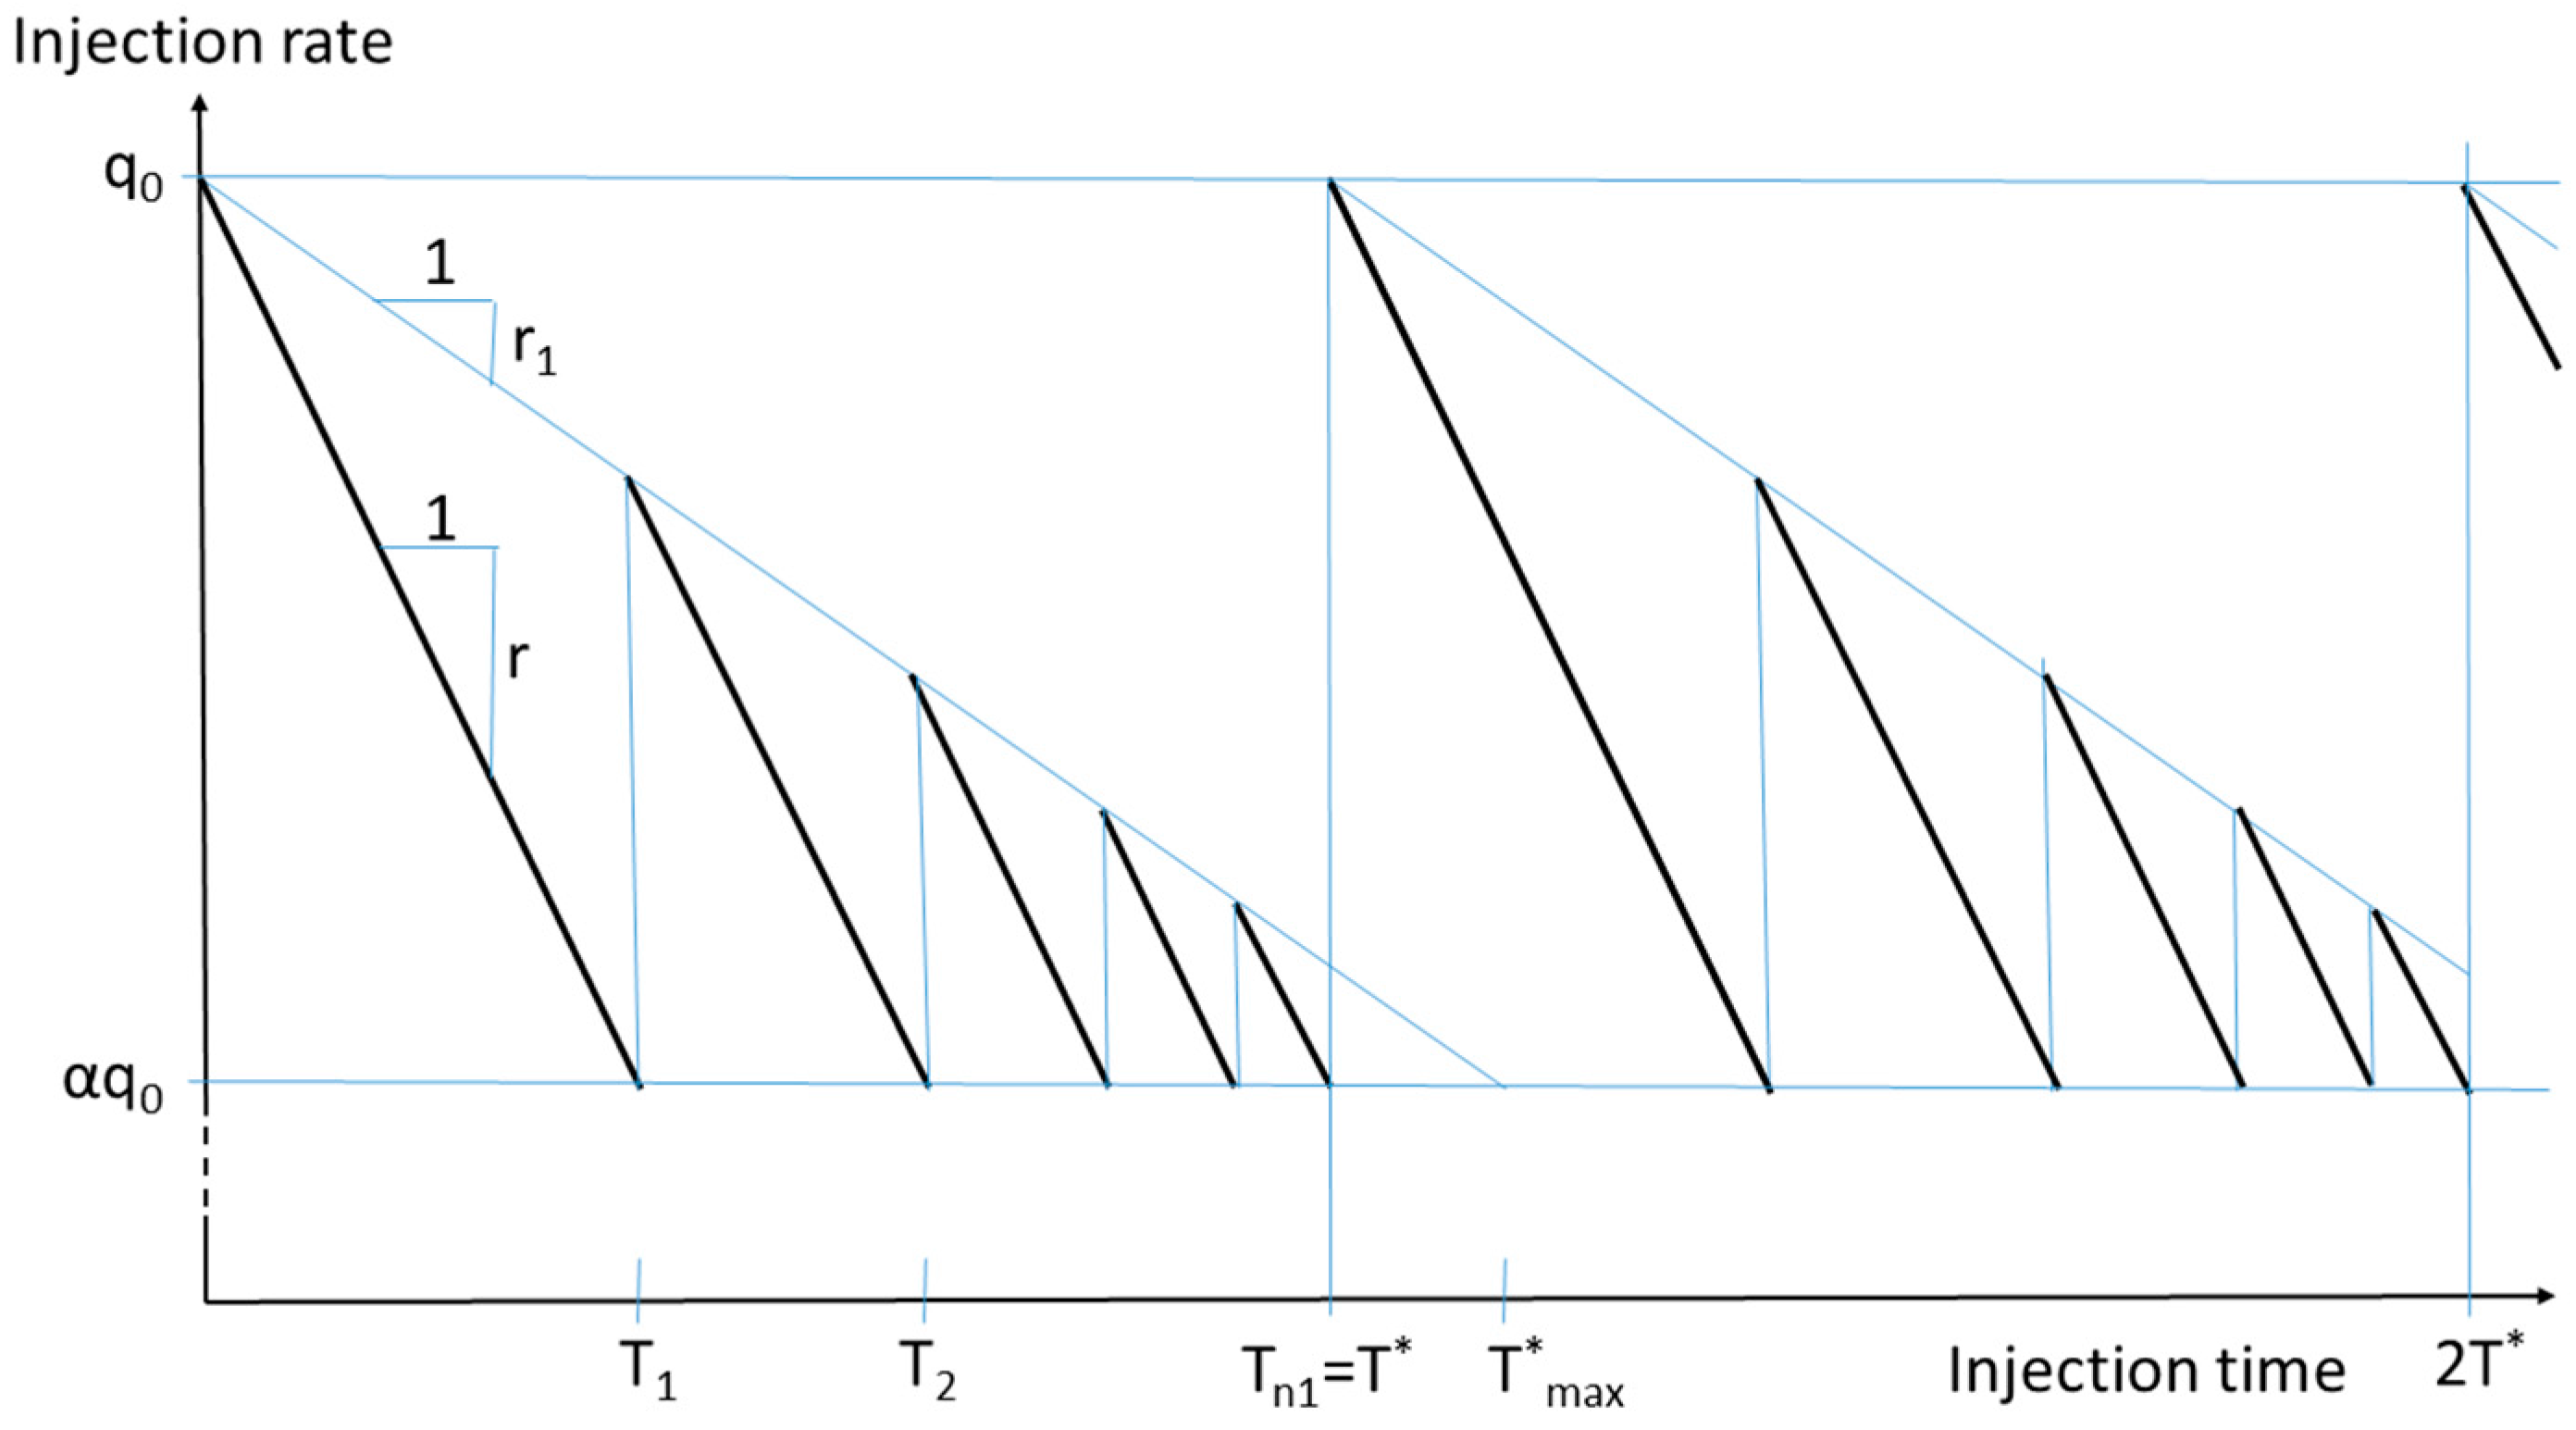
0, is assumed to be sustained indefinitely. However in actual injection systems, considering constrained injection pressure, the injection rate may decline relatively rapidly, at an acute rate, r (L/s/d), over periods of hours to days (
Figure 4). This reflects a decline in intrinsic permeability and, thus, specific capacity, largely due to the easily reversible component of physical blocking of the near well zone (and neglecting the transient variations in the radial hydraulic gradient due to variations in injection rates punctuated with purging events). It is assumed that injection is continuous until the injection rate declines to a constant fraction, α, of the initial injection rate. Upon purging the well, by pumping a water volume,
Vp1, much of the initial injection rate can be restored, but a chronic rate of clogging, r
1 (L/s/d), is observed. This reflects the biological clogging and accumulation of particulates and mineral precipitation that occurs further into the formation that is not removed by a basic purging operation. It is assumed that injection and purge cycles will continue until the volume of water purged exceeds η times the volume of water injected in the previous cycle, i.e.,
At this point a major redevelopment is triggered. It is assumed that this will require considerably longer to execute, tp2, than a basic purge (tp1), withdraw a considerably larger volume, , and that this will chemically dissolve and/or physically agitate and remove residual clogging agents. In the simple model used in this paper this is assumed to completely renovate the well and restore the initial injection rate, q0. It is recognized that this simplification is significant and warrants evaluation in the future, but as laboratory experiments to predict rates of irreversible clogging are currently lacking, this is not further considered in this current paper.
Note that
Figure 4 does not show the time duration of each purge event, nor the flow rate during the purge. Generally the flow rate of a purge is higher than q
0 to induce higher shear stresses on near-well particulates than those acting on them during deposition. The volumes of injected water recovered during major redevelopments may be considerably larger than for purge cycles.
Due to the repetitive nature of the flow rate on a major redevelopment cycle of T
*, the volume of injection for parameter sets r, r
1,
α,
η, then a simple approach may be used to determine the volume of net recharge and of purge and redevelopment water of ASR operations with rates of clogging r and r
1, appropriate for each considered type of recycled water treatment in relation to the assumed treatment for the no clogging case. It can be shown that the time period for the
nth injection cycle, is given by:
and the cumulative injection time to the end of the
nth cycle is given by:
The volume injected in the
nth cycle is given by:
If the volume of water purged,
, exceeds
η, then a major redevelopment is triggered immediately after purging. The cumulative volume of water recovered between major redevelopments is that of
purges (
Figure 4) and one major redevelopment:
The cumulative total time to the end of one major redevelopment is:
Hence, the annual volumes of purged water and of advanced redevelopment water produced are approximated by:
Hence, the annual reduction in available water for beneficial use from the “no clogging” case, assuming a constant recovery efficiency β (and that β is undiminished by the reduced net injection volume caused by clogging and its management), is given by:
A spreadsheet was set up to calculate these volumes in relation to the parameters used to define rates of clogging and operational trigger points to manage clogging.
Table 4 shows, for one specific set of operational parameters, an example of the impact of various rates of acute and chronic clogging on the reduction in net volume injected, and in one case for the volume purged or redeveloped. It can be seen that, for low rates of acute clogging and the tested range of ratio of chronic to acute clogging, the volumetric reductions are similar. Once the rate of acute clogging rises above 0.5%/day there is an appreciable reduction in the volume of net recharge and this is accentuated for higher rates of chronic clogging.
An economic evaluation of the impact of clogging may be based on this hydraulic evaluation, where it is straightforward to add the costs of clogging rehabilitation to the costs of improving injectant water quality in a present value analysis.
7. Australian Field Research Data on Clogging of ASR Wells
A number of studies have been undertaken that assist in forming the prior assessment of the clogging rate for future ASR projects in siliceous aquifers. Lakey [
9] performed an injection trial with secondary treated effluent in a siliceous aquifer at Carrum in southeast Melbourne and irrecoverable clogging occurred quickly. Studies in a long term recycled water injection trial in a limestone aquifer at Bolivar in South Australia were performed using secondary treated sewage effluent that passed through aeration lagoons and a dissolved air flotation and filtration water recycling plant before injection. Clogging occurred early in the trial. Daily purging of the injection well was undertaken and, even so, chronic clogging occurred. A decline in hydraulic conductivity from an initial mean of 3 m/d occurred at an acute rate of up to 15% per day with a chronic decline of up to 2%/day (derived from Pavelic et al. [
10]). Those rates of clogging were unsustainable and would have made ASR uneconomical.
However, after trickling filters were replaced by an activated sludge process at the wastewater treatment plant, as part of a scheduled upgrade, the rate of clogging slowed and stopped, and on occasions chronic clogging was also reversed due to changes in water quality. Pavelic et al. [
10] analysed the variations in rates of clogging and unclogging in relation to changes in water quality and found conditions for three significant variables that if satisfied would prevent chronic clogging. These were: turbidity < 3 NTU (Nephelometric Turbidity Units), total nitrogen < 10 mg/L, and pH < 7.2. They also found that the ratio of chronic to acute clogging rates varied between 0.067 and 1.0, with a mean of 0.2.
The reason the Bolivar trial proceeded, despite the Carrum results, was due to a laboratory column study undertaken by Rinck-Pfeiffer et al. [
11] that demonstrated dissolution of carbonate could refresh the well-aquifer interface and suggested that purging alone may be sufficient to restore near-well hydraulic conductivity, for this nutrient-rich recharge water. Pavelic et al. [
12] explored many alternatives to managing clogging, including replicated trials of three different redevelopment regimes. They found that when water quality met the determined criteria, they could reduce the volumetric proportion of injected water purged from 17% to 1.7% with no apparent impact on clogging, and economic success was demonstrated [
13]. With further improved water quality, the purging interval could be expanded to more than a month, with no chronic clogging [
14] and purge water was of sufficient quality to enable recycling back into the injectant after settling in tanks.
Several Australian field trials of ASR in confined to semi-confined siliceous aquifers have been undertaken with monitoring of water quality and clogging. The results of four of these are reported here and in
Table 5. At Kingswood, South Australia, rainwater from a domestic roof was filtered in a 100 micron mesh filter before recharging a semi-confined alluvial sand and silt aquifer [
15]. At Urrbrae urban stormwater was harvested in a pond and filtered in a rapid sand filter before injecting into a fine-grained sand at a depth of 80 m. At Rossdale, Victoria, urban stormwater was harvested in a pond and given treatment with ultrafiltration and granular activated carbon filtration before injecting into a low permeability weathered fractured basalt aquifer (Dillon et al. [
5]; Page et al. [
3]).
At Rossdale, a trial injection was performed with drinking water from the mains water supply via a 5 μm filter, over a total period of 36 days and no clogging was observed. In the absence of other information the adopted target water quality parameters for treated stormwater quality were those of the mains water; turbidity (0.6 NTU); DOC (1.7 mg/L), and biodegradable dissolved organic carbon (BDOC) (0.2 mg/L). However the most advanced stormwater treatment deployed, ultrafiltration and granular activated carbon (GAC) filtration, was unable to reach this level of BDOC which, potentially, was the cause of the 0.6%/day chronic clogging observed in the field trial. An assessment of clogging of aquifer materials at this site, if reverse osmosis were to be used to treat stormwater, revealed that water of low ionic strength caused significant clay dispersion. This suggests that without increasing the ionic strength and reducing sodium adsorption ratio, RO permeate would cause clogging and potentially well collapse. In related studies it was found that the waste products of coagulation, flocculation, and filtration processes would not have been of acceptable quality for discharge to the sewer, so those treatment options were not pursued further.
Finally, at Werribee core samples were obtained and, for other sites, indicative aquifer particle size and mineralogy were determined from drilling fluid sampling. This is a very poor indicator of clogging potential, as was found at Urrbrae where gravel was found in the drilling fluid samples but the aquifer was found from a pumping test to have a mean hydraulic conductivity of 0.7 m·d
−1, and on development produced a significant amount of fine sand. An injection trial was also conducted at the Werribee site using recycled water after 20 micron filtration [
16].
The rate of clogging at each site was recorded in relation to the typical water quality injected (
Table 5). The rate of clogging so determined is the chronic rate of clogging, r
1, as defined earlier.
8. Australian Column Studies on Clogging of ASR Wells in Siliceous Aquifers
Summary results of two laboratory column studies by Page et al. [
17] and Barry et al. [
18] are presented here in
Table 6 and
Table 7. These each link basic information on siliceous porous media with water quality information where one water source was given several different treatments, and the rate of acute clogging observed for each. In these studies there was no flow reversal, nor any attempt to replicate the effect of well purging. The rates of clogging determined are, therefore, what was earlier termed the acute rate, r.
At the Menindee site it is expected that GAC filtration is required in order to prevent biological clogging. The field site is remote and while purging and purge water management would be automated, visits for maintenance or major redevelopment are likely to be very expensive.
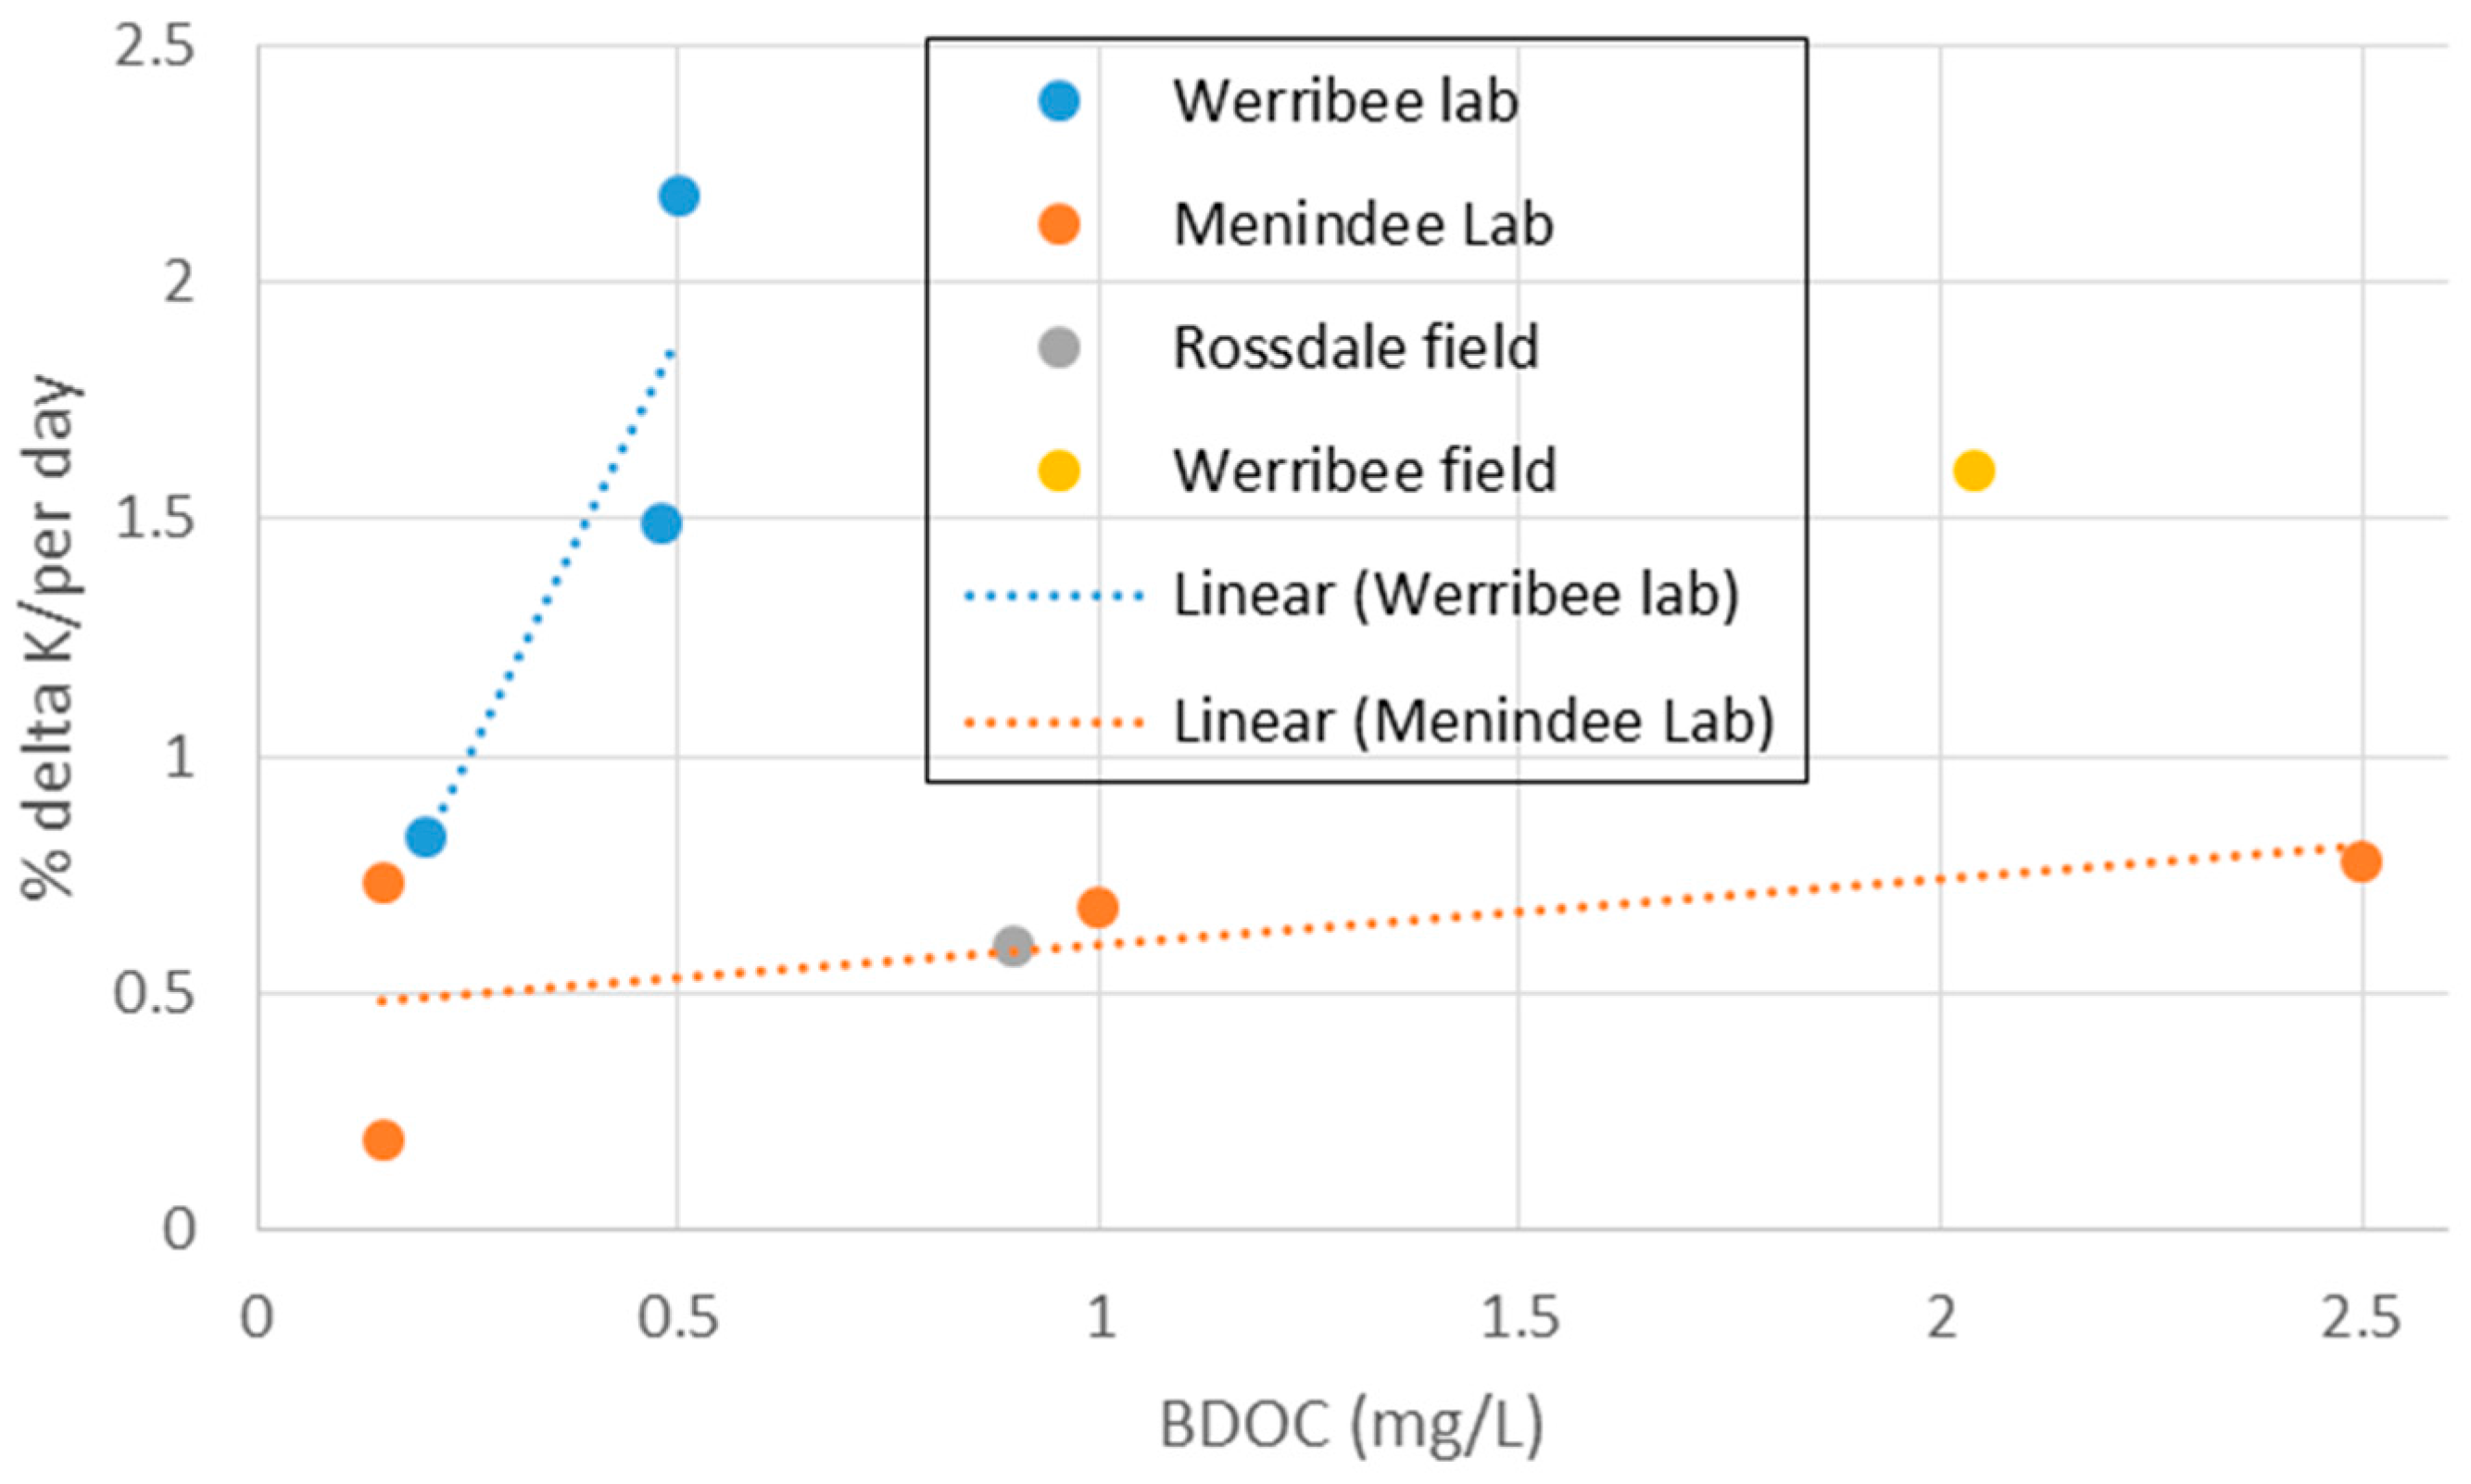
This lab study showed that even with a BDOC concentration of 0.2 mg/L in the Werribee formation aquifer material would result in an acute rate of clogging (0.83% ΔK/day) which is higher than the 0.6% chronic ΔK/day that had proved untenable at the Rossdale field site. In order to reduce clogging to a level likely to be manageable it is likely that BDOC would need to be reduced further. This may require superior contact time or sorbent properties than that of the small GAC reactor used for lab studies, or that the proportion of RO permeate be increased, but not to the extent that clay dispersion would be induced in the aquifer. While there are other factors that may potentially affect clogging at Werribee, the lab study with GAC-treated columns did not reveal deposition of iron or manganese, or other geochemical impacts, to suggest that biological clogging was not the dominant form of clogging. However there was evidence of manganese accumulation at the inlet end of columns with filtered water where concentrations at the inlet were an order of magnitude greater than along the column. It is noted that while the columns are representative of typical aquifer materials, the bulk of the flow will occur in the coarsest parts of the formation and that would be less affected by clogging. Hence, while results suggest caution, there will be no substitute for injection trials with the quality of water intended for recharge, and then different wells, even those with the same transmissivity, may have different clogging behaviour that depends on the presence and connectedness of preferential flow paths. At this ASR site, which is co-located with the water recycling plant, it is anticipated that maintenance costs could be more easily adsorbed than for the Menindee site.
9. Conclusions
Assembling data from
Table 5,
Table 6 and
Table 7 shows that lab studies have a range of clogging rates of r/q
0 from 0.2 to 2.2%/day and field trials had a range of r
1/q of 0.6–1.6%/day. Unfortunately there are no field and column studies at the same site that had the same source water quality. For the lab studies clogging rate appears to increase with the biodegradable dissolved organic carbon, but Werribee tests were more sensitive to BDOC than Menindee tests (
Figure 5), possibly due to a higher proportion of smaller sized particles and hence pore sizes. For the field trials chronic clogging of 0.6%/day was observed at Rossdale and 1.6%/day at Werribee. Experience at the field sites has shown that at 2%/day Urrbrae clogged so severely that the ASR operation became uneconomic. The Rossdale study showed a serious decline of permeability, even at 0.6%/day, suggesting that an advanced bore redevelopment would be required approximately annually in order to sustain operations.
The Werribee site observed a chronic clogging rate of 1.6%/day during the 19 day injection trial, suggesting that this clogging needs to be readily reversible by inexpensive purging operations in order to sustain economic operations. Lab studies would need to be designed for a reversible flow to replicate purging, and compared with field trials, to help ascribe appropriate confidence in the ability of column studies to predict chronic clogging. Aquifer heterogeneity will play an important role and multi-well injection sites with clogging rates observed over sustained periods in each well would help build a more quantitative approach for predicting clogging at such sites.
For each injection well at Werribee a posterior assessment of hydraulic and economic impacts of clogging will be undertaken from staged injection trials with the water quality selected by City West Water. This is expected to reveal more clearly the factors that may be better predictors of longer term hydraulic performance, and reveal the probabilities of false positives and false negatives which would engender value to a Bayesian analysis. The injection trials will also be valuable in assessing the operational parameters that mitigate clogging most economically.
Historically, clogging has been a serious impediment for many ASR operations due to inadequate attention to the issue, and to trial and error approaches. Unfortunately many successes and failures have been inadequately documented, so knowledge of rates of clogging, water quality, aquifer mineralogy, and particle size distribution is lacking. Reporting these parameters lays the foundations for future quantitative and probabilistic approaches. Coupling these with lab column experiments would also allow the predictive ability of these tests to be evaluated in a Bayesian context.
Trading off treatment and well rehabilitation has, in the past, biased outcomes to low-cost treatments and some acceptance of higher maintenance costs of ASR operations, simply as a means of deferring costs. The risk of economic failure of such systems is high, and the inconvenience of being forced to schedule well remediation at short notice would likely give ASR a bad name among operators. Doing appropriate investigations and making sound investments in treatment processes is a much surer pathway to the progress of ASR, and should be part of every guide to would-be ASR operators.
The simple calculations for loss in net recharge (
Table 3) rely on the assumption that all clogging is reversible. This is a simplification that is likely to underestimate clogging in the longer term. There would be value in researchers developing standardized laboratory test methods to evaluate unclogging by purging. This would then give a better indication of chronic clogging likely to occur in injection wells where column material is representative of the aquifer intersected by the well.


 ,
, 


