Article

Using the RESC Model and Diversity Indexes to Assess the Cross-Scale Water Resource Vulnerability and Spatial Heterogeneity in the Huai River Basin, China

1
School of Resource, Environment and Earth Science, Yunnan University, Kunming 650091, China
2
International Joint Research Center for Karstology, Yunnan University, Kunming 650091, China
3
State Key Laboratory of Water Resources and Hydropower Engineering Science, Wuhan University, Wuhan 430072, China
*
Authors to whom correspondence should be addressed.
Water 2016, 8(10), 431; https://doi.org/10.3390/w8100431
Submission received: 20 May 2016 / Revised: 3 August 2016 / Accepted: 31 August 2016 / Published: 30 September 2016
(This article belongs to the Special Issue Tackling Complex Water Problems in China under Changing Environment)

Abstract

:
Performing a multiscale assessment of water resource vulnerability on the basis of political boundaries and watersheds is necessary for adaptive water resources management. Using the Risk-Exposure-Sensitivity-Adaptability model (RESC model), the water resource vulnerability of the Huai River Basin was assessed using four scales, namely, Class II, Class III, Province-Class II, and Municipality-Class III WRR (Water Resources Region). Following this, the spatial heterogeneity of the vulnerability of the above four scales was evaluated with the Theil and the Shannon-Weaver index. The results demonstrate that, instead of moving towards convergence, water resource vulnerability presents different grades which change together with the change in scale, and in turn, tend to weaken from east to west. Of the four scales, the scale of Municipality-Class III WRR shows the most significant spatial diversity, whereas that of Class II WRR shows the least diversity. With spatial downscaling, the vulnerability demonstrates high spatial heterogeneity and diversity. Herein, an innovative cross-scales vulnerability assessment is proposed and the RESC model characteristics and uncertainties as well as the employment of cross-scale water resource vulnerability are discussed.

1. Introduction

Water resource vulnerability is an important topic at the forefront of hydrology and water resource research areas. In the late 1960s, as representative research on this topic, Albinet and Margat [1] proposed the concept of groundwater vulnerability. Other studies soon followed, focusing on such topics as the losses caused by water shortage [2], the degree of damage or adverse effects caused by climate change [3], water pressure [4], the ratio of water intake to water availability [5], freshwater criticality [6], and the propensity or predisposition that is adversely affected by diverse historical, social, economic, political, cultural, institutional, natural resource, and environmental conditions and processes [7] among others. Determining water resource vulnerability is important as it not only affects the actual capacity to protect water resources but also has an important influence on other related systems.
Vulnerability assessment results are very important for water resource utilization and management [8]. However, facing the uncertainty scale or principle [9,10], identifying the appropriate scale or the vulnerability pattern for the water resource management requirement is important. Just as the landscape pattern is spatially correlated and scale-dependent [11], understanding the structure and functioning of water resource vulnerability requires multiscale information. On a global, basin, and on administrative regional scales, vulnerability was examined in previous studies. In fact, water resource vulnerability at the global scale was predicted [6,8]. Moreover, Barry introduced a comprehensive vulnerability indicator to assess vulnerability at the national, regional, and public scales [12]. Issues on water resource vulnerability in China, one of the 13 countries in the world that experience water scarcity [13], was addressed in many previous studies. In the future, the frequency of droughts, floods, and other disasters could increase, exacerbating water resource vulnerability, which in turn, can lead to a severe supply-and-demand situation in the country. Water resource regions or watersheds, such as the Hai River [13], are chosen frequently as study areas to assess vulnerability, and administrative districts, such as Chinese cities, are also common as seen in many previous studies [14]. In addition, the vulnerability of typical areas, such as Northwest China [15], has also been examined. To capture the vulnerability of the water resources system, different types of scales must be considered, such as a scale representing the subsystem of physical water resources, a scale representing the social subsystem, and if necessary, an additional scale that features the temporal and administrative aspects of management [16].
Vulnerability assessment is not straightforward because there is no universally accepted concept for vulnerability [17]. Thus, the different assessment approaches can be grouped into three categories: (1) an index obtained by aggregating many vulnerability components with equal/unequal weights given to the parameters [14,17]; (2) a single and simple index [2,4,5,8,12]; and (3) an index integrated with many parameters based on the physical process [13]. Scaling functions are the most precise and concise way in which multiscale characteristics can be accurately quantified [11]. Meanwhile, many other approaches have been employed in studies that examine scaling relations [11,13,18,19,20].
The Huai River Basin only accounts for approximately 2.9% of the total water resource in China, while supporting a population comprising approximately 12.5% of China, approximately 7.6% of the added value of industrial production, and 19.3% of the total agricultural output; hence, this region is considered one of the most vulnerable basins in China [21]. Basin commissions and administrative institutes are tasked to manage the limited water resources effectively, and the functions and legal responsibilities are defined by China’s Water Law, which was amended in 2002 [22]. These basin commissions have been given greater authority in the allocation and centralized control of all diversion projects [23]. Understanding the spatio-temporal variation and the potential source of water pollution could greatly improve our knowledge of the impacts of human activities on the environment [24]. However, the administration of water resources management is largely based on political boundaries rather than on watersheds [25]. Either from the implementing authority or from special geographical stations with water supply ability, performing multiscale vulnerability assessment based on political boundaries and watersheds is necessary.
For the Huai River Basin, assessment results from the basin scales, especially multiscale vulnerability assessments based on political boundaries and watersheds, have not yet been published. Therefore, some questions about the Huai River Basin remain unanswered: Is the vulnerability high in the Huai River Basin? How is the vulnerability distributed in the different scales? What are the differences between the multiscale vulnerability assessment results? Accordingly, in this paper, multiscale vulnerability was assessed on the following scales: basin, sub-basin, combined political boundary and watershed, as well as combined municipality boundary and watershed scales using an improved vulnerability assessment method. Then the spatial heterogeneity of the vulnerability in the Huai River Basin was assessed by using the derived quantitative evaluation indexes.

2. Materials and Methods
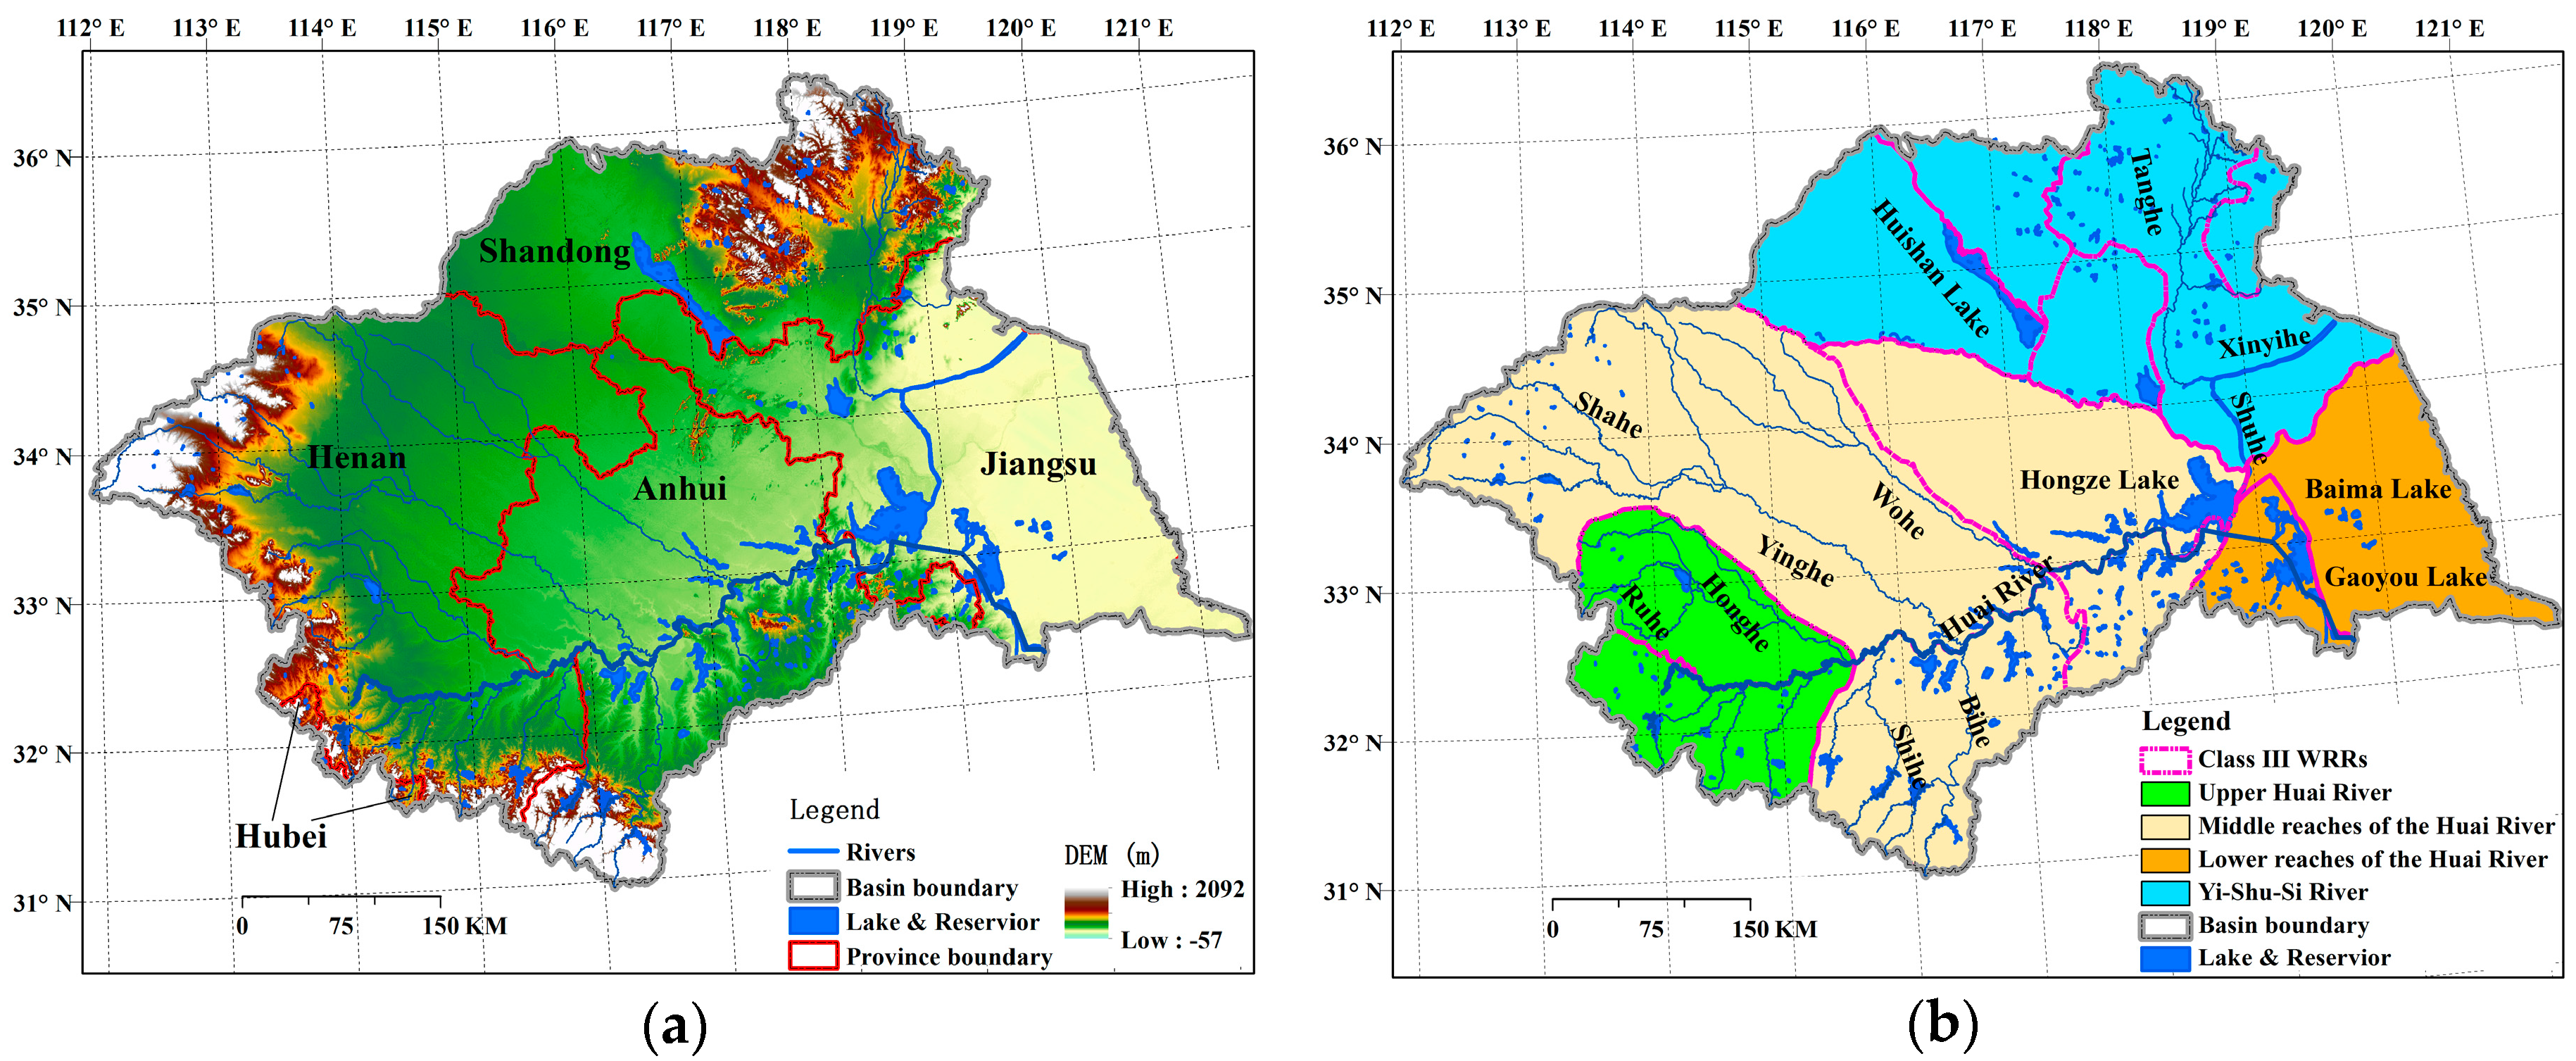
2.1. Study Area

The Huai River Basin (30°58′–36°20′ N, 111°55′–121°45′ E) is situated in the northern part of China and is composed of Shandong (SD), Henan (HN), Hubei (HB), Anhui (AH), and Jiangsu (JS) province (Figure 1a). The basin has an elevation of 0 m–2155 m. The mountain areas are distributed throughout the eastern, southern, and north-eastern areas of the Basin, whereas the central and eastern parts of the Basin are plain areas. The main rivers in this basin are the Shahe, Yinghe, Wohe, New Yihe, and Yihe (Figure 1b).
The Huai River Basin is a first-class water resources region (Class I WRR). Class III WRRs are generated in consideration of the convenience of water analysis and calculation. Meanwhile, Class II WRR is the union of all the sub-basins next to each other and shares similar development characteristics and utilization of water resources as in the Class III WRRs. The total area of the Huai River Basin is approximately 2.69 × 10⁵ km2 and includes four Class II WRRs. These four Class II WRRs are the Upper Huai River (UHR), Middle reaches of the Huai River (MHR), Lower reaches of the Huai River (LHR), and Yi-Shu-Si River (YSSR) (Figure 1b), which account for 11.4%, 47.9%, 11.4%, and 29.3% of the total area of the Huai River Basin, respectively. The average water resource of this basin is approximately 7.99 × 10¹⁰ m3/year, comprising just 2.9% of the total water resources in China. However, this basin supplies water for 12.5% of the national population and contributes to 7.6% of the industrial production in China. The amount of water resources in the UHR and MHR is enough to cover the demand. Additional details are presented in Table 1.

2.2. Data

We obtained monitoring data of surface water capacity, water resource quantity, average water resource quantity, water consumption, gross domestic product (GDP), and the population based on Class II WRRs, Class III WRRs, Province-Class II WRRs, and Municipality-Class III WRRs from the Huai River Water Resources Bulletin and the Integrated Planning of Water Resources in Huai River Basin. The average temperature and precipitation from 1961 to 2006 on the scale of 0.5° × 0.5° were calculated by using the method from the China Meteorological Administration [26,27] and the gauge observations from over 751 stations, which are maintained according to standard methods by the China Meteorological Administration.

2.3. Methodology

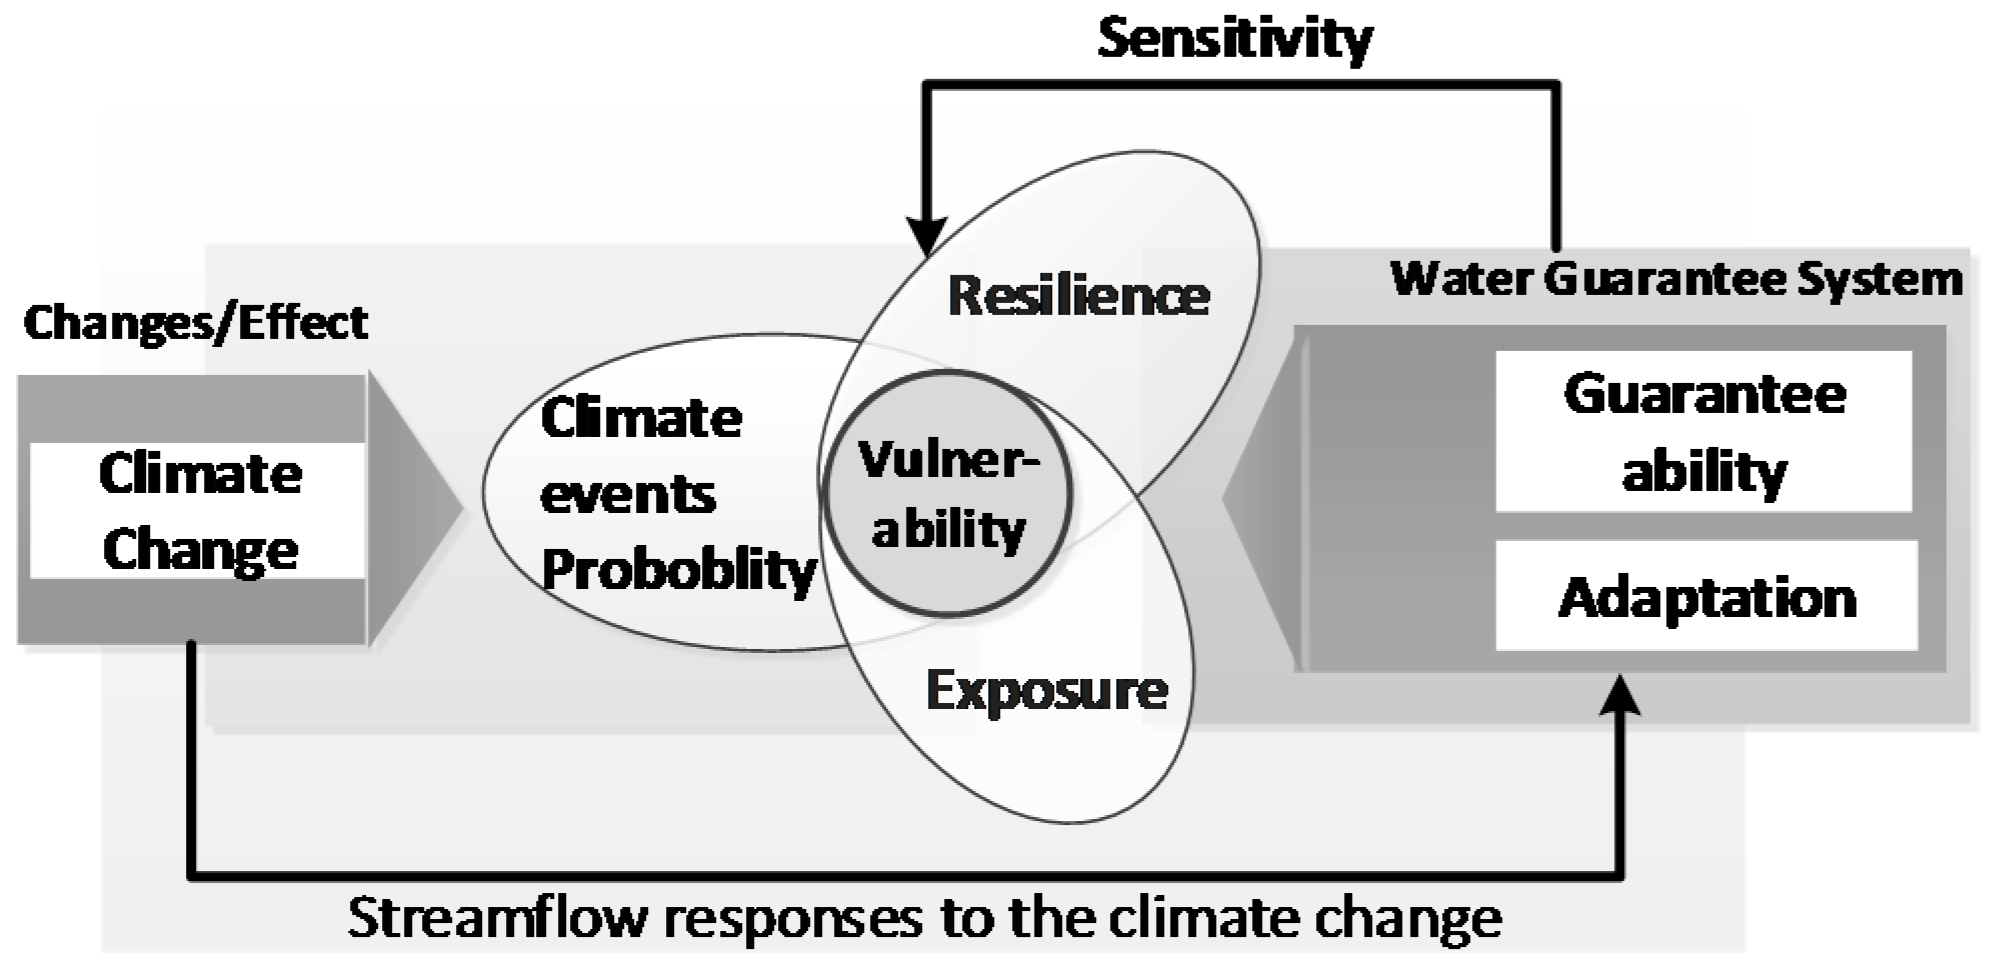
2.3.1. Assessment of the Sensitivity and Water Resource Vulnerability Based on the RESC Model

Many studies have focused on the assessment of water resource vulnerability. The connotation based on the early studies shows that vulnerability is a function of water pressure [4], the ratio of water intake to water availability [5], the loss or damage caused by water shortage [2] or climate change [3], and the propensity or predisposition that is adversely affected by other factors [7], etc. Hence, the main methods to assess the vulnerability are the single index or a set of indexes. However, water resource vulnerability is not only affected by the actual capacity of the water resources system, but also by other related systems. Therefore, given that the traditional or previous approach has been unable to examine the physical mechanism and interaction of water with society, a more accurate method and an assessment approach are required.
Based on discussions concerning the vulnerability connotation, several problems were identified in examining water resource vulnerability. These problems include the uncertain physical mechanism resulting in water resource vulnerability, the outdated research method, and the uncovered interaction mechanism between vulnerability and adaptive management. According to the Special Report on Managing the Risks of Extreme Events and Disasters to Advance Climate Change Adaptation (SREX), the vulnerability could be linked with the water stress indicator with adaptation/resilience (C(t)), climate change or climate events, Exposure(E(t)) and risk (R(t)) [7]. The assessment concerns an examination of the interactions among climatic, environmental, and human factors that can lead to impacts and disasters, and an exploration of options for managing the risks posed by such impacts and disasters.
The current paper addresses issues on water resource vulnerability and provides a vulnerability assessment model based on vulnerability connotation. The nature and severity of impacts brought about by climate change depend not only on the changes themselves but also on exposure and resilience (adaptation). In this study, the adverse impacts of water scarcity under climate change are considered, especially when they produce widespread damage and cause severe alterations in the normal functioning of communities or societies. Vulnerability is influenced by a wide range of factors, including the probability of natural disasters, exposure, resilience, and sensitivity (Figure 2). Vulnerability is used to evaluate the influence of natural climate change, which can contribute to the water guarantee system, as well as the exposure and adaptation of human society and natural ecosystems to the impact of changes. Adaptation to climate change can reduce exposure and vulnerability to climate change as well as increase resilience to the risks that cannot be eliminated.
Vulnerability is expressed as a function of disaster risk RI(t), drought exposure E(t), sensitivity S(t), and adaptability C(t) of the water resource system in this paper. And the assessment approach that is linked with RI(t), (E(t)), C(t), and S(t) is named as the Risk-Exposure-Sensitivity-Adaptability model (RESC model). This is expressed as
V ( t ) = ( S ( t ) β 1 C ( t ) β 2 ) ( E ( t ) ) β 3 ( R I ( t ) ) β 4 ,
where V(t) is the water resource vulnerability at time t; RI(t), E(t), S(t), and C(t) are the disaster risk, drought exposure, sensitivity, and adaptability of the water system at time t, respectively; RI(t) is the probability of drought disaster; E(t) is a factor integrating the drought tendency and its influence on people and economic behaviors; and C(t) is related to adaptation strategies, including integrated management levels, socioeconomic capacity and the scientific technical knowledge required to handle water issues. In addition, S(t) indicates the sensitivity of the water system to climate change, β1, β2, β3 and β4 represent the assembled parameters of S(t), C(t), E(t), and RI(t) respectively.
The sensitivity of the water system to climate change can be measured using many methods [28]. Here a revised two-parameter climate elasticity of stream flow index (eP,ΔT) proposed by Chen et al. [29] based on Fu’s index [28] is employed. The equation is expressed as
e P , Δ T = d R P , Δ T / R m ¯ d P P , Δ T / P ¯ ,
where RP,ΔT is the stream flow; PP,ΔT is the precipitation under temperature change; P ¯ , T ¯ , and R m ¯ represent the average precipitation, temperature, and prediction of stream flow, respectively; and dRP,ΔT refers to the average change in runoff with precipitation and temperature change.
When the long-term hydrology situation was considered, a runoff function based on water balance could be employed to estimate the mean annual runoff (Rm) to P and T [29,30]. This function is given by
R m = P × exp ( E P P ) .
As in earlier studies, when future climate conditions fall within the climate range condition of the historical data, dRP,ΔT can be obtained from the stream flow-precipitation-temperature interpolated surface [28]. However, the prediction based on historical records is not so reliable because the future climate condition is beyond the historical range by taking account of climate change aggravated by human activities, e.g., greenhouse gas emission and growing population [30]. Hence, following the method presented by Fu et al. the Gardner function, described below, is employed to calculate dRP,ΔT
d R P , Δ T = exp ( E P P ) × ( 1 + E P P ) × d P   [ 5544 × 10 10 × exp ( E P P ) × exp ( 4620 T k ) × T k 2 ] × d T k ,
where EP, TK, dP, and dTK are the mean annual potential evapotranspiration (mm), the temperature in Kelvin, and the changes in precipitation and temperature, respectively. As previously presented by Holland [30], the method to calculate EP only needs the mean annual temperature, and is given by
E P = 1.2 × 10 10 × exp ( 4620 / T k ) .
Here, elasticity presents the sensitivity of the water system to climate change. As the rate range is (∞, +∞), we need to convert the range of eP,Δt into [0,1] for comparison with the following equation:
S ( t ) = {   1 exp ( e P , Δ t ) e P , Δ t 0   1 exp ( e P , Δ t ) e P , Δ t < 0 .
Water adaptability is recognized as the ability to face water resource stress, and is a function of integrated socio-economic capacity as well as scientific, technical and management levels. C(t) can be determined by using the links between population (PH) driven by water stress or ”water crowding“ (PH/Q: population per water unit), water-use driven mobilization level (r: use-to-availability as a percentage of water availability), and per capita available water resources ((QQE)μ/PH: available water resources in cubic meters per capita per year). Hence, C(t) can be calculated using the equation
C ( t ) = C { r , P H Q , Q μ P H } = exp ( 2.3 × r ) exp ( P H Q × ( Q Q E ) μ P H ) = exp ( 2.3 × r + P H Q × ( Q Q E ) μ P H ) ,
where QE is the ecological water demand for the ecological system, μ is the criterion compliance rate that can be calculated with the ratio of river length to water quality required for all the river length. Meanwhile, the per capita water use (W/PH: water intake in cubic meters per capita per year) in Xia’s research is enhanced with the per capita available water resources in this manuscript.
The probability of drought disaster (RI(t)) is the measure of the likelihood that water scarcity will occur, and is quantified as a number between 0 and 1 (where 0 indicates impossibility and 1 indicates certainty). The higher the probability of the disaster risk, the more certain we are that water scarcity will occur. This also refers to the likelihood over a specified time period of severe alterations in the normal functioning of a community or a society as a result of hazardous physical events interacting with vulnerable social conditions, thereby leading to widespread adverse human, material, economic, or environmental effects that require immediate emergency response to satisfy critical human needs [7]. However, this paper only takes the disaster risk as the probability that is numerically described by the number of water scarcity outcomes divided by the total number of all outcomes as expressed by
R I ( t ) = P ( X i F ) = m n × 100 % ,
where P(Xi) is probability, Xi is the drought disaster, F is the set of drought disaster, m is the number of drought disaster outcomes and n is the total years of statistics.
Exposure refers to the presence (location) of people, livelihood, environmental services and resources, infrastructure, or economic, social, or cultural assets in places that could be adversely affected by physical events, which may be subject to potential future harm, loss, or damage [7]. This definition subsumes environment, resources, human welfare, security, and economical services. Here, we subsume the component of exposure under drought disaster, and define the people (Ph), gross domestic product (GDP), and the area (A) suffering the drought damage (DI). Other relevant and important interpretations and uses of exposure are not discussed here. Exposure is calculated using the equation
E ( t ) = ( 1 e x p ( P h × G D P A ) ) × D I ,
where D I is the trend of drought and its spatial extent.
In the RESC model, the parameters can be calculated by using Equations (2)–(9), respectively. However, this is insufficient for the vulnerability calculation as the assemble parameters are not settled. Here, we model the values of β1, β2, β3 and β4 by using the regression method. We define the threshold values for water crowding as follows: 1000 persons/(million·year) represents the state of water scarcity, 501–1000 persons/(million·years) represents the state of water stress, 101–500 persons/(million·years) represents a condition under water management problems, and less than 100 persons/(million·years) represents the state of water surplus [31]. Then, we set water use to 20%, 40%, and 70% of water availability as weak, mid-rate, strong development states, respectively. According to normal knowledge, the vulnerability in the 1960s was not fragile, and only became so in the 1980s. Thus, we set 0.1, 0.4 as the vulnerability background value. Then, we set the vulnerability of the Yangtze under a similar climate condition for comparison. In the end, the values of β1, β2, β3 and β4 are modeled as 0.4292, 0.5761, 0.279 and 0.13 respectively.
Water resource vulnerability can be graded into five groups to judge the quality, and the given grades indicate how good or bad it is. In this manuscript, I, II, III, IV, and V are used to indicate not fragile, weakly fragile, moderate fragile, strongly fragile, and extremely fragile conditions, respectively. Additionally, Class III is classified further into three subclasses to obtain more information. The grades of water resource vulnerability are shown in Table 2 below.

2.3.2. Heterogeneity Assessment of Water Resource Vulnerability

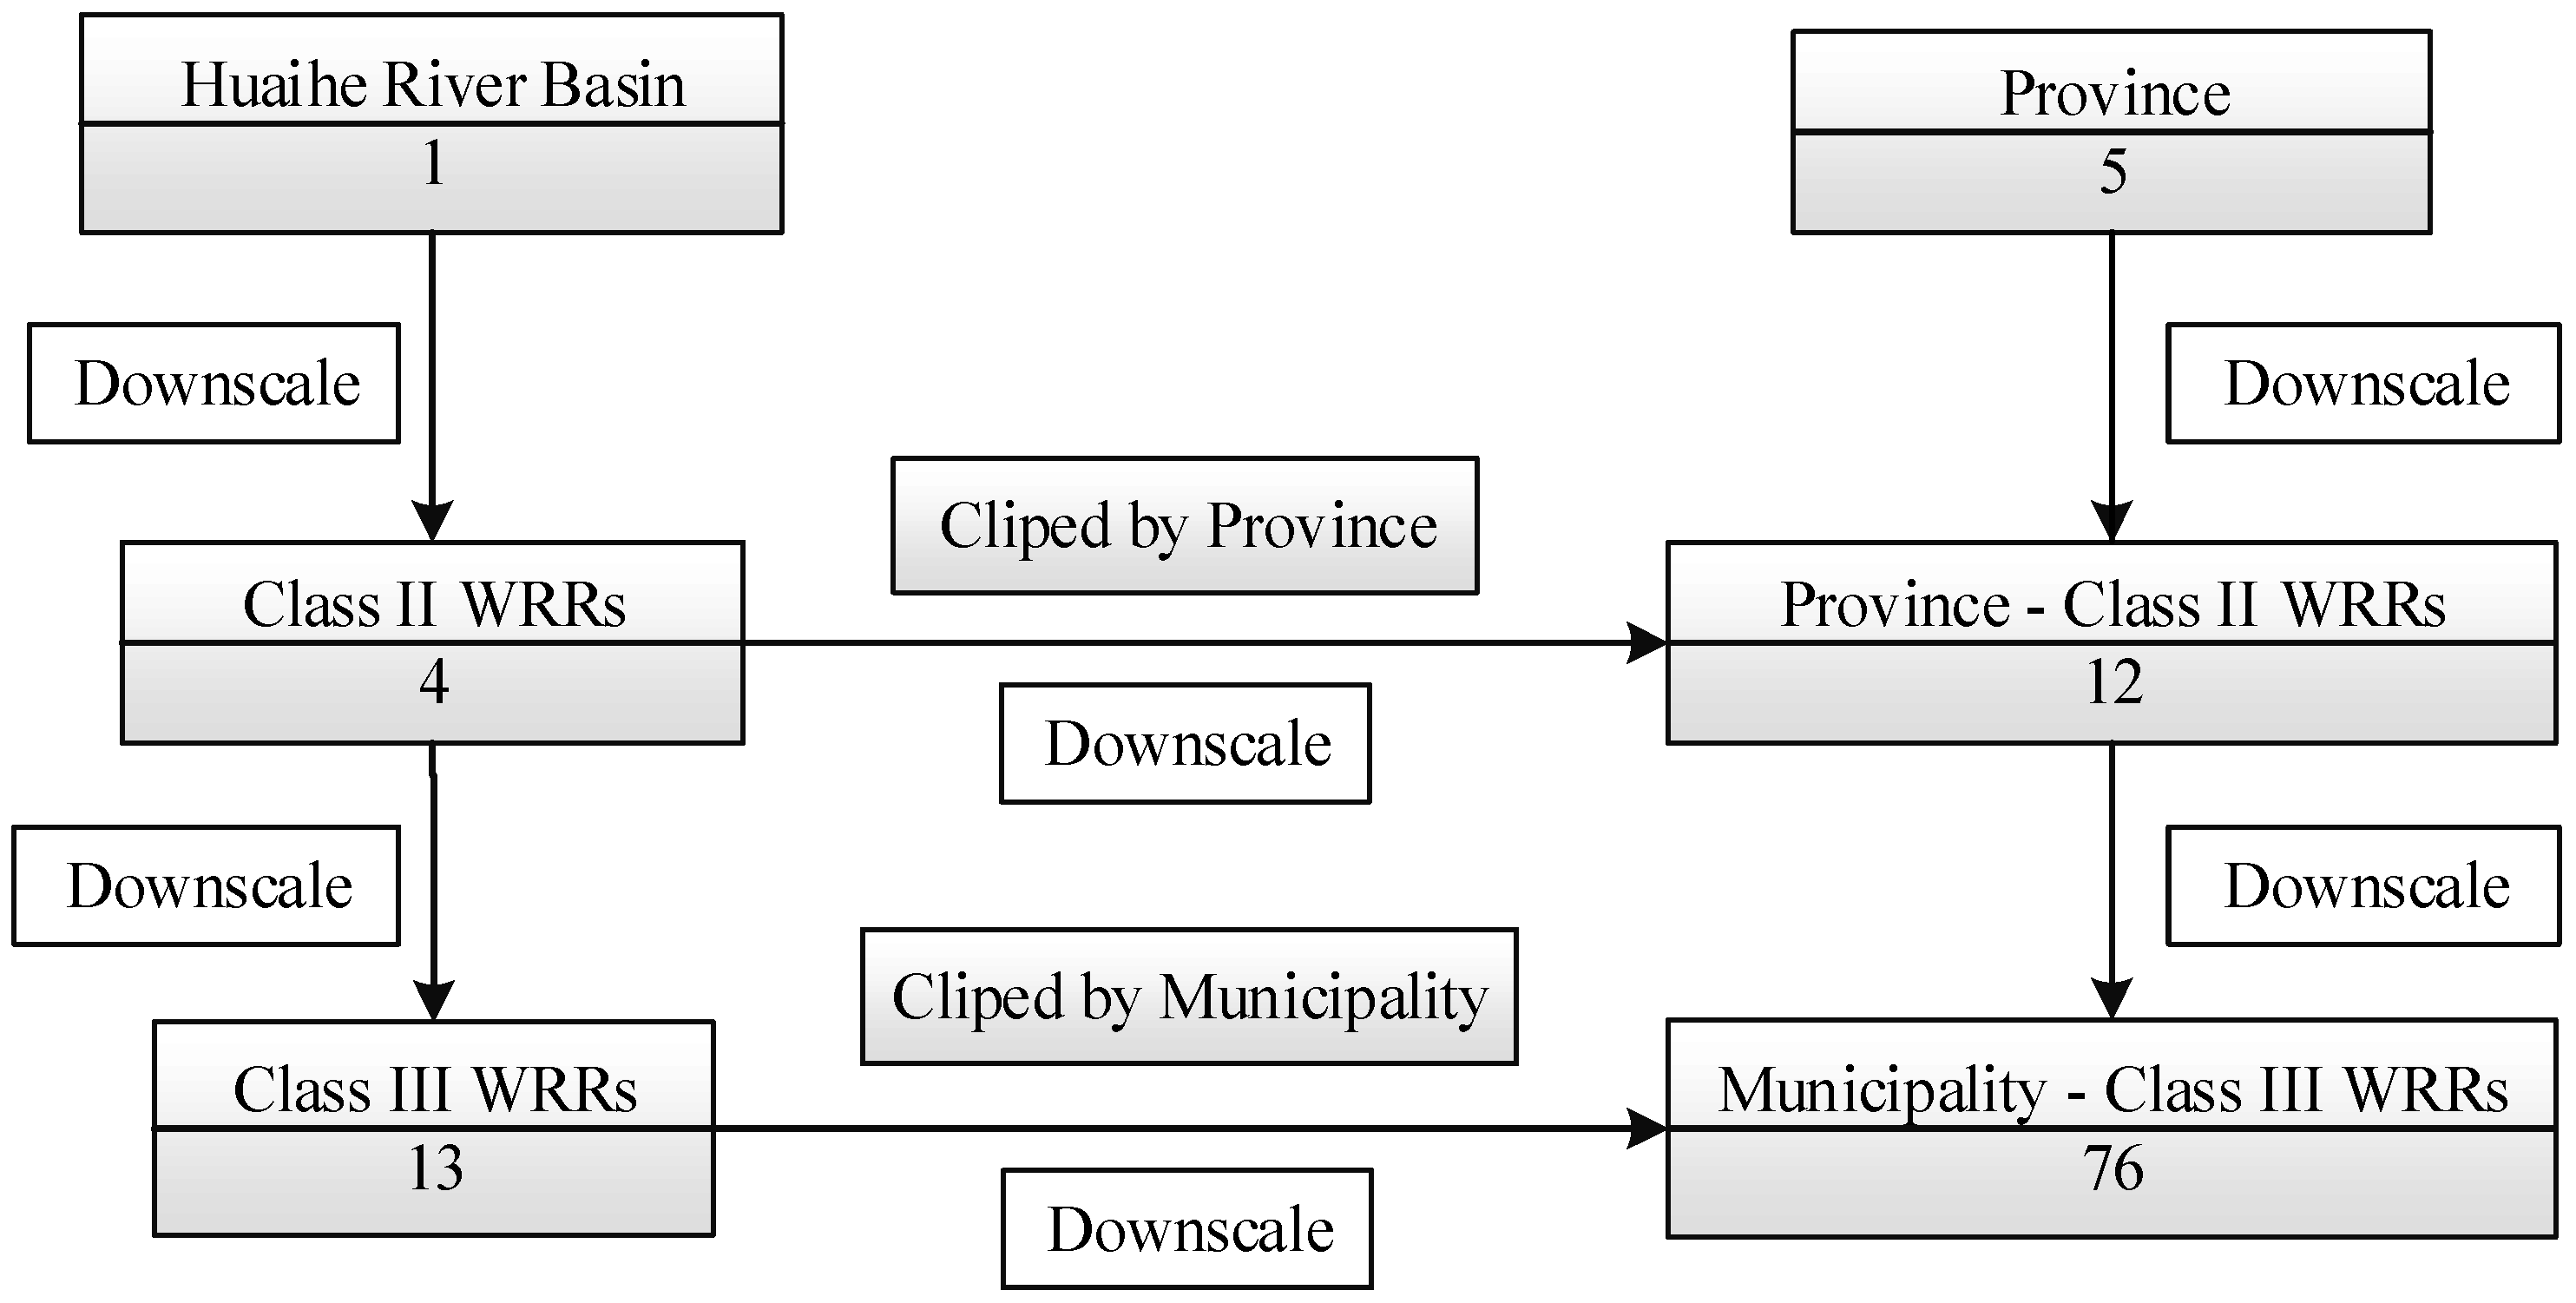
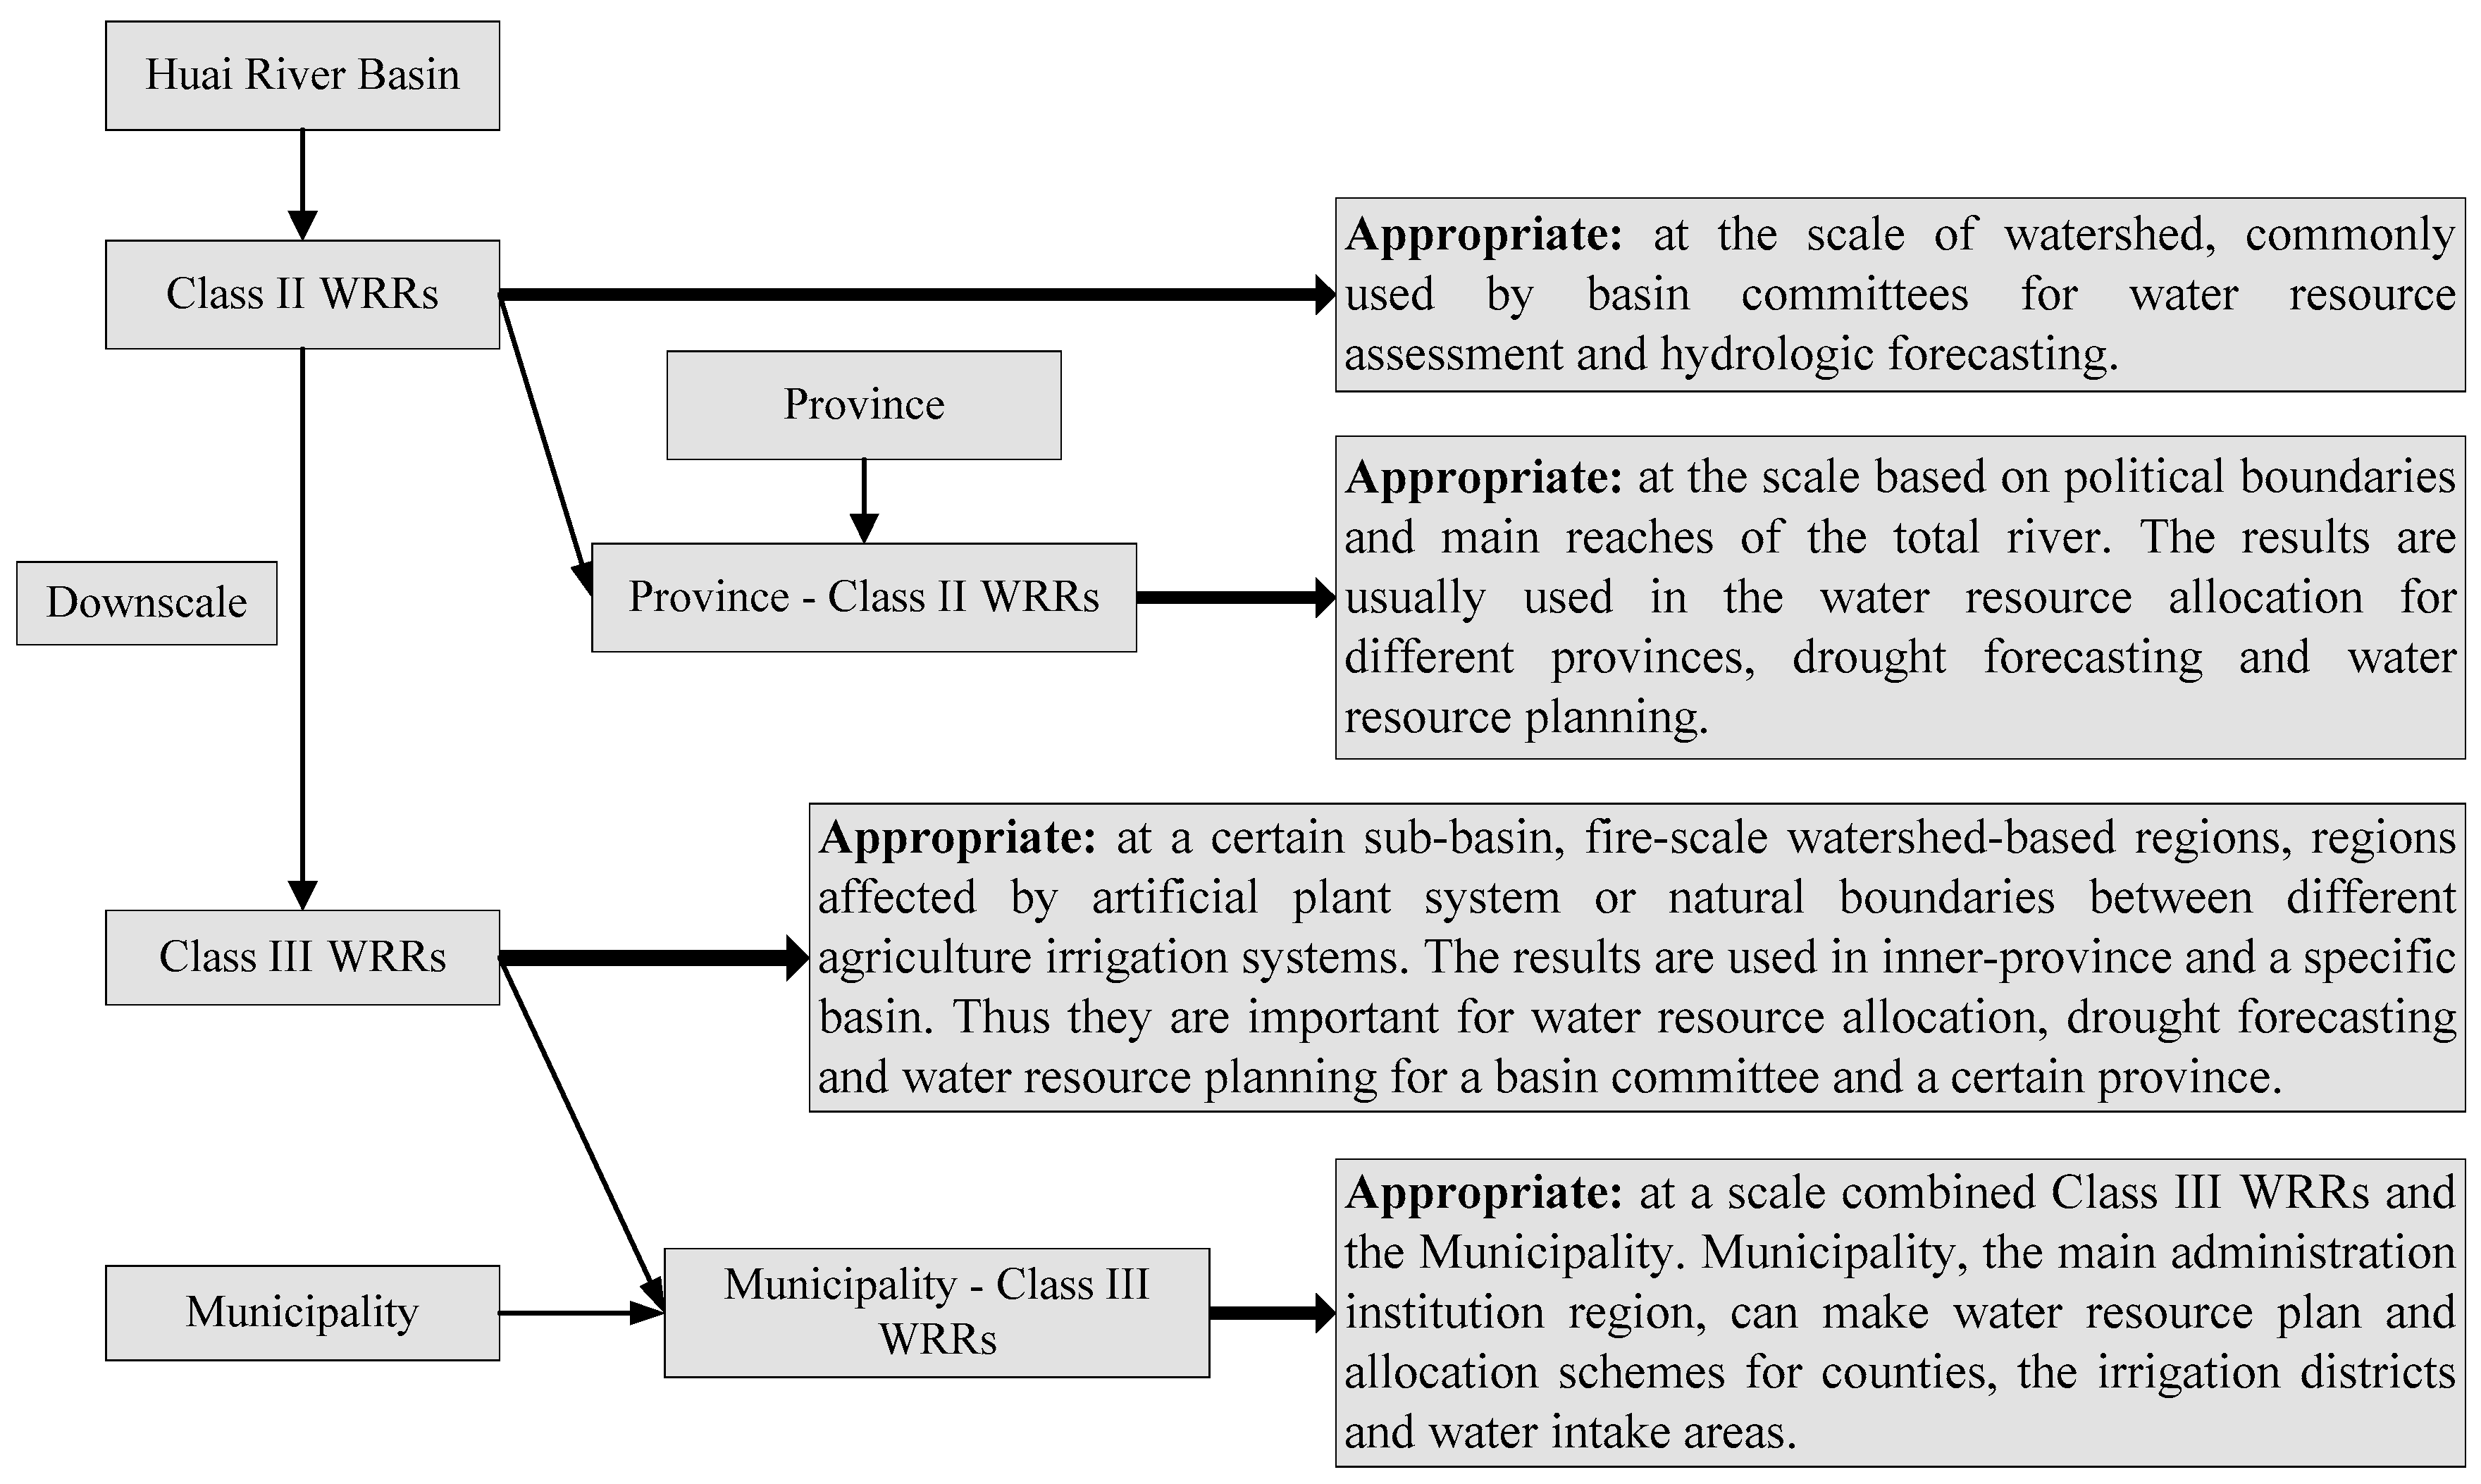
Multiscale Design Study

Multiscale assessment addresses challenges coming from multiscale phenomena across the organizational, temporal, and spatial scales. In this manuscript, water resource vulnerability in the Huai River Basin was assessed from physical system boundaries and complex man-made system boundaries.
  • Water Resources Regions (WRRs): They contain different classes, essentially considered as river basins or groups of basins, and were most commonly used as large-scale watershed-based regions in past studies. In this paper, the WRR mainly refers to the Class I WRRs: the Huai River Basin.
  • Class II WRRs: These comprise a naturally defined system under the scale of Class I WRRs, and commonly present the upper, middle, lower, and the main branch of the total basin. Class II WRRs are either large river basins or contiguous smaller basins with common characteristics.
  • Class III WRRs: These are used as fine-scale watershed-based regions that are affected by artificial plant systems or natural boundaries between different agriculture irrigation systems, which change the storage and through-put of the surface flow.
In this study, the sub-basin below the total basin, such as Class II and Class III WRRs, was selected. In addition, the across spatial scales, such as Province-Class II WRR and Municipality-Class III WRR scales, which are produced by using the province and municipality boundaries to clip Class II WRR and Class III WRR boundaries, respectively, were chosen as the scales for vulnerability assessment. Finally, 4 Class II WRR units, 13 Class III WRR units, 12 Province-Class II WRR units, and 76 Municipality-Class III WRR units are presented for the water resource vulnerability assessment and heterogeneity analysis (Figure 3).

Quantification of Heterogeneity

Except for the digital map, quantitative methods (e.g., the Theil index and the Shannon-Weaver index) have been reported as appropriate tools to measure spatial differences [13]. In this study, the Theil index below is used to analyze spatial differences in multiscale water resource vulnerability
T h e i l   =   i = 1 n V i ln V i d i ,
where n is the basin/area partition number, Vi is the share of the ith partition in the basin/area, and di is the share of the ith partition in the total basin/area.
The Shannon-Weaver index has been proven to efficiently assess the diversity of vulnerability (H) [13] employed in this study
H = j = 1 m V j ln V j .

3. Results

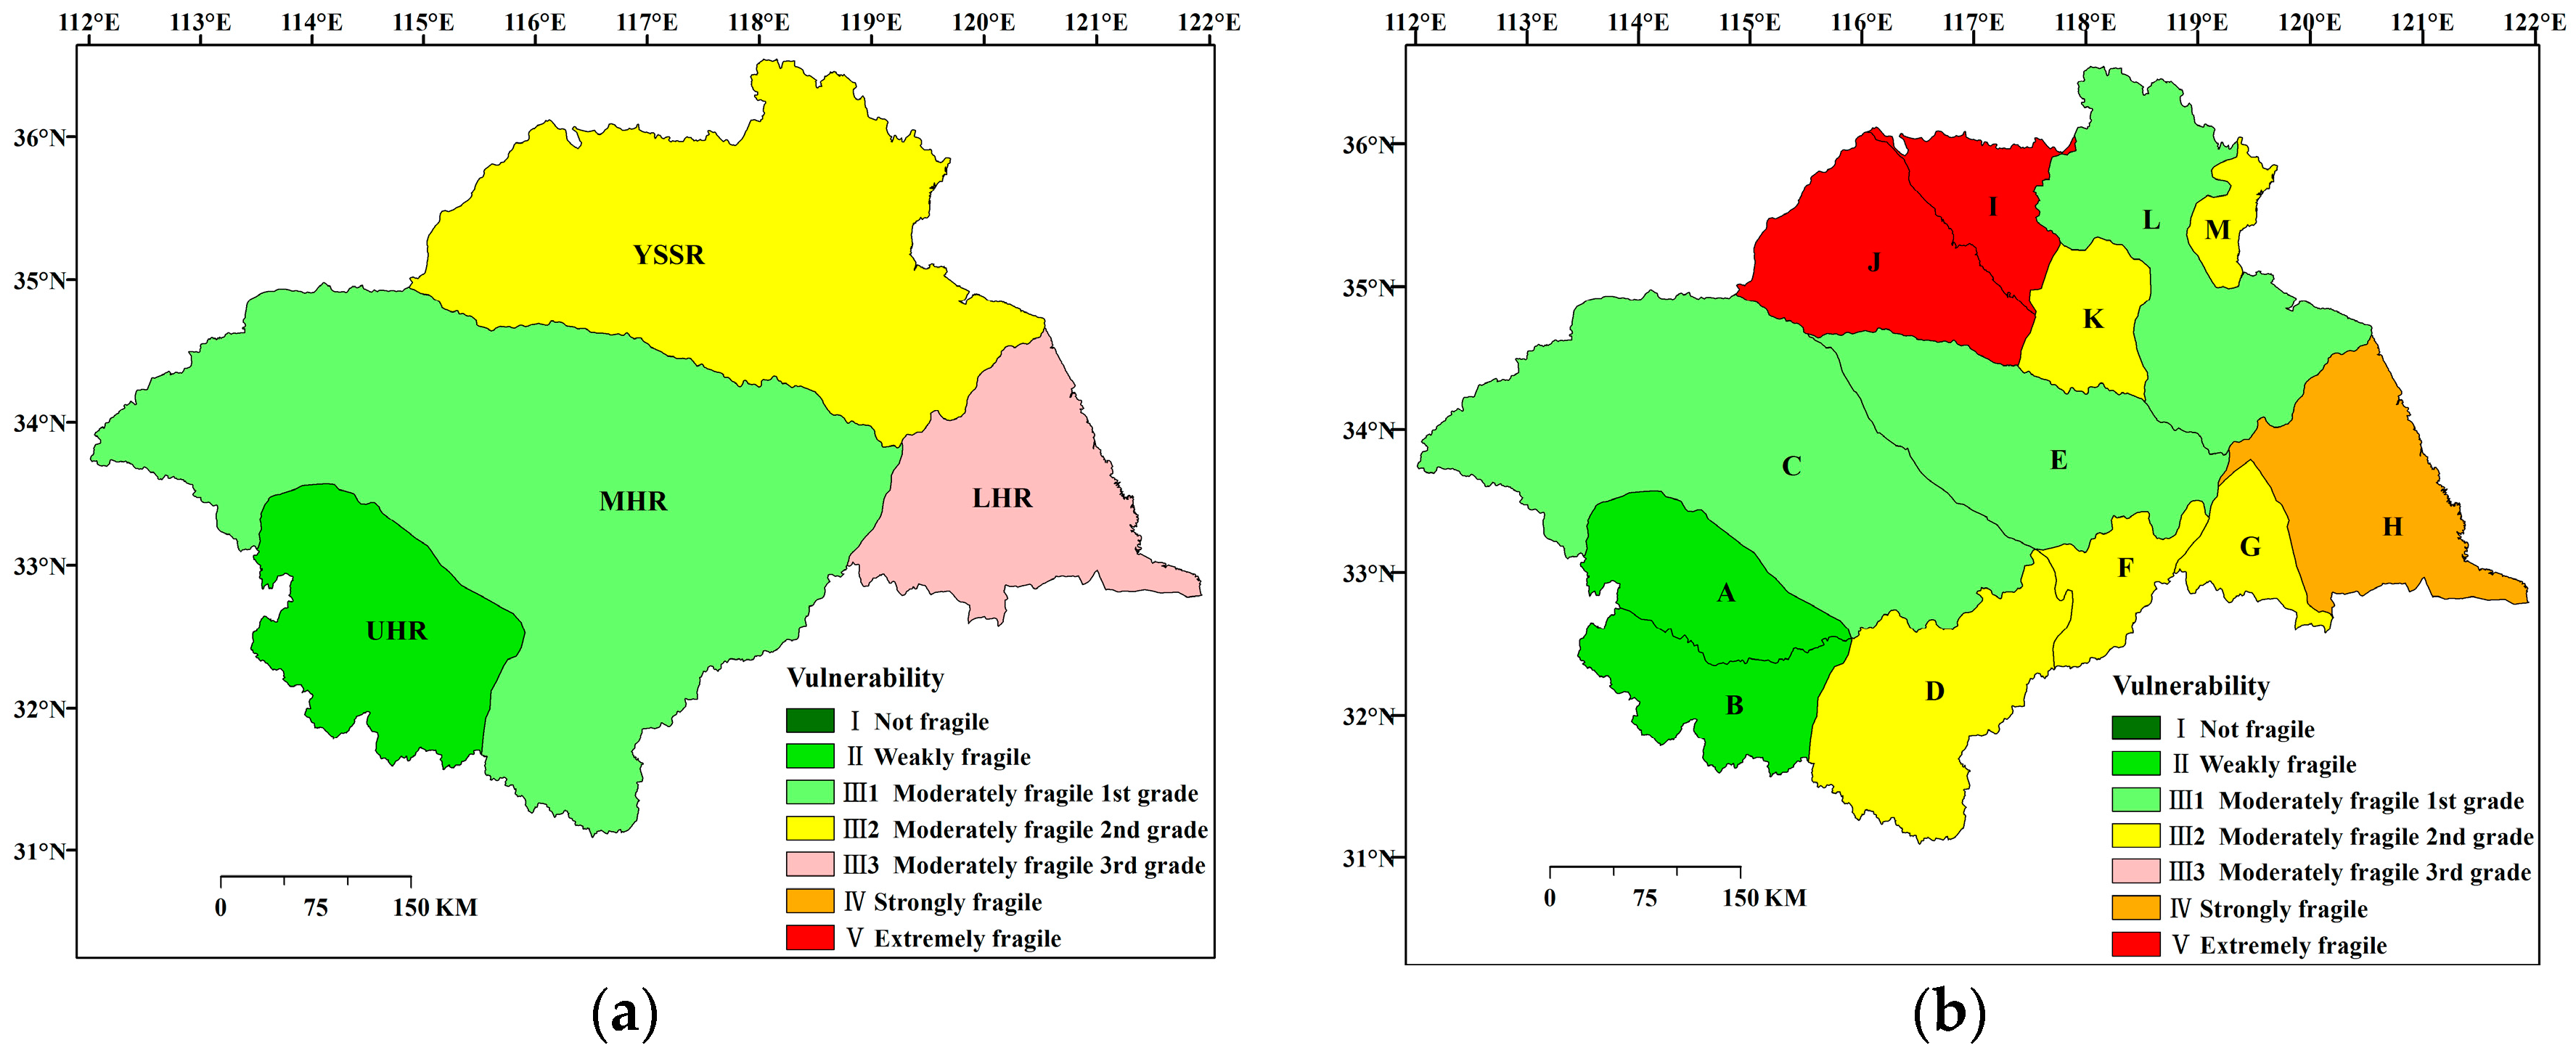
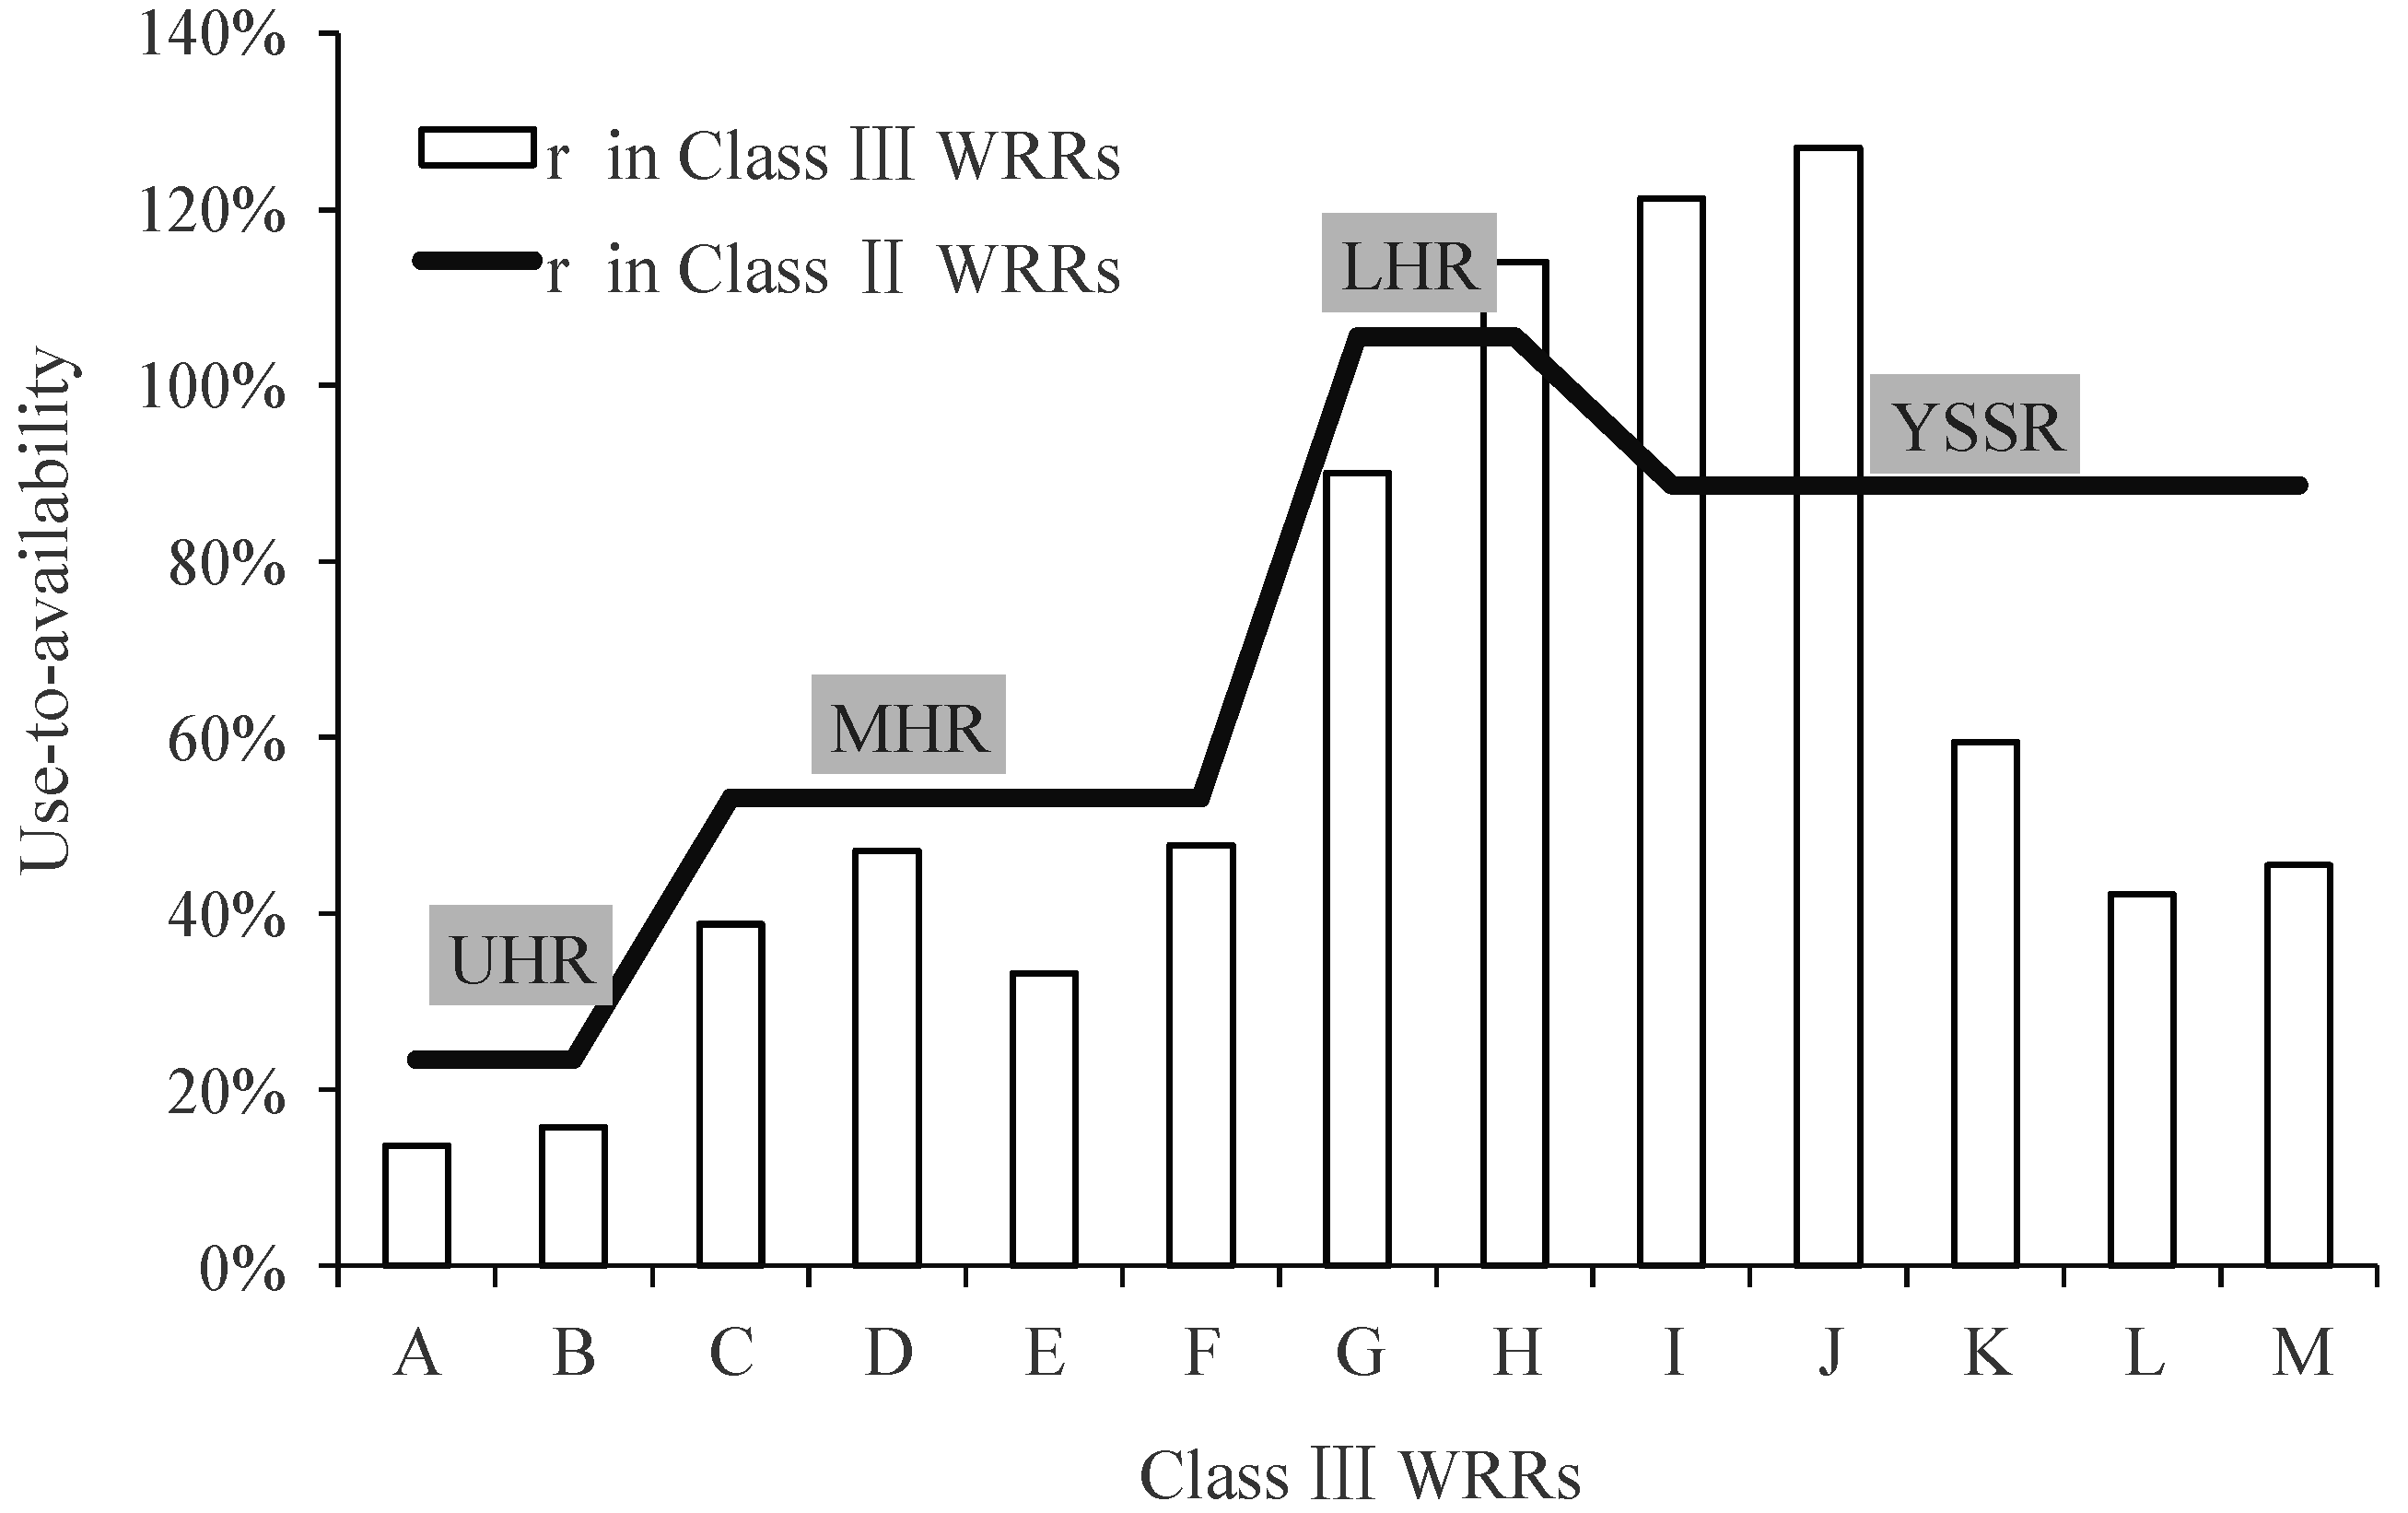
3.1. Water Resource Vulnerability of Class II and Class III WRRs

Water resource vulnerability of the Class II WRRs (Figure 4a) and Class III WRRs (Figure 4b) are calculated based on the data obtained on the average water resource quantity, precipitation, and temperature recorded from 1956 to 2000. At the Class II WRR scale, water resource vulnerability increases from the west to the east; the vulnerability of the UHR is lower than that of MHR, which in turn is lower than that of YSSR. The LHR River is the most vulnerable among the four WRRS. The vulnerability of Class III WRRs is obviously different from that of Class II WRRs. Five vulnerability grades are included in the Class III WRR scale, two more than the number of vulnerability classes of the Class II WRR scale (Figure 4). Meanwhile, the vulnerability of the Class III WRR scale spans from II–IV, two grades more than that of Class II WRR scale. At the Class II WRR scale, the units of MHR, YSSR, and LHR face a serious vulnerability situation. This is inaccurate and not intuitive; thus, it cannot be used for water management. However, the vulnerability distribution from the west to the east at the Class II WRR scale is still evident at the Class III WRR scale. Thus, Figure 4b is more useful than the Class II WRR results as the former shows the extremely vulnerable areas, namely, I and J. Moreover, some moderately fragile 2nd grade areas are separated from the moderately fragile 1st grade areas at the Class II WRR scale, such as D and F.
One of the main reasons for water resource vulnerability is the deficit of water supply in different WRRs. As shown in UHR, low use-to-availability indicates conditions of more sufficient water supply and low water shortage; thus, water resource vulnerability is lower than the others. At the Class II WRR scale, the water supply pressure (water consumption/water resources quantity) is highest in the LHR, that of MHR is lower than that of YSSR, and that of UHR is the lowest (Figure 5, Table 1); hence, the vulnerability sequence of these Class III WRRs is the same as with the water supply pressure. At the Class III WRR scale, the mountain areas are distinguished from the plain areas; owing to the difference of runoff conditions and water consumption, the vulnerability differs between mountains and plains. As shown in Figure 5, multiscale change is helpful in understanding the spatial differences. The solid line presents the use-to-availability of Class II WRRs, which differs from the use-to-availability of Class III WRRs. In the ideal situation, the bar is at the level of the solid line. If the solid line is higher than the column, the vulnerability of Class III WRRs is more serious than that of Class II WRRs. Similarly, when the solid line is lower than the column, the WRR is distinguished from the fragile grade at the Class II WRR scale. The units K, L, M, G, and E are lower than the solid line, so water resource vulnerabilities are lower than or equal to that of the Class II WRR scale.

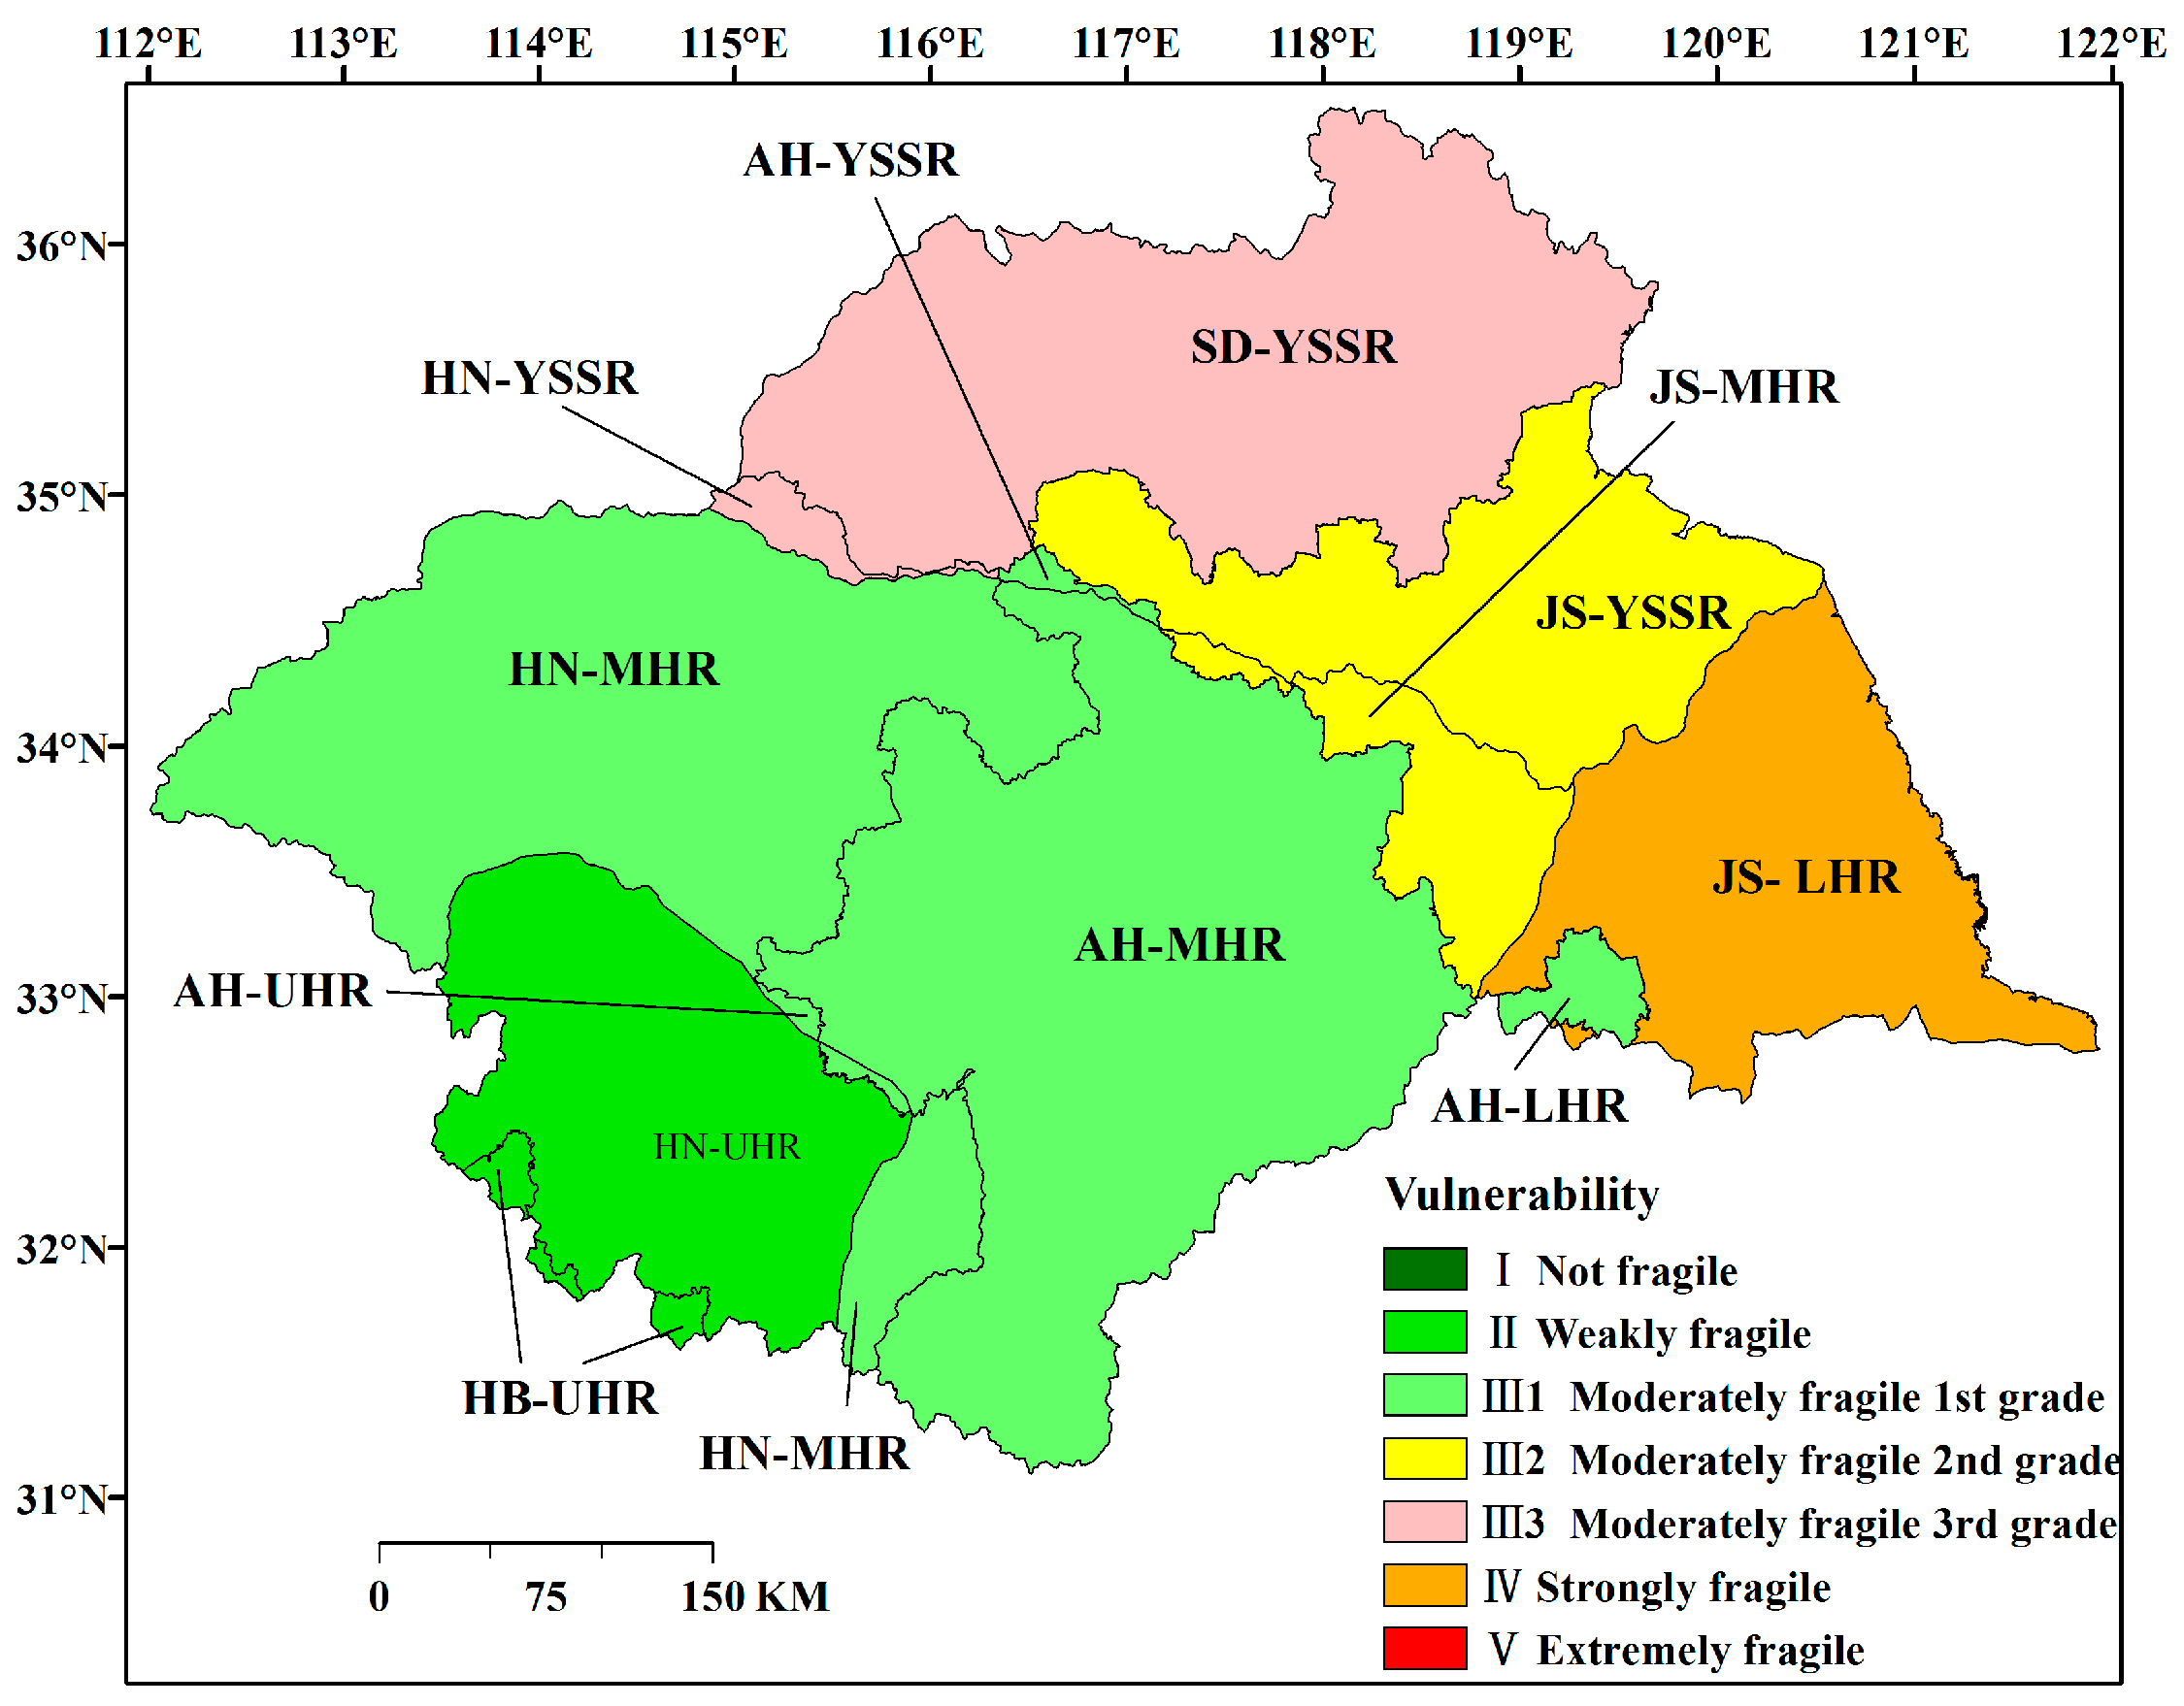
3.2. Spatial Differences of Water Resource Vulnerability at the Province-Class II WRR Scale

Assessment results of the water resource vulnerability at the Province-Class II WRR scale are shown in Figure 6. Five of all the vulnerability classes from the weakly fragile to strongly fragile, are shown in this figure. The unit with the highest vulnerability grade at the scale of Province-Class II WRR is the JS-LHR. The AN-LHR unit is in the moderately fragile 1st grade, but the LHR is in the moderately fragile 3rd grade class at the Class II WRR scale. The total number of vulnerability classes at the Province-Class II WRR scale is one more than that of the Class II WRR scale, but the same as that of the Class III WRR scale (Figure 4b).
The spatial distribution of the vulnerability in a provincial administrative region is shown in Figure 6. As can be seen, in HN, the vulnerability in YSSR is more serious than that in MHR, which in turn, is more vulnerable than that in UHR. The vulnerability distribution at the Province-Class II WRR scale in AH is in accordance with what is shown at the Class II WRR scale but a little different from that shown at the scale of Class III WRR. The vulnerability of HN-YSSR region is extremely fragile at the Class III WRR scale but moderately fragile 3rd grade at the scale of Province-Class II WRR. In JS, the vulnerability is sorted by grade in the following descending order: YSSR ≤ MHR < LHR. As shown in the results above, the spatial distribution of water resource vulnerability at the Province-Class II WRR scale is significantly different from that at the Class II WRR scale. This difference can be attributed to the changes of water resources quantity and consumption demand in the new units at the Province-Class II WRR scale (Figure 6). By downscaling the scales, the covered information at the Class II WRR scale is presented at the Province-Class II WRR scale. Additionally, we can easily observe the following: JS is the most fragile area in the Huai River Basin, vulnerability in SD is higher than that in AH, which is higher than that in HN; vulnerability in HB is the lowest.

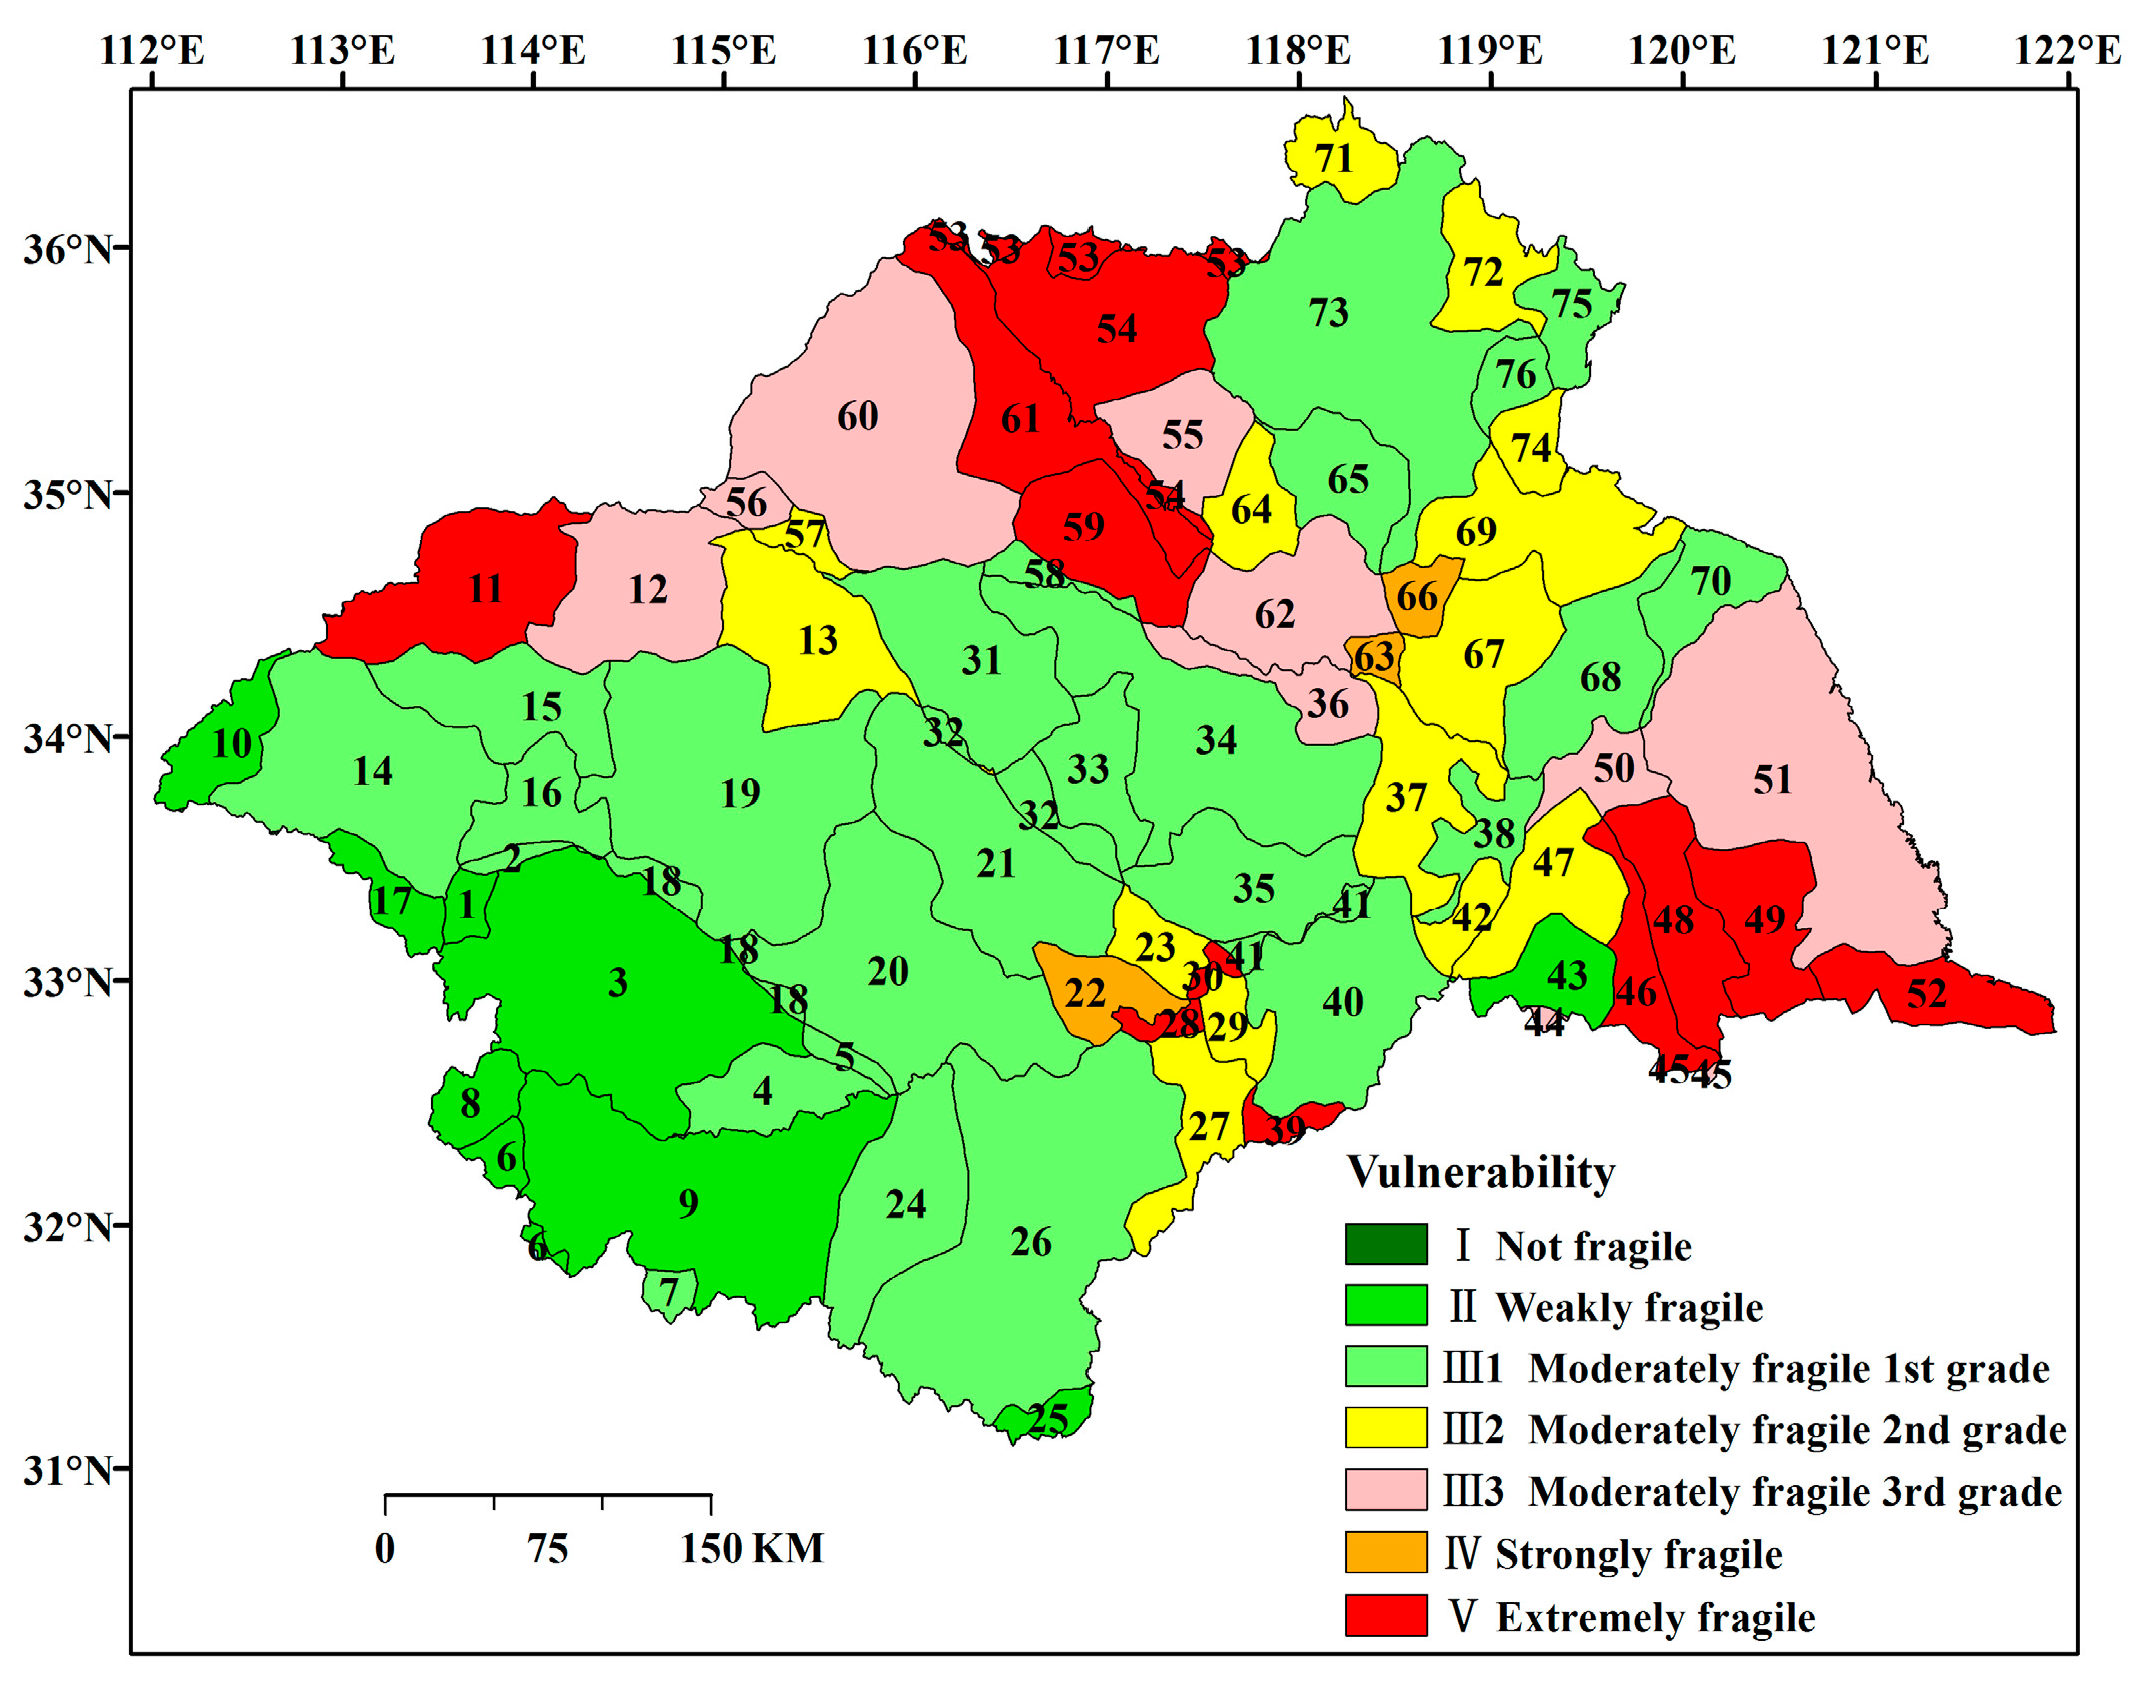
3.3. Spatial Differences in Water Resource Vulnerabilities at the Municipality-Class III WRR Scale

The vulnerability of a total of 76 units at the Municipality-Class III WRR scale is assessed, and the results are shown in Figure 7. Compared with other scales, additional information is revealed at the Municipality-Class III WRR scale. For example, some areas are weakly fragile but not shown at other scales above, such as units 10, 17, and 25. In addition, the areas that are in the extremely fragile grade include units 11, 30, 36, 45, 46, 48, 49, 52, 53, 54, 56, 59, and 61. The vulnerability assessment results show that the diversity of vulnerability grades is obvious at this scale; these results are closer to reality than those of other scales.
Among the total of 76 units at the Municipality-Class III WRR scale, 36 assessment units face less vulnerable situations at the Class III WRR scale, and 34 units are more vulnerable than those at the Province-Class II WRR scale. Given that the water consumption rates and water resource supply quantity vary at different scales, the vulnerability demonstrates more diversity across the scales. The differences can be attributed to variations in water consumption and water resource supply, which depend on many factors, such as diverse historical, social, economic, political, cultural, and environmental conditions.
Using vulnerability maps shown in Figure 4 and Figure 6, a basin institute authority or a county officer, can easily design a water management framework; however, implementing water resource management measures could still be difficult. Given that a more precise or comprehensive vulnerability map is needed at a tiny scale, the vulnerability digital map (shown in Figure 7) is a useful and necessary tool for carrying out water management.

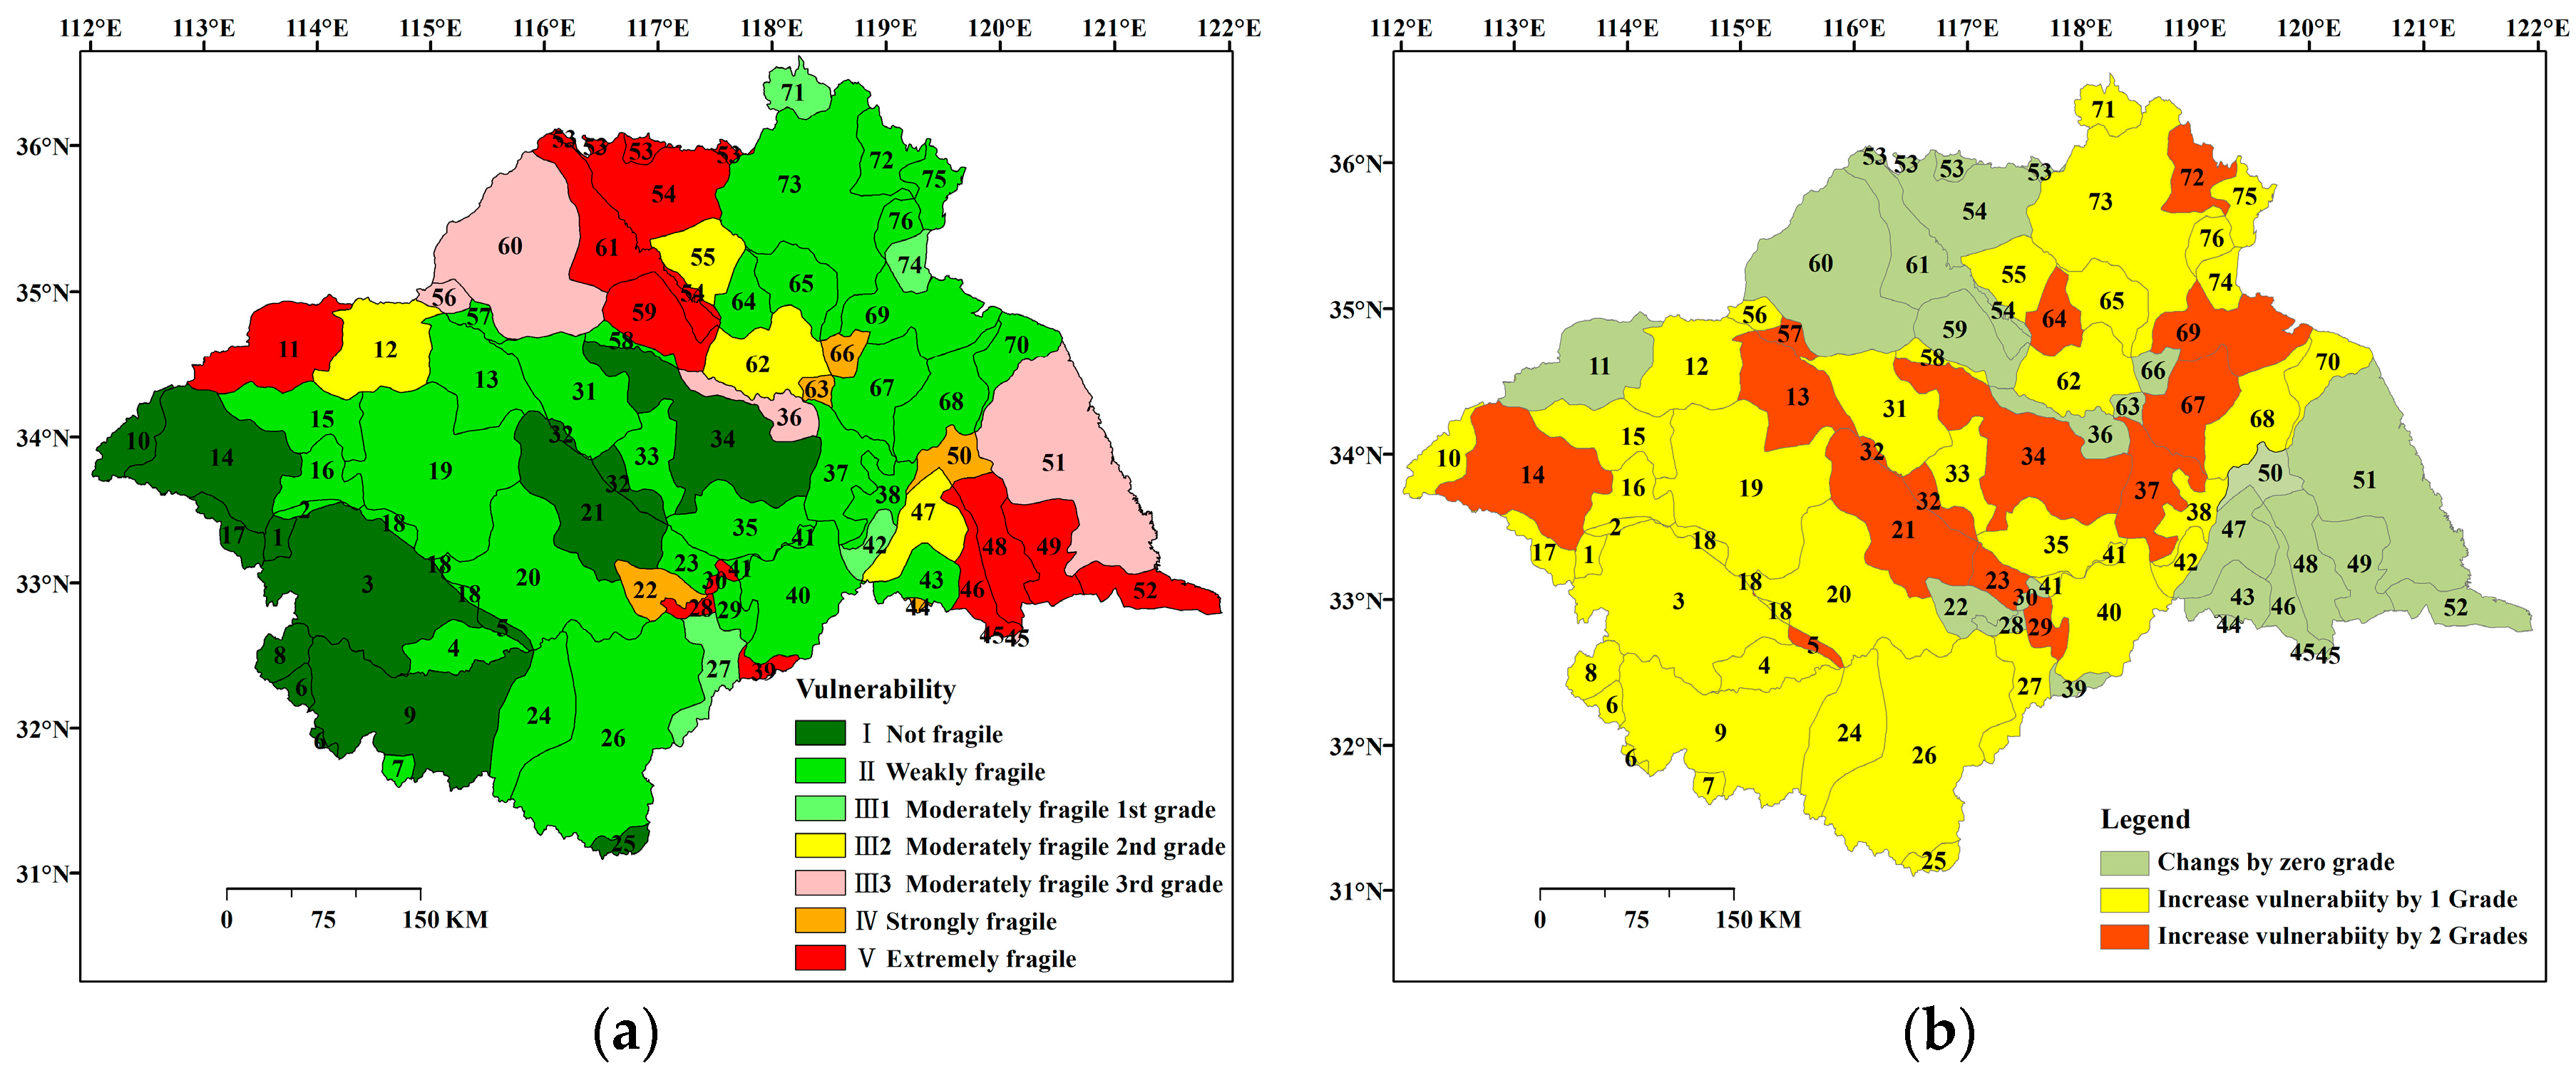
3.4. Heterogeneity Quantification of Water Resource Vulnerability

From the digital maps shown in Figure 4, Figure 6 and Figure 7, spatial differences at the scales can be intuitively reflected. However, the maps just provide a way to help managers gain an intuitive grasp of heterogeneity; the scientific assessment still requires quantitative assessment methods and results. Hence, this paper employed the Theil index and the Shannon-Weaver index to improve the heterogeneity quantification. Then, the heterogeneity of water resource vulnerability among multiple scales was measured by using the Theil index and the Shannon-Weaver index (Table 3). From the results, we find that the Theil index decreases successively with downscaling, as in Class II WRR, Class III WRR, and Municipality-Class III WRR scales, or in Class II WRR, Province-Class II WRR, and Municipality-Class III WRR scales. This trend suggests that an increasing coarse scale leads to decreasing heterogeneity of vulnerability.
The diversity of each vulnerability assessment across different scales is measured by using the Shannon-Weaver index. As the digital maps show, the diversity of vulnerability is highest at the Municipality-Class III WRR scale and lowest at the Class II WRR scale. This is demonstrated from the value of the Shannon-Weaver index. At the Class II WRR, Class III WRR, and Municipality-Class III WRR scales, a relationship exists wherein scale downscales in a regular sequence; as the scales downscale, the diversity of vulnerability increases successively.
Meanwhile, the spatial heterogeneities are measured by using the Shannon-Weaver index, and the results are similar to those obtained when measuring via the Theil index. As the scales downscale, the diversity of vulnerability increases while the Shannon-Weaver index increases. This is not a contradiction because a greater diversity indicates a more stable system; moreover, the lower the value of the Theil index, the lower the span in the vulnerability. For a water guarantee system, more diversity and a lower Theil index means more choice to guarantee water supply security. Additionally, the results of the current study are consistent with those of a former study [13], which states that the heterogeneity of water resource vulnerability across multiple scales varies and that the diversity increases on decreasing the scale, and vice versa.

4. Discussion

4.1. Deductive Presentation of How the RESC Model Works

The approaches employed in the assessment of water resource vulnerability are mainly classified into three categories (see Section 1). The RESC model proposed in this manuscript is a revised approach based on the third type. From the results of vulnerability assessment in the Huai River Basin, we can state that the proposed approach is more suitable for an assessment under complicated conditions than the previous method presented in Xia’s study [13]. Especially, this model can assess the vulnerability along with water balance, water pollution, water scarcity risk, etc.
As a revised method, the proposed approach features the following changes compared with the previous method [13]: (1) This approach combines water criterion compliance rate, disaster risk, together with society and economy exposure, as a novel approach to vulnerability assessment; (2) Instead of per capital water resource quantity, this approach revises the vulnerability assessment model in Xia and Chen’s study with per capita available water resources, which is a more scientific variable that it relates with the ecological water demand for the ecological system and the criterion compliance rate; (3) No universally accepted concept for exposure exists as it relates to persons, outside pressure to the system of human beings, and economy assets [7]. Under exposed conditions, the levels and types of adverse impacts are the result of a physical event (or events) interacting with socially constructed conditions denoted as vulnerabilities. Economic events, including insured, disaster losses associated with weather, climate, and geophysical events are higher in developed countries. Meanwhile, fatality rates and economic losses expressed as a proportion of gross domestic product (GDP), are higher in developing countries [7]. Therefore, accurately explaining and expressing exposure (Equation (9)), combined with people (Ph), GDP, and the area (A) suffering from the drought damage (DI) is meaningful.
Xia and Chen [13] proposed a method for water vulnerability evaluation as a function of sensitivity to climate change and the adaptation of a water resource system. However, this approach does not recognize the effect of disaster risk and exposure of persons and economical assets; thus it cannot accurately evaluate the vulnerability in the Huai River as shown in Figure 8a. In comparison, Figure 8b clearly presents the grade change of vulnerability assessed by the RESC model compared with the vulnerability results with the method of Xia and Chen. We can see that the vulnerabilities shown in Figure 7 are universally more diverse than those in Figure 8a. First, this finding is in accordance with the water balance, water guarantee condition, exposure, and drought risk of the Huai River. Several previous studies have found that the northern plain regions of the HRB, and especially the Hongruhe, Shayinghe, and Wohe, have the most severe forms of water pollution [32]. These regions have high populations, and high levels of industrial activities (e.g., mining of sulfate and chloride minerals), and abundant runoff from such agricultural activities. Additionally, the middle and lower reaches of most rivers have fragile or even unstable aquatic ecosystems [32]. The serious water pollution and the intensive human activities increase water resource vulnerability in this area (Figure 8b). Second, the highest water pollution in the upper Shayinghe, lower Yinghe, and, upper Honghe increases vulnerability by two grades (Figure 8b). Similarly, the lower water criterion compliance rate, high disaster risk, and society and economy exposure also increase vulnerability by 1–2 grades, especially along the lower main branches of the Huai River, such as the lower Shahe, Honghe, Wohe, Xinyihe, and Shuhe. Finally, the vulnerability mainly changes by zero grade in the extremely fragile areas, such as the Lower reaches of the Huai River as well as the areas of the southern four lakes in the Taian and Jining Municipalities.

4.2. Heterogeneity Signifies the Diversity of Water Resource Vulnerability and Demonstrates Potential for Application in the Relevant Authority Departments

Can the characteristics of water resource vulnerability be covered on a coarse scale? The answer is clear in this research as demonstrated by the generated vulnerability maps in the four scales. Similarly, a previous study [13] presents a common conclusion which is that the diversity of vulnerability increases successively with downscaling and more information is uncovered with downscaling. Furthermore, the greater the diversity of vulnerability, the more homogeneous the vulnerability distribution becomes. This is helpful in presenting the actual water resource vulnerability and heterogeneity with downscaling scales assessment. However, it may be insufficient in assessing the vulnerability in a very tiny scale as the data are difficult to collect, and increasing workload is associated with reduced efficiency.
The water resources management authority (WRMA) can be classified into administrative regional institutes and water resources regional institutes. The functions and legal statuses of basin commissions and administrative institutes are defined by China’s Water Law [22]. Different institutes require different scale results; thus a single-scale vulnerability assessment result, e.g., Class II WRR, is not adequate for water management. These basin commissions especially are given greater authority in the allocation and centralized control of all diversion projects [23], yet they lack the ability to control water utilization based on political boundaries [25]. Thus, one important task is to collect sufficient data to assess the vulnerability across Class II, Class III, Province-Class II, and Municipality-Class III WRR scales and other scales. This work can also serve as the basis of water resource management and future scientific studies. Either from the authority implementation or from special geographical stations with water supply ability, performing multiscale vulnerability assessment is necessary and must be based on political boundaries and watersheds.

4.3. An Appropriate Scale Depending on the Objectives and Water Resource Districts

From the results of the water resource vulnerability assessment, the vulnerability is scale-dependent especially for a river system. Spatial scales indicate different predictions as reported in a previous research [33]. In the current study, the research scale was selected from the observation scale; thus, the research scale or observational scale can be discussed [20]. However, there are not enough collected data for the entire process study which may underestimate the result as the observation scale is larger than the process scale [9]. For some variables, such as distance and areas, they are based on locations; and thus show obvious scale-dependent characters. On the contrary, some variables maintain a certain value or show a non-constant change extent with scaling.
Generally, multiscale vulnerability assessment can uncover the fine-scale measures and coarse-scale representations of vulnerability, from which the vulnerability results can be extrapolated at a few administration areas or institutions. Moreover, the results can be conducted to a more general set of conditions in water resource planning, allocation, drought prediction, etc. Here, the spatially heterogeneous processes acting at multiple scales are addressed. We find that adding fine-scale assessments, such as the Class III WRR, Province-Class II WRR, Municipality-Class III WRR scales into a broad-scale correlative framework is the best option. In many systems, this can improve predictive power and result in stronger generalities [18].
What comprises an “appropriate” scale depends partly on the purpose for which it is used. Ecologists probe the relationship between resources and consumers, but differences in their objectives lead them to focus their investigations at different scales [19]. Different scales are required to study the changes of variables in multiple scales; however, the scales chosen for analysis are still arbitrary and tend to reflect hierarchies of spatial scales based on our own perceptions of nature. Hence, we need non-arbitrary and operational ways of defining and detecting scales [33].
In this study, we presented four main scales each of which is appropriate for a specific purpose or administration department (Figure 9). Class II WRRs are commonly used by basin commissions for water resource assessment and hydrologic forecasting. Then, Class III WRRs are used in inner-province areas and specific basins; it is important for conducting water resource planning, allocation, as well as drought forecasting for a basin committee and a certain province. The Province-Class II WRRs are typically used in the water resource allocation for different provinces, drought forecasting, and water resources planning. Finally, the Municipality-Class III WRRs are the basis of water resources planning and allocation schemes for counties, and irrigation districts as well as their respective water intake areas.

4.4. Uncertainty Analysis

This study addresses issues on the scale effects of water resource vulnerability. However, some uncertainties exist, such as the climate change influence, the lack of water resource statistics, rationality of indicators applied to the cross-scale assessment [34] etc. Thus, the effects of climate change on water resources and the RESC model validation must be addressed in future studies.
The combined parameters and the data for each scale result in the data collection and applications problems of the RESC model. The combined parameters in this approach, such as adaptation ability, exposure, sensitivity, and risk, are not accurate and not universally accepted for vulnerability assessment. Each parameter can be treated as a research topic in future works. Hence, we can say that this manuscript is a scientific attempt from a complicated and integrated scope angle. The complicated data requirement for the RESC model restrains the immediate application of this method. As stated in the introduction, the data for the RESC contain the raw data, such as water quantity, water intake, water consumption, temperature, precipitation, population number, etc. Additionally, many derived data, such as disaster risk, water criterion compliance rate, as well as society and economy exposure, are very difficult to collect. The raw data and derived data across-scales are difficult to collect, resulting in some problems in the application of the RESC model.
Different characters and physical mathematic modeling may be shown in different target basins. This paper has many differences compared with Xia’s study [13], such as the difference in modeling (Equations (1), (2) and (7)–(9)). For other geographies, if the RESC model is employed, a new relationship between runoff, temperature, precipitation, evaporation, and other parameters must be modeled and used in the RESC model instead of Equations (3)–(5). From the scope of vulnerability results, the vulnerability assessment of the Huai River is a novel work that demonstrates rare cross-scale comparisons. Hence, this cross-scale vulnerability assessment is required in assessing other geographical forms.
In future studies, cross-scale assessments of changing vulnerability, and the complexity of the dynamics from the ensuing interactions must be comprehensively investigated. Some new topics for the cross scale vulnerability assessment have emerged, including the process of deciding on an appropriate scale for water resource management, evaluating the effect of objectives and water resource district on vulnerability, assessing the gaps with regard to data and scaling in the region, and how the outcomes of these analyses could be employed considering the cross-scale vulnerability assessment and the political framework, etc. As more (and better) data become available, advances in study design and methods must be made so as to gain knowledge of the finer nuances in vulnerability assessments.

5. Conclusions

Water resource vulnerability was assessed in this study by using the RESC model, and its heterogeneity was measured by using the Shannon-Weaver index and the Theil index at the Class II WRR, Class III WRR, Province-Class II WRR, and Municipality-Class III WRR scales.
Water resource vulnerability in the Huai River Basin weakens from east to west, and LHR is the most vulnerable area. The vulnerability of YSSR is also higher than that of the MHR Basin, which in turn is higher than that of UHR. Furthermore, the vulnerabilities vary across different scales; with scales downscaling the diversity of vulnerability increases successively, such as the diversity of vulnerability enhancing gradually in the Class II WRR, Class III WRR, and Municipality-Class III WRR scales. With scales downscaling, the increasing Shannon-Weaver Index indicates that, as the diversity of vulnerabilities increases, the more homogeneous the vulnerability distribution becomes. By contrast, the decreasing Theil index shows the greater number of vulnerability grades in different sub-areas. Downscaling is a good way to present the actual water resource vulnerability and heterogeneity in the Huai River Basin. Additionally, we determined that an appropriate scale depends on the objectives and the water resource districts that will use such a scale.
The assessment results of cross-scales vulnerability and its heterogeneity in the Huai River Basin are innovatively provided in this paper. Although some limits and uncertainties exist in terms of the methods and the results, the results will play an important role in characterizing the spatial patterns of water resource vulnerability and improving water resource management.

Acknowledgments

This study is supported by the National Natural Science Foundation of China-Yunnan Joint Fund (No. U1502233), The National Key Research and Development Program of China (No. 2016YFC0502500/2016YFC0502502), and by the National Natural Science Foundation of China (Nos. 41462015, 51279140, 41301520). We wish to thank the anonymous reviewers and editors for their thoughtful suggestions and careful work, which helped improve this paper substantially.

Author Contributions

Junxu Chen designed the conception and carried out the analysis of results. Jun Xia conceived the comparison of multiple scales; Zhifang Zhao performed the experiments; Si Hong analyzed the data. Hong Liu and Fei Zhao edited the format and checked the language.

Conflicts of Interest

The authors declare no conflict of interest.

Abbreviations

The following abbreviations are used in this manuscript:
Class II WRRssecond-class water resource regions
Class III WRRsthird-class water resource regions
HRBHuai River Basin
UHRUpper Huai River
MHRMiddle reaches of the Huai River
LHRLower reaches of the Huai River
YSSRYi-Shu-Si River

References

  1. Albinet, M.; Margat, J. Mapping the vulnerability to pollution of groundwater aquifers. In Groundwater Pollution-Symposium-Pollution des Eaux Souterraines; IAHS-AISH: Wallingford, UK, 1970; Volume 103, pp. 58–70. [Google Scholar]
  2. Hashimoto, T.; Loucks, D.; Stedinger, J. Reliability, resiliency and vulnerability criteria for water resources systems. Water Resour. Res. 1982, 18, 14–20. [Google Scholar] [CrossRef]
  3. The Intergovernmental Panel on Climate Change (IPCC). Climate Change 1995: The Science of Climate Change; Cambridge University Press: Cambridge, UK, 1996; Volume 19390. [Google Scholar]
  4. Falkenmark, M.; Widstrand, C. Population and Water Resources: A Delicate Balance; Population Reference Bureau: Washington, DC, USA, 1992; pp. 1–36. [Google Scholar]
  5. Raskin, P.; Gleick, P.; Kirshen, P.; Pontius, G.; Strzepek, K. Water Futures: Assessment of Long-Range Patterns and Prospects; Stockholm Environment Institute (SEI): Stockholm, Sweden, 1997. [Google Scholar]
  6. Alcamo, J.; Döll, P.; Kaspar, F.; Siebert, S. Global Change and Global Scenarios of Water Use and Availability: An Application of WaterGap 1.0; Center for Environmental Systems Research (CESR), University of Kassel: Kassel, Germany, 1997; pp. 17–20. [Google Scholar]
  7. The Intergovernmental Panel on Climate Change (IPCC). Managing the Risks of Extreme Events and Disasters to Advance Climate Change Adaptation: A Special Report of Working Groups I and II of the Intergovernmental Panel on Climate Change; Cambridge University Press: Cambridge, UK, 2012. [Google Scholar]
  8. Vorosmarty, C.J.; Green, P.; Salisbury, J.; Lammers, R.B. Global water resources: Vulnerability from climate change and population growth. Science 2000, 289, 284–288. [Google Scholar] [CrossRef] [PubMed]
  9. Blöschl, G.; Sivapalan, M. Scale issues in hydrological modelling: A review. Hydrol. Process. 1995, 9, 251–290. [Google Scholar] [CrossRef]
  10. Mandelbrot, B.B. How long is the coast of Britain. Science 1967, 156, 636–638. [Google Scholar] [CrossRef] [PubMed]
  11. Wu, J. Effects of changing scale on landscape pattern analysis: Scaling relations. Landsc. Ecol. 2004, 19, 125–138. [Google Scholar] [CrossRef]
  12. Barry, S.; Wandel, J. Adaptation, adaptive capacity and vulnerability. Glob. Environ. Chang. Hum. Policy Dimens. 2006, 16, 282–292. [Google Scholar]
  13. Xia, J.; Chen, J.; Weng, J.; Yu, L.; Qi, J.; Liao, Q. Water resource vulnerability and its spatial heterogeneity in Haihe River Basin, China. Chin. Geogr. Sci. 2014, 24, 525–539. [Google Scholar] [CrossRef]
  14. Zhou, J.; Zou, J. Vulnerability assessment of water resources to climate change in Chinese cities. Ecol. Econ. 2010, 6, 106–114. [Google Scholar]
  15. Liu, C. The Vulnerability of Water Resources in Northwest China. J. Glaciol. Geocryol. 2003, 3, 309–314. [Google Scholar]
  16. Hamouda, M.A.; El-Din, M.M.N.; Moursy, F.I. Vulnerability assessment of water resources systems in the Eastern Nile Basin. Water Resour. Manag. 2009, 23, 2697–2725. [Google Scholar] [CrossRef]
  17. Gain, A.K.; Giupponi, C.; Renaud, F.G. Climate Change Adaptation and Vulnerability Assessment of Water Resources Systems in Developing Countries: A Generalized Framework and a Feasibility Study in Bangladesh. Water 2012, 4, 345–366. [Google Scholar] [CrossRef] [Green Version]
  18. Hewitt, J.E.; Thrush, S.F.; Dayton, P.K.; Bonsdorff, E. The effect of spatial and temporal heterogeneity on the design and analysis of empirical studies of scale-dependent systems. Am. Nat. 2007, 169, 398–408. [Google Scholar] [CrossRef] [PubMed]
  19. Pulliam, H.R.; Dunning, J.B. The influence of food supply on local density and diversity of sparrows. Ecology 1987, 68, 1009–1014. [Google Scholar] [CrossRef]
  20. Schulze, R. Transcending scales of space and time in impact studies of climate and climate change on agrohydrological responses. Agric. Ecosyst. Environ. 2000, 82, 185–212. [Google Scholar] [CrossRef]
  21. Liu, C.; Zhang, D.; Liu, X.; Zhao, C. Spatial and temporal change in the potential evapotranspiration sensitivity to meteorological factors in China (1960–2007). J. Geogr. Sci. 2012, 22, 3–14. [Google Scholar] [CrossRef]
  22. China People’s Congress. Water Law of the People’s Republic of China (Amended); Law Press: Beijing, China, 2002.
  23. Shen, D. The 2002 Water Law: Its impacts on river basin management in China. Water Policy 2004, 6, 345–364. [Google Scholar]
  24. Chen, P.; Li, L.; Zhang, H. Spatio-Temporal Variations and Source Apportionment of Water Pollution in Danjiangkou Reservoir Basin, Central China. Water 2015, 7, 2591–2611. [Google Scholar] [CrossRef]
  25. Cheng, H.F.; Hu, Y.A. Improving China’s water resources management for better adaptation to climate change. Clim. Chang. 2012, 112, 253–282. [Google Scholar] [CrossRef]
  26. Xie, P.; Chen, M.; Yang, S.; Yatagai, A.; Hayasaka, T.; Fukushima, Y.; Liu, C. A gauge-based analysis of daily precipitation over East Asia. J. Hydrometeorol. 2007, 8, 607–626. [Google Scholar] [CrossRef]
  27. Ying, X.; Xuejie, G.; Yan, S.; Chonghai, X.; Ying, S. A daily temperature dataset over China and its application in validating a RCM simulation. Adv. Atmos. Sci. 2009, 26, 763–772. [Google Scholar]
  28. Fu, G.B.; Charles, S.P.; Chiew, F.H.S. A two-parameter climate elasticity of streamflow index to assess climate change effects on annual streamflow. Water Resour. Res. 2007, 43, W11419. [Google Scholar] [CrossRef]
  29. Chen, J.; Xia, J.; Zhao, C.; Zhang, S.; Fu, G.; Ning, L. The mechanism and scenarios of how mean annual runoff varies with climate change in Asian monsoon areas. J. Hydrol. 2014, 517, 595–606. [Google Scholar] [CrossRef]
  30. Gardner, L.R. Assessing the effect of climate change on mean annual runoff. J. Hydrol. 2009, 379, 351–359. [Google Scholar] [CrossRef]
  31. Brouwer, F.; Falkenmark, M. Climate-induced water availability changes in Europe. Environ. Monit. Assess. 1989, 13, 75–98. [Google Scholar] [CrossRef] [PubMed]
  32. Zhao, C.; Liu, C.; Xia, J.; Zhang, Y.; Yu, Q.; Eamus, D. Recognition of key regions for restoration of phytoplankton communities in the Huai River basin, China. J. Hydrol. 2012, 420, 292–300. [Google Scholar] [CrossRef]
  33. Wiens, J.A. Spatial scaling in ecology. Funct. Ecol. 1989, 3, 385–397. [Google Scholar] [CrossRef]
  34. Perveen, S.; James, L.A. Scale invariance of water stress and scarcity indicators: Facilitating cross-scale comparisons of water resource vulnerability. Appl. Geogr. 2011, 31, 321–328. [Google Scholar] [CrossRef]
Figure 1. Political boundary and digital elevation of the Huai River Basin. (a) Boundaries of second-class water resource regions (Class II WRRs) and (b) third-class water resource regions (Class III WRRs), main rivers, and tributaries.
Water 08 00431 g001
Figure 2. Illustration of the core concepts of water resource vulnerability coupled with water stress probability, exposure, resilience and elasticity of water resources to climate change. The paper assesses how exposure and resilience to climate events determine impacts; evaluates the influence of climate change in contributing to water stress, as well as the exposure and resilience of water resources; and considers the role of guarantee ability and adaptation to climate change in reducing exposure and water scarcity to climate change.
Water 08 00431 g002
Figure 3. Multiscale assessment employed in this study.
Water 08 00431 g003
Figure 4. Average water resource vulnerability in the Huai River Basin. (a) Vulnerability at the Class II WRR scale; (b) Vulnerability at the Class III WRR scale. A, North shore above the Wangjia Dam; B, South shore above the Wangjia Dam; C, North shore between the Wangjia and Bengbu Dam; D, South shore between the Wangjia and Bengbu Dam; E, North shore between Bengbu Dam and Hongze Lake; F, South shore between Bengbu Dam and Hongze Lake; G, Gaotian district area; H, the Lixia River Basin; I, eastern areas of the southern four lakes; J, western areas of the southern four lakes; K, the areas of the median Grand Canal; L, Yi-Shu-Si River Basin; M, the Rigan district area.
Water 08 00431 g004
Figure 5. Water consumption rates and water resource quantities of the Huai River Basin at the Class II WRR scale and Class III WRR scales. The names of Class III WRRs are the same as those given in Figure 4.
Water 08 00431 g005
Figure 6. Water resource vulnerabilities in the Huai River Basin at the Province-Class II WRR scale. AH-LHR, Lower reaches of the Huai River in Anhui; JS- LHR, Lower reaches of the Huai River in Jiangsu; HN-MHR, Middle reaches of the Huai River in Henan; AH-MHR, Middle reaches of the Huai River in Anhui; JS-MHR, Middle reaches of the Huai River in Jiangsu; HB-UHR, Upper Huai River in Hubei; HN-UHR, Upper Huai River in Henan; AH-UHR, Upper Huai River in Anhui; SD-YSSR, Yi-Shu-Si River in Shandong; AH-YSSR, Yi-Shu-Si River in Anhui; HN-YSSR, Yi-Shu-Si River in Henan; JS-YSSR, Yi-Shu-Si River in Jiangsu.
Water 08 00431 g006
Figure 7. Water resource vulnerability in the Huai River Basin at the Municipality-Class III WRR scale. 1, A in Pingdingshan Municipality; 2, A in Luohe Municipality; 3, A in Zhumadian Municipality; 4, A in Xinyang Municipality; 5, A in Fuyang Municipality; 6, B in Suizhou Municipality; 7, B in Xiaogan Municipality; 8, B in Nanyang Municipality; 9, B in Xinyang Municipality; 10, C in Luoyang Municipality; 11, C in Zhengzhou City; 12, C in Kaifeng Municipality; 13, C in Shangqiu Municipality; 14, C in Pingdingshan Municipality; 15, C in Xuchang Municipality; 16, C in Luohe Municipality; 17, C in Nanyang Municipality; 18, C in Zhumadian Municipality; 19, C in Zhoukou Municipality; 20, C in Fuyang Municipality; 21, C in Bozhou Municipality; 22, C in Huainan Municipality; 23, C in Bengbu Municipality; 24, D in Xinyang Municipality; 25, D in Anqing Municipality; 26, D in Luan Municipality; 27, D in Hefei City; 28, D in Huainan Municipality; 29, D in Chuzhou Municipality; 30, D in Bengbu Municipality; 31, E Shangqiu in Municipality; 32, E in Bozhou Municipality; 33, E in Huaibei Municipality; 34, E in Suzhou Municipality; 35, E in Bengbu Municipality; 36, E in Xuzhou Municipality; 37, E in Suqian Municipality; 38, E in Huaian Municipality; 39, F in Hefei City; 40, F in Chuzhou Municipality; 41, F in Bengbu Municipality; 42, F in Huaian Municipality; 43, G in Chuzhou Municipality; 44, G in Nanjing City; 45, G in Zhengjiang Municipality; 46, G in Yangzhou Municipality; 47, G in Huaian Municipality; 48, H in Yangtai Municipality; 49, H in Taizhou Municipality; 50, H in Huaian Municipality; 51, H in Yancheng Municipality; 52, H in Nantong Municipality; 53, I in Taian Municipality; 54, I in Jining Municipality; 55, I in Zaozhuang Municipality; 56, J in Kaifeng Municipality; 57, J in Shangqiu Municipality; 58, J in Suzhou Municipality; 59, J in Xuzhou Municipality; 60, J in Heze Municipality; 61, J in Jining Municipality; 62, K in Xuzhou Municipality; 63, K in Suqian Municipality; 64, K in Zaozhuang Municipality; 65, K in Linyi Municipality; 66, L in Xuzhou Municipality; 67, L in Suqian Municipality; 68, L in Huaian Municipality; 69, L in Lianyungang Municipality; 70, L in Yancheng Municipality; 71, L in Zibo Municipality; 72, L in Rizhao Municipality; 73, L in Linyi Municipality; 74, M in Lianyungang Municipality; 75, M in Rizhao Municipality; 76, M in Linyi Municipality.
Water 08 00431 g007
Figure 8. (a) Water resource vulnerability at the Municipality-Class III WRR scale with the method of Xia and Chen; and (b) the grade of vulnerability change compared with the vulnerability results with the method in this manuscript. The names of Municipality-Class III WRRs are the same as given in Figure 7.
Water 08 00431 g008
Figure 9. The scale relationship for the employment of water resource vulnerability in the Huai River Basin. The ( Water 08 00431 i001) sign represents the appropriate employed situations for certain vulnerability results on a scale. The ( Water 08 00431 i002) sign represents the downscale arrows.
Water 08 00431 g009
Table 1. Water quantity, water consumption, GDP, and population in the Huai River Basin.
VariableArea (km2)Average Water Resources (1956–2000) (108 m3)Water Consumption in 2000 (108 m3)GDP (108 Yuan)Population (104 Person)
Region
UHR30,588121.128.66510.31390.2
MHR128,784374.4199.863795.38185.9
LHR30,66093.1107.131300.61728.5
YSSR78,925210.8165.022867.75051.2
Total268,957799.4500.678473.916,356.6
Table 2. Classification of water resource vulnerability (V(t)).
V(t)ClassSubclassDescription
0 ≤ V(t) ≤ 0.10INot fragile
0.10 < V(t) ≤ 0.20IIWeakly fragile
0.20 < V(t) ≤ 0.60IIIModerately fragile
0.20 < V(t) ≤ 0.30III1Moderately fragile, 1st grade
0.30 < V(t) ≤ 0.40III2Moderately fragile, 2nd grade
0.40 < V(t) ≤ 0.60III3Moderately fragile, 3rd grade
0.60 < V(t) ≤ 0.80IVStrongly fragile
V(t) > 0.80VExtremely fragile
Table 3. Diversity and heterogeneity of water resource vulnerability.
IndexNotWeakModerateStrongExtremeTheil IndexShannon-Weaver Index
Region 1st2nd3rd
Class II WRRs01111000.5601.040
Class III WRRs02350120.4671.525
Province-Class II WRRs02522100.4781.545
Municipality-Class III WRRs09271493140.3221.685

