1. Introduction
Natural organic matter (NOM) is ubiquitous in waters, sediments, and soils. Aquatic NOM is derived both from the breakdown of terrestrial plants as well as the by-product of bacteria, algae, and aquatic plants. The interrelation between NOM and climate change and notably the rising concentrations of NOM has attracted a lot of attention recently [
1,
2,
3,
4,
5,
6,
7,
8,
9]. Several potential factors, including an increase in air and surface water temperature, rainfall intensity, and atmospheric CO
2 and/or a decrease in acid deposition, have been proposed to explain the increased amount of NOM [
10], but there is yet no scientific consensus on the issue [
11].
NOM has a significant impact on drinking water quality directly, by reacting with water treatment chemicals contributing to disinfection by-product (DBP) formation [
12,
13], and indirectly, by impacting water treatment processes (including fouling of membranes and reducing the effectiveness of activated carbon for contaminant removal). In the recent years, reports worldwide indicate a continuing increase in the color and NOM of the surface water, which in turn, causes an adverse effect on drinking water purification [
14]. Changes in the properties of NOM also influence the treatment significantly [
15].
Therefore, the water industry has been focusing on improving current treatment processes and developing new applications for enhanced removal of NOM. One of the latest innovations in nanofiltration (NF) for effective removal of NOM, is capillary NF membranes which combine the chemical resistance of hollow fiber membranes with the organic retention of spiral wound nanofiltration [
16,
17]. This new type of membrane (HFW1000) is suitable for raw waters that have low hardness and contain organic matter that are difficult to flocculate such as lake water. Recent studies indicated that a combined coagulation and NF process removed more than 90% of the dissolved organic carbon (DOC), and 96% of the absorbance at 254 nm in lake water [
18], while using direct NF resulted in NOM removal with 93% in UV-absorbance (UVA) retention and 88% TOC retention [
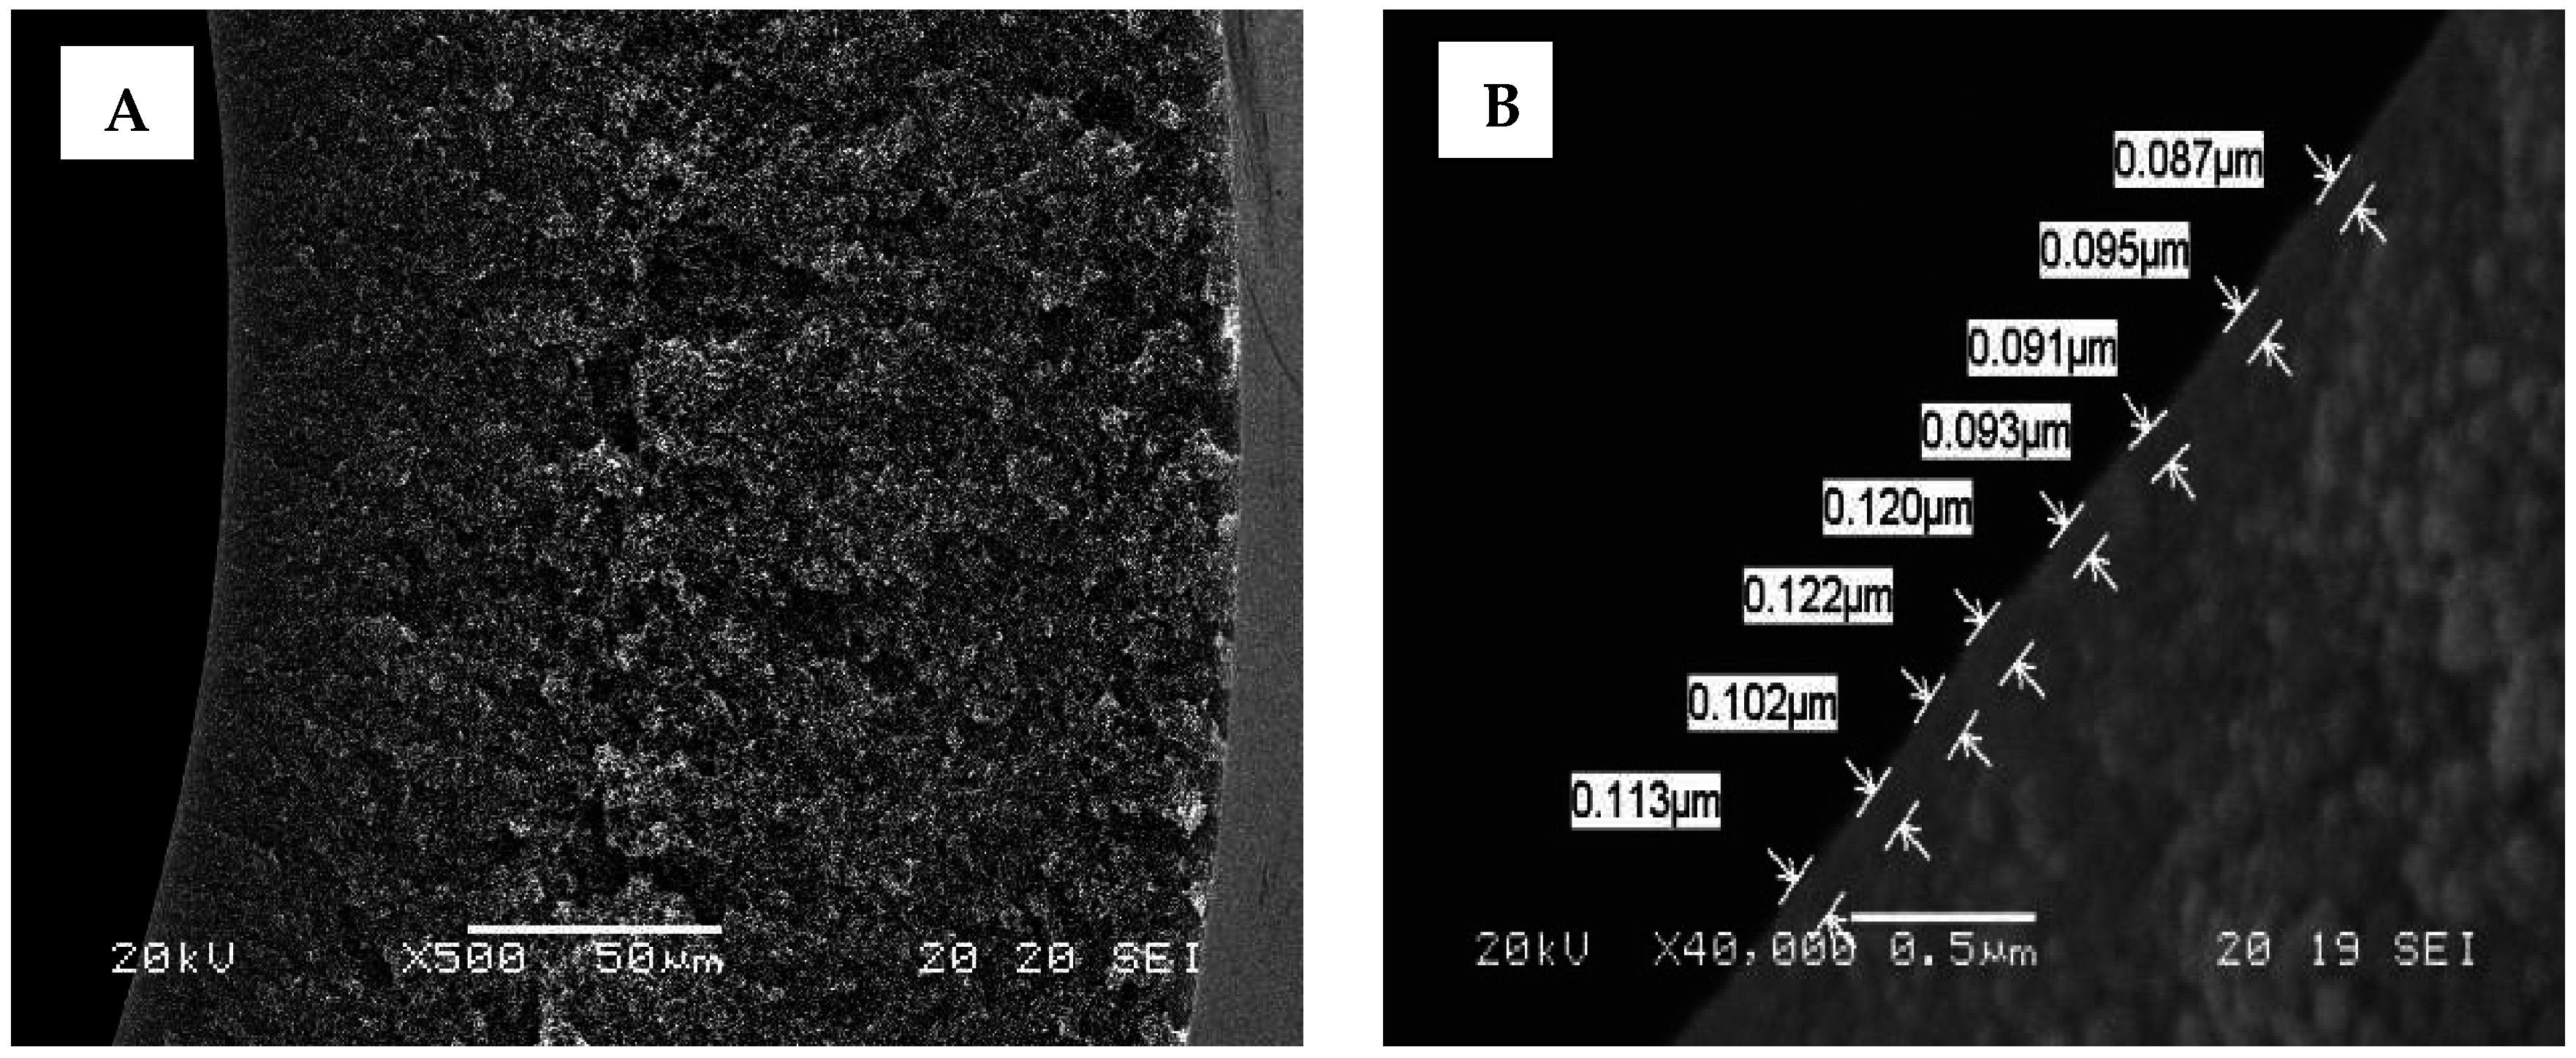
19]. An advanced autopsy of the hollow fiber NF membranes was conducted after 12 months of operation with no substantial changes to the membranes detected [
20]. These results encouraged us to evaluate dimensioning parameters for the use of these NF membranes for direct lake water filtration.
The transport of NOM through NF membrane pores is influenced either by convection or diffusion, depending on the hydrodynamic conditions and electrostatic interactions between the membrane surface and NOM molecules. Different mechanisms influencing the removal of small organic compounds have been suggested. The polarity and differences in diffusion rates in a non-porous structure may influence the rejection of small organic compounds in NF [
21,
22]. The solution-diffusion model is the most widely used model of permeation in non-porous polymer membranes [
23,
24,
25] while the Donnan steric pore model and dielectric exclusion model have also been used to describe mass transfer of electrolytes and neutral solutes through nanofiltration membranes [
26] as well as to predict rejections of trace organics by NF membranes [
27,
28]. The ability of the model to describe all non-porous membrane separation processes has been the subject of several reviews even in the past [
23,
29,
30]. Since the selected capillary NF membrane for this study has been deemed to be a non-porous membrane [
31], the solution-diffusion model is used to obtain a design tool for prediction of permeate quality for different settings regarding filtration flux, cross-flow velocity, recovery and for different staging configurations.
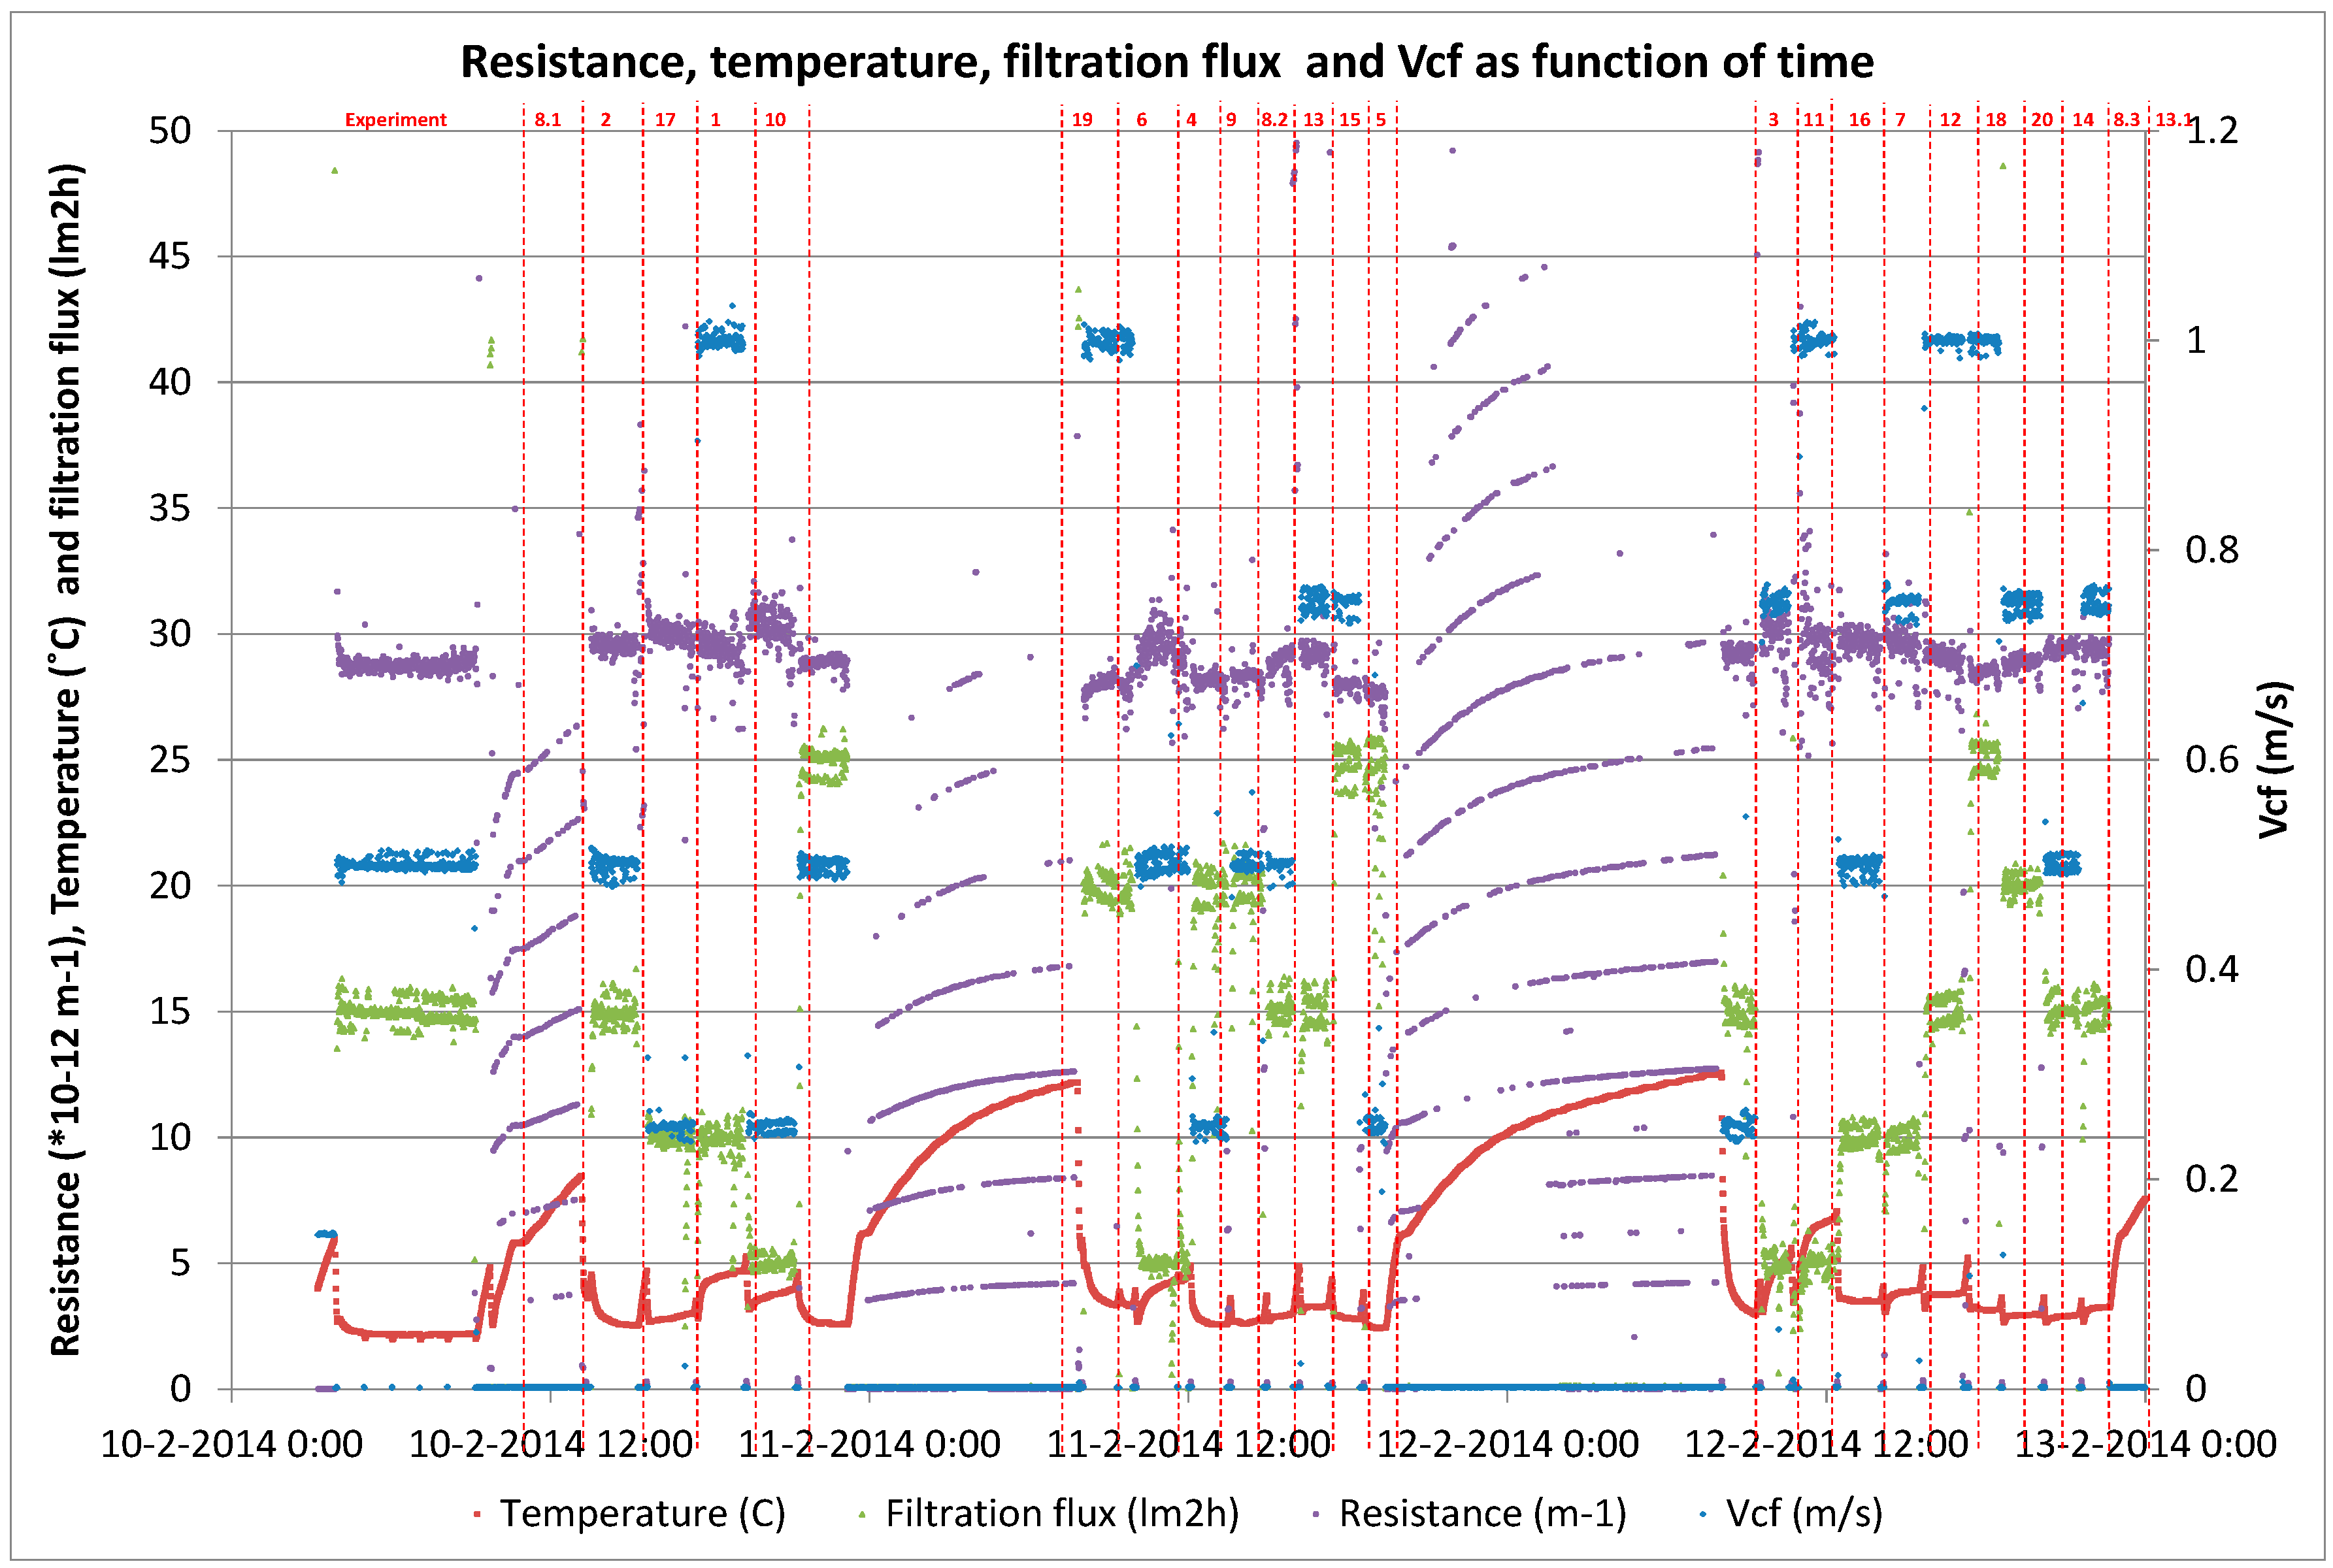
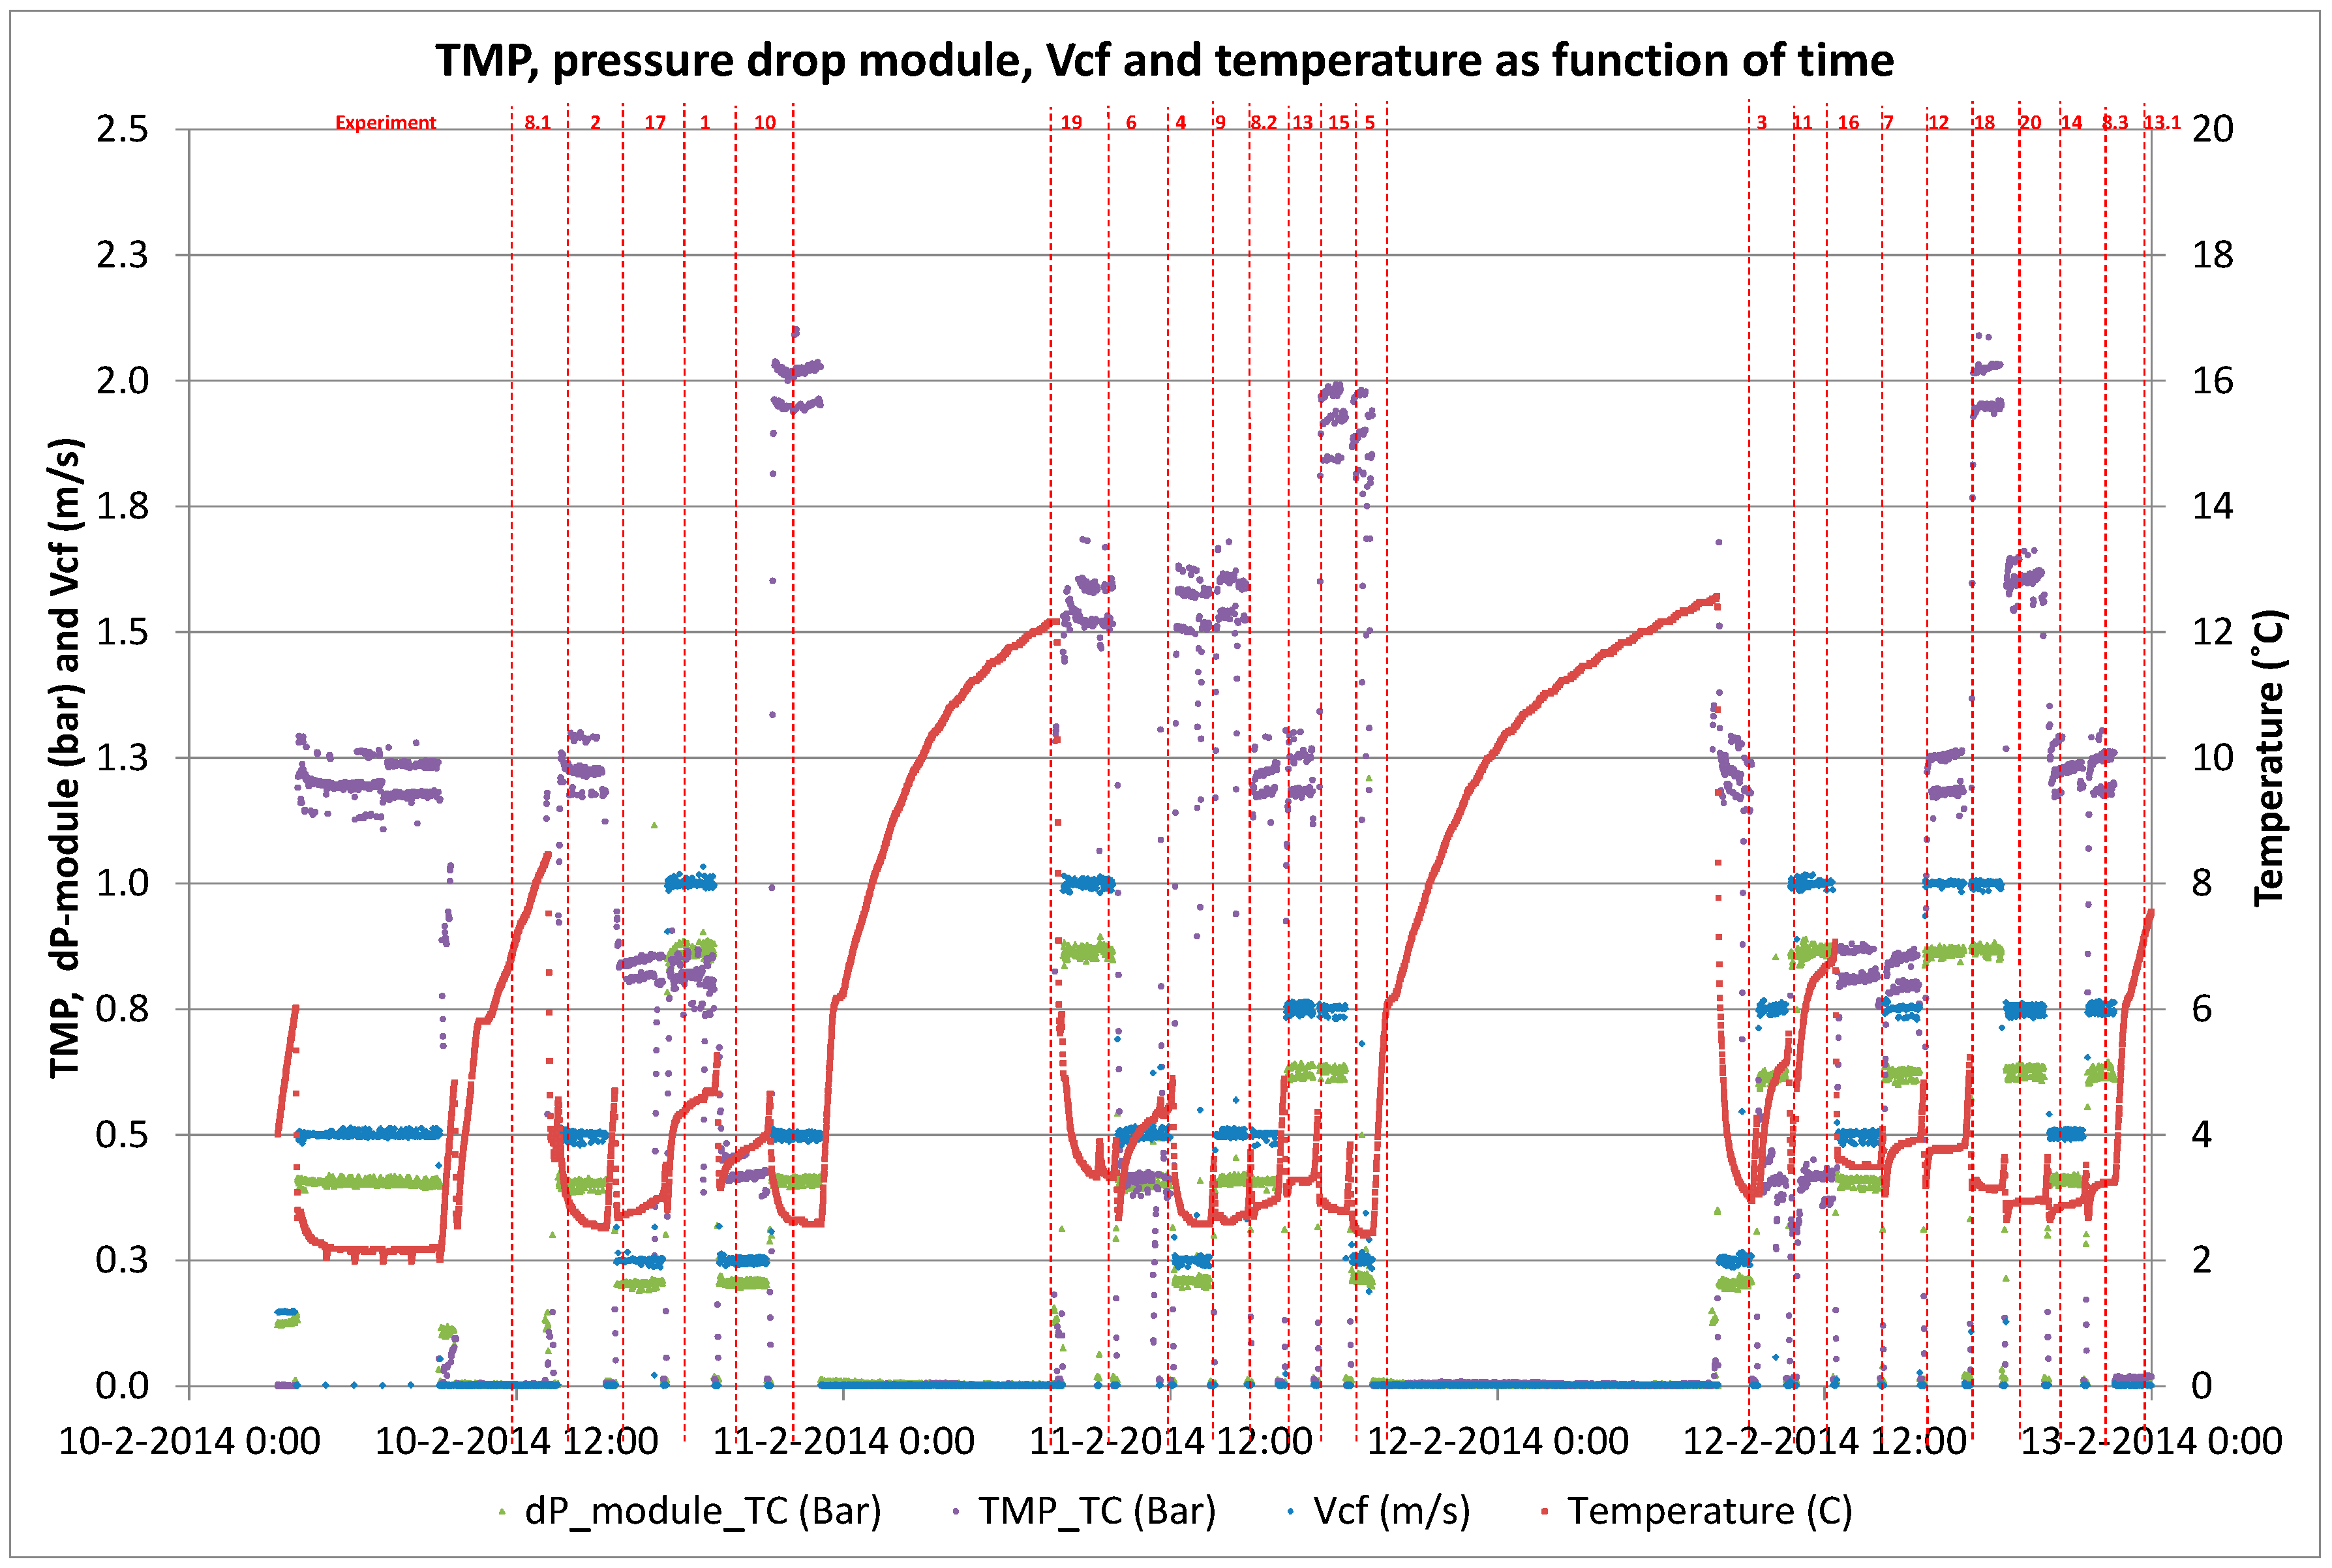
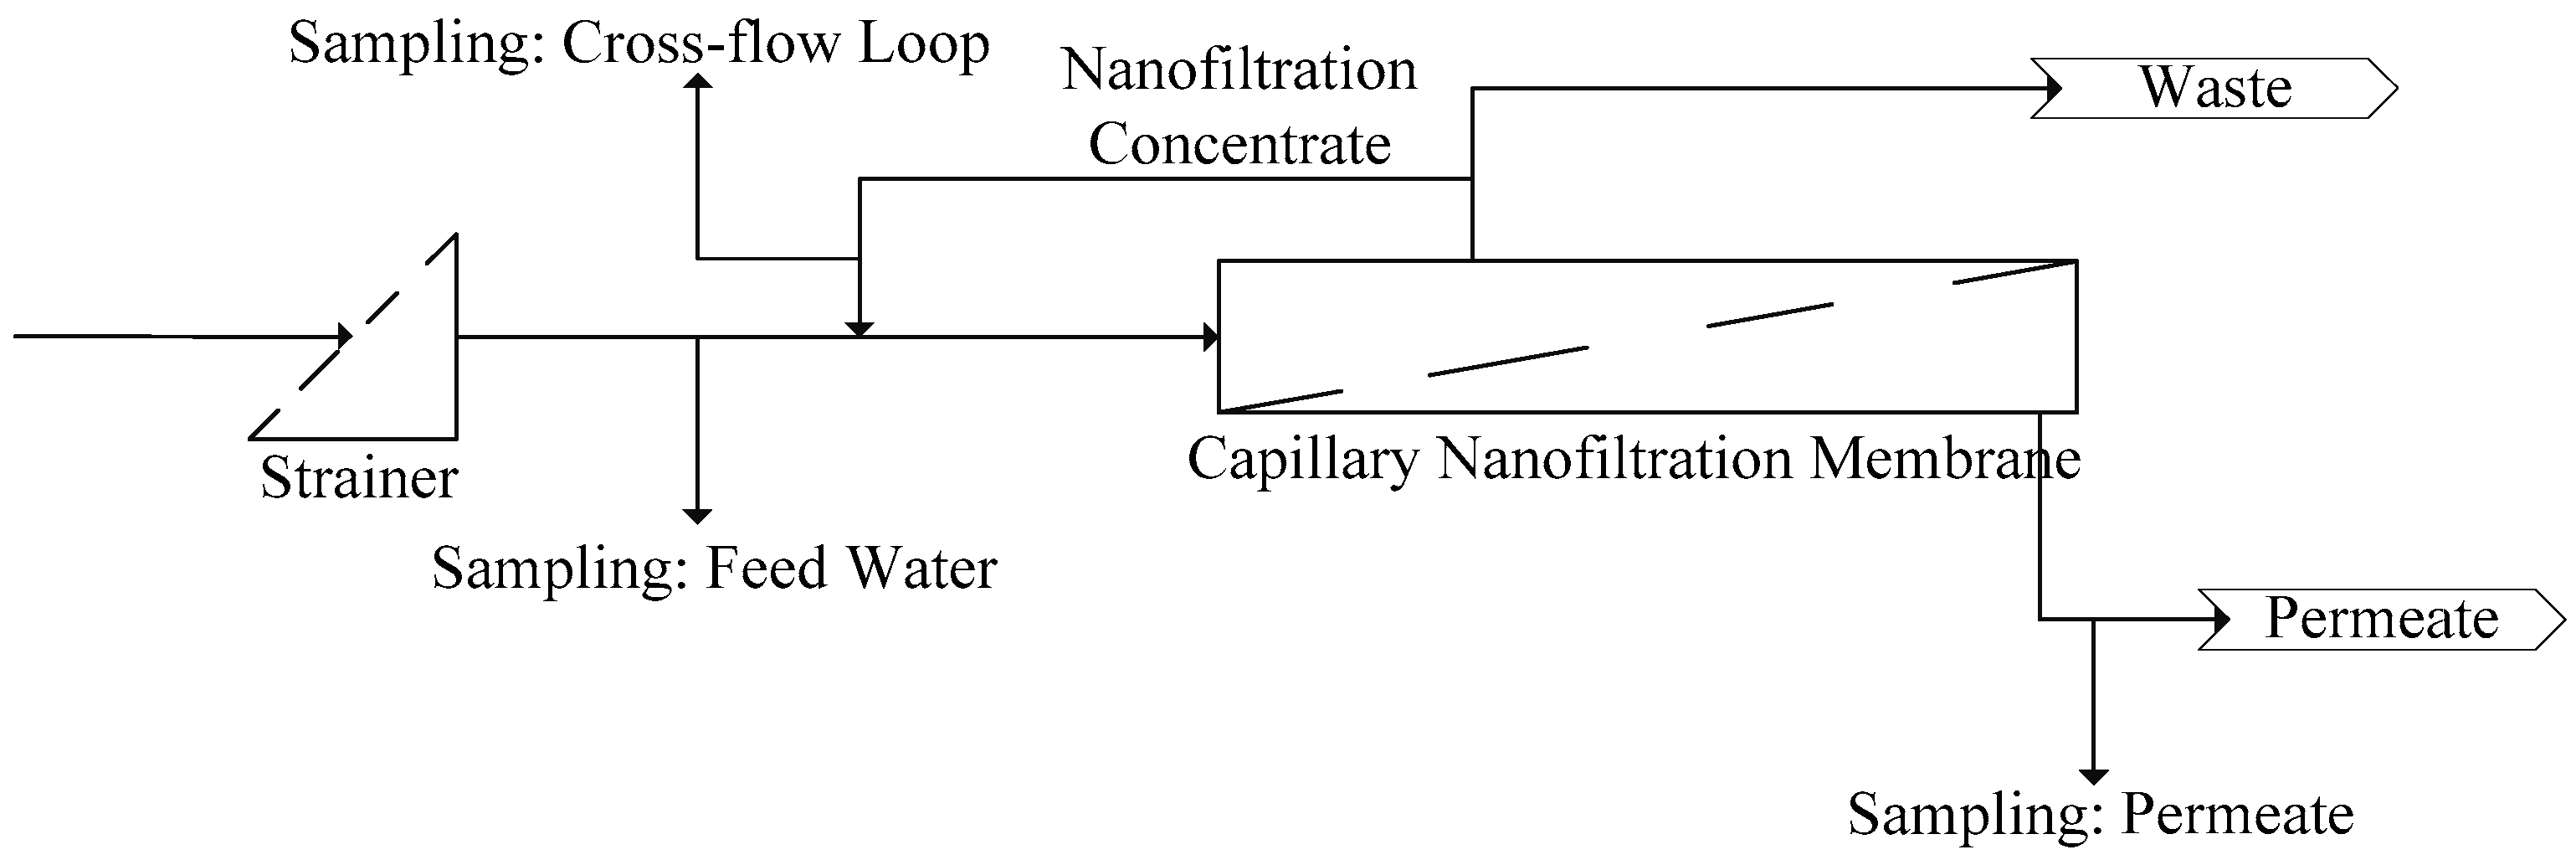
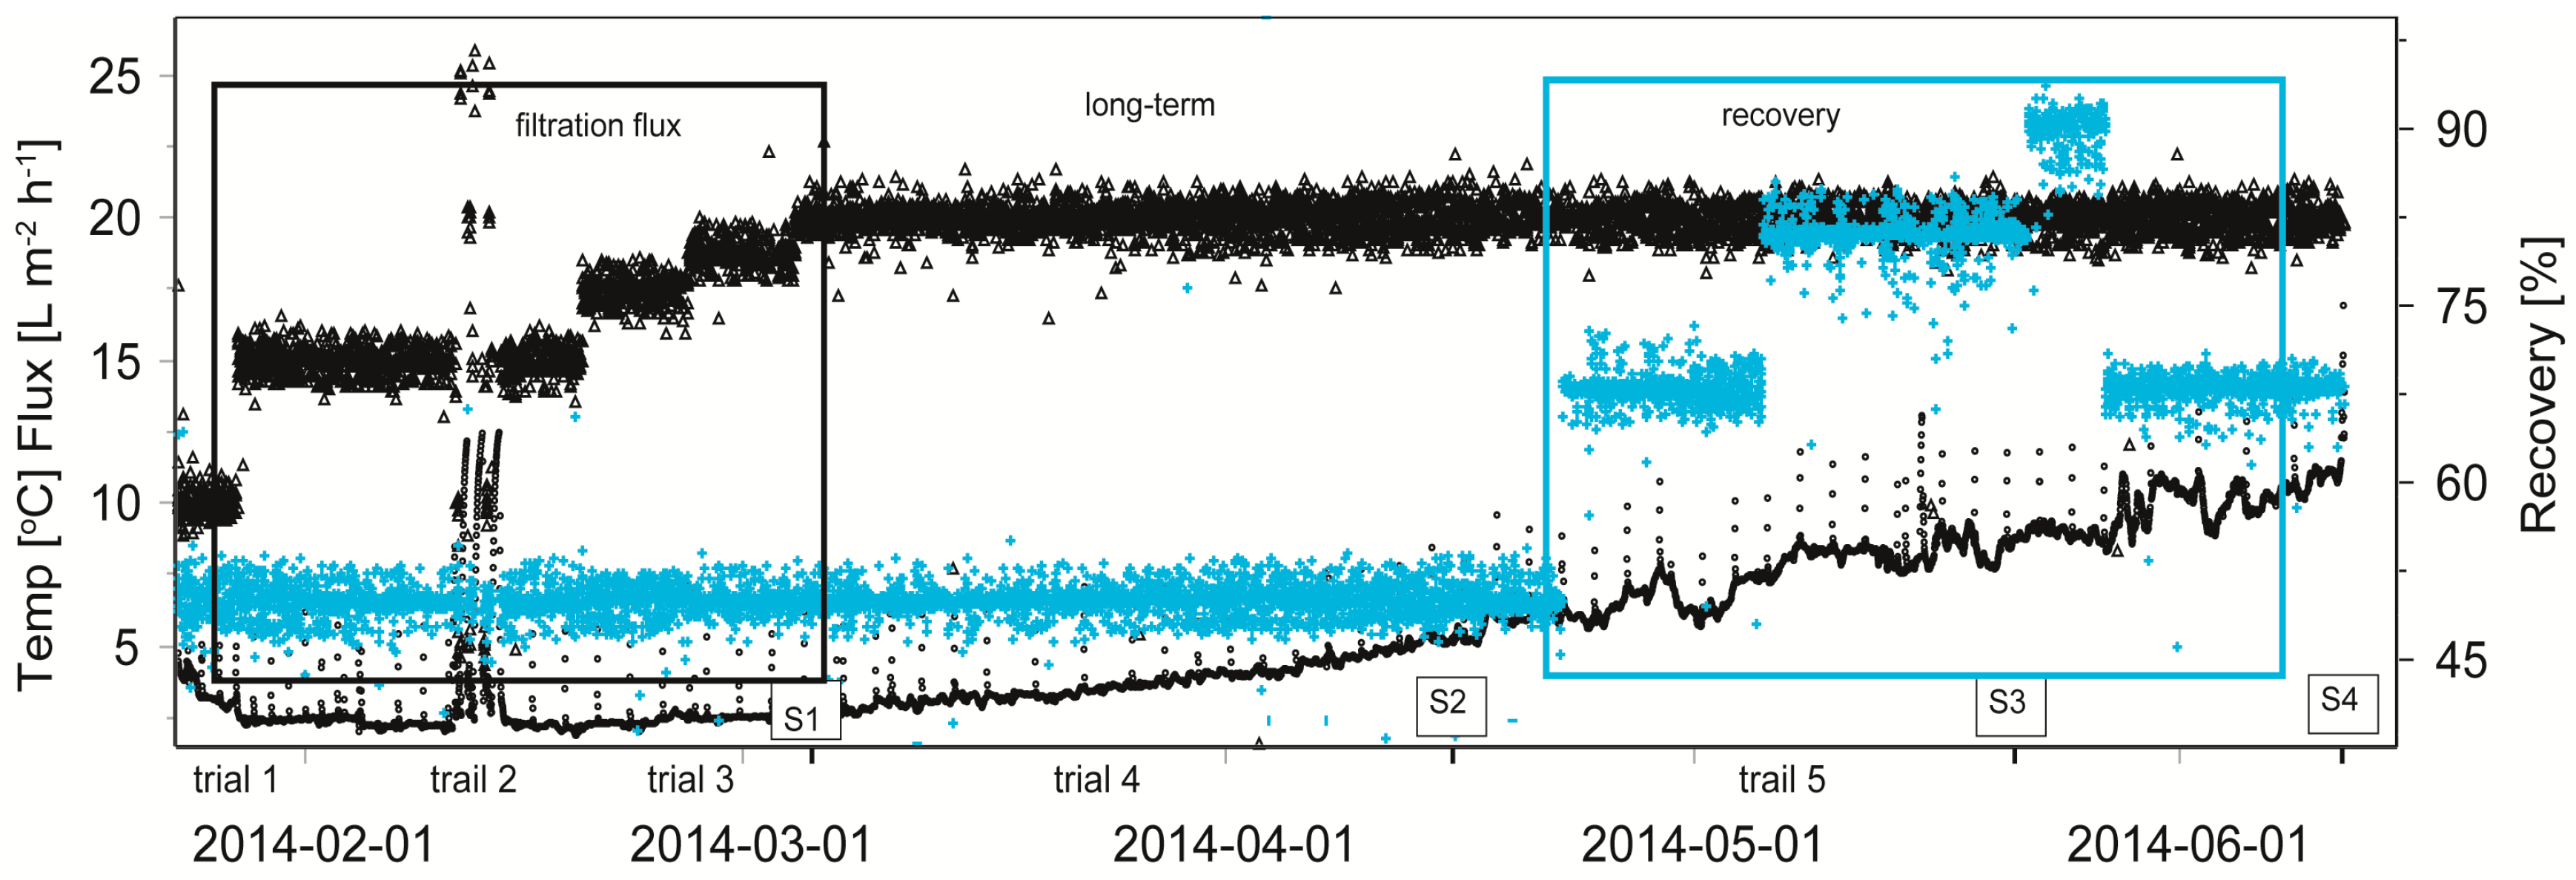
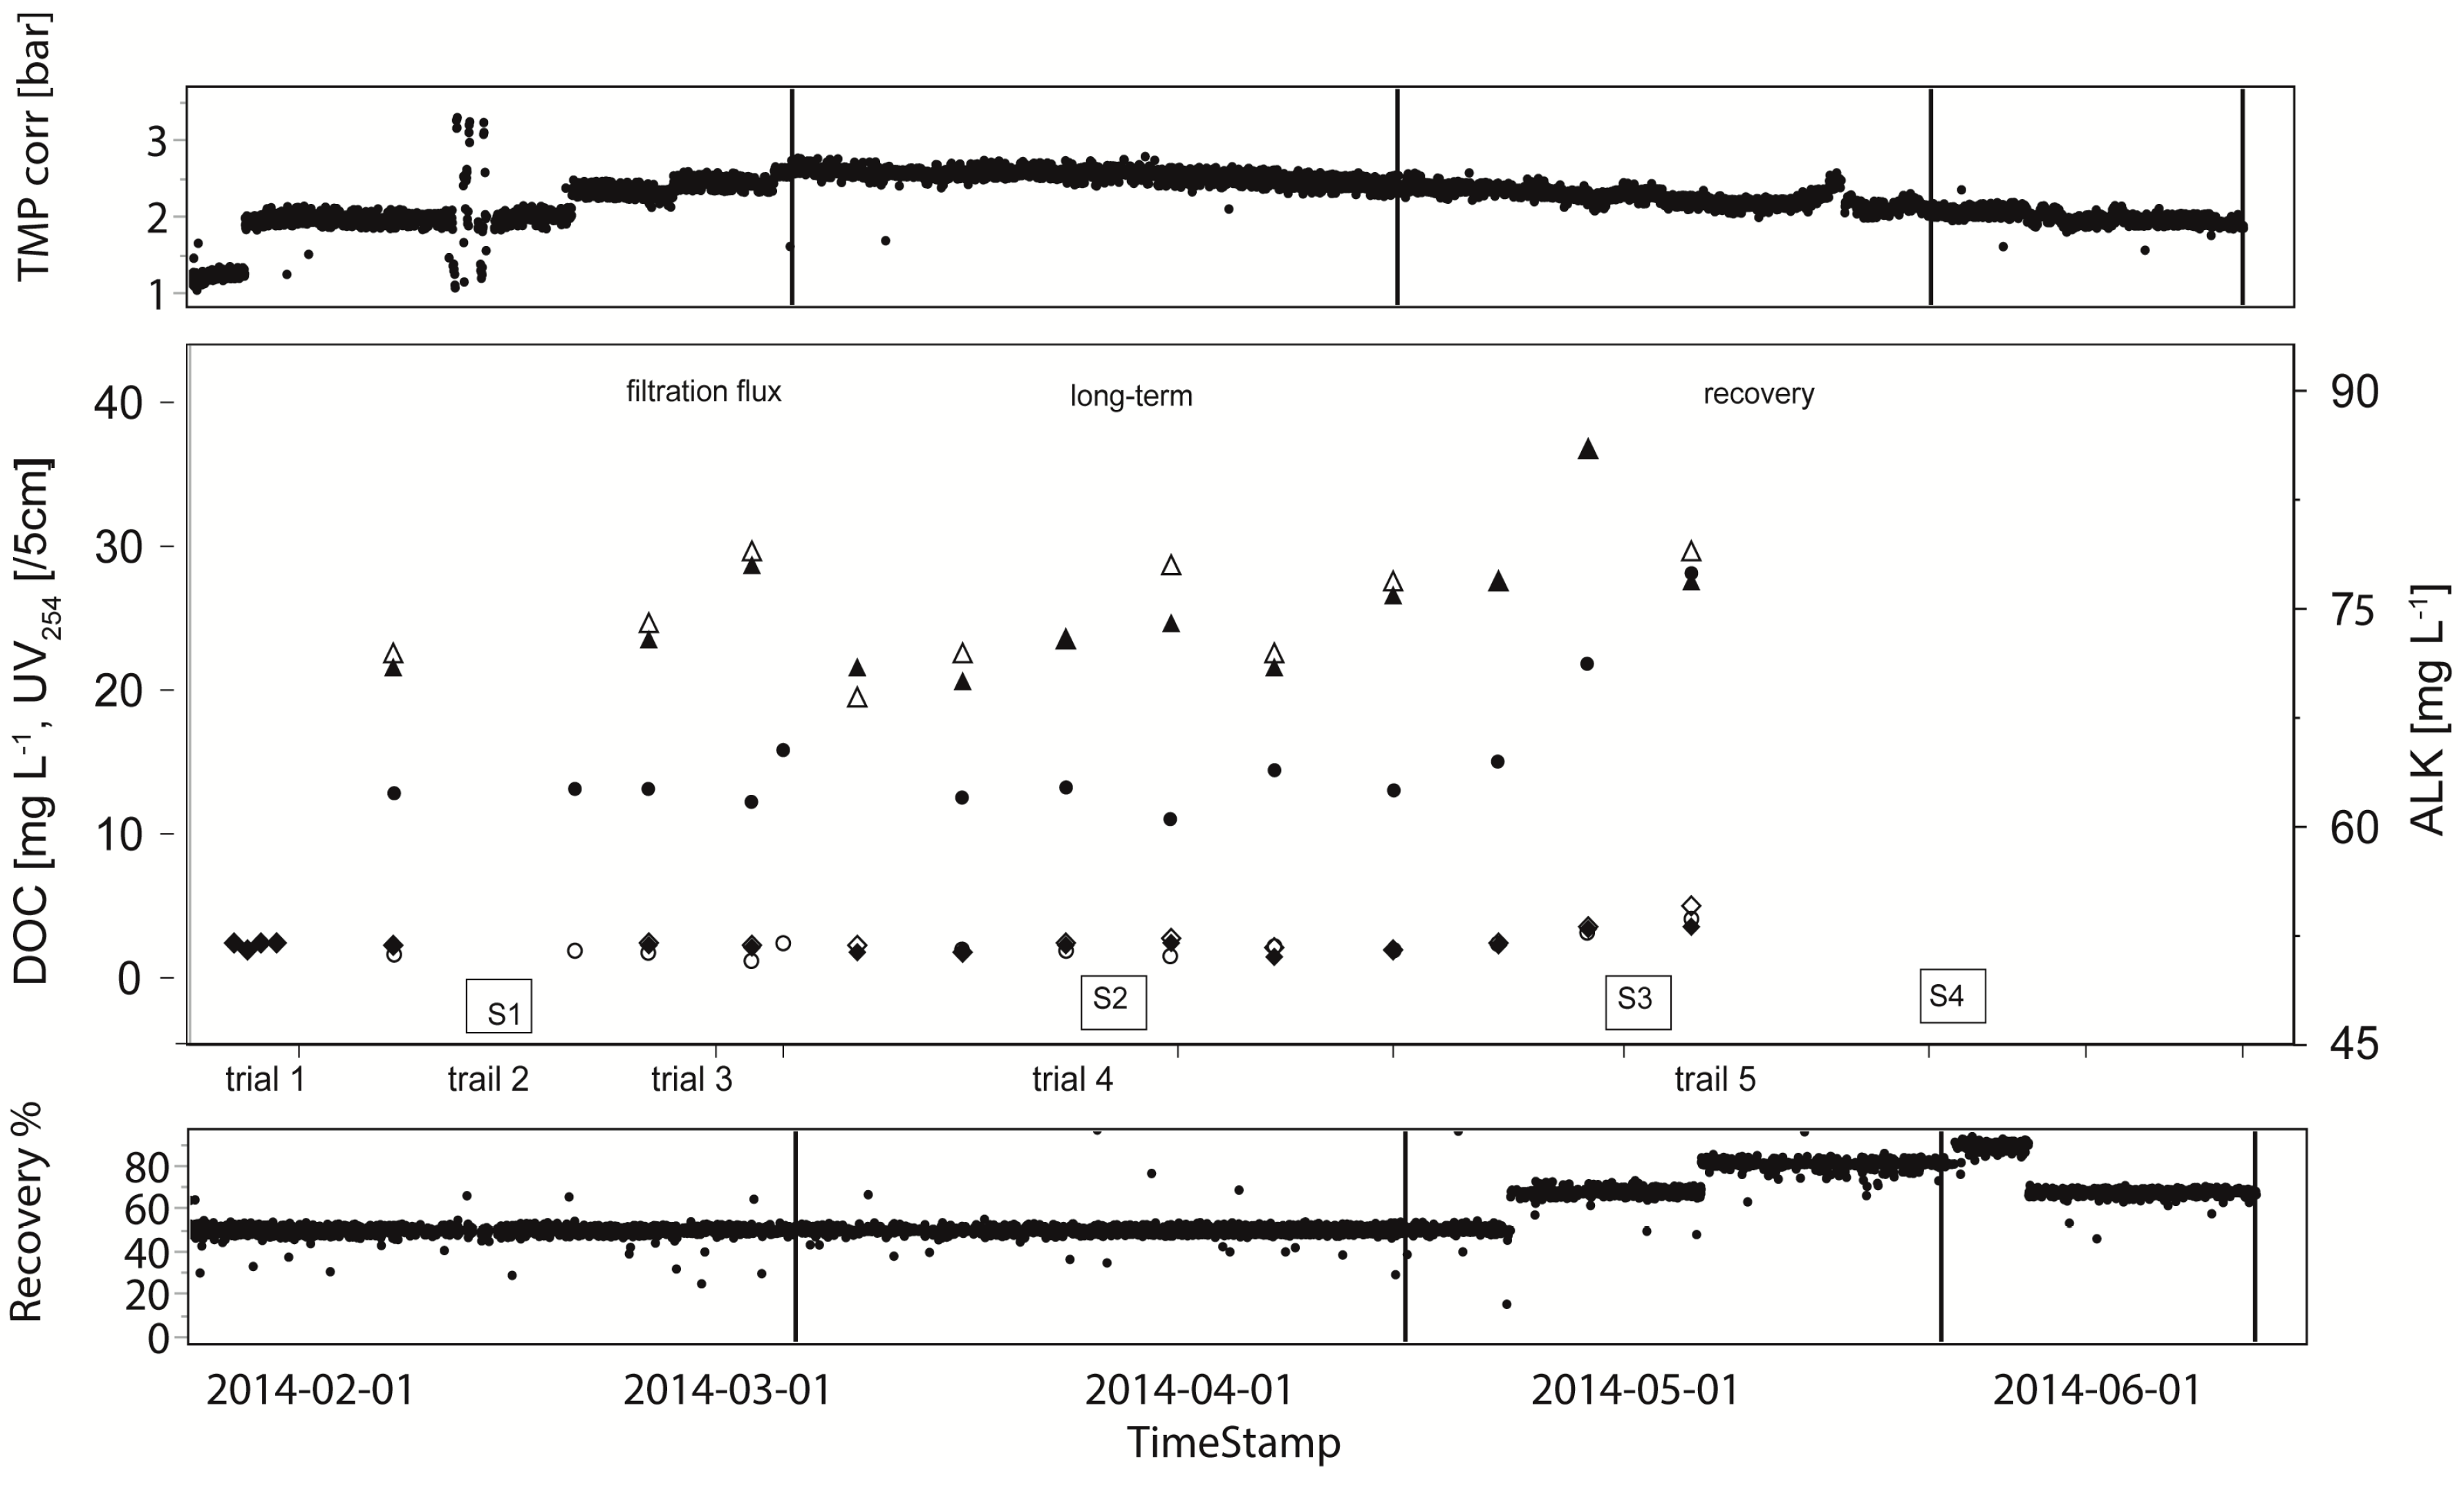
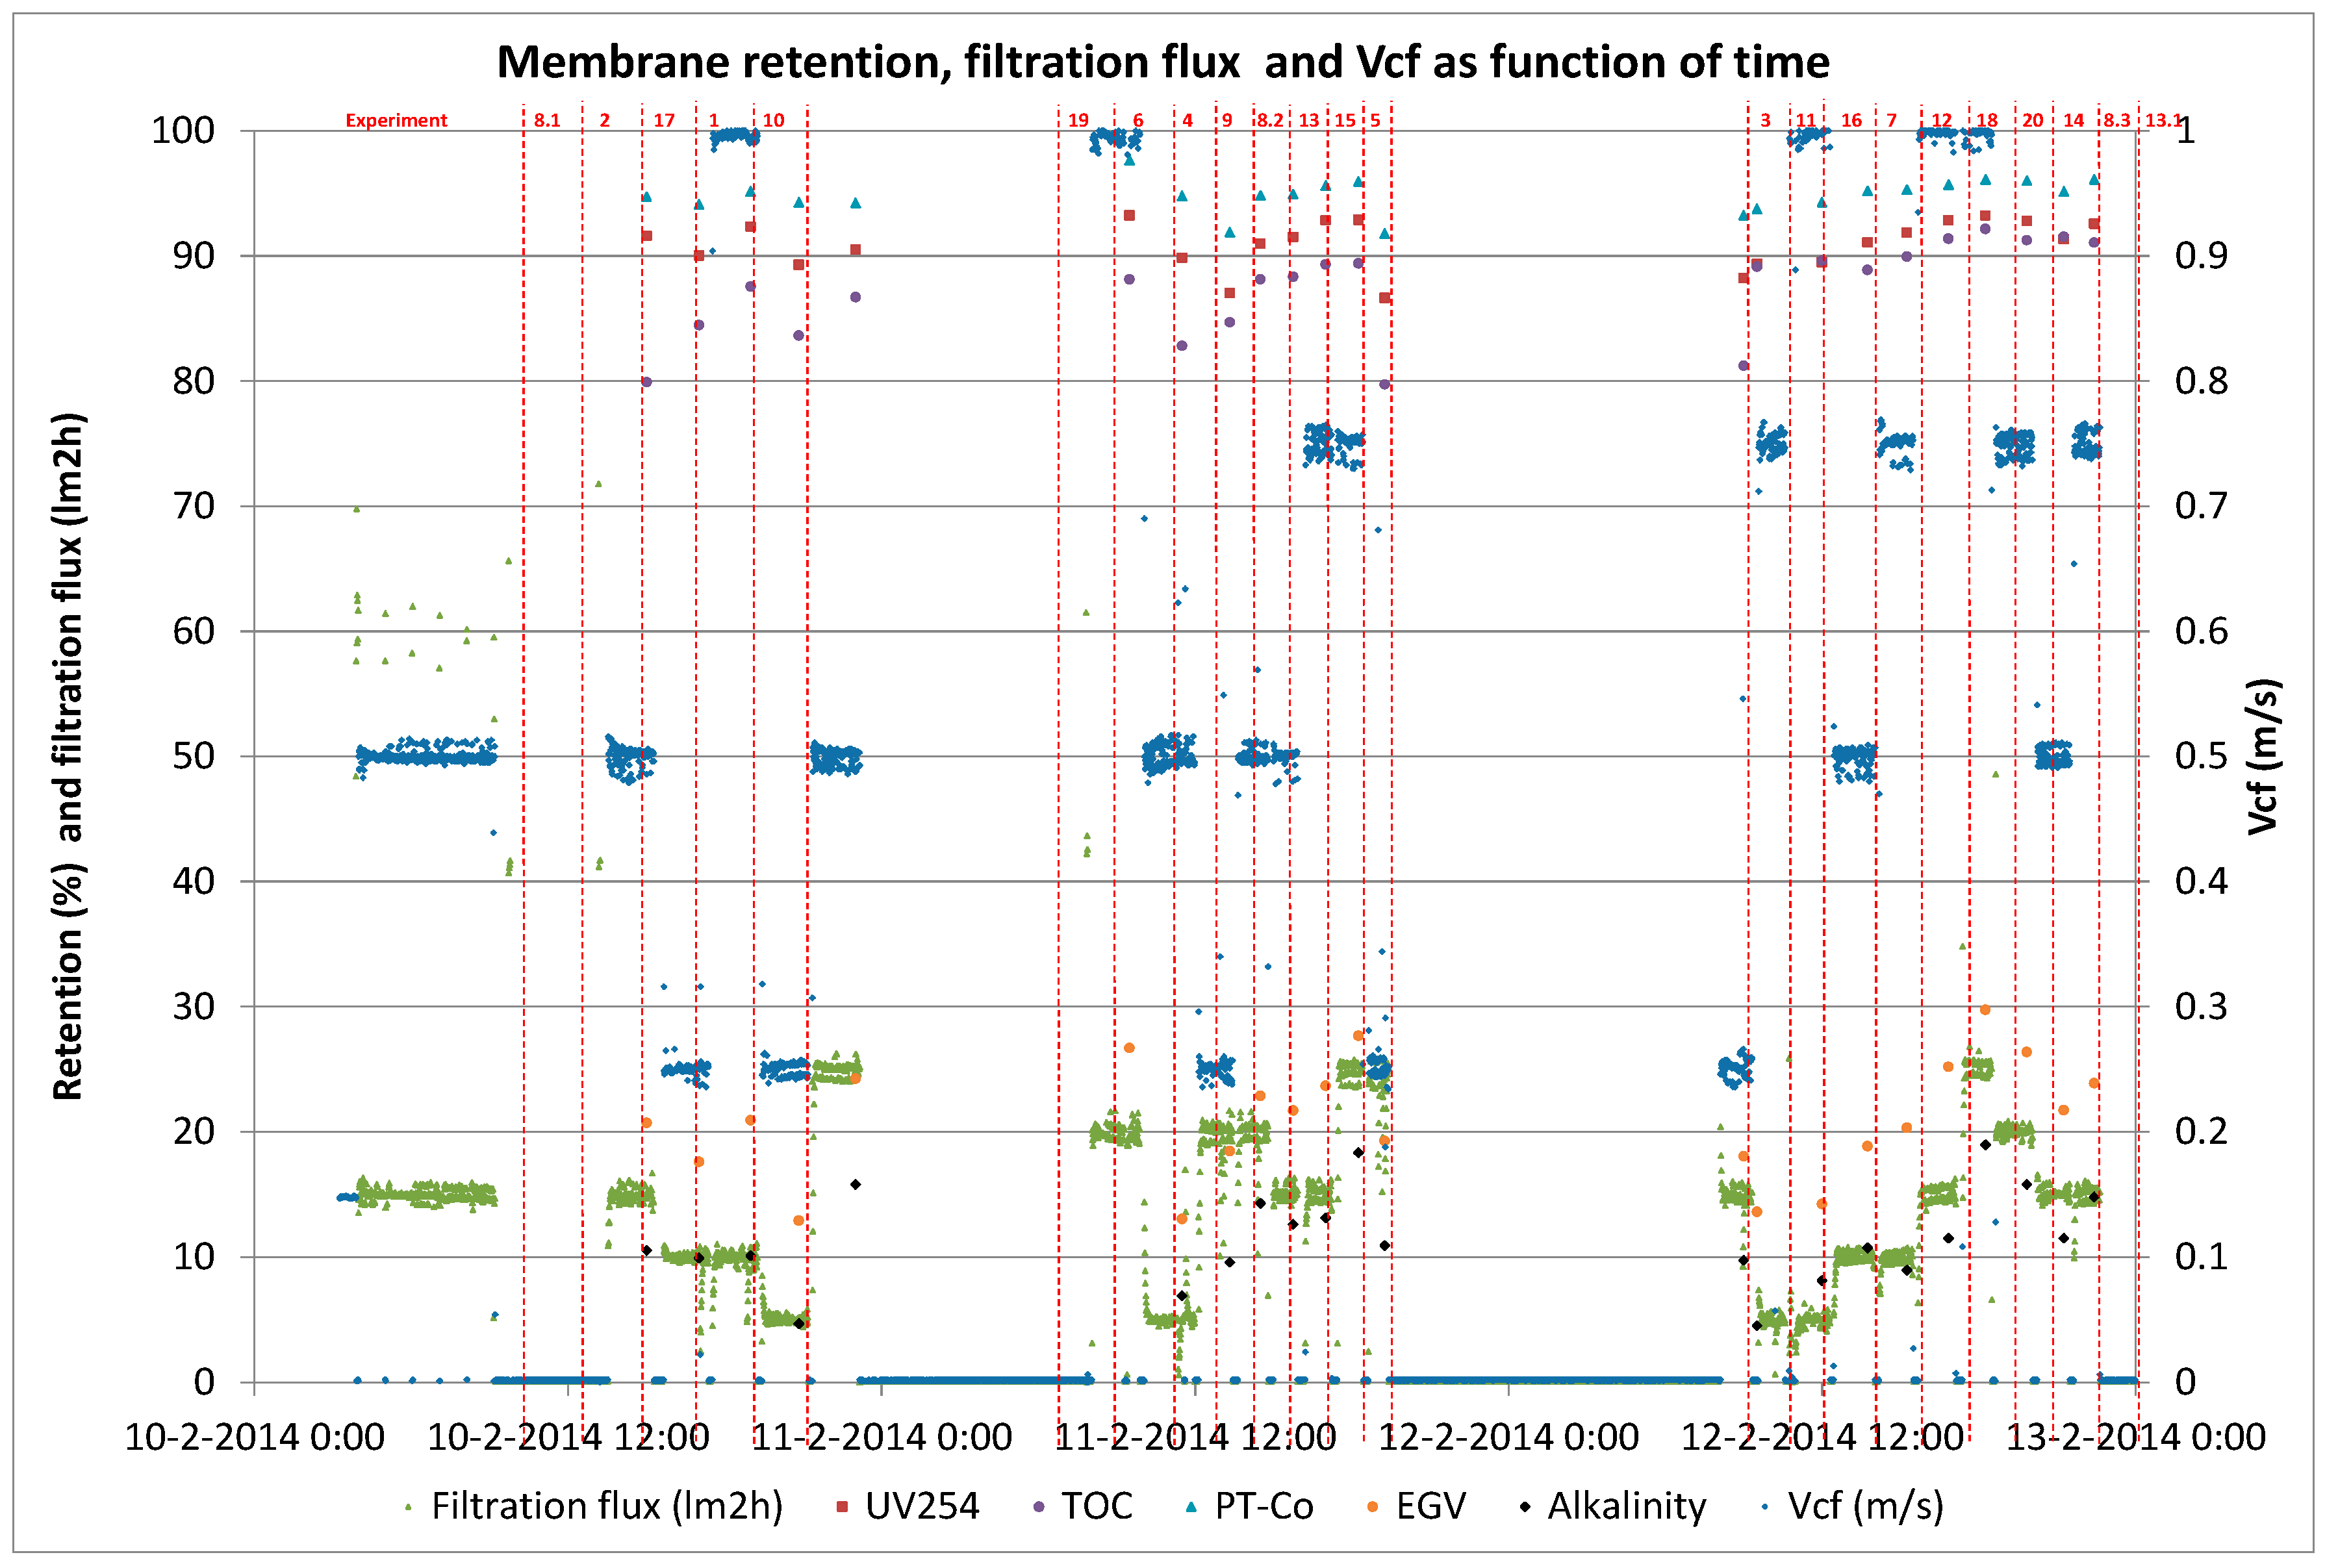
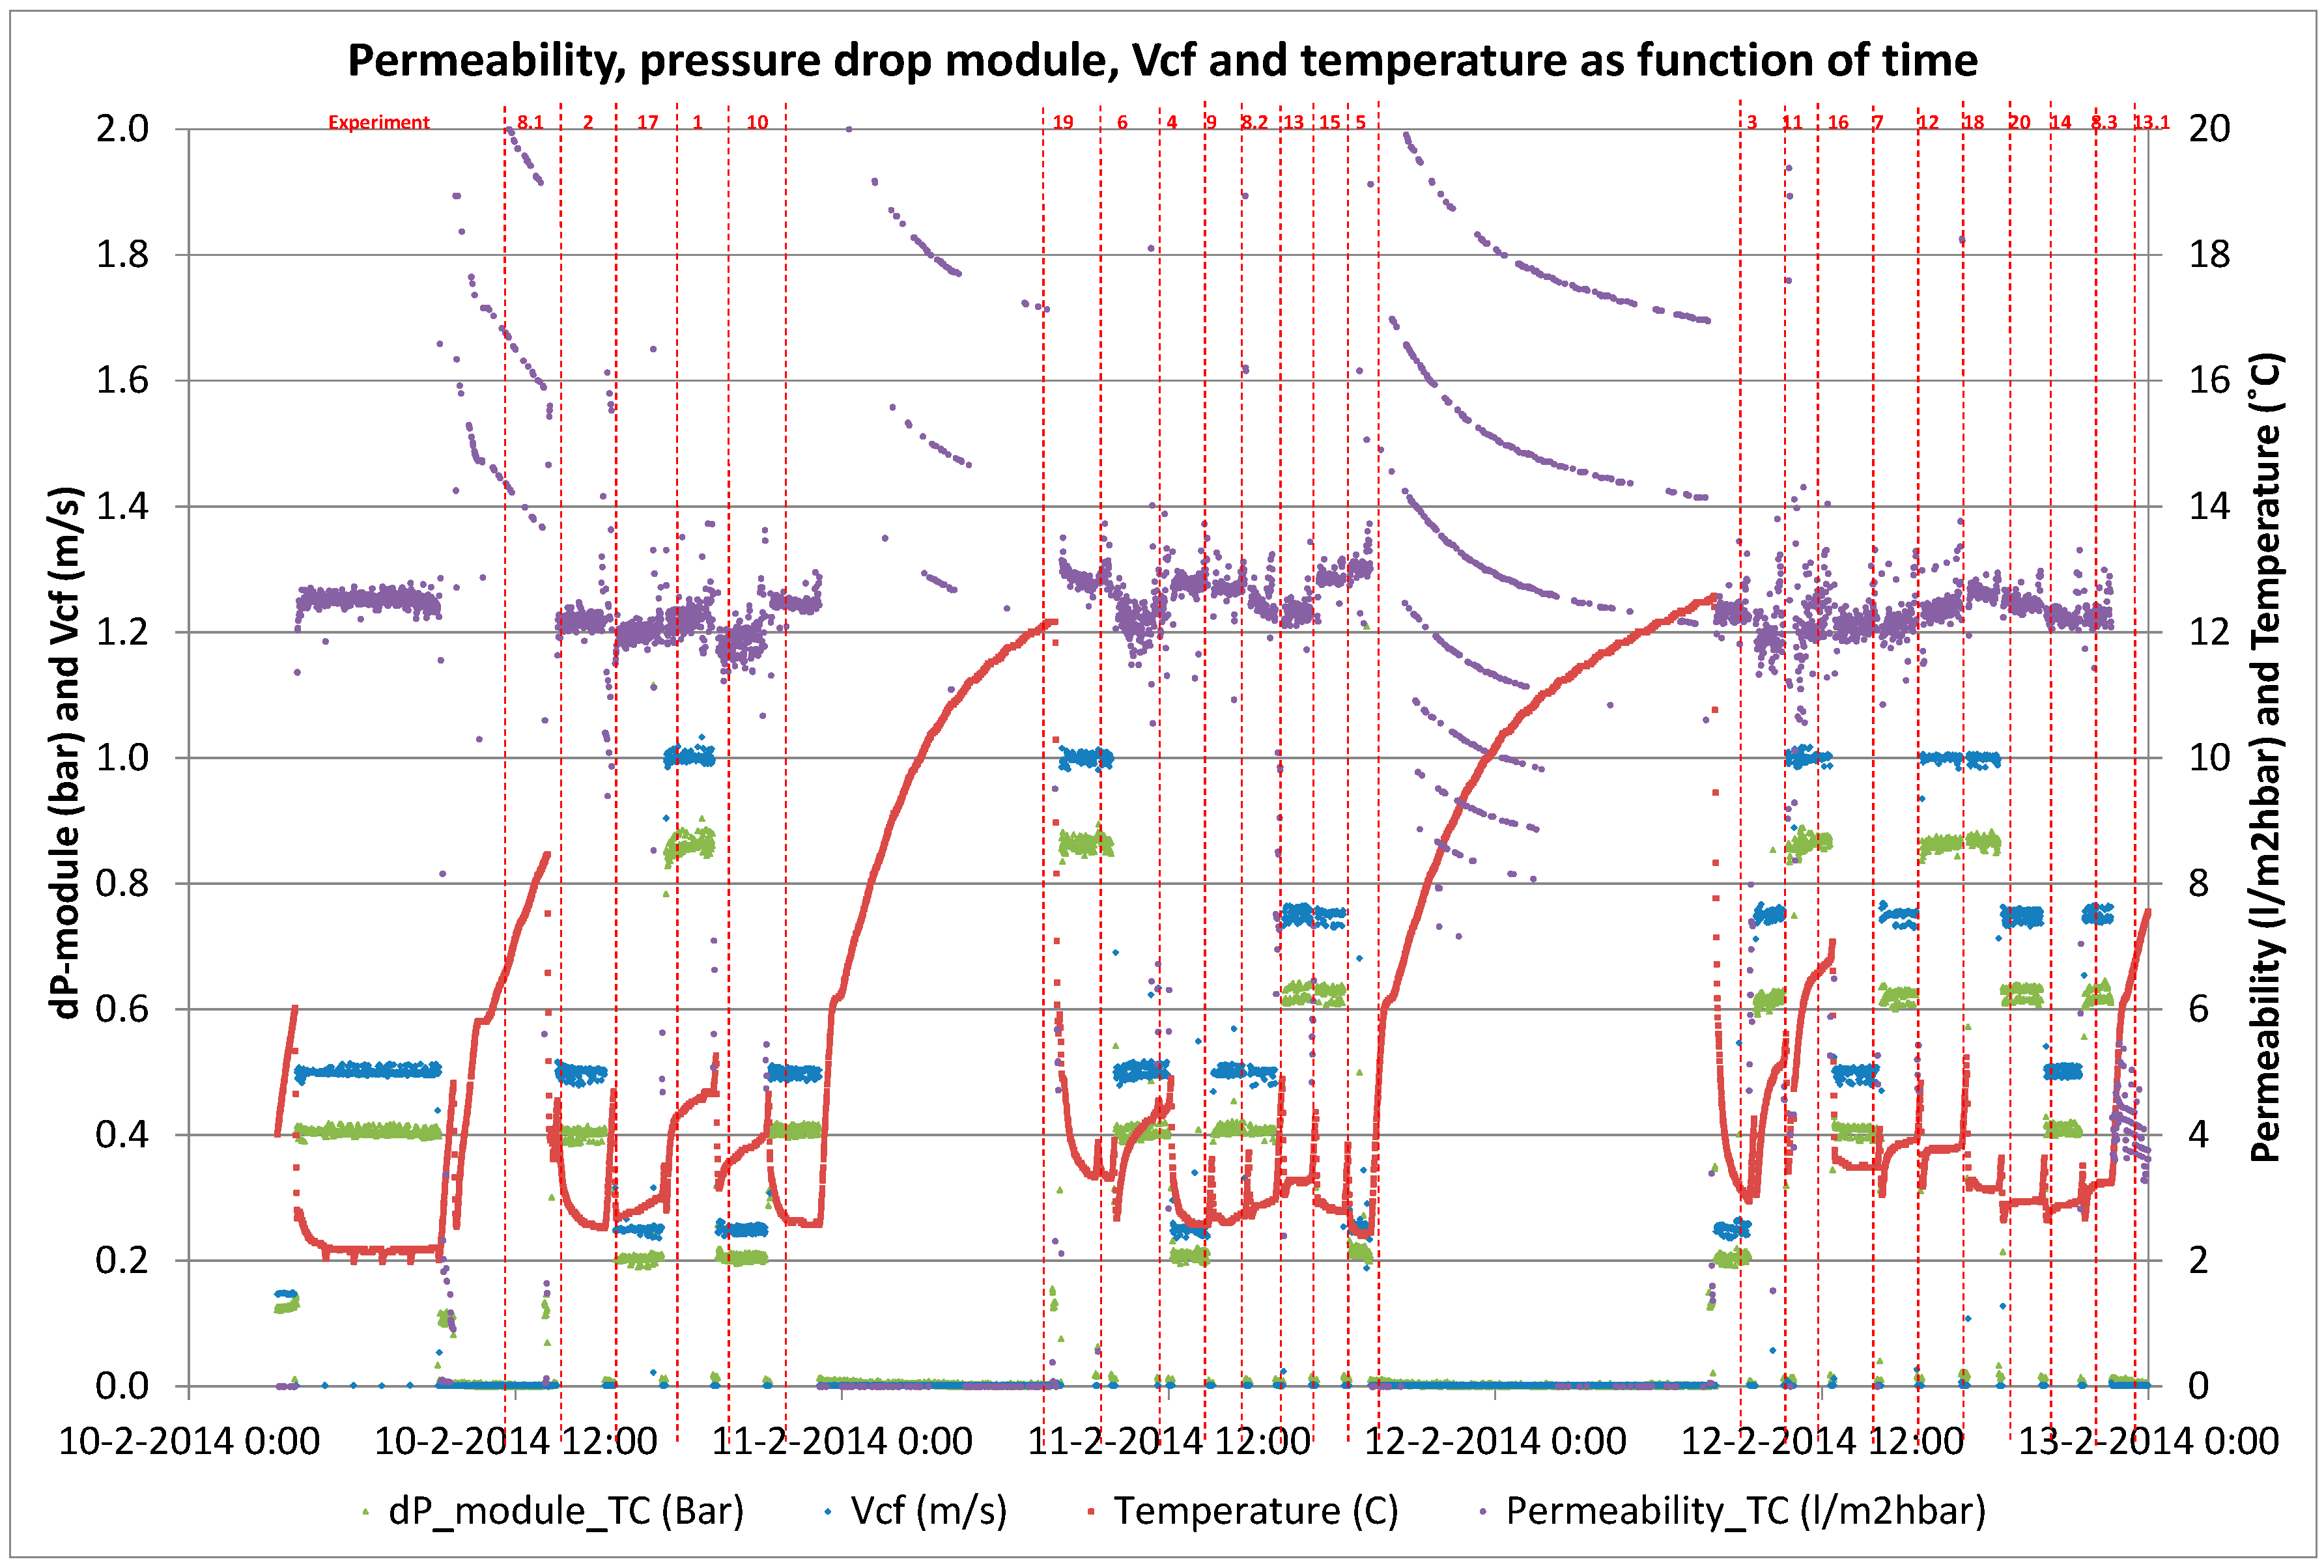
This paper describes and evaluates a 6-month (from January 2014 to June 2014) pilot test of hollow fiber nanofiltration by direct filtration of surface water from Lake Mälaren, a drinking water source for more than 2 million citizens. The pilot trials were conducted at Görvälnverket WTP and operated by the water utility, Norrvatten, providing drinking water for about 500,000 people in the northern part of the Swedish capital of Stockholm.
Twenty short-term (<2 h) experiments, at a fixed recovery of 50%, with sufficient variations in filtration flux (5–25 L·m−2·h−1) and cross-flow velocity (0.25–1.0 m·s−1) were performed with a fully automated pilot plant to determine the solute diffusion coefficient and solute permeability coefficient to predict NOM retention (i.e., DOC). These short term experiments were complemented with a long term performance test of direct filtration at fixed filtration flux of 20 L·m−2 h−1 and fixed cross flow (0.5 m·s−1) but at varying recoveries (50%–90%) using the above-mentioned pilot plant. For all experiments, conventional NOM analysis (TOC, DOC, UV absorbance) was combined with LC-OCD analysis for feed water, concentrate and permeate to elucidate the retention of specific NOM fractions as a function of varying operation conditions.
2. Theory
In theory, both the convection and solution diffusion models might be applicable for the HFW 1000 separation process, since the test membrane is positioned between a dense UF and an open NF (MWCO: ~1000 Da). Recent studies of the capillary nanofiltration membrane for determination of source specific model parameters showed a good fit of experimental results based on the solution diffusion model [
31,
32,
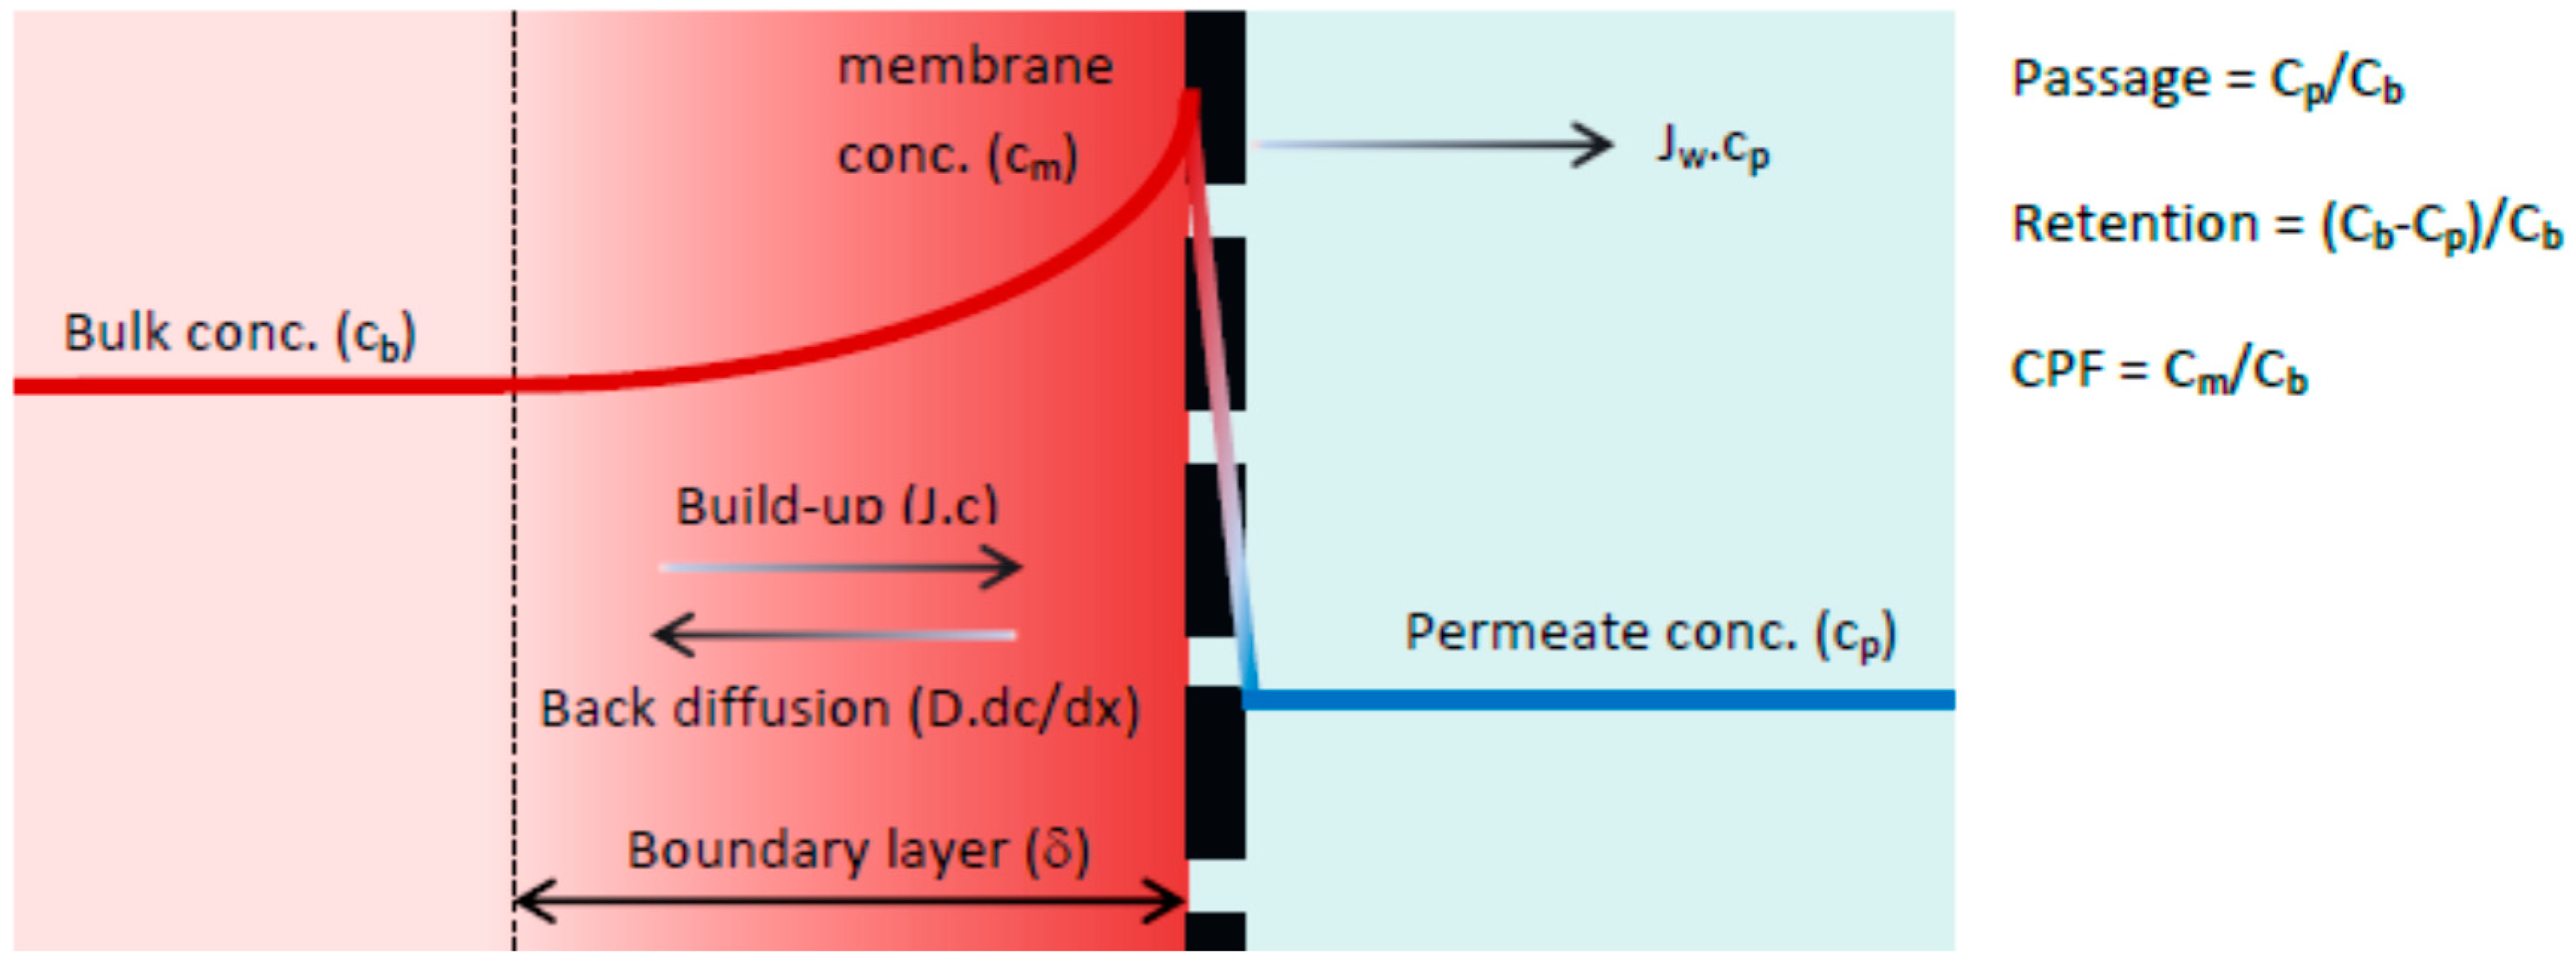
33]. According to previous research, the selected membrane is a loose and open NF membrane and therefore can be described as a non-porous membrane. The solution-diffusion model, which is based on the film theory, was used for the active membrane layer. When a driving force is applied on the feed solution, the solvent starts to permeate freely while the solute is partially retained by the membrane. As a result, the solute concentration in the permeate (C
p) will be lower compared with the bulk solution (C
b). Retained solutes accumulate near the membrane surface, gradually increasing the local concentration (C
m). This increase in concentration is the driving force for back diffusion into the bulk of the feed and after a given period, steady state conditions are established. Thus, the driving force for solute permeation is assumed to rely solely on diffusion due to a concentration difference between permeate (C
p) and the concentration at the membrane surface (C
m). A schematic representation of the concentration polarization phenomena is given in
Figure 1.
The boundary layer (δ) is defined as the distance from the membrane surface where the solute concentration equals the bulk concentration (complete mixing). In the boundary layer the solute concentration will reach a maximum value at the membrane surface (C
m). The solution diffusion model differs from the convection model in how solute transport through the membrane is defined. The driving forces for solute permeation are assumed to rely solely on diffusion due to a solute concentration difference between permeate (C
p) and concentration at the membrane surface (C
m). The rate of solute permeation is determined by the solute permeability coefficient (B) expressed in (m·s
−1). By performing a mass balance across the concentration polarization layer, the film model is obtained (Equation (1)). Subsequent substitution of the rate of solute permeation yields Equation (2) which describes the passage for the solution diffusion model [
34].
where,
Cp = Concentration in the permeate (e.g., TOC in mg·L−1 or UV extinction in m−1)
Cb = Concentration in the bulk (actual feed)
Cm = Concentration at the membrane surface
Jw = Filtration flux (m3·m−2·s−1)
k = Mass transfer coefficient (m·s−1)
v = Cross flow velocity (m·s−1)
d = Hydraulic membrane diameter (m)
L = Membrane length (m)
B = Solute permeability coefficient (m·s−1)
D = Solute diffusion coefficient (m2·s−1)
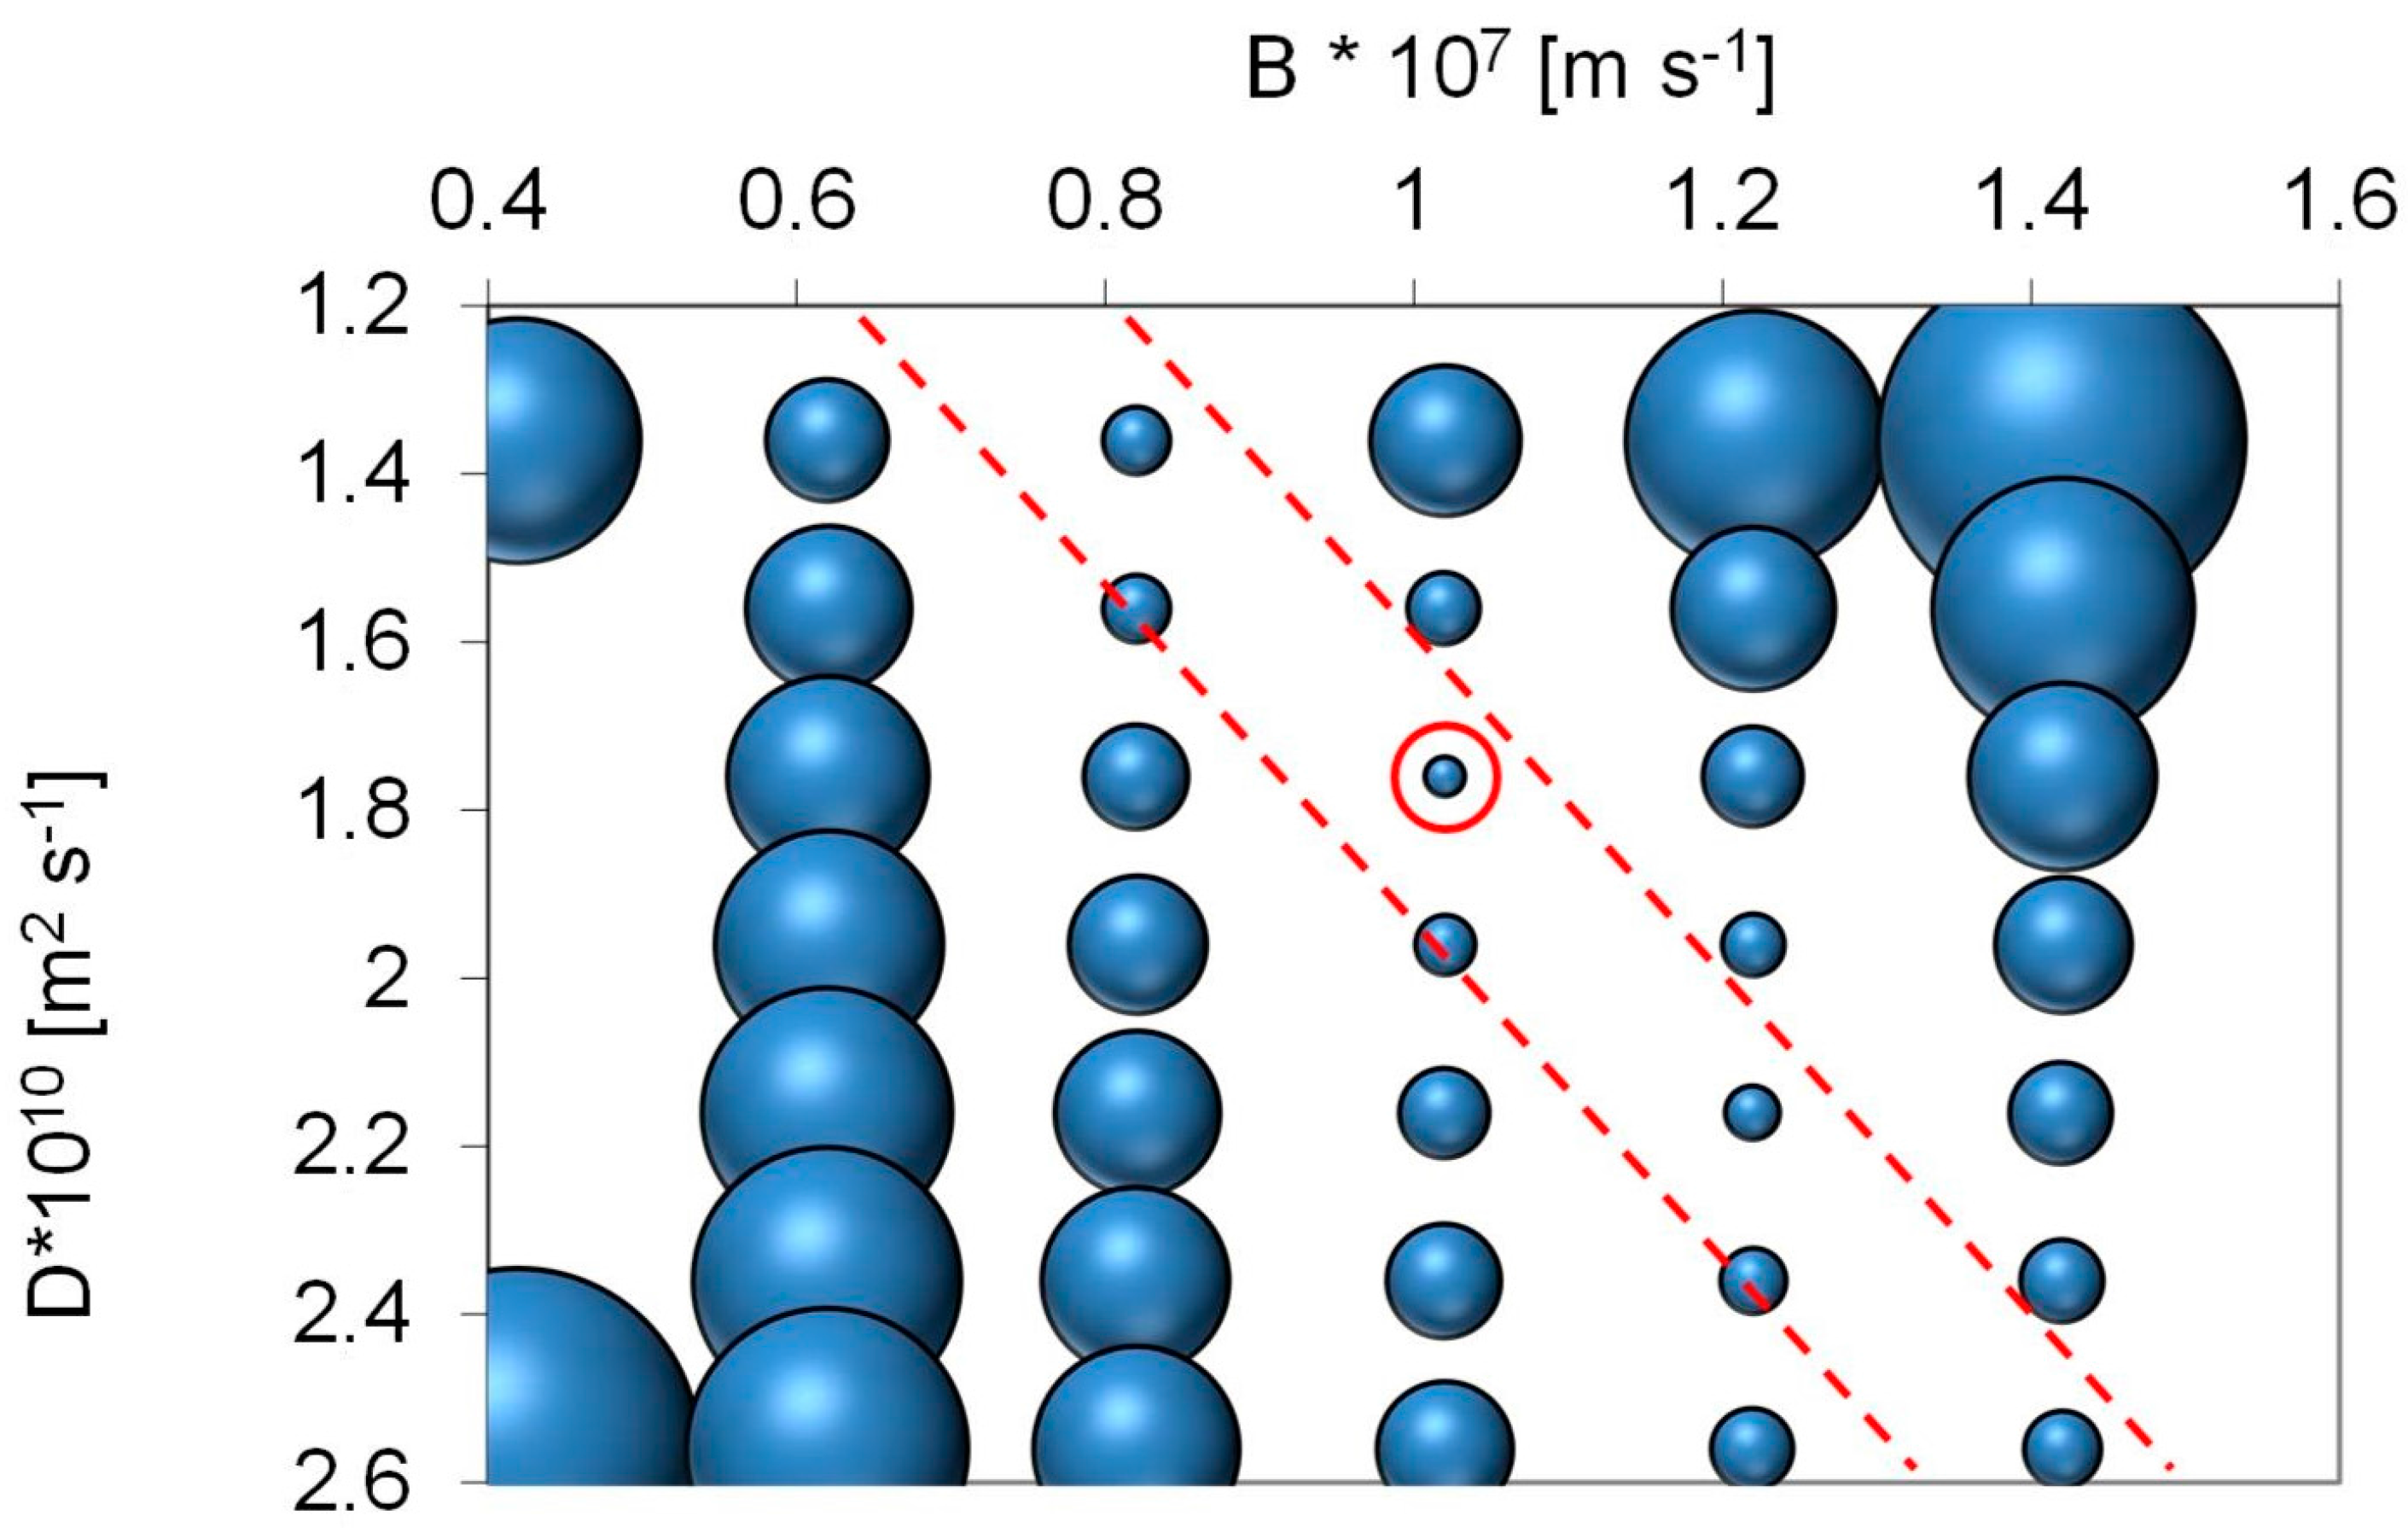
The solution diffusion model has two unknown parameters, the solute diffusion coefficient, D, and the solute permeability coefficient, B. These two latter parameters were fitted using the experimental results from pilot trials.
Model fitting was performed through an iterative process with the initial value of solute diffusion coefficient, D, based on the literature value reported by Park et al. [
35]. Mass transfer coefficients, k, were calculated using Equation (4) for laminar flow conditions at four different crossflow velocities, ranging from 0 to 3.0 m·s
−1 with corresponding Reynolds numbers of 0 to 2400 for 0.8 mm membrane fibres. The TOC and UV
254 of the permeate were calculated using Equation (1) and compared with experimentally measured values. The final model fitting parameters of D, and B were determined using the Least Square Error method through the ‘Generalized Reduced Gradient’ (GRG2) algorithm in Excel (Solver).
It should be noted that only the concentrations of fraction (II) of the TOC were used for the model calibration as fraction (I) was only present in the feed water and concentrate, and fractions (III) was present in the same quantitative amount in the feed water and permeate.
5. Conclusions
Pilot studies are valuable to find optimal conditions for nanofiltration of lake water rich in organic material. The NOM removal based on capillary NF membranes from modified polyethersulfone (PES) proved to be suitable for direct nanofiltration of surface water from Lake Mälaren with high removal of NOM and minimal removal of salts.
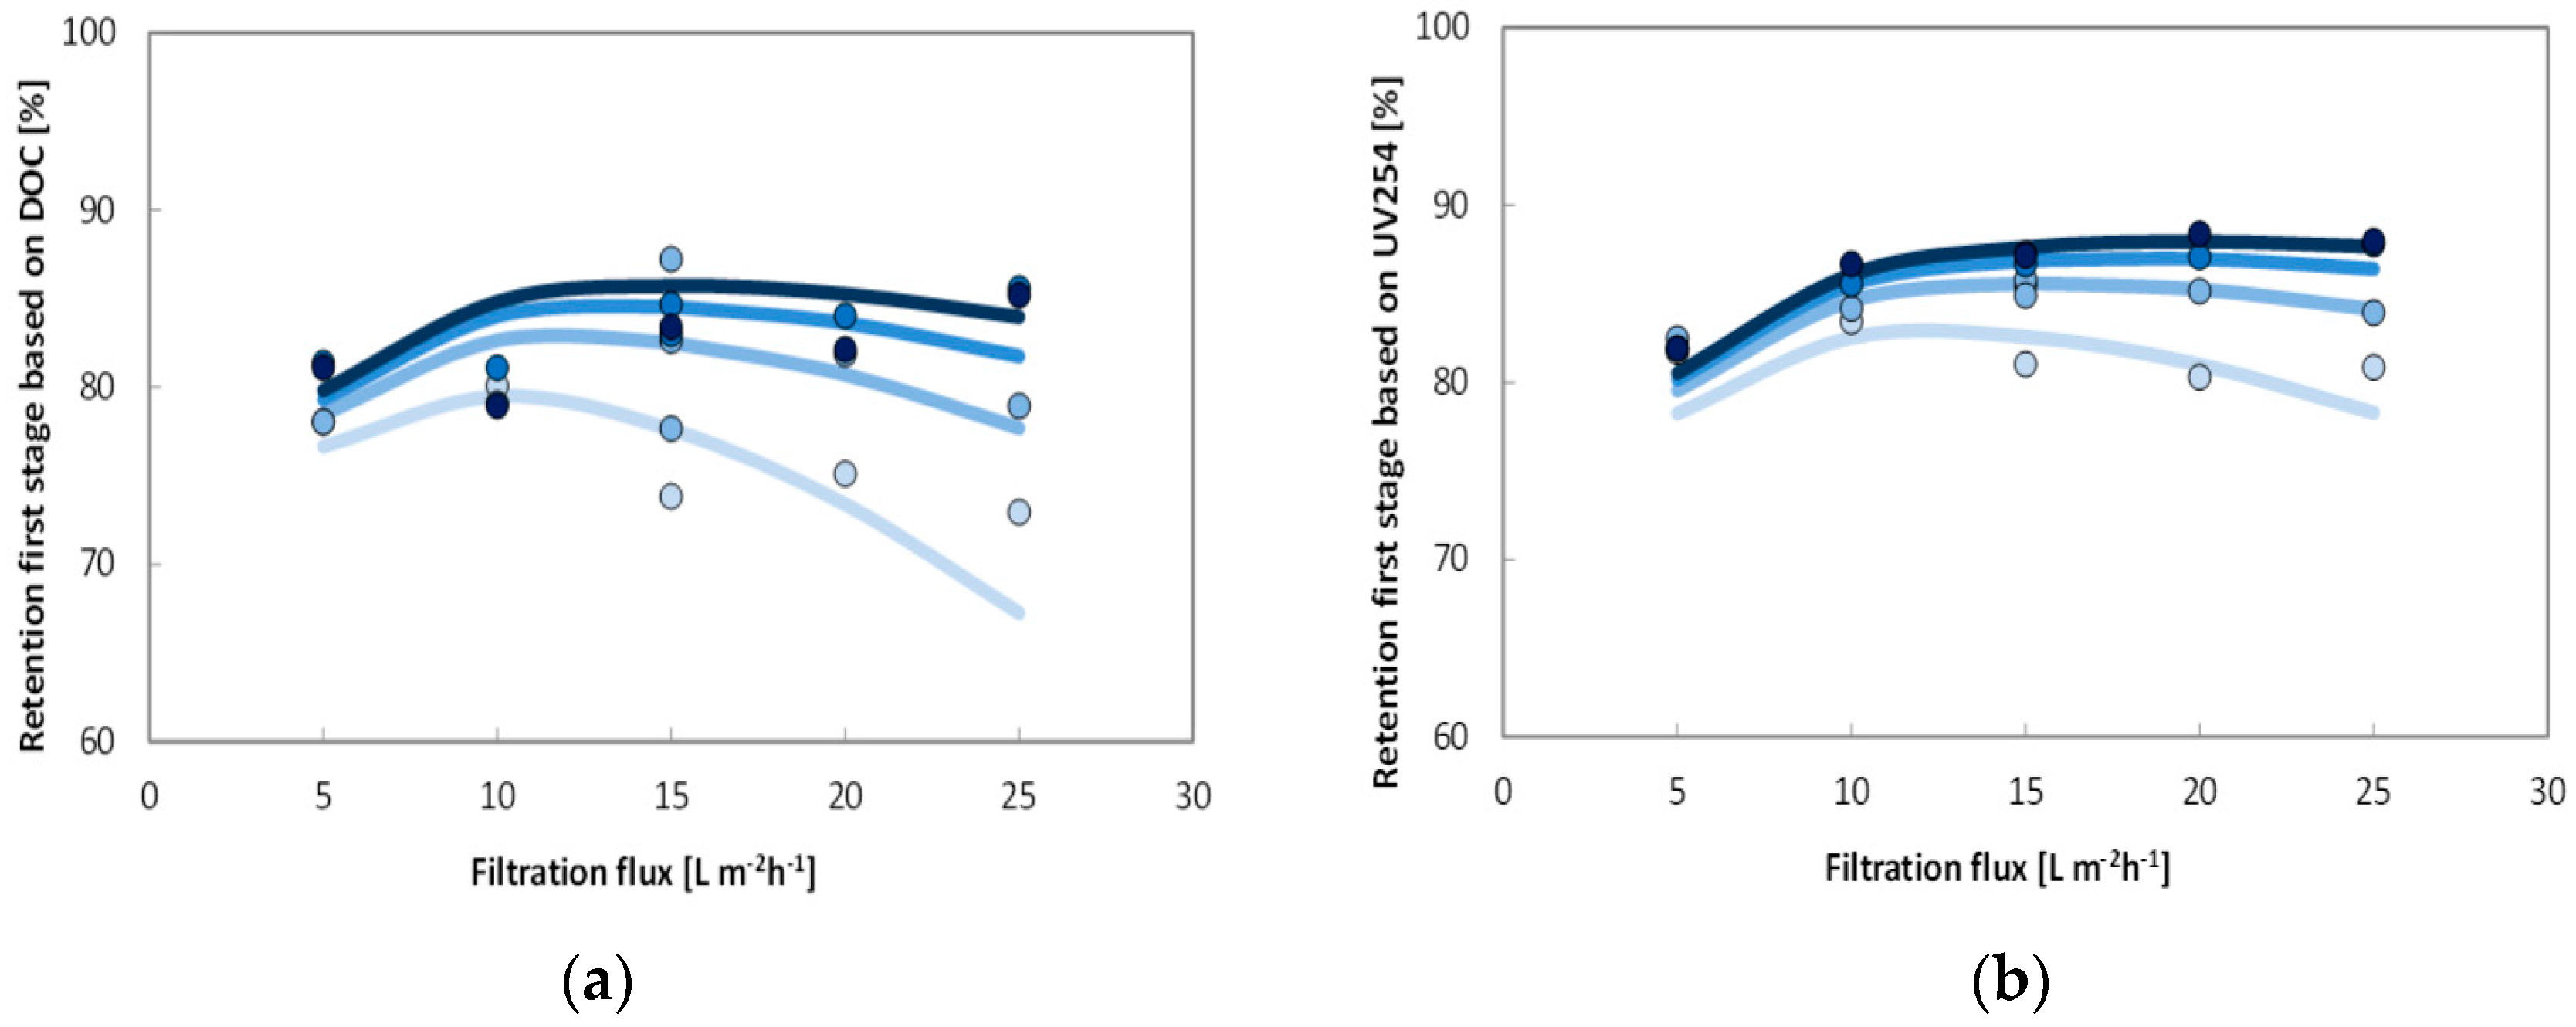
The influence of filtration and cross flow velocity on permeate quality can be described using the solution diffusion model. Therefore, the HFW1000 membrane can be categorized as a non-porous membrane with respect to NOM removal.
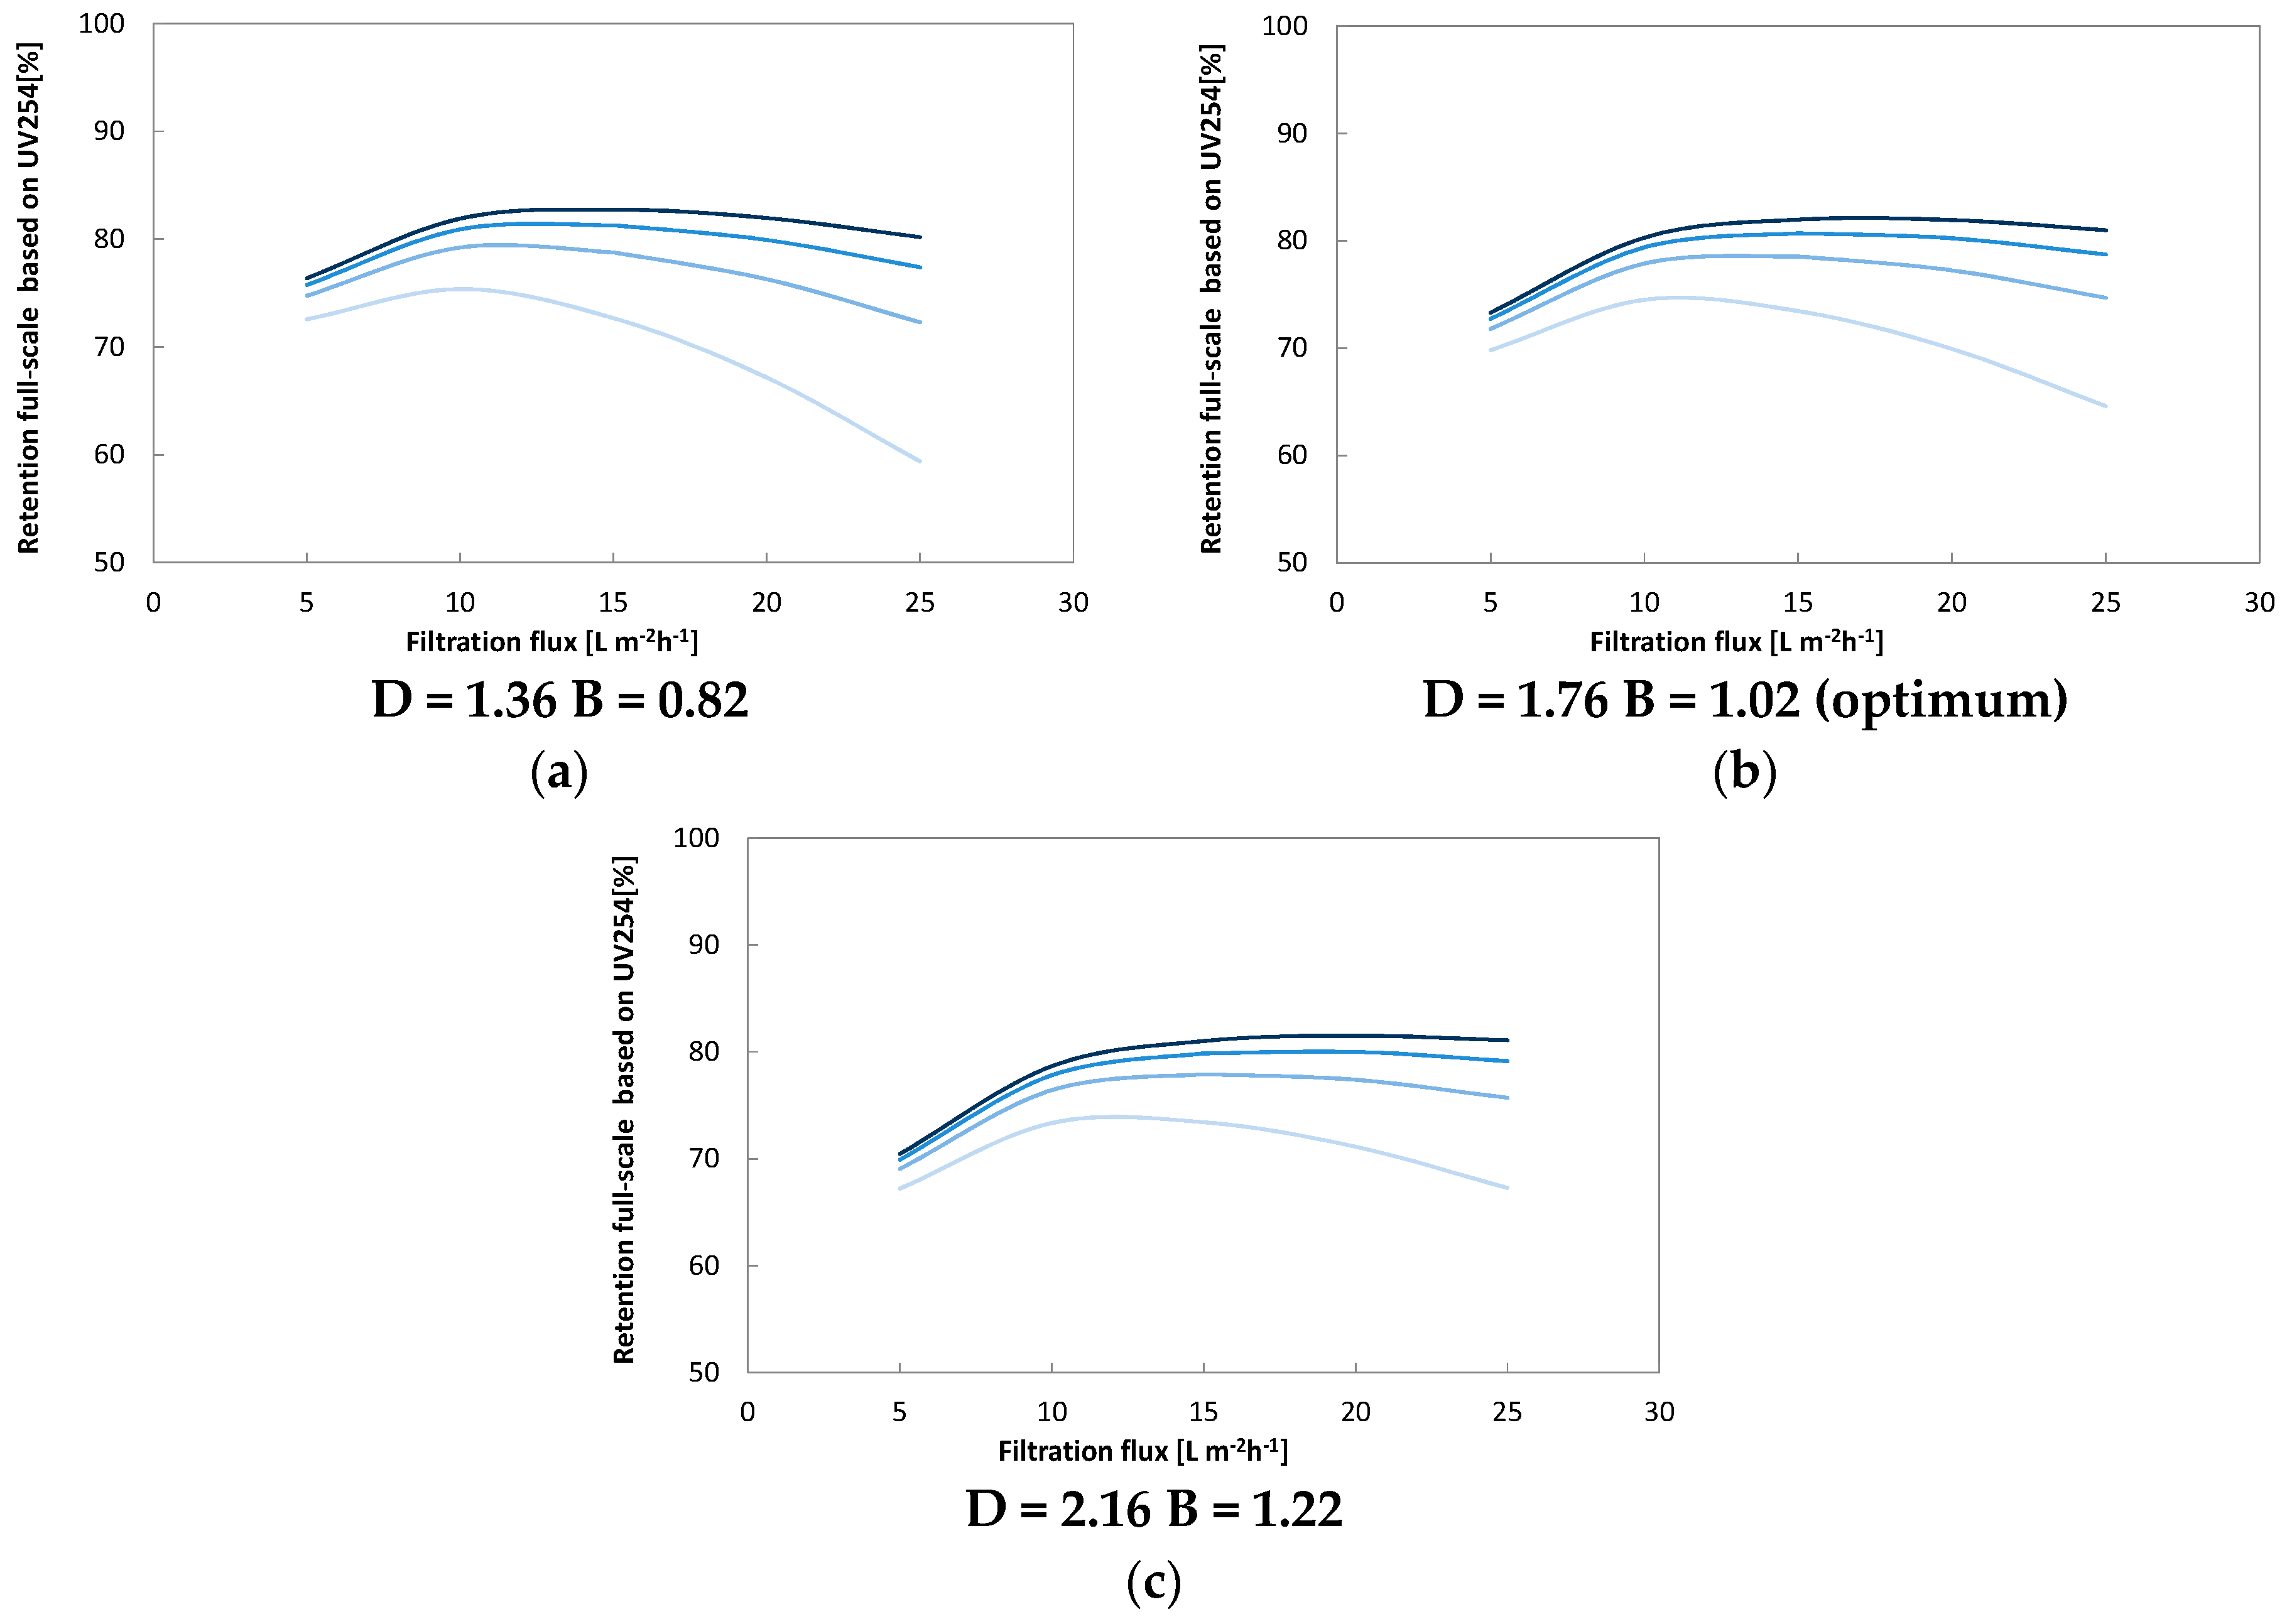
Employing the solution diffusion model, the model parameters ‘B’ and ‘D’ can be determined. For surface water from Lake Mälaren source specific model parameters were calculated based on TOC analysis as:
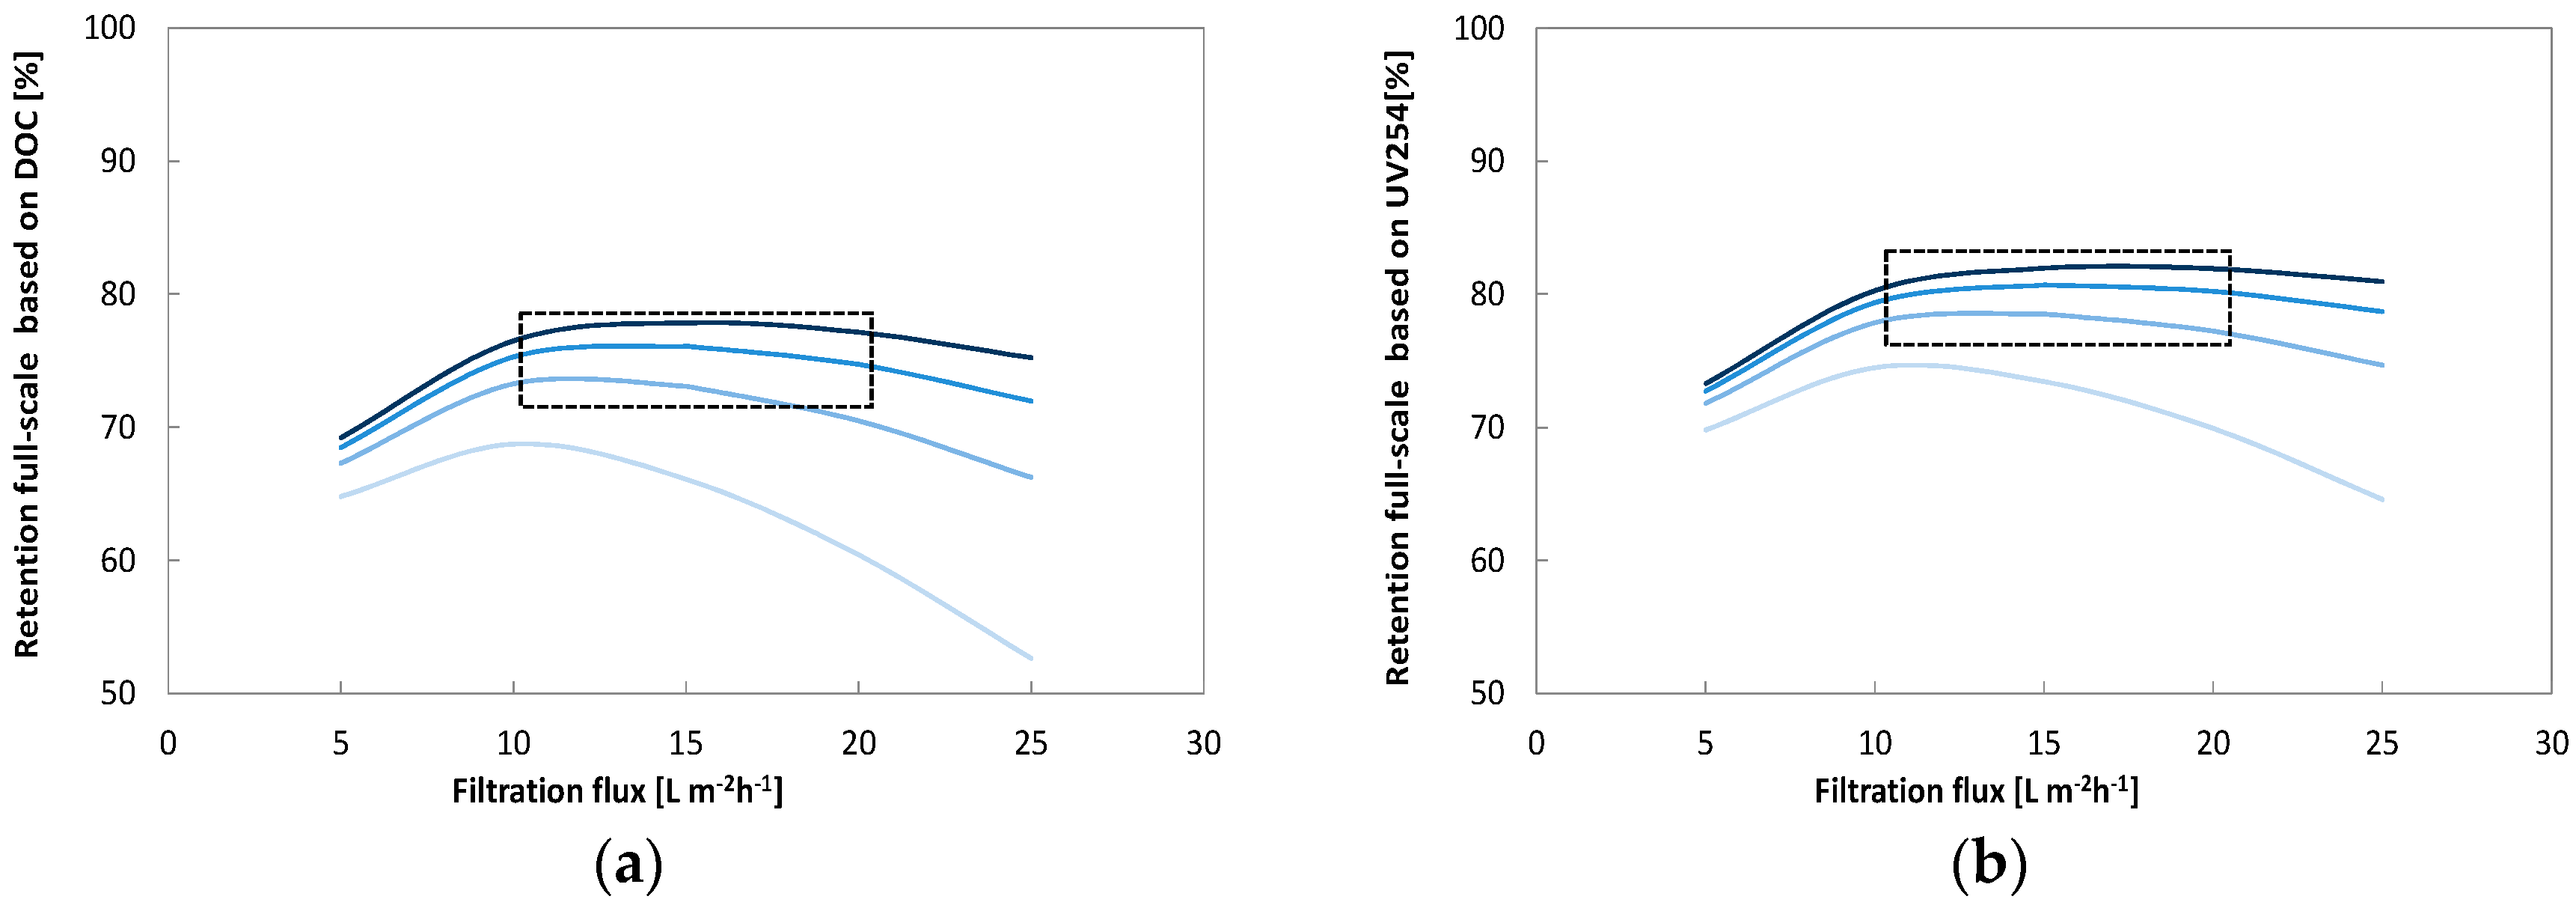
These model parameters can be used to design full-scale plants.
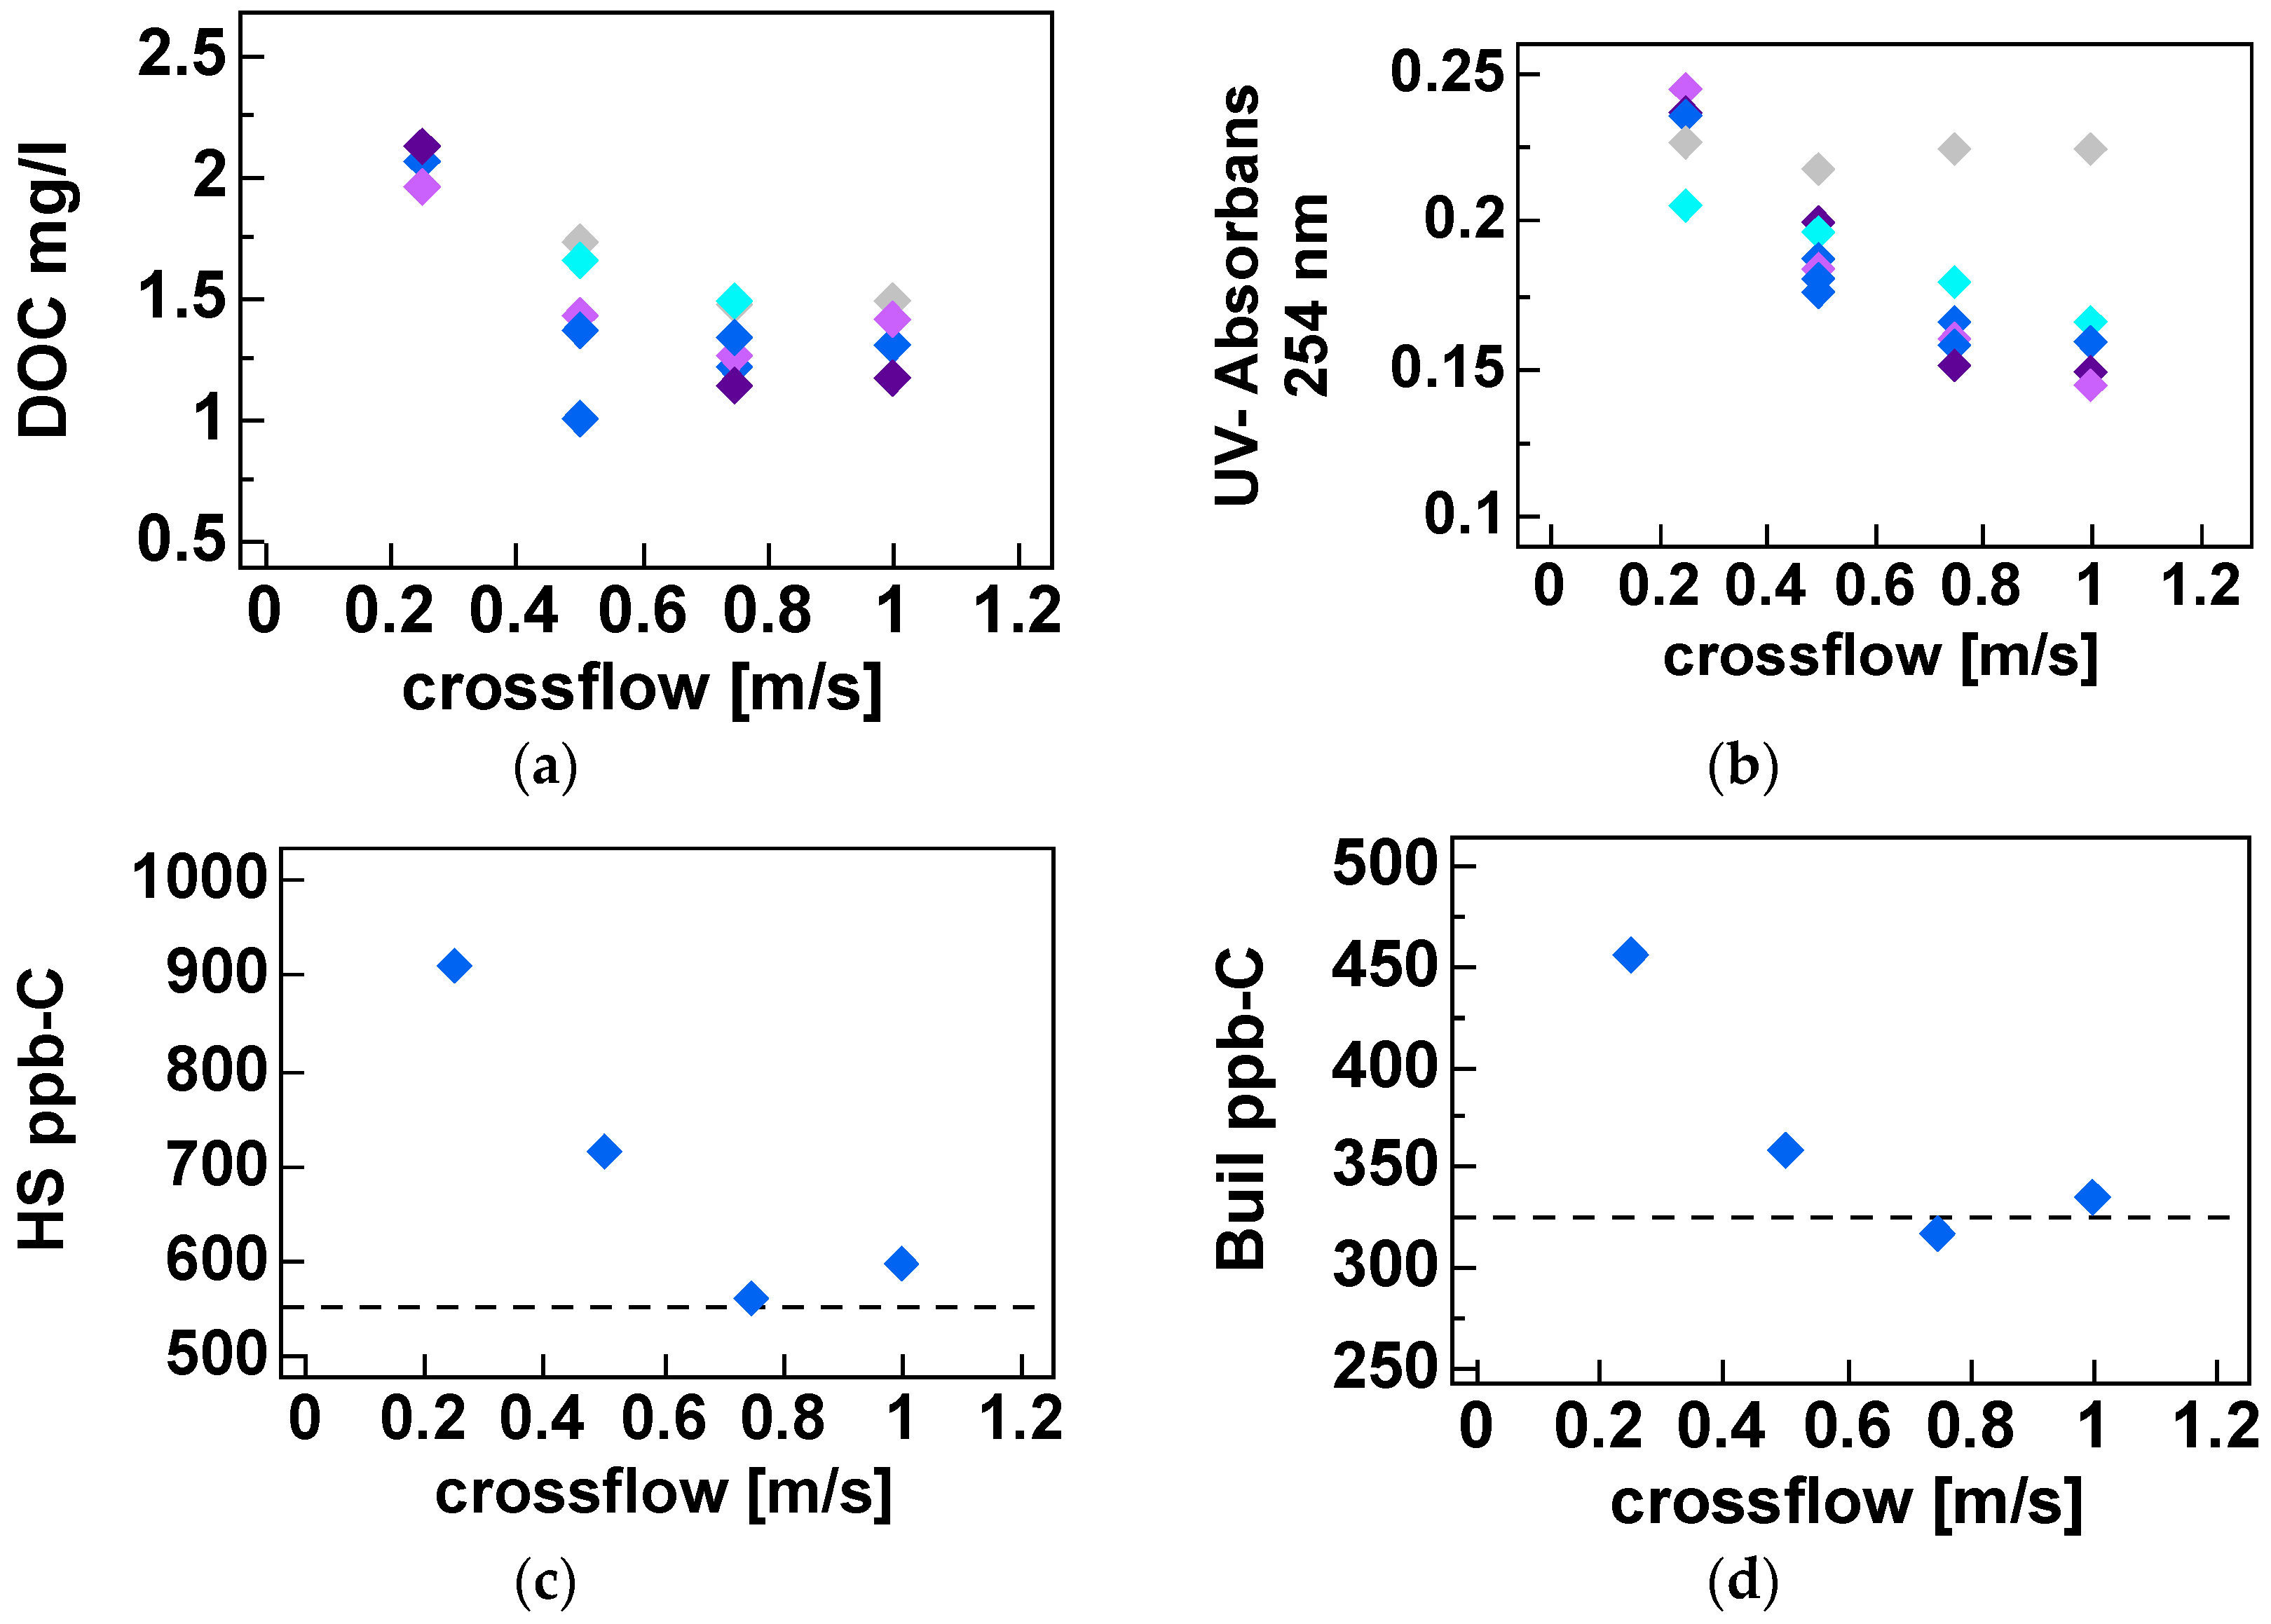
The permeate quality was greatly improved after nanofiltration. Preferential removal of UV over HS as compared to DOC was observed. Only low molecular acids and low molecular non-charged matter passed through the membrane, while high molecular compounds were retained.
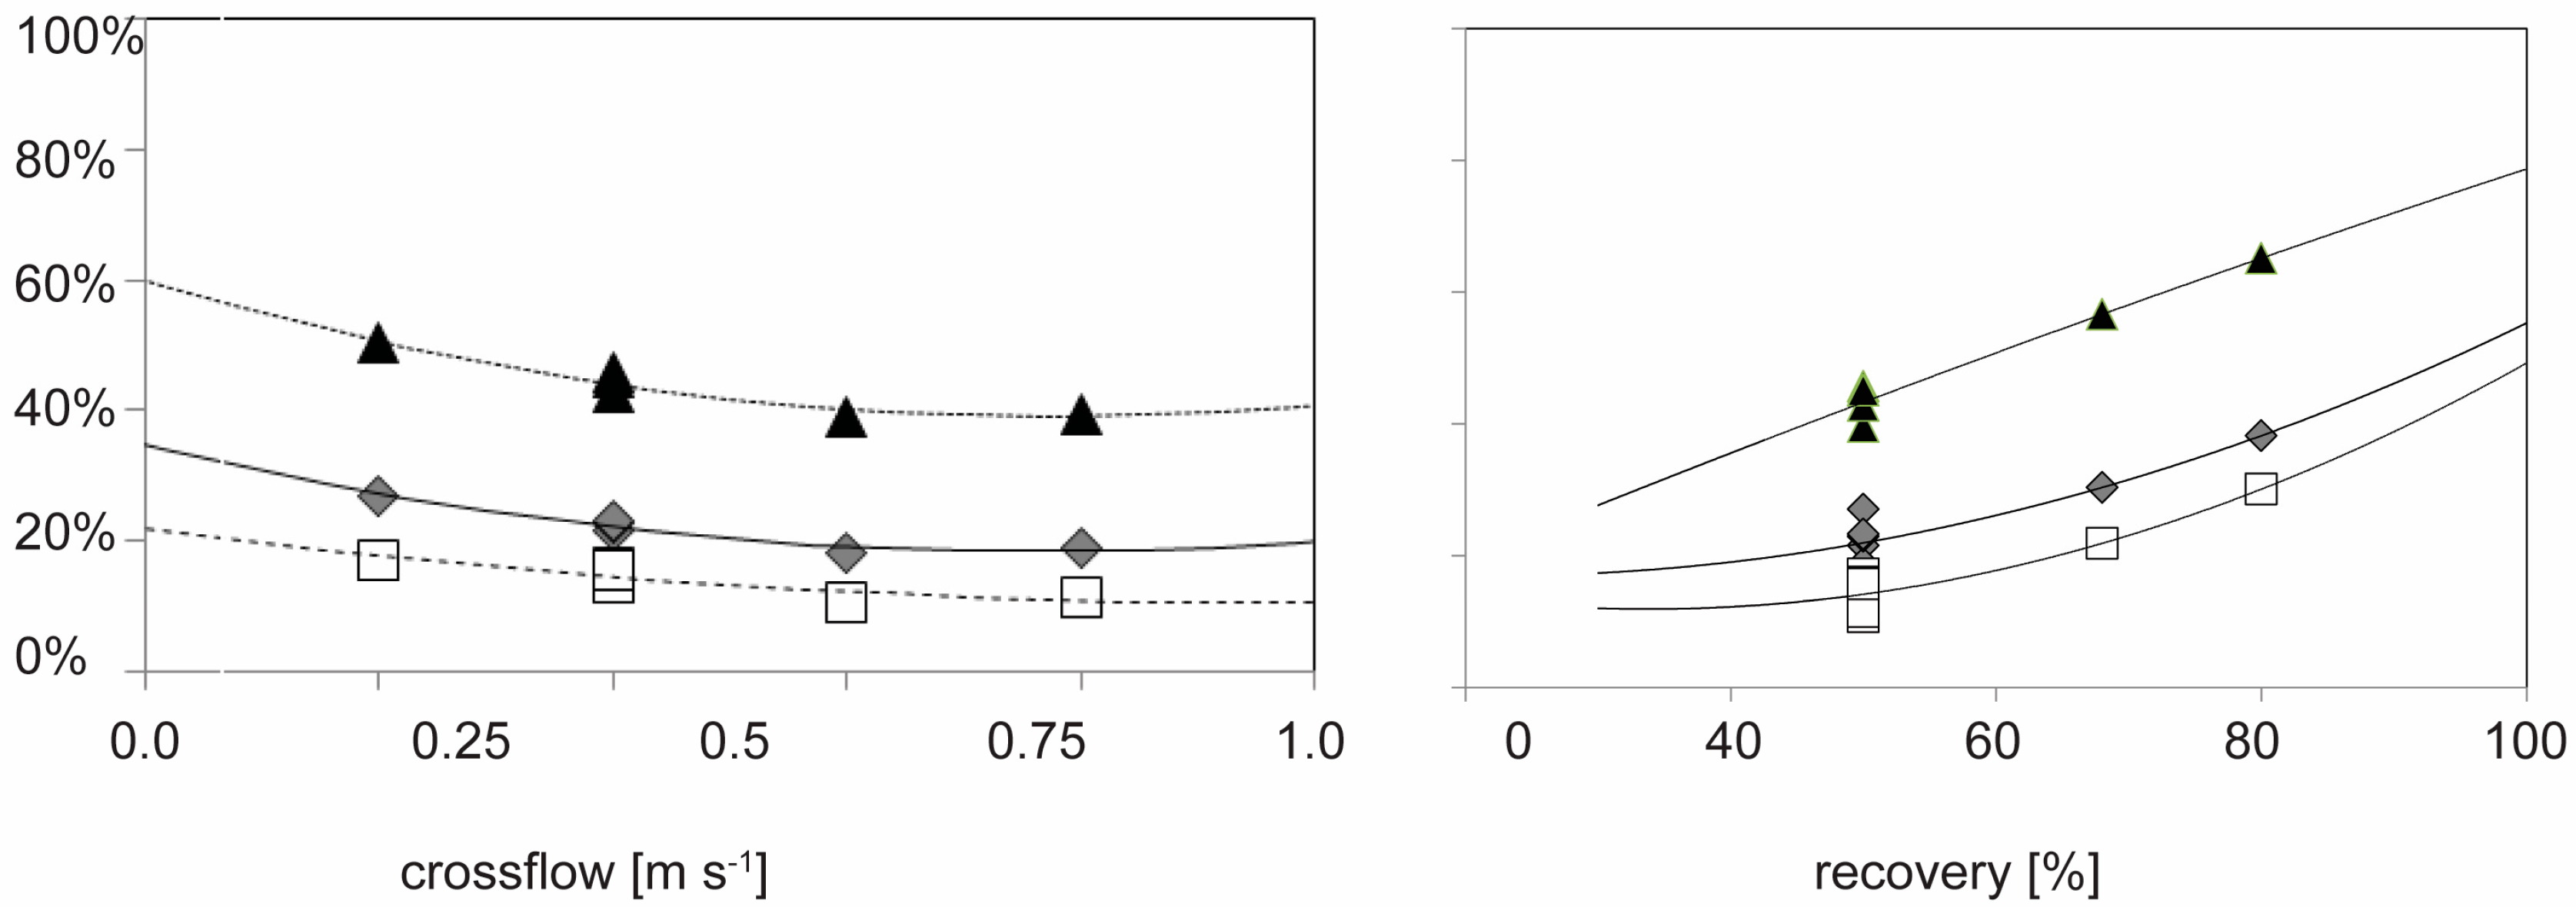
Optimal cross flow was close to 0.75 m·s−1 at 80% recovery with a flux of 12–18 L·m−2·h−1. Under these conditions, around 80% of the UV, 75% of the Humic substances (Mw = 600) and 70% of TOC (from 8 to below 2 mg·L−1) were removed. Higher cross flow velocities led to a marginal improvement (+2%) while increasing and decreasing membrane flux degraded permeate water quality. Apparent optimized diffusion coefficients for UV and TOC were around 1.2–2.4 × 10⁻¹⁰ m2·s−1 and are close to values found in the literature. Due to their higher diffusion coefficients and higher permeability coefficient only around 40% of the low molecular weight acids (MW = 300–400) were retained. Between 30% and 40% of the low molecular acids that permeate the membrane can be removed with post nanofiltration via granulated activated carbon.
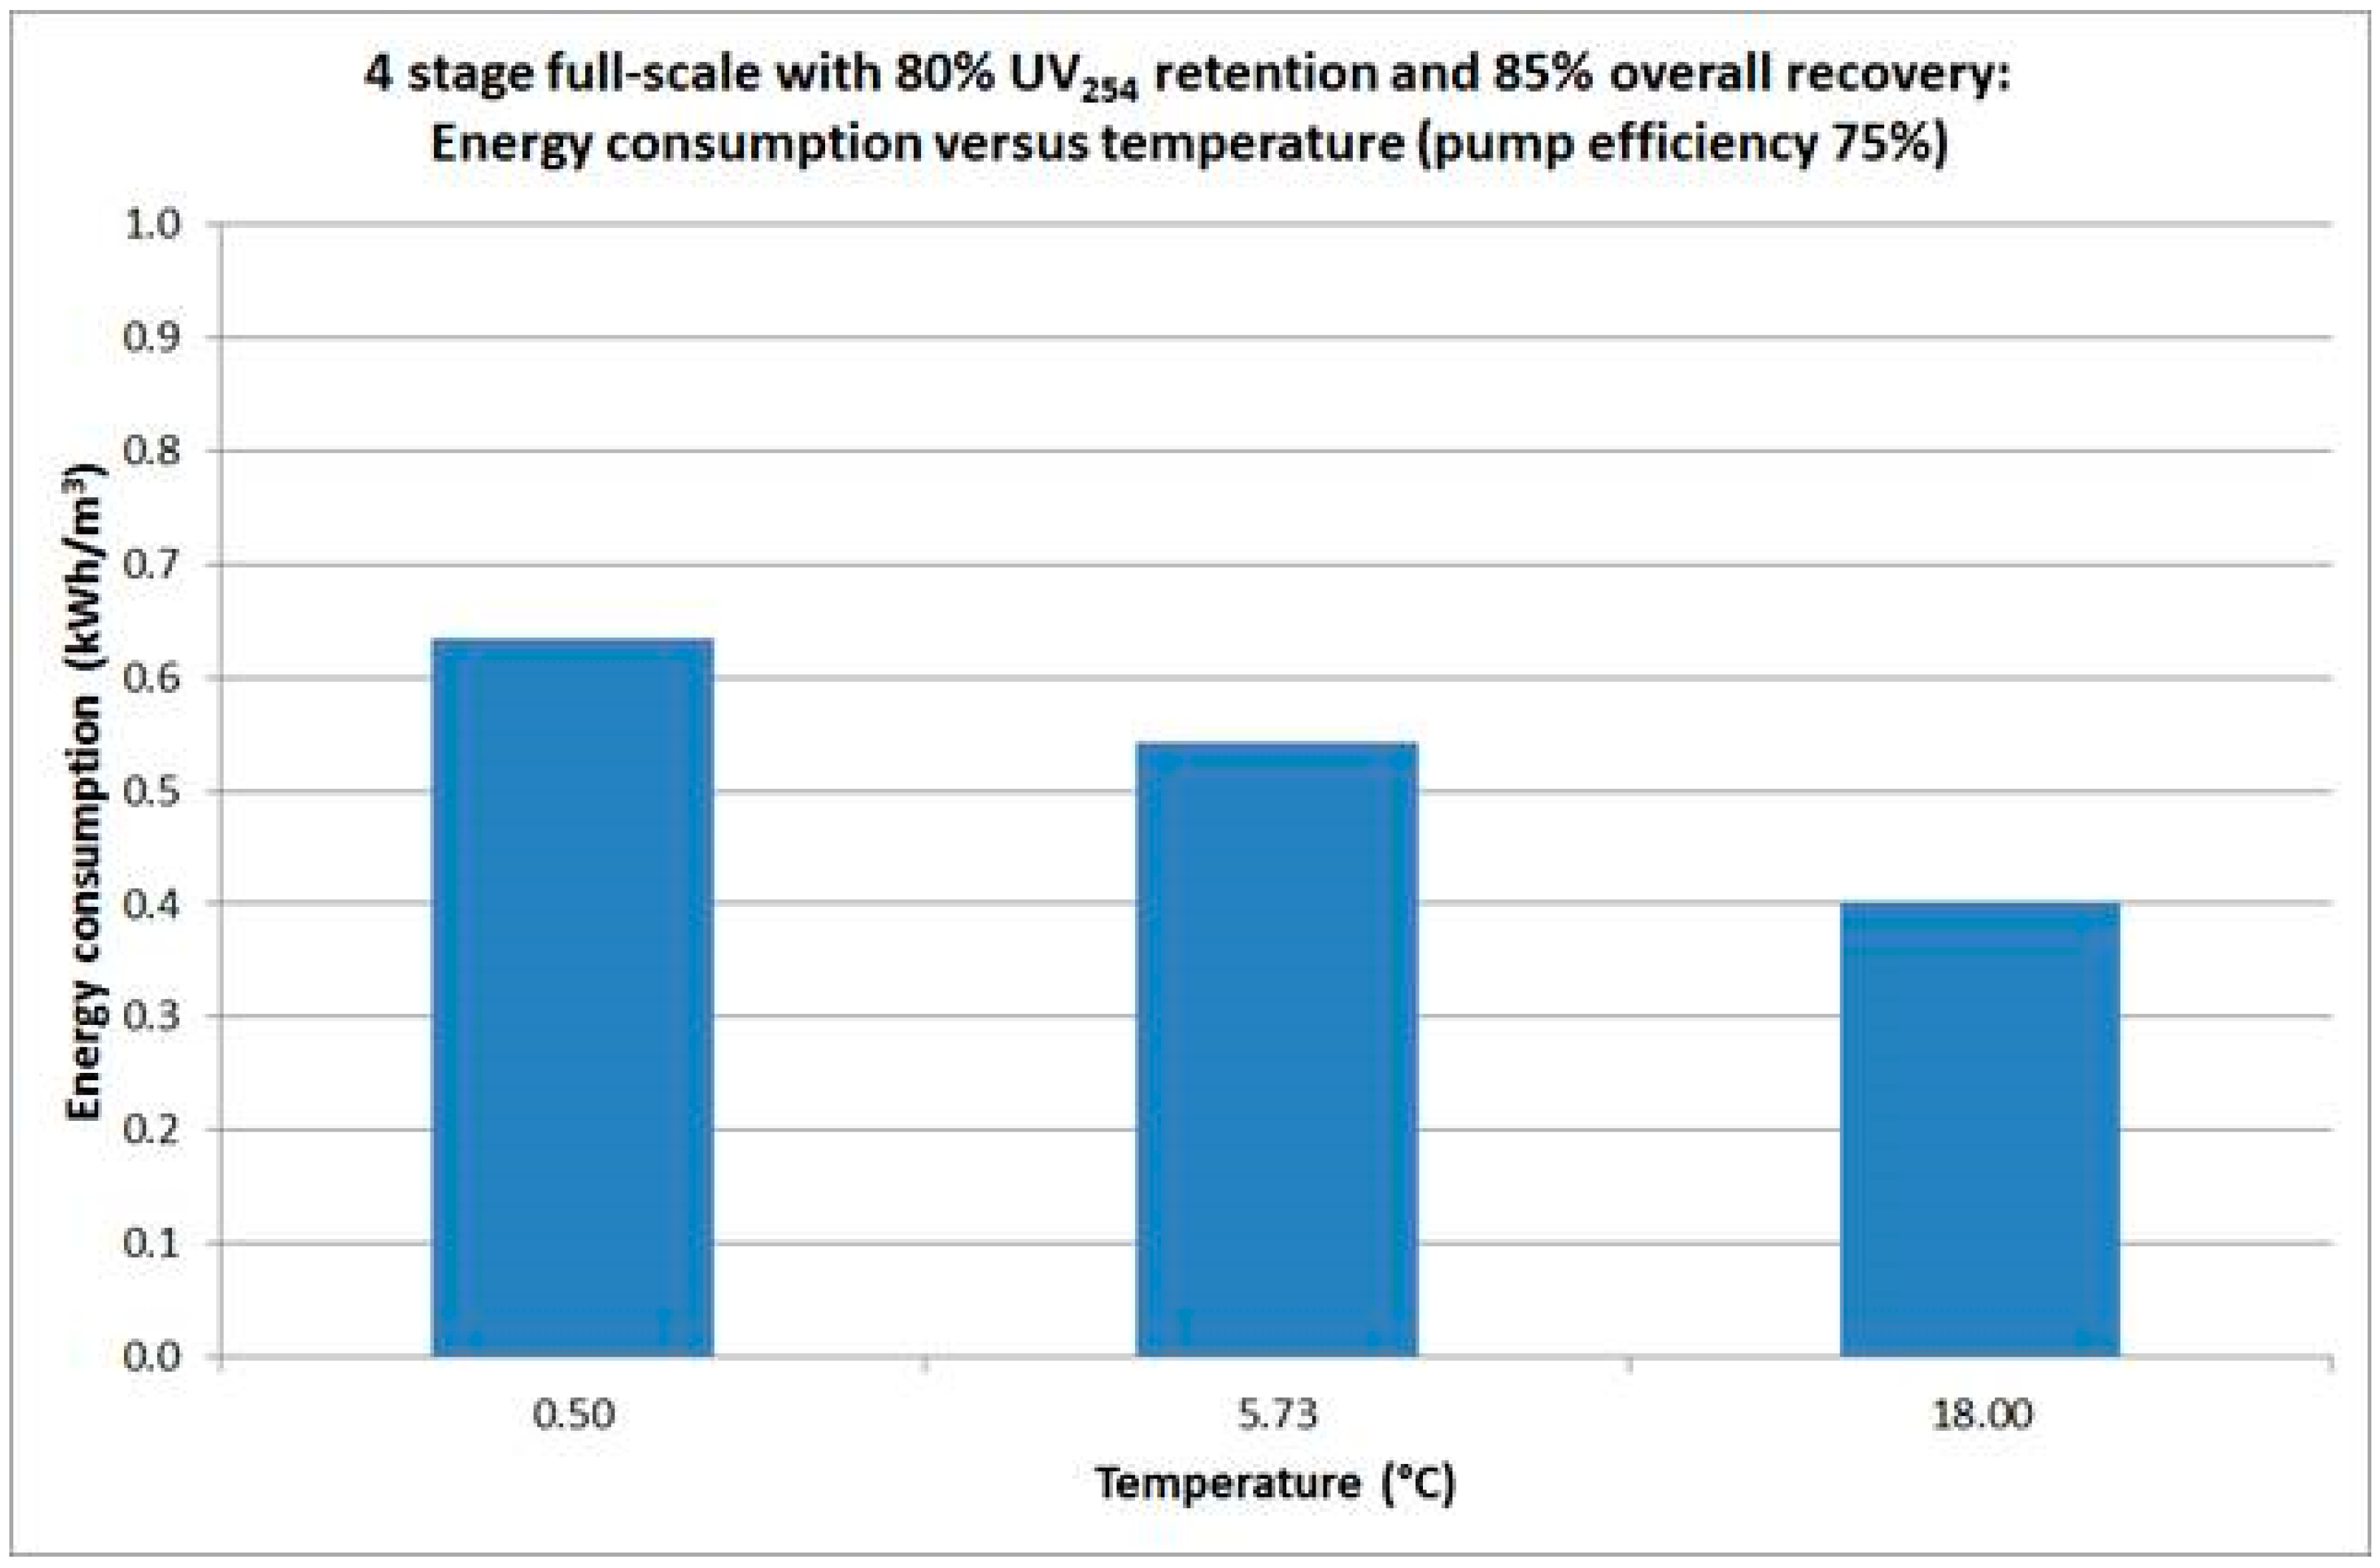
The resulting energy consumption of a hypothetical four-stage design, at average operating temperature of 5.73 °C, for the proposed full-scale process was calculated to be 0.54 kWh·m−3 produced water.


