1. Introduction
The growing global population, crop production, sewage emissions and fossil fuel combustion have significantly altered the global nitrogen (N) and phosphorus (P) cycles. These changes of global nutrient cycles have both positive and negative effects [
1]. On the one hand, the past few decades have seen an increase in crop yield that can be attributed to the increased use of N and P fertilizer in agriculture [
2]. On the other hand, there is an imbalance between the applied nutrients in agriculture in the form of artificial fertilizer or manure and the nutrients taken up by the crops. Such imbalances—with crops not taking up the complete N and P provided—result in a large fraction of the mobilized N and P entering the freshwater system, causing degradation of the water quality and eutrophication of coastal marine ecosystems [
2]. As a consequence, human-induced eutrophication of lakes, estuaries and coastal seas have been reported since the early twentieth century [
3,
4,
5,
6].
International trade of agricultural products has increased significantly over the last few decades. Taking into account the above described effects of agriculture, this increase results in a globalization of agricultural pollution [
7,
8,
9]. Importing countries are shifting the environmental damage of agricultural production to regions that produce and export the products [
7,
8,
9,
10,
11,
12]. Hence, consumers do not have to bear the environmental cost and, as they may be far away from the regions that produce and supply the products, they are less aware of the environmental damages caused [
7,
8,
9,
10,
11]. In order to increase awareness as well as to correctly assign responsibilities for environmental impacts to the responsible final consumer, it is necessary to quantify and account for the N and P emissions produced along the supply chain of the traded agricultural products and to relate them to final consumption. This need to measure the environmental pressure generated by intensive agricultural activities has led to the development of indicators that include the Ecological Footprint [
13], the grey water footprint (GWF) [
10] and the nitrogen footprint [
14]. The water footprint (WF) is an indicator of both consumptive water use (water evaporated or incorporated into the product) and water required to assimilate pollutants. We can distinguish the WF into three colours: the green, blue and grey WF. The green WF refers to the consumption of rainwater, the blue WF refers to consumption of surface and ground water. The GWF is an indicator of water pollution. It is defined as the volume of freshwater that is required to assimilate the load of pollutants based on natural background concentration and existing ambient water quality standards [
15]. The WF of a nation can be distinguished into: “the WF of national production” and “the WF national consumption”. The WF of national production refers to the total freshwater volume consumed or polluted within the territory of the nation as a result of activities within the agricultural sector, the industrial sector, and the domestic water supply sector. The WF of national consumption, on the other hand, is the total volume of freshwater that is consumed or polluted to produce the goods consumed by the nation′s population. We can further divide the WF of national consumption into two components: the internal and external WF of national consumption. The internal WF refers to the use of domestic water to produce goods consumed by the nation′s population. The external WF, on the other hand, is the volume of water used in other countries to produce goods consumed by the population in the nation under consideration.
Hoekstra and Mekonnen [
12] have shown that 430 billion m
3 per year of grey water have been traded globally over the period 1996–2005. During the same period, the global total external GWF (
i.e., the part of the WF of national consumption falling outside the nation considered) was 218 billion m
3 per year. In a recent study, O′Bannon
et al. [
7] showed that the global external GWF increased 136% during the 1986–2010 period.
The aim of this study was to estimate the quantity of nutrients (N and P) emitted and building on these estimates to calculate the GWF of the EU-27 related to both production and consumption of crop products. Further, the sustainability of the EU-27′s GWF of consumption is assessed by identifying priority basins and products. The analysis was carried out using the EXIOBASE v2.2 database (TNO, The Hague, The Netherlands) (base year 2007). EXIOBASE is a global, detailed multi-regional environmentally extended Supply and Use/Input Output (MR EE SUT/IOT) database [
16]. The use of EXIOBASE allows tracking the environmental pressure caused by production processed through the supply chains to the final consumer.
The paper is structured as follows: In the following section, the method and data applied in the study is described. This is followed by a section presenting the results of our analysis. The final section provides a discussion of our main findings and the limitation of the study.
2. Materials and Methods
Nitrogen and phosphorus emissions to fresh water. Nitrogen loss through leaching (
OUTlea, kg/ha) was calculated using the regression model developed by De Willigen [
17]:
where
P is the annual precipitation (mm/year),
C the clay content (%),
L the layer thickness or rooting depth (m),
Nf the mineral and manure N (kg N/ha),
α the decomposition rate (=1.6% per year),
Nom the amount of N in soil organic matter (kg N/ha), and
Nu the N uptake by harvested crop and crop residues removed from the field (kg of N/ha per year).
Nom is calculated by multiplying bulk density (
BD, kg/m
3), total N in soil (
TOTN, in kg/kg), and layer thickness
L. The data on
C,
BD, and
TOTN were obtained from the derived soil properties on a 5 × 5 arc-min global grid (version 1.2) from ISRICWISE [
18]. The precipitation data for the period 2000–2010 were obtained from the Climate Research Unit of the University of East Anglia (version CRU TS 2.0) [
19]. The 30-arc-min precipitation data were converted into 5-arc-min resolution data by assigning the 30-arc-min values to each of the 36 5-arc-min grid cells contained in the 30 by 30 arc-min grid cell. The rooting depth (
L, m) for individual crops were obtained from Allen
et al. [
20].
The first part of the regression equation (0.0463 + 0.0037 ×
(P/C ×
L)) determines the fraction of the total mobile N that will leach, and the second part (
Nf + α ×
Nom − Nu) determines the available mobile N [
21]. To keep the fractional losses less than one, following De Willigen [
17], an upper limit of 250 mm/(% m) was set for the combined parameter (
P/
C ×
L). Since perennials crops can take up N throughout the year, for these crops, the amount of N in soil organic matter was multiplied by 0.5 in order to further limit overestimation of N leaching [
22]. We believe this assumption is reasonable given the fact that other authors have set an upper limit on the total leaching arguing the model might overestimate the leaching volume. For example, Liu
et al. [
23] have set an upper limit on the total leached amount not to exceed 20% of the total mineral fertilizer application and 50% of the N from manure arguing that the model may give unreasonably high leaching values.
We estimated the human-induced (
i.e., due to artificial fertilizer and manure application) leaching quantity (
Anthroplea) by multiplying the total leached volume (
OUTlea) by the fraction of N input in the form of fertilizer and manure (
Nf) to the total N input including the amount of N in the soil organic content:
Modeling the emission of P from diffuse sources at a global scale is more complicated than estimating N. Therefore, we have adopted the approach of Bouwman
et al. [
24], where the amount of P emitted to the water system is assumed to be 12.5% of the P input from the fertilizer and manure application. This value was obtained from the increase of total P river export between 1970 and 2000 as modeled by the global NEWS model [
25] and corrected for the global average P retention of 20% in river systems [
26].
IFA
et al. [
27] were the primary source of artificial fertilizer application rate per crop per country. This dataset was further complemented with FAO [
28] and Heffer [
29]. These application rates were adjusted to fit FAO [
30] country average artificial fertilizer consumption per year for the period 2007. The manure input was calculated at grid cell level by multiplying livestock density (taken from FAO [
31]) by the animal-specific excretion rates (taken from Sheldrick
et al. [
32]). The N and P removal with harvested crops was estimated by multiplying the crop yield by the crop-specific N and P content. Similarly, the N and P removal with crop residues was calculated by multiplying the yield of crop residue by the N and P content of the crop residue and a residual removal factor. The crop yield at 5 arc min per crop was taken from Mekonnen and Hoekstra [
33]. The crop-specific N and P contents of major crop and crop residues were taken from IPNI [
34]. For other crops and crop groupings, values from FAO [
22] and Roy
et al. [
35] were used. For nuts and spices, we have adopted the values of fruits and vegetables respectively from FAO [
22]. The crop residues removal factors were obtained from different sources [
22,
36,
37,
38,
39,
40].
Calculating the grey water footprint. The GWFs of N and P are first calculated separately, and then the overall GWF of N and P is determined by the nutrient that is most critical,
i.e., the nutrient with the larger GWF. Following Hoekstra
et al. [
15], the GWF (WF
grey, m
3/year) is calculated by dividing the N and P nutrients load (L, kg/year) by the difference between the ambient water quality standard for N and P nutrients (the maximum acceptable concentration (c
max, mg/L) and their natural concentration in the receiving water body (c
nat, in mg/L)):
The natural concentration in a receiving water body is the concentration of the water systems that are in pristine condition before human disturbances occur in the catchment. We have adopted the maximum acceptable and natural concentration values for total N and total P from Liu
et al. [
41]. The maximum acceptable concentration values are 3.1 mg N/L and 0.95 mg P/L for total N and total P, respectively, and the natural concentration value of 1.5 mg N/L and 0.52 mg P/L for total N and total P, respectively. Although different ecosystems respond differently to nutrient loads, requiring different maximum allowable concentration values, we have taken a single value for the whole world. Besides, natural concentrations vary from basin to basin. However, obtaining or estimating basin-specific values for both maximum allowable and natural concentration is an elaborate task and impossible for a global study like this one.
To calculate the GWF related to the EU-27 consumption of goods and services, we extend the monetary MRIO model EXIOBASE 2.2 by the physical extensions consisting of GWF values related to the production of 146 different crops in the 48 different countries and regions of the EXIOBASE model. By allocating the GWF to the sectors producing the specific crops, the GWF is “linked” to the trade flows of the crops and ends with them in the countries of final consumption.
The GWF in a river basin is environmentally unsustainable, creating an environmental hotspot when the water pollution level exceeds the waste assimilation capacity. Those basins where the water pollution level creates environmental hotspot are identified as “priority river basins.” The priority river basins and products related to EU-27′s WF of consumption were identified on the basis of the size of the GWF of EU-27′s consumption and the water pollution level (WPL) obtained from Liu
et al. [
41]. Water pollution levels (WPL) can be calculated as the ratio of the total GWF in a catchment to the actual runoff from that catchment. A water pollution level of one means that the waste assimilation capacity has been fully consumed, as the complete runoff is “needed” to assimilate the emissions. When the water pollution level exceeds one, ambient water quality standards are violated. If the EU-27′s consumption causes a GWF in a basin with WPL higher than one, the products contributing a large share to this GWF are identified as priority products as per the definition the basin is defined as priority river basin (see above).
3. Results
In the first part of the results (
Section 3.1), we will present the nutrient emission values that are used as input to the EXIOBASE database.
Section 3.2 presents the GWF related to the production of crops within the EU-27. The GWF from the production perspective is the total GWF within the territory of the 27 EU countries related to the production of crops. Part of the GWF within the EU-27 can be used to produce goods consumed within the region, and the rest used for producing goods for export to the rest of the world. In
Section 3.3, we present the GWF as the result of EU-27 consumption of crop products. For this section, EXIOBASE is used to calculate the GWF embodied in the final consumption of crop products by the EU-27. Part of the GWF related to EU-27 consumption is located within the EU-27 (internal WF) and part of it is located outside the boarder of EU-27 (external WF).
3.1. Anthropogenic Nitrogen and Phosphorus Emissions to Fresh Water Related to EU-27′s Crop Production
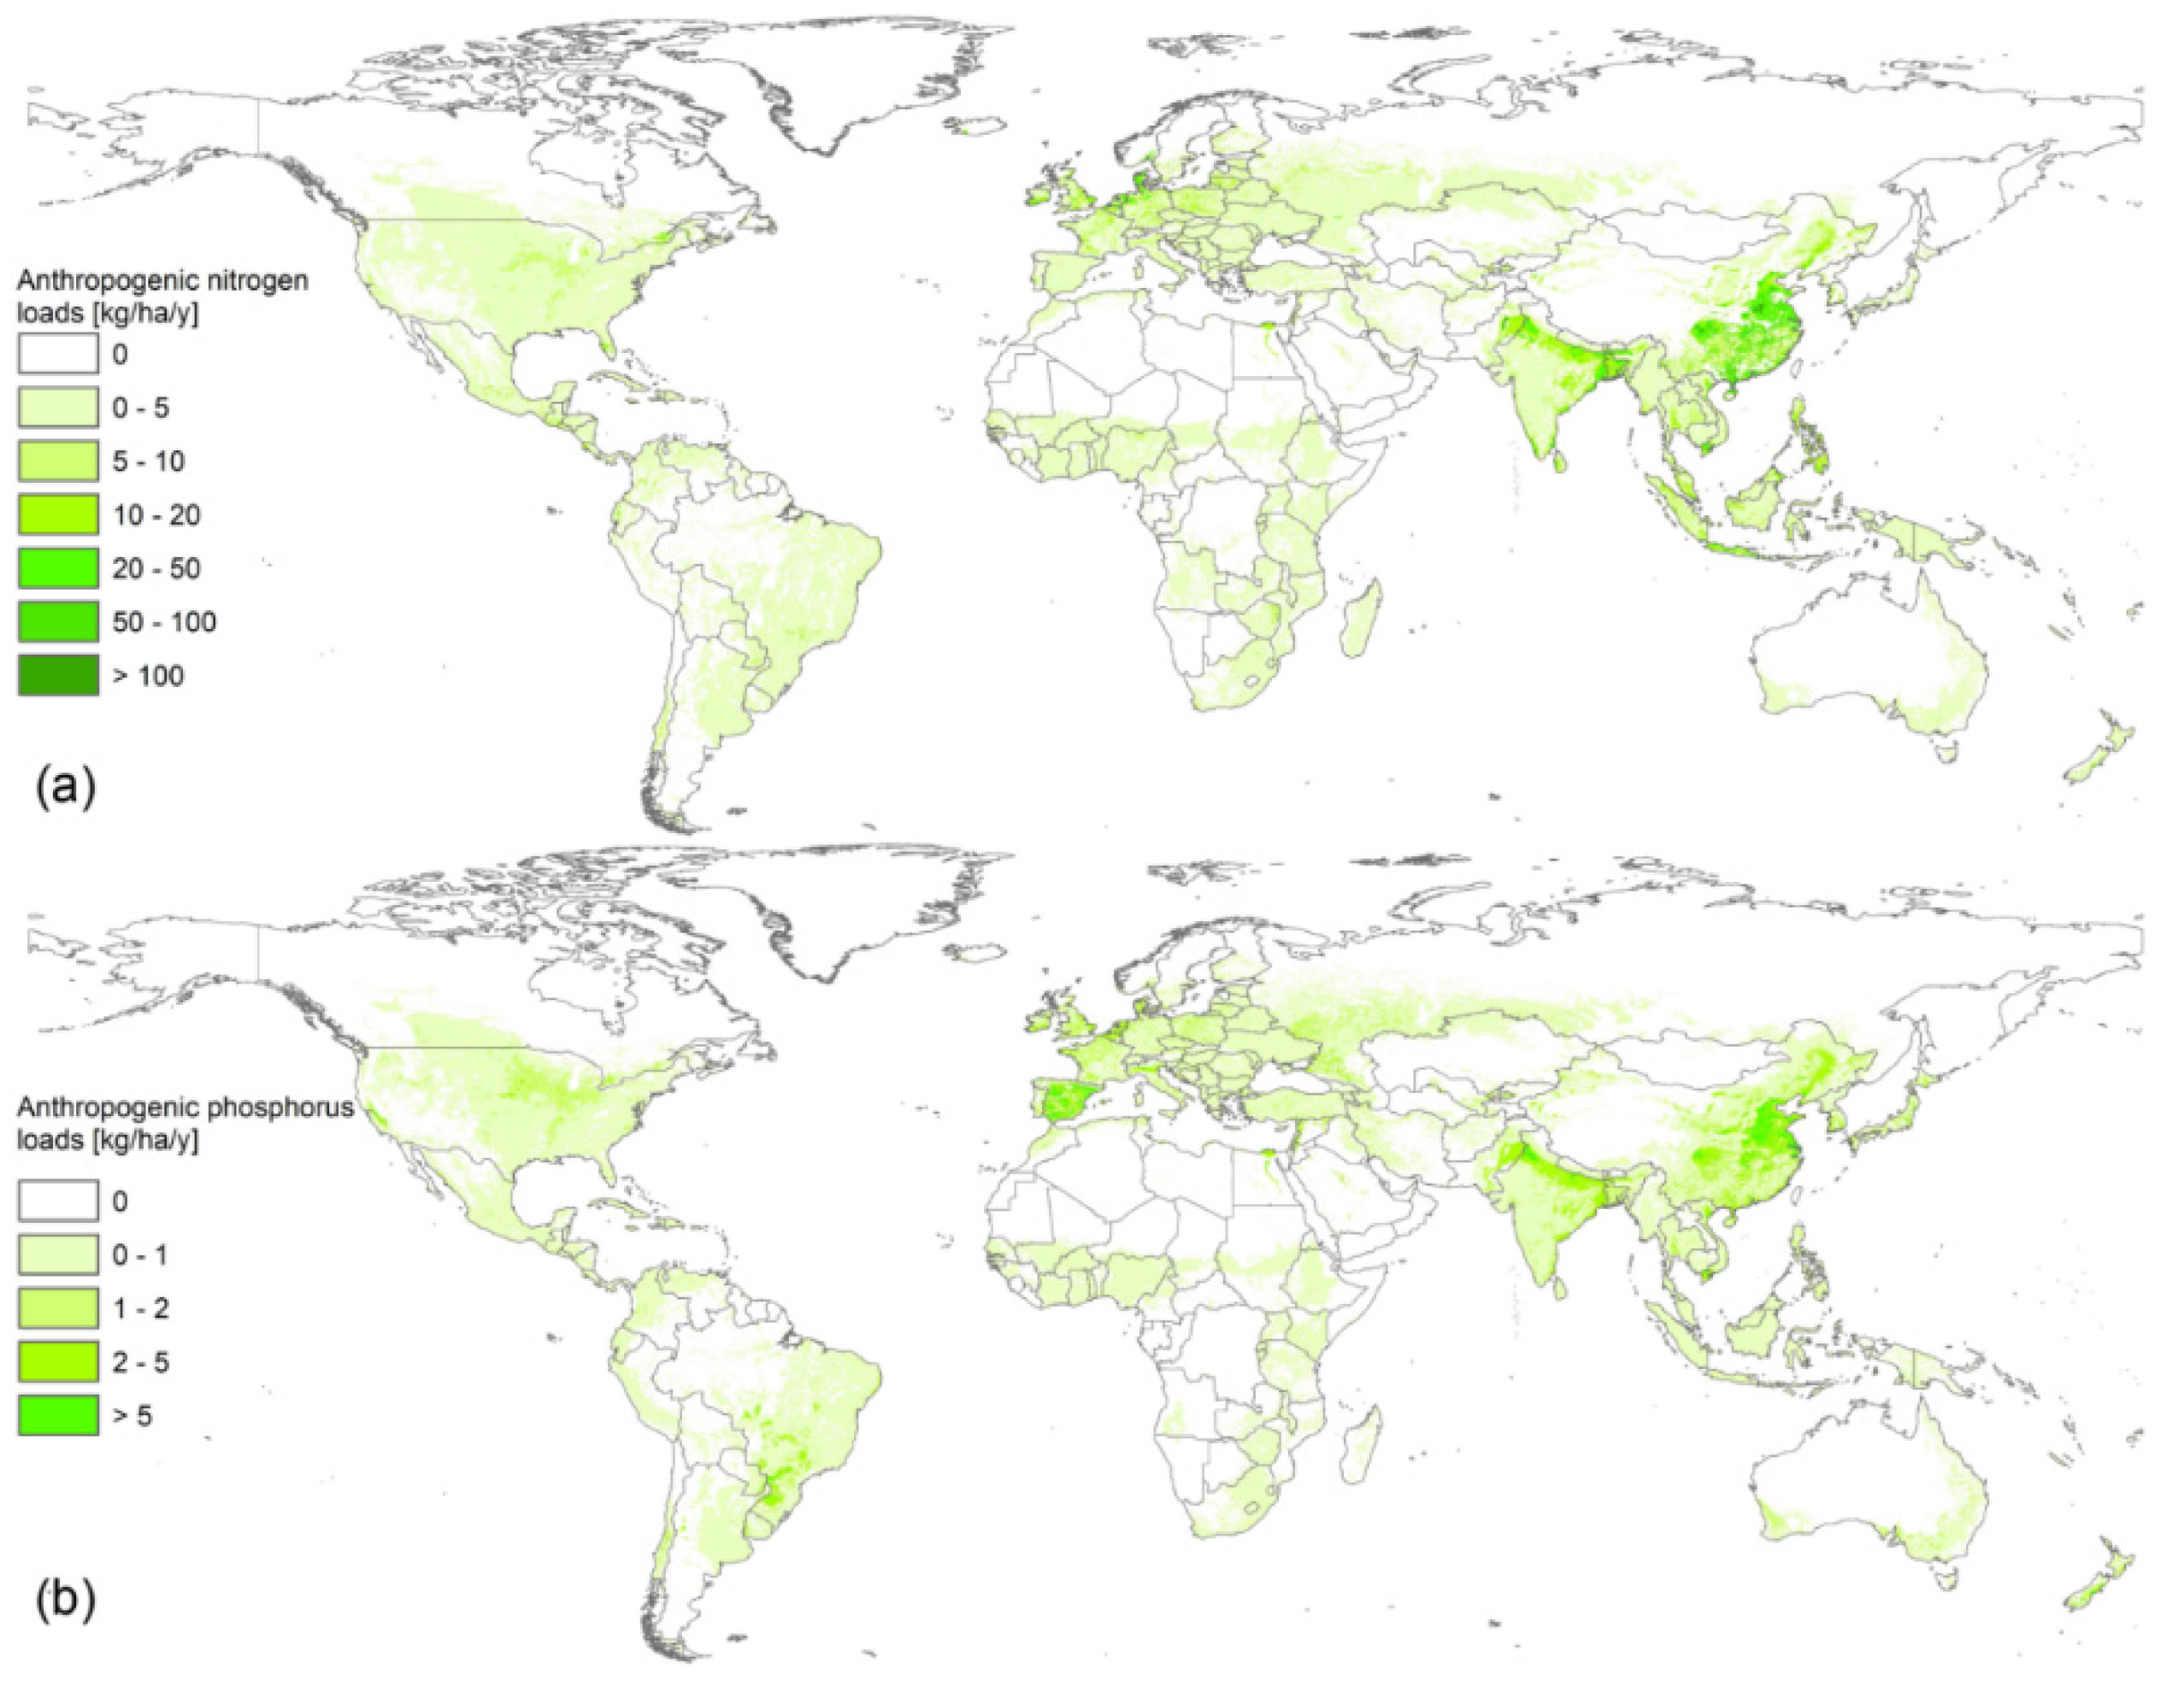
Nitrogen and phosphorus emissions to fresh water at high spatial resolution are presented in
Figure 1. The results show that the global total N and P emissions from agricultural production in 2007 were 31 and 2.9 million tonnes per year, respectively. However, as
Figure 1 illustrates, there are marked spatial variations in the anthropogenic N and P emissions to fresh water across the globe. In Southeastern China and Northeastern India, N loads can reach above 100 kg N/ha. Other places with large N loads include Western Europe, Central US, and Central America. In Europe, mainly in Germany, Netherlands, Belgium, the UK, Denmark, and Poland, N loads of up to 75 kg N/ha were observed. On the other hand, anthropogenic P load is largest in Northeastern Spain in the Ebro River basin where it reaches as much 50 kg P/ha. In Northeastern China and Northern India, the anthropogenic P load of a little over 5 kg/ha was observed.
The anthropogenic N and P emissions in 2007 within the EU-27 were 0.9 and 0.4 million tonnes per year, respectively. The contribution of major countries to the total EU-27 N and P loads are presented in
Table 1. Ireland contributed the largest share (23%) of anthropogenic N load, followed by Germany (19%), UK (14%), Netherlands and Poland, each with 10%. About 50% of the anthropogenic P load in the EU-27 was contributed by Spain, followed by France (11%), and Poland (6%).
In terms of per unit of harvested area, the largest anthropogenic emission occurred in Ireland with 690 kg N/ha and 26 kg P/ha, followed by Netherlands (157 kg N/ha and 17 kg P/ha), Belgium (41 kg N/ha and 9 kg P/ha), and UK (33 kg N/ha and 5 kg P/ha). An excessive nutrient input from manure is mainly responsible for the larger emission in these countries.
Figure 1.
Map of global anthropogenic loads of (a) nitrogen and (b) phosphorus due to global production of crops shown in kg/ha on a 5 by 5 arc-min grid. Period: 2007.
Figure 1.
Map of global anthropogenic loads of (a) nitrogen and (b) phosphorus due to global production of crops shown in kg/ha on a 5 by 5 arc-min grid. Period: 2007.
Table 1.
Anthropogenic nitrogen and phosphorus emissions to water for selected European countries and EU-27 total.
Table 1.
Anthropogenic nitrogen and phosphorus emissions to water for selected European countries and EU-27 total.
| Product | Anthropogenic Nitrogen Emissions | Anthropogenic Phosphorus Emissions |
|---|
| k Tonne/Year | kg/ha | k Tonne/Year | kg/ha |
|---|
| Belgium | 25 | 41 | 6 | 9 |
| Bulgaria | 11 | 4 | 6 | 2 |
| France | 70 | 5 | 45 | 3 |
| Germany | 176 | 19 | 22 | 2 |
| Greece | 13 | 4 | 6 | 2 |
| Ireland | 214 | 690 | 8 | 26 |
| Italy | 19 | 3 | 21 | 3 |
| Netherlands | 90 | 157 | 10 | 17 |
| Poland | 91 | 8 | 26 | 2 |
| Portugal | 6 | 5 | 5 | 4 |
| Spain | 58 | 5 | 212 | 17 |
| UK | 139 | 33 | 22 | 5 |
| Other countries | 21 | 1 | 38 | 2 |
| Total EU-27 | 933 | 11 | 425 | 5 |
3.2. The Grey Water Footprint of EU-27 Related to Crop Production
Figure 2 illustrates the GWFs due to N and P emissions related to the crop production in the EU-27 in 2007. The overall GWF is the larger of the two values; the total overall GWF related to agricultural production in the EU-27 was 1065 billion m
3 per year (
Table 2). About 78% of this GWF is due to the anthropogenic P emissions, while the remaining 22% is due to anthropogenic N load from crop fields mainly cereals, fruits, and vegetables. Cereals (wheat, rice and other cereals) take the largest share, accounting for 30% of the GWF. The other crops with major contribution to the total GWF are fruits (17%), vegetables (14%) and oil crops (13%). The large GWF by these crops can be explained by their large extent of the harvested area. Cereals (wheat, rice and other cereals) account for 65% of the harvested area, followed by oil crops with 18%, and vegetables, fruits and nuts together with 11%. The other reasons for difference in the contribution of different crops to the overall GWF of EU-27 are the difference in the artificial fertilizer and manure application rate, and the crops nutrient removal rate.
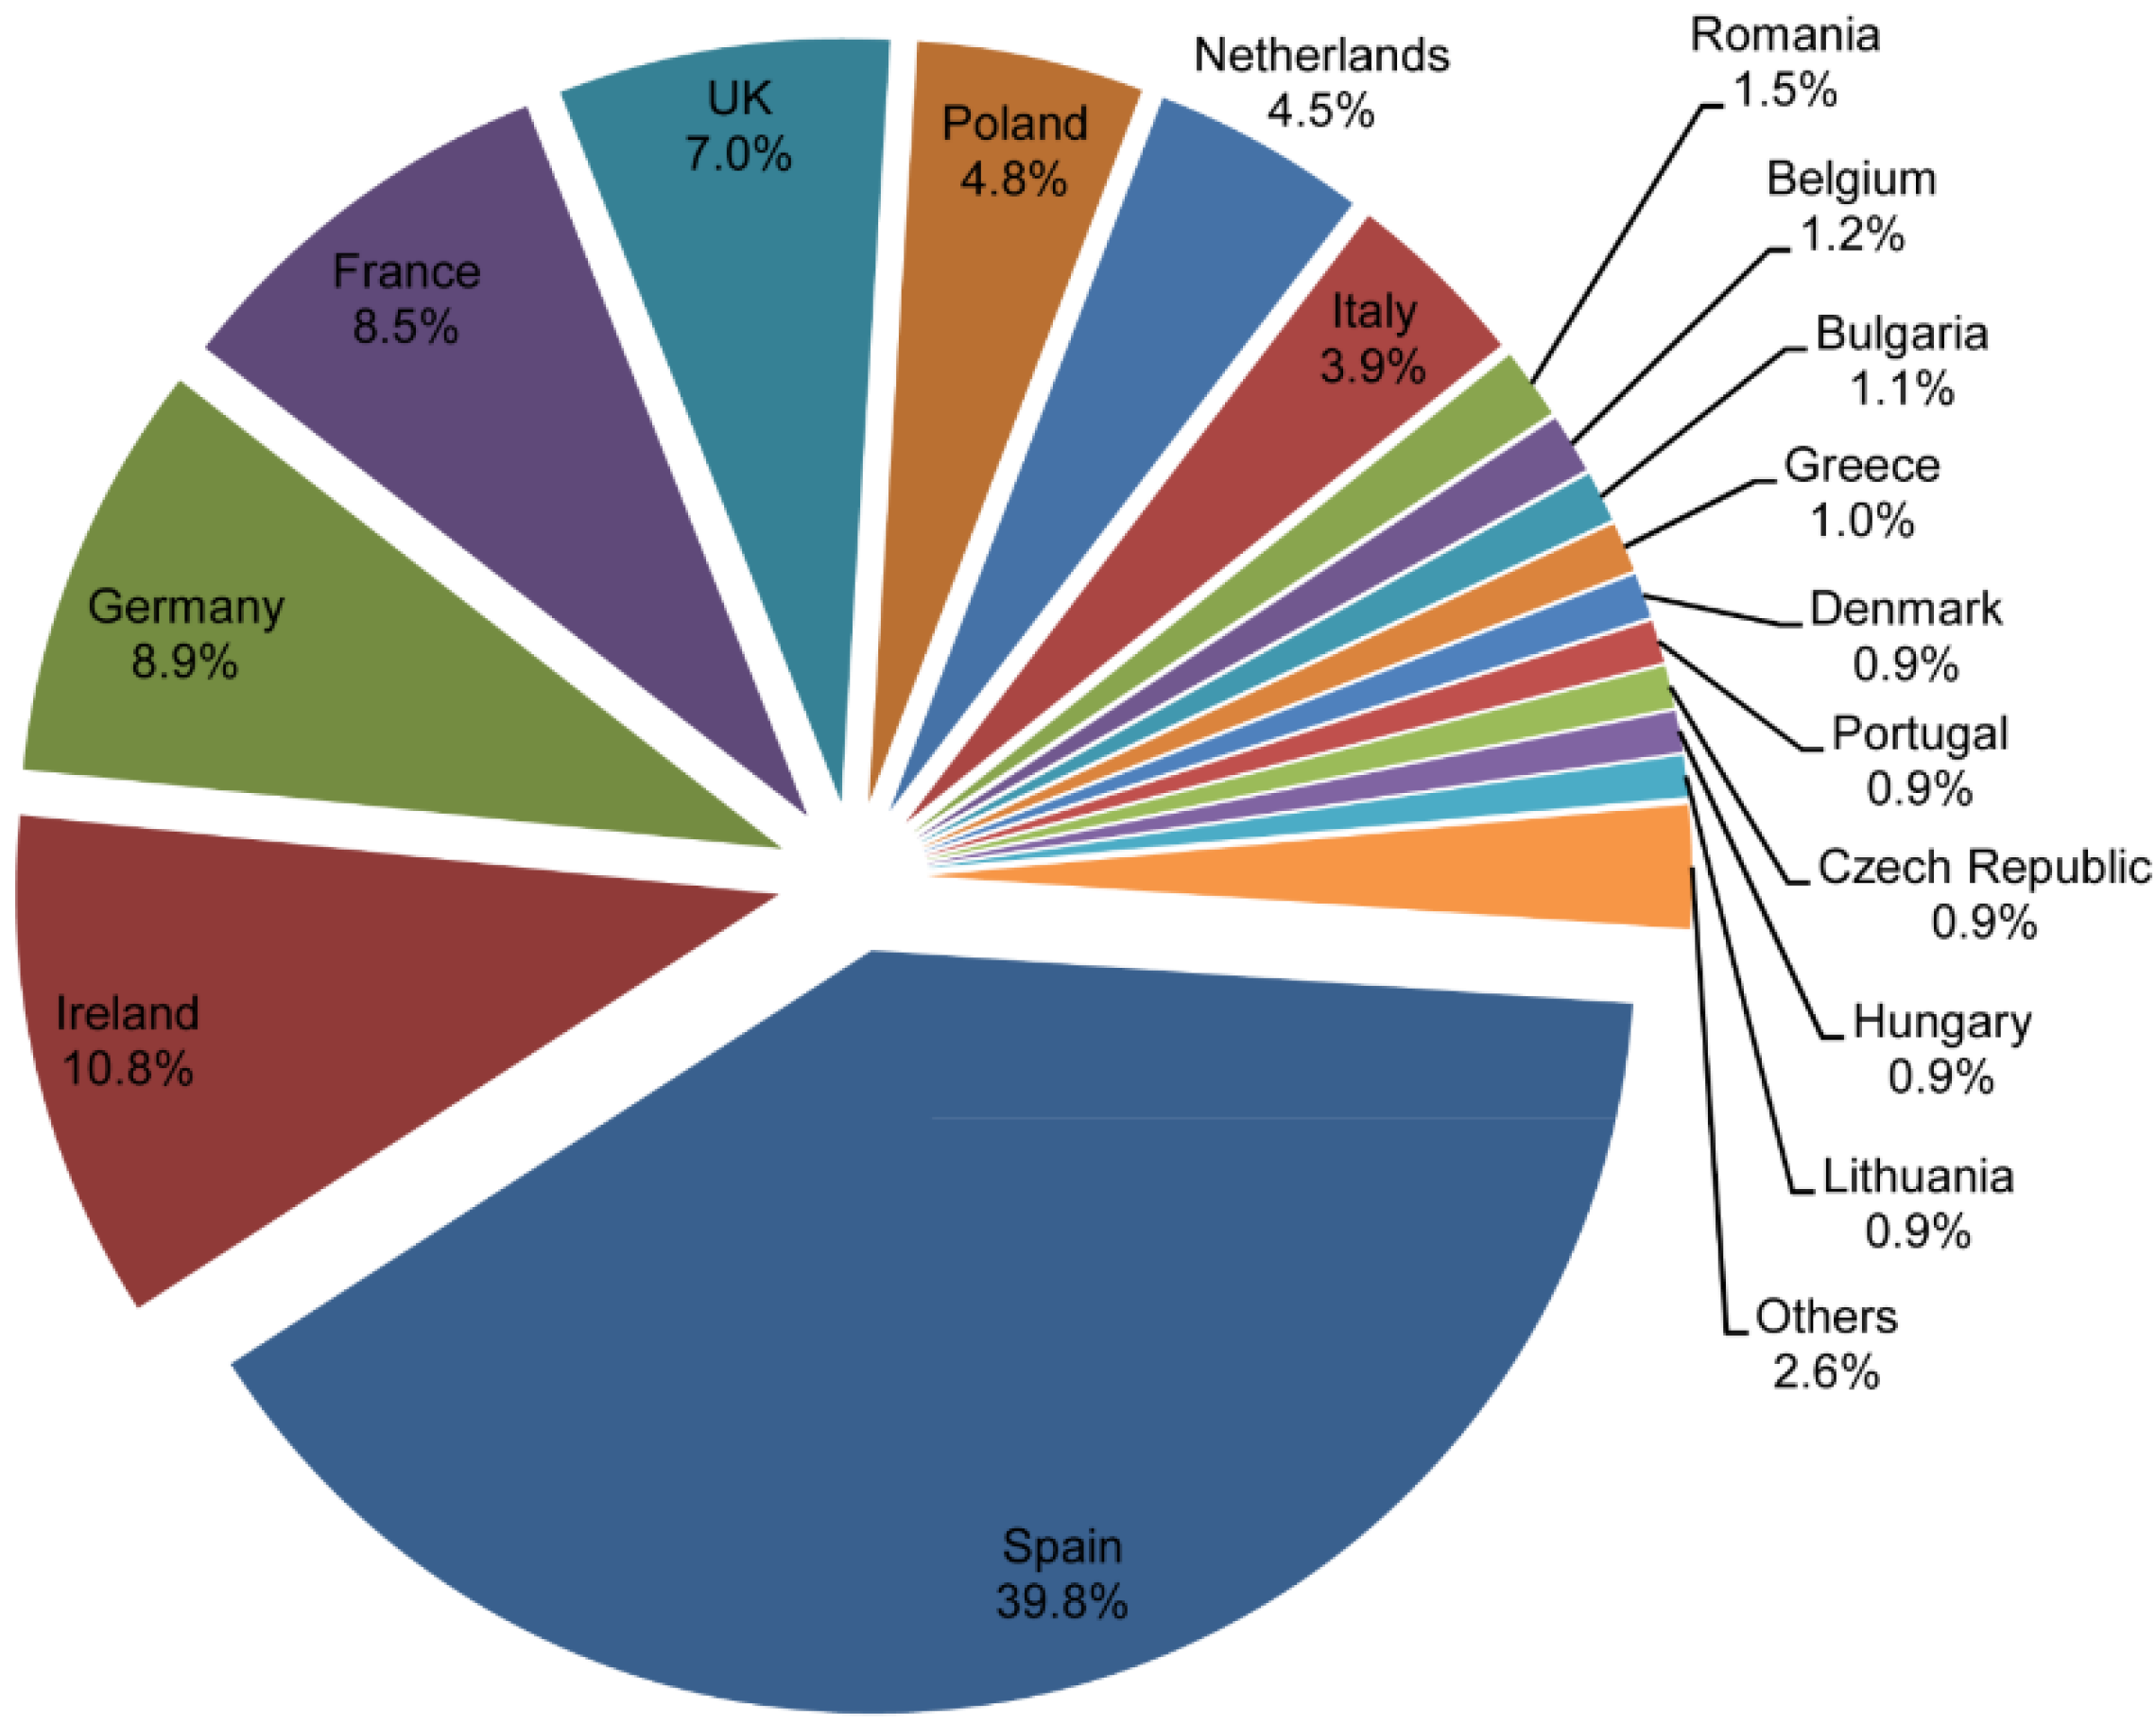
The contribution of different countries to the overall GWF of the EU-27 related to crop production is presented in
Figure 2. About 40% of the overall GWF was contributed by Spain, mainly due to anthropogenic P loads from cropland. The other major countries contributing a large share to the EU-27′s GWF of production are Ireland (11%), Germany (9%), France (9%), and the UK (7%). In Ireland, Germany and the UK, the larger GWF is due to N loads, while in France anthropogenic load was the dominant one. The large GWF in Ireland is mainly due to large manure application rates, while in Germany, France, and the UK it is mainly due to the large agricultural harvested area combined with high nutrient (fertilizer and manure) application rate.
Table 2.
Grey water footprint of production of the EU-27 (million m3 per year). Period: 2007.
Table 2.
Grey water footprint of production of the EU-27 (million m3 per year). Period: 2007.
| Product | Nitrogen | Phosphorus | Overall |
|---|
| Other cereals | 105,093 | 190,130 | 190,130 |
| Fruits | 22,631 | 175,891 | 175,891 |
| Vegetables | 30,962 | 144,285 | 144,285 |
| Oil crops | 139,674 | 95,105 | 139,674 |
| Wheat | 106,408 | 115,376 | 115,376 |
| Pulses | 11,775 | 85,151 | 85,151 |
| fodder crops | 62,581 | 63,121 | 63,121 |
| Roots and tubers | 51,324 | 32,720 | 51,324 |
| Sugar crops | 41,003 | 27,681 | 41,003 |
| Nuts | 9580 | 31,330 | 31,330 |
| Paddy rice | 15 | 12,869 | 12,869 |
| Other crops | 1849 | 11,775 | 11,775 |
| Fibres | 43 | 2985 | 2985 |
| Total | 582,938 | 988,419 | 1,064,914 |
Figure 2.
Contribution of different countries to the overall GWF of EU-27 related to production. Period: 2007.
Figure 2.
Contribution of different countries to the overall GWF of EU-27 related to production. Period: 2007.
3.3. The Grey Water Footprint Related to EU-27 Consumption
The total agricultural GWF of the EU-27 related to consumption in 2007 was 1834 billion m
3/year, which is 3700 m
3/year per capita on average (
Table 3). Looking at some selected European countries, the difference in the per-capita WF is quite large, ranging from 8900 m
3/cap/year for Spain to 1600 m
3/cap/year for Estonia.
The extent to which countries externalize their WF varies considerably. For the EU-27 as a whole, the share of the external WF was 41%. The share of the external GWF for the selected countries varies from 26% for Spain to 84% for Estonia. The extent to which single EU-27 countries externalize their GWF to other EU-27 countries or to the rest of the world also varies. For Spain, 42% of its GWF was external but only 4% was externalized to the EU-27, while 22% was to the rest of the world. Estonia, on the other hand, shifted 26% of its grey WF to the EU-27 and 57% to the rest of the world. The large share of the external WF shows that the EU-27 and the other countries displaced a large portion of the water pollution to the rest of the world.
Table 3.
Grey water footprint of the EU-27′s and some selected countries related to consumption of agricultural products. Period: 2007.
Table 3.
Grey water footprint of the EU-27′s and some selected countries related to consumption of agricultural products. Period: 2007.
| Country | Total GWF (Gm3/Year) | Per capita GWF (m3/Cap/Year) |
|---|
| Internal | External GWF | Total |
|---|
| Within EU-27 | Rest of the World |
|---|
| EU-27 | 1080 | | 754 | 1834 | 3694 |
| Estonia | 0.3 | 0.6 | 1.2 | 2.1 | 1608 |
| Germany | 76 | 74 | 178 | 328 | 3924 |
| Netherlands | 17 | 17 | 46 | 80 | 4839 |
| Poland | 46 | 11 | 20 | 77 | 2023 |
| Spain | 294 | 15 | 90 | 399 | 8931 |
| UK | 72 | 64 | 129 | 265 | 4322 |
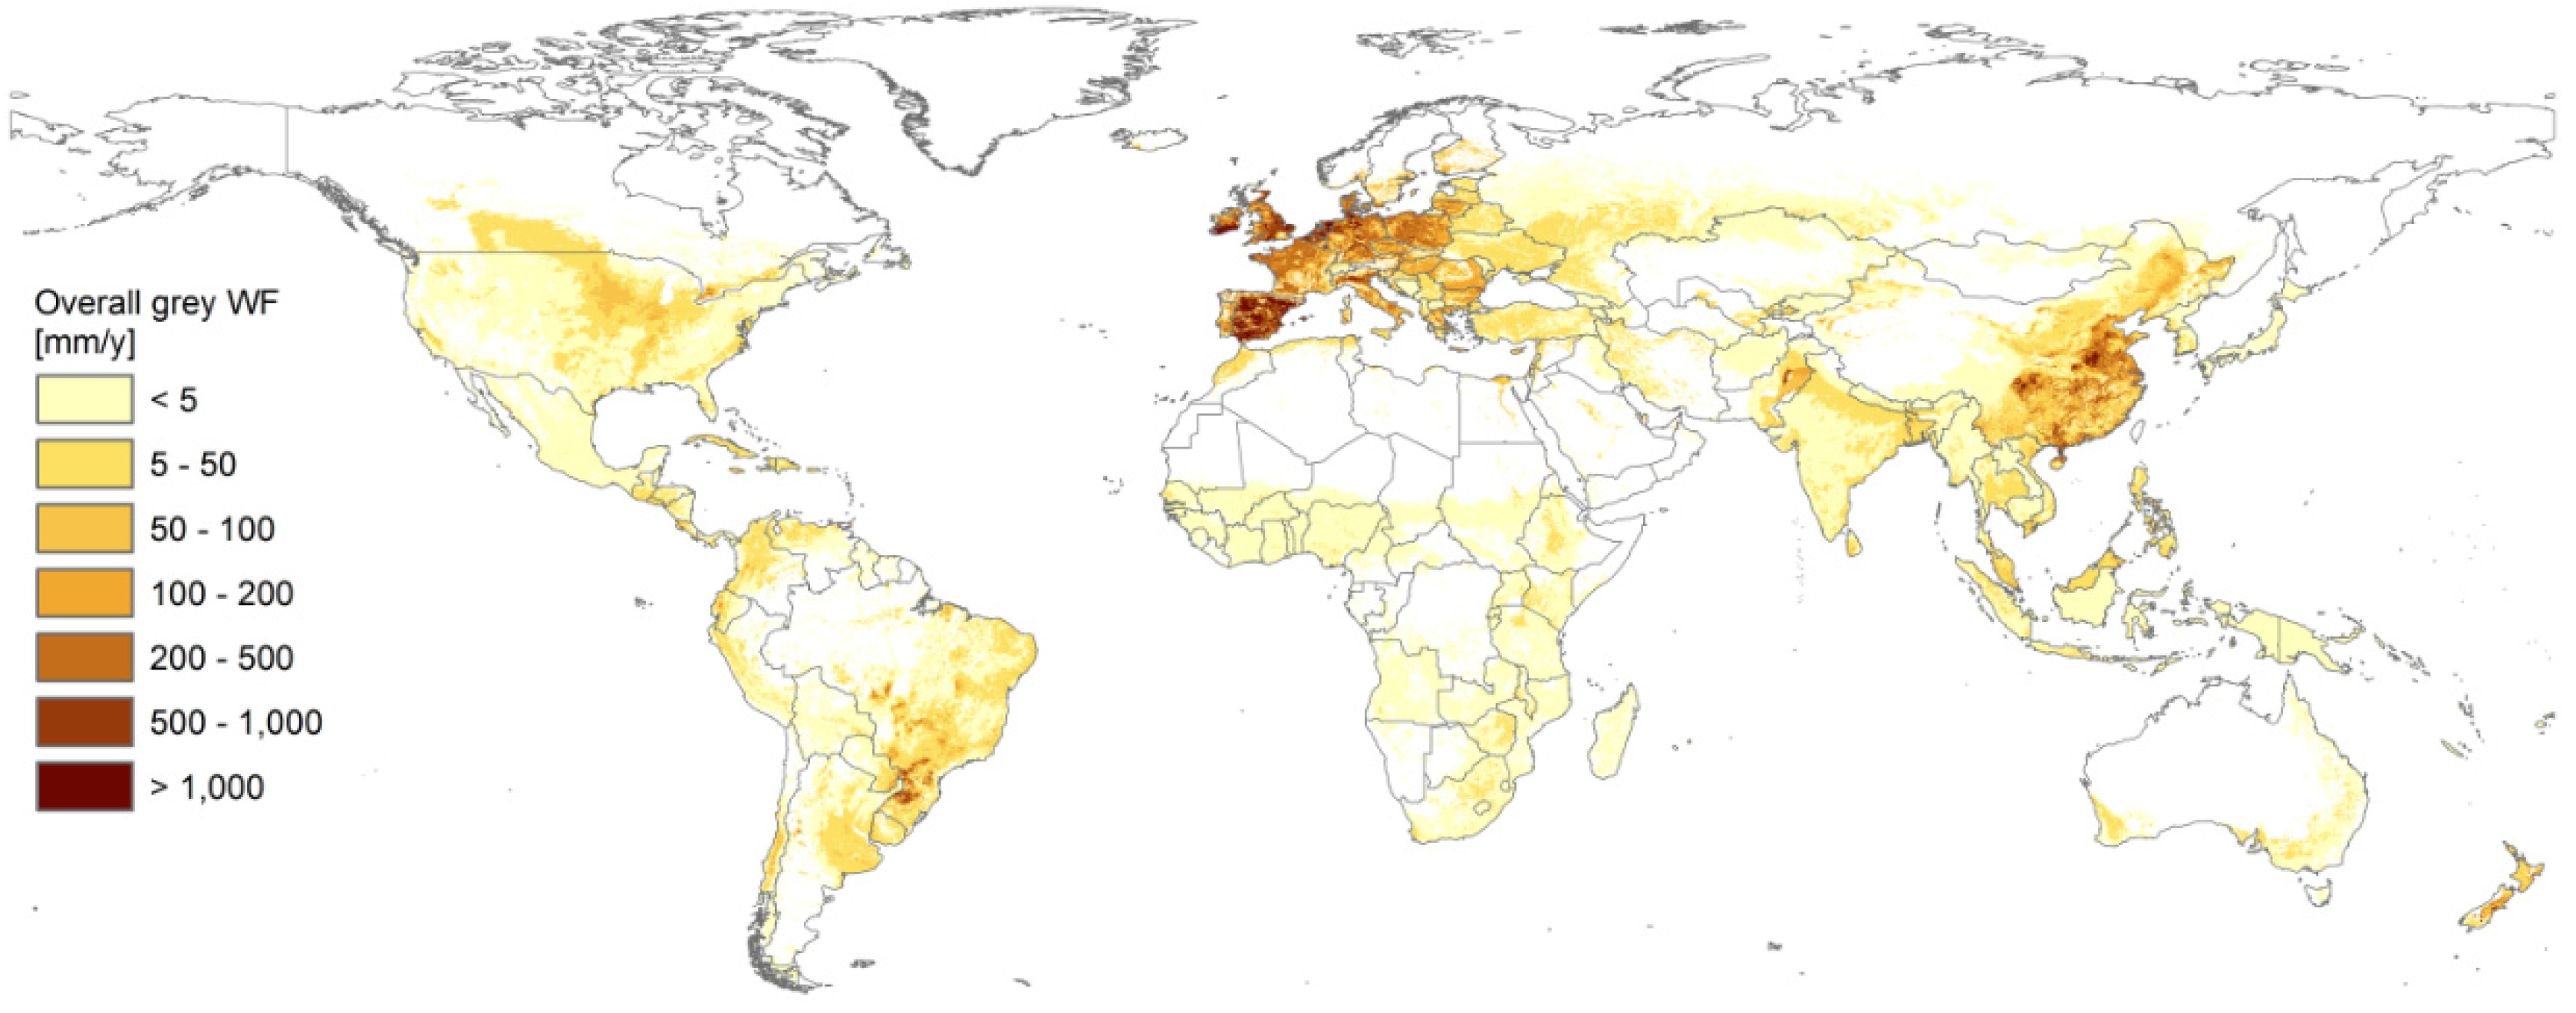
The origin of the global GWF of the EU-27 related to agricultural products consumption is shown in
Figure 3. The figure shows that, although the external GWF of the EU-27 is spread across the rest of the world, its extent is concentrated in only a few places. Large external GWFs of the EU-27 can be observed in the Mississippi river basin (USA), Parana River basin (shared by Argentina, Bolivia, Brazil and Paraguay), Indus River basin, Southeastern China in the Huai He River basin, Yellow River basin and Yangtze River basin, and the Nile Delta in Egypt. The large GWF (both internal and external) is the function of the volume of the different crops supplied to the EU-27 and the GWF per unit of product (m
3/tonne) of the consumed crops.
Figure 3 shows a number of darker areas within the EU-27, which can be explained by the fact that about 59% of the GWF of consumption of the EU-27 is internal (within EU-27). The other darker area is in Eastern China, which is due to both the large volume of oil crops and cereals imported from China, and an excessive fertilizer application rate in China.
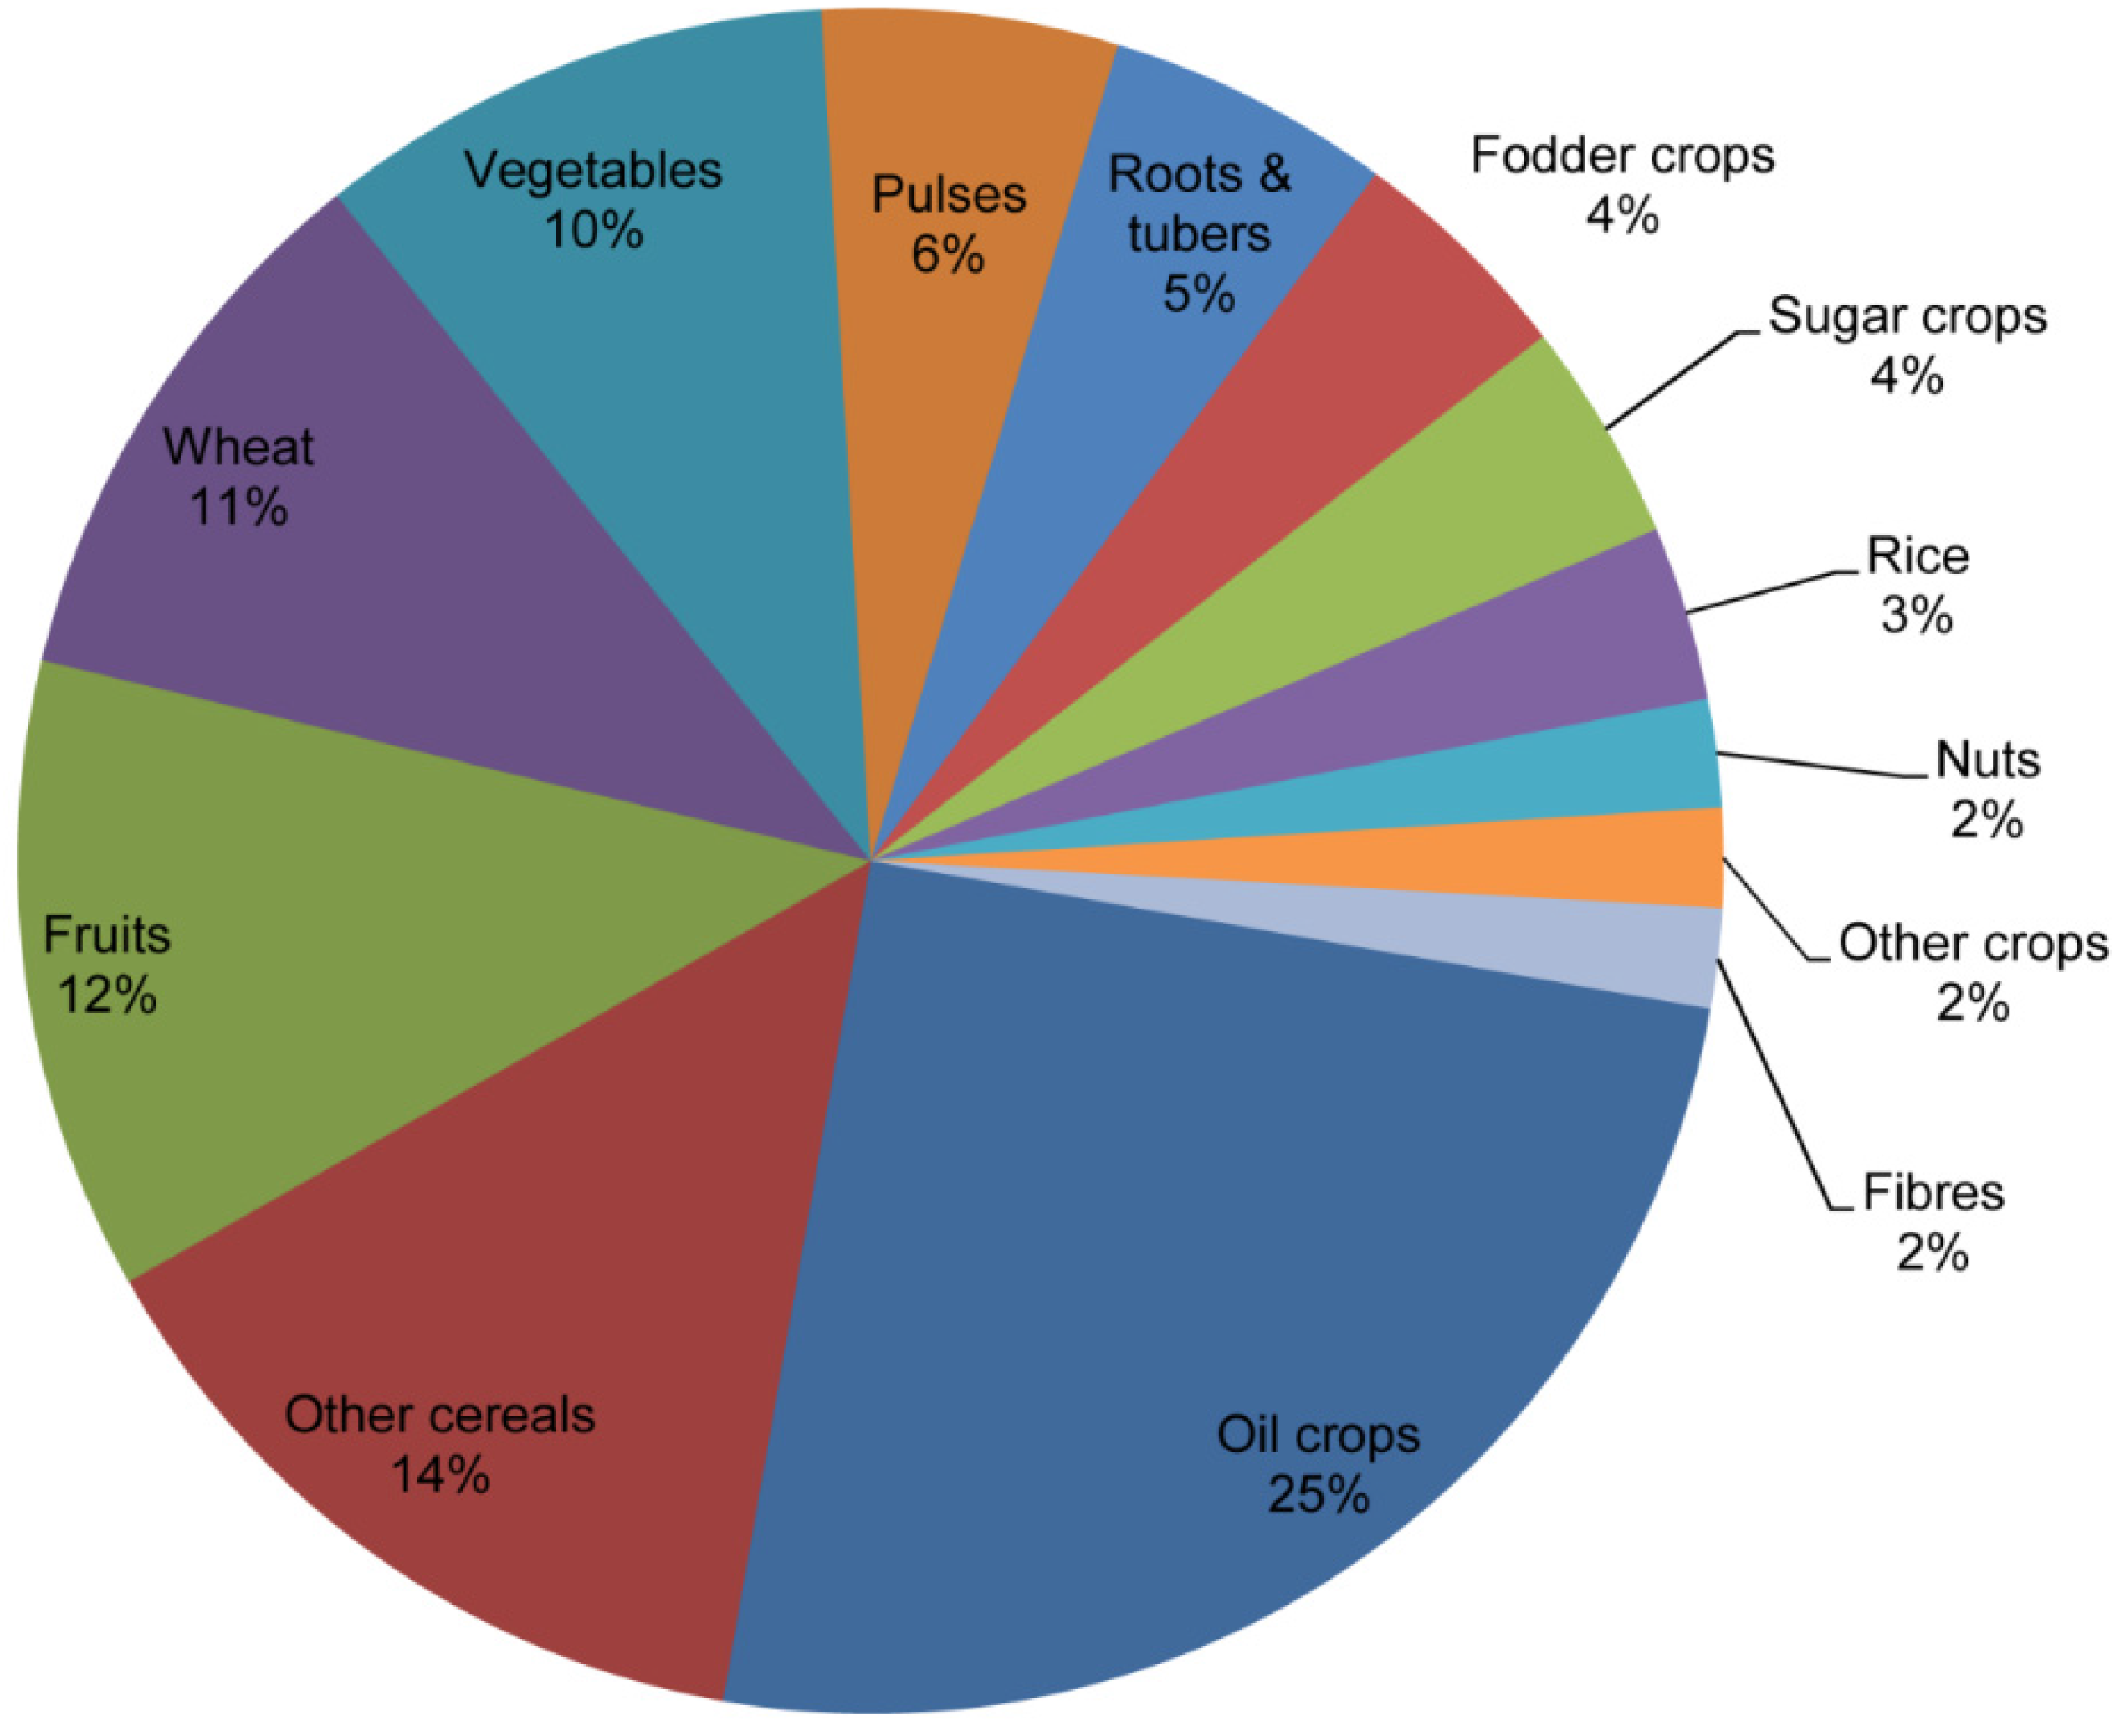
The contribution of different crops to the average GWF of consumption of the EU is presented in
Figure 4. One quarter of the GWF relates to the consumption of oil crops (including cotton, soybean, oil palm, sunflower, rapeseed and others). The difference in the GWF among the different crops is mainly due to the rate of application of artificial fertilizers and manure, plus the crops′ nutrient removal rate. For example, cereal crops have larger N removal rates compared to oil seeds (e.g., 55 kg N/tonne of wheat compared to 10 kg N/tonne of oil crops). In addition, the fraction of N leaching from the agricultural field depends on the precipitation and the clay content of the soil as shown in Equation 1. The leaching fraction will be larger for areas with low clay soil and high precipitation. The large GWF of oil crops comes mainly from China, which has relatively larger fertilizer application rate and anthropogenic N and P emissions. The other products contributing a large share to the EU′s GWF of consumption are other cereals (14%), fruits (12%), wheat (11%), and vegetables (10%). Eastern China and developed Western countries (EU and USA) are known to have an excessive nutrient application rate, while the fertilizer application rate in developing countries such as Africa is not sufficient to supply the crop nutrient requirement [
2]. This is reflected in the high N and P loads in
Figure 1 and large GWF in
Figure 3, in Eastern China and Western Europe.
Figure 3.
The global GWF of the EU-27 related to consumption of agricultural products shown in mm/year on a 5 by 5 arc-min grid. Data per grid cell have been calculated as the WF within a grid cell (in cubic meters per year) divided by the area of the grid cell (in 103 m2). Period: 2007.
Figure 3.
The global GWF of the EU-27 related to consumption of agricultural products shown in mm/year on a 5 by 5 arc-min grid. Data per grid cell have been calculated as the WF within a grid cell (in cubic meters per year) divided by the area of the grid cell (in 103 m2). Period: 2007.
Figure 4.
The contribution of different crops to the overall GWF of the EU consumption of agricultural products. Period: 2007.
Figure 4.
The contribution of different crops to the overall GWF of the EU consumption of agricultural products. Period: 2007.
3.4. Priority Basins and Products
A detailed analysis of the GWF of the EU-27 related to consumption of agricultural products shows that about 87% of the total GWF occurs in basins where the WPL is beyond 1.0,
i.e., the ambient water quality standard are violated (
Table 4). The hotspots with respect to the GWF of the EU-27′s consumption of agricultural products are identified based on the WPL in the respective river basins where these GWFs are located.
Table 4 presents the top 20 river basins ranked by size of the GWF of the EU related to the consumption of agricultural products. The table also shows the crop products with significant contribution to the GWF within the basin. In all 20 river basins, the WPL exceeds 1.0, indicating that in all basins the water quality standards are violated.
Table 4.
The water pollution level and contribution of major crops in the priority basins supporting the largest share of the total GWF related to EU′s consumption.
Table 4.
The water pollution level and contribution of major crops in the priority basins supporting the largest share of the total GWF related to EU′s consumption.
| Basin | Percentage the Total GWF EU-27′s Consumption Located in the Basin | Water Pollution Level for the Nutrient with Larger GWF | Products with Significant Contribution to the GWF in the Basin (% Contribution) |
|---|
| Yangtze (Chang Jiang) | 8.5% | 2.50 | oil crops-39%, paddy rice-14%, roots and tubers-12%, vegetables-10%, other cereals-8%, wheat-7% |
| Ebro | 6.9% | 1.08 | fruits-28%, vegetables-18%, other cereals-16%, pulses-14%, oil crops-6%, nuts-5% |
| Douro | 4.2% | 1.53 | fruits-24%, other cereals-20%, vegetables-17%, pulses-12%, nuts-5%, oil crops-5% |
| Huai He | 3.0% | 7.08 | oil crops-38%, wheat-19%, other cereals-16%, vegetables-7%, roots and tubers-7%, paddy rice-6% |
| Guadalquivir | 2.9% | 8.31 | oil crops-24%, fruits-21%, vegetables-15%, pulses-11%, other cereals-9% |
| Danube | 2.8% | 1.09 | other cereals-29%, Wheat-17%, oil crops-12%, fruits-10%, vegetables-9%, fodder crops-8% |
| Guadiana | 2.6% | 1.70 | fruits-24%, vegetables-16%, other cereals-15%, pulses-12%, oil crops-11%, nuts-6% |
| Tejo | 2.4% | 1.00 | fruits-26%, vegetables-17%, other cereals-16%, pulses-13%, oil crops-9%, nuts-6% |
| Mississippi | 2.1% | 1.33 | oil crops-97% |
| Xi Jiang | 2.0% | 2.49 | oil crops-29%, sugar crops-21%, vegetables-14%, paddy rice-13%, other cereals-9%, roots and tubers-7% |
| Rhine | 1.5% | 2.59 | oil crops-39%, other cereals-23%, sugar crops-11%, wheat-9%, roots and tubers-6% |
| Wisla | 1.5% | 3.33 | fruits-21%, oil crops-18%, wheat-15%, roots and tubers-14%, sugar crops-14%, other cereals-10%, vegetables-8% |
| Elbe | 1.4% | 2.72 | oil crops-58%, other cereals-16%, sugar crops-9%, wheat-6%, vegetables-5% |
| Oder | 1.4% | 2.14 | oil crops-37%, sugar crops-16%, fruits-13%, wheat-13%, roots and tubers-7%, other cereals-7%, vegetables-5% |
| Huang He (Yellow) | 1.2% | 2.87 | other cereals-25%, wheat-24%, oil crops-23%, vegetables-6%, fruits-7%, roots and tubers-7% |
| Amur | 1.1% | 1.18 | oil crops-34%, other cereals-33%, wheat-12% |
| Loire | 1.1% | 1.58 | other cereals-44%, oil crops-22%, pulses-19%, Fruits-7% |
| Indus | 1.1% | 2.99 | wheat-50%, oil crops-35%, sugar crops-6%, pulses-6% |
| Uruguay | 1.0% | 1.02 | oil crops-98% |
| Yongding He | 0.9% | 8.98 | other cereals-29%, wheat-26%, oil crops-21%, fruits-9%, vegetables-7% |
The Yangtze River basin (China) and Ebro River basin (Spain) are two of the most important priority basins, contributing about 8.5% and 6.9% to the overall GWF of the EU-27′s consumption of agricultural products, respectively. In the Yangtze River basin, oil crops production accounts for a significant share of the GWF (39%), followed by rice (14%) and root & tubers (12%). In the Ebro River basin, fruits are the dominant crops that account for the largest share of the GWF in the basin (28%), followed by vegetables (18%) and other cereals (16%).
The Douro (shared by Spain and Portugal) and Huai He (China) are the other priority basins, where 4.2% and 3% of EU′s grey WF is located, respectively. The major crops accounting for a large share of the GWF in the Douro basin are fruits production (24%), other cereals (20%), and vegetables (17%). In the Huai He basins, oil crops (mainly cotton production) contribute about 38% to the GWF, followed by wheat (19%) and other cereals (16%). Next in the list of the priority basins are the Guadalquivir and the Danube, where 2.9% and 2.8% of the GWF of EU′s consumption are located, respectively. The GWF in the Guadalquivir river basin is mainly due to the production of oil crops, fruits, and vegetables. In the Danube basin, the major crops responsible for the large GWF are mainly other cereals, wheat, and oil crops production.
The results of this basin prioritization provide the EU-27 with a clear focus on two priority regions for crop production and sourcing: within the EU-27 itself and Eastern Asia (mainly China). Among the 20 priority basins, 11 of them are within the EU-27 and 6 mainly in China.
There is diversity in the priority crops among the basins. However, five crops and crop categories stand out as the major priority crops: oil crops, other cereals, fruits, wheat and vegetables. These five products also account for about 72% of the overall GWF of the EU-27′s consumption (
Figure 4). Oil crops (including cotton) are the most important crops contributing the largest share of the EU-27 consumers GWF. They are listed as the priority crops in all the priority basins.
4. Discussion and Conclusions
In the current study, we estimate the global N and P emission related to crops production. The study also provides important information on the level of nutrient emission to water and the GWF of the EU-27, both related to the production and consumption of crops.
Our estimate of global total N emission of 31 million tonnes of N per year is 20% lower than the estimate by Bouwman
et al. [
24] (39 million tonne N/year) and 35% above the estimate by Liu
et al. [
23] (23 million tonne N/year). Our estimate of global P emission of 2.9 million tonne P per year is 28% lower than the estimate by Bouwman
et al. [
24] (4 million tonne P/year). It should be noted that the estimate by Bouwman
et al. [
24] includes nutrients flows from grassland, which is not included in the current study. Besides, the two studies refer to two different time periods—while the values in the current study refer to the year 2007, the Bouwman
et al. [
24] study refers to the year 2000.
We further compared our estimate of total N and P emission in from the EU-27′s croplands to freshwater with results from earlier studies. Our estimate of total N emission from EU-27′s croplands is much lower than the other studies (
Table 5): It varies from as low as 30% of the estimate by Leip
et al. [
42] to almost half of the estimate by Westhoek
et al. [
43]. Further, differences in the modeling approach, the large difference between our estimate and the earlier studies, can be explained by the following facts: (a) our estimate refers to cropland, while the estimate from the other studies include nutrients flows from grassland; (b) the other studies have considered inputs through N deposition and fixation, while we consider only fertilizer and manure inputs in croplands; and (c) the study by Leip
et al. [
44] and Westhoek
et al. [
43] have considered N flows from other countries to EU through crop imports. On the other hand, our estimate of the total P emission is 87% larger than the estimate by Grizzetti
et al. [
45]. The estimate by Grizzetti
et al. [
45] refers to nutrient flows to European seas after accounting for nutrient retention in the river networks, while our estimate accounts for all the emission that goes to the freshwater systems. Although the volume of the estimated nutrients emission vary greatly among the different studies, the findings of all of the studies, including ours, underline the need to control nutrient emission in EU-27 and around the world to manage the undesired consequences on the aquatic ecosystems.
Table 5.
Comparison of the Estimated Overall Diffuse N Load from the EU-27′S Croplands to Fresh Water with the Results from Previous Studies.
Table 5.
Comparison of the Estimated Overall Diffuse N Load from the EU-27′S Croplands to Fresh Water with the Results from Previous Studies.
| Study | N Leaching and Runoff to Fresh Water from Diffuse Sources (Million Tonne N/Year) | P Leaching and Runoff to Fresh Water from Diffuse Sources (Million Tonne P/Year) | Study Period |
|---|
| Leip et al. [42] | 5.98 | -- | 2002 |
| Liep et al. [44] | 5.0 | -- | 2004 |
| Westhoek et al. [43] | 3.3 | -- | 2004 |
| Grizzetti et al. [45] | 4.77 | 0.23 | 2000 |
| Current study | 1.68 * | 0.43 | 2007 |
The nutrient emission estimates are derived based on a large number of inputs that may include uncertainties and possible errors. Possible sources of uncertainties include: the fertilizer and manure application rate, the crops nutrient uptake rate, the maximum allowable nutrient concentration, and the natural nutrient concentration. For the GWF in particular, the maximum allowable concentration and the natural nutrient concentrations values taken will have large impacts on the final result. For example, Liu
et al. [
41] have shown that a slight increase/decrease results in a large change in the final values of the WPL. In a recent study, Mekonnen and Hoekstra [
46] showed that the uncertainty of the N related global GWF due to uncertainty in input data and parameters ranges from −33% to +60%. Such large uncertainty ranges highlights the need for further detailed assessment of the nutrient emission and GWF based on local data and better modeling tools. In general, depending on the elements included and the data on the maximum allowable concentration and natural concertation used, the final volume of the GWF differs substantially. To address this and other criticism directed at the GWF concept, Vanham and Bidoglio [
47] suggest further standardization of the GWF method.
The other potential uncertainties are related to the models used in estimating both the N and P emission per grid cell. The regression model of De Willigen [
17] used here in estimating N emission is based on experimental data, and could therefore give unreasonably high leaching values when used for input parameters (precipitation, clay content, and layer thickness) beyond those used in deriving the regression equation. Liu
et al. [
23], for example, have set an upper limit on the total leached amount not to exceed 20% of the total mineral fertilizer application and 50% of the N from manure, arguing that the model may give unreasonably high leaching values for extreme precipitation. On the other hand, the model accounts for the effect of precipitation neglecting the effect of irrigation, potentially underestimating the N leaching from irrigated fields. The P emission is also estimated using a single factor derived from extensive modeling exercise applied at a global scale. Since it does not account for the local conditions (e.g., precipitation and soil P content) that might influence P runoff from agricultural field, the estimates at grid level are subject to large uncertainties and errors. Given the fact that 78% of the GWF is related to anthropogenic P emission, further refinement of the approach in modeling P emission will improve the final result. Given the uncertainties in the input variables and the modeling, the results in this paper should be taken as indicative of the nutrient loads and the grey WF magnitudes rather than as an absolute value.
The study also does not assess the final effect of eutrophication of lakes, estuaries and coastal seas associated with the emitted nutrients, as this is beyond the scope of the present paper. In future studies, the assessment of such effects on fish, the threat on biodiversity, on the tourism and recreation activities would add value to the analysis results.
The increases in international trade of agricultural products in the last few decades have also increased the globalization of virtual water flows as well as agricultural pollution. Consumers in one part of the world are shifting the environmental damage brought about by fertilizer application to regions that produce and export the products often without being aware of the environmental damages. The methodology of tracing global virtual water flows through an environmentally extended input-output framework such as the EXIOBASE has proven to be a valuable tool for providing insight into the environmental pressure put by consumers in one part of the word on regions that produce and export the product. By combining the data on direct and indirect water consumption per country with data on water pollution, it is possible to trace water pollution induced by final consumption.
This study is a major contribution to understanding the sustainability of the EU′s consumption with respect to water pollution both within the EU and the rest of the world. By tracing the global GWF of the EU, the study made the link between the crops consumed in the EU to the water pollution problem in other places. It further assessed the geographically specific extent to which the EU has externalized its environmental damage by identifying priority basins and products. Prioritizing or identifying the basins with serious water pollution and the associated products responsible for the large GWF can help the EU policy makers and governments to formulate policies and strategies on how to share responsibility for reducing GWFs where it is most needed.
As a consequence, analyses like the one presented in this paper may further encourage EU policy makers to develop GWF reduction targets that account for the assimilation capacity of river basins. These targets can be translated into maximum acceptable loads per river basin to be downscaled to the specific crops production. In many regions of the world, crops receive excessive amounts of nutrient. In these regions, the excessive application of nutrients can be reduced without affecting agricultural productivities [
2]. Reducing the application of N and P in agriculture provides both environmental and economic benefits. The EU could implement a number of regulations including the certification of imported crop products in order to promote environmentally sustainable crop production in other countries.


