Article

Using a Modified Lane’s Relation in Local Bed Scouring Studies in the Laboratory Channel

Water Engineering Division, Department of Hydraulic Engineering, Warsaw University of Life Sciences—SGGW, 159 Nowoursynowska Street, Warsaw 02-787, Poland
*
Author to whom correspondence should be addressed.
Water 2016, 8(1), 16; https://doi.org/10.3390/w8010016
Submission received: 3 September 2015 / Revised: 7 December 2015 / Accepted: 15 December 2015 / Published: 6 January 2016

Abstract

:
Numerous approaches to local scour forming studies have been developed. This paper presents different scientific approaches to the scour phenomenon using Lane’s relation [1] in its modified form during laboratory studies. The original Lane’s relation is applicable in dynamic balance conditions in alluvial rivers context, and it is not an equation, but a qualitative expression which cannot be directly used to estimate the influence of a change in one parameter on the magnitude of others. Lane's relation, despite its qualitative and simplified character, serves well to describe the nature of the process of forming alluvial stream channels, while modified relation allows transforming it into an equation for laboratory studies of local scour forming in prearranged clear-water equilibrium conditions and gives a new opportunity for this principle application.

Graphical Abstract

1. Introduction

Numerous approaches to local scour forming studies have been developed [2,3,4,5]. The present research discloses different scientific approaches to the local scouring phenomenon—the Lane’s relation [1] application in laboratory studies is performed and used commonly in alluvial rivers morphology forming context in a dynamic balance (equilibrium) conditions. Natural river stays in equilibrium conditions if in a long period of time basic flow parameters, such as even longitudinal river decline, average channel width and depth, and bedload granulation’s characteristics remain constant, which is originally described by Lane as the following:
Q s × d ~ Q w × S
where: Q s —bedload’s transport discharge, d —particle diameter, Q w —water discharge, S—energy grade line slope.
It was attempted to describe the river morphology forming process more precisely using classic Lane’s relation, according to Lane’s sentence: “The science of fluvial morphology has developed from two roots which have been largely independent of each other (…)” [1]. Geology and engineering—these two roots have remained largely separate down to the present time. Scientists [6] focused on one of these roots: geology, but the second—engineering—is up to now insufficiently studied and needs a wider description. Others considered the geomorphology parameters of the natural river channel connection with sediment transport discharge, as for example [6,7,8]. Concomitantly, Lane’s relation in scope of local scouring in laboratory conditions has not been examined yet. Schumm’s formula [8] attempts to forecast river adjustment for the maintenance of a stable equilibrium state following disturbance, and it establishes a connection as it follows:
Q s = W × L × S d × P
where: W —channel width; L —the length of river; S —the channel slope; P —the channel sinuosity index. Schumm’s model was further modified by other scientists [7] to derive Lane’s modified relation considering the width-to-depth ratio ( W H ) :
Q w × S ~ Q s × D s × ( W H ) 1
where: D s —the sediment size; W —the channel width, H —the depth of the water.
The present paper consists of a further modification of derived relation, considering width-to-depth ratio in modified relation, developed into an equation in local scour forming process phenomenon in laboratory conditions.
To describe equilibrium conditions in scope of scouring phenomenon, Chabert and Engeldinger classified local scours into two categories—clear-water scour and live-bed scour. Clear-water scour takes place in the absence of sediment transport by the approaching flow (no sediment feeding adoption), and live-bed scour occurs when the scour hole is continuously fed with sediment by the approaching flow [9]. The time development of clear-water and live-bed scour is shown in Figure 1.
Figure 1. Time development of clear-water and live-bed scour [10].
Water 08 00016 g001
The original form of Lane’s relation is not an equation, but a qualitative expression which cannot be directly used to estimate the influence of a change in one parameter on the magnitude of others. Consequently, it is not possible to estimate the changes in the morphological characteristics of a river which result from its seeking to retrieve the dynamic balance lost due to the change in water flow conditions and/or bedload’s transport. Lane’s relation, despite its qualitative and simplified character, serves well to describe the nature of the process of forming alluvial stream channels. Results of many field studies, as well as analyses of causes and effects of the river’s loss of dynamic balance, support the assumptions of Lane’s relation, which can predict tendencies in changes of hydraulic and morphological characteristics of stream channels [8,11,12,13,14].

2. Materials and Methods

2.1. The Modified Lane's Relation

The original form of Lane’s relation (1) is not applicable to the functional description of the bedload’s dynamic balance conditions due to the lack of consistency of parameters on the left and right side. In order to eliminate this inconvenience, the relation modification is suggested, which relies on the replacement of bedload’s d design grain size with dimensionless grain parameter, described by Bonnefille with the following relation [15]:
D * =   d 50 × [ ( s 1 ) g v 2 ]   1 3
where: d 50 —median grain diameter for 50% of sieve curve (m), s —specific density of solid particles (-); s = ρsw, where ρs—bed material specific density (kg·m−3), ρw—water specific density (kg·m−3), g acceleration of gravity (m·s−2),   v kinematic viscosity parameter (m2·s−1).
Once Lane’s relation, in its original form, describes the natural river’s character, not local scouring phenomenon in laboratory conditions, there exists the possibility of crediting the local scour distance energy grade line into hydraulic gradient in researched reach.
The modified Lane’s relation with the [7] adjustment (Equations (1), (3) and (4)) eventually takes the following form with D * parameter included:
  Q s × D * × ( W H ) 1 = Q w × S
where: Q s mean bedload’s transport discharge (m3·s−1), D * dimensionless grain parameter of laboratory material (-), W —the channel width (m), H —the depth of the water (m), Q w water flow discharge (m3·s−1), S mean energy grade line slope in local scour distance (-).

2.2. Aim and Scope of Research

The aim of this research is to examine the possibility to use the modified Lane’s relation (Equation (5)) in the local scouring phenomenon description in laboratory channels with a rectangular cross-section, in which the solid bottom transforms into sandy bottom in the intake part. Due to the increase of flow resistance on the whole length of the bed, resulting from varied roughness of the solid and sandy bottom, the hydraulic gradient increases causing an increase of shear stress on the bottom. After exceeding the critical shear stress, the motion of sediment grains begins and is followed by gradual scour of the bed during the time of experiment until the shape and the parameters of local scours stabilize. Then, the local scour obtains equilibrium depth in clear-water scour conditions, zmax, because no sediment feeding system application (Figure 2). The experimental conditions in this study may be compared to a case of the transport continuity being disrupted by the accumulation of bedload material in the retention reservoir located upstream [6,7].
Figure 2. Scheme of local scour forming in washable area of sandy bed. Where: 1—solid bottom; 2—sandy washout bed; H1, H2, H3—water depth; Qw—water flow discharge; S1, S2—energy grade line slope; zmax—maximal depth of local scour while achieving stabilization in time tn (clear-water equilibrium scour depth); t1, t2, tn—shapes of bed while duration of experiment in time.
Water 08 00016 g002

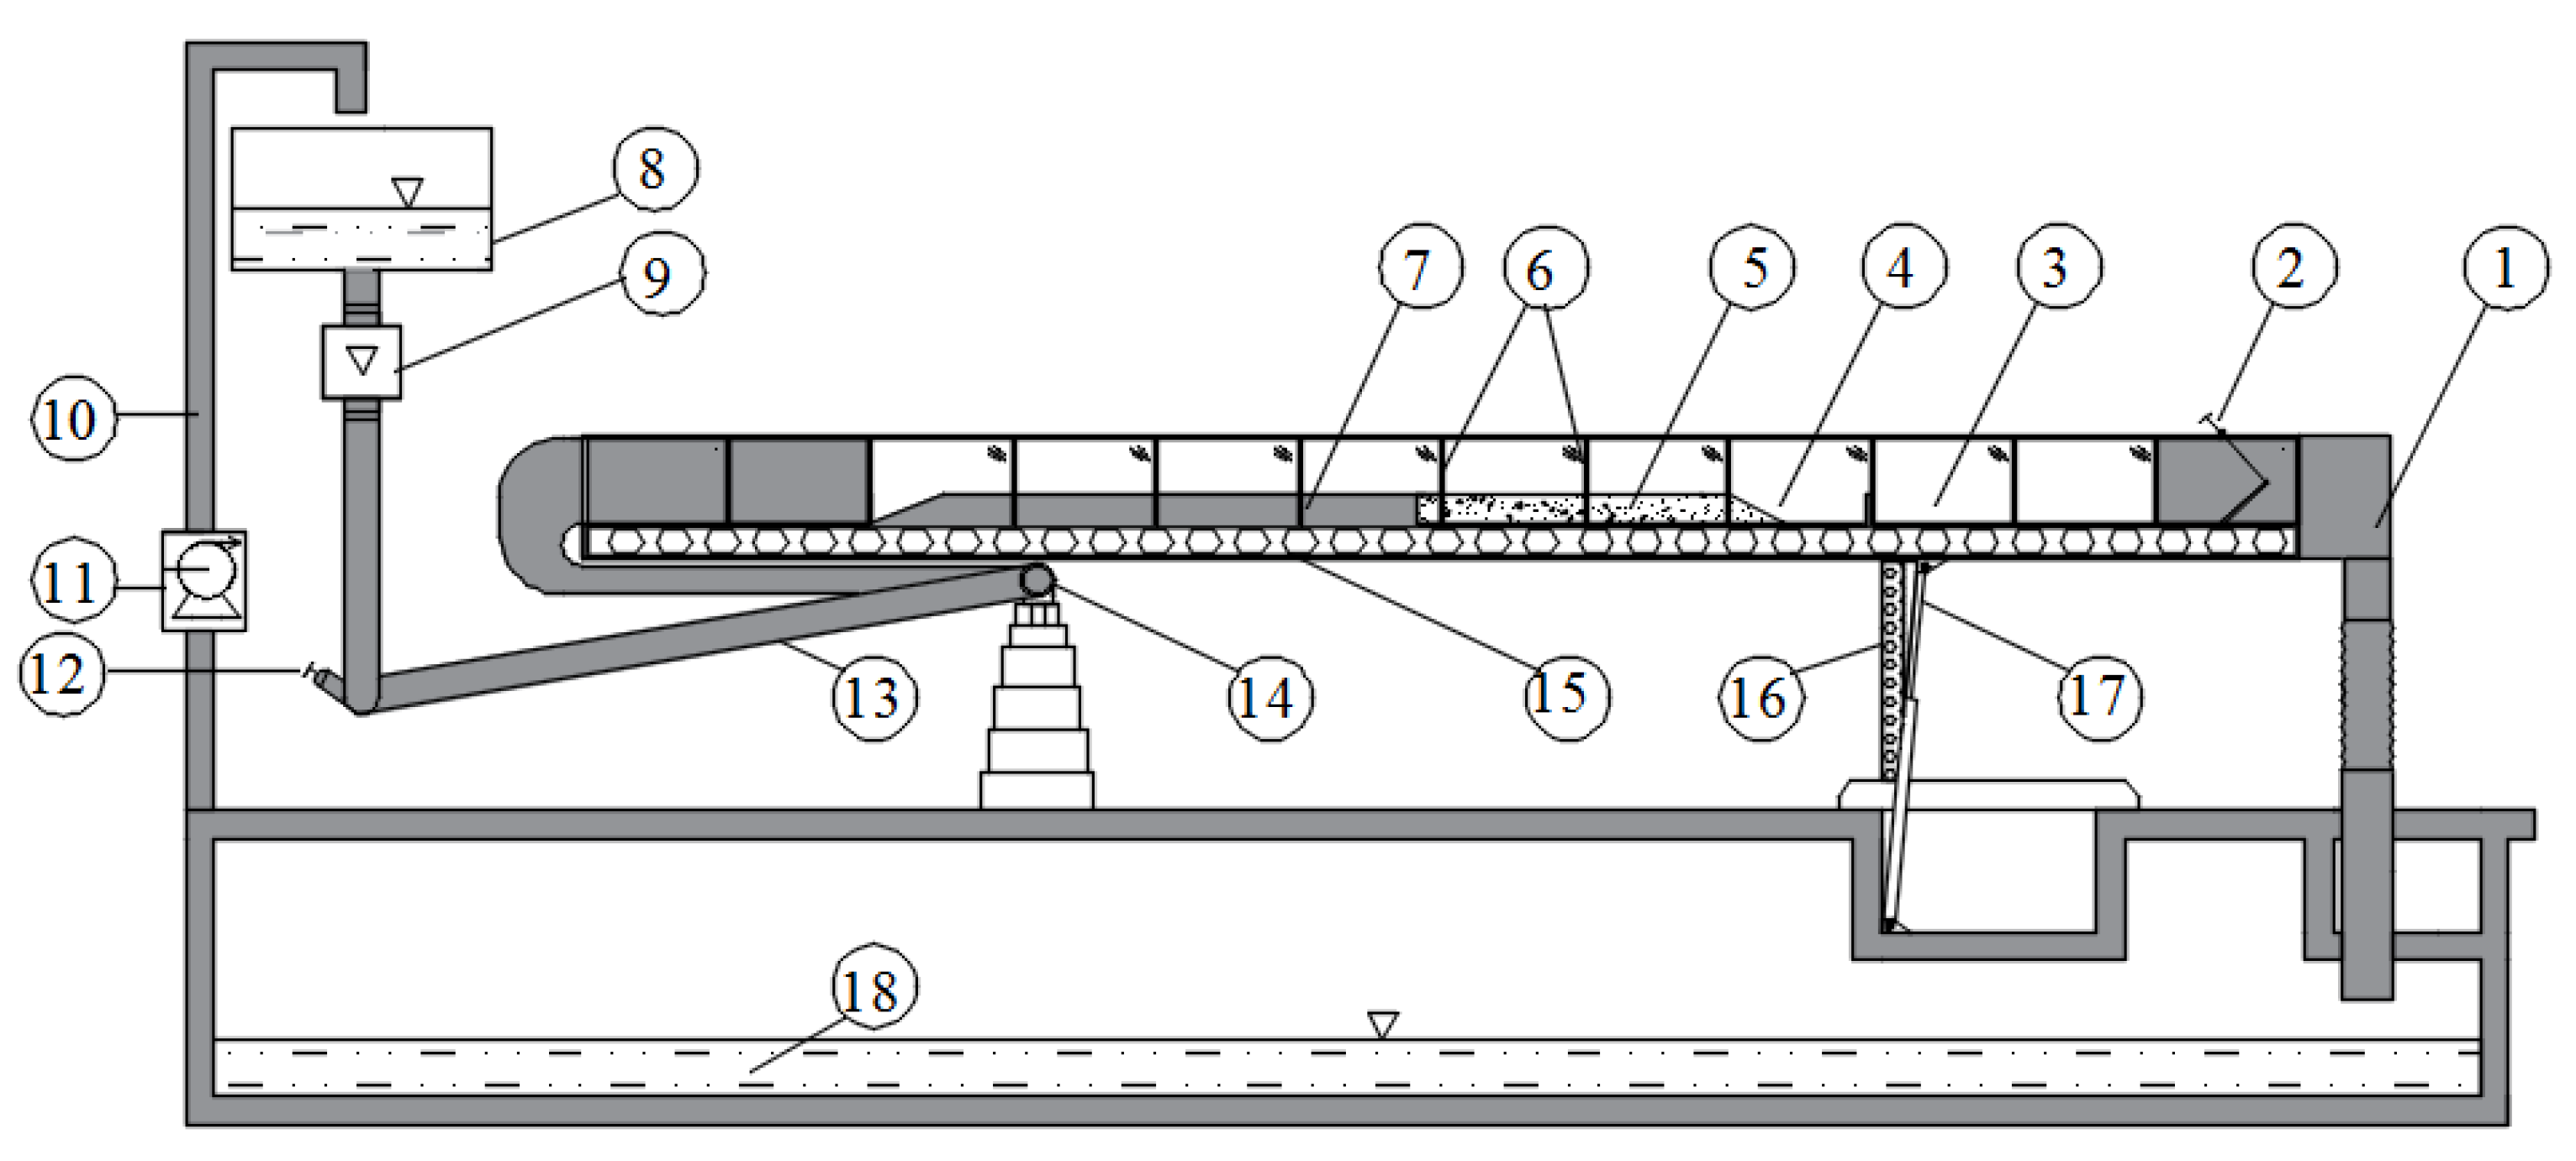
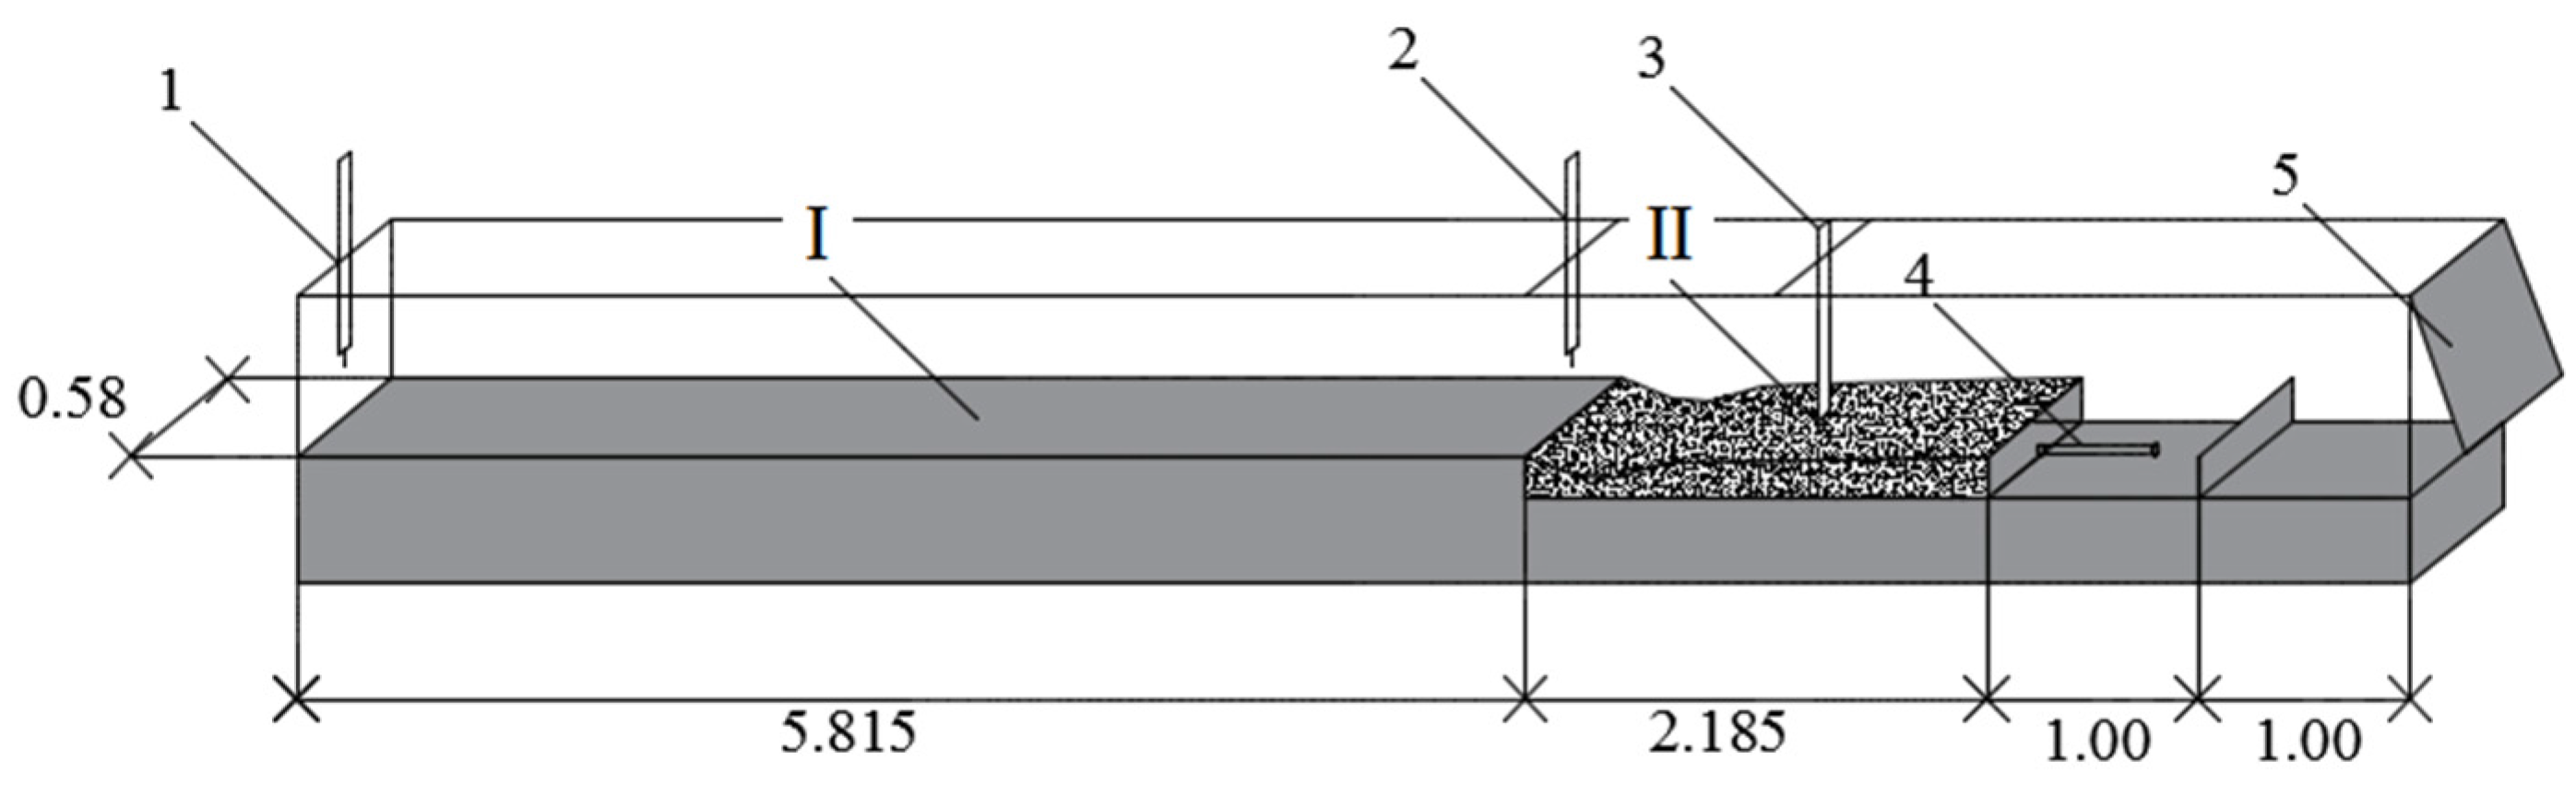
2.3. Description of the Test Stand

Studies of local scours phenomenon were conducted in a laboratory channel of 0.58 m in width (W) and full length (L) of 10.00 m (Figure 3).
Figure 3. Experimental channel scheme—side view. Where: 1—chute chamber; 2—the regulatory gate; 3—glass side wall; 4—collection chamber; 5—sandy bed; 6—supports for side walls; 7—solid bottom; 8—upper reservoir; 9—electromagnetic flow meter; 10—a pipeline conducting water; 11—the pump; 12—the regulatory valve; 13—the feeding pipeline; 14—the support with joint; 15—the support plate of the channel; 16—the support with adjustable frame elevation; 17—the hydraulic cylinder; 18—the lower reservoir.
Water 08 00016 g003
The solid bottom, which is 5.82 m in length, precedes the washout part, which is 2.18 in length (Figure 4), that is filled with sand with a mass median diameter of grain d50 = 0.62 mm and d90 = 1.50 mm [16]. A pin water gauge was used in the intake part in order to measure the water surface elevation, regulated with a gate. In order to measure the ordinate of water surface level, a moving pin water gauge was used and was placed on the trolley pushed on guides along the channel. The level of the sandy bottom within the washout bed was measured with a moving disc probe. The water flow discharge was examined with the use of electromagnetic flow meter. No sediment feeding system was adopted.
Figure 4. Experimental channel scheme (all dimensions in meters). Where: I—solid bottom; II—washout bed (sandy); 1,2—pin water gauge; 3—disc probe; 4—collection chamber; 5—the regulatory gate.
Water 08 00016 g004

2.4. Methodology and the Scope of the Study

In the studies on local scour phenomenon, which were conducted in changeable water flow discharge and water surface level conditions, the parameters were described for facilitating the establishment of the correlation between the right and the left side of modified Lane’s relation, i.e., the product of water flow discharge, water level decline (hydraulic gradient), and the product of bedload discharge and Bonnefille’s dimensionless grain parameter.
Water flow discharge was measured by electromagnetic flow meter. The average decline of water level on the washout bed was examined on the basis of the readings of a movable pin water gauge made in the bed’s axis in the cross-sections of bed probing. The shape of the sandy washout bed was examined with the results of bed probing measured with a disc probe in five representative points in each of the 11 cross-sections (Figure 5).
Figure 5. Probing points in the area of sandy bed—plan view; all dimensions in meters; “+”—bed probing points.
Water 08 00016 g005
The experiment was being conducted until a stabilized scour hole shape (and simultaneously a maximal scour depth zmax) was reached and controlled with a time step of 0.5 h or 1 h. The changes in bed shape were described within these time steps under the influence of the set water flow discharge levels. The application of Surfer software enabled conversion data to grid format, computing washed-out bedload volume after each probing with an established time step, plotting a graph of the increase in scours volume, and creating a graphic illustration of the changes occurring in the bedload. It shows the equilibrium depth of clear-water scour. The grid of bed shape was described with coordinates (x,y,z) and then, Surfer was used, also for creation a graphical images of scours (Figure 6). The final volume of local scour was measured firstly by filling calibrated containers with material, gathered in collection chamber, and then, compared with the final scour volume, computed by Surfer as a difference between initial conditions surface (upper surface) and the final coordinates of bed (x,y,zmax) (lower surface). Comparison reveals a 5% maximal error of the values measured in laboratory conditions and computed in Surfer; therefore the volume gauged in containers was accepted to further analysis.
Figure 6. Local scour in sandy washout bed (measurement no. 8 in conditions of Qw = 0.040 m3·s−1 and H = 0.1 m).
Water 08 00016 g006
Thirteen experiments were conducted in the research in a scope of water flow discharge Qw = 0.020–0.045 m3∙s−1 and depth H = 0.1–0.2 m (Table 1). Apart from established water flow discharge and water surface level, the water discharge per unit width q, and time t are shown in each measurement. All the tests lasted long enough to reach equilibrium scour depth. Maximum scour depth zmax was measured after the equilibrium scour depth in clear-water scouring conditions achievement as a maximal distance between initial and final ordinates (zmax and the initial ordinate z, before water flow input into channel).
Table 1. Summary of the test’s main parameters.
Number of MeasurementQwHqTν D * Vstzmax
(m3·s−1)(m)(m3·s−1∙m−2)(°C)(1×10⁻⁶∙m2·s−1)(-)(m3)(h)(cm)
10.0200.100.00316.81.08614.720.001537.250.42
20.0250.100.00416.51.09414.650.0184110.503.41
30.0250.120.00416.11.10414.560.001516.500.41
40.0300.100.00516.51.09414.650.037015.004.74
50.0300.150.00516.71.08914.700.001516.000.47
60.0350.120.00616.31.09914.610.046818.505.64
70.0350.150.00615.91.10914.520.004047.502.17
80.0400.100.00716.01.10714.540.097469.2511.82
90.0400.120.00717.21.07614.810.0550010.509.28
100.0400.150.00717.01.08114.770.019008.004.23
110.0400.200.00716.81.08614.720.002406.000.59
120.0430.120.00716.61.09114.680.068008.507.64
130.0450.150.00816.01.10714.540.045008.506.29
Where: Qw—water flow discharge, H—water depth in the channel in control profile, q—discharge per unit width, T—average temperature of water, ν—kinematic viscosity parameter, D * —Bonnefille’s dimensionless grain parameter, Vs—total volume of bedload scattered from washout sandy bed in equilibrium conditions (volume of local scour), t—duration of measurement, zmax—maximal (equilibrium) scour hole depth.
Mean bedload discharge Qs was determined as the product of bedload volume (gathered in collection chamber) Vs, and the experiment’s duration t. The experiment included the measurement of water temperature, which made it possible to determine the kinematic viscosity parameter v and then Bonnefille’s dimensionless grain parameter D * (2). The specific density of sand ρs in the washout bed was 2610 kg·m−3. Therefore, assuming a water density on the level of 1000 kg·m−3, the relative density of bed material was estimated at s = 2.61 [-]. Measurements of washed-out bedload volume took place after the achievement of scour stabilization—i.e., no visible particle movement and after dewatering the bed.
To recognize better the hydraulic conditions, Froude number was also calculated for initial conditions. In bedload movement conditions during local scour forming process in sandy bed, dimensionless shear stress in bed region θ exceeds critical shear stress (Shield number) θ c r : θ > θ c r , where θ for the bed region could be calculated as:
θ = τ b ( ρ s ρ w ) g d 50
Mean shear stress for bottom part of flume τ b   is calculated as the product of density of water ρ w , the gravity acceleration g , hydraulic radius of the sandy bottom part R b ,   and hydraulic gradient S [17] ( τ b = ρ w · g · R b · S ) . Because of continued changes of the bed shape during the experiment, the hydraulic radius of the sandy bottom part R b and energy grade line slope S is changing during the scour forming process. Calculations were conducted for the hydraulic radius of the bottom part R b in time t = 0 (for initial assumed water depth H and initial shape of the bed in flume) and for mean energy grade line slope for each measurement S .
To determine the R b value in the chosen cross section (located in 5.82 meter of laboratory flume lengh), Einstein’s division of velocity field was used [18,19]. The hydraulic resistance and roughness coefficients change alongside the wetted perimeter of the chosen cross section in flume, which influences the shear stress distribution in cross section [20]. Einstein’s method predicates the assumption of velocity distribution in the cross section, which is dependent on mutual relation between total value of hydraulic resistance for the cross section and hydraulic resistances for the separated part of wetted perimeter of cross section:
λ = λ i O i O i  
where: λ —total hydraulic resistance coefficient for cross section, λ i —hydraulic resistance coefficient for the separate part of cross section with an absolute roughness k s i , O i —wetted perimeter of separate part of cross section.
It is assumed that the mean velocity in total velocity field V is equal to velocity in separate part of total velocity field, i.e., in zones of water flow influence on bottom V b and walls of the channel V g . With the assumption of roughness equality of both walls in the cross section, they are fulfilled following relations:
For mean velocity in each part of the cross section:
V = V b = V g  
1 λ 8 g R S = 1 λ b 8 g R b S = 1 λ g 8 g R g S  
where: λ ,   λ b , λ g —total hydraulic resistance coefficient for all velocity field; for the sandy bottom part of cross section; for glass walls; R ,   R b ,   R g —total hydraulic radius for all velocity field; hydraulic radius, that express impact of velocity field on the sandy bottom part; hydraulic radius, that express impact of velocity field on the single glass wall part.
For cross section area: A = 2 A g + A b , where: A —area of total velocity field, A g —area of single velocity field, that impact on glass wall, A b —area of velocity field, that impact on sandy bottom.
For hydraulic radius: R = A O , R b = A b O b , R g = A g O g , where O , O b , O g —total wetted perimeter, wetted perimeter of the bottom part, wetted perimeter of the walls.
Hydraulic radiuses and hydraulic resistance coefficients for the separate part of the cross section were obtained from iterative calculations using the Colebrook-White equation:
1 λ = 2 l o g ( 2.51 R e λ + k s d 3.71 )  
where k s is absolute roughness, assumed as: k s b = 3 d 90 = 0.0045   m [15] for the bottom and k s g = 3.0 × 10 6   m for the glass walls [21] and R e is a Reynold’s number.
For the R b value obtained from iterations, it calculated τ b and finally, dimensionless shear stress θ for the bed area. To perform a comparison with critical shear stress, Shields number for the bed velocity field was calculated [22] as a function of the local Reynold’s number R e * , dependent on median grain diameter d 50 , dynamic water velocity in velocity field connected with bottom region u * = τ b / ρ w and kinematic viscosity parameter   v :
R e * = d 50 × u * v  
Then, in accordance with Zanke:
θ c r = 0.432 R e * 2 + 0.04 ( 1 3.32 R e * 1 )
Attempt to correlate dimensionless shear stress in bed region θ with mean sediment discharge Q s and with maximal scour depth z m a x for each measurement were undertaken.

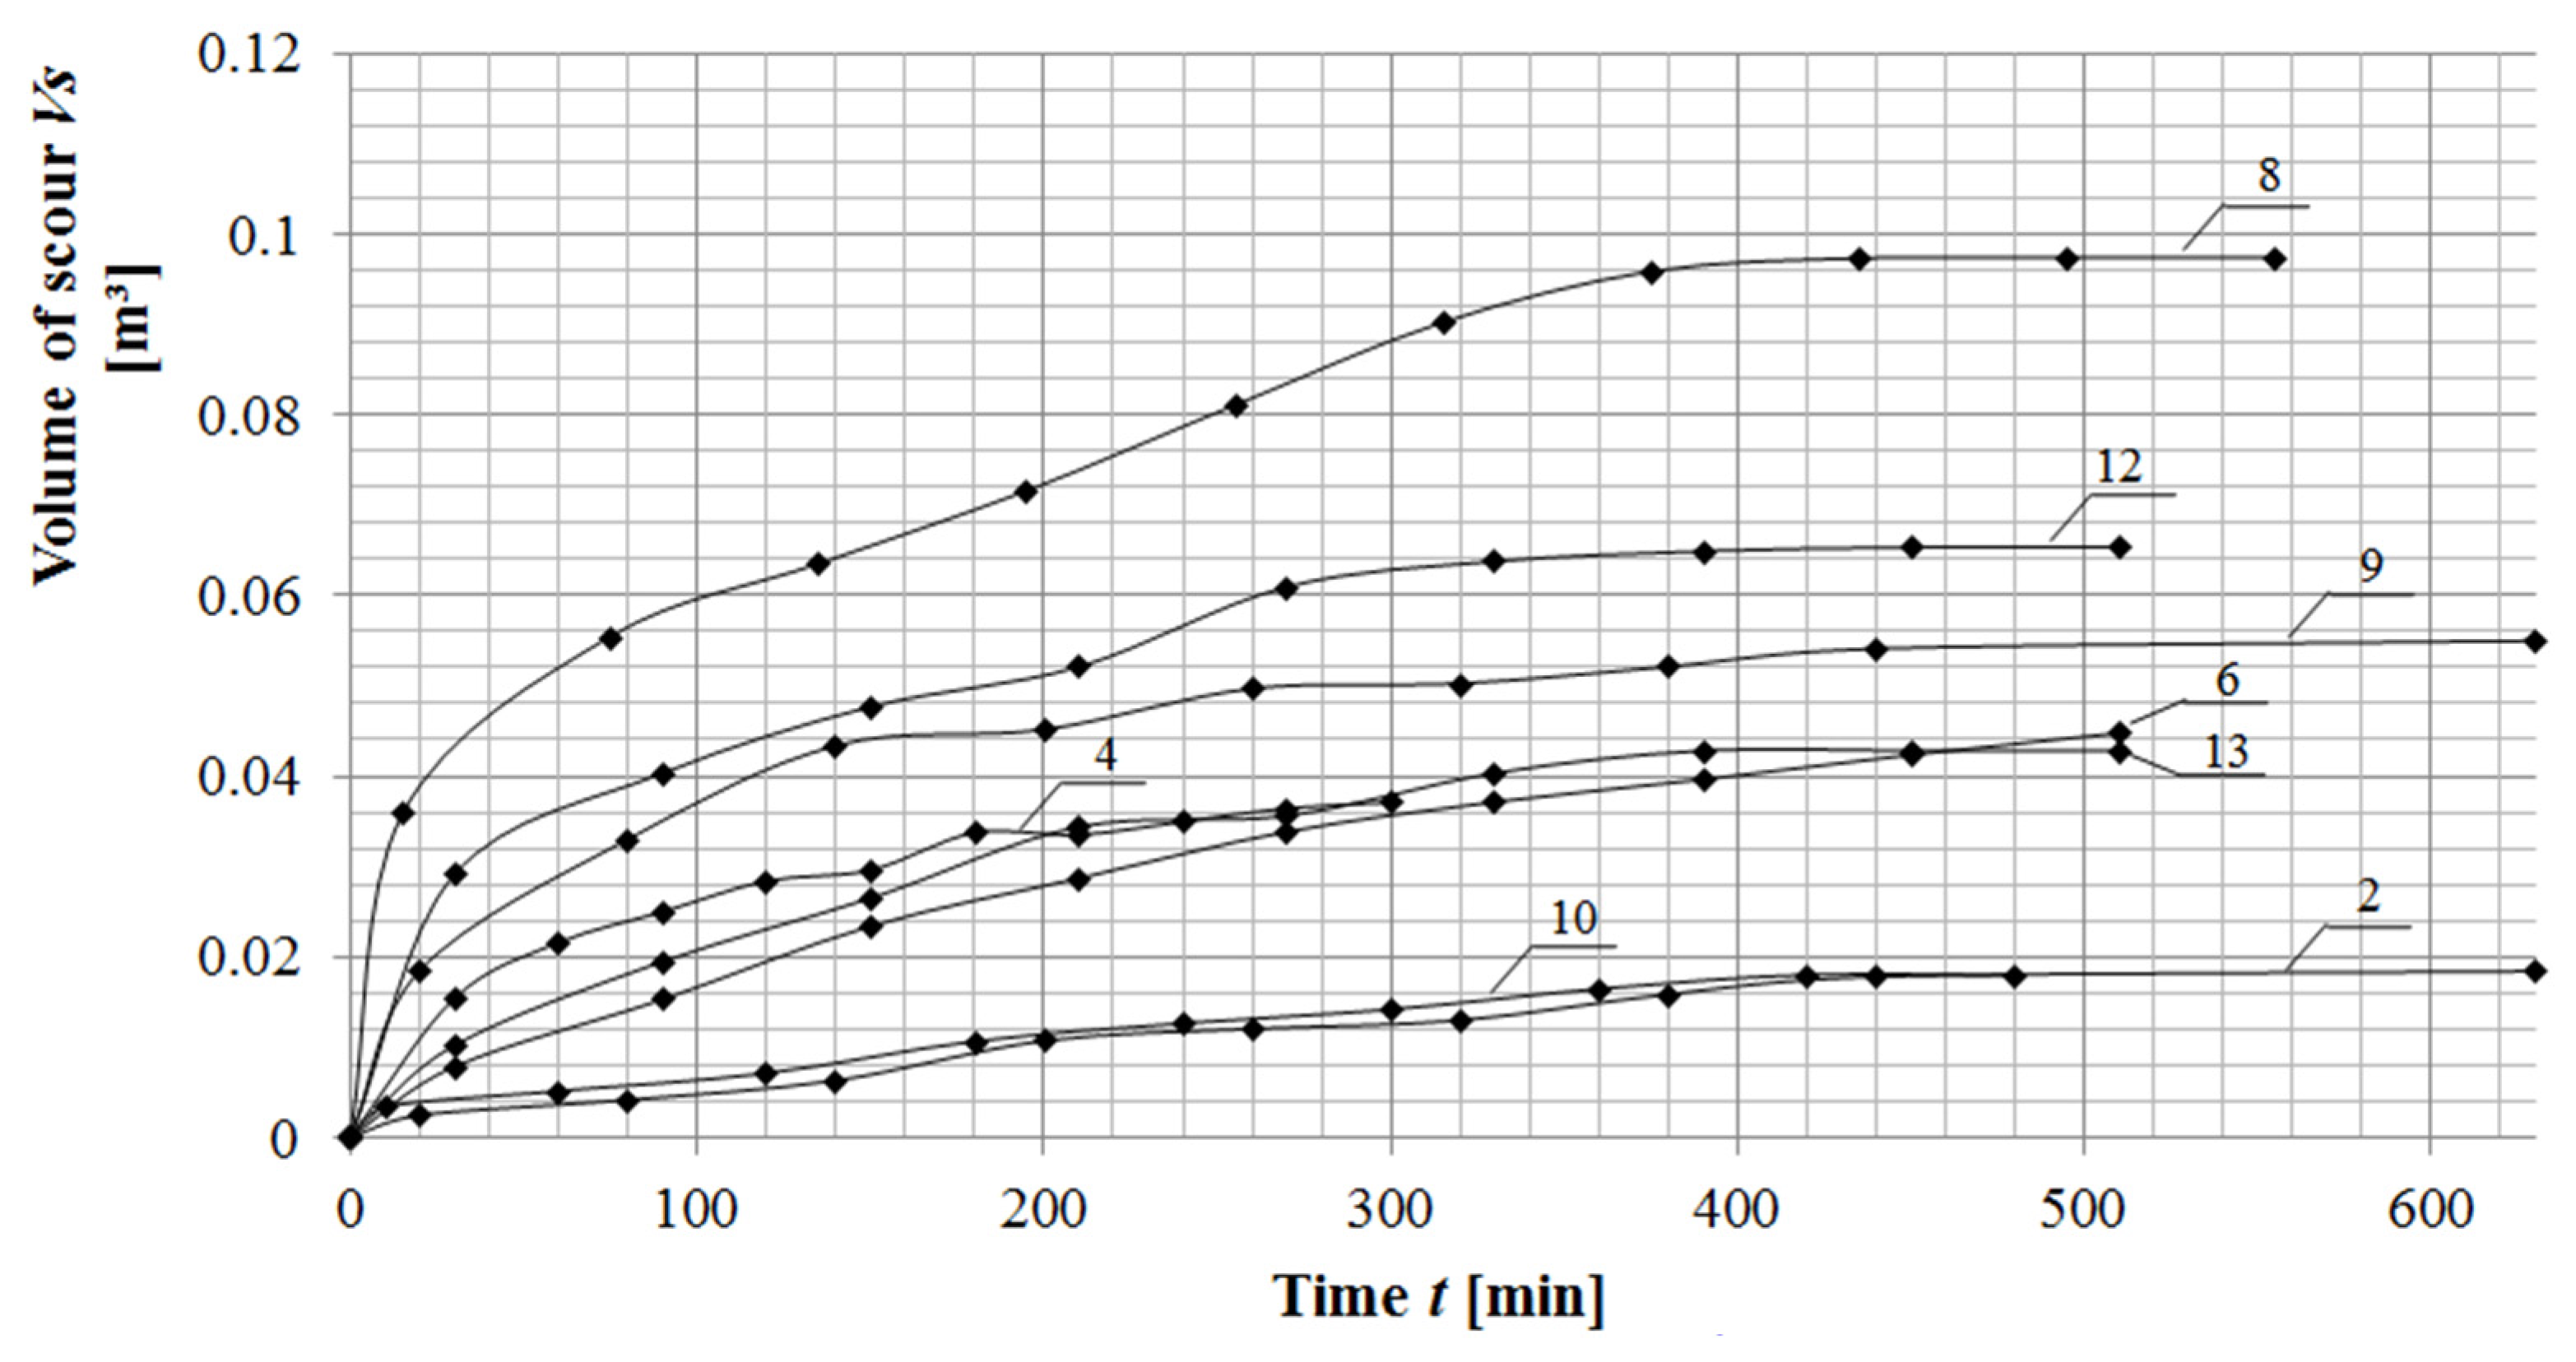
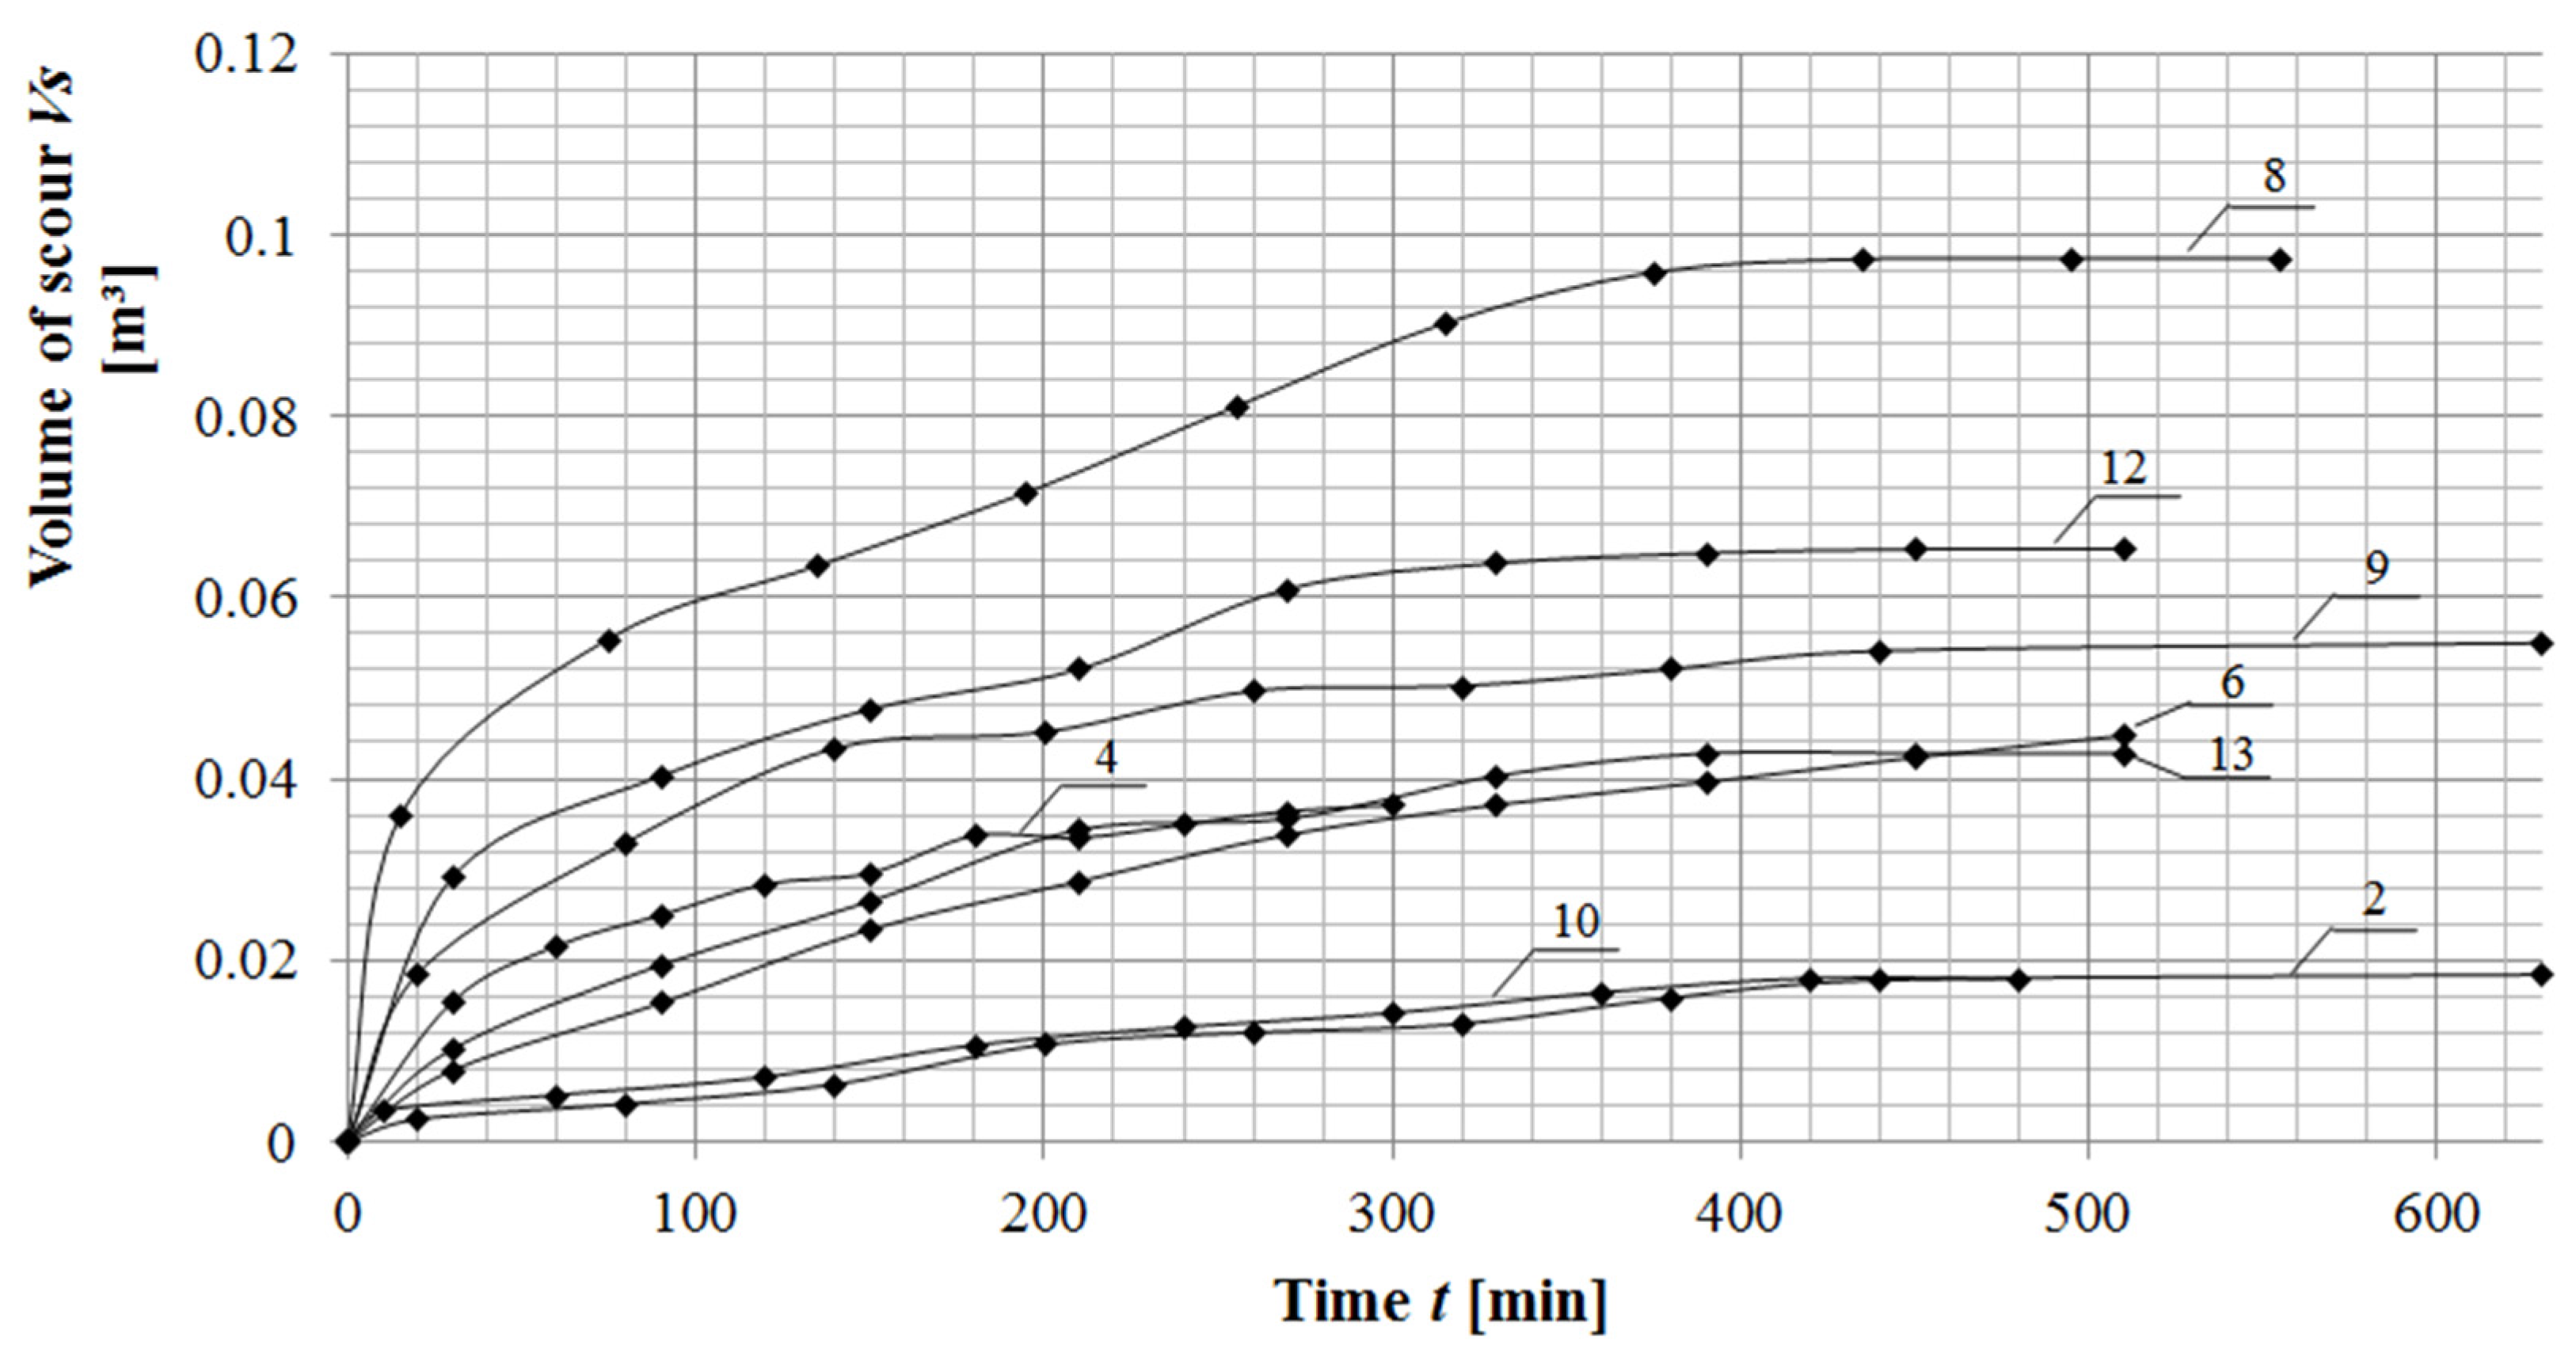
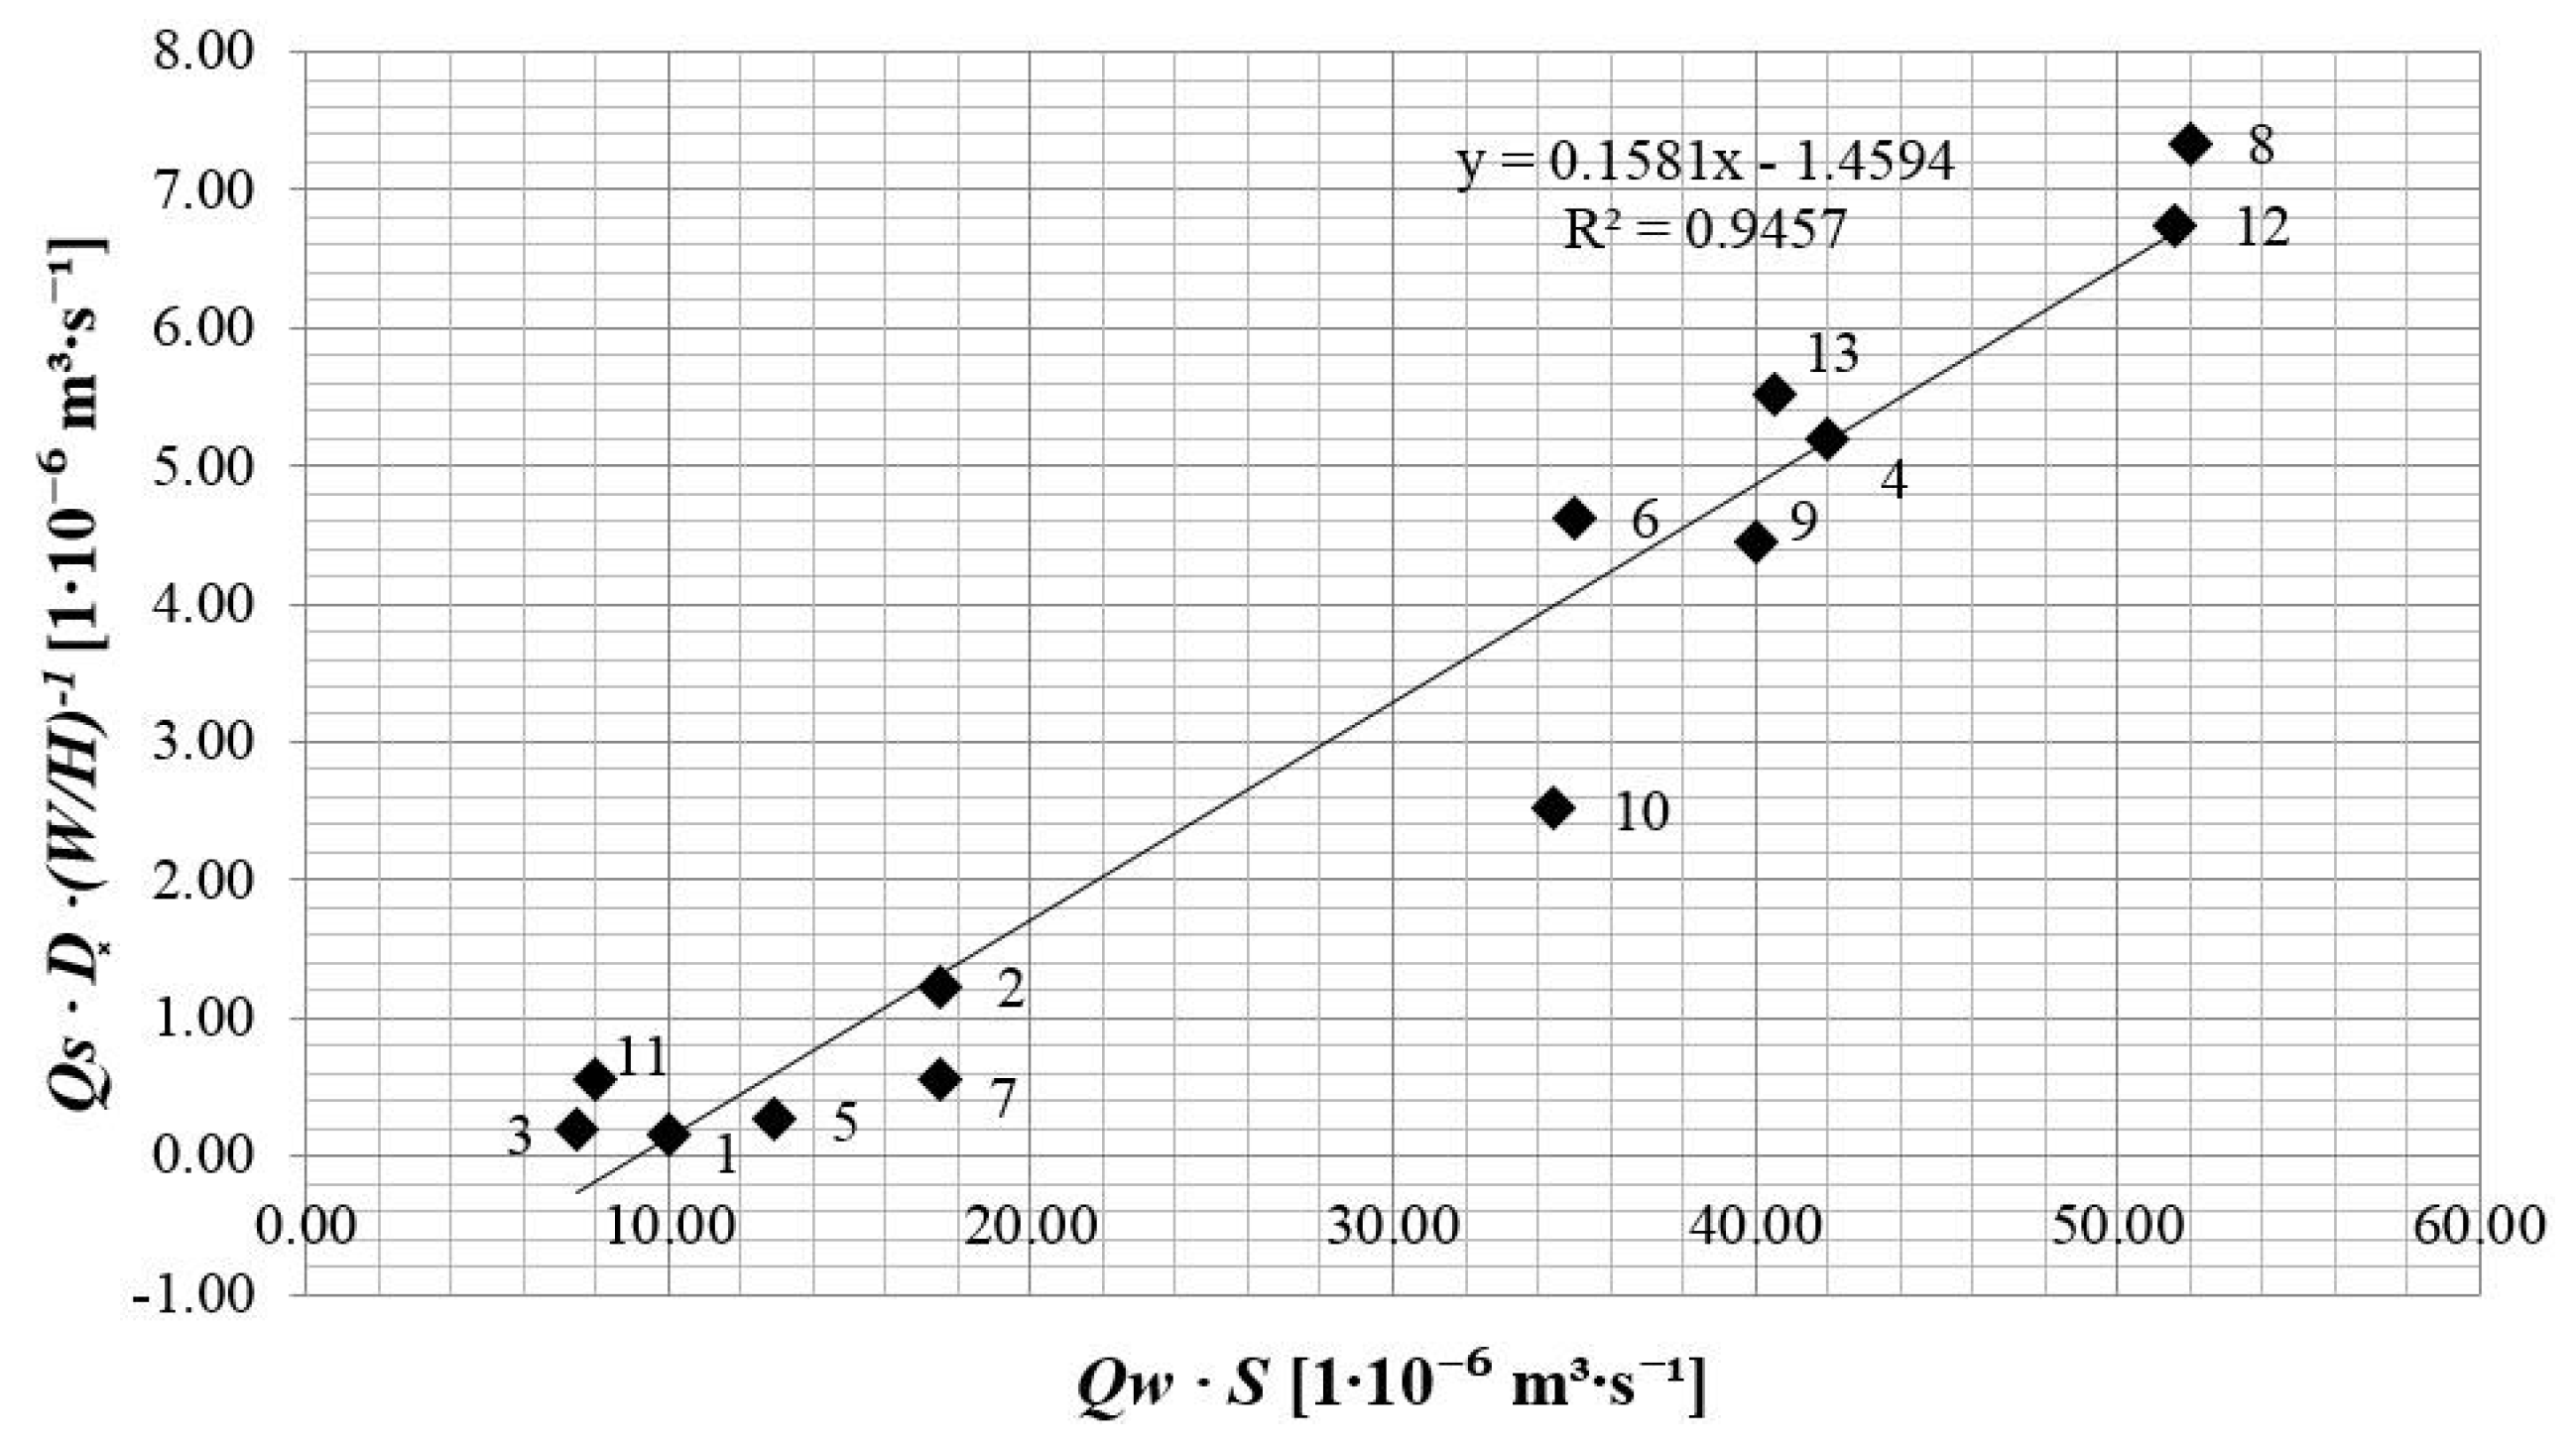
3. Results and Discussion

Figure 7 and Figure 8 illustrate the amount of the washout bedload, i.e., the volume of sand which was washed out from the bed and kept in the collection chamber during the experiment. The observation lasted until the bedload motion stabilized, i.e., until it reached a visible equilibrium (maximal) scour depth, defined by Chabert and Engeldinger (Figure 1). Initially, the local scour hole was rapidly increasing (the volume of washed out sand was increasing), and after a specific time, the growth curve of the bedload approached the horizontal position—it reached the dynamic balance condition (dynamic equilibrium).
Figure 7. Amount of bedload scattered from the dissipation basin (sandy bed) in variants with visible scour during test runs No 2, 6, 8, 9, 10, 12; Where 1–13 are the numbers of the measurements (compare with Table 1 and Table 2).
Water 08 00016 g007
Figure 8. Amount of bedload scattered from the dissipation basin (sandy bed) in variants with invisible scour during test runs No 1, 3, 7, 11; Where 1–13 are the numbers of the measurements (compare with Table 1 and Table 2).
Water 08 00016 g008
The data collected from each measurement and the calculated parameters of the modified Lane’s relation are presented in Table 2. The correlation of the right and left side of the modified Lane’s relation is shown in Figure 9. The coefficient of determination R2 between variables was also calculated. The trend line plotted on the basis of the points indicates exponential measured link between variables.
Table 2. Summary of calculation results.
No of MeasurementQwHQs D * ( W H ) S Q S × D * × ( W H ) 1 Q w × S
(m3·s−1)(m)(1 × 10⁻⁶·m3·s−1)(-)(-)(-)(1 × 10⁻⁶ m3·s−1)(1 × 10⁻⁶ m3·s−1)
10.0200.100.05914.725.800.00050.1510.00
20.0250.100.48714.655.800.00071.2317.50
30.0250.120.06514.564.830.00030.197.50
40.0300.102.05614.655.800.00145.1942.00
50.0300.150.07014.703.870.00040.2712.92
60.0350.121.53014.614.830.00104.6235.00
70.0350.150.15014.523.870.00050.5617.50
80.0400.102.92714.545.800.00137.3452.00
90.0400.121.45514.814.830.00104.4640.00
100.0400.150.66014.773.870.00092.5234.46
110.0400.200.11114.722.900.00020.568.00
120.0430.122.22214.684.830.00126.7551.60
130.0450.151.47114.543.870.00095.5340.50
Where: Qw—water flow discharge, H—the depth of water in the channel in control profile, Qs—mean bedload transport discharge, S—mean hydraulic gradient in local scour distance, D * —Bonnefille’s dimensionless grain parameter, zmax—maximal scour depth, W —channel width, H water depth.
Figure 9. Modified Lane’s relation graph; 1–13 are the numbers of the measurements (compare with Table 1 and Table 2).
Water 08 00016 g009
The acknowledgement of the linear trend line slope of function allows the formulation of the final version of modified Lane’s relation on the grounds of relation (Equation (5)), as it follows:
Q s × D * × ( W H ) 1 = 0.158 × Q w × S
Verification proposed by authors, a modified Lane’s relation is performed on the basis of real, in-situ measured data [23]. Measurements concerned local bottom scour downstream of weir, where the solid bottom precedes the sandy part of bed (with median diameter d 50 = 0.42   m m ), as it is also designed in the laboratory model described in the present paper. The subject of the studies are located on the Zagożdżonka River at Czarna gauge (the catchment area 23.4 km2) on the east side of Poland, about 100 km south of Warsaw. Scour was the result of a flood that occurred on 11 June 2013. The water flow and sediment parameters are: S = 2.4   , ρ s = 2610   k g · m 3 , s = 2.61 , T = 16   ° C ,     and d 50 = 0.42   m m ,   D * = 9.85   [ ] . Sediments are stemmed in the reservoir and placed in the upper part of the Zagożdżonka River so the scour below the solid bottom is made in clear-water conditions, as laboratory experiment also assumed.
The verification of modified Lane’s relation is performed in unsteady conditions of water flow for a flood event, during which, water discharges and inversed width-to-depth ratio ( W H ) 1 were variable in time:
-
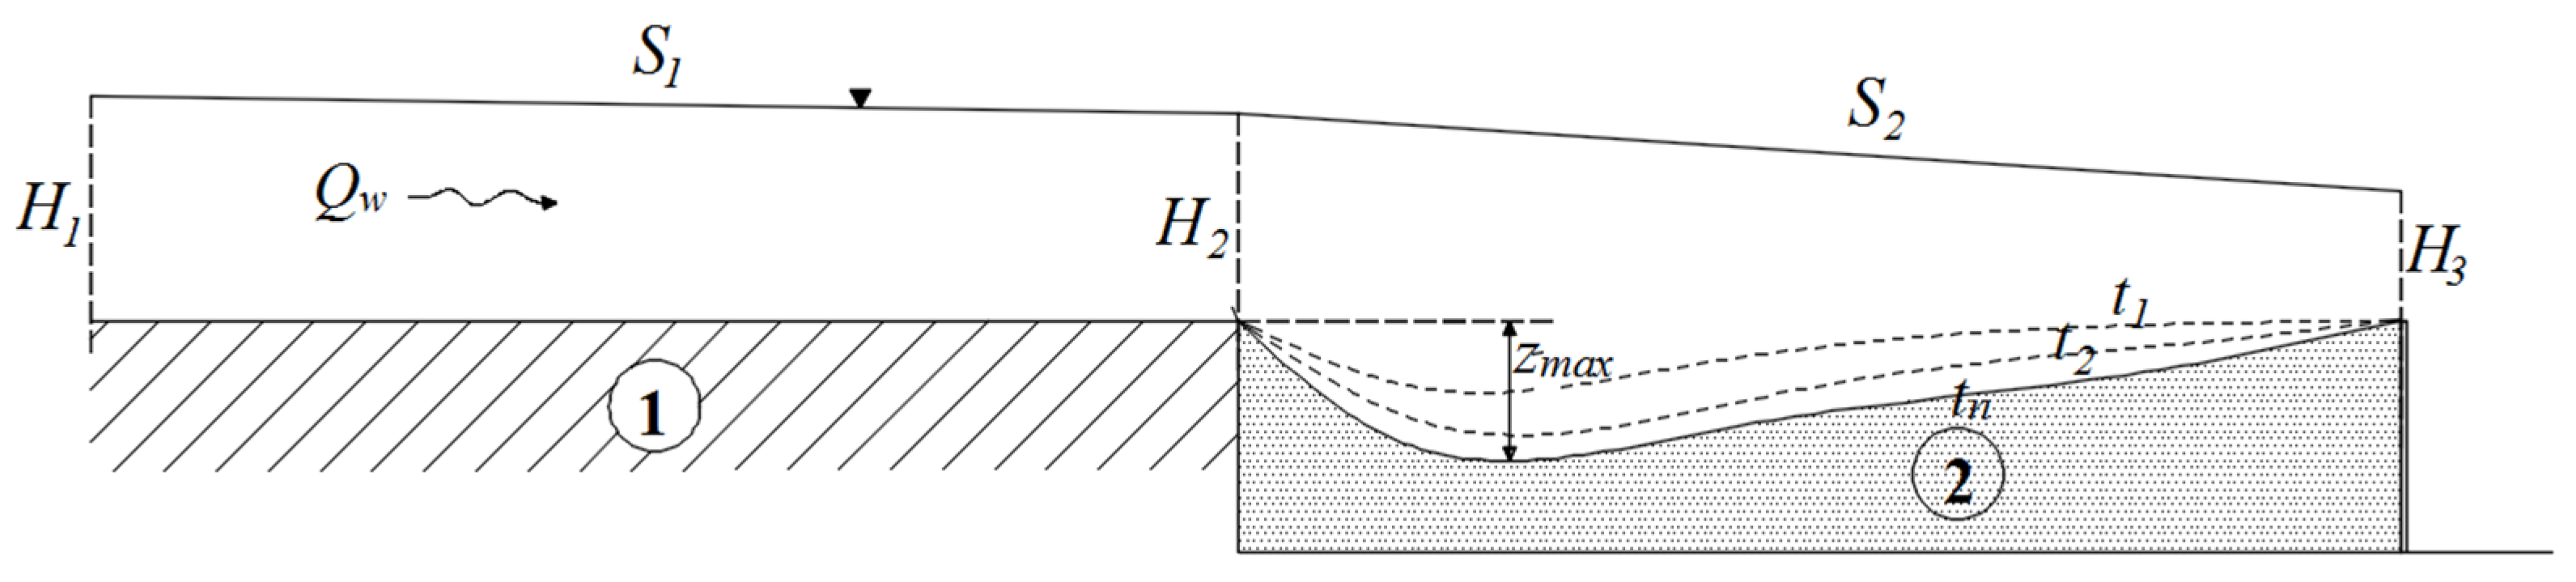
initial water discharge before the flood occurrence Q w = 0.50   m 3 · s 1 with ( W H ) 1 = 0.0375
-
peak-flow water discharge Q w = 5.06   m 3 · s 1 with ( W H ) 1 =   0.1950
During 45 h flood event, local scour was formed of volume V s = 24.8   m 3 and obtained from the sounding results that were done in the area of scour before and during the flood. As assigned in paper, the acknowledgement of scour volume and time allows the calculation of the mean value of bedload transport discharge during flood event:
Q s = V s t =   0.000153   m 3 · s 1
To verify the values agreement, the transformation of modified Lane’s relation (Equation (13)) below is performed:
Q s = 0.158 × Q w × S D * × ( W H ) 1  
Bedload transport discharge for initial conditions of flood event:
Q s = 0.158 × 0.5 × 0.0024 9.85 × 0.0375 = 0.0005   m 3 · s 1
And for the peak-flow conditions:
Q s = 0.158 × 5.06 × 0.0024 9.85 × 0.1950 = 0.0010   m 3 · s 1
Taking into consideration the lack of exact bottom shape data before the flood occurrence, the variability of water surface level during flood conditions, water discharge fluctuations, and variable energy grade line slope in natural conditions, the calculation results appears satisfactory because of the same order of magnitude of obtained values. However, it should be further analyzed in scope of other real objects.
Table 3 presents calculated parameters, representing hydraulic conditions and sediment properties, as the basis for deriving the correlation between the dimensionless shear stress in bed region θ , maximal local scour depth zmax, and with medium bedload transport discharge Qs, shown in Figure 10 and Figure 11. Froude number Fr is lower than one for each measurement, which characterizes the type of movement of the water flow in flume. The subcritical movement was recognized for each measurement.
Table 3. Summary of calculated parameters, connected with hydraulic conditions and sediment properties.
No. of MeasurementQwHzmaxQsRb τ b θ u * R e * θ c r Fr
(m3·s−1)(m)(m)(1 × 10⁻⁶·m3·s−1)(m)(Pa)(-)( m · s 1 )(-)(-)(-)
10.0200.100.00420.0590.09230.450.04510.02112.10.03200.35
20.0250.100.03410.4870.09230.630.06310.02514.20.03280.44
30.0250.120.00410.0650.10880.320.03190.01810.00.03110.33
40.0300.100.04742.0560.09231.270.12630.03620.20.03450.52
50.0300.150.00470.0700.13250.520.05180.02313.00.03230.28
60.0350.120.05641.5300.10881.070.10640.03318.50.03410.46
70.0350.150.02170.1500.13250.650.06480.02514.30.03280.33
80.0400.100.11822.9270.09231.180.11730.03419.20.03430.70
90.0400.120.09281.4550.10881.070.10640.03318.80.03420.53
100.0400.150.04230.6600.13251.170.11660.03419.60.03440.38
110.0400.200.00590.1110.16920.330.03310.01810.40.03120.25
120.0430.120.07642.2220.10881.280.12760.03620.30.03450.57
130.0450.150.06291.4710.13251.170.11660.03419.20.03420.43
Where: Qw—water flow discharge, H—the depth of water in the channel in control profile, zmax—maximal scour depth, Qs—mean bedload transport discharge, Rb—hydraulic radius of the sandy bottom part, τb—mean shear stress in the bed region, θ dimensionless shear stress in bed region, u * —dynamic velocity in velocity field connected with bottom region, R e * —local Reynolds number, θcr—Shields parameter, Fr—Froude number.
Figure 10. Shields parameter and the sediment discharge correlation graph, where θ—dimensionless shear stress in bed region; Qs—sediment discharge; R2—coefficient of determination.
Water 08 00016 g010
Figure 11. Shields parameter and the maximal scour depth correlation graph, where θ—dimensionless shear stress in bed region; zmax—maximal scour depth in clear water scour forming process; R2—coefficient of determination.
Water 08 00016 g011

4. Conclusions

For over 50 years, the original form of Lane’s relation has provided a unique conceptual model useful for geomorphologists and engineers to connect water flow conditions and sediment properties. Authors have not found the literature in scope of Lane’s relation application in local scour process description or trials to recast it into equation. Relation is used commonly to describe the natural river morphology forming process, and, in consequence, the dynamic equilibrium achieving by natural lowland rivers or mountain streams. Additionally, the previous studies of formula modifying were focused to correlate it with geomorphological parameters of the channel [6,7,8]. Concomitantly, the Lane’s relation, in scope of local scouring in laboratory conditions, has not yet been examined.
The modified Lane’s relation, presented in this paper was examined in the subcritical flow of the water in laboratory conditions in a clear-water scour forming process. The results of the experiments supported the experimental hypothesis, i.e., a mutual correlation of the left and right sides of the modified Lane’s relation including width-to-depth ratio. It is possible to build functional relationships between the sides of the modified relation in clear-water scouring conditions. Additionally, it is possible to use the Lane’s relation in local scour forming process descriptions, despite the fact that Lane’s relation is a principle commonly used in natural, alluvial rivers morphology forming descriptions in dynamic balance (equilibrium) conditions, which could be replaced by equilibrium scour depth conditions for local scour forming phenomenon.
The coefficient of determination R 2 of the left and right side of the modified relation is high and equals 0.9457, which indicates a high dependency between the sides, signaling a very good correlation of data. It is possible to state the linear function, basing on trend line slope. The modified form of Lane’s relation was derived from laboratory experiment results connected with delimited values of water flow discharge (0.020–0.045 m3∙s−1) and depth (H = 0.1–0.2 m). The formulated relation was examined in praxis for water-flow discharge of 5.06 m3∙s−1 in unsteady flow conditions, before and during a flood event in case of the real object on the grounds of in situ measurements. The real objects characteristics were similar to laboratory model—the solid bottom precedes sandy bed, and local scour forming takes place in clear-water conditions.
The verification results could be recognized as satisfactory because of the same value orders of magnitude. Miscalculation could be derived from the lack of exact bottom shape data before the flood occurrence, the variability of water surface level during flood conditions, water discharge fluctuations, and variable energy grade line slope in natural unsteady flow conditions.
Propitious results of verification in scope of other real objects could be a scientific area that should be further analysed. Other real-object verification test results would give data that would widen the scope of modified Lane’s relation components.
The volume of washed out bedload from the bottom during the time of experiments increases with time until the stabilization of the scour shape is achieved, where the curve approaches the horizontal position, signalizing the achievement of equilibrium scour depth in clear-water scouring conditions.
Dimensionless shear stress in bed region θ exceeds critical shear stress (Shield number) θ c r : θ > θ c r , confirming the rule that the particle movement is initiated after exceeding this critical stress value—each measurement assumed lower or higher local scour forming intensity.
Coefficient of determination for dimensionless shear stress in bed region θ and mean sediment discharge Qs equals 0.7380, which could be described as a satisfactory match between data. Additionally, the coefficient of determination for dimensionless shear stress in bed region θ and maximal local scour depth zmax equals 0.6703, also signal a satisfactory match of data. It was possible to sketch the trend lines in graphs, however, some points on the graphs diverge from the trend line. In the range of θ   > 0.1, it could be observed that shear stress growth stops despite of continual growth of Qs and zmax values, which leads to the conclusion that further analyses are needed to ascertain the explicit correlation.

Acknowledgments

This research was supported by Department of Hydraulic Engineering, Warsaw University of Life Sciences, Poland.

Author Contributions

Marta Kiraga and Zbigniew Popek conceived and designed the experiments and also wrote the paper; Marta Kiraga performed the experiments and analyzed the data.

Conflicts of Interest

The authors declare no conflict of interest.

References

  1. Lane, E.W. The importance of fluvial morphology in hydraulic engineering. In Proceedings of American Society of Civil Engineers, New York, NY, USA, July 1955; pp. 1–17.
  2. Aderibigbe, O.; Rajaratnam, N. Effect of sediment gradation on erosion by plane turbulent wall jets. J. Hydraul. Eng. 1998, 124, 1034–1042. [Google Scholar] [CrossRef]
  3. Gaudio, R.; Marion, A. Time evolution of scouring downstream of bed sills. J. Hydraul. Res. 2003, 41, 271–284. [Google Scholar] [CrossRef]
  4. Lenzi, M.A.; Marion, A.; Comiti, F.; Gaudio, R. Local scouring in low and high gradient streams at bed sills. J. Hydraul. Res. 2002, 40, 731–739. [Google Scholar] [CrossRef]
  5. Melville, B. The physics of local scour at bridge piers. In Proceedings of the Fourth International Conference on Scour and Erosion, Tokyo, Japan, 5–7 November 2008.
  6. Dust, D.; Wohl, E. Conceptual model for complex river responses using an expanded Lane’s relation. Geomorphology 2012, 139–140, 109–121. [Google Scholar] [CrossRef]
  7. Huang, H.Q.; Liu, X.; Nanson, G.C. Commentary on a “conceptual model for complex river responses using an expanded Lane’s diagram by David Dust and Ellen Wohl”. Geomorphology 2014, 209, 140–142. [Google Scholar] [CrossRef]
  8. Schumm, S.A. Fluvial System; Wiley-Interscience: New York, NY, USA, 1977. [Google Scholar]
  9. Barbhuiya, A.K.; Dey, S. Local scour at abutments: A review. Sadhana 2004, 29, 449–476. [Google Scholar] [CrossRef]
  10. Chabert, J.; Engeldinger, P. Etude des Affouillements Autour des Piles des Ponts; Laboratoire d’Hydraulique: Chatou, France, 1956. [Google Scholar]
  11. Brookes, A. Channelized Rivers—Perspectives for Environmental Management; John Wiley and Sons: Chichester, UK, 1988. [Google Scholar]
  12. Church, M. Channel morphology and typology. In The River Handbook; Calow, P., Petts, G.E., Eds.; Blecwell; Scientific Publications: Oxford, UK, 1992; Volume 1. [Google Scholar]
  13. Hickin, E.J. The analysis of river-planform responses to changes in discharge. In River Channel Changes; Gregory, K.J., Ed.; John Wiley and Sons: Chichester, UK, 1977. [Google Scholar]
  14. Werburton, J.; Danks, M.; Wishart, D. Stability of an upland gravel-bed stream Swinhope Burn, Northern England. Catena 2002, 49, 309–329. [Google Scholar] [CrossRef]
  15. Van Rijn, L.C. Principles of Sediment Transport in Rivers, Estuaries and Castal Seas; Aqua Publications: Amsterdam, The Netherlands, 1993. [Google Scholar]
  16. Nowak, P. Results of Specific Density Calculations for Sand and Crushed Aggregate; The Laboratory of Chemistry and Water and Wastewater Technology, Warsaw University of Life Sciences (WULS-SGGW): Warszawa, Poland, 2009. (In Polish) [Google Scholar]
  17. Popek, Z. Bedload transport conditions in small lowland river. Treatises and Monographs. WULS-SGGW, Warsaw (in Polish) Schumm, S.A. 1969: River metamorphosis. J. Hydraul. Div. American Soc. Civ. Eng. 2006, 95, 255–273. [Google Scholar]
  18. Horton, R. Separate roughness coefficients for channel bottom and sides. Eng. News Rec. 1933, 111, 652–653. [Google Scholar]
  19. Indlekofer, H. Überlagerung von Rauhigkeitseinflüssen beim Abfluß in Offenen Gerinnen; Mitteilungen Institut für Wasserbau und Wasserwirtschaft, RWTH Aachen: Heft, Germany, 1981; Volume 37, pp. 105–145. [Google Scholar]
  20. Kubrak, J.; Nachlik, E. Hydraulic Basics of River Channels Bandwidth Calculations; Warsaw University of Life Sciences: Warszawa, Poland, 2003. (In Polish) [Google Scholar]
  21. Bollrich, G.; Preißler, G. Hydromechanik, Band 1; Verlag für Bauwesen: Berlin, Germany, 1992. [Google Scholar]
  22. Zanke, U. Grundlagen der Sedimentbewegung; Springer: Berlin, Germany, 1982. [Google Scholar]
  23. Urbański, J.; Hejduk, L. The analysis of local scour size formed after flood event. Monografie Komitetu Gospodarki Wodnej 2014, XX, 389–399. (In Polish) [Google Scholar]

