
Water Quality of Four Major Lakes in Mississippi, USA: Impacts on Human and Aquatic Ecosystem Health

 ,
,
Abstract
:1. Introduction
2. Materials and Methods
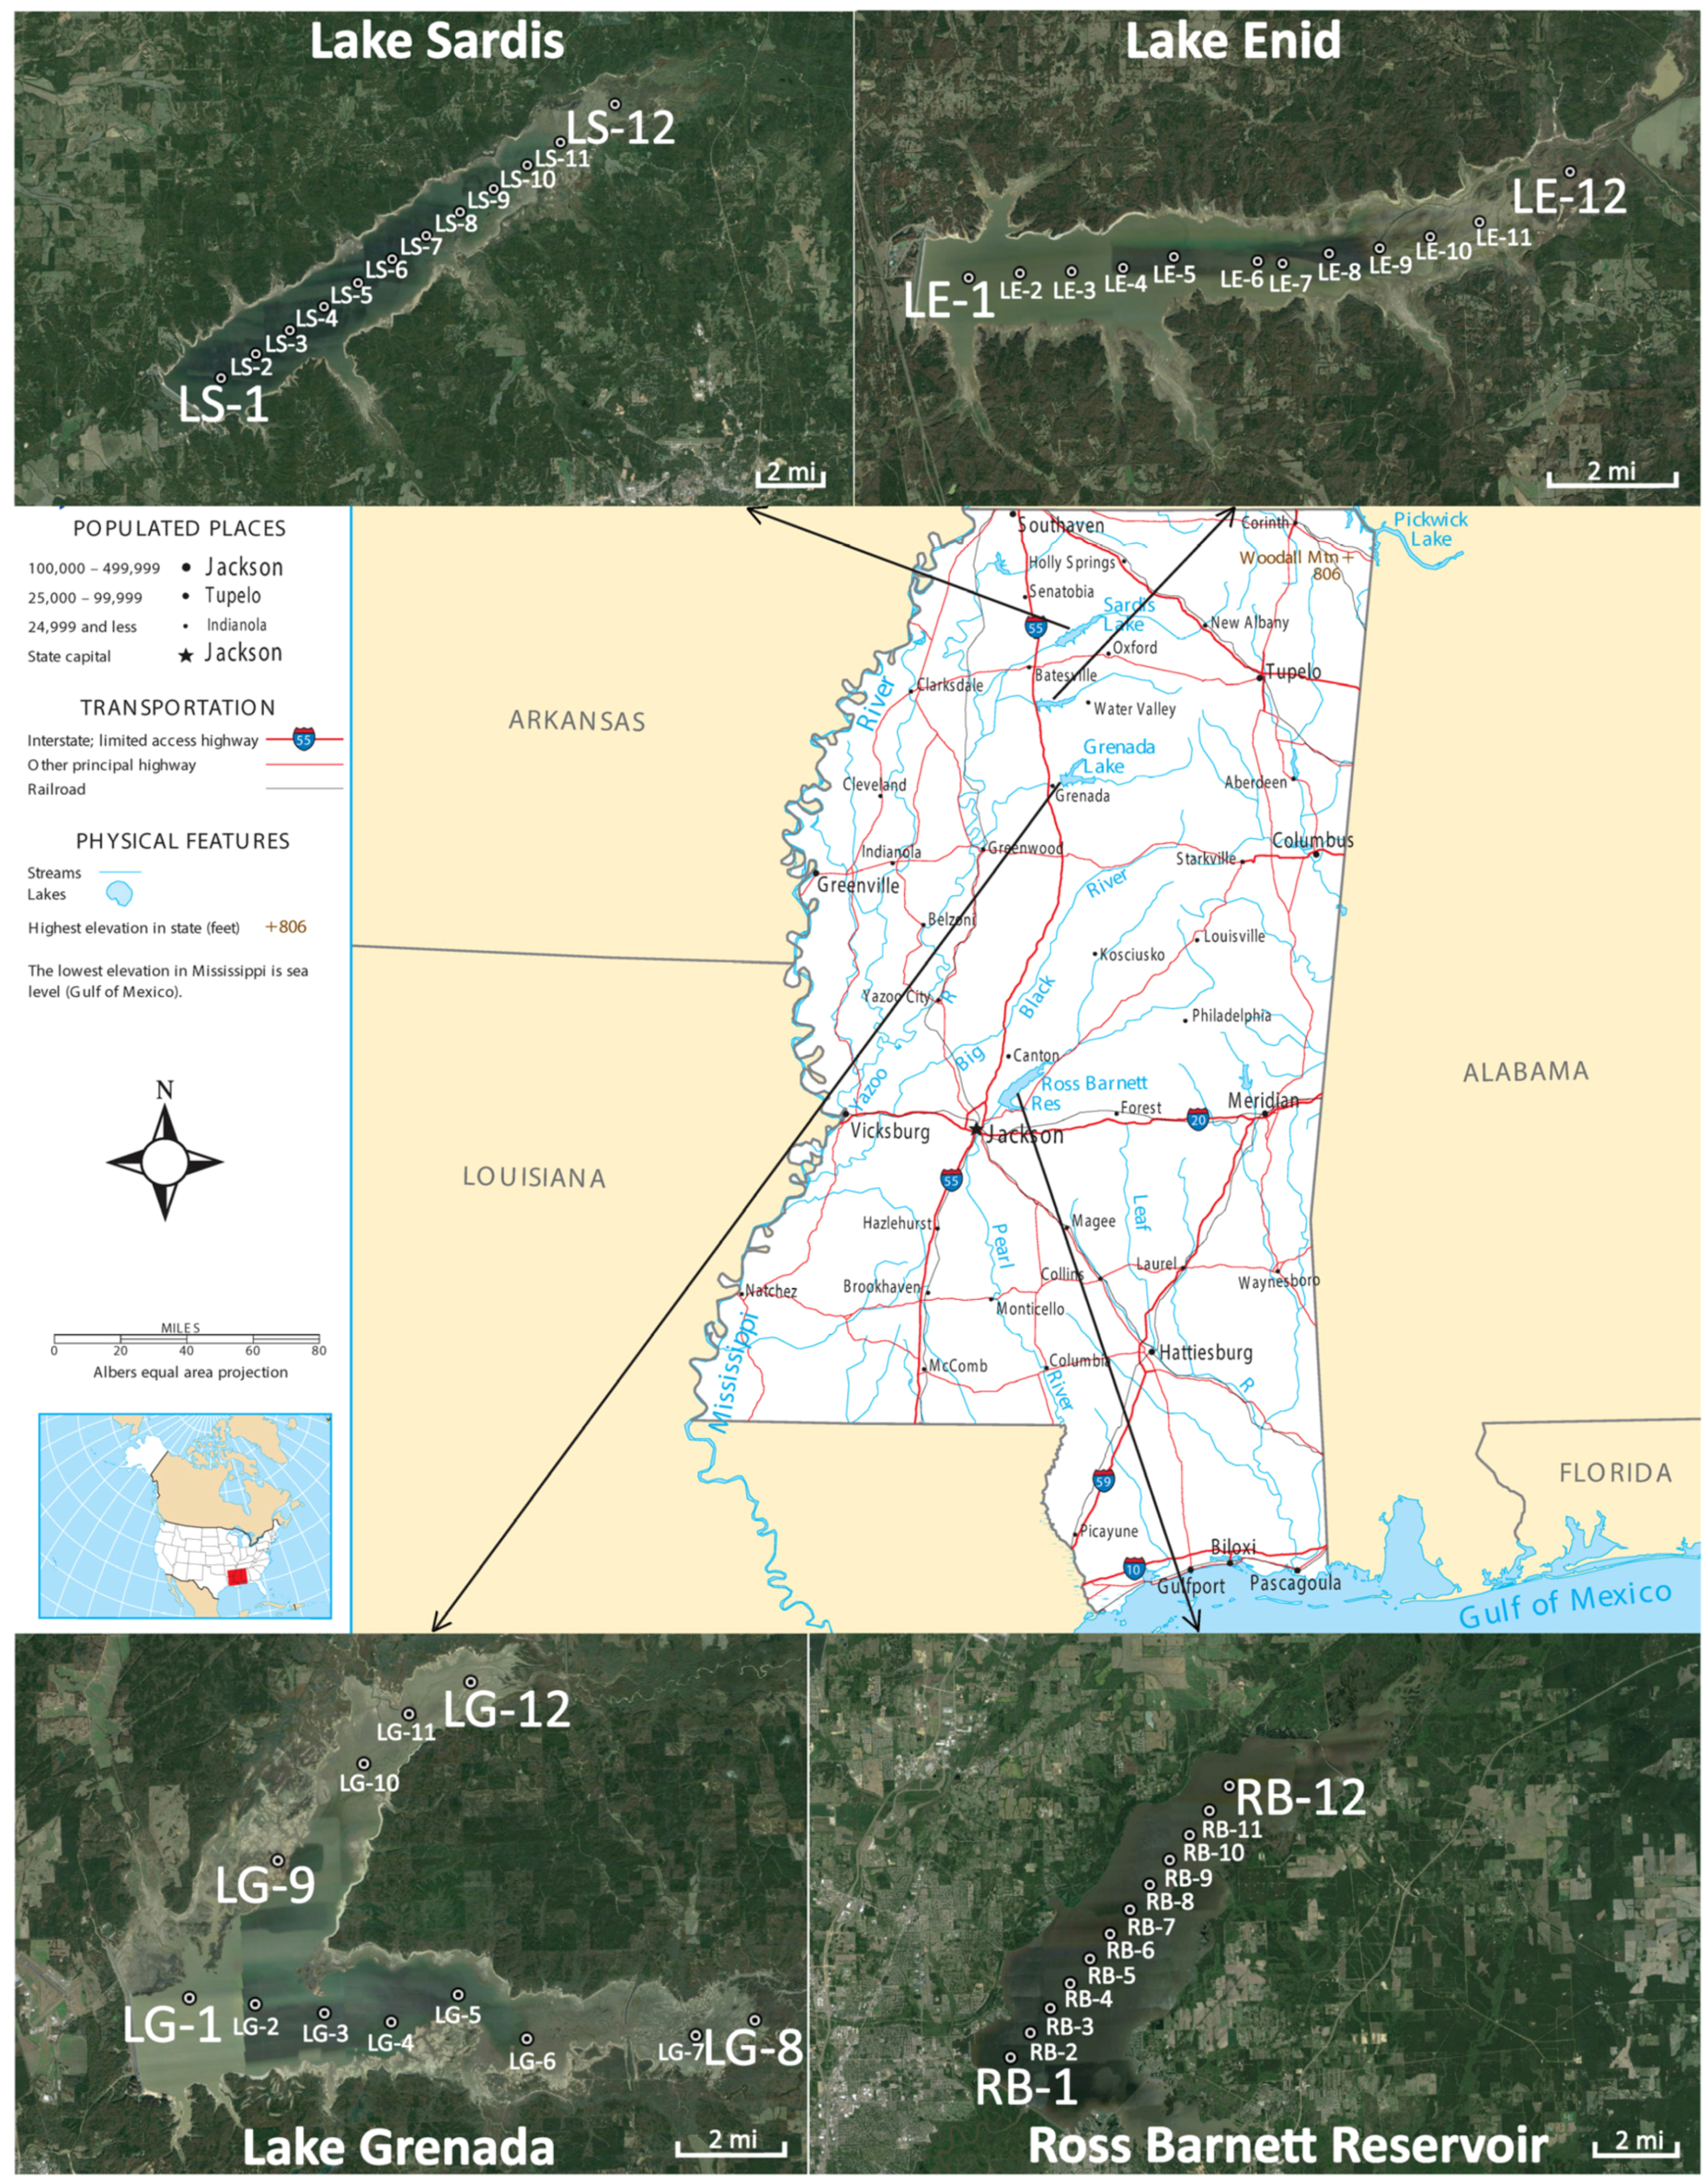
2.1. Site Description
2.2. Satellite Data
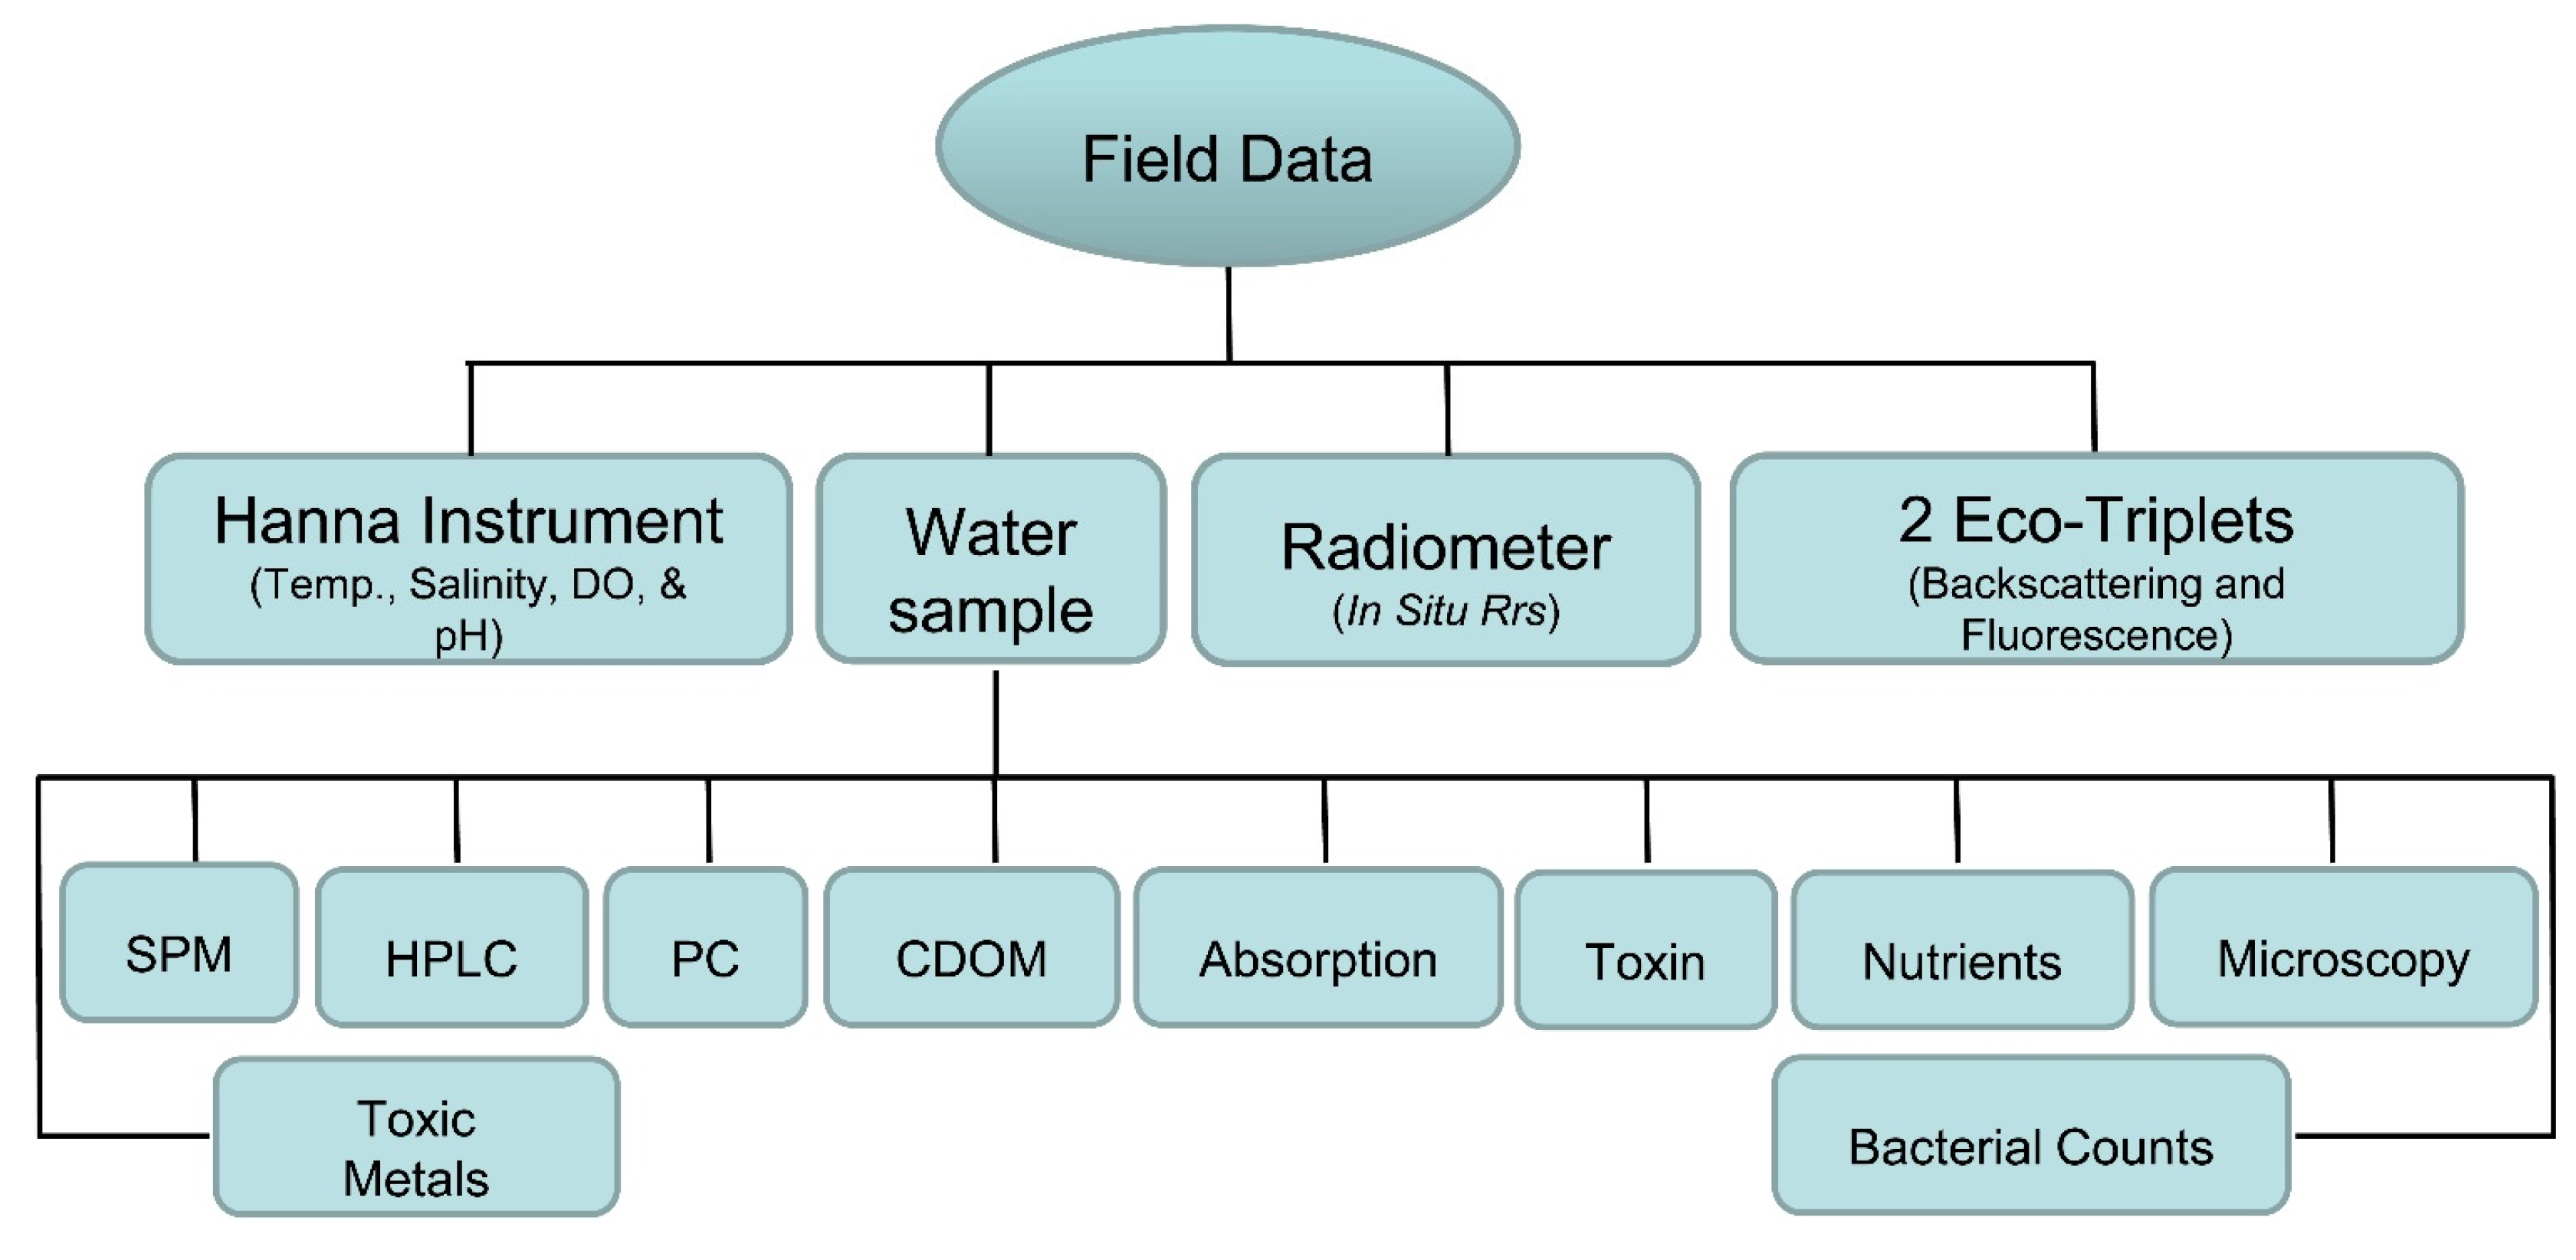
2.3. Field Data
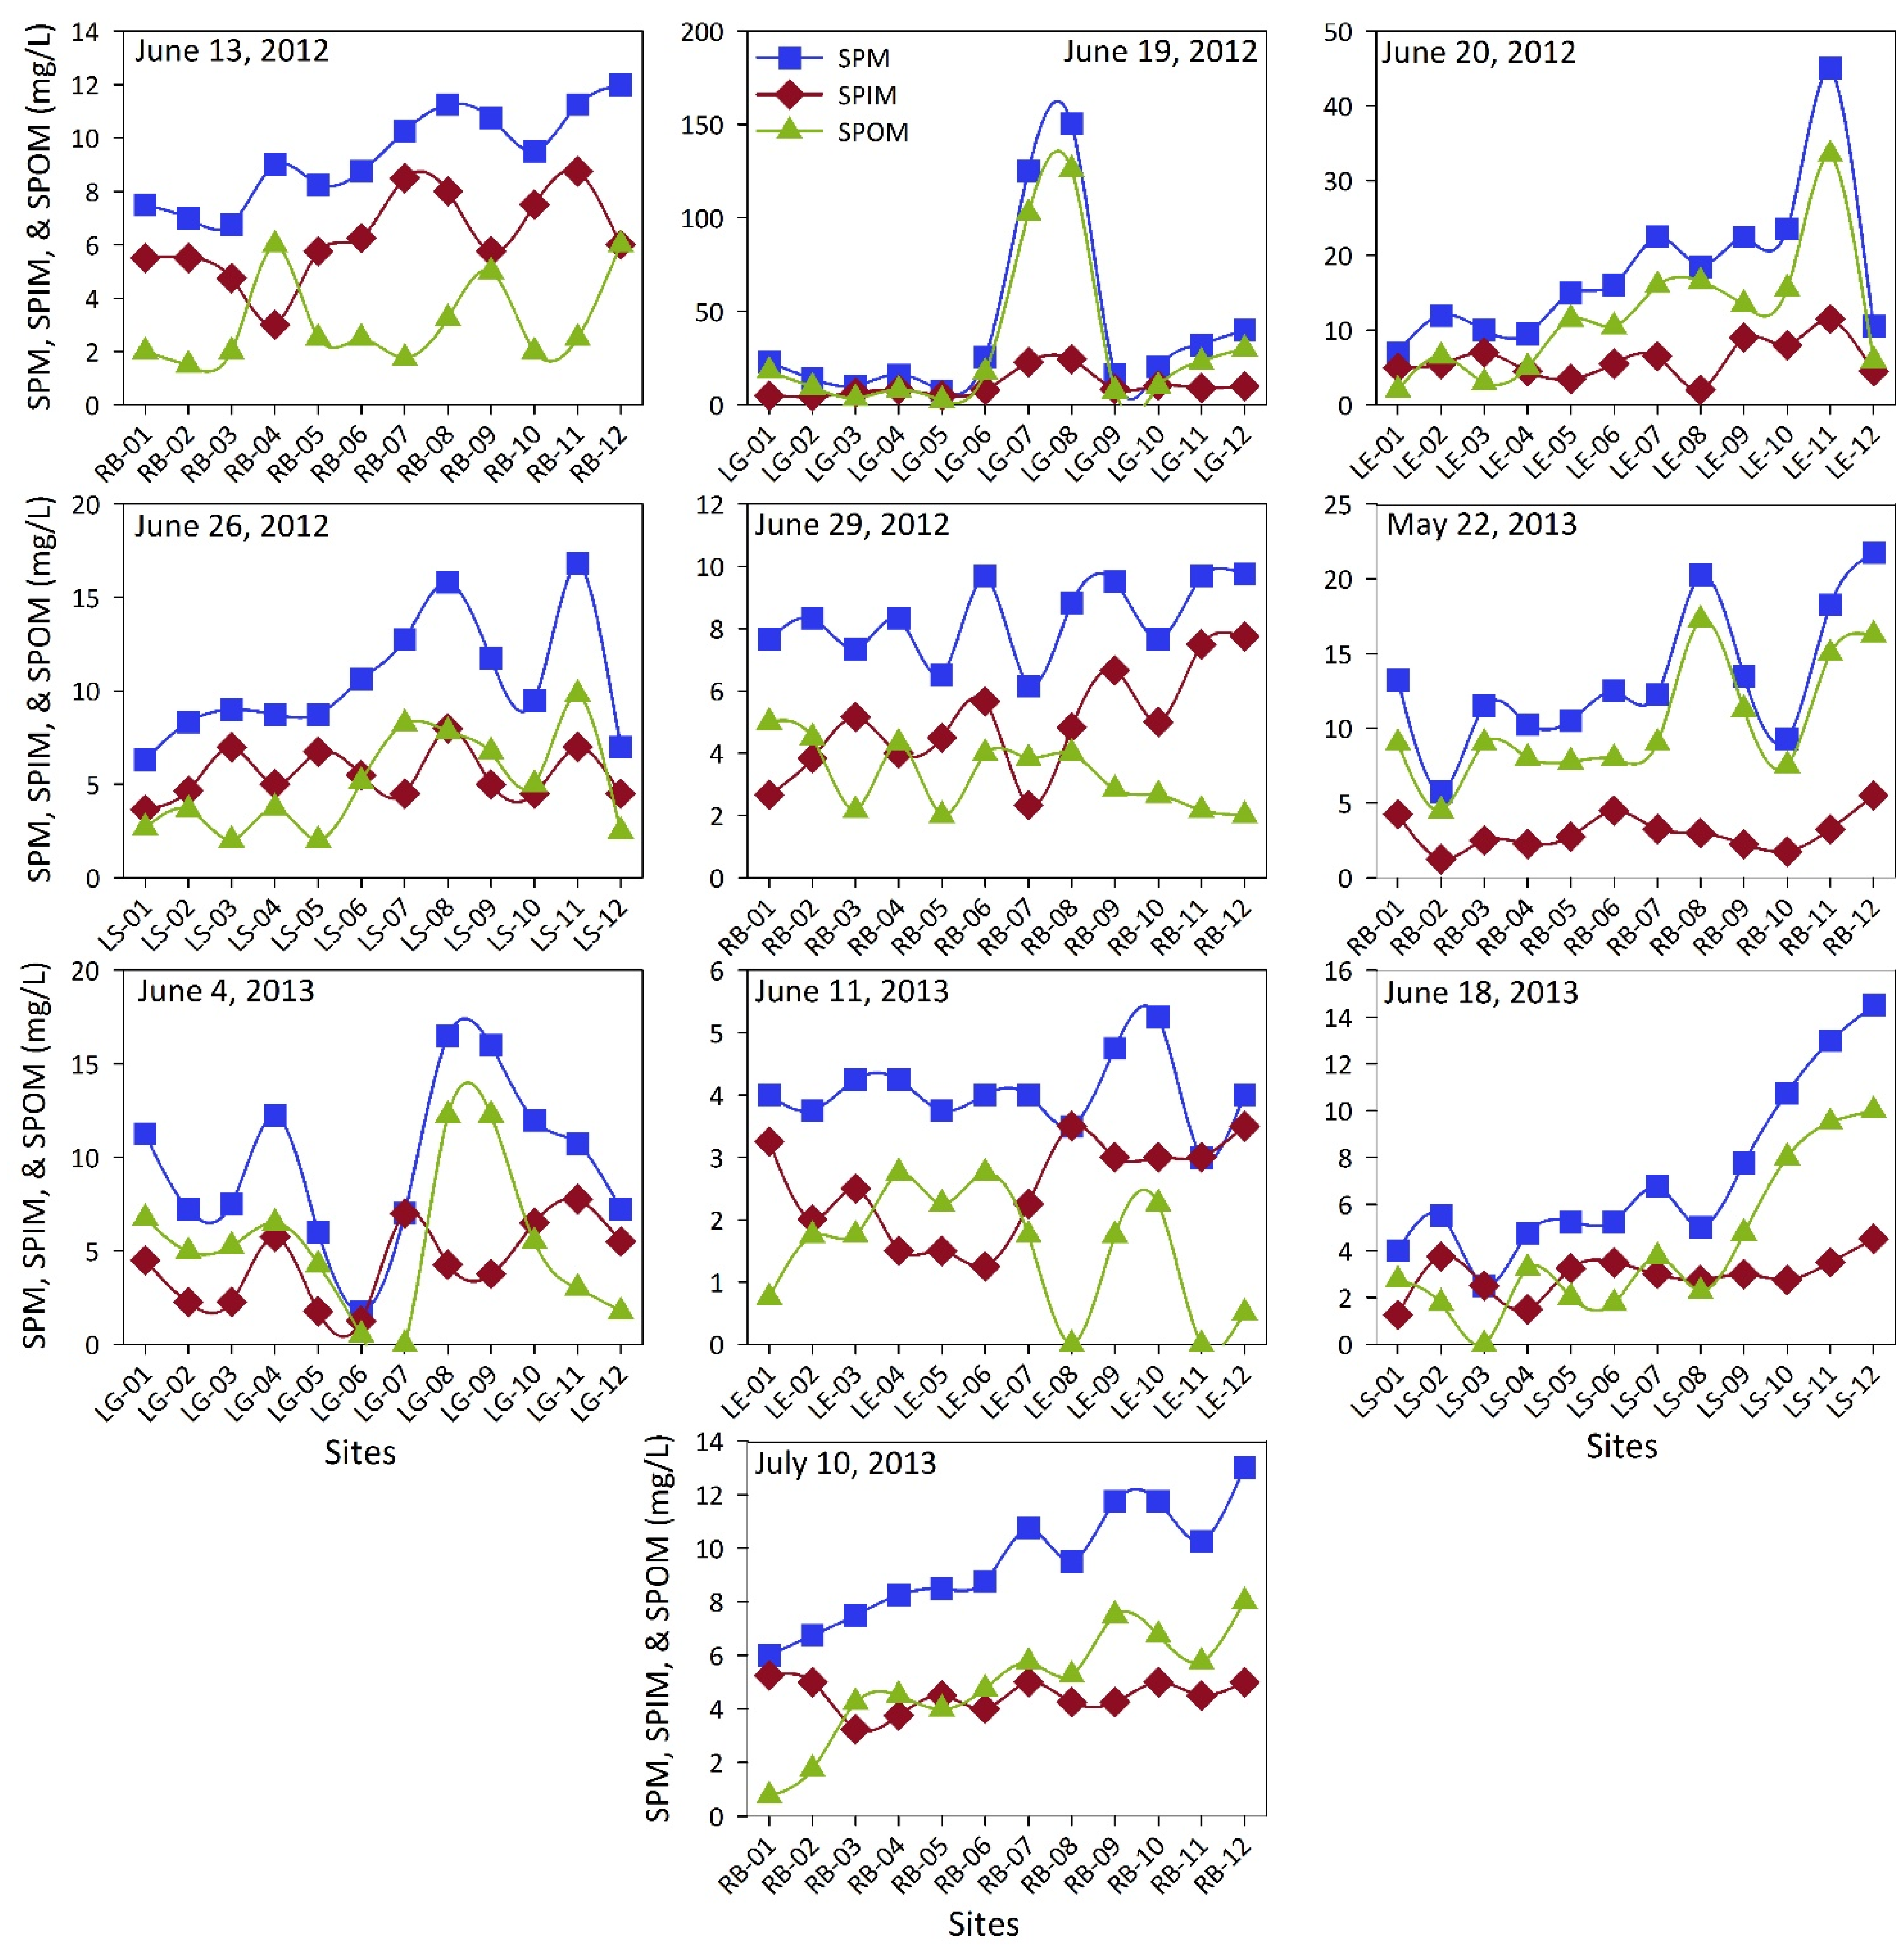
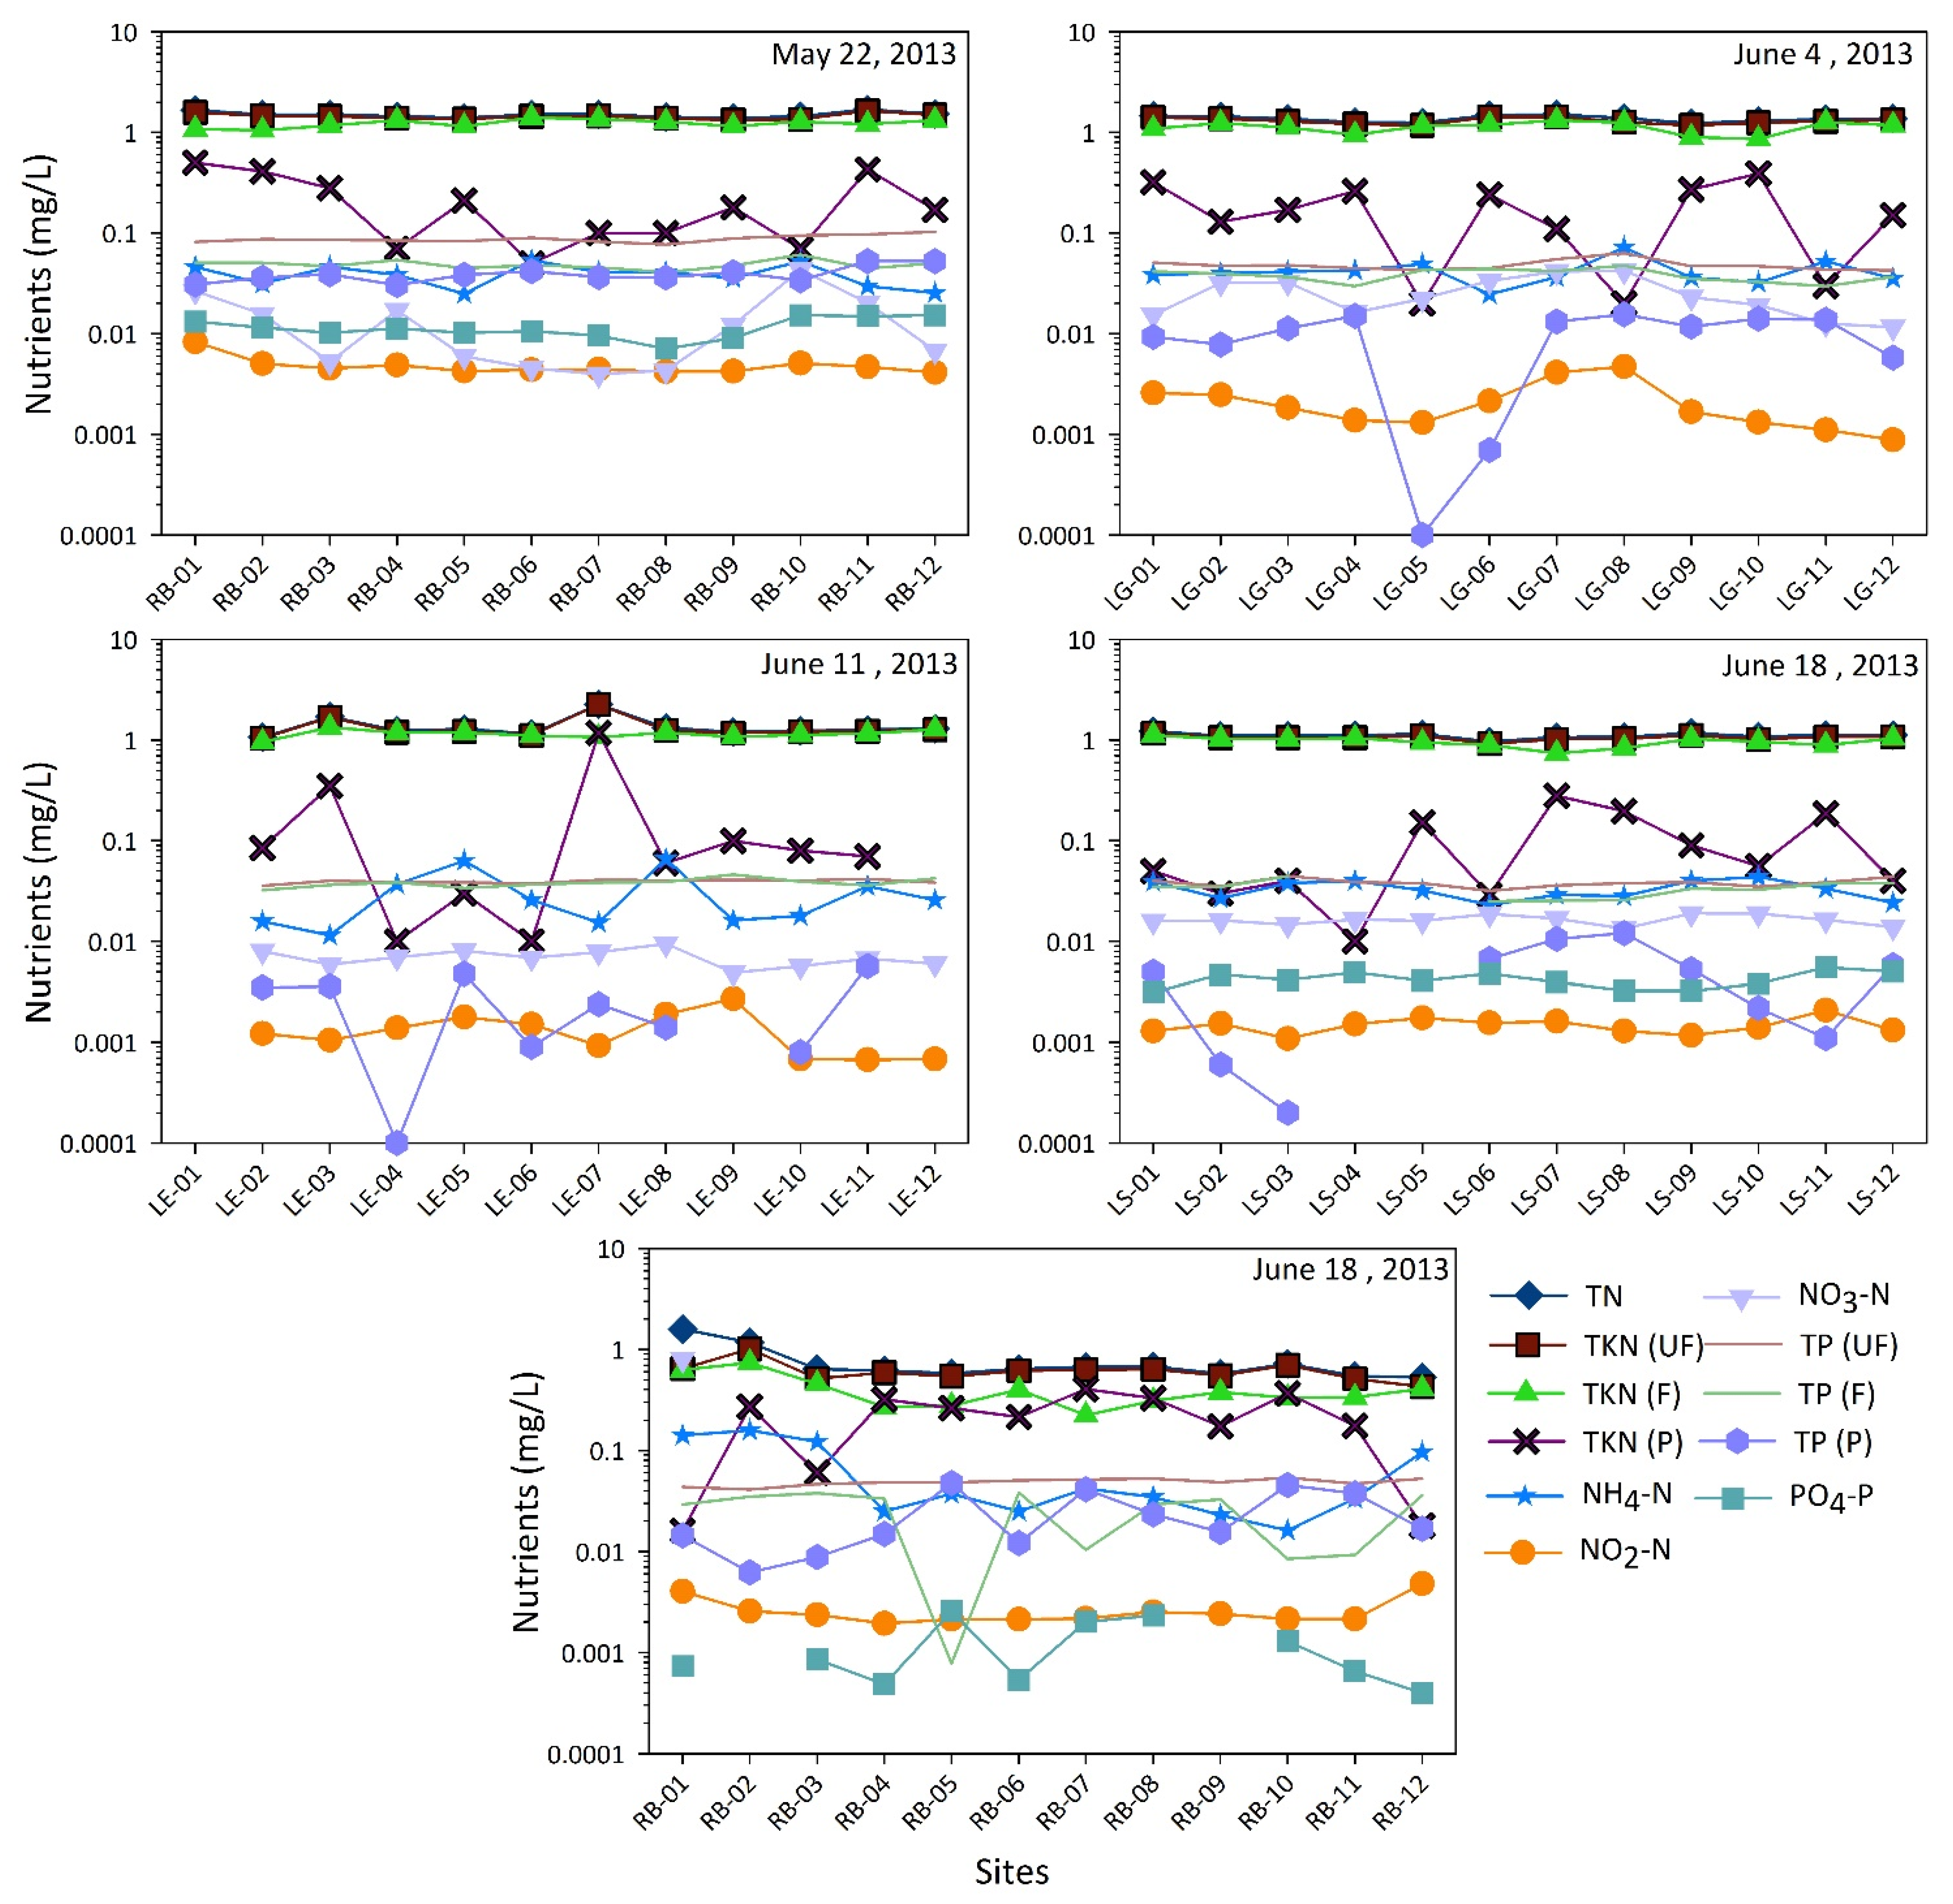
3. Results and Discussions


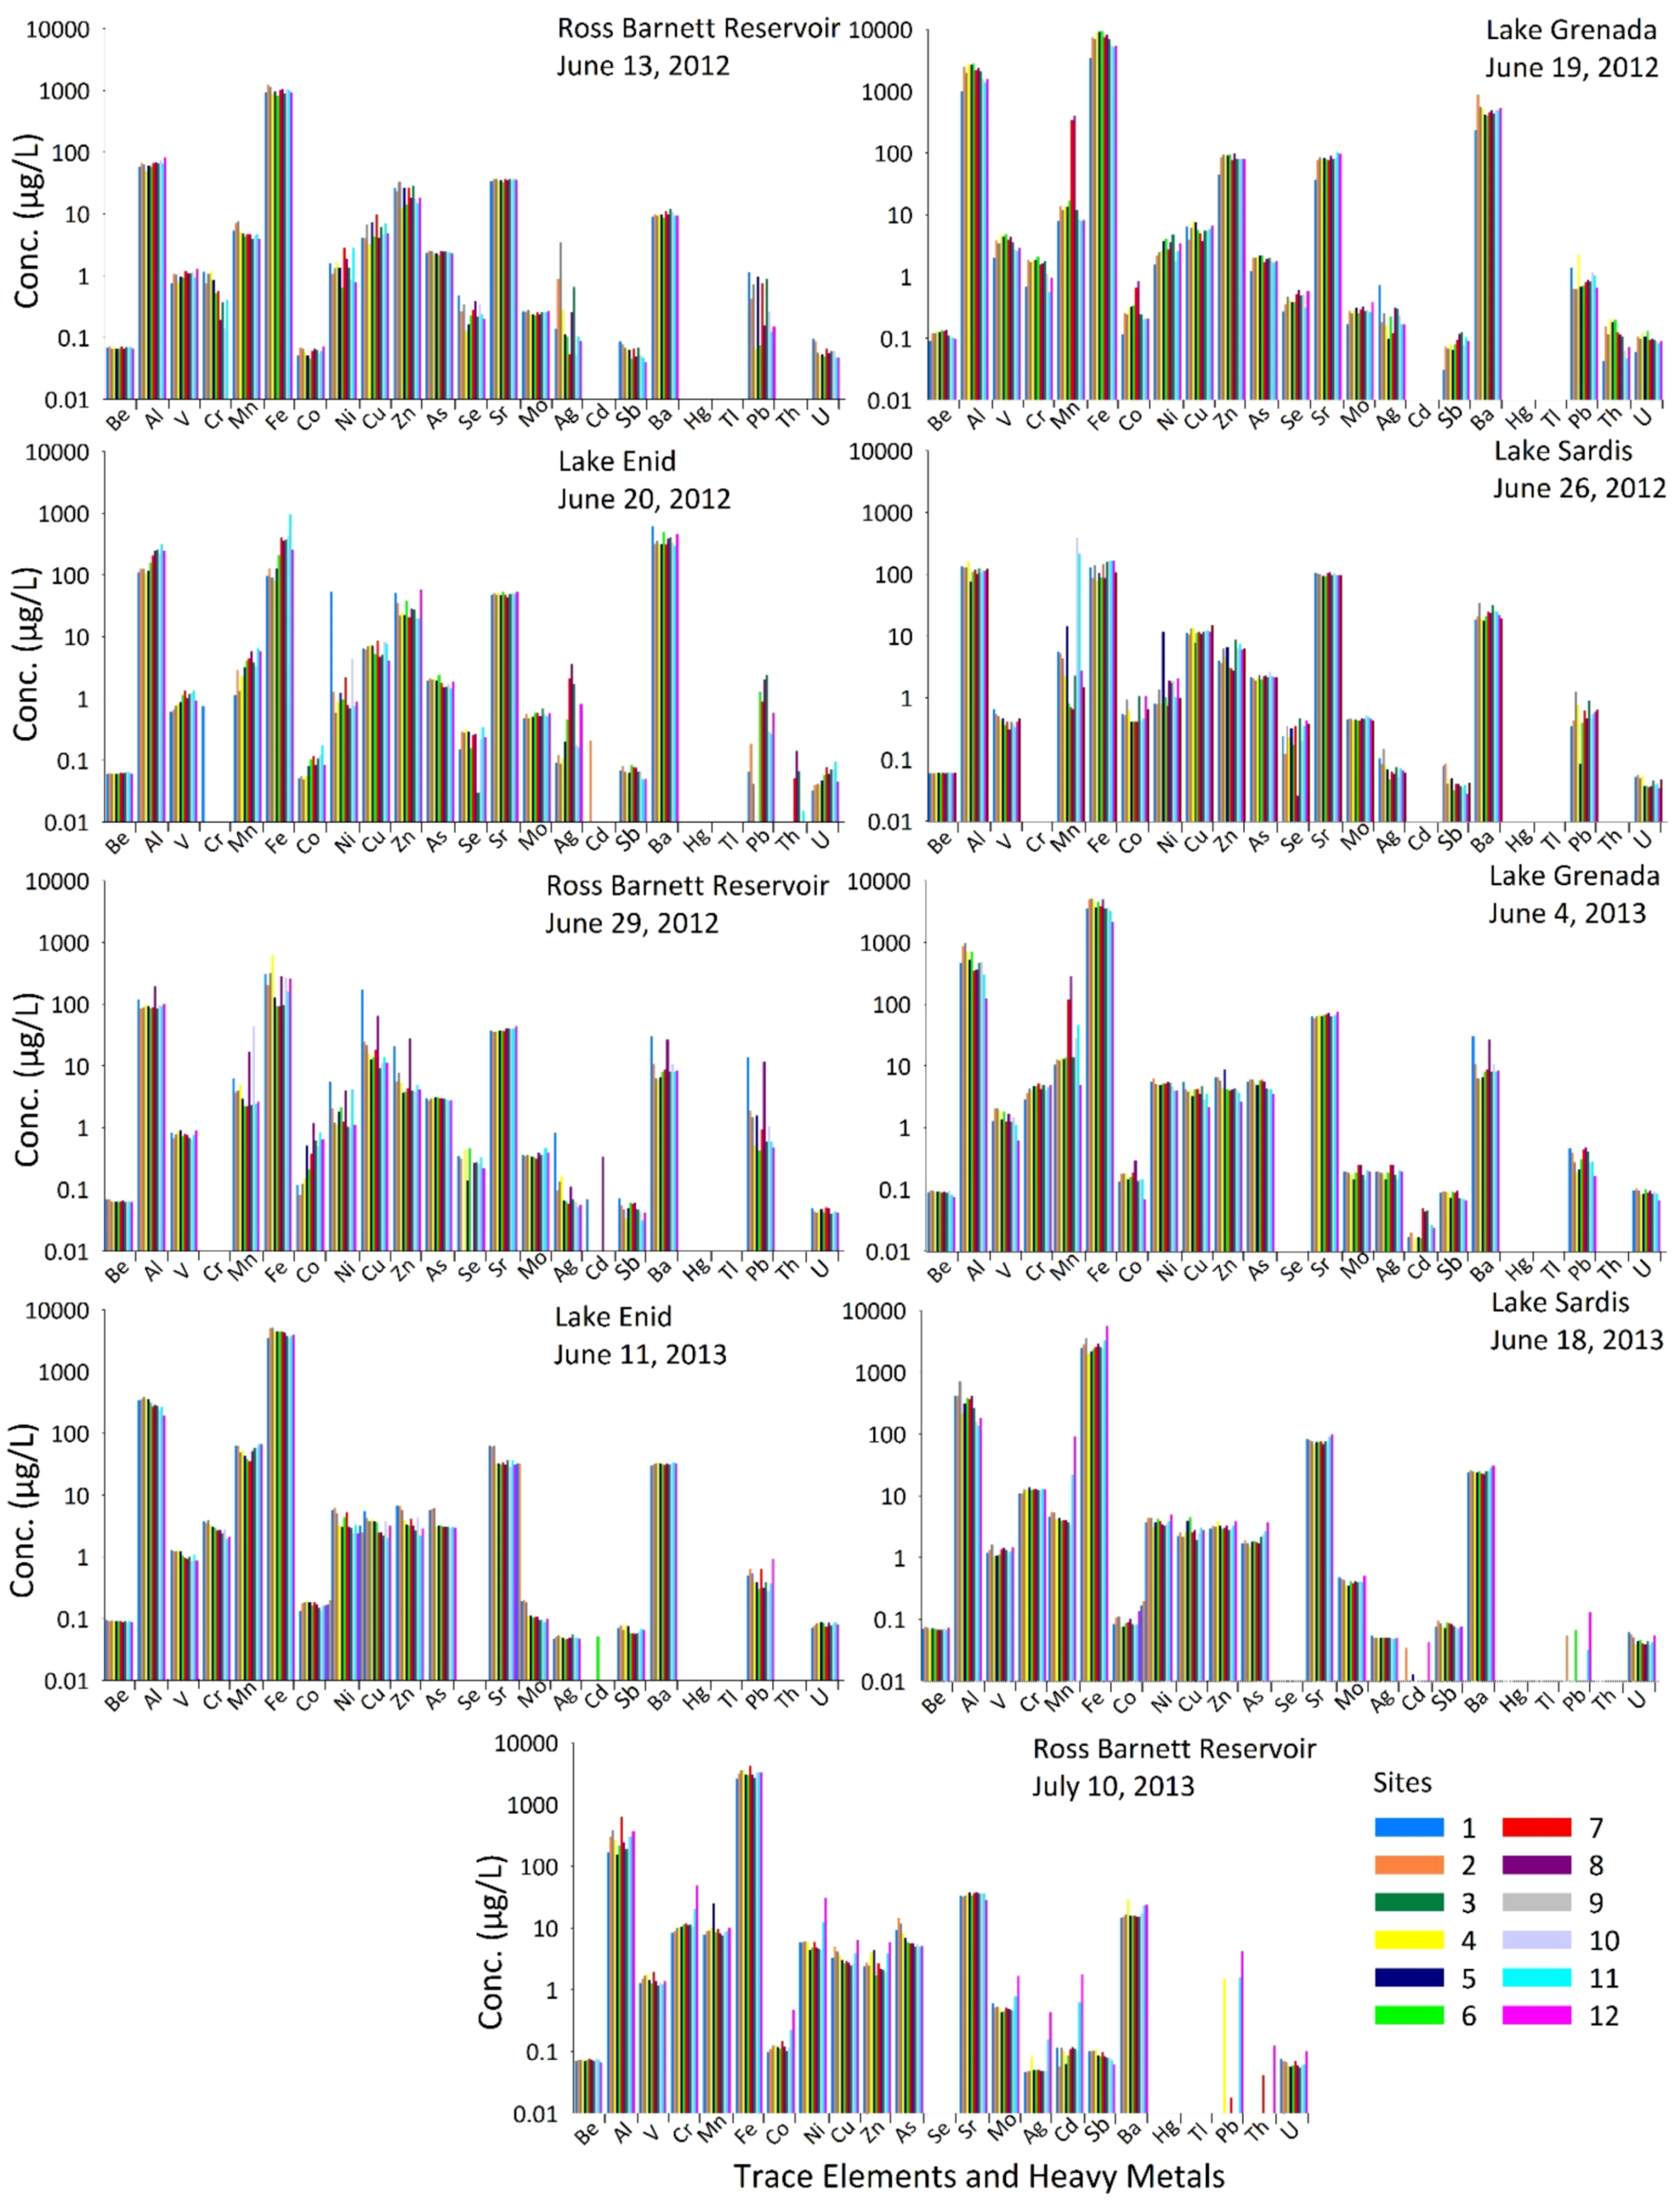
| Elements and Metals | Be | Cr | As | Se | Cd | Sb | Ba | Hg | Tl | Pb | U | Al | Cu | Fe | Mn | Ag | Zn | ||
|---|---|---|---|---|---|---|---|---|---|---|---|---|---|---|---|---|---|---|---|
| MCL (µg/L) | 4 | 100 | 10 | 50 | 5 | 6 | 2000 | 2 | 2 | 15 | 30 | 200 | 1000 | 300 | 50 | 100 | 5000 | ||
| DL (µg/L) | 0.008 | 0.023 | 0.026 | 0.018 | 0.012 | 0.015 | 0.008 | 0.005 | 0.003 | 0.013 | 0.004 | 0.035 | 0.018 | 0.042 | 0.012 | 0.008 | 0.024 | ||
| RB | 13 June 2012 | Mean | 0.069 | 0.657 | 2.39 | 0.272 | BD | 0.061 | 9.94 | BD | BD | 0.476 | 0.061 | 65.0 | 5.54 | 991 | 5.10 | 0.521 | 21.7 |
| Minimum | 0.066 | 0.142 | 2.16 | 0.129 | BD | 0.040 | 8.59 | BD | BD | 0.065 | 0.047 | 48.5 | 3.20 | 809 | 3.99 | 0.052 | 12.3 | ||
| Maximum | 0.073 | 1.20 | 2.54 | 0.478 | BD | 0.086 | 12.3 | BD | BD | 1.14 | 0.095 | 82.5 | 9.72 | 1217 | 7.52 | 3.52 | 33.3 | ||
| LG | 19 June 2012 | Mean | 0.117 | 1.47 | 1.87 | 0.444 | BD | 0.084 | 492 | BD | BD | 0.977 | 0.098 | 2066 | 5.81 | 7012 | 70.6 | 0.246 | 83.2 |
| Minimum | 0.090 | 0.551 | 1.22 | 0.270 | BD | 0.031 | 233 | BD | BD | 0.619 | 0.059 | 992 | 3.72 | 3494 | 7.80 | 0.097 | 44.2 | ||
| Maximum | 0.135 | 2.11 | 2.17 | 0.618 | BD | 0.124 | 875 | BD | BD | 2.28 | 0.131 | 2849 | 7.74 | 9415 | 398 | 0.726 | 98.8 | ||
| LE | 20 June 2012 | Mean | 0.062 | 0.740 | 1.87 | 0.237 | 0.205 | 0.067 | 384 | BD | BD | 0.804 | 0.057 | 185 | 6.48 | 291 | 3.71 | 0.809 | 30.5 |
| Minimum | 0.060 | 0.740 | 1.45 | 0.030 | 0.205 | 0.048 | 296 | BD | BD | 0.042 | 0.033 | 107 | 4.09 | 80.2 | 1.12 | 0.089 | 19.8 | ||
| Maximum | 0.066 | 0.740 | 2.39 | 0.344 | 0.205 | 0.083 | 614 | BD | BD | 2.39 | 0.097 | 316 | 8.53 | 947 | 6.39 | 3.63 | 56.7 | ||
| LS | 26 June 2012 | Mean | 0.060 | BD | 2.19 | 0.272 | BD | 0.046 | 23.7 | BD | BD | 0.571 | 0.043 | 118 | 11.5 | 126 | 54.4 | 0.077 | 5.22 |
| Minimum | 0.060 | BD | 1.92 | 0.026 | BD | 0.028 | 17.7 | BD | BD | 0.085 | 0.035 | 76.3 | 7.75 | 77.7 | 0.658 | 0.048 | 2.70 | ||
| Maximum | 0.061 | BD | 2.62 | 0.469 | BD | 0.085 | 34.1 | BD | BD | 1.25 | 0.057 | 161 | 13.5 | 166 | 399 | 0.149 | 8.90 | ||
| RB | 29 June 2012 | Mean | 0.064 | BD | 2.94 | 0.308 | 0.204 | 0.050 | 11.6 | BD | BD | 2.92 | 0.045 | 102 | 32.7 | 237 | 7.94 | 0.146 | 8.06 |
| Minimum | 0.062 | BD | 2.75 | 0.139 | 0.069 | 0.032 | 6.12 | BD | BD | 0.430 | 0.041 | 84.8 | 9.30 | 91.9 | 2.18 | 0.052 | 3.74 | ||
| Maximum | 0.070 | BD | 3.16 | 0.466 | 0.338 | 0.071 | 30.2 | BD | BD | 13.7 | 0.051 | 192 | 174 | 629 | 44.6 | 0.817 | 28.3 | ||
| LG | 2 June 2013 | Mean | 0.090 | 4.37 | 5.11 | BD | 0.024 | 0.083 | 29.1 | BD | BD | 0.322 | 0.089 | 529 | 3.83 | 4012 | 47.4 | 0.067 | 4.96 |
| Minimum | 0.075 | 2.90 | 3.55 | BD | 0.003 | 0.067 | 26.0 | BD | BD | 0.164 | 0.066 | 125 | 2.15 | 2137 | 5.00 | 0.047 | 2.63 | ||
| Maximum | 0.097 | 5.21 | 6.08 | BD | 0.050 | 0.094 | 31.4 | BD | BD | 0.473 | 0.104 | 983 | 5.46 | 5127 | 283 | 0.184 | 8.88 | ||
| LE | 11 June 2013 | Mean | 0.090 | 2.93 | 3.07 | BD | 0.014 | 0.066 | 31.9 | BD | BD | 0.471 | 0.081 | 301 | 2.89 | 4120 | 54.0 | 0.049 | 3.34 |
| Minimum | 0.086 | 1.97 | 2.94 | BD | 0.000 | 0.057 | 30.4 | BD | BD | 0.278 | 0.071 | 195 | 1.94 | 3461 | 35.5 | 0.046 | 2.24 | ||
| Maximum | 0.096 | 3.91 | 3.19 | BD | 0.052 | 0.078 | 34.3 | BD | BD | 0.927 | 0.088 | 388 | 4.09 | 4544 | 67.1 | 0.056 | 4.94 | ||
| LS | 18 June 2013 | Mean | 0.070 | 12.4 | 2.07 | BD | 0.017 | 0.080 | 25.2 | BD | BD | 0.057 | 0.047 | 330 | 2.80 | 2898 | 13.1 | 0.051 | 3.21 |
| Minimum | 0.067 | 10.9 | 1.52 | BD | 0.005 | 0.070 | 22.5 | BD | BD | 0.004 | 0.039 | 136 | 1.91 | 1983 | 3.37 | 0.049 | 2.76 | ||
| Maximum | 0.075 | 13.7 | 3.72 | BD | 0.043 | 0.096 | 30.7 | BD | BD | 0.129 | 0.062 | 708 | 4.51 | 5552 | 92.4 | 0.055 | 3.83 | ||
| RB | 10 July 2014 | Mean | 0.072 | 14.4 | 7.36 | BD | 0.281 | 0.088 | 18.1 | BD | BD | 1.84 | 0.066 | 292 | 3.57 | 3226 | 10.2 | 0.093 | 3.03 |
| Minimum | 0.066 | 8.39 | 4.94 | BD | 0.056 | 0.061 | 14.7 | BD | BD | 0.018 | 0.055 | 153 | 2.46 | 2629 | 7.60 | 0.046 | 1.68 | ||
| Maximum | 0.078 | 49.2 | 14.5 | BD | 1.77 | 0.105 | 29.1 | BD | BD | 4.22 | 0.101 | 620 | 6.39 | 4163 | 25.1 | 0.440 | 5.84 | ||
4. Conclusions
Acknowledgments
Author Contributions
Conflicts of Interest
References
- Diaz, R.J.; Rosenberg, R. Spreading dead zones and consequences for marine ecosystems. Science 2008, 321, 926–929. [Google Scholar] [CrossRef]
- Lotze, H.K.; Lenihan, H.S.; Bourque, B.J.; Bradbury, R.H.; Cooke, R.G.; Kay, M.C.; Kidwell, S.M.; Kirby, M.X.; Peterson, C.H.; Jackson, J.B.C. Depletion, degradation, and recovery potential of estuaries and coastal seas. Science 2006, 312, 1806–1809. [Google Scholar] [CrossRef] [PubMed]
- Rabalais, N.N.; Turner, R.E.; Sen Gupta, B.K.; Boesch, D.F.; Chapman, P.; Murrell, M.C. Hypoxia in the northern gulf of mexico: Does the science support the plan to reduce, mitigate, and control hypoxia? Estuaries Coasts 2007, 30, 753–772. [Google Scholar] [CrossRef]
- Garcia, A.C.; Bargu, S.; Dash, P.; Rabalais, N.N.; Sutor, M.; Morrison, W.; Walker, N.D. Evaluating the potential risk of microcystins to blue crab (callinectes sapidus) fisheries and human health in a eutrophic estuary. Harmful Algae 2010, 9, 134–143. [Google Scholar] [CrossRef]
- Metcalf, J.S.; Codd, G.A. Cyanobacterial Toxins in the Water Environment: A Review of Current Knowledge. Foundation for Water Research. Available online: http://www.fwr.org/cyanotox.pdf (accessed on 24 May 2015).
- Carmichael, W. The cyanotoxins. Adv. Bot. Res. 1997, 27, 211–257. [Google Scholar]
- Codd, G.A.; BELL, S.G.; Kaya, K.; WARD, C.J.; BEATTIE, K.A.; METCALF, J.S. Cyanobacterial toxins, exposure routes and human health. Eur. J. Phycol. 1999, 34, 405–415. [Google Scholar] [CrossRef]
- Falconer, I.R. Cyanobacteria—Toxins in Drinking Water. In Encyclopedia of Environmental Microbiology; John Wiley & Sons, Inc.: Hoboken, NJ, USA, 2003. [Google Scholar]
- Anderson, D.M.; Burkholder, J.M.; Cochlan, W.P.; Glibert, P.M.; Gobler, C.J.; Heil, C.A.; Kudela, R.M.; Parsons, M.L.; Rensel, J.J.; Townsend, D.W. Harmful algal blooms and eutrophication: Examining linkages from selected coastal regions of the united states. Harmful Algae 2008, 8, 39–53. [Google Scholar] [CrossRef] [PubMed]
- Cousins, F. Deadly Bacteria Found in Gulf Coast Tar Balls. Available online: http://www.desmogblog.com/deadly-bacteria-found-gulf-coast-tar-balls (assessed on 24 May 2015).
- Roig, F.J.; Sanjuán, E.; Llorens, A.; Amaro, C. Pilf polymorphism-based pcr to distinguish vibrio vulnificus strains potentially dangerous to public health. Appl. Environ. Microbiol. 2010, 76, 1328–1333. [Google Scholar] [CrossRef] [PubMed]
- Langmuir, D.; Chrostowski, P.; Vigneault, B.; Chaney, R. Issue Paper on the Environmental Chemistry of Metals. Available online: http://ofmpub.epa.gov/eims/eimscomm.getfile?p_download_id=437514 (assessed on 15 May 2015).
- US Environmental Protection Agency. Water on Tap: What You Need to Know. Available online: http://www.epa.gov/safewater/wot/pdfs/book_waterontap_full.pdf (assessed on 1 August 2015).
- Fitzsimmons, E.G. Tap Water Ban for Toledo Residents. New York Times, 3 August 2014; A12. [Google Scholar]
- Henry, T. Carrol Township’s Scare with Toxin a “Wake-up Call”. Toledo Blade, 2013. Available online: http://www.toledoblade.com/local/2013/09/15/Carroll-Township-s-scare-with-toxin-a-wake-up-call.html (accessed on 24 May 2015).
- Wynne, T.T.; Stumpf, R.P. Spatial and temporal patterns in the seasonal distribution of toxic cyanobacteria in western lake erie from 2002–2014. Toxins 2015, 7, 1649–1663. [Google Scholar] [CrossRef] [PubMed]
- US Environmental Protection Agency. Monitoring Lake Quality. Available online: http://www.epa.state.il.us/water/conservation/lake-notes/monitoring-lake-quality/monitoring-lake-quality.pdf (assessed on 15 July 2015).
- Niu, X.; Williams, J.; Miller, D.; Lehnert, K.; Bills, B.; Brantley, S. An ontology driven relational geochemical database for the earth’s critical zone: Czchemdb. J. Environ. Inf. 2014, 23, 10–23. [Google Scholar] [CrossRef]
- Dash, P.; Walker, N.; Mishra, D.; D’Sa, E.; Ladner, S. Atmospheric correction and vicarious calibration of oceansat-1 ocean color monitor (ocm) data in coastal case 2 waters. Remote Sens. 2012, 4, 1716–1740. [Google Scholar] [CrossRef]
- Gould, R.W.; Arnone, R.A. Remote sensing estimates of inherent optical properties in a coastal environment. Remote Sens. Environ. 1997, 61, 290–301. [Google Scholar] [CrossRef]
- Olmanson, L.G.; Brezonik, P.L.; Bauer, M.E. Airborne hyperspectral remote sensing to assess spatial distribution of water quality characteristics in large rivers: The mississippi river and its tributaries in minnesota. Remote Sens. Environ. 2013, 130, 254–265. [Google Scholar]
- Song, K.; Li, L.; Tedesco, L.; Duan, H.; Li, L.; Du, J. Remote quantification of total suspended matter through empirical approaches for inland waters. J. Environ. Inf. 2014, 23, 23–36. [Google Scholar] [CrossRef]
- Stumpf, R.P.; Wynne, T.T.; Baker, D.B.; Fahnenstiel, G.L. Interannual variability of cyanobacterial blooms in lake erie. PLoS One 2012, 7. [Google Scholar] [CrossRef] [PubMed]
- Bradt, S. Applications of remote sensing for lake basin management. Available online: http://wldb.ilec.or.jp/ILBMTrainingMaterials/resources/Remote_Sensing.pdf (assessed on 31 July 2015).
- Kutser, T. Passive optical remote sensing of cyanobacteria and other intense phytoplankton blooms in coastal and inland waters. Int. J. Remote Sens. 2009, 30, 4401–4425. [Google Scholar] [CrossRef]
- Dash, P.; Walker, N.D.; Mishra, D.R.; Hu, C.; Pinckney, J.L.; D’Sa, E.J. Estimation of cyanobacterial pigments in a freshwater lake using OCM satellite data. Remote Sen. Environ. 2011, 115, 3409–3423. [Google Scholar] [CrossRef]
- David, M.B.; Flint, C.G.; McIsaac, G.F.; Gentry, L.E.; Dolan, M.K.; Czapar, G.F. Biophysical and social barriers restrict water quality improvements in the mississippi river basin. Environ. Sci. Technol. 2013, 47, 11928–11929. [Google Scholar] [CrossRef] [PubMed]
- Lerch, R.; Baffaut, C.; Sadler, E.; Kremer, R. Long-term agroecosystem research in the central mississippi river basin: Goodwater creek experimental watershed and regional herbicide water quality data. J. Environ. Qual. 2015, 44, 28–36. [Google Scholar] [CrossRef] [PubMed]
- Ling, J.; Wu, M.; Chen, Y.; Zhang, Y.; Dong, J. Identification of spatial and temporal patterns of coastal waters in sanya bay, south China sea by chemometrics. J. Environ. Inf. 2014, 23, 37–43. [Google Scholar] [CrossRef]
- Shiller, A.M.; Shim, M.-J.; Guo, L.; Bianchi, T.S.; Smith, R.W.; Duan, S. Hurricane katrina impact on water quality in the east pearl river, mississippi. J. Hydrol. 2012, 414, 388–392. [Google Scholar] [CrossRef]
- MSDEQ. Comprehensive protection and restoration plan for the ross barnett reservoir watershed, Mississippi. Available online: http://rezonate-ms.org/wp-content/uploads/2013/09/FINAL-Executive-Summary.pdf (assessed on 24 May 2015).
- US Army Corps of Engineers. Welcome to the Vicksburg District’s Corps Lakes. Available online: http://www.mvk.usace.army.mil/Missions/Recreation.aspx (assessed on 24 May 2015).
- Kishinhi, S.; Tchounwou, P.B.; Farah, I.O.; Chigbu, P. Recreational water quality control in Mississippi, USA: Bacteriological assessment in the pearl river and ross barnett reservoir. Rev. Environ. Health 2006, 21, 295–307. [Google Scholar] [CrossRef] [PubMed]
- Tchounwou, P.B.; Warren, M. Physicochemical and bacteriological assessment of water quality at the ross barnett reservoir in central Mississippi, USA. Rev. Environ. Health 2001, 16, 203–212. [Google Scholar] [CrossRef] [PubMed]
- Wersal, R.M.; Madsen, J.D.; Tagert, M.L. Aquatic plant survey of ross barnett reservoir for 2005. GeoResour. Inst. Rep. 2006, 5003, 1–11. [Google Scholar]
- Sobolev, D.; Moore, K.; Morris, A.L. Nutrients and light limitation of phytoplankton biomass in a turbid southeastern reservoir: Implications for water quality. Southeast. Nat. 2009, 8, 255–266. [Google Scholar] [CrossRef]
- Downer, C.W.; DeLaune, R.; Nyman, J.A. Characteristics and Long-Term Sedimentation Patterns of Wetlands Constructed in the Fluctuation Zone of Grenada Lake, Mississippi; US Army Engineer Waterways Experiment Station: Vicksburg, MS, USA, 1995. [Google Scholar]
- Dunbar, J.A.; Bennett, S.J.; Higley, P.D.; Rhoton, F.E. Sedimentation patterns within a flood control reservoir: Grenada lake, MS. Res. Rep. 2003, 38, 44. [Google Scholar]
- Bennett, S.J.; Rhoton, F.E. Physical and chemical characteristics of sediment impounded within Grenada lake, MS. 2003. Available online: http://www.ars.usda.gov/SP2UserFiles/Place/60600505/TechnicalReports/NSLTechnicalReport36.pdf (assessed on 7 September 2015). [Google Scholar]
- Bennett, S.J.; Rhoton, F.E.; Dunbar, J.A. Texture, spatial distribution, and rate of reservoir sedimentation within a highly erosive, cultivated watershed: Grenada lake, Mississippi. Water Resour. Res. 2005, 41. [Google Scholar] [CrossRef]
- Huggett, D.; Steevens, J.; Allgood, J.; Lutken, C.; Grace, C.; Benson, W. Mercury in sediment and fish from north Mississippi lakes. Chemosphere 2001, 42, 923–929. [Google Scholar] [CrossRef]
- Lim, K.-Y.; Surbeck, C.Q. A multi-variate methodology for analyzing pre-existing lake water quality data. J. Environ. Monit. 2011, 13, 2477–2487. [Google Scholar] [CrossRef] [PubMed]
- Ochs, C.A.; Rhew, K. Population dynamics of autotrophic picoplankton in a southeastern us reservoir. Int. Rev. Gesamten Hydrobiol. Hydrogr. 1997, 82, 293–313. [Google Scholar] [CrossRef]
- Sthapit, E.; Ochs, C.A.; Zimba, P.V. Spatial and temporal variation in phytoplankton community structure in a southeastern us reservoir determined by HPLC and light microscopy. Hydrobiologia 2008, 600, 215–228. [Google Scholar] [CrossRef]
- Hanson, L.A.; Hubbard, W.D.; Petrie-Hanson, L. Distribution of Largemouth Bass Virus may be expanding in Mississippi. Fish health newsletter: Bethesda, MD, USA, 2003. Available online: http://www.afs-fhs.org/communications/newsletter/V29-4_2001.PDF (assessed on 7 September 2015).
- Haag, W.R.; Warren, M.L. Freshwater mussel assemblage structure in a regulated river in the lower Mississippi river alluvial basin, USA. Aquat. Conserv.: Mar. Freshw. Ecosyst. 2007, 17, 25–36. [Google Scholar] [CrossRef]
- Dorr, B.; Munn, I.A.; Meals, K.O. A socioeconomic and biological evaluation of current and hypothetical crappie regulations in Sardis lake, Mississippi: An integrated approach. North Am. J. Fish. Manag. 2002, 22, 1376–1384. [Google Scholar] [CrossRef]
- McClain, C.R. Science quality seawifs data for global biosphere research. Sea Technol. 1998, 39, 10–16. [Google Scholar]
- Britton, L.J.; Greeson, P.E. Methods for Collection and Analysis of Aquatic Biological and Microbiological Samples; U.S. Geological Survey: Lakewood, CO, USA, 1989.
- Pinckney, J.; Millie, D.; Howe, K.; Paerl, H.; Hurley, J. Flow scintillation counting of 14c-labeled microalgal photosynthetic pigments. J. Plankton Res. 1996, 18, 1867–1880. [Google Scholar] [CrossRef]
- Roy, S.; Llewellyn, C.A.; Egeland, E.S.; Johnsen, G. Phytoplankton Pigments: Characterization, Chemotaxonomy and Applications in Oceanography; Cambridge University Press: Cambridge, UK, 2011. [Google Scholar]
- Mackey, M.; Mackey, D.; Higgins, H.; Wright, S. Chemtax-a program for estimating class abundances from chemical markers: Application to HPLC measurements of phytoplankton. Mar. Ecol. Prog. Ser. 1996, 144, 265–283. [Google Scholar] [CrossRef]
- Higgins, H.W.; Wright, S.W.; Schluter, L. Quantitative Interpretation of Chemotaxonomic Pigment Data; Cambridge University Press: Cambridge, UK, 2011. [Google Scholar]
- Latasa, M. Improving estimations of phytoplankton class abundances using chemtax. Mar. Ecol. Prog. Ser. 2007, 329, 13–21. [Google Scholar] [CrossRef]
- Pinckney, J.L.; Wee, J.L.; Hou, A.; Walker, N.D. Phytoplankton community structure responses to urban effluent inputs following hurricanes katrina and rita. Mar. Ecol. Prog. Ser. 2009, 387, 137–146. [Google Scholar] [CrossRef]
- Schlüter, L.; Lauridsen, T.; Krogh, G.; Jørgensen, T. Identification and quantification of phytoplankton groups in lakes using new pigment ratios—A comparison between pigment analysis by HPLC and microscopy. Freshw. Biol. 2006, 51, 1474–1485. [Google Scholar] [CrossRef]
- Mackey, M.D.; Higgins, H.W.; Mackey, D.J.; Wright, S.W. Chemtax User’s Manual: A Program for Estimating Class Abundances from Chemical Markers—Application to HPLC Measurements of Phytoplankton Pigments; CSIRO Marine Laboratories: Hobart, Australia, 1997. [Google Scholar]
- Wright, S.; Thomas, D.; Marchant, H.; Higgins, H.; Mackey, M.; Mackey, D. Analysis of phytoplankton of the australian sector of the southern ocean: Comparisons of microscopy and size frequency data with interpretations of pigment HPLC data using the ‘CHEMTAX’ matrix factorisation program. Mar. Ecol. Prog. Ser. 1996, 14, 285–298. [Google Scholar] [CrossRef]
- Downes, M.T.; Hall, J.A. A sensitive fluorometric technique for the measurement of phycobilin pigments and its application to the study of marine and freshwater picophytoplankton in oligotrophic environments. J. Appl. Phycol. 1998, 10, 357–363. [Google Scholar] [CrossRef]
- Mitchell, B.G.; Kahru, M.; Wieland, J.; Stramska, M. Determination of spectral absorption coefficients of particles, dissolved material and phytoplankton for discrete water samples. In Ocean Optics Protocols For Satellite Ocean Color Sensor Validation, Revision 2; National Aeronautics and Space Administration, Goddard Space Flight Center: Greenbelt, MD, USA, 2002; Volume 3, pp. 231–257. [Google Scholar]
- Cleveland, J.; Weidemann, A.D. Quantifying absorption by aquatic particles: A multiple scattering correction for glass-fiber filters. Limnol. Oceanogr. 1993, 38, 1321–1327. [Google Scholar] [CrossRef]
- Boyer, G.L. Cyanobacterial toxins in new york and the lower great lakes ecosystems. In Cyanobacterial Harmful Algal Blooms: State of the Science and Research Needs; Springer: Berlin, Germany, 2008; pp. 153–165. [Google Scholar]
- American Public Health Association; American Water Works Association; Water Environment Federation. Standard Methods for the Examination of Water and Wastewater; American Public Health Association (APHA): Washington, DC, USA, 2005. [Google Scholar]
- Shields, F.D.; Lizotte, R.E.; Knight, S.S.; Cooper, C.M.; Wilcox, D. The stream channel incision syndrome and water quality. Ecol. Eng. 2010, 36, 78–90. [Google Scholar] [CrossRef]
- Sieracki, C.K.; Sieracki, M.E.; Yentsch, C.S. An imaging-in-flow system for automated analysis of marine microplankton. Mar. Ecol. Prog. Ser. 1998, 168, 285–296. [Google Scholar] [CrossRef]
- Franz, B.A.; Werdell, P.J.; Meister, G.; Kwiatkowska, E.J.; Bailey, S.W.; Ahmad, Z.; McClain, C.R. Modis Land Bands for Ocean Remote Sensing Applications. In Proceedings of the Ocean Optics XVIII, Montreal, Canada, 9–13 October 2006.
- Miller, J.R.; Sinclair, J.T.; Walsh, D. Controls on suspended sediment concentrations and turbidity within a reforested, southern appalachian headwater basin. Water 2015, 7, 3123–3148. [Google Scholar] [CrossRef]
- Cullum, R.; Knight, S.; Cooper, C.; Smith, S. Combined effects of best management practices on water quality in oxbow lakes from agricultural watersheds. Soil Tillage Res. 2006, 90, 212–221. [Google Scholar] [CrossRef]
- WHO. Turbidity Measurement. Available online: http://www.who.int/water_sanitation_health/hygiene/emergencies/fs2_33.pdf (assessed on 24 May 2015).
- Hunter, P.; Tyler, A.; Willby, N.; Gilvear, D. The spatial dynamics of vertical migration by microcystis aeruginosa in a eutrophic shallow lake: A case study using high spatial resolution time-series airborne remote sensing. Limnol. Oceanogr. 2008, 53, 2391–2406. [Google Scholar] [CrossRef]
- Schalles, J.F.; Yacobi, Y.Z. Remote detection and seasonal patterns of phycocyanin, carotenoid and chlorophyll pigments in eutrophic waters. Ergeb. Limnol. 2000, 55, 153–168. [Google Scholar]
- Hunter, P.D.; Tyler, A.N.; Gilvear, D.J.; Willby, N.J. Using remote sensing to aid the assessment of human health risks from blooms of potentially toxic cyanobacteria. Environ. Sci. Technol. 2009, 43, 2627–2633. [Google Scholar] [CrossRef] [PubMed]
- MacKintosh, C.; Beattie, K.A.; Klumpp, S.; Cohen, P.; Codd, G.A. Cyanobacterial microcystin-lr is a potent and specific inhibitor of protein phosphatases 1 and 2a from both mammals and higher plants. FEBS Lett. 1990, 264, 187–192. [Google Scholar] [CrossRef]
- Graham, J.L.; Loftin, K.A.; Kamman, N. Monitoring recreational freshwaters. Lakelines 2009, 29, 18–24. [Google Scholar]
- Codd, G.A.; Bell, S.G.; Brooks, W.P. Cyanobacterial toxins in water. Water Sci. Technol. 1989, 21, 1–13. [Google Scholar]
- Falconer, D.S.; Mackay, T.F.C. Introduction to Quantitative Genetics; Ronald Press: New York, NY, USA, 1960. [Google Scholar]
- WHO Geneva. Guidelines for Drinking-Water Quality; World Health Organization: Geneva, Switzerland, 2011. [Google Scholar]
- US Environmental Protection Agency. 2015 Drinking Water Health Advisories for Two Cyanobacterial Toxins. Available online: http://www2.epa.gov/sites/production/files/2015-06/documents/cyanotoxins-fact_sheet-2015.pdf (assessed on 31 July 2015).
- Messina, I. Microcystin Detected in Raw Lake Erie Water, Toledo Water Deemed Safe to Drink. The Blade, 2015. Available online: http://www.toledoblade.com/local/2015/07/27/Microcystin-detected-in-raw-Lake-Erie-water-Toledo-water-deemed-safe-to-drink.html (accessed on 24 May 2015).
- US Environmental Protection Agency. What is the Regulatory Status of Habs Cyanobacteria and Cyanotoxins in the U.S.? Available online: http://www2.epa.gov/nutrient-policy-data/policies-and-guidelines (assessed on 24 May 2015).
- Carlson, R.E. A trophic state index for lakes1. Limnol. Oceanogr. 1977, 22, 361–369. [Google Scholar] [CrossRef]
- Carlson, R.E. Expanding the trophic state concept to identify non-nutrient limited lakes and reservoirs; Enhancing the States’s Lake Management Programs; North American Lake management Society: Madison, WI, USA, 1991; pp. 59–71. [Google Scholar]
- US Environmental Protection Agency. Drinking Water Contaminants. Available online: http://water.epa.gov/drink/contaminants/#Microorganisms (assessed on 15 May 2015).
- Paerl, H.W.; Fulton, R.S.; Moisander, P.H.; Dyble, J. Harmful freshwater algal blooms, with an emphasis on cyanobacteria. Sci. World J. 2001, 1, 76–113. [Google Scholar] [CrossRef] [PubMed]
- Stevenson, A.H. Studies of bathing water quality and health*. Am. J. Public Health Nations Health 1953, 43, 529–538. [Google Scholar] [CrossRef] [PubMed]
- US Environmental Protection Agency. 2012 Recreational Water Quality Criteria. Available online: http://water.epa.gov/scitech/swguidance/standards/criteria/health/recreation/Upload/factsheet2012.pdf (assessed on 15 May 2015).
© 2015 by the authors; licensee MDPI, Basel, Switzerland. This article is an open access article distributed under the terms and conditions of the Creative Commons Attribution license (http://creativecommons.org/licenses/by/4.0/).
Share and Cite
Dash, P.; Silwal, S.; Ikenga, J.O.; Pinckney, J.L.; Arslan, Z.; Lizotte, R.E. Water Quality of Four Major Lakes in Mississippi, USA: Impacts on Human and Aquatic Ecosystem Health. Water 2015, 7, 4999-5030. https://doi.org/10.3390/w7094999
Dash P, Silwal S, Ikenga JO, Pinckney JL, Arslan Z, Lizotte RE. Water Quality of Four Major Lakes in Mississippi, USA: Impacts on Human and Aquatic Ecosystem Health. Water. 2015; 7(9):4999-5030. https://doi.org/10.3390/w7094999
Chicago/Turabian StyleDash, Padmanava, Saurav Silwal, Julius O. Ikenga, James L. Pinckney, Zikri Arslan, and Richard E. Lizotte. 2015. "Water Quality of Four Major Lakes in Mississippi, USA: Impacts on Human and Aquatic Ecosystem Health" Water 7, no. 9: 4999-5030. https://doi.org/10.3390/w7094999