Article

Territorial Vulnerability Assessment Supporting Risk Managing Coastal Areas Due to Tsunami Impact

by
José Leandro Barros
1,*,
Alexandre Oliveira Tavares
2,
Angela Santos
1 and
André Fonte
1
1
Centre for Geographical Studies, Institute of Geography and Spatial Planning, Universidade deLisboa, Edifício da Faculdade de Letras, Alameda da Universidade, Lisboa 1600-214, Portugal
2
Center for Social Studies, Earth Sciences Department, University of Coimbra, Rua Sílvio Lima, Polo II, Coimbra 3030-790, Portugal
*
Author to whom correspondence should be addressed.
Water 2015, 7(9), 4971-4998; https://doi.org/10.3390/w7094971
Submission received: 29 June 2015 / Revised: 7 September 2015 / Accepted: 9 September 2015 / Published: 15 September 2015

Abstract

:
Portugal’s coastline extends 1187 km. It is characterized by social, economic and physical conditions that differentiate it from the rest of the territory, including population density, location of infrastructure and support of tourism activities. Therefore, it has a significant exposure if a tsunami occurs. Six coastal study sites with varying characteristics were selected for evaluation in this paper, including two core beach-use areas, two residential areas and two industrial areas. These sites are located in the municipalities of Figueira da Foz, Setúbal and Vila do Bispo. The analysis began with the calculation of the potential tsunami inundation area for each site using the 1755 Lisbon tsunami. Next, a methodology distinguished by its multidimensional character was applied to assess local vulnerability to tsunamis. This methodology assesses vulnerabilities associated with morphological, structural, social and tax factors. These four vulnerability components were combined to obtain a Composite Vulnerability Index (CVI), which enabled us to identify the most vulnerable areas and to determine the distinguishing characteristics of each area.

1. Introduction

1.1. Contextualization

The 1 November 1755 earthquake (magnitude Mw 8.7) and tsunami was the most catastrophic natural disaster to occur in Portugal’s history; this disaster caused approximately 12,000 deaths and resulted in severe damage to many coastal areas, particularly the city of Lisbon [1]. Historical records identify a total of 17 tsunamis that have taken place in Portugal from 60 BC to the present day [2,3].
In recent decades, Portugal’s coastal areas have been subject to social, economic, land-use and environmental transformations, similar to coastal areas worldwide [4,5,6]. The concentration of population in urban and coastal areas in recent decades has put great socio-economic and environmental pressures on these zones. Worldwide, coastal areas play a key role in supporting human survival; about half of the world’s population depends directly on these areas for livelihoods related to fisheries, tourism, trade, transport and energy [6], and 40% of the world population lives less than 100 km from the coast [7].
If we narrow our analysis and only consider areas designated Low Elevation Coastal Zone (LECZ), which is defined as a contiguous area along the coast less than 10 meters above sea level [8,9], we see that this area represents 2% of the world’s land area but supports 10% of the global population and 13% of the world’s urban population [9].
In Portugal, the coastal zone is 1187 km long and is characterized by social, economic, physical and environmental conditions that distinguish it from the rest of the territory. In the last five decades, urbanization, especially along the coastline between Viana do Castelo, Setúbal and the Algarve coast, has put strong human pressure on this zone, which is represented by the fact that 75% of the country’s population and 85% of its GDP are now concentrated in this area [10]. These data are supported by the European Environmental Agency (EEA), which notes that between 1990 and 2005 Portugal had one of the highest percentages of construction per 1 km of coastline of any European country [11]. These facts have decisively increased the vulnerability and exposure of the coastal zone to natural hazards in general, and tsunamis in particular, as revealed by the damage caused by the 6 January 2014 Hercules storm, which caused more than a million in damage and about eight injuries [12].
The heterogeneity that characterizes the Portuguese coast is reflected in the existence of numerous areas with differentiating features. Industrial areas, a succession of predominantly residential areas, as well as beach-use areas for vacationers and environmentally protected areas are all found along the coast. This diversity requires the adoption of a multidimensional methodology to analyze and evaluate the tsunami vulnerability of different regions. This study analyzed six sites based on the following distinctive features: two beach-use areas, two residential neighborhoods and two industrial areas.
The beach use areas are characterized by strong coastal tourism. They are distinguished from other areas by their high transient populations and low number of long-term residents, a high number of secondary vacation homes, and a strong seasonal flux in the human population that puts amount of strain on the environment and landscape. The two residential neighborhoods were chosen based on their strong anthropic pressures corresponding to population clusters of regional (Cova Gala) and national (Setúbal) importance. These areas distinguished by the variety of services and functions that are provided within their territories. The two industrial areas selected for this study are also characterized by the presence of residential, retail and other services in addition to industry.
The present study will focus on different areas within three Portuguese coastal municipalities, based on historical accounts of the 1755 Lisbon tsunami and territorial characteristics (Figure 1). Even though it was triggered by an earthquake, the methodological approach only explores the tsunami parameters and their relation with coastal attributes for the potential impact assessment. In this study, the impacts from earthquake shaking are not considered, but this would likely increase the damage and number of injuries in the areas studied. This could also potentially cause changes in the land morphology as well as weaken building structures. The analysis began with a worst-case scenario based on a deterministic approach, focused on a scenario similar to the 1 November 1755 tsunami event. Table 1 presents the tsunami parameters for the three study municipalities. Furthermore, according to the historical accounts, Vila do Bispo municipality was the first municipality hit by the 1755 tsunami, less than 20 min after the earthquake [1]. In addition, at Vila do Bispo the tsunami run-up was extreme, being the highest values with at the cliffs. As we move away from the source (eastern and northern Portuguese coastal zones), the tsunami travel times increase and tsunami run-up decreases, as confirmed by the tsunami numerical model [2,13].
Figure 1. Location of the two study areas: (a) framework for Portugal; (b) municipality of Figueira da Foz; (c) municipality of Setúbal; and (d) municipality of Vila do Bispo.
Water 07 04971 g001
Table 1. Tsunami parameters for the studied municipalities [1].
MunicipalitiesRun-up (m)Travel Time (min)Fatalities
Figueira da Foz3638–450
Setúbal6–17.5>2000 (1)
Vila do Bispo10–14416–170
Note: (1) damage/fatalities due to earthquake, fire and tsunami.
Based on the tsunami numerical model carried out by [2,13] at the regional scale, the study uses the inundated areas calculated by [1] at Figueira da Foz, and the outputs model upgrades at Setubal and Vila do Bispo.
A multidimensional methodology was applied to all six study sites to assess their vulnerability to tsunamis, expressing the potential for casualty, destruction, damage, disruption or other form of loss. The selection of this methodology was justified by the fact that the six areas have distinctive morphological structural, social and tax features. Previous studies evaluating the vulnerability to tsunamis show that the distribution of vulnerability over a territory does not occur in a uniform manner and is instead dependent on a number of factors [14,15,16]. Thus, this paper applies a multidimensional methodology that integrates morphological, structural, social and fiscal vulnerability components into the analysis. A vulnerability index was calculated for each component. Finally, a Composite Vulnerability Index (CVI) was calculated to create a single index that accounted for the four vulnerabilities previously considered.
The objectives of this work include:
  • Analysis and assessment of the characteristics of beach-use areas, residential areas and industrial areas.
  • Assessment of the characteristics of the buildings potentially affected by tsunami.
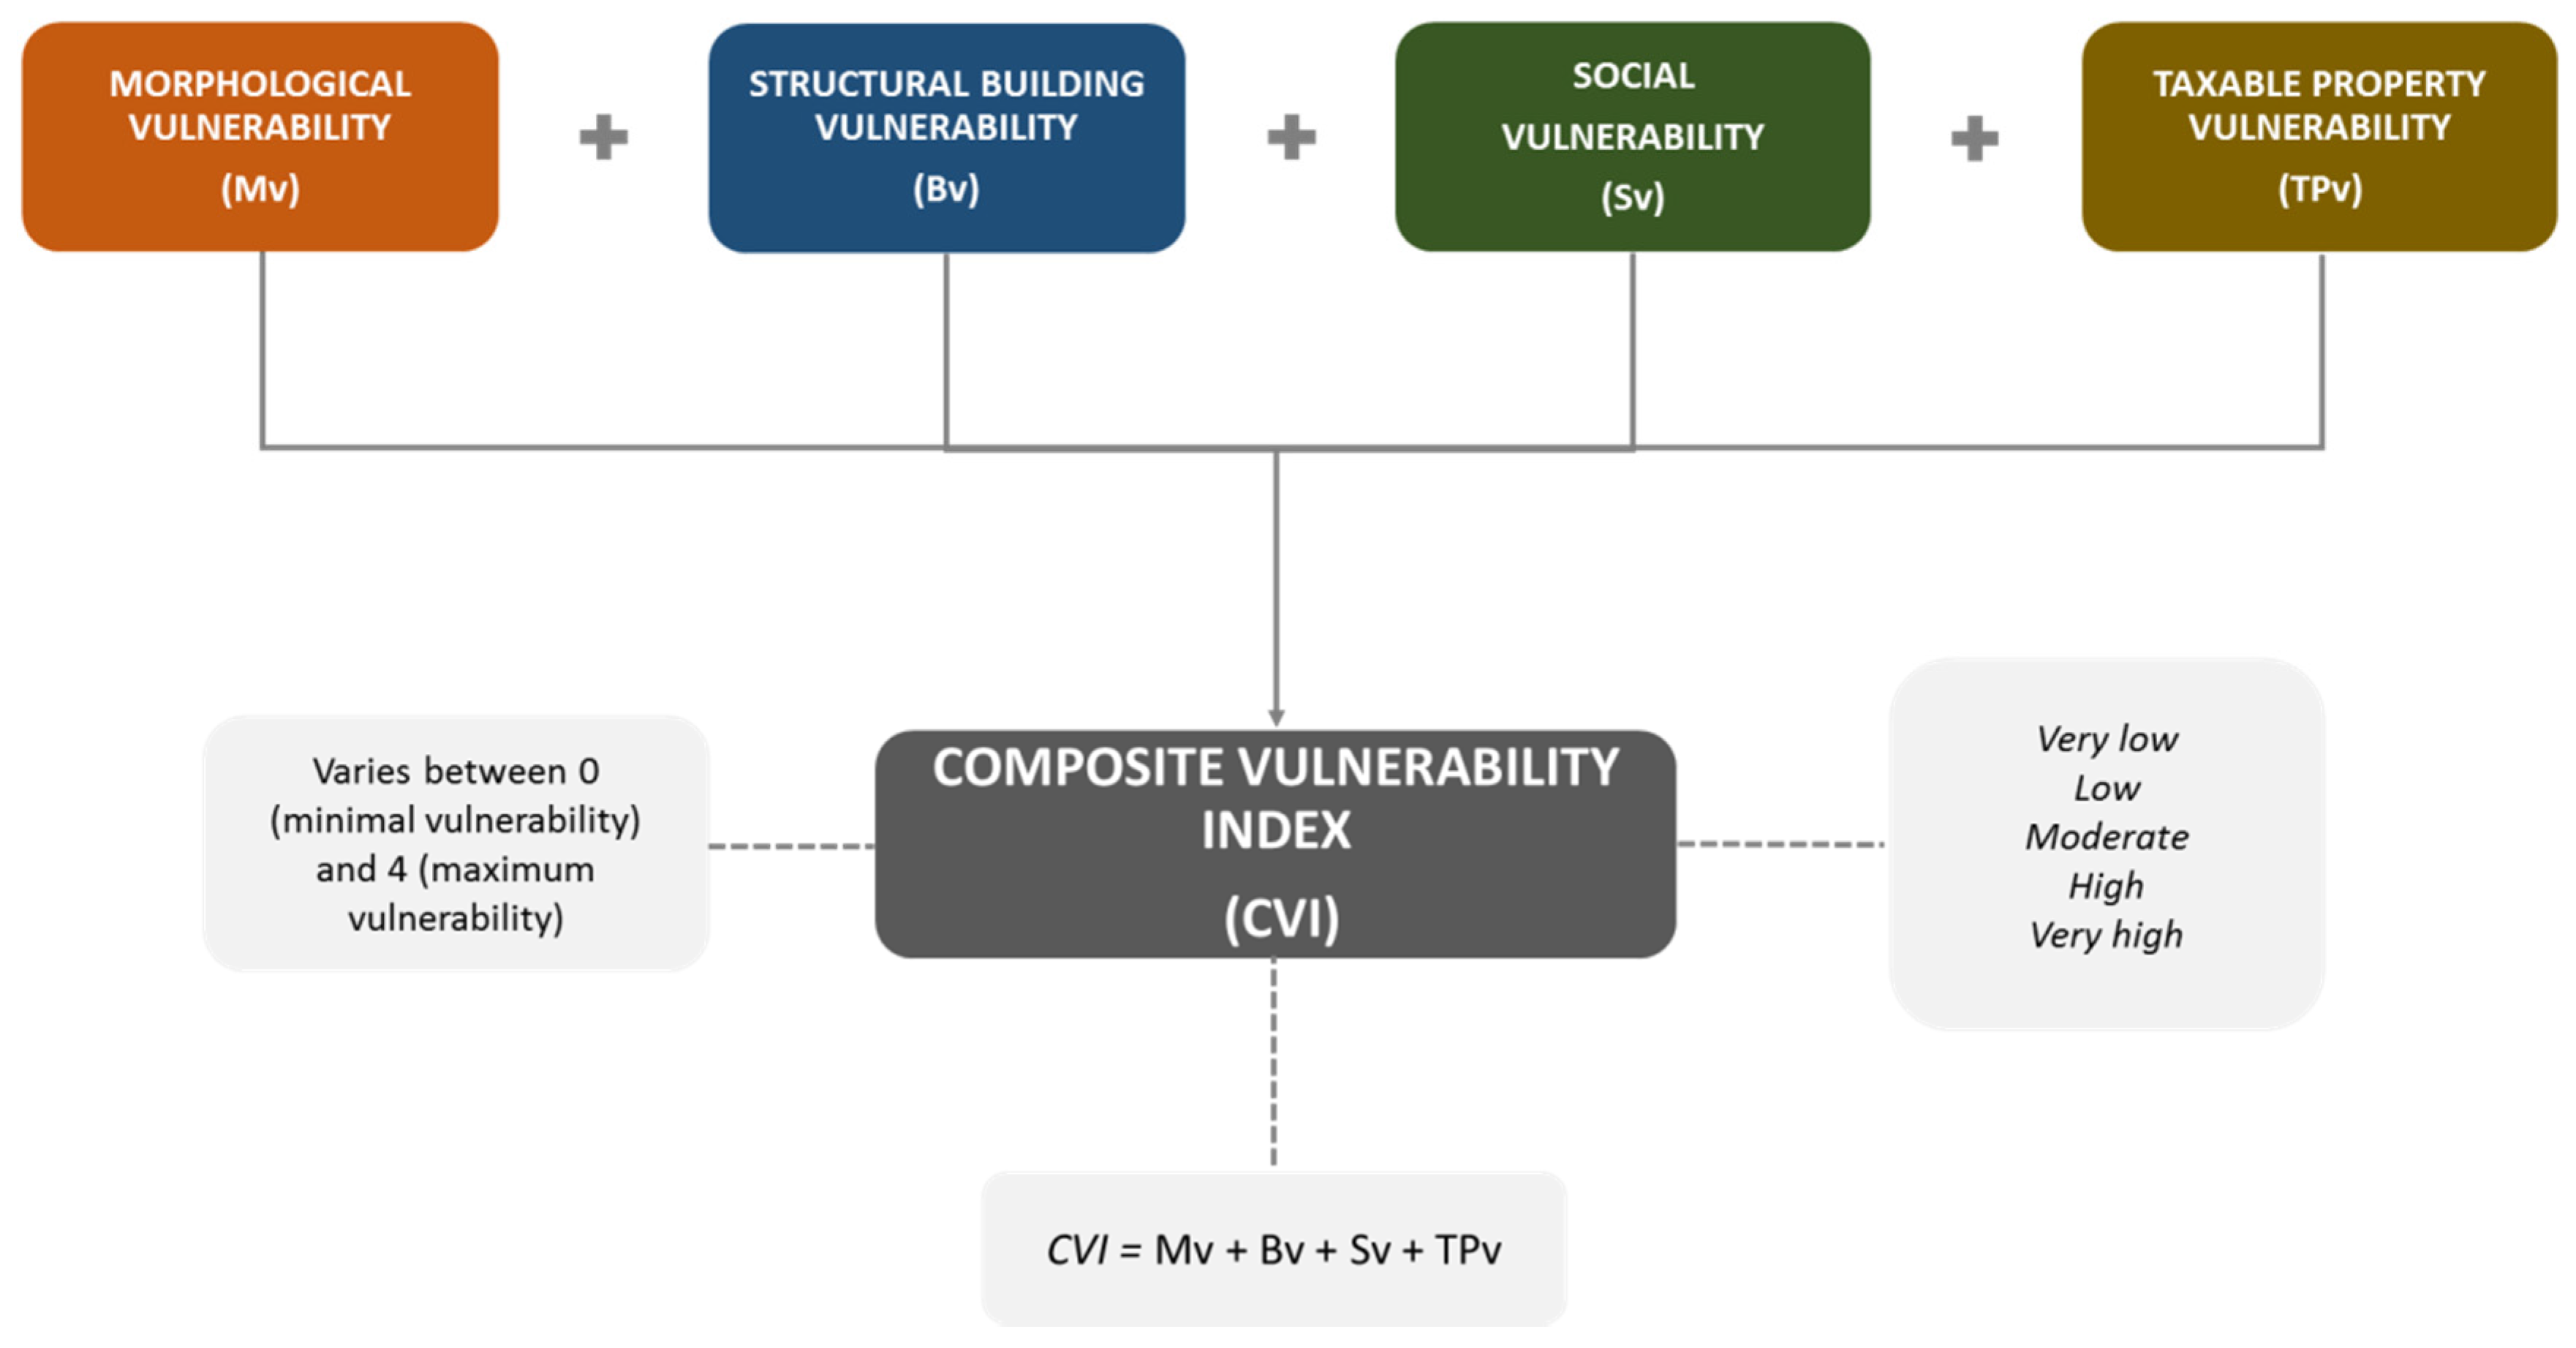
  • Calculation and cartographic representation of the vulnerability indices for the four analysis factors (morphological, structural, social and tax characteristics).
  • Calculation and cartographic representation of a Composite Vulnerability Index (CVI) using different classification levels.
  • A comparison of the tsunami vulnerability classification for the different studied areas and their relation to territorial features.
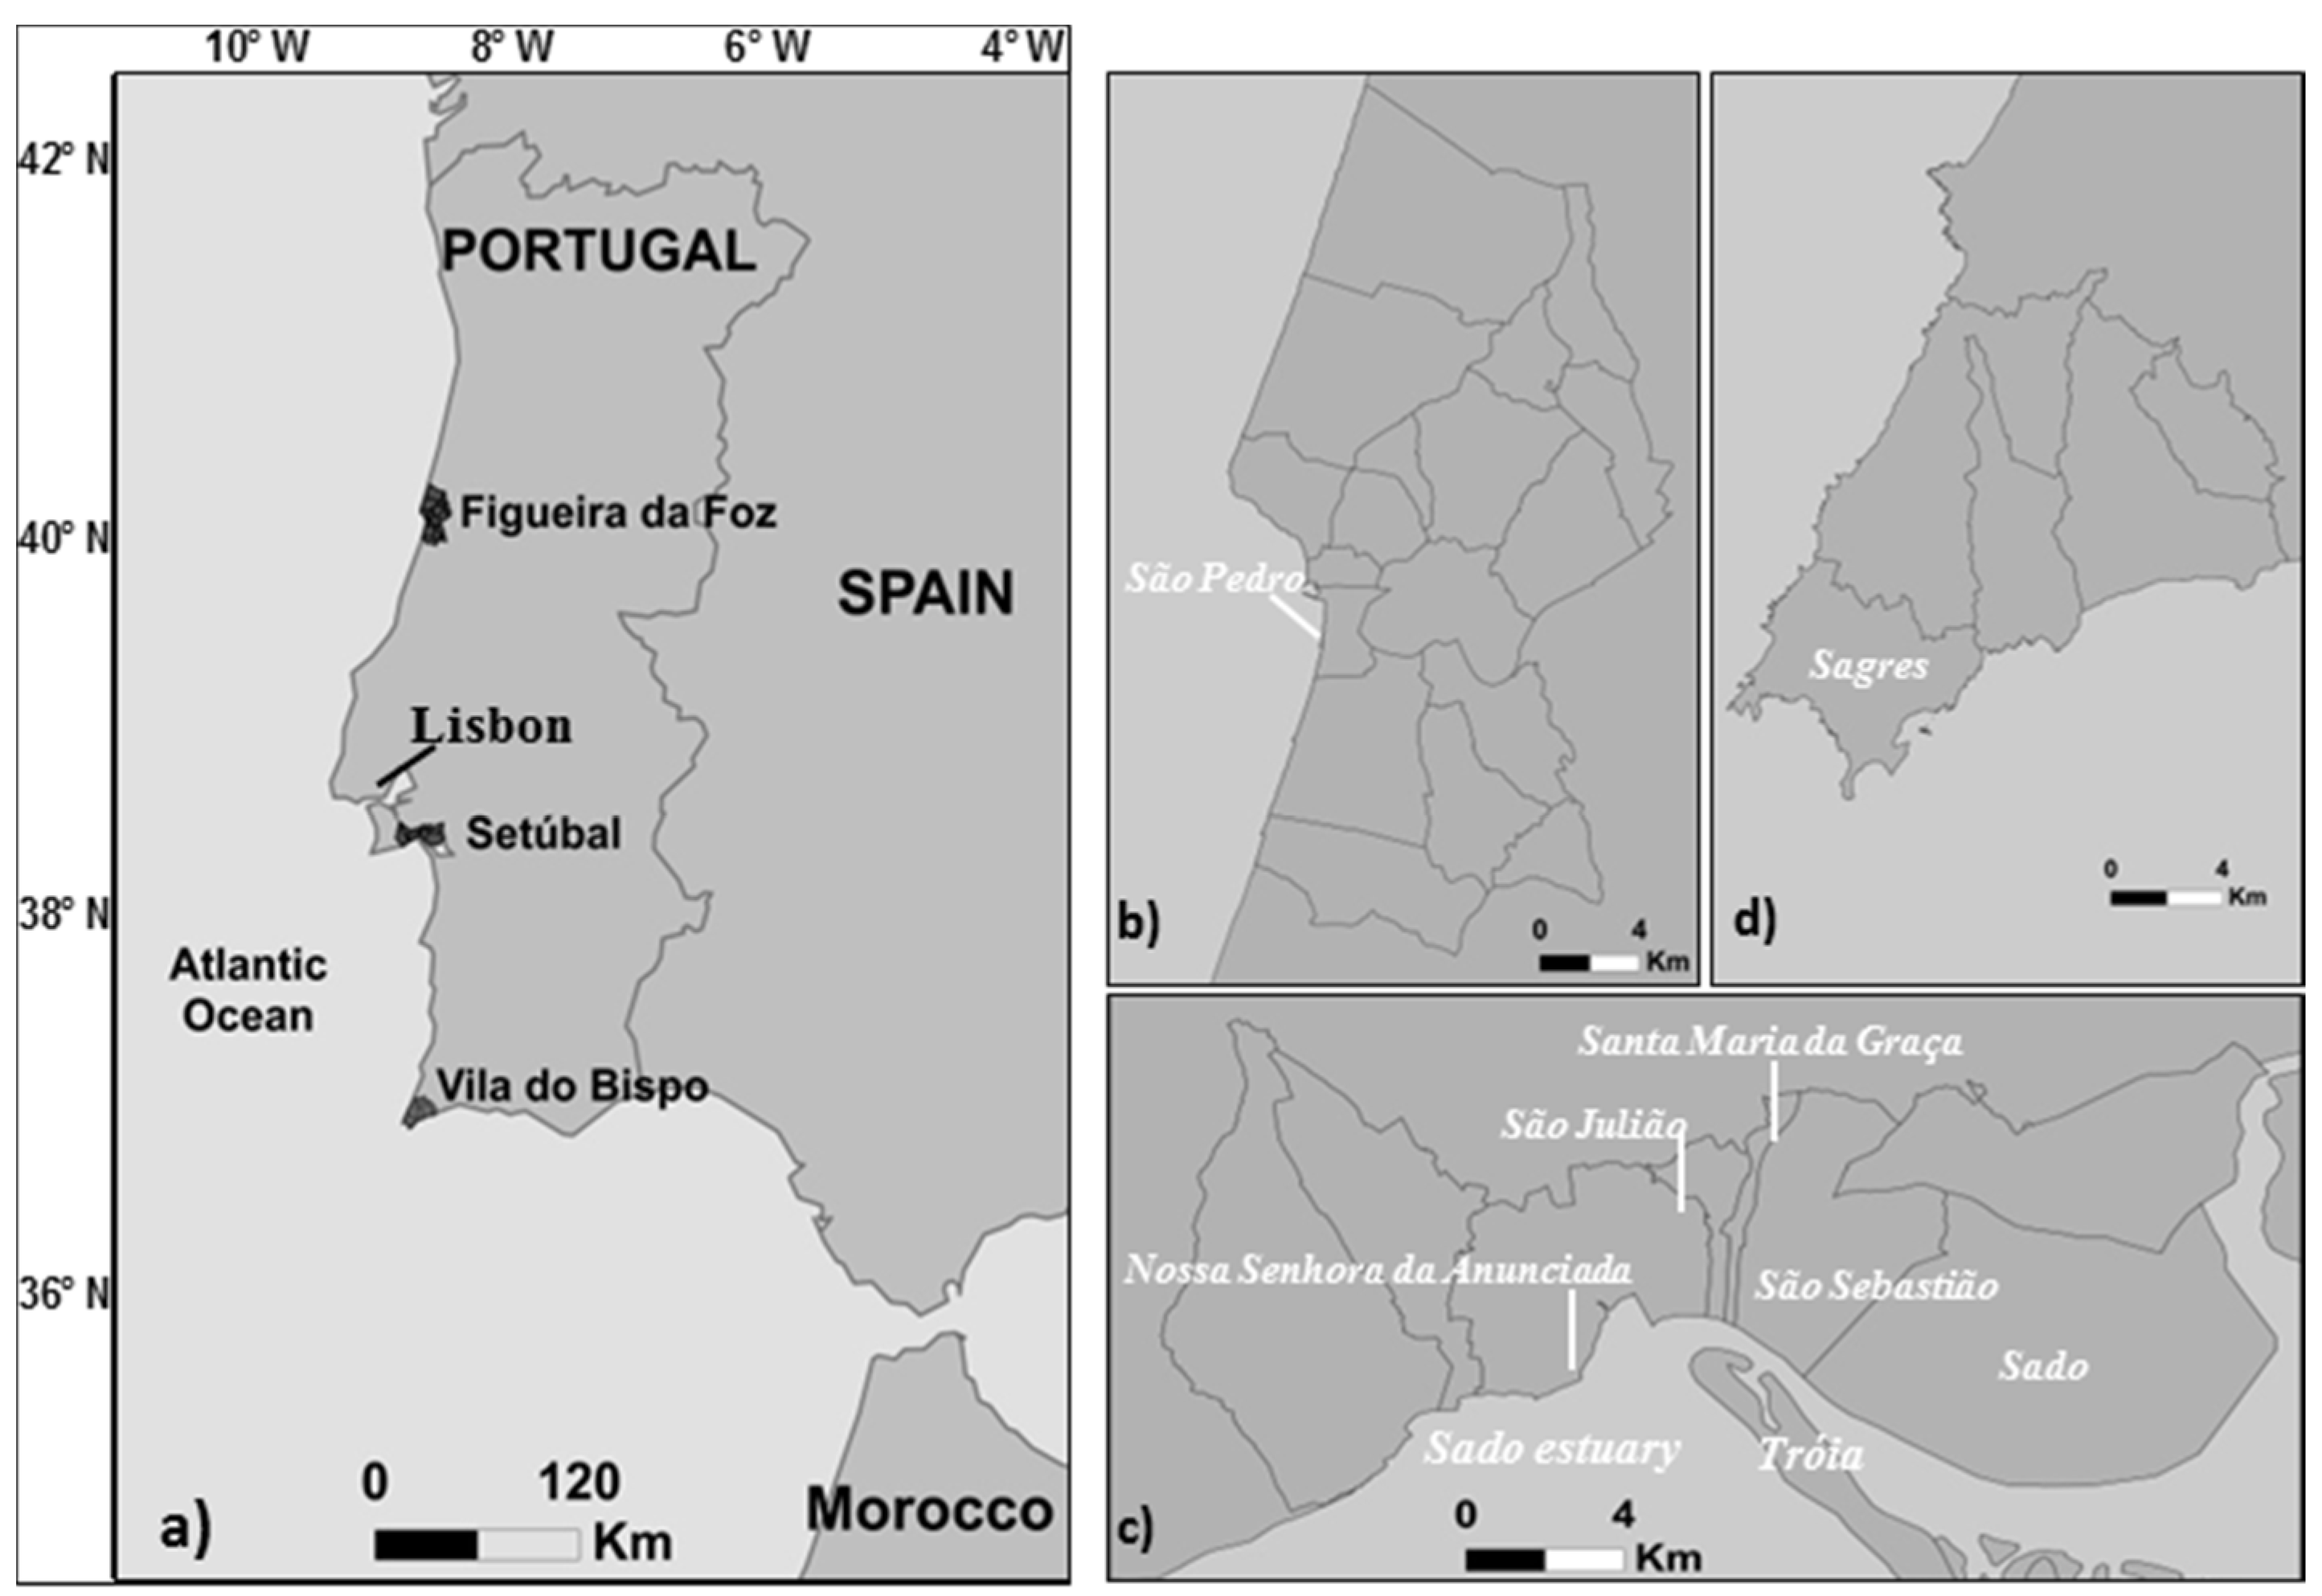
With this approach, we intend to assess the characteristics of the territory subject to potential tsunami inundation impact. We seek to evaluate both structural elements potentially exposed as the social and economic dimension of the affected study areas. This knowledge will allow the resource scale for prevention and mitigation, as well increase the warning, alert, rescue and emergency effectiveness.

1.2. Study Areas

The study area was defined by overlaying the worst-case scenario inundation results (where the maximum water level is related to the mean sea level) from the numerical tsunami model obtained by [2], with the statistical subsections from Censos 2011 [17]. Three distinctive land-uses were selected for analysis: beach-use areas (Cabedelo and Martinhal), residential neighborhood (Cova Gala and city of Setúbal) and industrial (Outão and industrial zone of Setúbal). Each land-use was represented by two sites from Figueira da Foz, Setúbal and Vila do Bispo municipalities.

1.2.1. Beach-Use Areas

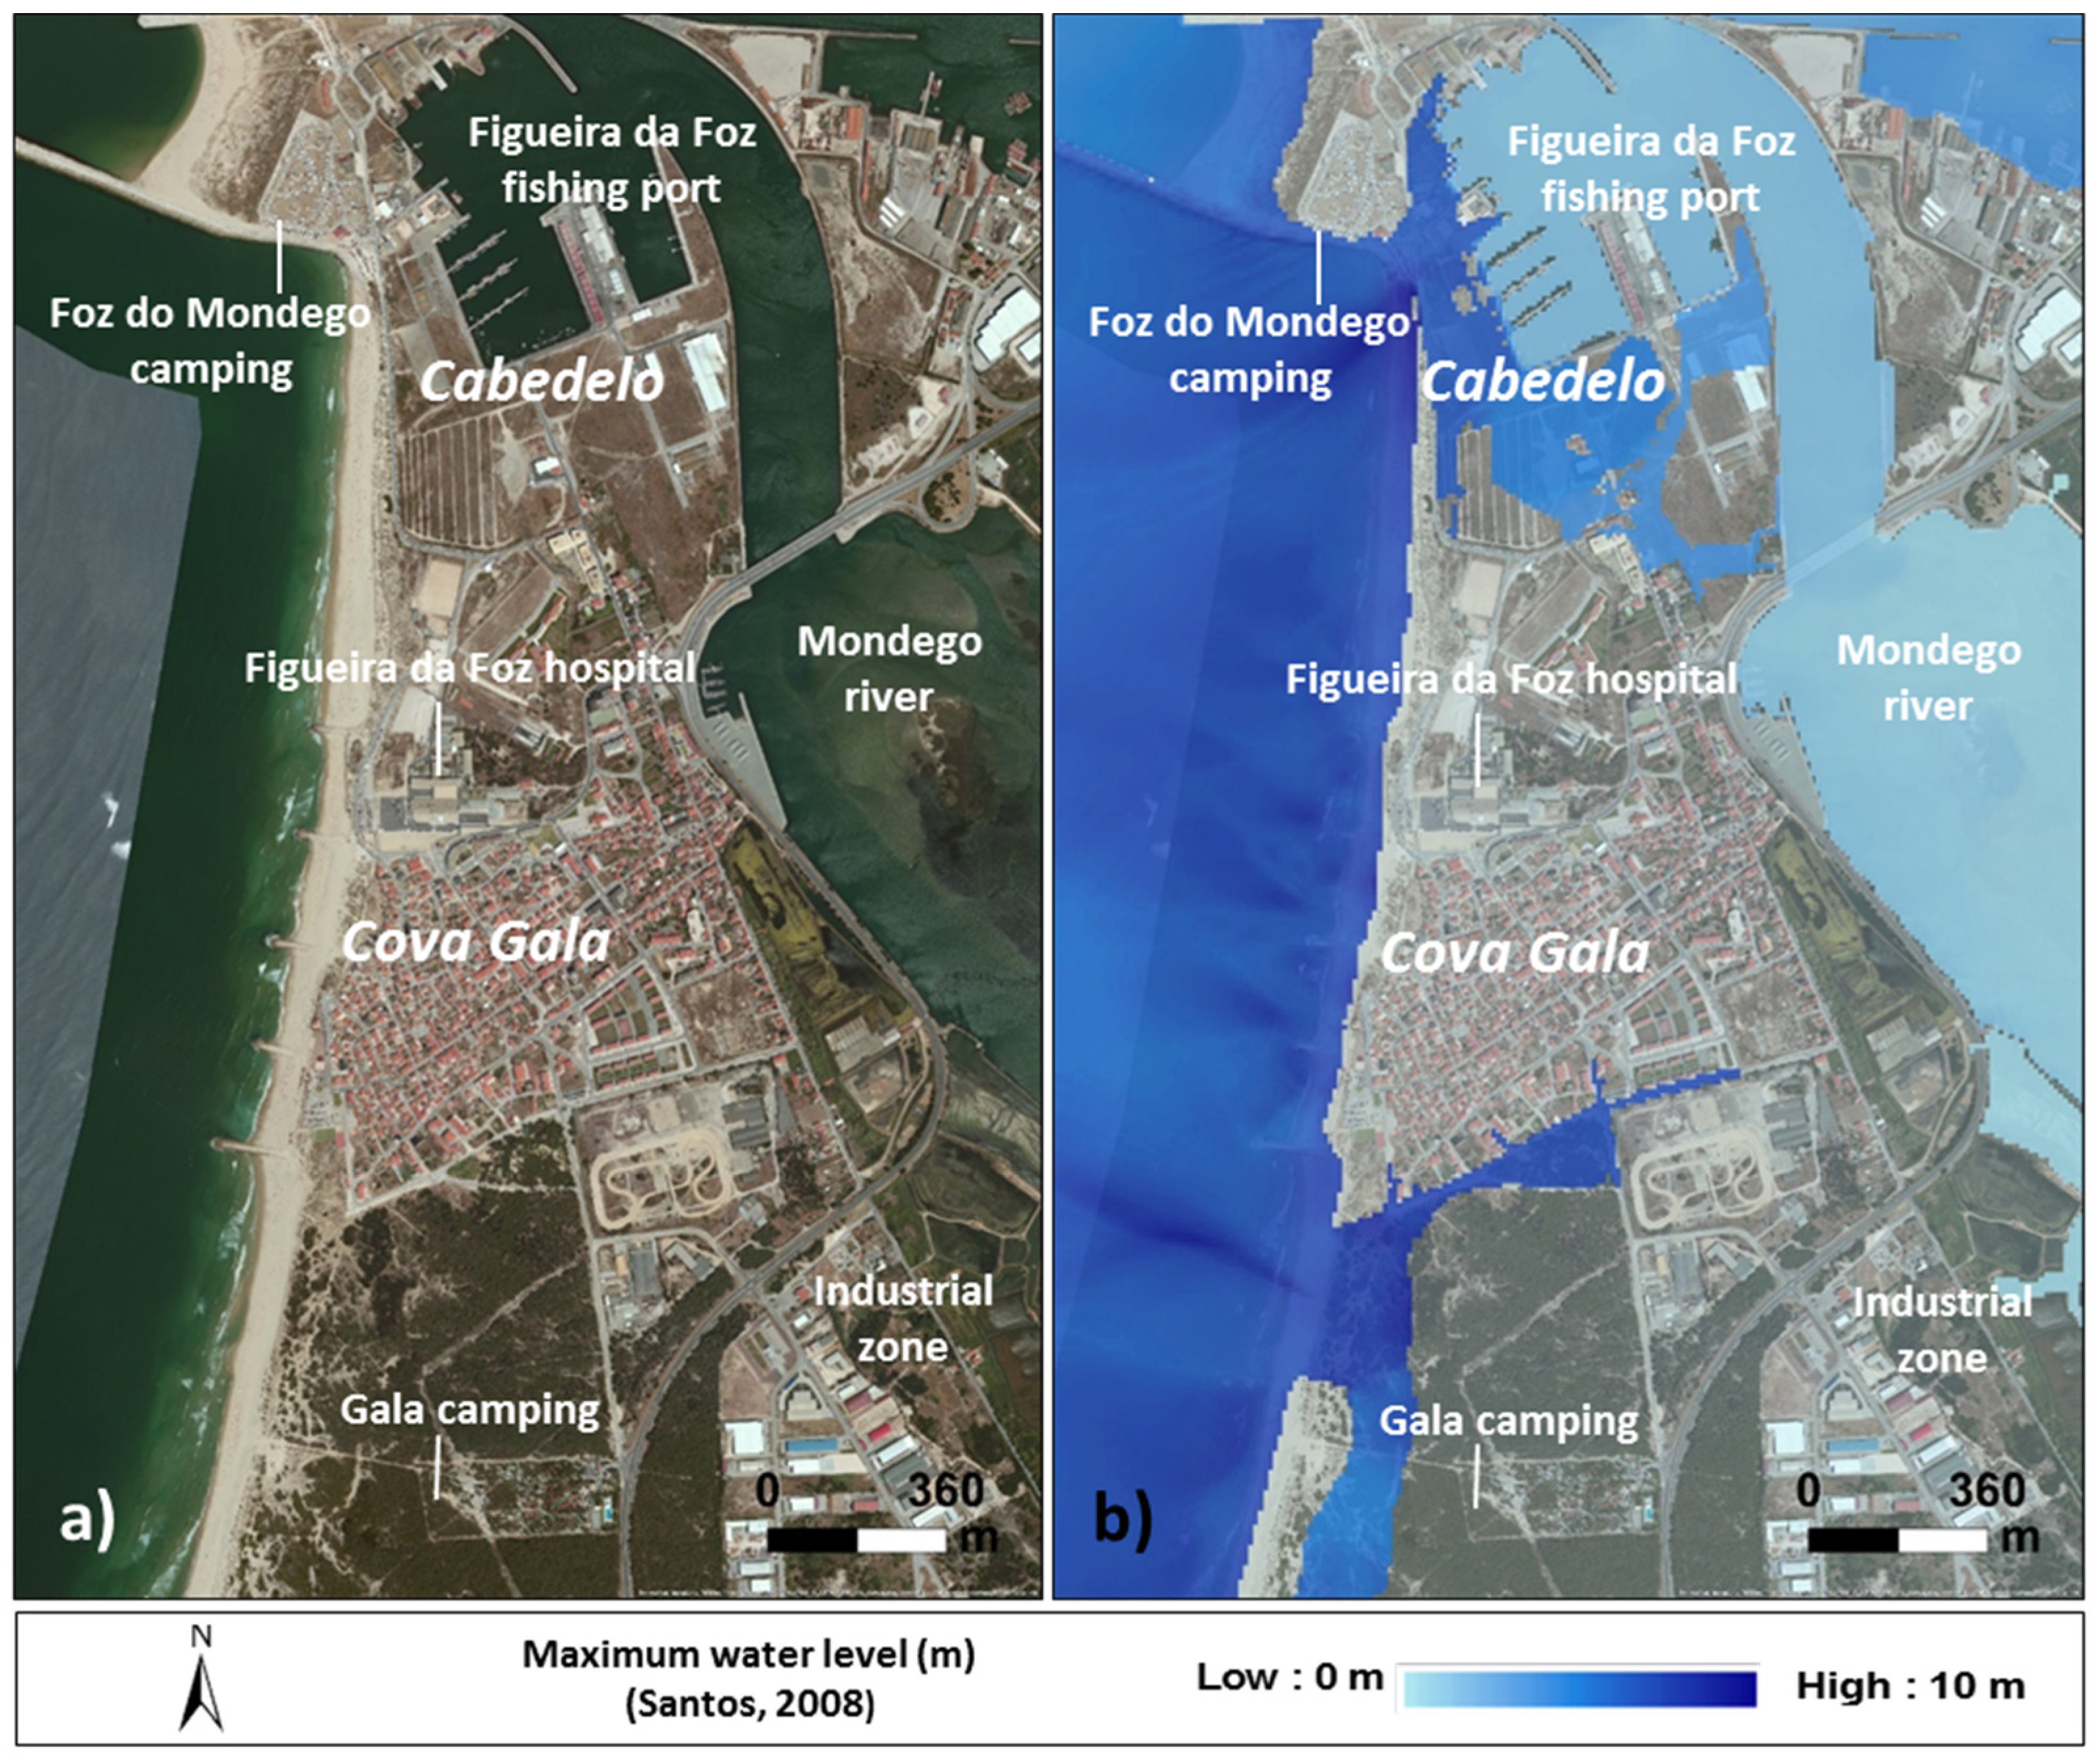
Cabedelo (Figueira da Foz Municipality)

Cabedelo is a seaside area located in central Portugal in the parish of São Pedro (Figure 1b). The parish is located in the northern Cova Gala population cluster (Figure 2) of Figueira da Foz municipality. The municipality consists of 18 parishes distributed over an area of 379 km2. The municipality is home to 62,125 inhabitants and has a population density of 163.3 hab/km2, a total of 24,893 buildings and 43,300 lodgings [17]. The parish of S. Pedro has an area of approximately 7 km2 with a resident population of 2910 people and a population density of 415.1 hab/km2 [17]. However, the number of residents and non-residents increases considerably during the summer season [18].
Cabedelo is distinguished by a plurality of deployed services. In particular, it has a camping site, coffee shops, restaurants and a surf school, and it is home to the fishing port of Figueira da Foz, shipyards and a group of companies related to the maritime sector.
Figure 2. Cabedelo study area: (a) Satellite imagery from study area; (b) Tsunami inundation from numerical model results for Cabedelo [1].
Water 07 04971 g002

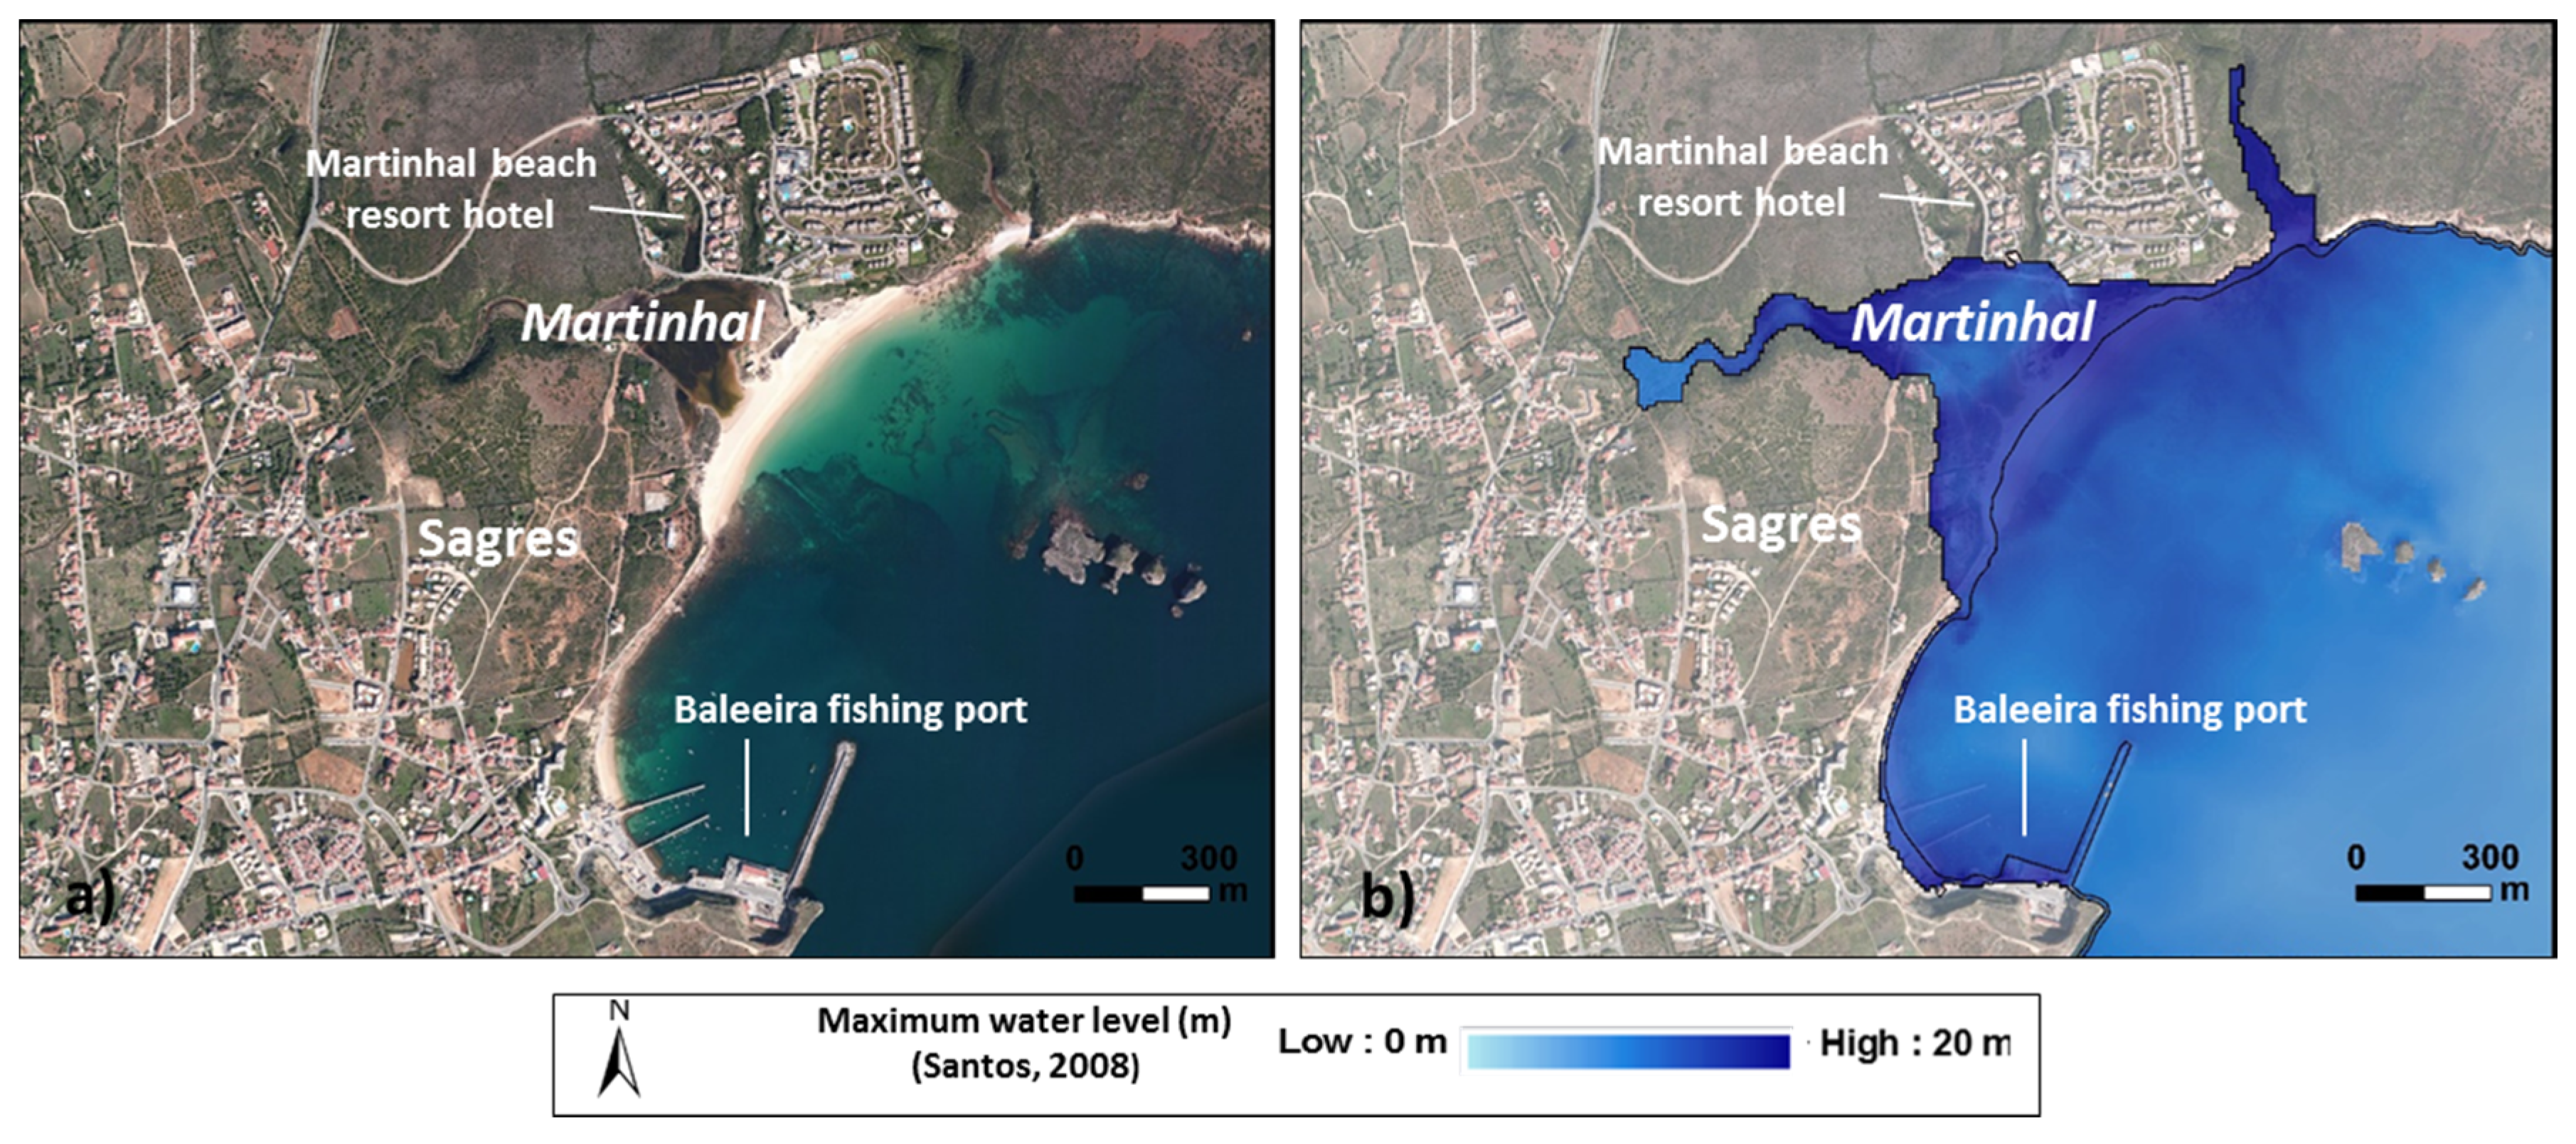
Martinhal (Vila do Bispo Municipality)

The Martinhal beach (Figure 3) is located in Sagres parish (Figure 1d), which is part of Vila do Bispo municipality in the most southwestern zone of Portugal. Martinhal is characterized by seaside tourism dominated by single-family residences that cater to tourists or serve as second homes.
Vila do Bispo municipality contains five parishes and is 179 km2. According to the 2011 Census, the municipality has 5381 inhabitants, with a population density of 29.2 hab/km2 [17]. The municipality has a total of 5184 buildings and 5979 lodgings [17]. Sagres parish has 1909 inhabitants, is 34.28 km2, and has a population density of 55.7 hab/km2 [16]. Martinhal stands out as a tourist retreat and is almost exclusively devoted to tourism. The Martinhal Beach Resort & Hotel is almost exclusively responsible for all of the buildings within the analyzed area. This area is also characterized by a marked seasonal population.
Figure 3. Martinhal study area: (a) Satellite image from study area; (b) Tsunami inundation from numerical model results for Martinhal [2].
Water 07 04971 g003

1.2.2. Residential Neighborhoods

Cova Gala (Figueira da Foz Municipality)

Cova Gala is a population cluster located on the left bank of the Mondego River, in the São Pedro parish (the same parish where Cabedelo is located) of Figueira da Foz municipality (Figure 2). In recent decades, the parish of São Pedro, especially the area of Cova Gala, has undergone considerable territorial and socio-economic changes. Once characterized by its intrinsic link to fishing, the importance of this sector has been reduced over the last four decades. The implementation of various industries in the parish and neighboring areas, as well as the opening of the Hospital District of Figueira da Foz, the implementation of a set of services and the consequent development of the tertiary sector and the development of tourism, have all led to profound changes in the area and an increase in the resident population. These facts led to the elevation of São Pedro—Cova Gala from an agglomeration to a town in 2009.

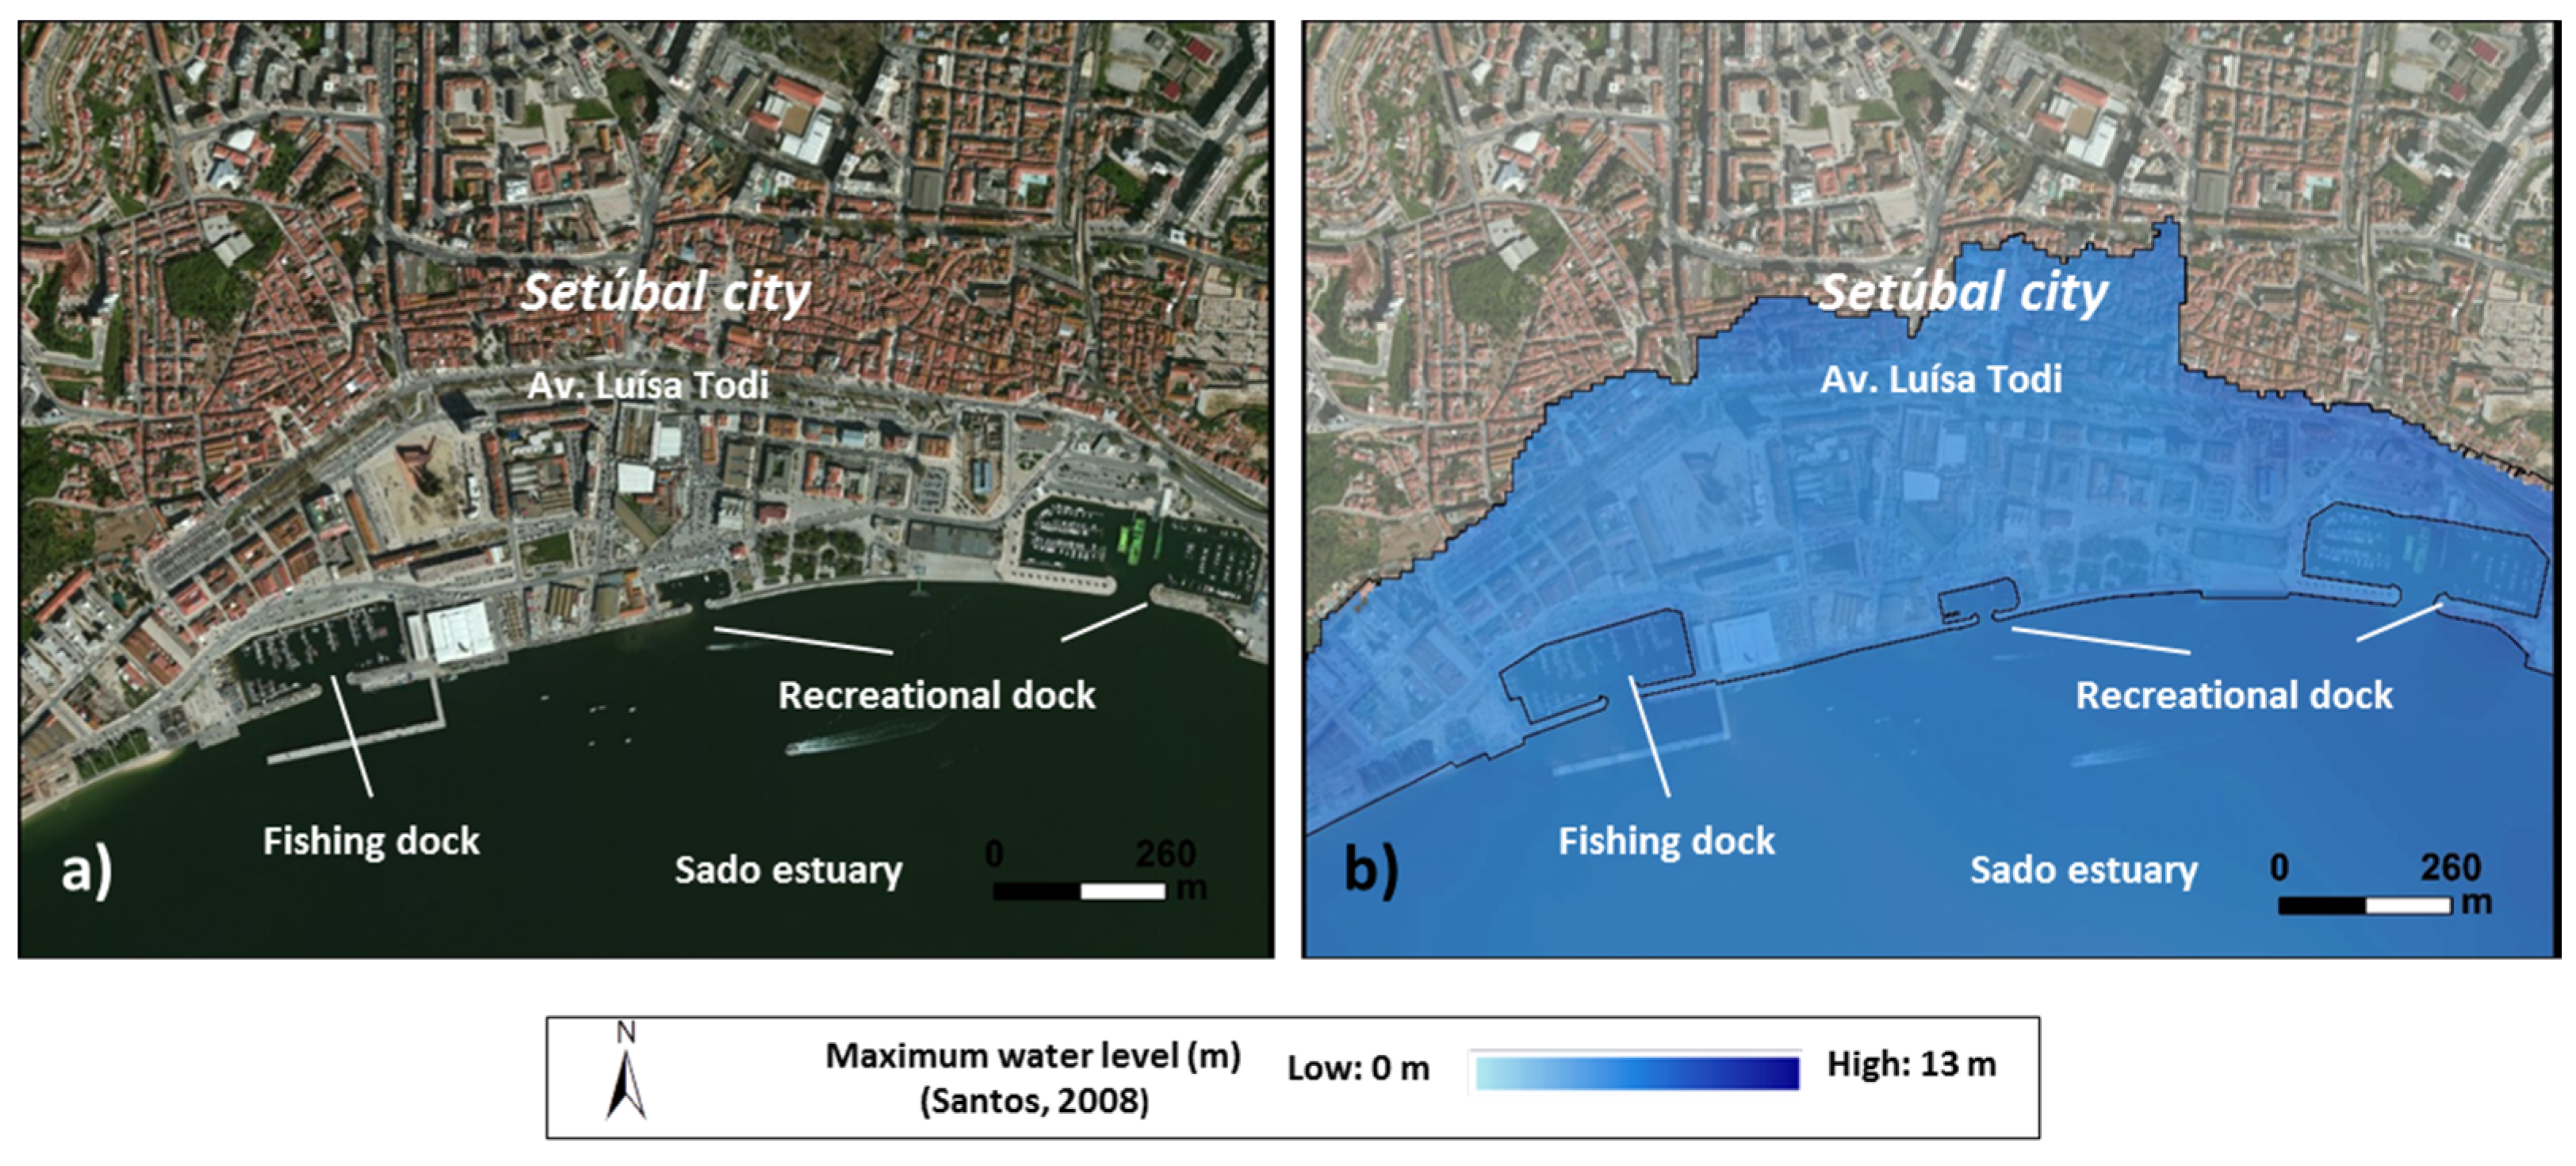
City of Setúbal (Setúbal Municipality)

The other residential neighborhood analyzed in this study is the riverside urban area of the Sado estuary in the city of Setúbal (Figure 4). The municipality of Setúbal is located in the metropolitan area of Lisbon, is 172 km2 [17] and is divided into eight parishes. The municipality has a total of 121,185 inhabitants and a population density of 698.9 hab/km2. In national terms the city of Setúbal is a medium-sized city and is one of the primary national economic centers. It contains commercial and industrial sectors and is an example of the diversity of infrastructure and distribution of facilities along the coast [12].
In terms of use and occupied land, the study area contains residential features, as well as areas allocated to services, commerce and activities related to industry and fishing. According to [19], the area can be divided into four sectors based on deployed equipment and infrastructure: (1) Near the riverfront, which is dominated by support infrastructure for fishing and commercial activities; (2) From the riverfront to Av. Luisa Todi, which is dominated by equipment and infrastructure related to the port of Setúbal, civil protection, services, catering and some residential buildings; (3) Av. Luisa Todi, which is dominated by green spaces; and (4) The historic center of Setúbal, which is characterized by residential buildings and spaces for food services and commerce.
Figure 4. Setúbal study area: (a) Satellite image from study area; (b) Tsunami inundation from numerical model results for Setúbal [2].
Water 07 04971 g004

1.2.3. Industrial Areas

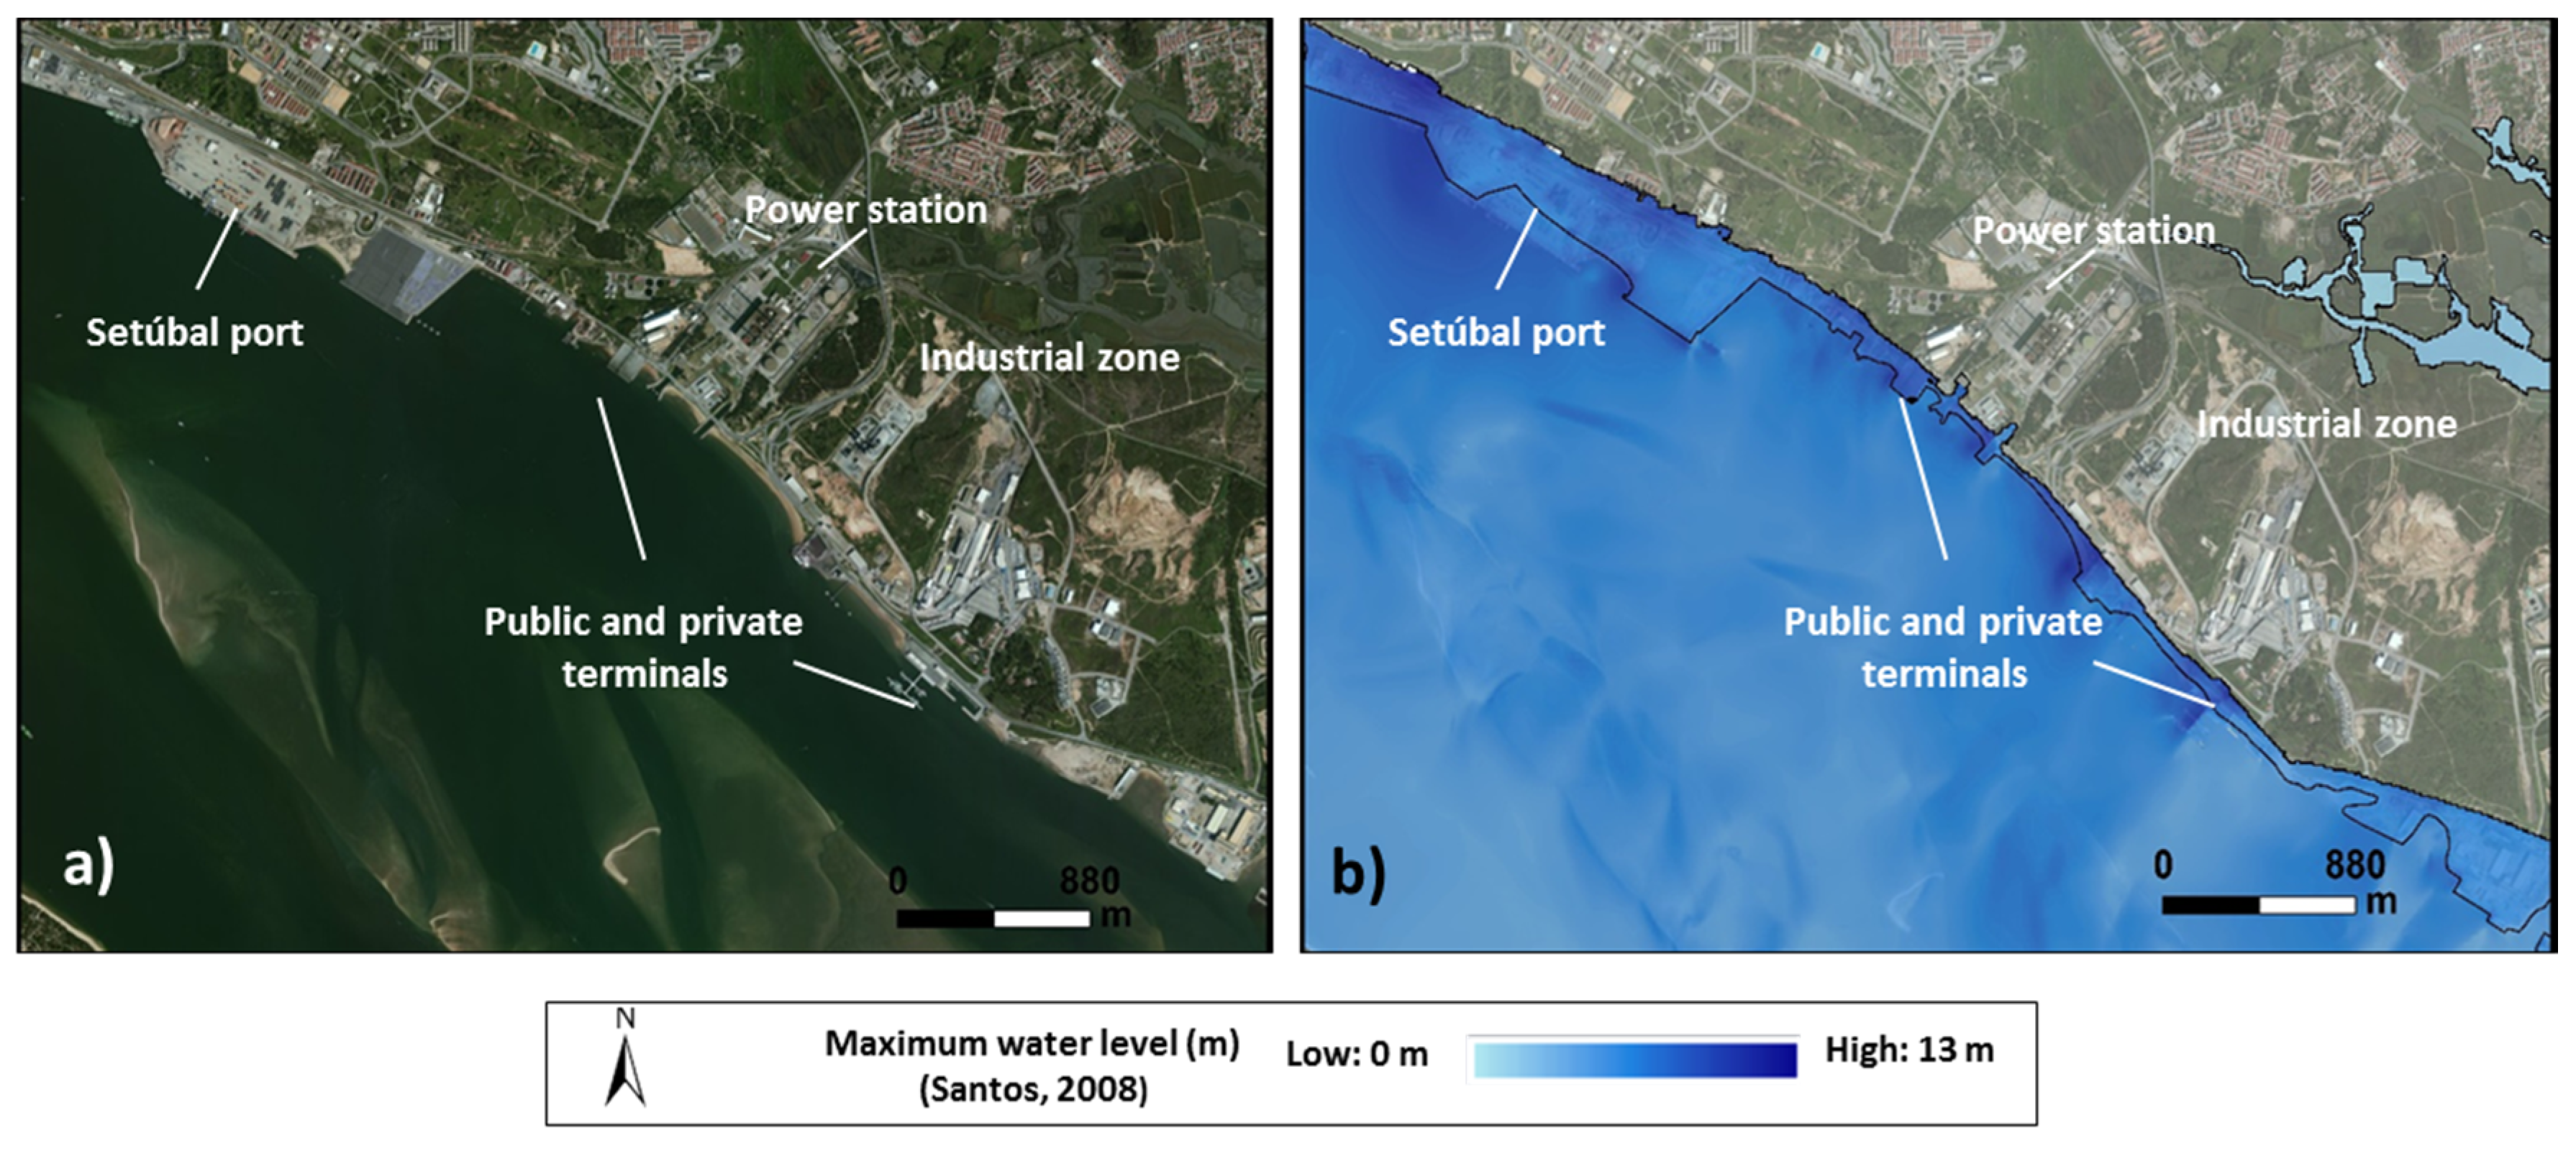
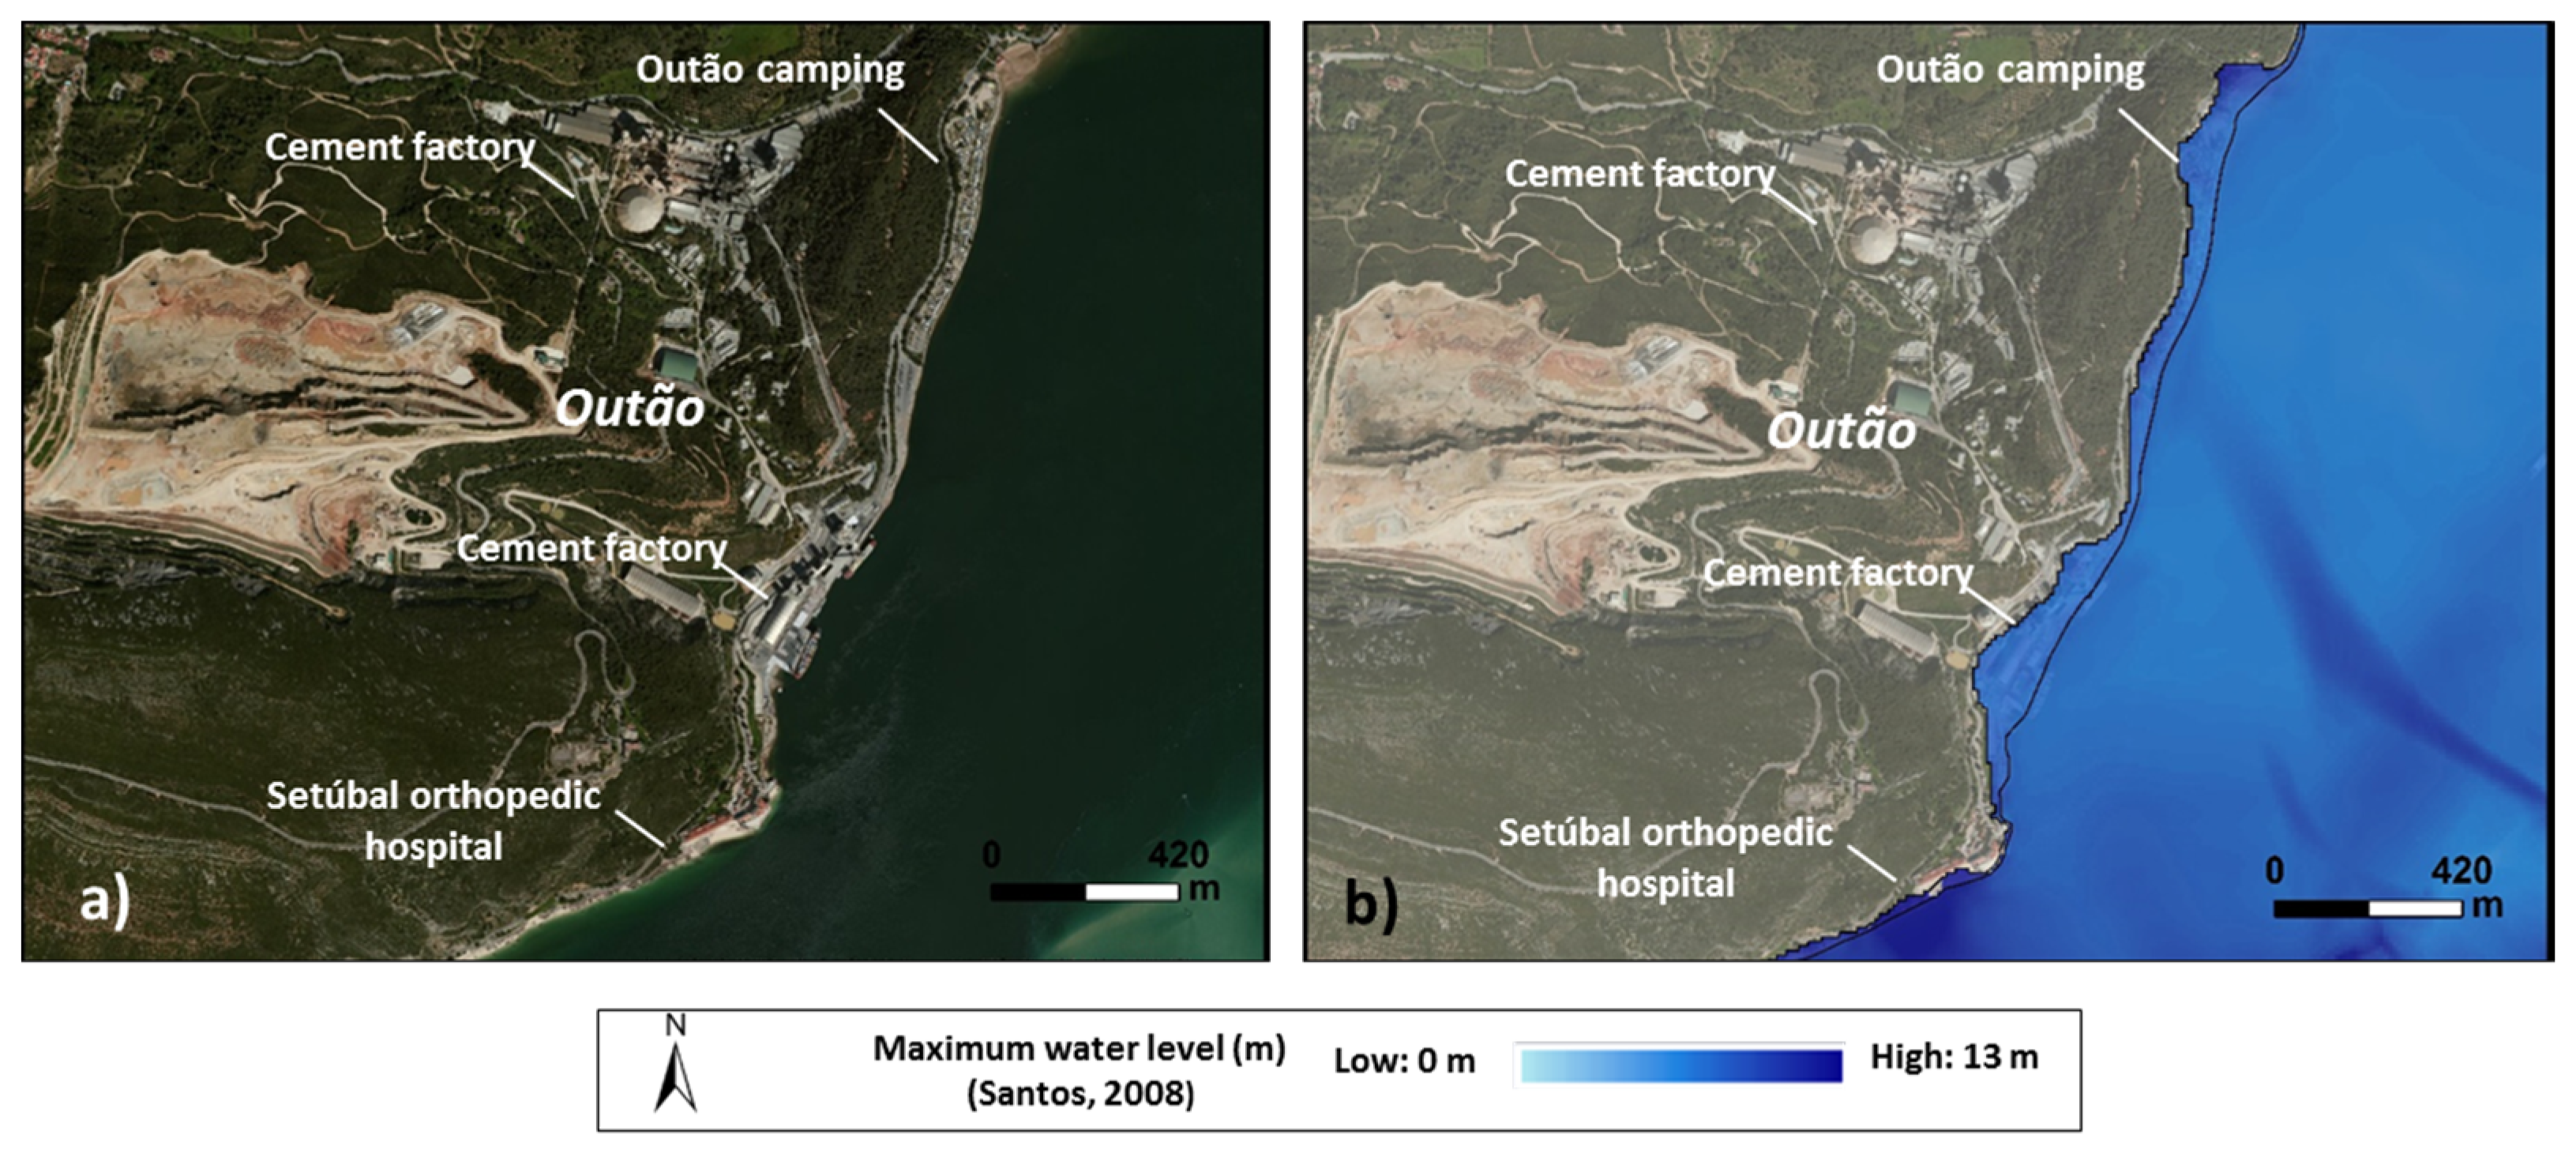
Outão (Setúbal Municipality)

Outão is located in Arrábida Natural Park in the parish of Nossa Senhora da Anunciada in the southwestern section of Setúbal municipality. The focus of this area is its cement industry, which clearly delineates the region from an environmental, landscape and socio-economic point of view (Figure 5).
Figure 5. Outão study area: (a) Satellite image from study area; (b) Tsunami inundation from numerical model results for Outão [2].
Water 07 04971 g005
The area is characterized by industry and services, including the Setúbal orthopaedic hospital, but and also the camping of Outão. It has a distinct non-resident population, and there is significant daily flow into and out of the area.

Industrial Zone of Setúbal (Setúbal Municipality)

The other industrial area analyzed (Figure 6), which includes the riverfronts of São Sebastião and Sado parishes and extends from the end of the port to the beginning of the peninsula of Mitrena. It has an area of 1.25 km2. Diverse deployed infrastructure, ranging from a power station and a wide variety of chemical industries to support infrastructure and various port activities characterize this area. This area as well as neighboring areas has a high density of road infrastructure. The resident population is unique among the studies sites in that it is composed of a set of informal settlements and structurally degraded buildings in the surrounding areas of the old industrial complex.
Figure 6. Industrial zone of Setúbal study area: (a) Satellite image from study area; (b) Tsunami inundation from numerical model results for the industrial zone of Setúbal [2].
Water 07 04971 g006

2. Data and Methods

A new multidimensional approach has been developed to tsunami risk management by combining four components of vulnerability analysis: morphological, structural, social and tax components of vulnerability. These factors were selected based on previously studies: morphologic component [20,21]; structural component [22]; social component [23,24,25,26] and allocation component based on property taxes [27]. The analysis of the different vulnerability occurred at the municipal level (social and tax component) and local level (morphological and structural component). At the municipal level, the unit of analysis is the parish, and at the local level the unit of analysis is based on the inundated area as identified from the numerical tsunami model.
The analysis will culminate with the calculation of a Composite Vulnerability Index (CVI), which combines the four vulnerability components discussed above. All vulnerability indices (the four individual components and the final composite index) vary from very low to very high in accordance with the standard deviation and the following categories: “very low”, <1 SD; “low”, ≥−1 to −0.5 SD; “moderate”, ≥−0.5 to +0.5 SD; “high”, ≥0.5 to 1 SD; “very high”, ≥1 SD [23].

2.1. Social Assessment (Sv)
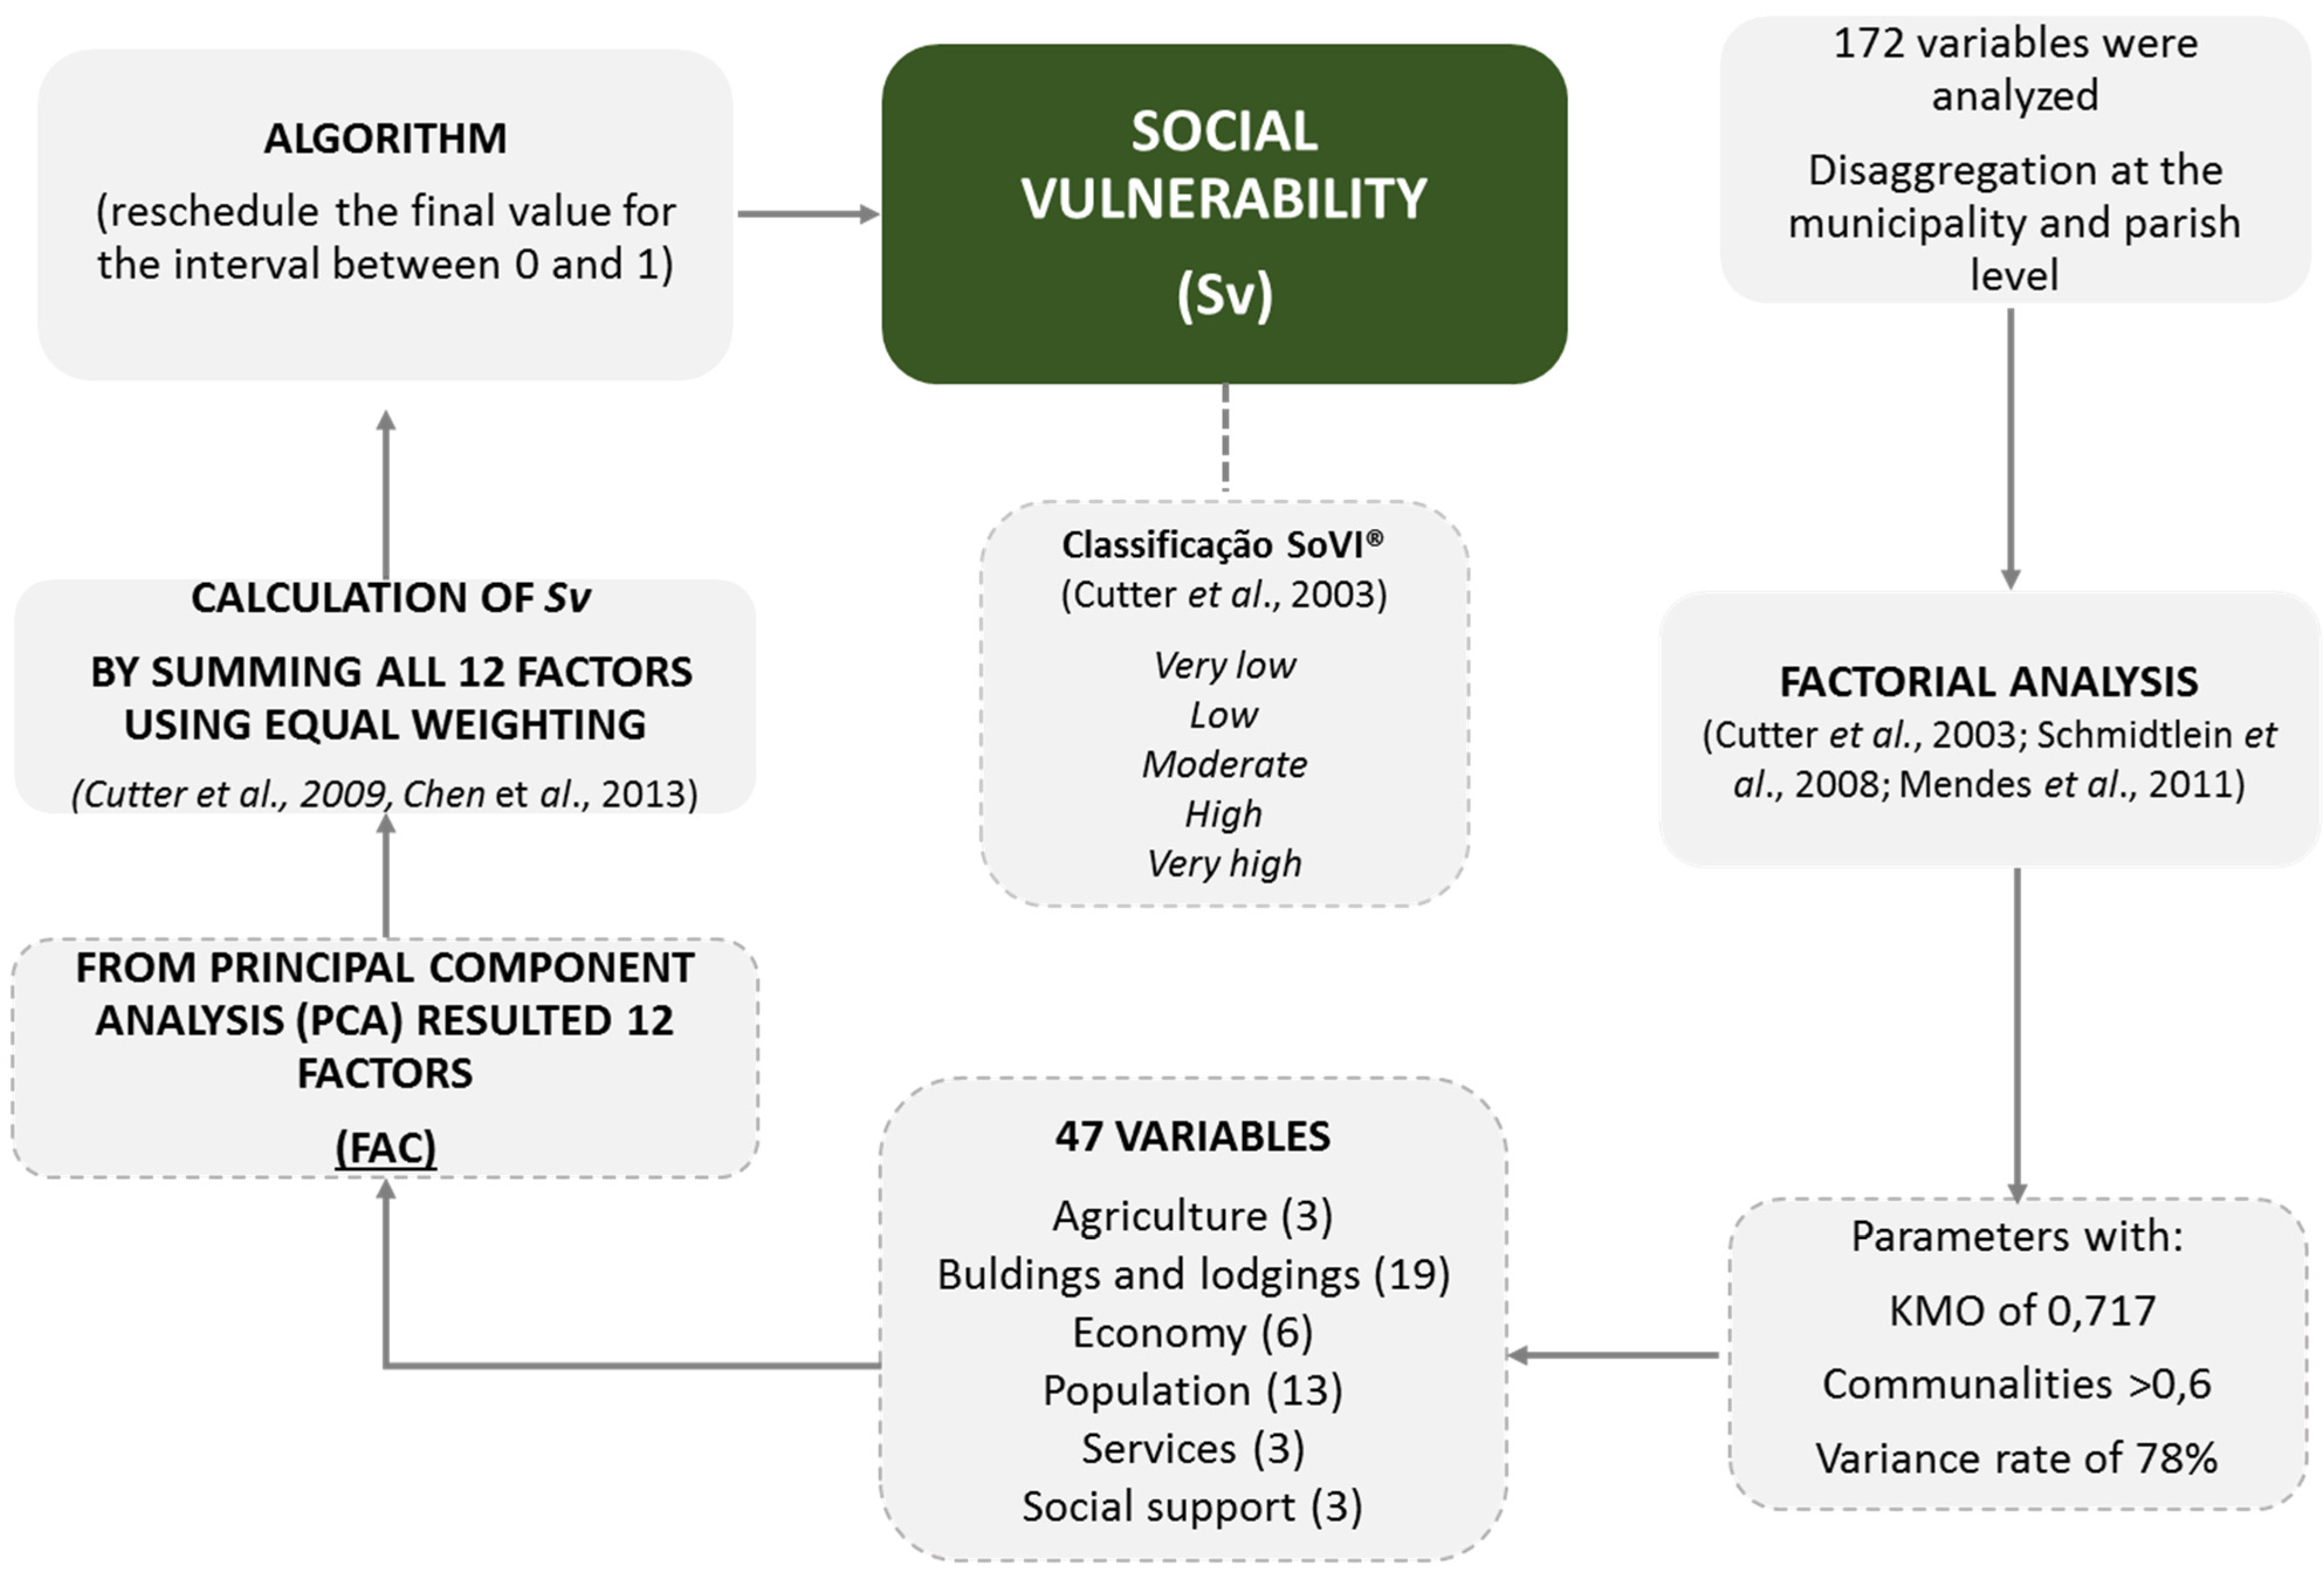
Social vulnerability was calculated using a factor analysis that has been applied by several authors [23,24,25,26], with some adaptation at the local scale. An initial set of 172 variables were analyzed and disaggregated at the municipality and parish levels (Figure 7). Data for these variables was collected from the 2011 National Census and the database of the National Statistical Agency [17], the PORDATA database [28] and the local Social Charter [29].
Figure 7. Graphical process of social vulnerability calculation. [23,24,25,26]
Water 07 04971 g007
A total of 15 municipalities and a sample of 88 parishes were incorporated in the analysis to strengthen the results. A Principal Component Analysis (PCA) was performed, by using SPSS software. After the data correlation matrix was derived, all of the values with a correlation greater than 0.7 were eliminated. The PCA analysis was repeated to achieve a set of parameters with a KMO (Kaiser–Meyer–Olkin, a measure of sampling adequacy that test the overall consistency of the data) of 0.717, more than 0.6 commonalities and a variance rate of 78% [30] for a set of 47 variables (Figure 7) [31]. A total of 12 principal variables (FAC) that best explain social vulnerability to tsunamis were finally extracted from the PCA [23,24,32]. The resulting social vulnerability index (Sv) was produced by summing all 12 factors using equal weighting, according to [23,26]. An algorithm was then applied to reorganize the values from 0 and 1. Following the classification system SoVI® (Columbia, SC, USA) recommended by [23], vulnerability was organized by standard deviation, as mentioned previously.
The matrix of components resulting from the factorial analysis allowed for the selection of a set of six primary components (FAC) representing 61.7% of the total variance (Table 2). Each of the FAC’s is characterized based on the explanatory variables included therein. Each of the explanatory variables can positively (+) or negatively (−) influence the FAC, as appropriate. The remaining six components were not considered because they contributed residual values to the total variance.
Table 2. Social vulnerability components.
FACName of ComponentExplanatory VariablesExplained Variance (%)
1Seasonal occupation-Proportion of the foreign population (+)18.9%
-Proportion of the employed population (−)
-Proportion of lodgings (−)
-Proportion of seasonal lodgings (+)
-Proportion of individuals per lodging (−)
2Residential urban centers-Proportion of the population employed in the primary sector (−)15.5%
-Average number of floors per building (+)
-Firefighters per 1000 inhabitants (−)
-Proportion of single parents (+)
-Ratio of the female population (+)
-Proportion of owner housing (+)
3Population dynamics-Average monthly housing rents (+)12.8%
-Rate of population change (+)
-Birth rates (+)
-Proportion of the population that 5 years prior inhabited areas outside the municipality (+)
4Disadvantaged social contexts-Proportion of individuals per household (+)5.8%
-Proportion of overcrowded households (+)
-Proportion of the population between 15 and 24 years of age (+)
-Unemployment rate (+)
5Urban areas with commerce-Proportion of predominantly residential buildings (+)4.4%
-Proportion of buildings that are not exclusively residential (+)
-Proportion of the population working in another parish (−)
6Population dependent of social support-Social support housing (+)4.3%
-Adult population in support institutions (+)
-Childcare institutions (+)
-Longevity index (+)

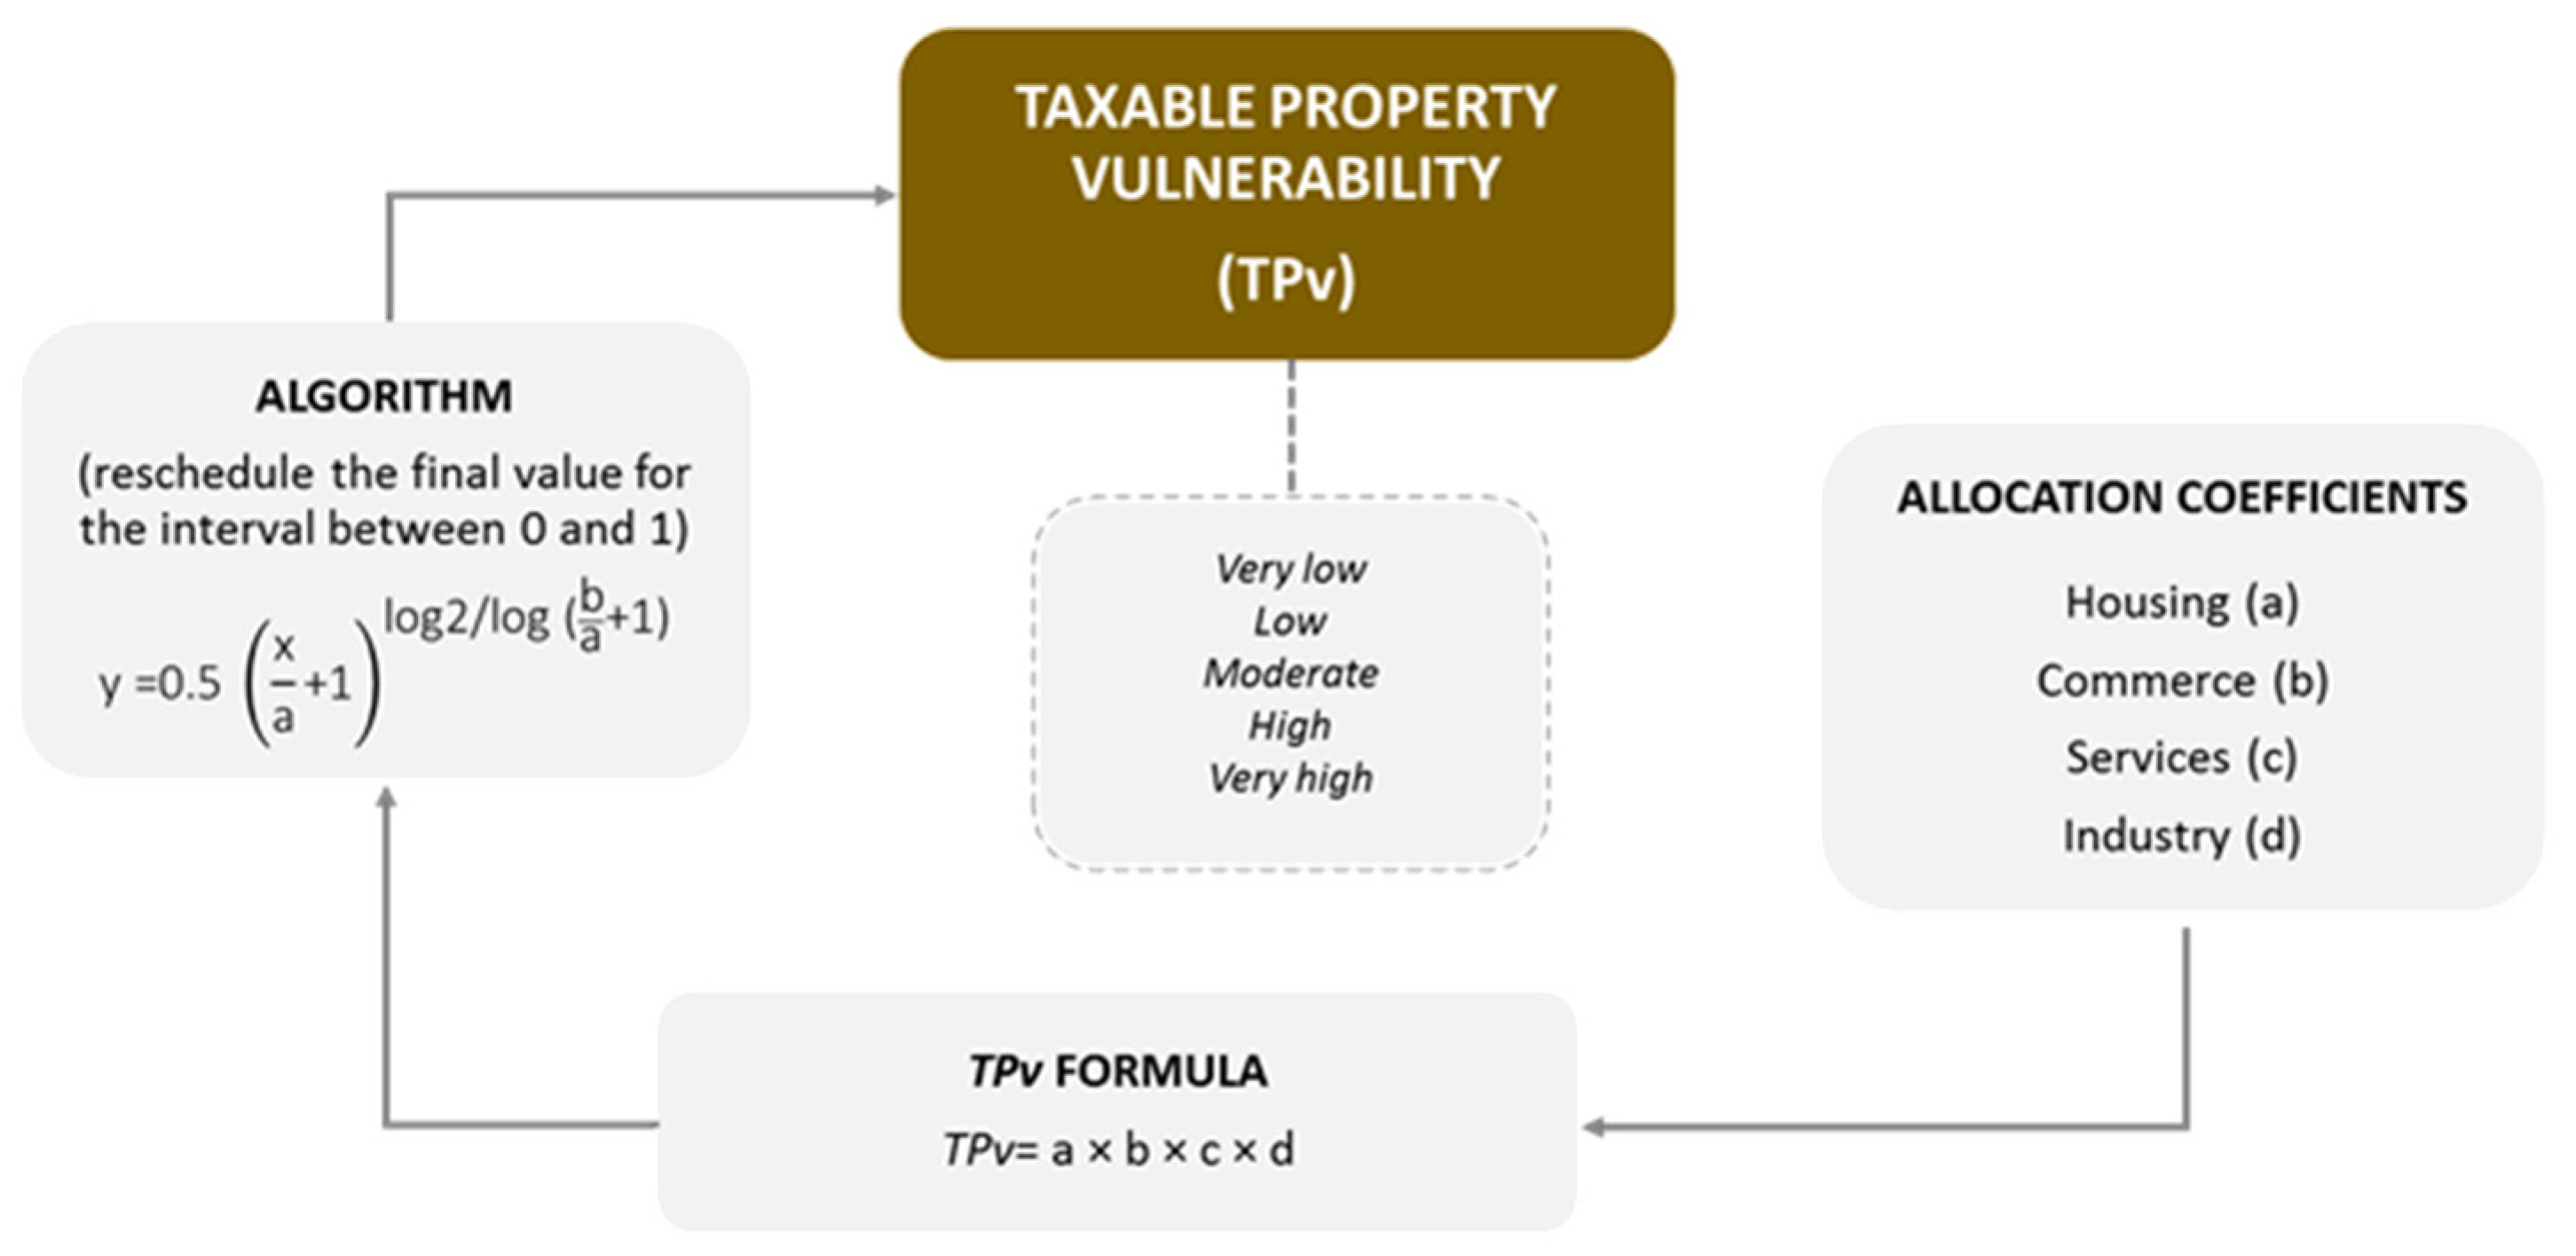
2.2. Taxable Property Assessment (TPv)

A set of four allocation coefficients (Figure 8) was considered for the analysis of the tax factor and served as a basis for the calculation of the Municipal Property Tax. The coefficients were derived from various activities implemented throughout the territory, such as commercial, industrial, housing and services. These data were collected from the Tax and Customs Authority. The incorporation of these new elements reinforced the analysis by providing information about variations within the analyzed territory. The different allocation coefficients for activities enabled the classification and differentiation of each territory based on integrated activities.
The product of the coefficients mentioned above was used to calculate the Taxable Property Vulnerability (TPv) index. After the calculation was performed, the values were adjusted to a range of 0 to 1 using an algorithm. This resulted in five vulnerability classes based on the standard deviation classes mentioned above.
Figure 8. Graphical process of taxable property vulnerability calculation.
Water 07 04971 g008

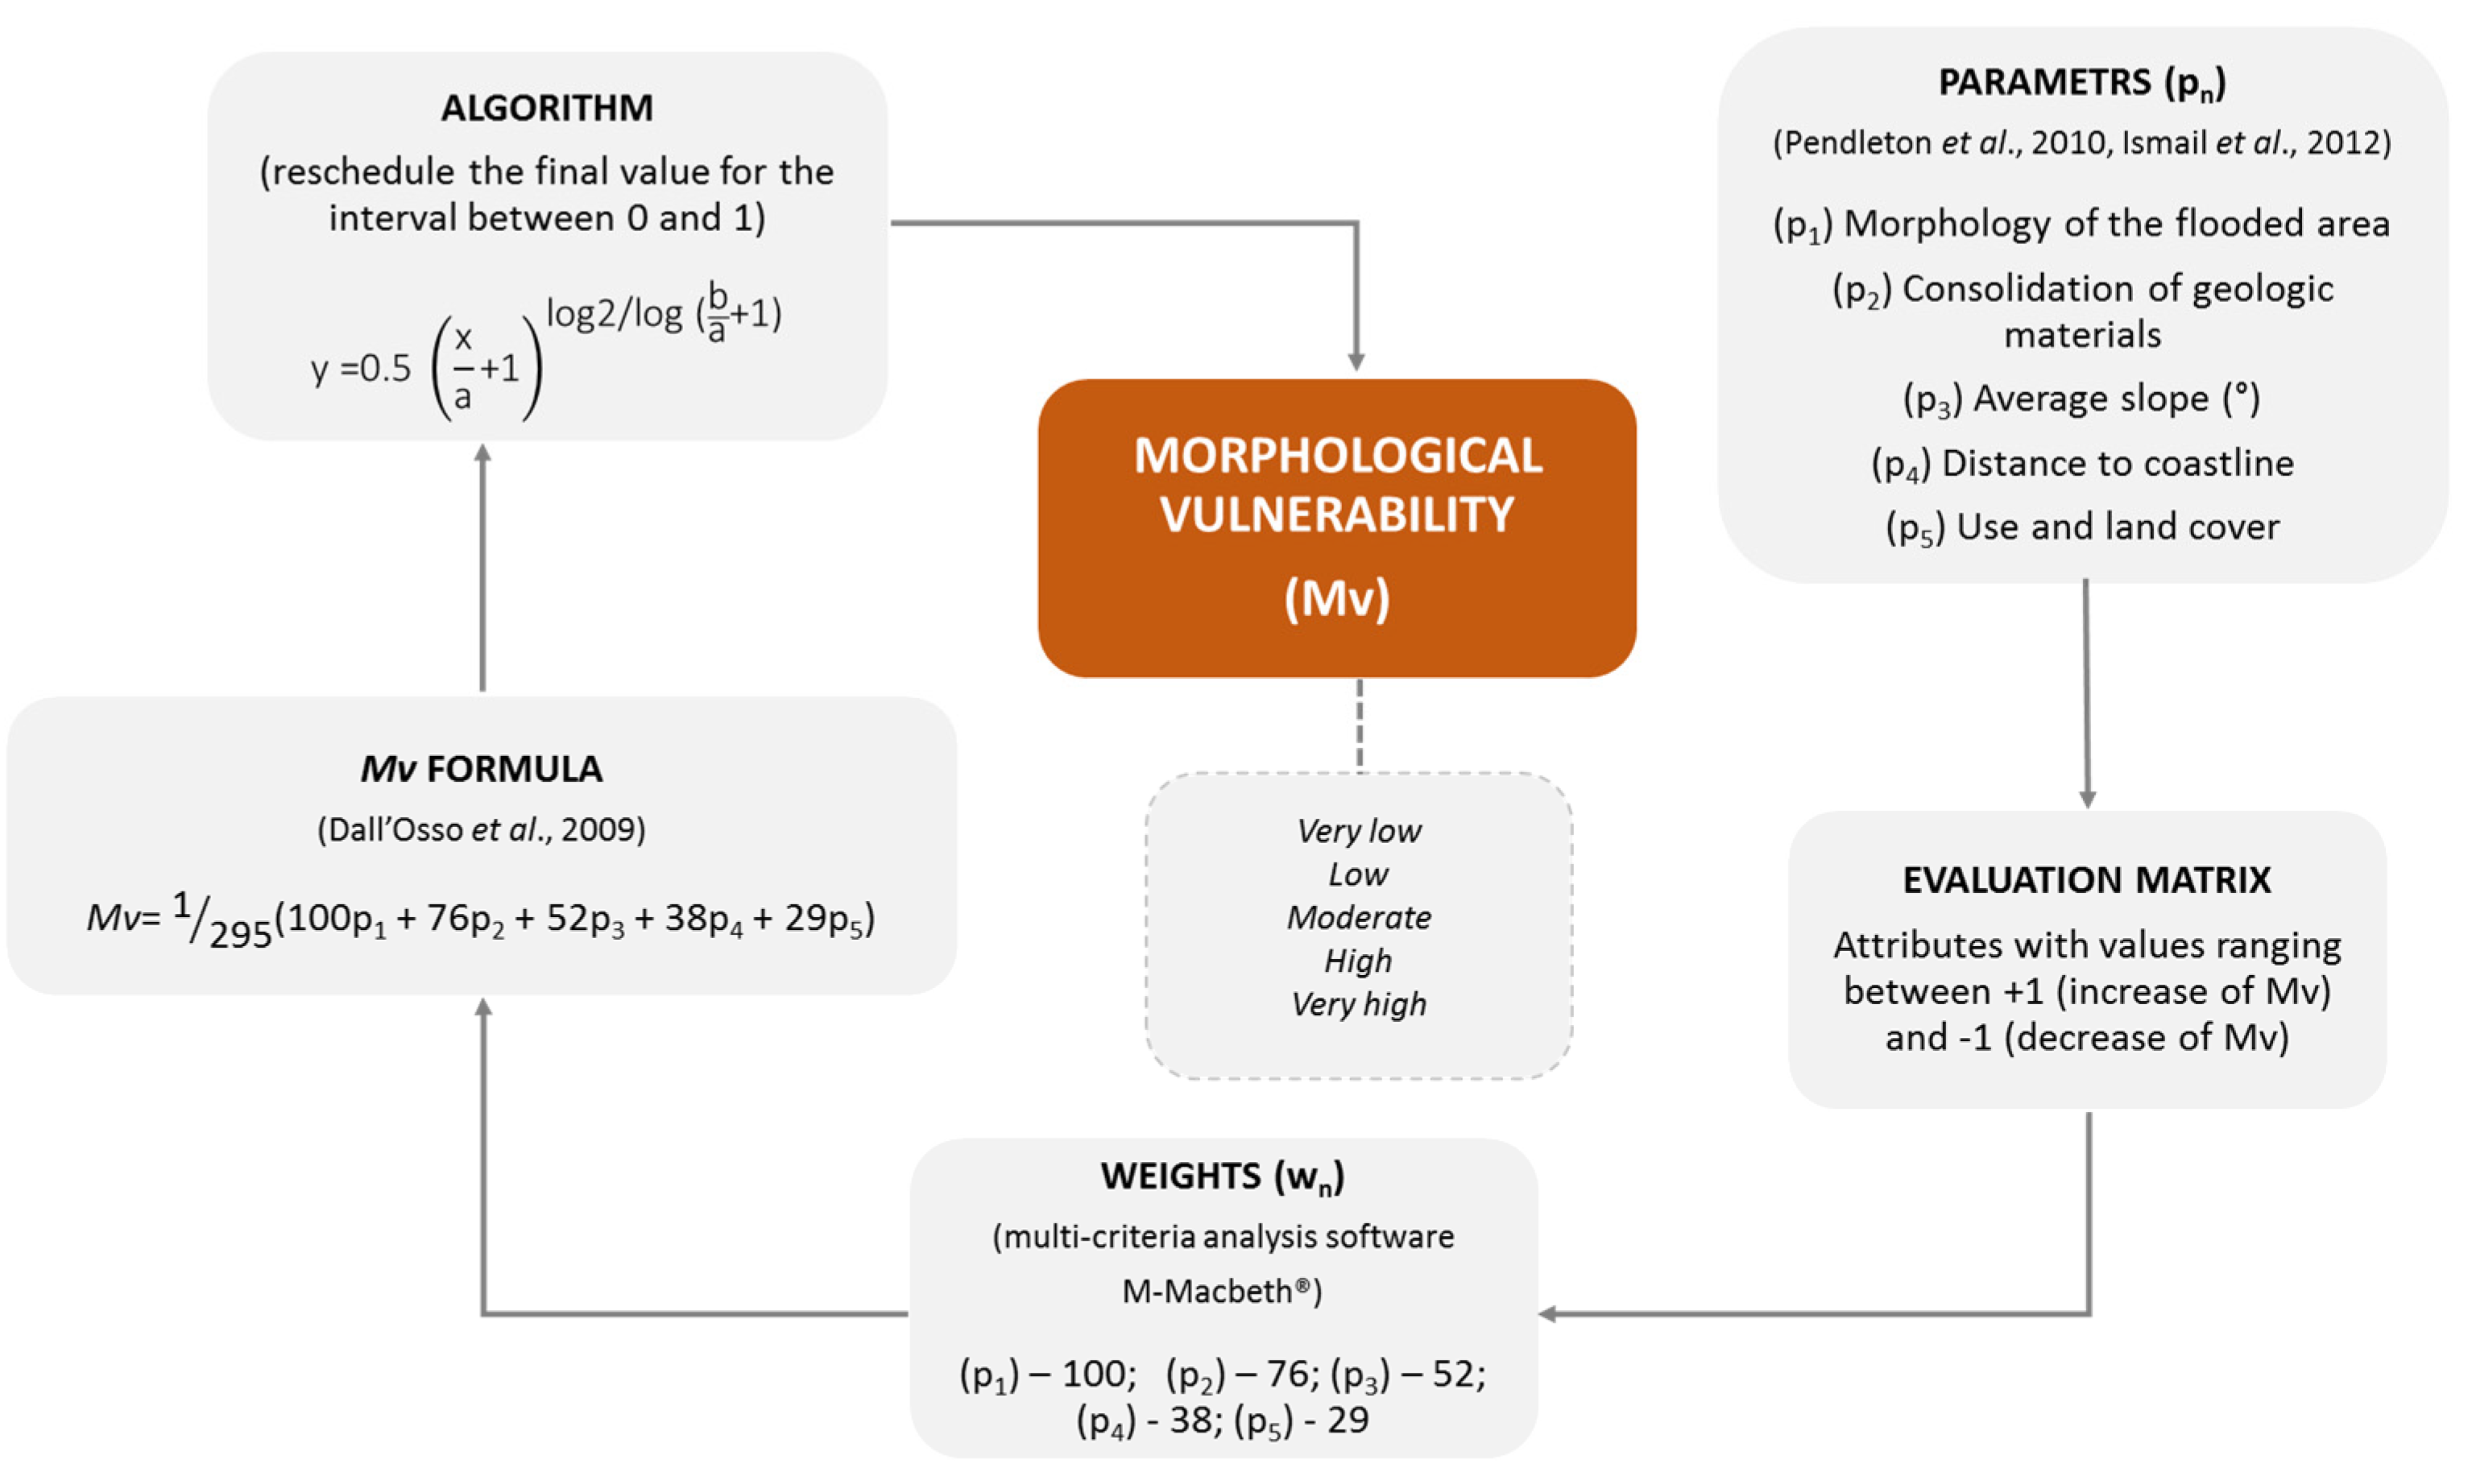
2.3. Morphological Assessment (Mv)

Five parameters were considered in the calculation of morphological vulnerability (Figure 9). A matrix based on fieldwork complemented with satellite imagery analysis and the use of GIS software was employed to collect and analyze the attributes of each parameter. The matrix gives values ranging between +1 and −1 to each attribute. Positive values represent an increase in vulnerability and negative values represent a decrease in vulnerability. However, not all parameters have the same influence on morphological vulnerability. Therefore, we used the M-Macbeth® (Hainaut, Belgium) multi-criteria analysis software [33,34] to assign different weights to each parameter (Figure 9).
Figure 9. Graphical process of morphological vulnerability calculation. [20,21,22].
Water 07 04971 g009
Morphological vulnerability was calculated using the formula presented in Figure 9, where “pn” is the value assigned to each parameter and “wn” is the weight assigned to each parameter. After the calculation was performed, and the algorithm in Figure 1 was used to adjust the final values to a range between 0 and 1, where “x” represents the direct value of the vulnerability, “y” is the adjusted vulnerability value in the range 0 to 1, “a” is the maximum value of the vulnerability of the sample and “b” is the minimum value of the sample.

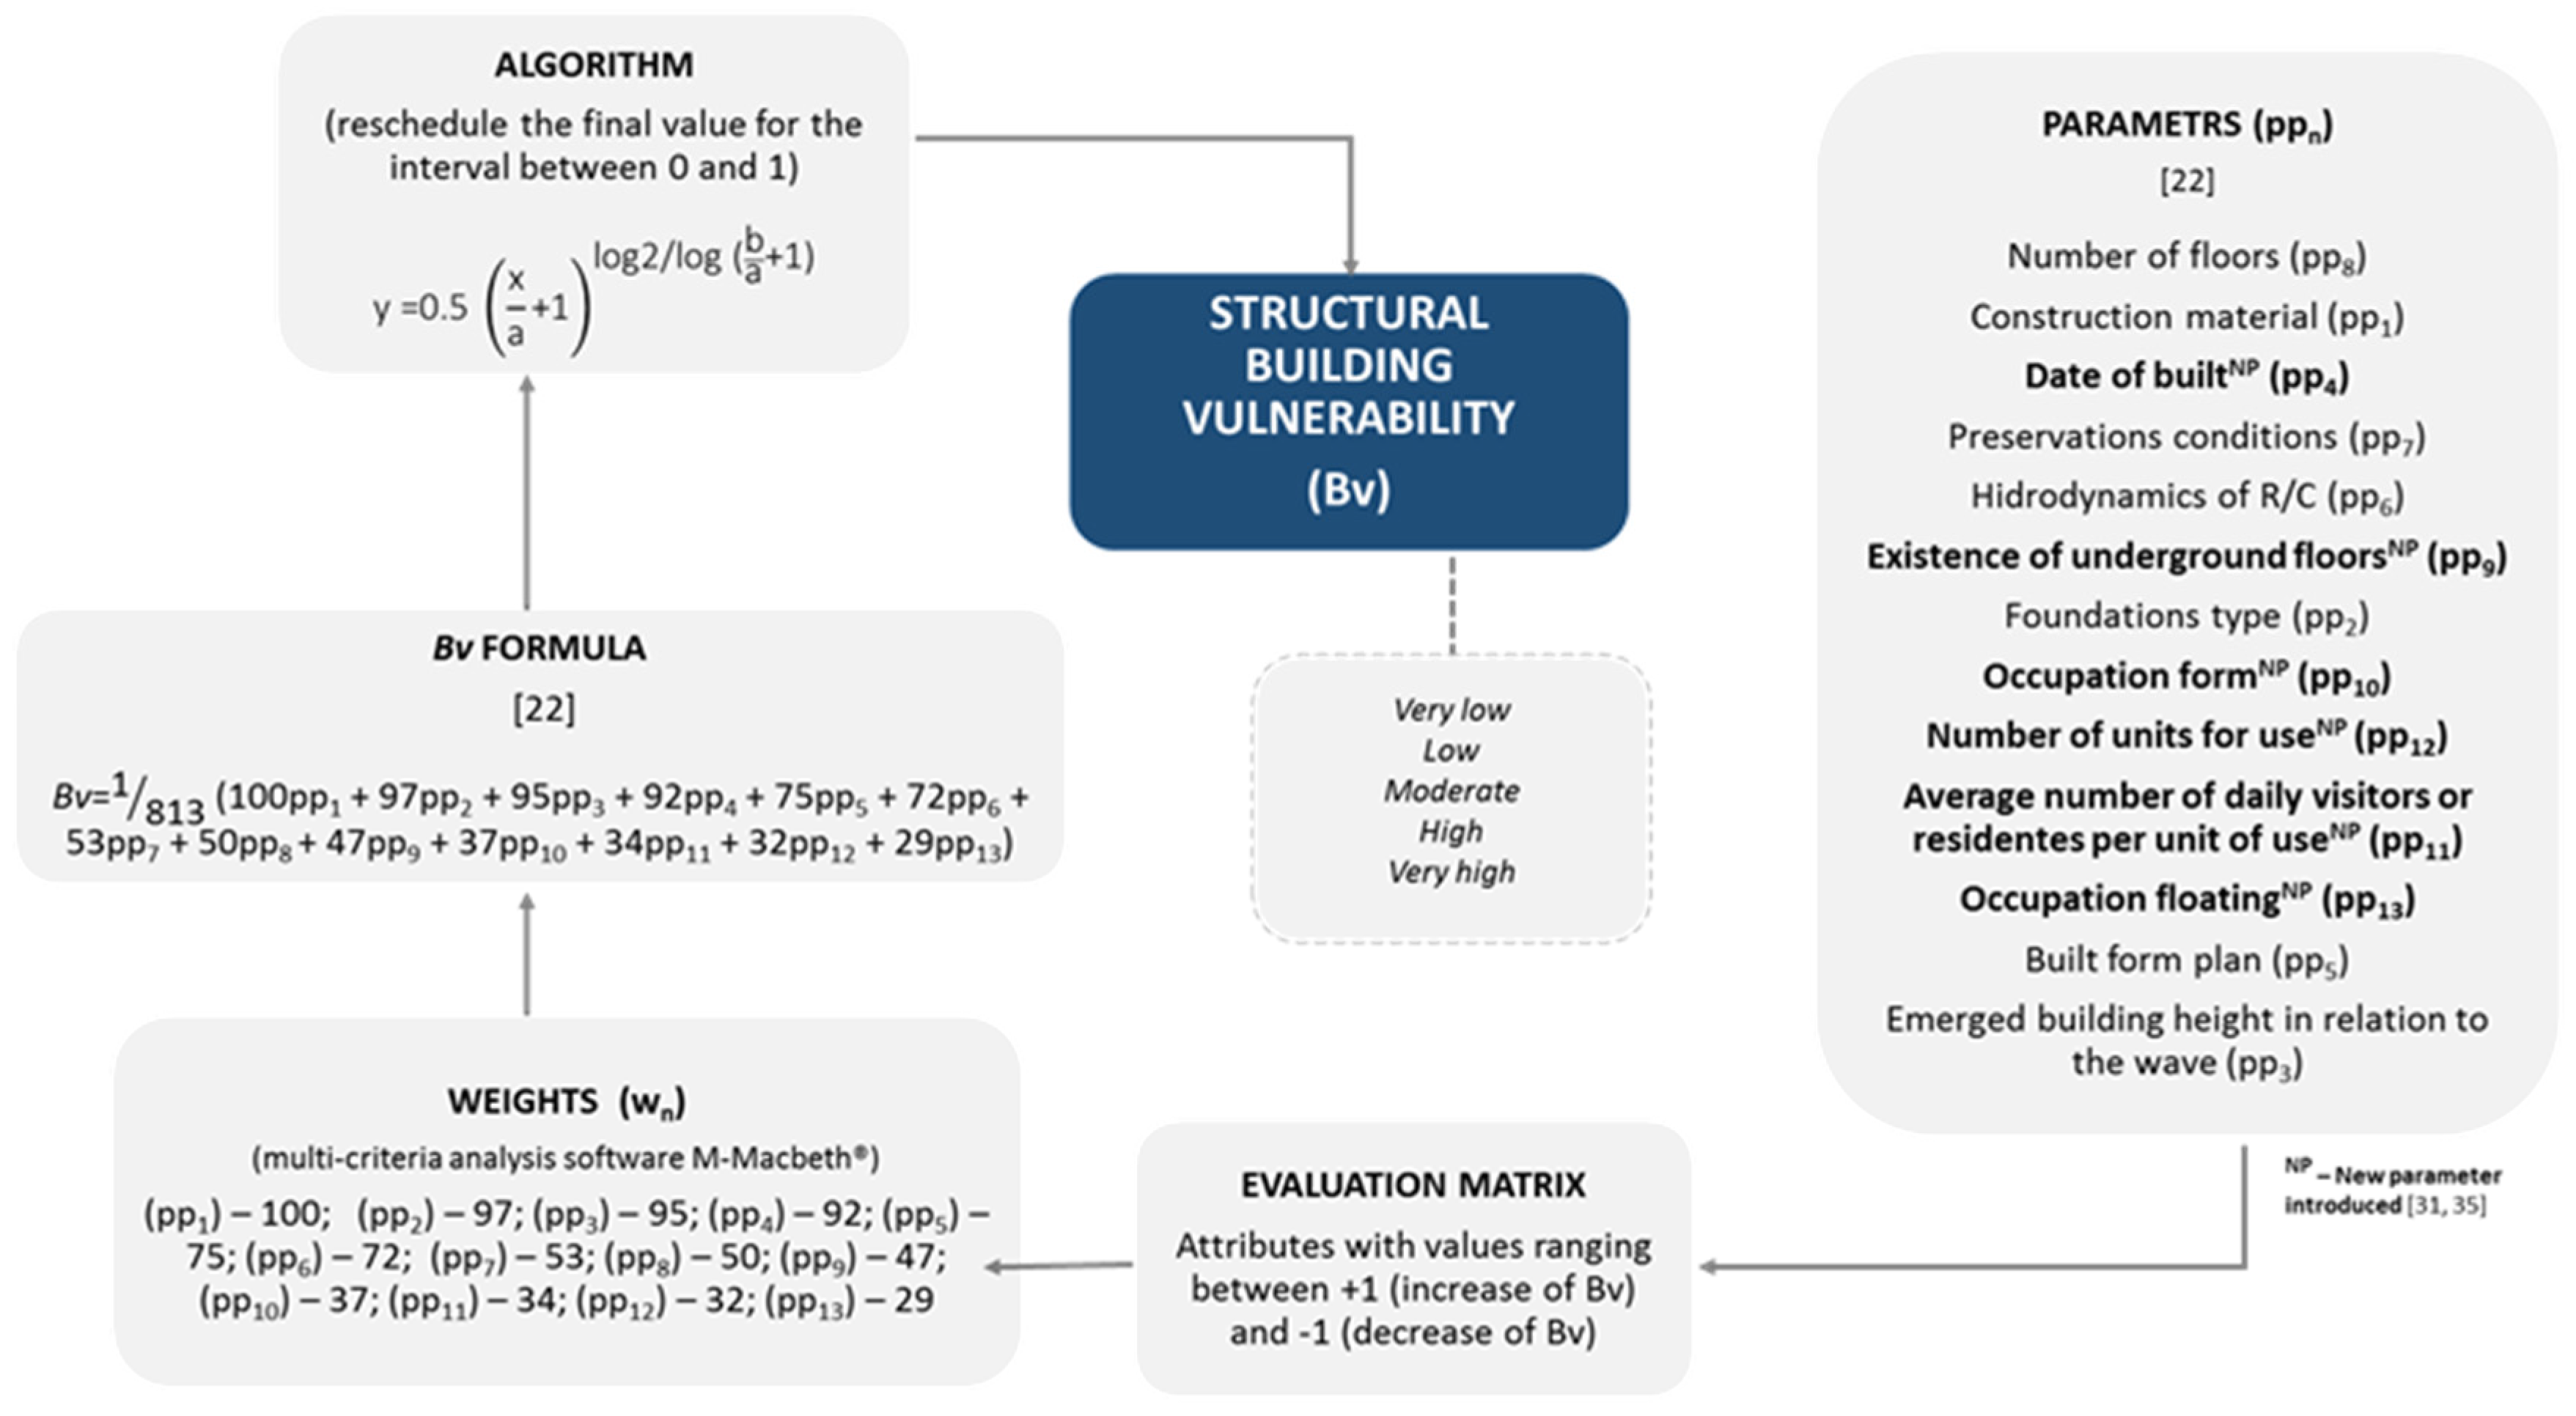
2.4. Structural Building Assessment (Bv)

A structural component analysis was applied to buildings potentially affected by the numerically modeled tsunami inundation [2]. We considered a total of 13 parameters (Figure 10) that characterize the structural, architectural, occupational and functional aspects of the buildings. The identification of these buildings and the collection of their various intrinsic characteristics and those of the surrounding areas occurred through fieldwork. A matrix was used to aggregate all parameters representing the structural aspects of vulnerability. Each parameter was given a value between +1 and –1.
Figure 10. Graphical process of structural vulnerability calculation. [22,31,35].
Water 07 04971 g010
For this assessment, we introduced a new set of parameters (bold in the Figure 10) related to the occupation, functionality and structure of each building [31,35] that have not been addressed in previous works, including those by [21,22]. The introduction of these new parameters strengthened our analysis and enabled the introduction of new data that had not been considered in previous methodologies. These new parameters distinguish buildings according to their function, the seasonality of use, capacity, and rate and type of occupation. In terms of function, buildings were divided into six categories: exclusively residential, commercial, services/industry, outbuilding/warehouse, mixed type (e.g., residential and commercial building), and critical buildings (e.g., police, fire station, and school).
Each of the 13 parameters contributed differently to structural vulnerability. M-Macbeth® multi-criteria analysis software [33,34] was used to assign different weights to each parameter.
After weighting each parameter and assigning values to each of its attributes, structural vulnerability was calculated (Bv) using the formula presented in Figure 10, where “ppn” is the value assigned to each parameter and “wn” the weight assigned to each parameter. After the calculation, the adjustment algorithm was applied to convert the data to values between 0 and 1.

2.5. Composite Vulnerability Index (CVI)

After calculating the morphological (Mv), structural (Bv), social (Sv) and taxable property vulnerabilities (TPv), a Composite Vulnerability Index (CVI) was calculated. This index is the sum of the four component indices and is presented in Figure 11.
The CVI varies between 0 (minimal vulnerability) and 4 (maximum vulnerability), with vulnerability ranging between very low to very high according to the five standard deviation levels mentioned above.
Figure 11. Graphical process of Composite Vulnerability Index calculation.
Water 07 04971 g011

3. Results

3.1. Municipal Vulnerability Components

3.1.1. Social Vulnerability
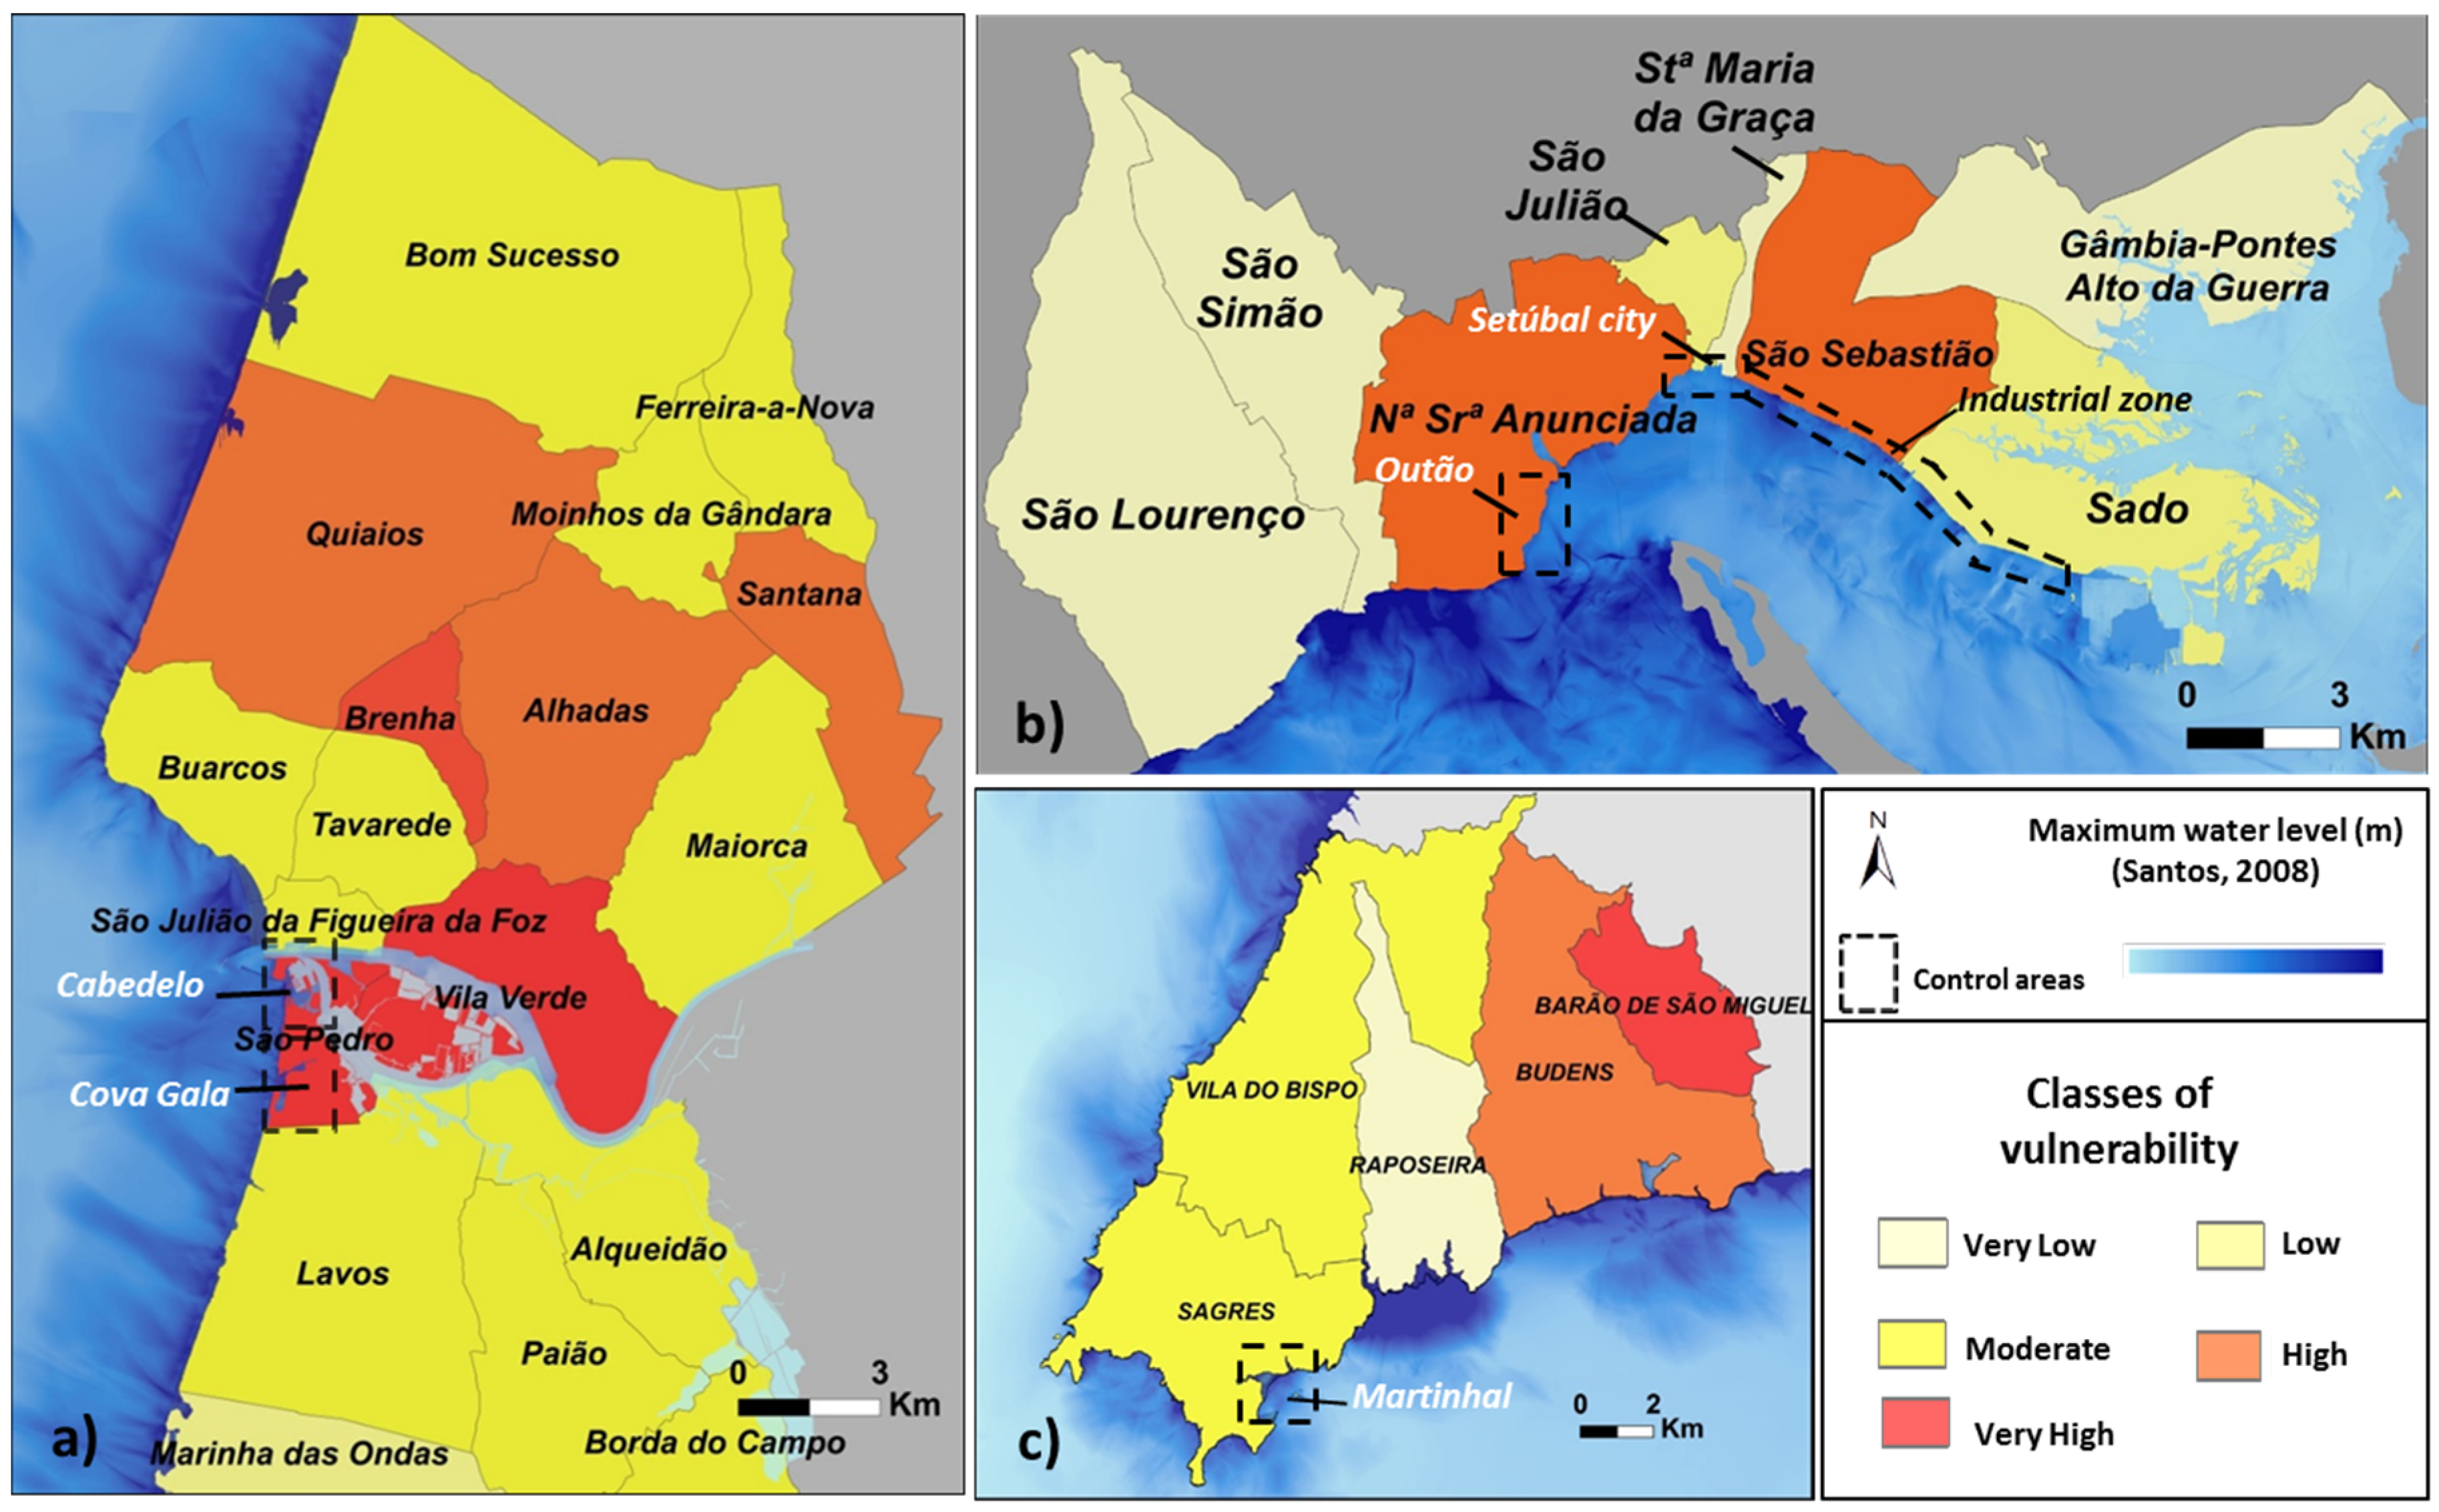
Social vulnerability was calculated at the parish and municipality levels for the different areas of study: Figueira da Foz (Cabedelo and Cova Gala), Setúbal (Outão, city of Setúbal and industrial zone) and Vila do Bispo (Martinhal).
Figure 12 is a spatial representation of the social vulnerability of each municipality. In Figueira da Foz (Figure 12a), vulnerability varies between low (0.310) and very high (0.730) (Table 3). Cova Gala and the Cabedelo, which are located on the left bank of the river Mondego, in the parish of São Pedro exhibit very high social vulnerability.
In the district of Setúbal, social vulnerability varies between very low (0.000) and high (0.670) (Table 3). Of the areas analyzed within the municipality (Figure 12b), Outão, which is located in the parish of Nossa Senhora da Anunciada, is highly vulnerable to tsunamis. The urban area of Setubal is characterized by varying levels of social vulnerability based on parish: Nossa Senhora da Anunciadada and São Sebastião are highly vulnerable; São Julião has low vulnerability; and Santa Maria da Graça has very low vulnerability. The industrial area is part of the parish of S. Sebastião, which has a high level of vulnerability, and the Sado parish, which is classified as low vulnerability.
Figure 12. Social vulnerability: (a) Figueira da Foz municipality; (b) Setúbal municipality; and (c) Vila do Bispo municipality.
Water 07 04971 g012
Table 3. Social vulnerability components.
Standard Deviation ClassesPCA Classification IntervalNominal ClassificationMunicipalitiesMunicipal Classification IntervalMunicipal Nominal Classification
<−1 SD
≥−1 to −0.5 SD
≥−0.5 to +0.5 SD
≥+0.5 to +1 SD
≥+1 SD
0.000–0.310 0.310–0.400 0.400–0.580 0.580–0.670 0.670–1Very Low
Low
Moderate
High
Very High
Figueira da Foz0.310–0.390 0.420–0.540 0.590–0.640 0.700–0.730Low
Moderate
High
Very High
Setúbal0.000–0.300 0.390–0.400 0.650–0.670Very Low
Low
High
Vila do Bispo0.000–0.300 0.470–0.530 0.580–0.650 0.670–0.770Very Low
Moderate
High
Very High
In the municipality of Vila do Bispo (Figure 12c), vulnerability varies between very low (0.000) and very high (0.770) (Table 3). The parish of Sagres, where Martinhal is located, is characterized by moderate social vulnerability. Overall, the lowest vulnerability values are observed in Setúbal municipality, where values for the two lowest vulnerability classes (very low and low) ranged from 0.000 to 0.400. The highest vulnerability values were observed in the municipality of Vila do Bispo, where values for the two highest vulnerability classes (high and very high) ranged from 0.580 to 0.770 (Table 3).

3.1.2. Taxable Property Vulnerability
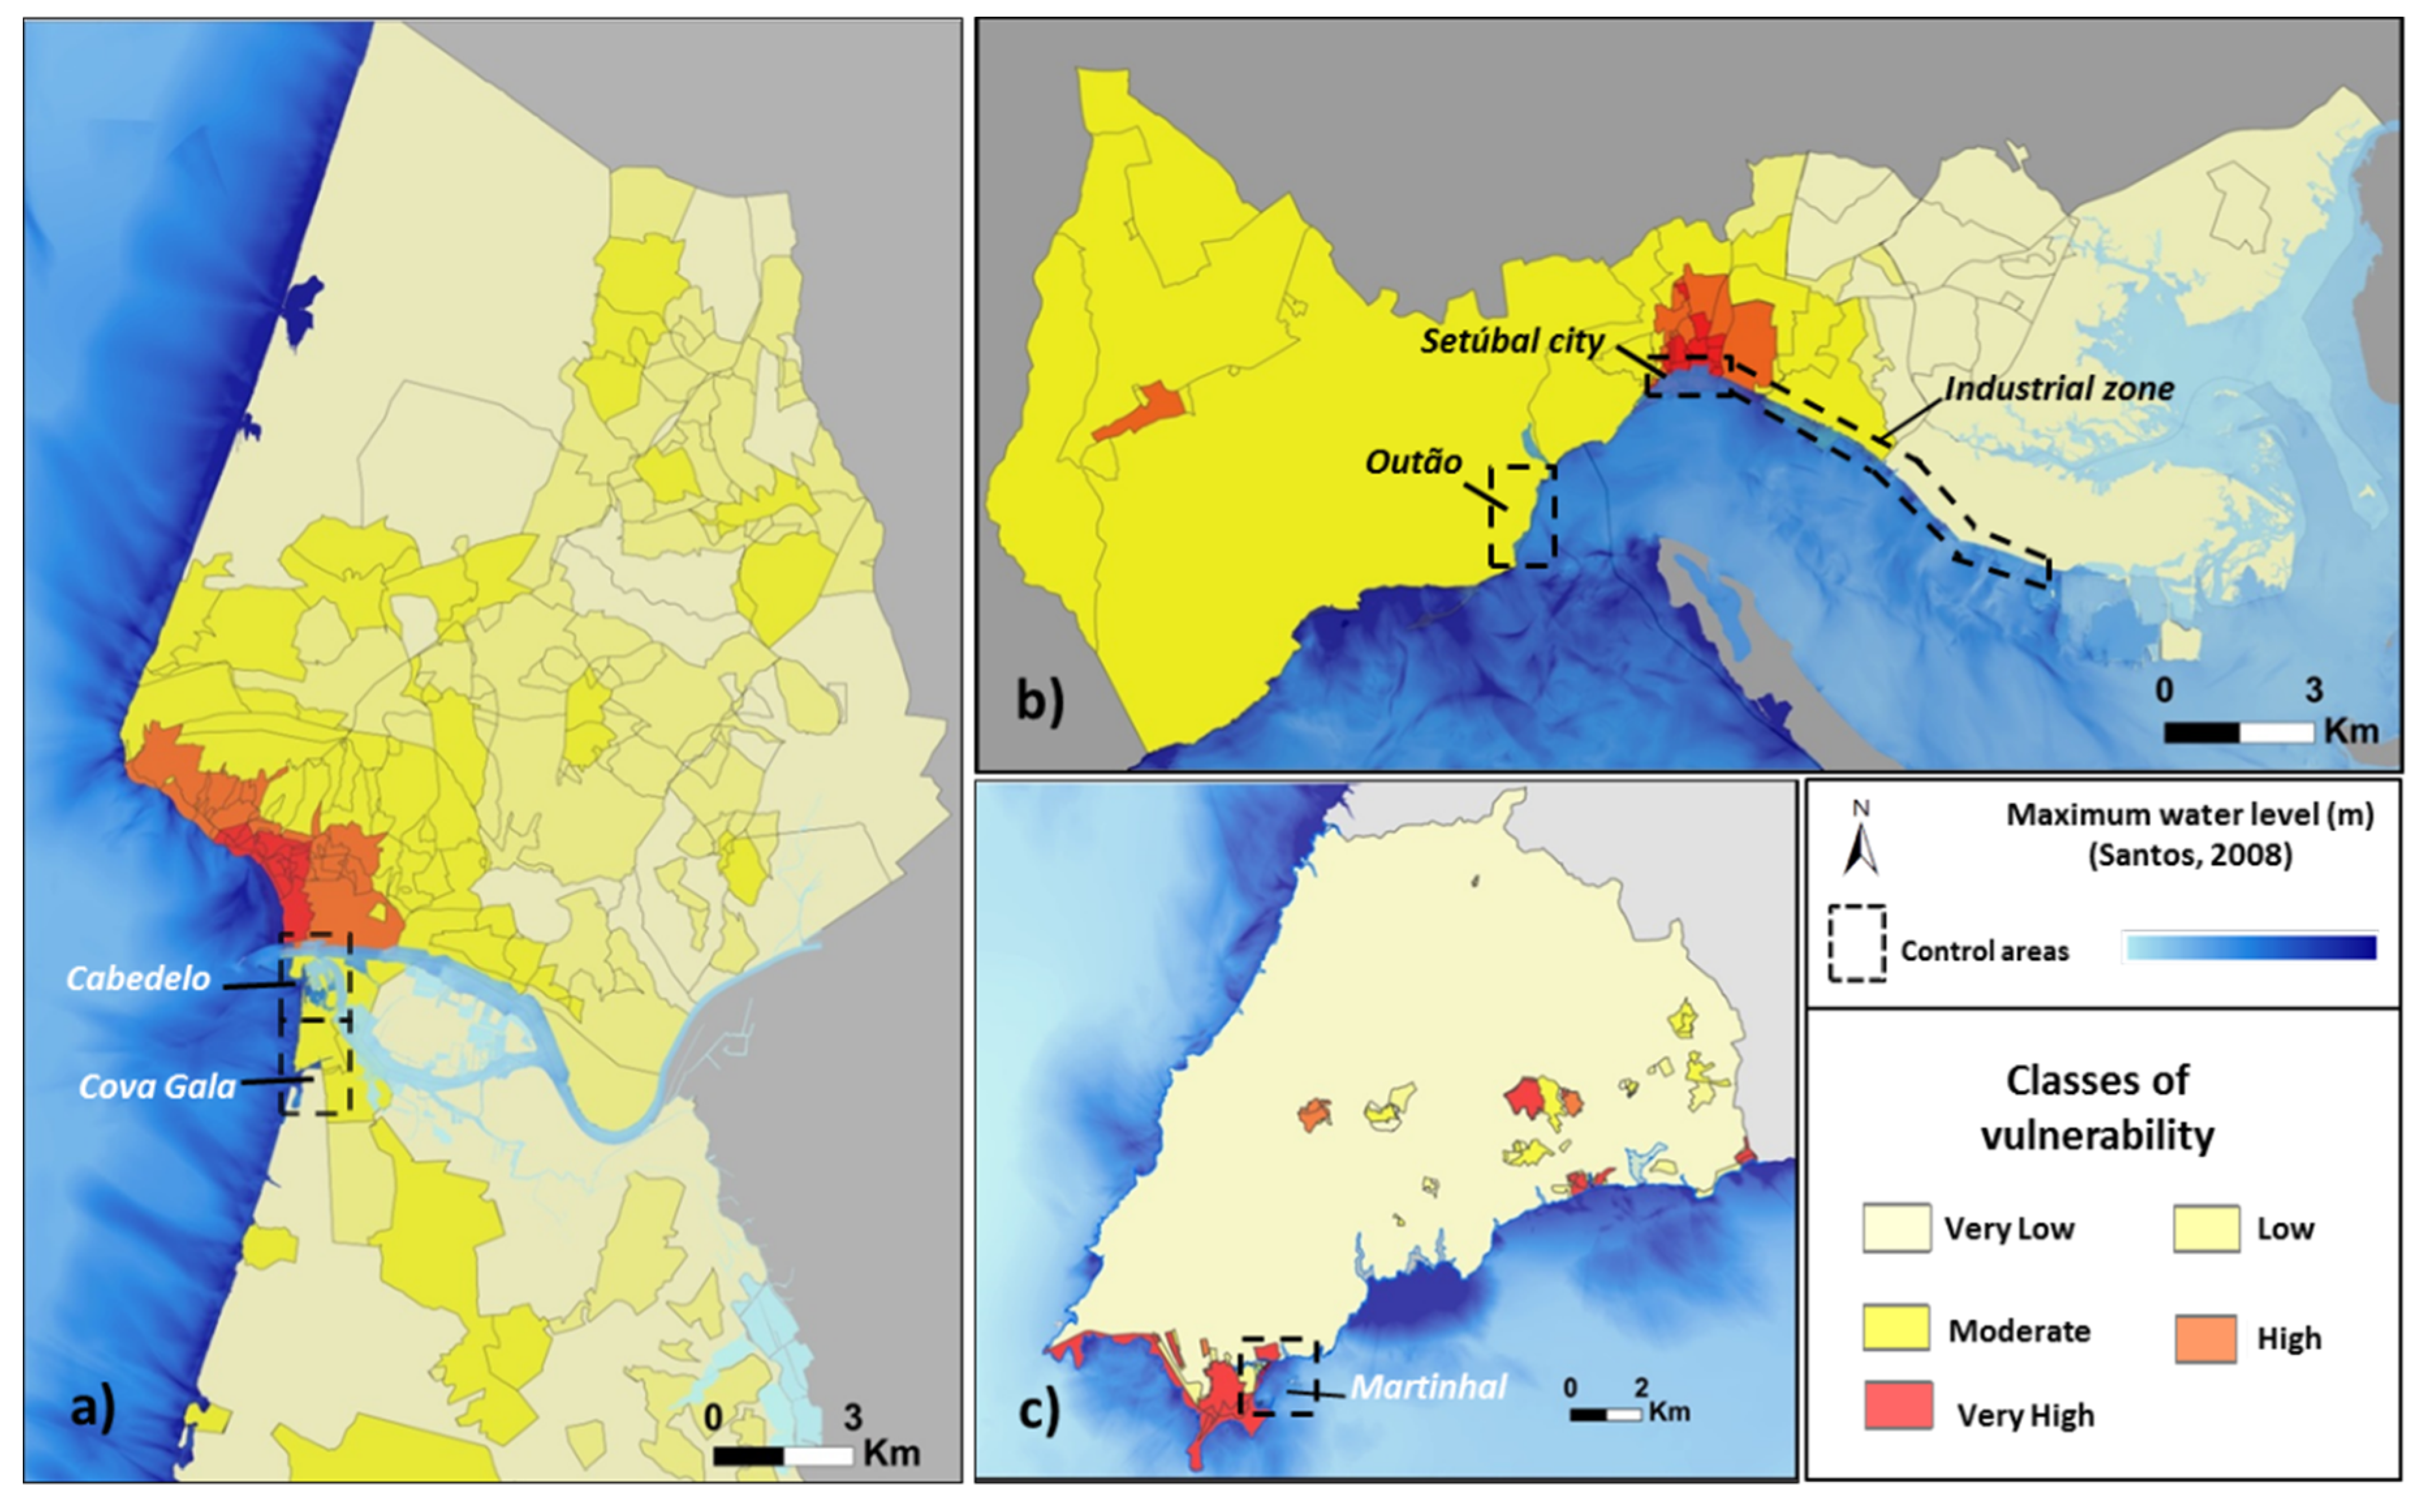
Taxable property vulnerability (Figure 13 and Table 4) varies from very low to very high in Figueira da Foz (Figure 13a), with marked differences across the municipality. Cova Gala and Cabedelo were characterized by very low vulnerability in the south of analyzed areas and moderate vulnerabilities in the remaining areas. These results can be explained by the fact that this is a peri-urban area with strong natural components, with the exception of Cova Gala, which is a consolidated urban area, and the fishing port, which concentrates trade activities for the territory.
In Setubal (Figure 13b), taxable property vulnerability also varies between very low and very, high with a clear distinction between urban and natural/rural areas. The highest vulnerability values are concentrated in the center of the municipality, at the heart of Setúbal’s urban area. In terms of the localities analyzed, Outão exhibited moderate vulnerability. This can be explained by the heterogeneity of the area. Despite the existence of infrastructure linked to industry and services, the area also has a strong natural component and is located in the middle of the Arrábida Natural Park. The city of Setúbal, which is a consolidated urban area, is completely characterized by very high vulnerability. The riverfront, which is primarily geared toward industrial uses, is characterized by varying taxable property vulnerability, with the port of Setubal classified as highly vulnerable and a general decrease in vulnerability to the east, where the vulnerability is very low.
Figure 13. Social vulnerability: (a) Figueira da foz municipality; (b) Setúbal municipality; and (c) Vila do Bispo municipality.
Water 07 04971 g013
Table 4. Social vulnerability components.
Standard Deviation ClassesMunicipalitiesMunicipal Classification IntervalMunicipal Nominal Classification
<−1 SD
≥−1 to −0.5 SD
≥−0.5 to +0.5 SD
≥+ 0.5 to +1 SD
≥+1 SD
Figueira da Foz0.000–0.567
0.567–0.651
0.651–0.795
0.795–0.867
0.867–1
Very Low
Low
Moderate
High
Very High
Setúbal0.000–0.612
0.612–0.687
0.687–0.829
0.829–0.893
0.893–1
Very Low
Low
Moderate
High
Very High
Vila do Bispo0.000–0.586
0.586–0.630
0.630–0.717
0.717–0.761
0.761–1
Very Low
Low
Moderate
High
Very High
Finally, the vulnerability of taxable property in Vila do Bispo municipality (Figure 13c) ranges from very low to very high, with a clear distinction between urban and rural areas. Martinhal is classified as very highly vulnerable. Although Martinhal is surrounded by rural/natural features, its taxable property vulnerability value is high because it is a center for seaside tourism, and therefore its location coefficients are given higher values.
Table 4 allows us to assess the numerical variation of different vulnerability classes for the municipalities in question. Overall, it can be concluded that lower levels of vulnerability are observed in the municipality of Vila do Bispo, where the lower class values ranged between 0.000 and 0.630. Higher taxable property vulnerability values for Vila do Bispo varied between 0.717 and 1, highlighting the heterogeneity of vulnerability across the municipality with respect to tax characteristics

3.2. Local Vulnerability Components

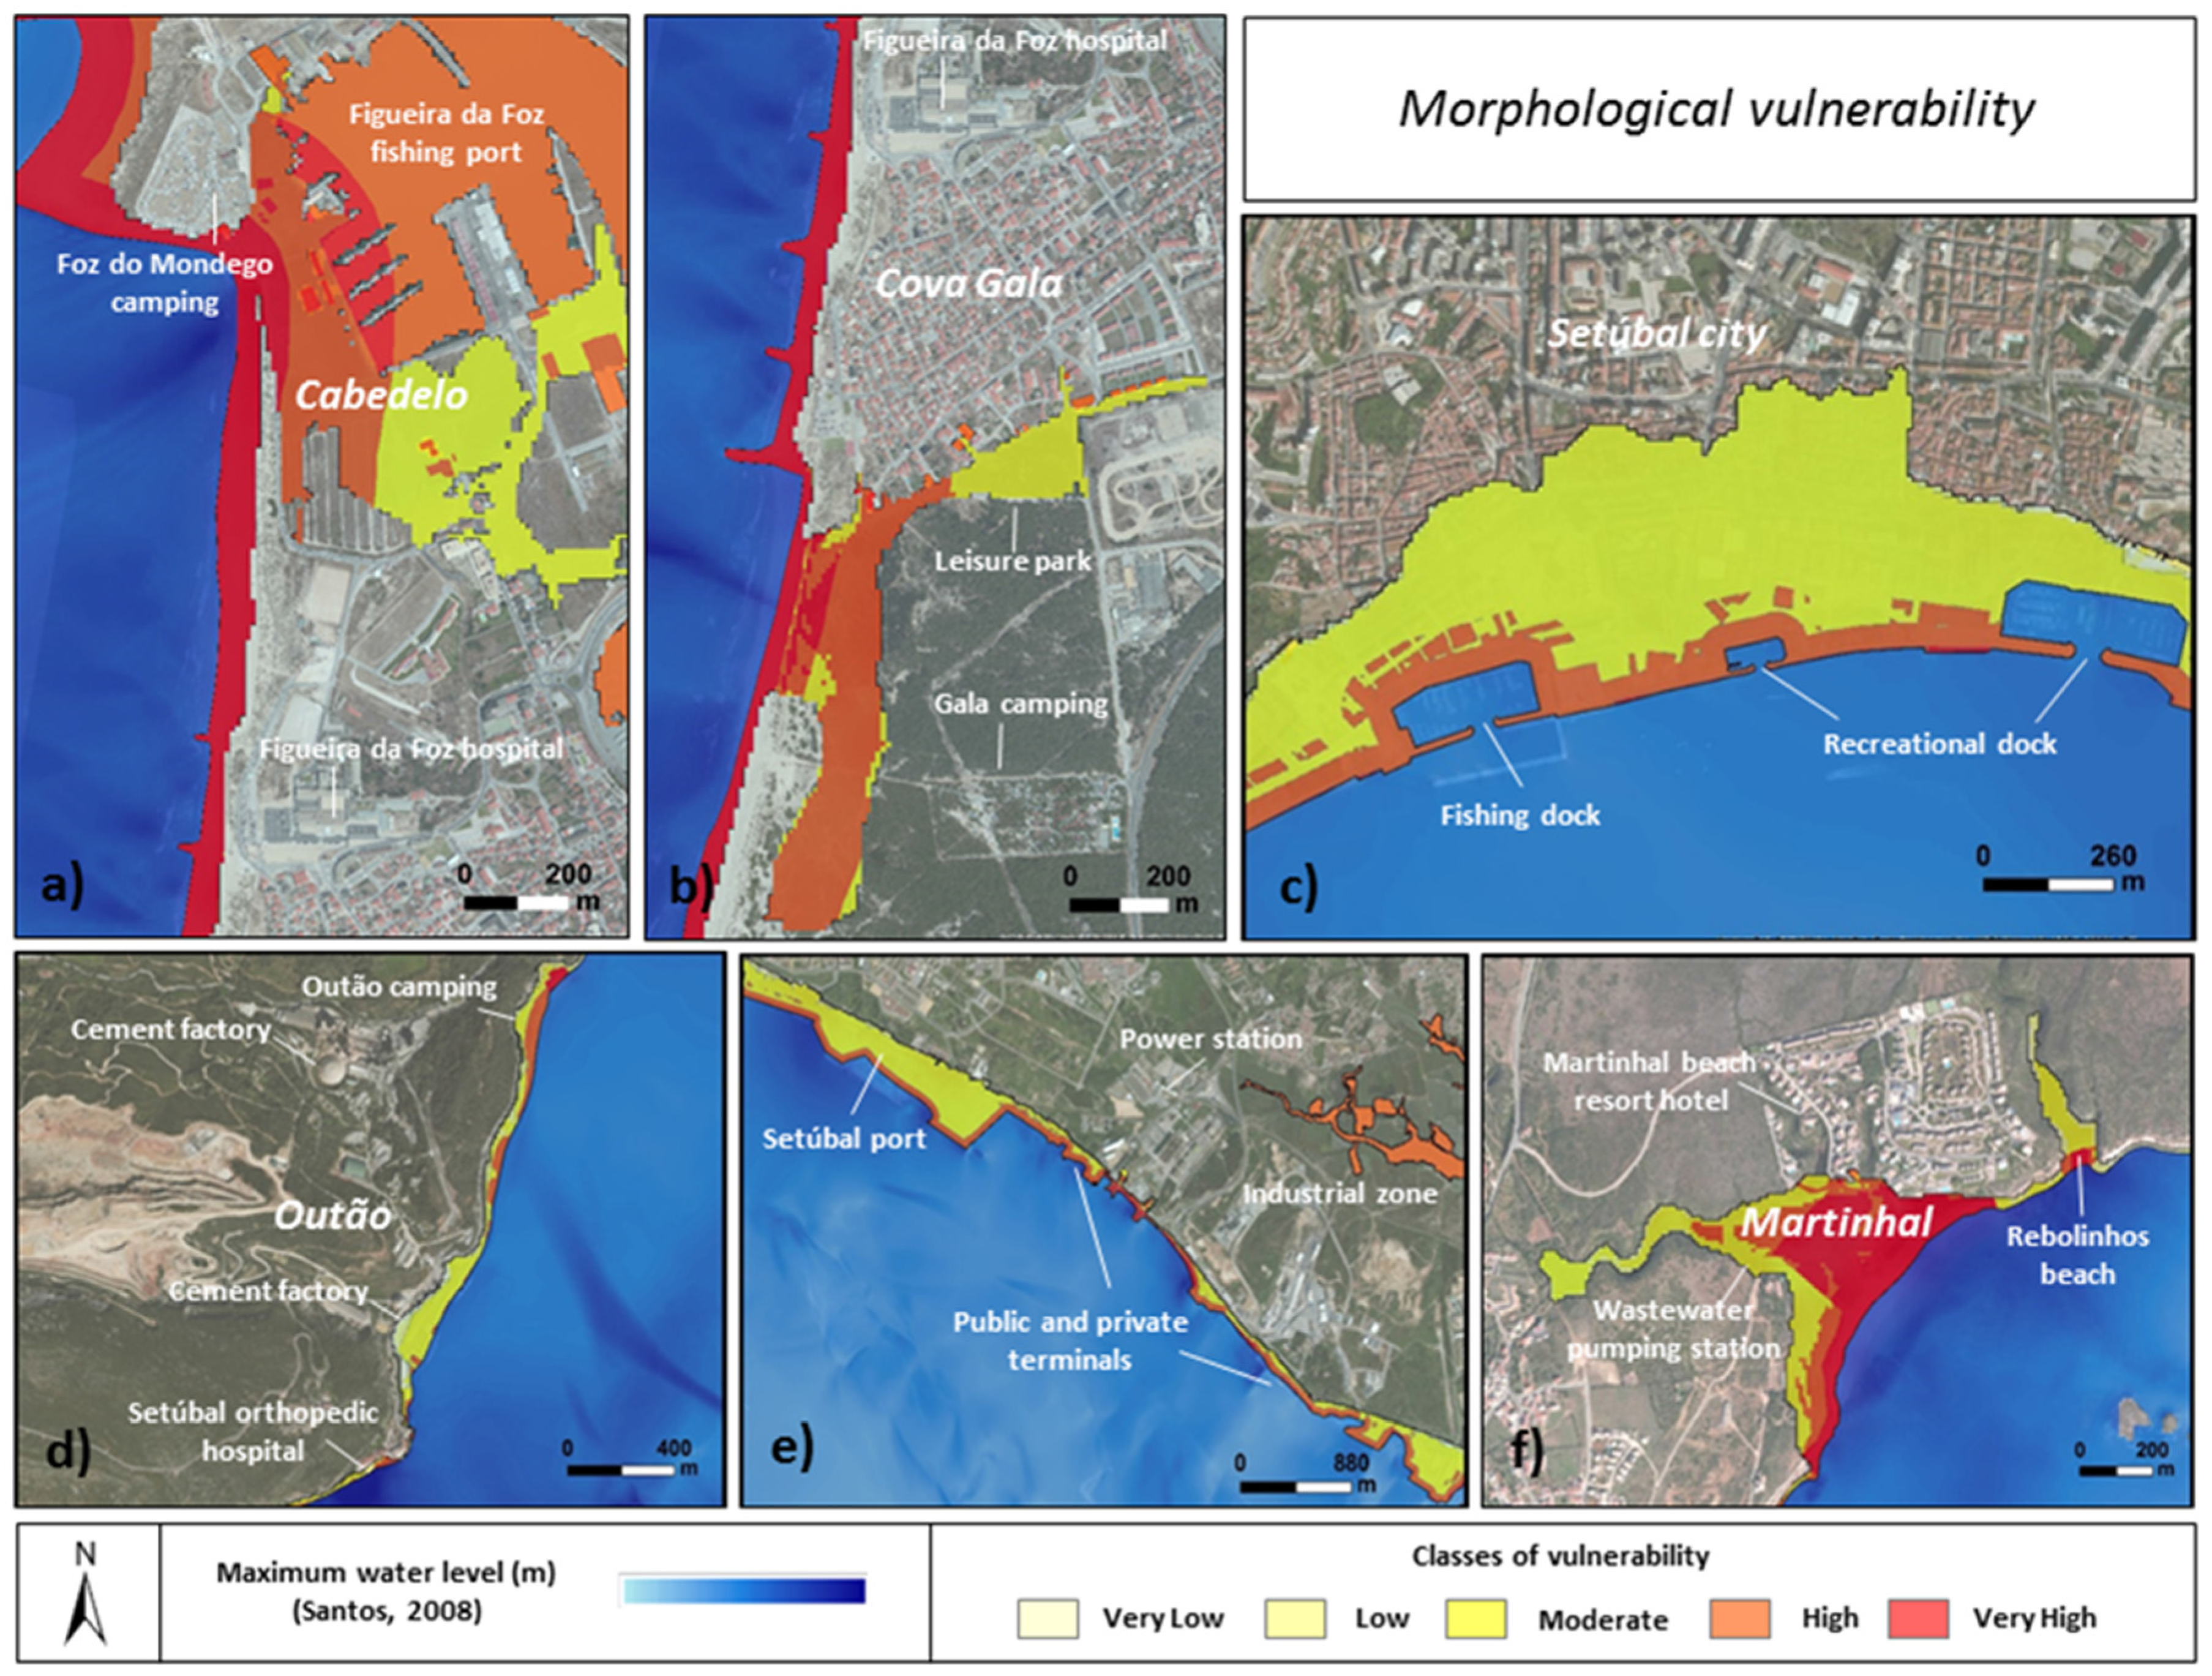
3.2.1. Morphological Vulnerability

Figure 14 shows the morphological vulnerability in the area under study, with vulnerabilities ranging between very low and very high. Cabedelo (Figure 14a) and Cova Gala (Figure 14b), located in Figueira da Foz, represent 6.1% of the total flooded area of the municipality (Table 5). The highest morphological vulnerability values are concentrated in the coastal zone, especially on the beach of Cabedelo, in the fishing port and on the beach of Cova Gala. It is apparent that morphological vulnerability is strongly correlated with distance to the coastline, as decreases in vulnerability are associated with increasing distances from the coastline. However, within this factor, slope and morphology of the study area also play a decisive role in the final value of vulnerability.
Figure 14. Morphological vulnerability: (a) Cabedelo; (b) Cova Gala; (c) City of Setúbal; (d) Outão; (e) Industrial zone; and (f) Martinhal.
Water 07 04971 g014
Table 5. Percentage of area by classes of vulnerability.
Study AreasInundated Area (% of Analyzed Area in the Municipality Total Inundated Area)Classes of VulnerabilityPercentage of Area (%)Area Affected (ha)
Cabedelo4.5Moderate2014
High5338
Very High2718
Cova Gala1.6Moderate205
High4812
Very High328
City of Setubal2.7Very Low0.70.5
Low10.7
Moderate7855
High2014
Very High0.30.4
Outão0.5Very Low81
Low142
Moderate507
High213
Very High70.6
Industrial zone4.8Very Low12
Low33
Moderate6278
High3037
Very High45
Martinhal12.3Very Low31
Low72
Moderate3310
High175
Very High4012
With regard to areas located in Setúbal, the urban area of Setubal accounts for 2.7% of the total flooded area within the municipality (Table 5), and its morphological vulnerability varies between very low and very high (Figure 14c). Lower values are located in the boundary areas in the northern part of the study area, especially at the edge just beyond the north of the marina. The highest values of morphological vulnerability are located along the riverfront of the Sado estuary to approximately 200 m inland. Beyond this band, the region is dominated by moderate values of vulnerability, which affect the vast majority of the study area. The final values of morphological vulnerability are clearly influenced by the following parameters: use and type of soil, slope and distance to the coastline.
In Outão (Figure 14d), vulnerability varies between very low and very high; this area contains 0.5% of the total area affected by flooding within the municipality (Table 5). Vulnerability of this area varies greatly, and the distance to the shoreline parameter has less weight compared to the areas discussed above. The highest vulnerability values are located in the Outão camping location and the areas surrounding the Setúbal orthopedic hospital. The final values of morphological vulnerability are clearly influenced by land-use, land cover and slope.
Regarding the industrial area (Figure 14e), morphological vulnerability varies between very low and very high, with the greatest vulnerability values located along the edge of the Sado estuary and the lowest located inland. In this area, the final values of morphological vulnerability are clearly influenced by the distance to the shoreline and use and land cover. This industrial zone accounts for a total of 4.8% of the total flood-affected area within the municipality.
Morphological vulnerability in Martinhal (Figure 14f) ranges from low to very high and is greatly influenced by distance to the coastline. Figure 14f clearly shows that vulnerability in Martinhal decreases with increasing distance from the shoreline. The highest values are located in the area of Martinhal beach, in the southern zone of the Martinhal beach resort hotel and on the sandy beach of Rebolinhos. Martinhal represent 12.3% of the total flooded area of the municipality (Table 5).
Table 5 shows the total percent of flooded area per morphological vulnerability class. Higher values (high and very high class) are observed in Cabedelo (80%), Cova Gala (80%) and Martinhal (57%).
In contrast, lower levels of vulnerability (very low and low classes) are located in Outão, where the two lowest classes represent 22% of the flooded area. Also noteworthy is the fact that in the city and the industrial zone of Setubal, the vast majority of the flooded area is characterized by only moderate morphological vulnerability (78% and 62%, respectively). If we analyze the data in terms of affected area, we see that the high and very high vulnerability classes in the Cabedelo zone are some of the largest affected areas (56 ha). With regard to the very low and low vulnerability classes, represented by the industrial area, 5 ha are affected. In terms of moderate vulnerability, 55 ha of urban Setubal are affected.

3.2.2. Structural Vulnerability
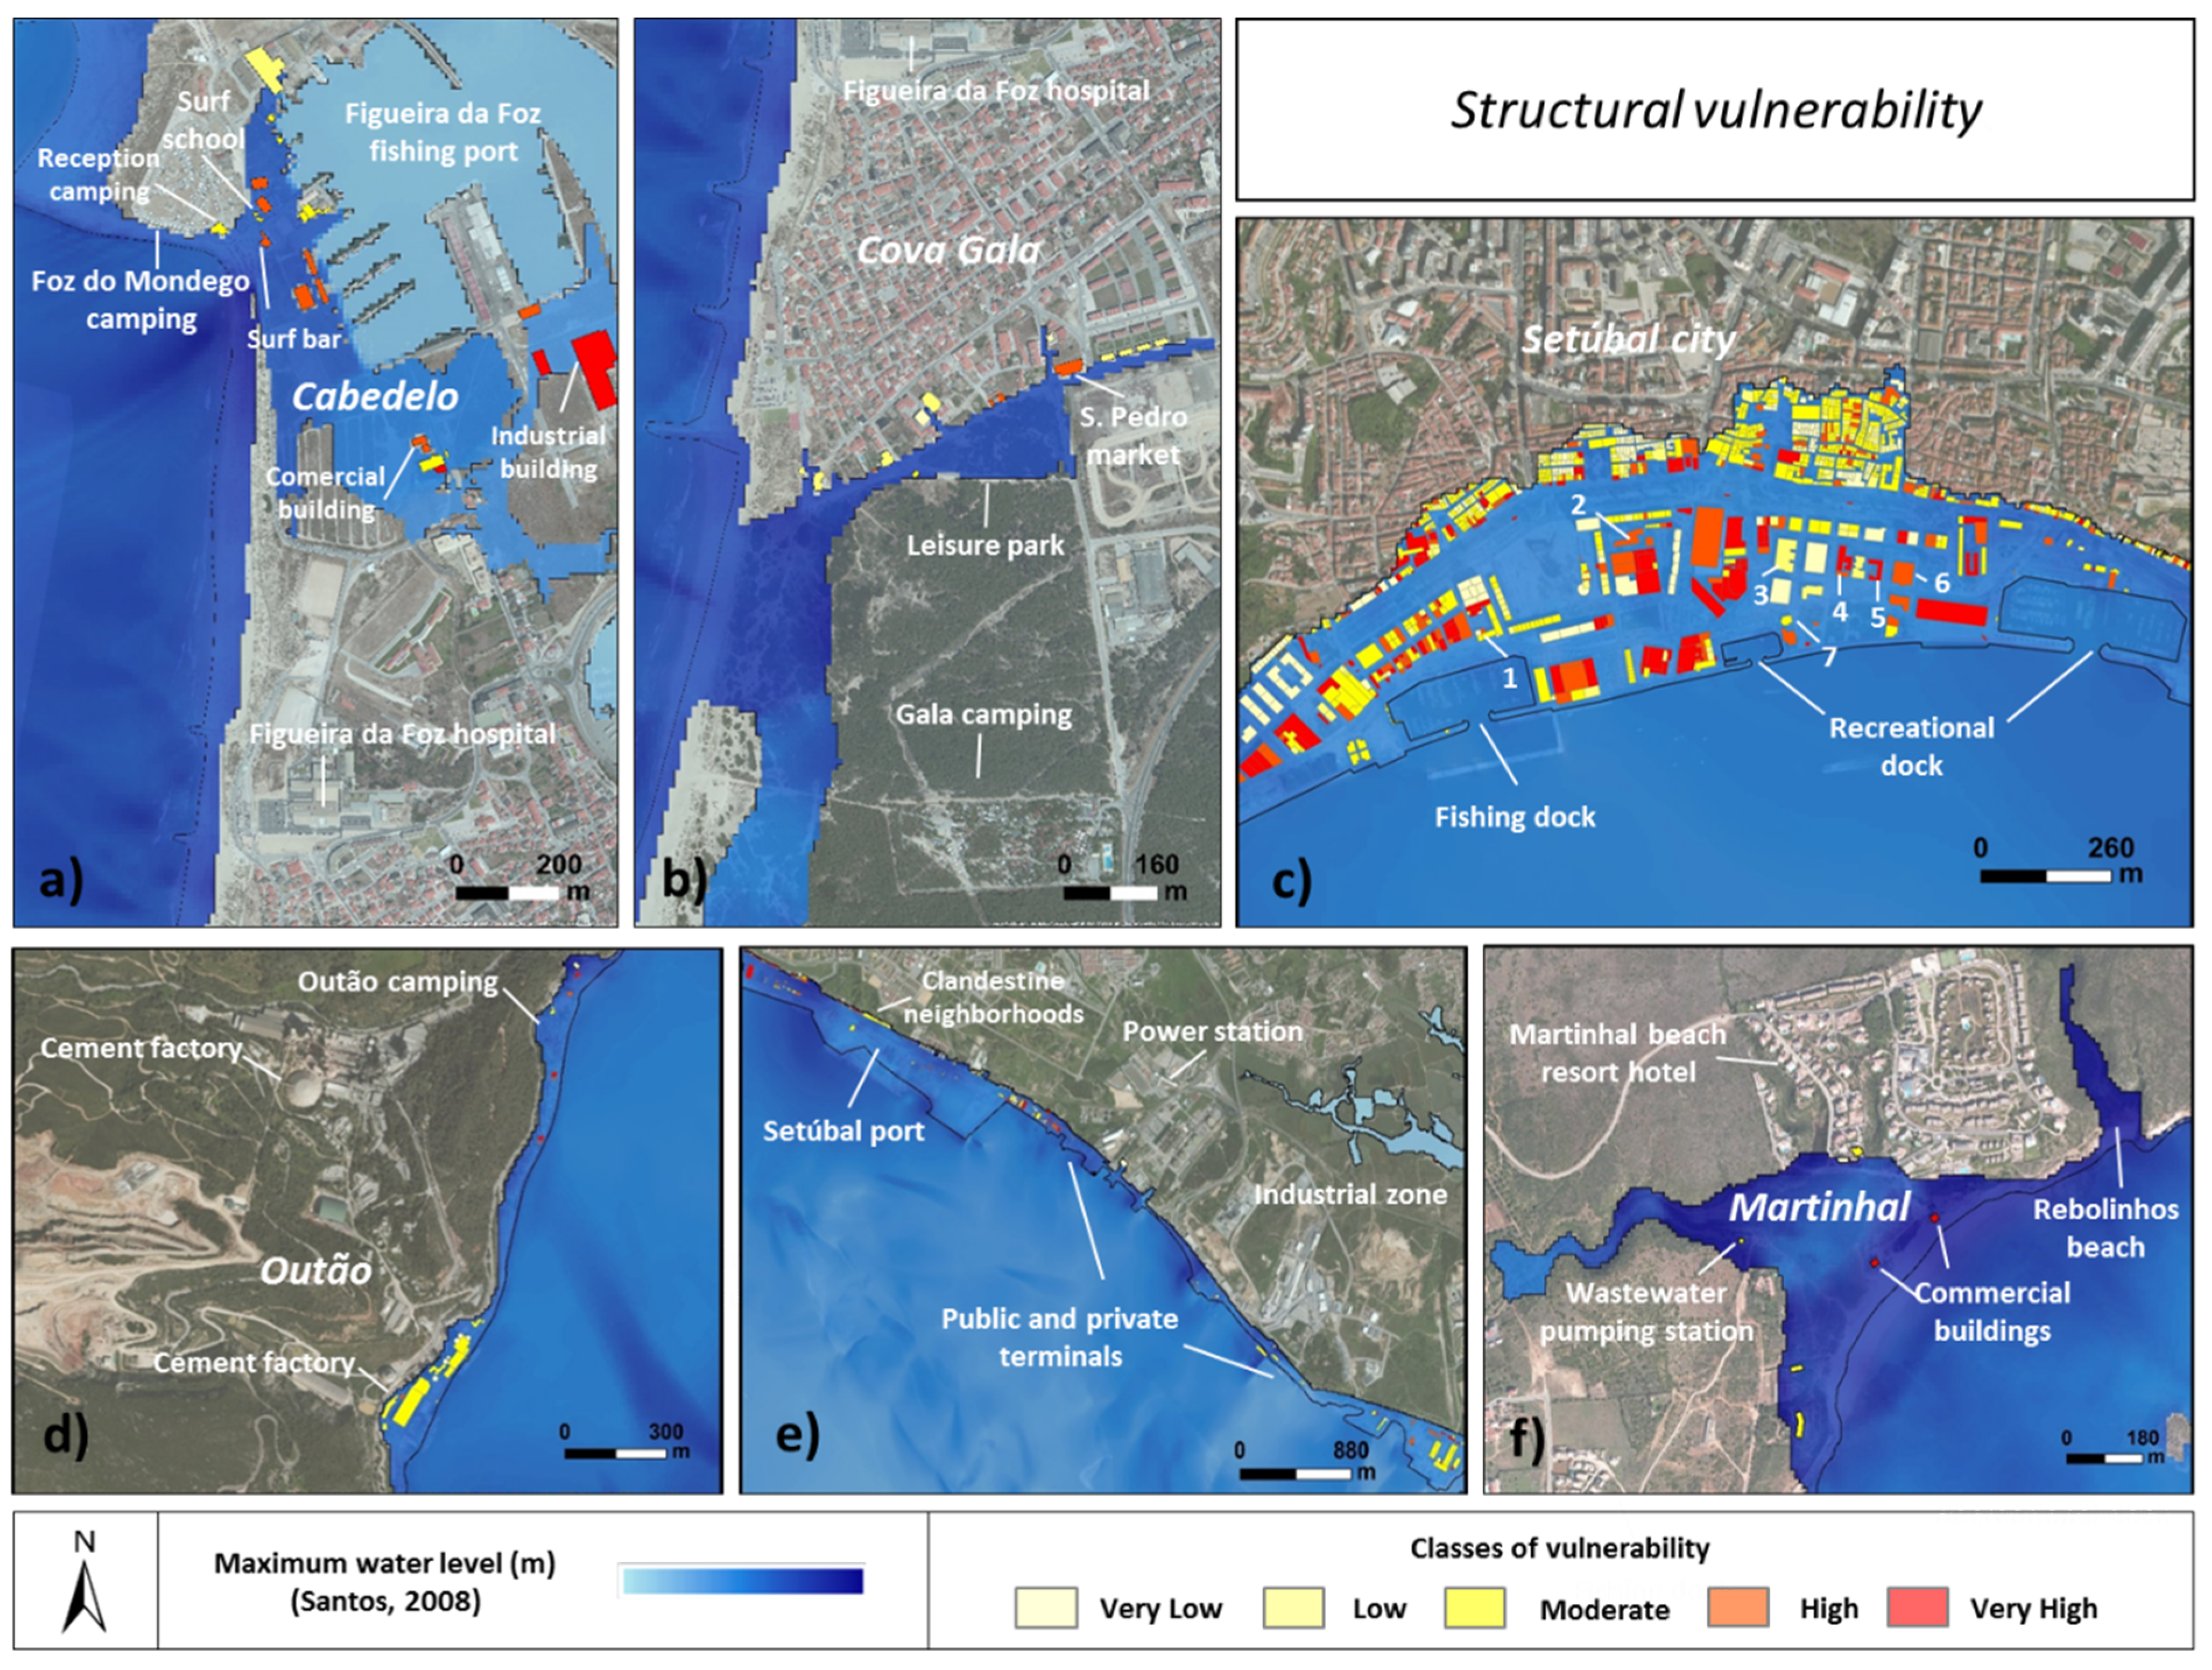
Figure 15 shows the structural vulnerability, with vulnerability varying between very low and very high. By overlaying the 1755 Lisbon tsunami inundation model with current buildings footprints, we identified a total of 22 buildings in Cabedelo that would potentially be affected by a tsunami (Figure 15a). The structural vulnerability of these buildings varied from low to very high. Table 6 shows that most of the buildings exhibited moderate to high vulnerability. Most buildings of concern were in the outbuilding/warehouse, services/industrial and commercial categories. With regard to residential buildings, only one was potentially affected by the worst-case scenario tsunami. Despite a strong industrial and commercial component, Cabedelo is also an important seaside tourism area characterized by a high influx of people on weekends and during the summer. The camping area has a maximum capacity of 1000 people and is open from January to November. This zone is also much appreciated by surfers because of the natural beach and sea conditions and is a popular choice for their activities.
Figure 15. Structural vulnerability: (a) Cabedelo; (b) Cova Gala; (c) City of Setúbal; (d) Outão; (e) Industrial zone; and (f) Martinhal.
Water 07 04971 g015
In Cova Gala, a total of 15 buildings (Table 6) were potentially affected by a worst-case scenario tsunami (Figure 15b), with vulnerabilities ranging between very low and high. An analysis by vulnerability class shows that most buildings at this site have low vulnerability. The majority of buildings (13) are exclusively residential, one has a commercial function and the other is an outbuilding. Of the 13 buildings that are exclusively residential, eight exhibit low vulnerability and only two are highly vulnerable.
In the urban area of Setubal, a total of 1259 buildings (Table 6) were identified as potentially affected by the worst-case scenario tsunami (Figure 15c), with vulnerabilities ranging between very low and very high. Of the total, 18% of buildings have a very low structural vulnerability, 16% low, 41% moderate, 13% high and 12% very high vulnerability. Fifty-five percent of the buildings are mixed use, 29% of the buildings are exclusively residential and 22% have a secondary function in addition to a residential function. 5% of potentially affected buildings relate to critical infrastructure and are of strategic importance for emergency response and normal societal functioning. Some of these buildings are shown in Figure 15c and include: (1) a fire station with moderate vulnerability; (2) a kindergarten with high vulnerability; (3) a courthouse with low vulnerability; (4) a port captaincy office with high vulnerability; (5) a customs house with very high vulnerability; (6) a police station with high vulnerability; and (7) a port administration building with moderate vulnerability (the methodological approach only considered the port buildings for the structural vulnerability analysis, because the on-water port structures are presented in the morphological vulnerability, namely through the land use occupation).
In Outão (Figure 15d), a total of 32 buildings were identified as potentially affected by the worst-case scenario tsunami (Table 6), with vulnerabilities varying between very low and very high. Most of the buildings exhibited a moderate vulnerability. Typologically, the analysis of potentially affected buildings shows that the vast majority of buildings (22 buildings) are associated with existing cement factory and are industrial in nature. Eight buildings are located in the camping area, including a reception building, a coffee shop as well as a number of support buildings. There are only two exclusively residential buildings in the potentially flooded area.
Regarding the industrial area (Figure 15e), a total of 325 potentially affected buildings were identified, with vulnerabilities varying between very low and very high (Table 6). The analysis of buildings by vulnerability class shows that 11.7% have very low structural vulnerability, 8.6% low, 26.4% moderate, 18% high and 35% very high structural vulnerability. In typological terms, the buildings affected include outbuilding/warehouses and support buildings in the industrial and commercial zones, which represent 31% of all potentially affected buildings (102 buildings); exclusively residential buildings (86 buildings, 26% of total) and buildings related to services/industry (65 buildings, 20% of total). Additional affected buildings include critical infrastructure such as power stations, industrial warehouses and support buildings for the Setúbal port’s activity.
Finally, at Martinhal (Figure 15f) a total of seven potentially affected buildings were identified (Table 6), with vulnerability levels varying between very low and very high. Three buildings are exclusively residential, three have a commercial function, one is an outbuilding and one is a wastewater pumping station. Although the number of buildings potentially affected may seem low, Martinhal is a natural area with a strong beach tourism presence and is characterized by fluctuating population flows that increase on weekends and during the bathing season, when the entire beach has the potential to be completely inundated.
Table 6. Percentage and number of buildings by classes of vulnerability.
Study AreasAnalyzed Buildings (% of Analyzed Buildings in the Total Municipality Affected Buildings)Classes of VulnerabilityNumber of Buildings by Class
Cabedelo15.3Low1
Moderate10
High8
Very High3
Cova Gala10.4Very Low2
Low8
Moderate1
High4
City of Setubal62.8Very Low219
Low202
Moderate519
High166
Very High153
Outão2.3Very Low6
Low1
Moderate16
High5
Very High4
Industrial zone23.3Very Low38
Low28
Moderate86
High59
Very High114
Martinhal7.0Very Low1
Low1
Moderate3
Very High2

4. Discussions and Conclusions
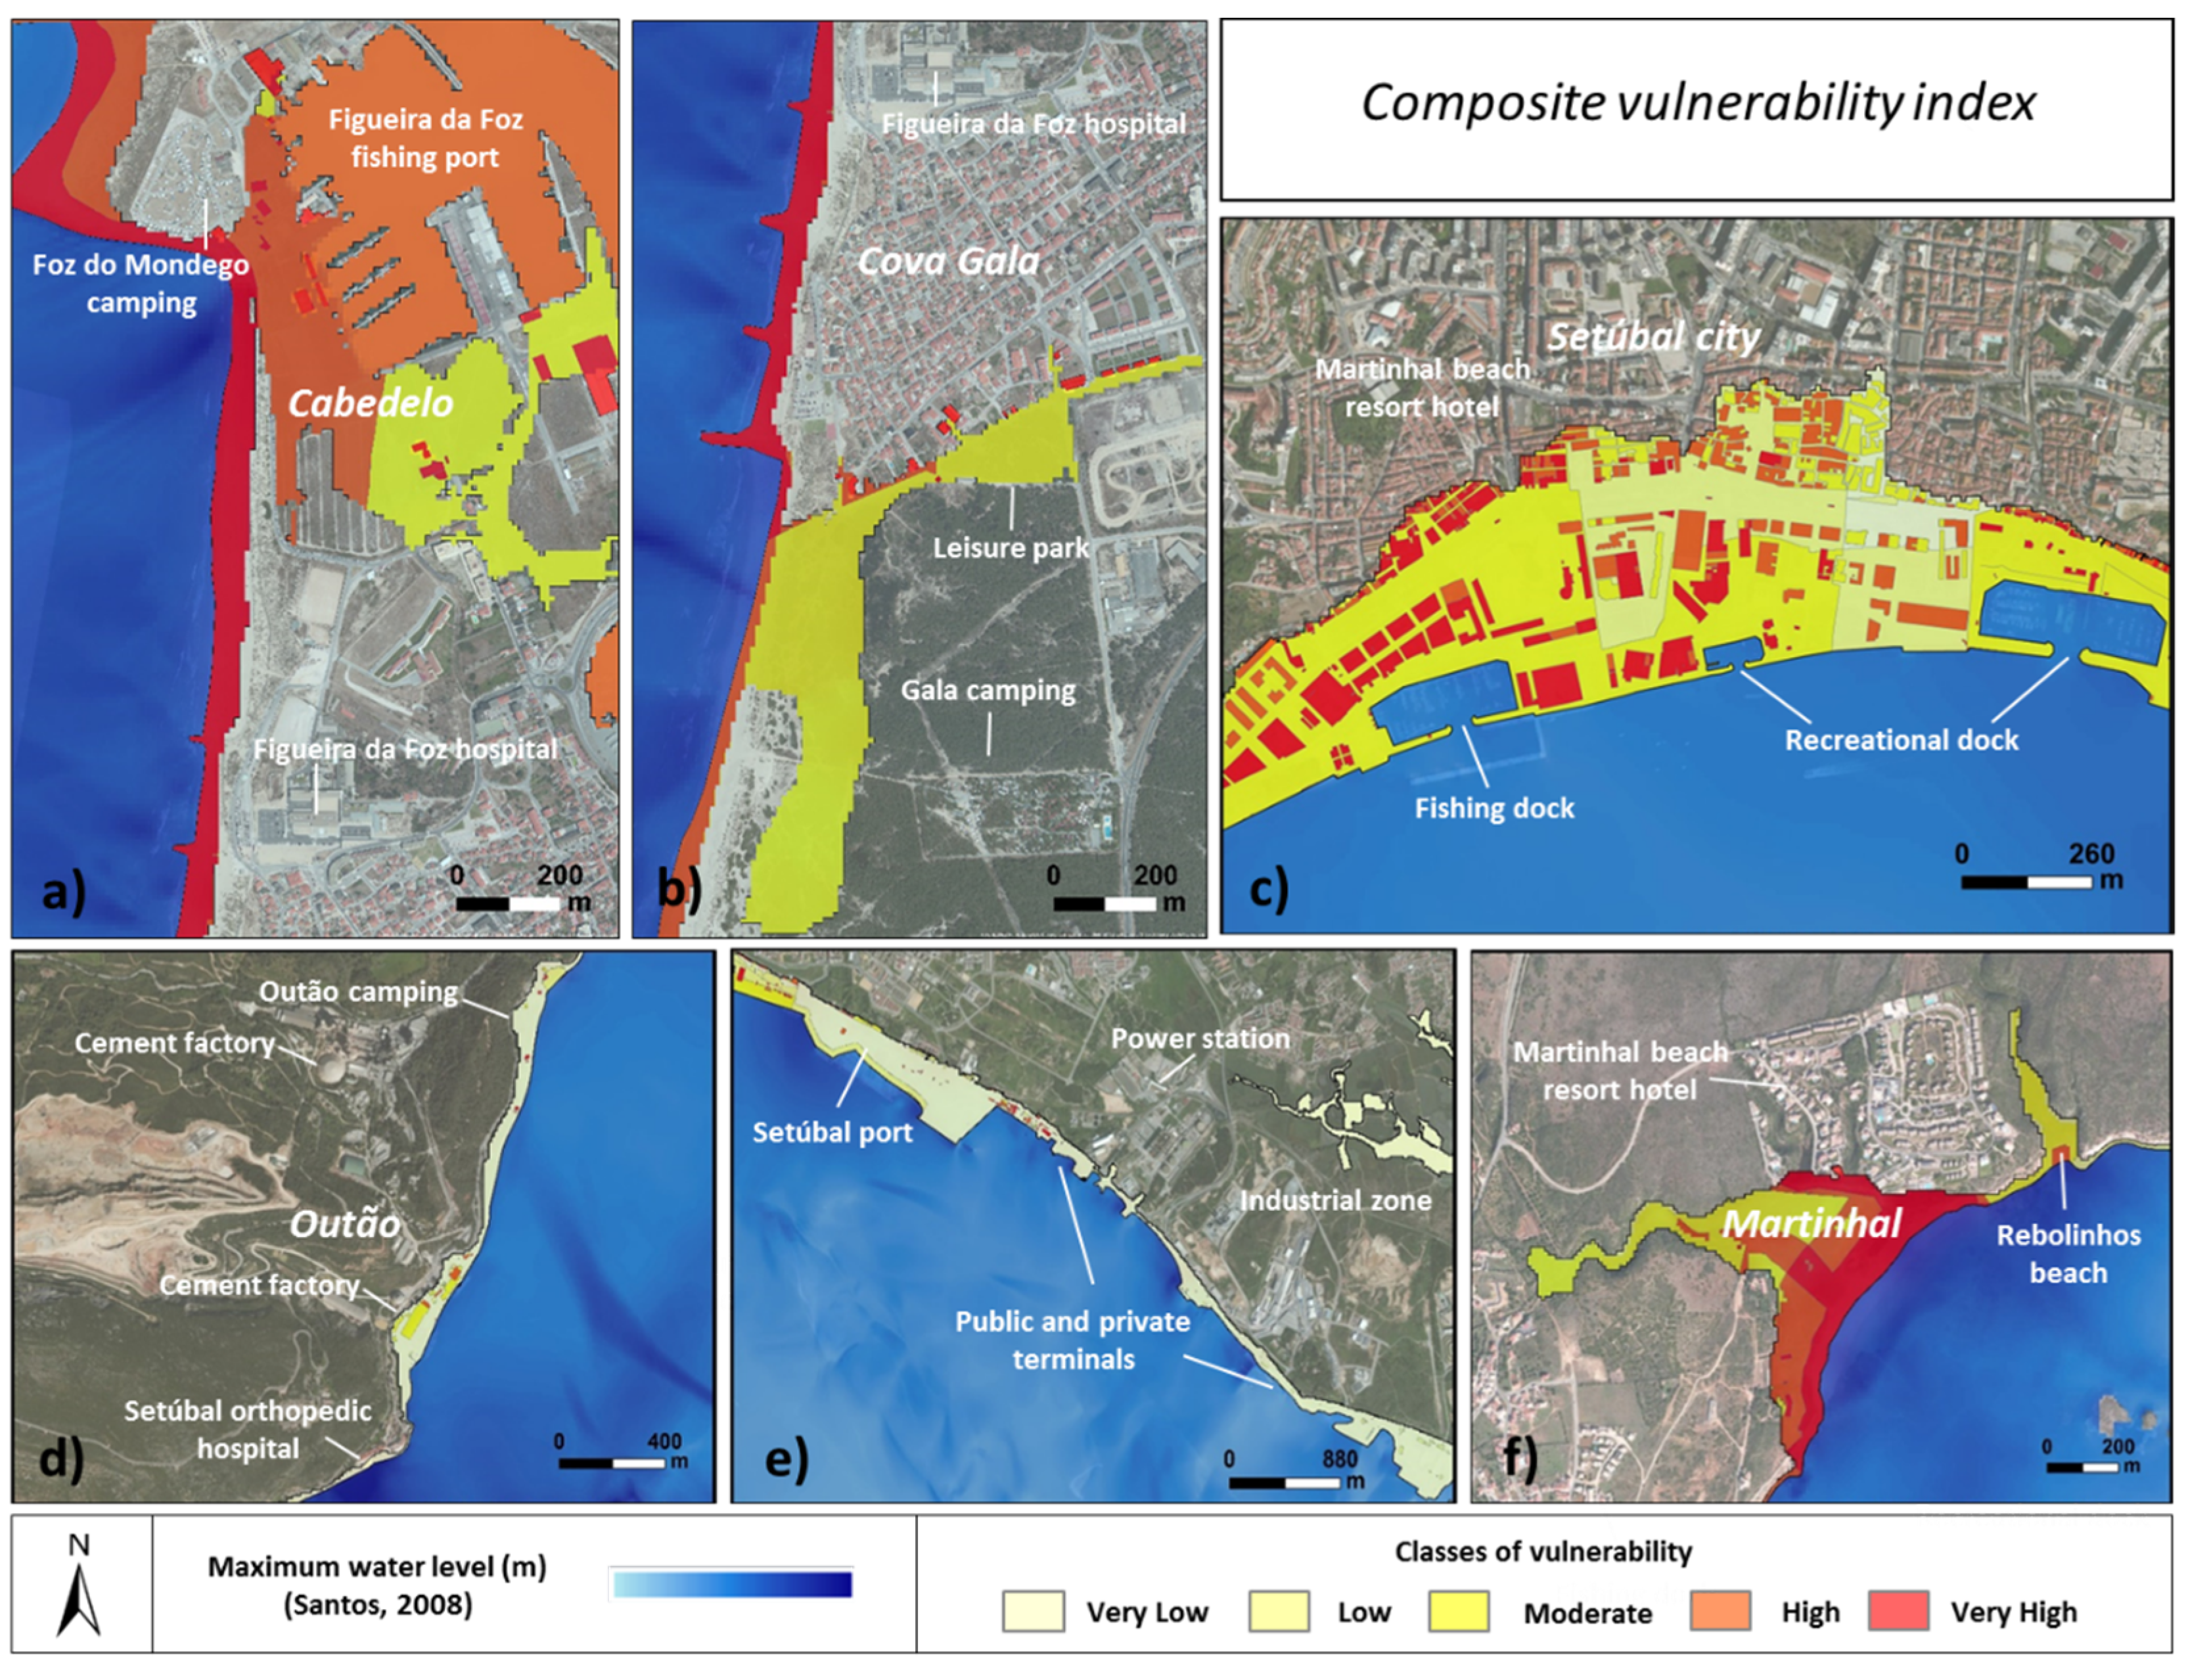
This study analyzed areas with different characteristics (beach-use, residential and industrial areas) to understand the different dynamics associated with these land-use characteristics. After calculating the morphological, structural, social and taxable property vulnerabilities, the Composite Vulnerability Index (CVI) that results from the combination of these components was calculated, and is presented in the Figure 16.
The results highlight different behaviors and dynamics between study regions. Table 7 shows the percent of affected area by CVI class for all three areas categories analyzed. Beach-use areas clearly have a higher CVI when compared to the industrial and residential areas. Seventy-four percent of affected beach-use areas is classified with a high or very high CVI, with a clear emphasis on morphological component of vulnerability associated with distance to the coastline and slope. This is evidenced by the existence of the highest CVI values near the coast and in areas of lower slopes, as well as decreases in vulnerability with increasing distance from the coastline (Figure 16a,f). It is also supported by the fact that the vulnerability in the area of potentially affected buildings is classified as high and very high.
Figure 16. Composite Vulnerability Index (CVI): (a) Cabedelo; (b) Cova Gala; (c) City of Setúbal; (d) Outão; (e) Industrial zone; and (f) Martinhal.
Water 07 04971 g016
Table 7. Percentage of area by CVI vulnerability classes.
Type of the AreaCVI(%) of Area
Beach-use areasLow2
Moderate24
High50
Very High24
Residential areasVery Low3
Low15
Moderate55
High12
Very High15
Industrial areasVery Low82
Low10
Moderate6
High1
Very High1
Furthermore, the lowest CVI values are in industrial areas, with 92% of such areas classified with a low or very low CVI. A regional distinction in CVI among industrial areas was clearly observed and analyzed; areas with buildings largely had CVI values between moderate and very high, while the rest of area had CVI values from very low to low (Figure 16d,e). This clearly indicates that structural elements are an important component differentiating vulnerability. Taxable property, structural vulnerability and the parameter use and land cover, belonging to the morphological component of vulnerability, clearly delineate the composite vulnerability of industrial areas.
Most residential areas (73%) had a CVI ranging from very low and moderate. In these areas, the CVI value is strongly influenced by structural vulnerability, with the highest values coinciding with building sites (Figure 16b,c). In addiotion, noteworthy is the influence of the social and tax elements on the final value of CVI in residential areas.
Clearly, the intrinsic characteristics of the region and the types of activities carried out there influence the composite vulnerability of the territory. In the analyzed areas, morphology decisively influences the vulnerability of seaside areas, whereas residential areas are strongly affected by structural, tax and social vulnerability. On the other hand, the vulnerability of industrial areas is largely governed by the tax and structural vulnerability of the region.
With regard to buildings potentially affected by a tsunami, the calculation of the structural vulnerability and the analysis of typology strengthened the overall results, allowing us to identify and highlight differences between the study areas (Table 8). For example, 51% of potentially affected buildings located in the industrial areas exhibit high and very high vulnerabilities. In beach-use areas this value is 45%, and in residential areas it is 25%. The high value observed for industrial areas can be explained by the dominant building types (Service/Industry and Outbuilding/warehouse) because many of these buildings are prefabricated (including buildings to support industrial activities) and many also have significant structural limitations. Conversely, the highest percentage of buildings classified with very low and low vulnerabilities are located in residential areas (34%) followed by industrial areas (20%) and seaside areas (18%).
A typological analysis of potentially affected buildings allowed us to identify functional differences in terms of the building of the analyzed areas. In the beach-use areas (69%) and industrial areas (55%), Services/Industry and outbuilding/warehouse buildings dominate the landscape. In residential areas, mixed-use buildings dominate, with 37% of the 55% of buildings designated as mixed-used categorized as not exclusively residential. In terms of exclusively residential buildings, the highest percent of affected buildings are located in residential areas (30%). In industrial areas, exclusively residential buildings account for 25% of all buildings and most of these buildings are part of informal settlements built near old industrial complexes (e.g., Quinta da Parvoíce and Vila Maria). As a result, these buildings have serious structural constraints that contribute to the high structural vulnerability values of the area. In beach-use areas, this value is 14%. Finally, potentially affected critical infrastructure was also identified and analyzed. In residential areas, critical infrastructure accounts for 4% of all potentially affected buildings. For example, in the urban area of Setúbal, a set of strategic buildings associated with city management and crisis response (e.g., police, firefighters, schools, custom house, and captaincy) was identified. In industrial areas, 4% of potentially affected buildings were related to critical infrastructure, primarily power transformer stations.
Table 8. Percentage of buildings by vulnerability classes and by typology.
Typology of the AreaStructural Vulnerability(%) of BuildingsTypology of Building(%) of Buildings
Beach-use areasVery Low3Exclusively Residential14
Low7Commercial17
Moderate45Services/Industry35
High28Outbuilding/warehouse34
Very High17
Residential areasVery Low17Exclusively Residential30
Low17Commercial9
Moderate41Services/Industry1
High13Outbuilding/warehouse1
Very High12Mixed type55
Critical buildings4
Industrial areasVery Low12Exclusively Residential25
Low8Commercial8
Moderate29Services/Industry26
High18Outbuilding/warehouse29
Very High33Mixed type8
Critical buildings4
The multidimensional methodology used in this study allows us to approach the issue of regional vulnerability from multiple perspectives and in great detail, responding to concerns raised in [36,37,38,39,40]. The calculation of morphological, structural, social and tax elements of vulnerability, complemented by the Composite Vulnerability Index, allowed us to obtain a set of outputs that contributed to the analysis and evaluation of individual and aggregate elements of regional vulnerability. This strengthened the methodology and distinguished it in relation to its precedents. On the other hand, the various outputs produced can and should serve as a starting point in the emergency management process and are a working tool for different stakeholders to analyze, discuss and implement prevention, reduction and mitigation measures related to tsunami risks.
The application of this methodology also enables the identification of the most vulnerable areas and the identification of vulnerabilities associated with different potentially affected buildings, enabling the creation of plans and evacuation routes. It also allows for the identification of buildings that serve as shelters for vertical evacuation. Recognizing the importance of the vulnerability in seaside tourism areas with seasonal occupation peaks reinforces the necessity of adequate awareness systems in these areas.
When comparing the historical accounts for the three municipalities in Table 1 with the territorial vulnerability results, the increase is very evident from the elements exposed to a potential inundation caused by tsunami impact, which determine a large number of fatalities and damages. An event similar to the 1755 tsunami would potentially cause a wide destruction of the urban fabric of the city of Setubal, including natural areas and some critical infrastructure, and it would affect the industrial and port activities, with clear disruption to industrial and tertiary activities. In the municipality of Vila do Bispo, a potential event would cause heavy losses in relation to the seasonality of tourism, but also to the tertiary economy and fishing activities. These current data contradict the reduced societal impact in the event of 1755 for this study area. In the municipality of Figueira da Foz, several coastal neighborhoods would potentially be hit and destroyed, and the port activities and estuarine agriculture would be affected. A potential tsunami inundation impact in this small-sized city would cause issues in societal function, namely related with access to the hospital, which is located in inundation area proximity.
The results also allow the adoption of risk prevention and mitigation measures related to the impact of tsunamis. The vulnerability outputs enable the selection of planning strategies related to the land-use and occupation, defining areas with several occupation restrictions or removal from affected areas any infrastructure critical for society to function. Still in the planning framework processes, the results can support specific regulation for building, according to the vulnerability zoning. The social vulnerability component of data supports a warning and alert system adjusted for different risk groups and establishes forms of communication tailored to the sectorial activities that take place in the areas directly affected by the flood or the surrounding areas [41,42,43].
With the knowledge of vulnerability resulting from urban occupation, type of occupation of the buildings and the characteristics of users, civil protection resources and emergency procedures, namely through the plan management, the warning capabilities and alerts, evacuation support and rescue ranking, as mention by different authors, can be adjusted and scaled [38,44,45].
The introduction of this composite methodology allows for a more precise idea about a tsunami’s local impact and the major societal disruptions enable an integrated view of municipal, sites and buildings data. These made possible a management and planning process by identifying areas of potentially affected critical infrastructure and urban fabric, allowing timely intervention in these areas to reduce vulnerabilities or plan for their relocation outside of the danger area. This local approach is more recognized by land use planning or emergency municipal managers [46,47], in result of the distinctive display in the territory of the impacts resulting from a tsunami inundation. Based on these results, it is determined that authorities in the Setúbal study area should carry out of preliminary training exercises and consider relocating the firehouse outside of the impact area.
This multidimensional methodology can be applied to different geographical contexts (seaside, residential and industrial areas) and enables the identification of differences within and among regions. Finally, the results may also assist critical discussion for scientists and managers about methodologically complementary of territorial vulnerability, for example earthquakes and tsunamis on coastal areas.

Acknowledgments

This research was supported by the TsuRiMa Project—TSUnami Risk Management for spatial planning and civil protection (PTDC/CSGEO/118992/2010), funded by the Foundation of Science and Techonology (FCT), Portugal.

Author Contributions

Leandro Barros was responsible for the cartography and statistical analysis. Leandro Barros and André Fonte conducted the data collection. Alexandre Oliveira Tavares was responsible for the methodological approach and discussion topics. Angela Santos conducted the supporting numerical model of tsunami inundation. All authors contributed to the discussion and conclusions.

Conflicts of Interest

The authors declare no conflict of interest.

References

  1. Santos, A.; Koshimura, S. The Historical Review of the 1755 Lisbon Tsunami. J. Geodesy Geomat. Eng. 2015, 1, 38–52. [Google Scholar]
  2. Santos, A. Tsunami Hazard Assessment in Portugal by the Worst Case Scenario: The November 1st, 1755 Lisbon Tsunami. Ph.D. Thesis, Tohoku University, Sendai, Japan, 11 September 2008. [Google Scholar]
  3. Baptista, M.; Miranda, J. Revision of the Portuguese catalog of tsunamis. Nat. Hazards Earth Syst. Sci. 2009, 9, 9–25. [Google Scholar] [CrossRef]
  4. Small, C.; Nicholls, R.J. A global analysis of human settlement in coastal zones. J. Coast. Res. 2003, 19, 584–599. [Google Scholar]
  5. Balk, D.; Montgomery, M.R.; McGranahan, G.; Kim, D.; Mara, V.; Todd, M.; Buettner, T.; Dorélien, A. Mapping urban settlements and the risks of climate change in Africa, Asia and South America. In Population Dynamics and Climate Change; Guzmán, J.M., Martine, G., McGranahan, G., Schensul, D., Tacoli, C., Eds.; United Nations Population Fund (UNFPA), International Institute for Environment and Development (IIED): New York, NY, USA; London, UK, 2009; pp. 80–103. [Google Scholar]
  6. Neumann, B.; Vafeidis, A.T.; Zimmermann, J.; Nicholls, R.J. Future Coastal Population Growth and Exposure to Sea-Level Rise and Coastal Flooding—A Global Assessment. PLoS ONE 2015, 10, e0131375. [Google Scholar] [CrossRef] [PubMed]
  7. IOC/UNESCO. IMO, FAO, UNDP. A Blueprint for Ocean and Coastal Sustainability; IOC/UNESCO: Paris, France, 2011. Available online: http://www.stakeholderforum.org/fileadmin/files/Opening%20Watson-Wright%20Monaco.pdf (accessed on 9 September 2015).
  8. Lichter, M.; Vafeidis, A.T.; Nicholls, R.J.; Kaiser, G. Exploring Data-Related Uncertainties in Analyses of Land Area and Population in the “Low-Elevation Coastal Zone” (LECZ). J. Coast. Res. 2011, 27, 757–768. [Google Scholar] [CrossRef]
  9. Mcgranahan, G.; Balk, D.; Anderson, B. The rising tide: Assessing the risks of climate change and human settlements in low elevation coastal zones. Environ. Urban. 2007, 19, 17–37. [Google Scholar] [CrossRef]
  10. Estatégia Nacional Para a Gestão Integrada da Zona Costeira; Instituto da Água: Lisbon, Portugal, 2009. Available online: http://w3.ualg.pt/~jdias/JAD/ebooks/ENGIZC_JAD.pdf (accessed on 20 February 2015).
  11. European Environment Agency (EEA). The Changing Faces of Europe’s Coastal Area; European Environment Agency (EEA): Copenhaga, Denmark, 2006. [Google Scholar]
  12. Santos, A.; Mendes, S.; Corte-Real, J. Impacts of the storm Hercules in Portugal. Finisterra 2014, 98, 197–220. [Google Scholar] [CrossRef]
  13. Santos, A.; Koshimura, S.; Imamura, F. The 1755 Lisbon Tsunami: Tsunami source determination and its validation. J. Disaster Res. 2009, 4, 41–52. [Google Scholar]
  14. Papathoma, M.; Dominey-Howes, D.; Zong, Y.; Smith, D. Assessing tsunami vulnerability, an example from Herakleio, Crete. Nat. Hazards Earth Syst. Sci. 2003, 3, 377–389. [Google Scholar] [CrossRef]
  15. Papathoma, M.; Dominey-Howes, D. Tsunami vulnerability assessment and its implications for coastal hazard analysis and disaster management planning, Gulf of Corinth, Greece. Nat. Hazards Earth Syst. Sci. 2003, 3, 733–747. [Google Scholar] [CrossRef]
  16. Dominey-Howes, D.; Papathoma, M. Validating a tsunami vulnerability assessment model (the PTVA model) using field data from the 2004 Indian Ocean tsunami. Nat. Hazards 2007, 40, 113–136. [Google Scholar] [CrossRef]
  17. INE. Instituto Nacional de Estatística, Censos de Portugal de 2011. Available online: http://www.ine.pt (accessed on 20 February 2015).
  18. Henriques, E.B. A cidade, destino de turismo. Rev. Fac. Letras Geogr. 2003, XIX, 163–172. [Google Scholar]
  19. Santos, A.; Tavares, A.O.; Emidio, A. Comparative tsunami vulnerability assessment of an urban area: An analysis of Setúbal city, Portugal. Appl. Geogr. 2014, 55, 19–29. [Google Scholar] [CrossRef]
  20. Pendleton, E.; Barras, J.; Williams, S.; Twichell, D. Coastal Vulnerability Assessment of the Northern Gulf of Mexico to Sea-Level Rise and Coastal Change. U.S Geological Survey Report, 2010–1146. Available online: http://pubs.usgs.gov/of/2010/1146/pdf/ofr2010-1146.pdf (accessed on 1 October 2014).
  21. Ismail, H.; Abd Wahab, A.; Mohd Amin, M.; Mohd Yunus, M.; Jaffar Sidek, F.; Esfandier, J.B. A 3-tier tsunami vulnerability assessment technique for the north-west coast of Peninsular Malaysia. Nat. Hazards 2012, 63, 549–573. [Google Scholar] [CrossRef]
  22. Dall’Osso, F.; Gonella, M.; Gabbianelli, G.; Withycombe, G.; Dominey-Howes, D. A revised (PTVA) model for assessing the vulnerability of buildings to tsunami damage. Nat. Hazards Earth Syst. Sci. 2009, 9, 1557–1565. [Google Scholar] [CrossRef] [Green Version]
  23. Cutter, S.; Boruff, B.; Shirley, W. Social vulnerability to environmental hazards. Soc. Sci. Q. 2003, 84, 242–261. [Google Scholar] [CrossRef]
  24. Schmidtlein, M.; Deutsch, R.; Piegorsch, W.; Cutter, S. A Sensitivity Analysis of the Social Vulnerability Index. Risk Anal. 2008, 28, 1099–1114. [Google Scholar] [CrossRef] [PubMed]
  25. Mendes, J.M. Social Vulnerability Indexes as Planning Tools: Beyond the preparedness paradigm. J. Risk Res. 2009, 12, 43–58. [Google Scholar] [CrossRef]
  26. Chen, W.; Susan, S.; Emrich, C.; Shi, P. Measuring social vulnerability to natural hazards in the Yangtze river delta region, China. Int. J. Disaster Risk Sci. 2013, 4, 169–181. [Google Scholar] [CrossRef]
  27. AT Autoridade Tributária e Aduaneira. Available online: http://www.e-financas.gov.pt/SIGIMI/default.jsp (accessed on day February 2015).
  28. PORDATA. Base de dados Portugal Contemporâneo. Available online: http://www.pordata.pt (accessed on 20 February 2014).
  29. Carta Social. Available online: http://www.cartasocial.pt (accessed on 18 February 2014).
  30. Comrey, A.; Lee, H. A First Course in Factor Analysis; Physiology Press: New York, NY, USA, 2009; pp. 1–430. [Google Scholar]
  31. Barros, J.L.; Emídio, A.; Santos, A.; Tavares, A.O. Composite Methodology for Tsunami Vulnerability Assessment Based on the Numerical Simulation of 1755 Lisbon Tsunami—Application on Two Portuguese Coastal Areas. In Safety and Reliability: Methodology and Applications; Taylor & Francis Group: London, UK, 2015; pp. 1581–1588. [Google Scholar]
  32. Mendes, J.M.; Tavares, A.O.; Freiria, S.; Cunha, L. Vulnerabilidade social aos riscos naturais e tecnológicos em Portugal. Rev. Crít. Ciênc. Soc. 2011, 93, 95–128. [Google Scholar]
  33. Bana e Costa, C.A.; Silva, P.A.; Correia, F.N. Multicriteria Evaluation of Flood Control Measures: The case of Ribeira do Livramento. Water Resour. Manag. 2004, 18, 263–283. [Google Scholar] [CrossRef]
  34. Bana e Costa, C.A.; Chargas, M. An example of how to use MACBETH to build a quantitative value model based on qualitative value judgements. Eur. J. Oper. Res. 2004, 153, 323–331. [Google Scholar] [CrossRef]
  35. Tavares, A.O.; Barros, J.L.; Santos, A. Tsunami Vulnerability in Two Coastal Areas of Portugal: A Multidimensional Approach. In Risk, Models and Applications, Lecture Notes in Information Sciences; CODATA: Berlin, Germany, 2015; Volume 7, pp. 91–103. [Google Scholar]
  36. Wisner, B.; Blaikie, P.; Cannon, T.; Davis, I. At Risk: Natural Hazards, People’s Vulnerability and Disasters, 2nd ed.; Taylor & Francis Group: London, UK, 2004; pp. 1–471. [Google Scholar]
  37. Atillah, A.; El Hadani, D.; Moudni, H.; Lesne, O.; Renou, C.; Mangin, A.; Rouffi, F. Tsunami vulnerability and damage assessment in the coastal area of Rabat and Salé, Morocco. Nat. Hazards Earth Syst. Sci. 2011, 11, 3397–3414. [Google Scholar] [CrossRef]
  38. Tavares, A.O.; Santos, P.P.; Freire, P.; Fortunato, A.B.; Rilo, A.; Sá, L. Flooding hazard in the Tagus estuarine area: The challenge of scale in vulnerability assessments. J. Environ. Sci. Policy 2015, 51, 238–255. [Google Scholar] [CrossRef]
  39. Santos, P.P.; Tavares, A.O. Basin Flood Risk Management: A Territorial Data-Driven Approach to Support Decision-Making. Water 2015, 7, 480–502. [Google Scholar] [CrossRef]
  40. Balica, S.F.; Wright, N.G.; van der Meulen, F. A flood vulnerability index for coastal cities and its use in assessing climate change impacts. Nat. Hazards 2012, 52, 73–105. [Google Scholar] [CrossRef]
  41. Adger, W.N.; Hughes, T.P.; Folke, C.; Carpenter, S.R.; Rockström, J. Social-ecological resilience to coastal disasters. Science 2005, 309, 1036–1039. [Google Scholar] [CrossRef] [PubMed]
  42. Gregg, C.E.; Houghton, B.F.; Paton, D.; Johnston, D.M.; Swanson, D.A.; Yanagi, B.S. Tsunami warnings: Understanding in Hawai. Nat. Hazards 2007, 40, 71–87. [Google Scholar] [CrossRef]
  43. Santos, A.; Tavares, A.O.; Queirós, M. Numerical modelling and evacuation strategies for tsunami awareness: Lessons from the 2012 Haida Gwaii Tsunami. Geomat. Nat. Hazards Risk 2015. [Google Scholar] [CrossRef]
  44. Vivacqua, A.S.; Borges, M.R. Taking advantage of collective knowledge in emergency response systems. J. Netw. Comput. Appl. 2012, 35, 189–198. [Google Scholar] [CrossRef]
  45. Spahn, H.; Hoppe, M.; Vidiarina, H.D.; Usdianto, B. Experience from three years of local capacity development for tsunami early warning in Indonesia: Challenges, lessons and the way ahead. Nat. Hazards Earth Syst. Sci. 2010, 10, 1411–1429. [Google Scholar] [CrossRef]
  46. Tavares, A.O.; Santos, P.P. Re-scaling risk governance using local appraisal and community involvement. J. Risk Res. 2014, 17, 923–949. [Google Scholar] [CrossRef]
  47. Birkmann, J.; Cardona, O.D.; Carreño, M.L.; Barbat, A.H.; Pelling, M.; Schneiderbauer, S.; Welle, T. Framing vulnerability, risk and societal responses: The MOVE framework. Nat. Hazards 2013, 67, 193–211. [Google Scholar] [CrossRef]

