Article

Spatiotemporal Distribution of Soil Moisture and Salinity in the Taklimakan Desert Highway Shelterbelt

1
Xinjiang Institute of Ecology and Geography, Chinese Academy of Sciences, Urumqi 830011, Xinjiang, China
2
University of Chinese Academy of Sciences, Beijing 10000, China
3
College of Natural Resources and Environment, Northwest A&F University, Yangling 712100, China
*
Authors to whom correspondence should be addressed.
Water 2015, 7(8), 4343-4361; https://doi.org/10.3390/w7084343
Submission received: 2 June 2015 / Revised: 26 July 2015 / Accepted: 27 July 2015 / Published: 6 August 2015
(This article belongs to the Special Issue Water Resources Assessment and Management in Drylands)

Abstract

:
Salinization and secondary salinization often appear after irrigation with saline water. The Taklimakan Desert Highway Shelterbelt has been irrigated with saline ground water for more than ten years; however, soil salinity in the shelterbelt has not been evaluated. The objective of this study was to analyze the spatial and temporal distribution of soil moisture and salinity in the shelterbelt system. Using a non-uniform grid method, soil samples were collected every two days during one ten-day irrigation cycle in July 2014 and one day in spring, summer, and autumn. The results indicated that soil moisture declined linearly with time during the irrigation cycle. Soil moisture was greatest in the southern and eastern sections of the study area. In contrast to soil moisture, soil electrical conductivity increased from 2 to 6 days after irrigation, and then gradually decreased from 6 to 8 days after irrigation. Soil moisture was the greatest in spring and the least in summer. In contrast, soil salinity increased from spring to autumn. Long time drip-irrigation with saline groundwater increased soil salinity slightly. The soil salt content was closely associated with soil texture. The current soil salt content did not affect plant growth, however, the soil in the shelterbelt should be continuously monitored to prevent salinization in the future.

1. Introduction

In arid and semiarid regions, water scarcity is a serious and chronic environmental problem threatening the ecosystem [1]. To overcome this shortage, lower quality water is widely used [2,3]. For instance, saline groundwater is applied in the ecological shelterbelt in the Taklimakan Desert, the largest mobile desert in China. The desert has a harsh environment with little precipitation and strong evaporative potential [4]. To access oil fields, a highway was built from north to south across the Taklimakan Desert in 1997. A shelterbelt was planted along both sides of the highway in 2003, to limit sand drift into the highway [5]. The shelterbelt, which is sometimes called “Great Green Wall”, consists of several drought- and salt-tolerant plants including Tamarisk L., Haloxylon Bunge, and Calligonum L. [6]. The moving dunes have been successfully stabilized on both sides of the highway for more than ten years. The highway shelterbelt is irrigated with underground water (containing 2.8–29.7 g·L−1 salt). The water comes from 108 wells. Each well irrigates 3.12 × 10³ m2. The water salinity averages 5 g·L−1 [6].
Saline water irrigation can result in an increase in salinity at the soil surface. This process, which is known as secondary salinization, is a major environmental hazard [7,8] that threatens about 6% of the total global land area [9]. Salt accumulation in soil not only affects physical, chemical, and biological soil processes [10], but also reduces soil productivity [11], soil sustainability [12,13], and vegetation growth [14]. Soil salinity in the irrigated areas of Xinjiang has increased 40% from 1983 to 2005 [8]. Previous studies in the Taklimakan Desert Highway Shelterbelt indicated that long-term drip irrigation with saline water irrigation did not significantly increase soil salinity among lateral roots but did significantly increase soil salinity at the soil surface (0–10 cm) [15]. Furthermore, Zhang et al. [6] indicated this salt accumulation was a major threat to the shelterbelt. Drip irrigation with saline water within the shelterbelts may increase soil nutrient content and improve soil structure [15].
Many factors can influence the distribution of soil moisture and salinity. Sumner et al. [16] showed that the salinity at which vegetation growth is negatively affected as soil clay content increases. Furthermore, they observed that soils with high clay content had greater water retention capacity, soil salinity and osmotic potential. Li et al. [17] reported significant differences between the inter-dunes and dune-tops, indicated that different topographic characteristics between plots result in the differences in soil organic carbon (SOC), available nitrogen (AN), and available phosphorus (AP), whereas the heterogeneity of soil pH and electrical conductivity (EC) arise from plant species and their distribution. In the arid desert environment, the aerial parts of vegetation for nutrients retardation are beneficial to soil evolution. Li et al. [15] showed that irrigation salinity water significantly affected soil EC but not soil pH. Salt accumulation in soil increased as irrigation water salinity increased. Low salinity (3.6–15.5 g·L−1) in irrigation water increased SOC, total nitrogen (TN) and total phosphorus (TP). In addition, saline irrigation is beneficial for the development of Aeolian sandy soils, and there has been no salinity hazard to plants with saline irrigation for seven years. There was no obvious profile differentiation because of the short time since shelterbelt establishment, however, the color of the Aeolian sandy soil changed slightly [18].
However, these studies are often limited to point-scale. Information about the spatial patterns of soil moisture content and salinity on the field scale are lacking in this region. Soil salinity and moisture are highly variable over time and space [19,20,21,22], especially in harsh environments. To understand the factors governing hydrological process, information is needed about the spatiotemporal evolution of soil moisture and salinity under saline drip irrigation. Deriving conclusions from soil moisture and salinity measurements at only a few locations may result in large uncertainties because soil moisture and salinity can be highly variable. The prediction of soil moisture and salinity at un-sampled locations creates even more uncertainty. This requires knowledge of soil moisture and salinity magnitude, temporal dynamics, and spatial variability [23]. Since the 1990s, the study of spatiotemporal distribution of soil moisture and salinity was promoted by geostatistical techniques which reduce and quantify these uncertainties [24]. Currently, research interest is growing in mapping soil EC as a surrogate for soil salinity [25]. Zheng et al. [26] characterized the spatiotemporal variability of soil EC in a drip-irrigated field during the cotton growing and determined the factors that influence the spatiotemporal variability of soil salinity. Many findings have demonstrated that spatial and temporal information about soil EC can be used to improve the overall management of irrigated fields [27].
Soil moisture and salinity are essential factors restricting the sustainable development of shelterbelts. Usually, salinity tends to concentrate in shallow soils. To understand soil and plant development along the Taklimakan Desert Highway Shelterbelt, it is important to learn more about the spatiotemporal distribution of soil salinity within irrigation cycles and with seasons. In this study, our objectives were: (1) to characterize the spatiotemporal distribution of soil moisture and salinity either in one single drip-irrigation cycle, or in different growing seasons (spring, summer and autumn); and (2) to determine the factors that influence the spatiotemporal variability of soil moisture and salinity.

2. Materials and Methods
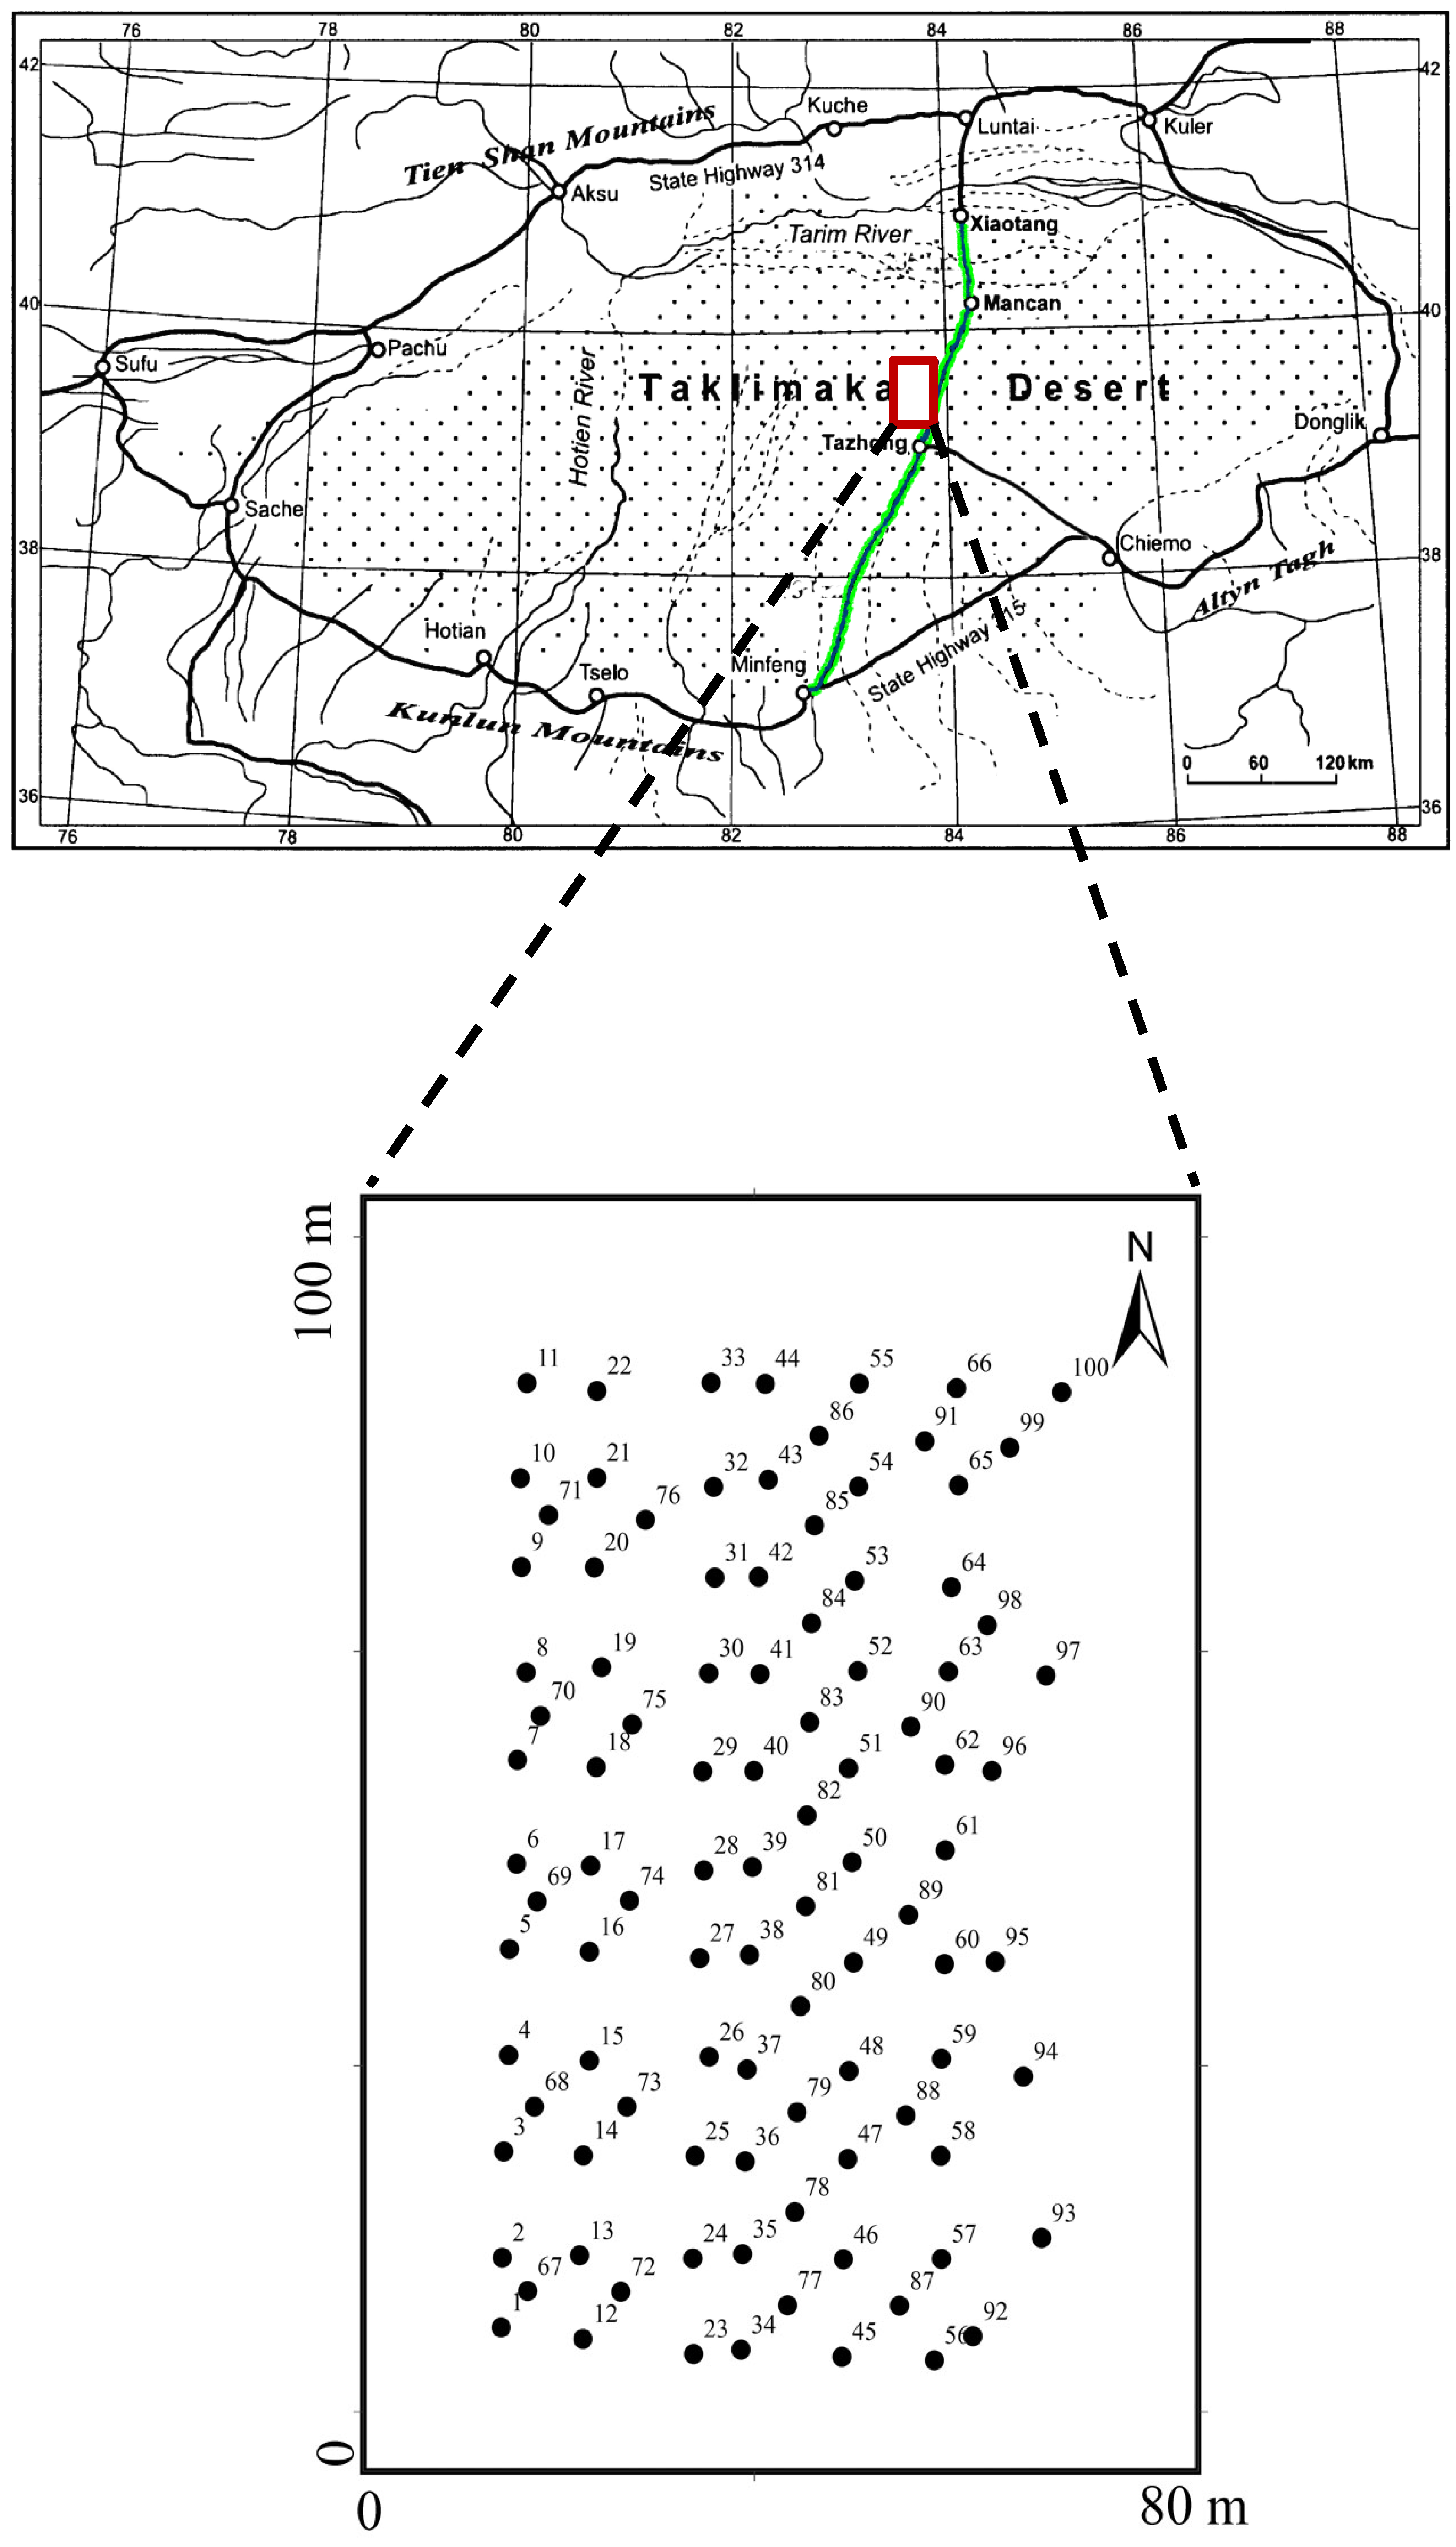
2.1. Study Area

The study was conducted in the Taklimakan Desert Highway Shelterbelt (Figure 1), which is located between 37–42° N and 82–85° E. The region has annual precipitation < 30 mm and annual potential evaporation > 3800 mm; Annual average temperature is 12.7 °C, with the highest temperature of 43.2 °C in August and the lowest temperature of −19.3 °C in January. It has more than 130 days for sand-shifting. The annual average wind speed is 2.5 m·s−1, with wind activity intensity index above 40,000 [5]. Most of the areas along the highway are covered with mobile shifting sands, mainly consisting of fine and very fine sand particles [4]. There are very few natural vegetation and residential animals [5].
Figure 1. Locations of sampling sites at the study area. The green line shows the Taklimakan Desert Highway Shelterbelt. The red box shows the sampling site.
Water 07 04343 g001

2.2. Sampling Design and Soil Analysis

Similar ground landscape, vegetation planting pattern, vegetation species, and irrigation measurements are developed along the highway shelterbelt. The ground landscape is mainly high mobile dunes combined with large complex dune chains. The soil is mainly shifting Aeolian sandy soil. The shelterbelt was planted with a spacing of according to 1 m × 2 m intervals. The shelterbelt is irrigated twice per month, from March to May, and from September to October. Irrigation is applied three times per month, from June to August [6]. The only difference is the salinity of irrigation water, and the salinity around 5 g·L−1 represents most salinity of the irrigation water.
Since the spatial arrangement of shelterbelt controlled by groundwater irrigation is very similar from place to place along the highway shelterbelt, we mainly investigated the spatial distribution of soil water and salt of the shelterbelt irrigated by the most representative salinity, i.e., 4.80 g L−1. The geostatistical non-uniform grid sampling method was used, and 66 points in the shelterbelt, 25 points between the shelterbelts and 9 points in shifting sandy land were selected. In 2014, shallow soil samples (0–10 cm) were collected at each point on 23 April and 8 October. These dates were the middle dates during the irrigation cycle. Soil samples were also collected at each point every two days during one irrigation cycle (10 to 20 July). Light rainfall occurred early in the morning and again one or two hours before sampling on 20 July. In total, about 700 soil samples were taken. Five soil cores (i.e., five replicates) were taken at each grid point which was about 30-cm from the dripper. Each point was recorded with GPS.
Each soil sample was divided into two parts. One part was used to measure soil moisture by the oven-drying method. The second part was air-dried and passed through a 1.0 mm sieve for soil chemical analyses. Topographical and vegetation conditions were noted at each sampling point. Soil SOC, total nitrogen (TN), total phosphorus (TP), total potassium (TK), pH, and particle size distribution were only measured at first sampling time in April. Soil pH and EC were measured in a soil–water suspension with a 1:5 soil: water ratio. The SOC content was determined using the K2Cr2O7–H2SO4 oxidation method of Walkley–Black [28]. Total soil N was determined using the Kjeldahl procedure (UDK140 Automatic Steam Distilling Unit, Automatic Titroline 96, Usmate Velate, Italy). Total soil P was determined by flow injection analysis [28]. Total soil K was determined by flame photometry [29]. Particle size distribution was determined by the pipette method in a sedimentation cylinder, using sodium hexametaphosphate as the dispersing agent [30].

2.3. Descriptive Statistical Analysis

Descriptive statistics including mean, maximum, minimum, standard deviation (SD), coefficient of variation (CV), skewness, and distribution type (DT) among soil properties were calculated using SPSS 13.0. Analysis of variance (ANOVA) analysis was conducted to test the differences of moisture and EC among five sampling times during an irrigation cycle and among three seasons at a significant level of 0.05. Person’s Correlation Analysis was performed to identify the relationship among soil moisture, salinity, other selected physical, chemical factors, and terrain.

2.4. Geostatistics Analysis

Geostatistics were used to explore the variation and spatial dependency of spatially distributed data. The variogram function can be used for Kriging interpolation to generate predictions for unsampled locations within the sampling extent. The GS+ software (version, 9.0; Gamma Design Software 2002) was used to create semivariograms for variance structure of soil moisture and salinity of topsoil [31]. Then, the ordinary Kriging interpolation method by Arcgis 9.3 was adopted to map spatial distribution of soil moisture and salinity [19,32].
A semivariogram was calculated for each soil property as follows [33]:
γ ( h ) = 1 2 N i = 1 N { z ( x i ) z ( x i + h ) } 2
where z(xi) is a sample z at location xi, and N(h) is the number of data pairs separated by h. A variogram function is fitted to the experimental variogram to obtain geostatistics, including nugget variance (C0), structured variance (C), sill (C0 + C), and range (A0). To explore the degree of spatial dependency, the ratio of nugget to sill (i.e., the nugget ratio) was calculated. A nugget ratio < 25% indicates a strong spatial dependency; a nugget ratio > 75% indicates no spatial dependency, otherwise, the spatial dependency is moderate [20].
The most common variogram functions are bounded models with a fixed range (i.e., circular or spherical), or models that approach the sill asymptotically (exponential or Gaussian models). Semivariogram γ(h) for soil salinity during the irrigation cycle and growing period in different seasons were calculated, and the scatterplot of γ(h) versus h were generated. Then, different theoretical semivariance models were used to fit the calculated values and the model with the best-fitting value, which were based on R2.

3. Results and Discussion

3.1. Descriptive Statistics of Soil Properties

Table 1 showed the basic descriptive statistics of soil physical and chemical properties in the shelterbelt. Based on skewness values, SOC, TN, TP, TK, pH, sand, and silt content were normally distributed, while soil moisture, EC, and clay content were log-normally distributed.
The large CV values were obtained for soil moisture (196.99%) and EC (107.00%), indicating a strong spatial variation. The CV values of TN, TP and TK ranged from 22.1% to 54.7%, corresponding to a moderate degree of variability. These results were consistent with other studies [34,35,36]. Corwin et al. [36] reported that CV values for soil nutrient all exceeded 20%. Zhang et al. [37] indicated that soil SOC, TN, TP, TK were in moderate variability in a subtropical Karst forest, which were mainly related to soil parent materials. The lowest CV values were observed for sand content (4.2%). Notably, a relatively small CV value (6.3%) was observed for pH, similar to the surface layer of an agricultural soil [38]. Others have also reported similar findings at various scales [34,39]. The SOC content of all sampling sites ranged from 0.16 to 1.52 g·kg−1, with a mean of 0.65 g·kg−1, indicating that SOC was still in a low level. The CV value of SOC is 49.8%, which could be mainly attributed to planting pattern of the shelterbelt.
Table 1. Statistical summary for selected soil physical and chemical properties.
VariableDescriptive Statistics aDT b
MeanMin.–Max.SDCV (%)Skewness
Moisture (%)1.190.00–10.002.34197.02.53LN
EC (mS·cm−1)1.560.09–11.461.66107.03.82LN
SOC (g·kg−1)9.461.68–27.480.3249.80.58N
TN (g·kg−1)0.060.01–0.190.0354.70.79N
TP (g·kg−1)0.350.17–0.700.0823.90.68N
TK (g·kg−1)7.274.60–8.800.8122.1−0.95N
pH8.327.08–9.480.536.3−0.15N
Sand (%)89.7482.93–98.263.724.2−0.02N
Silt (%)10.241.74–17.073.6936.1−0.05N
Clay (%)0.030.00–0.570.11440.24.80LN
Notes:a Min., minimum; Max., maximum; SD, standard deviation; CV, coefficient of variation; b DT, distribution type; N, normal distribution; LN, log-normal distribution.

3.2. Spatiotemporal Distribution of Soil Moisture and Salinity

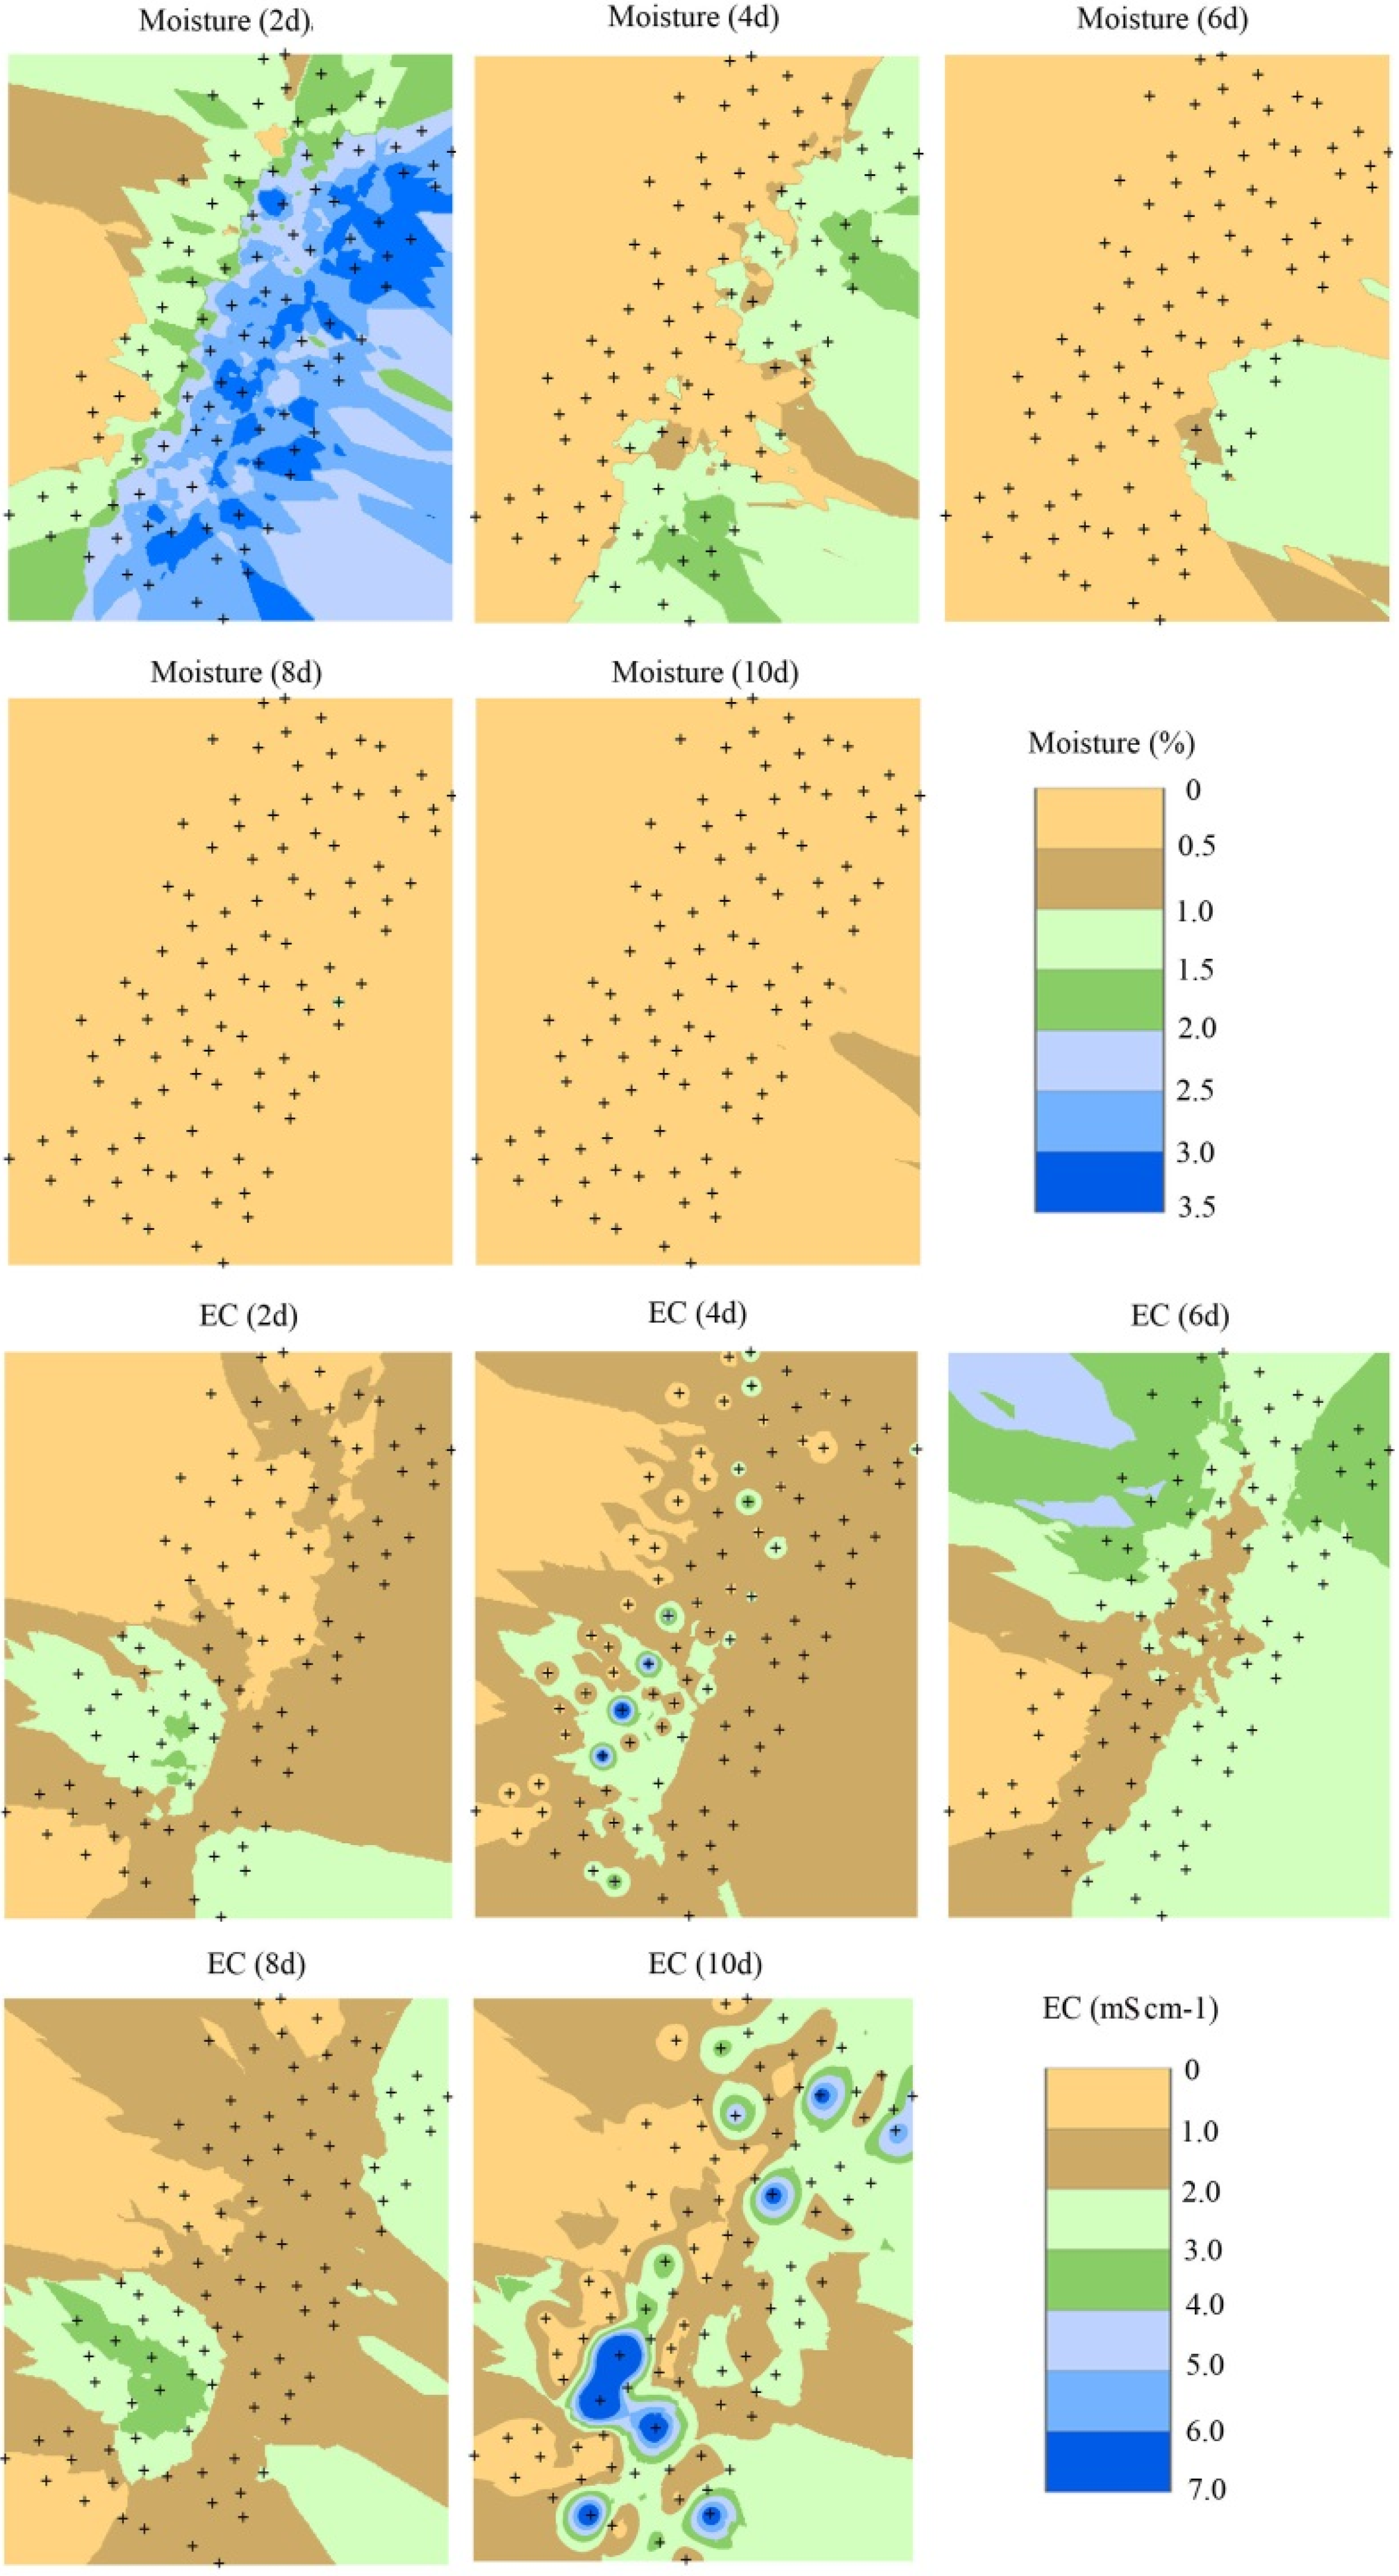
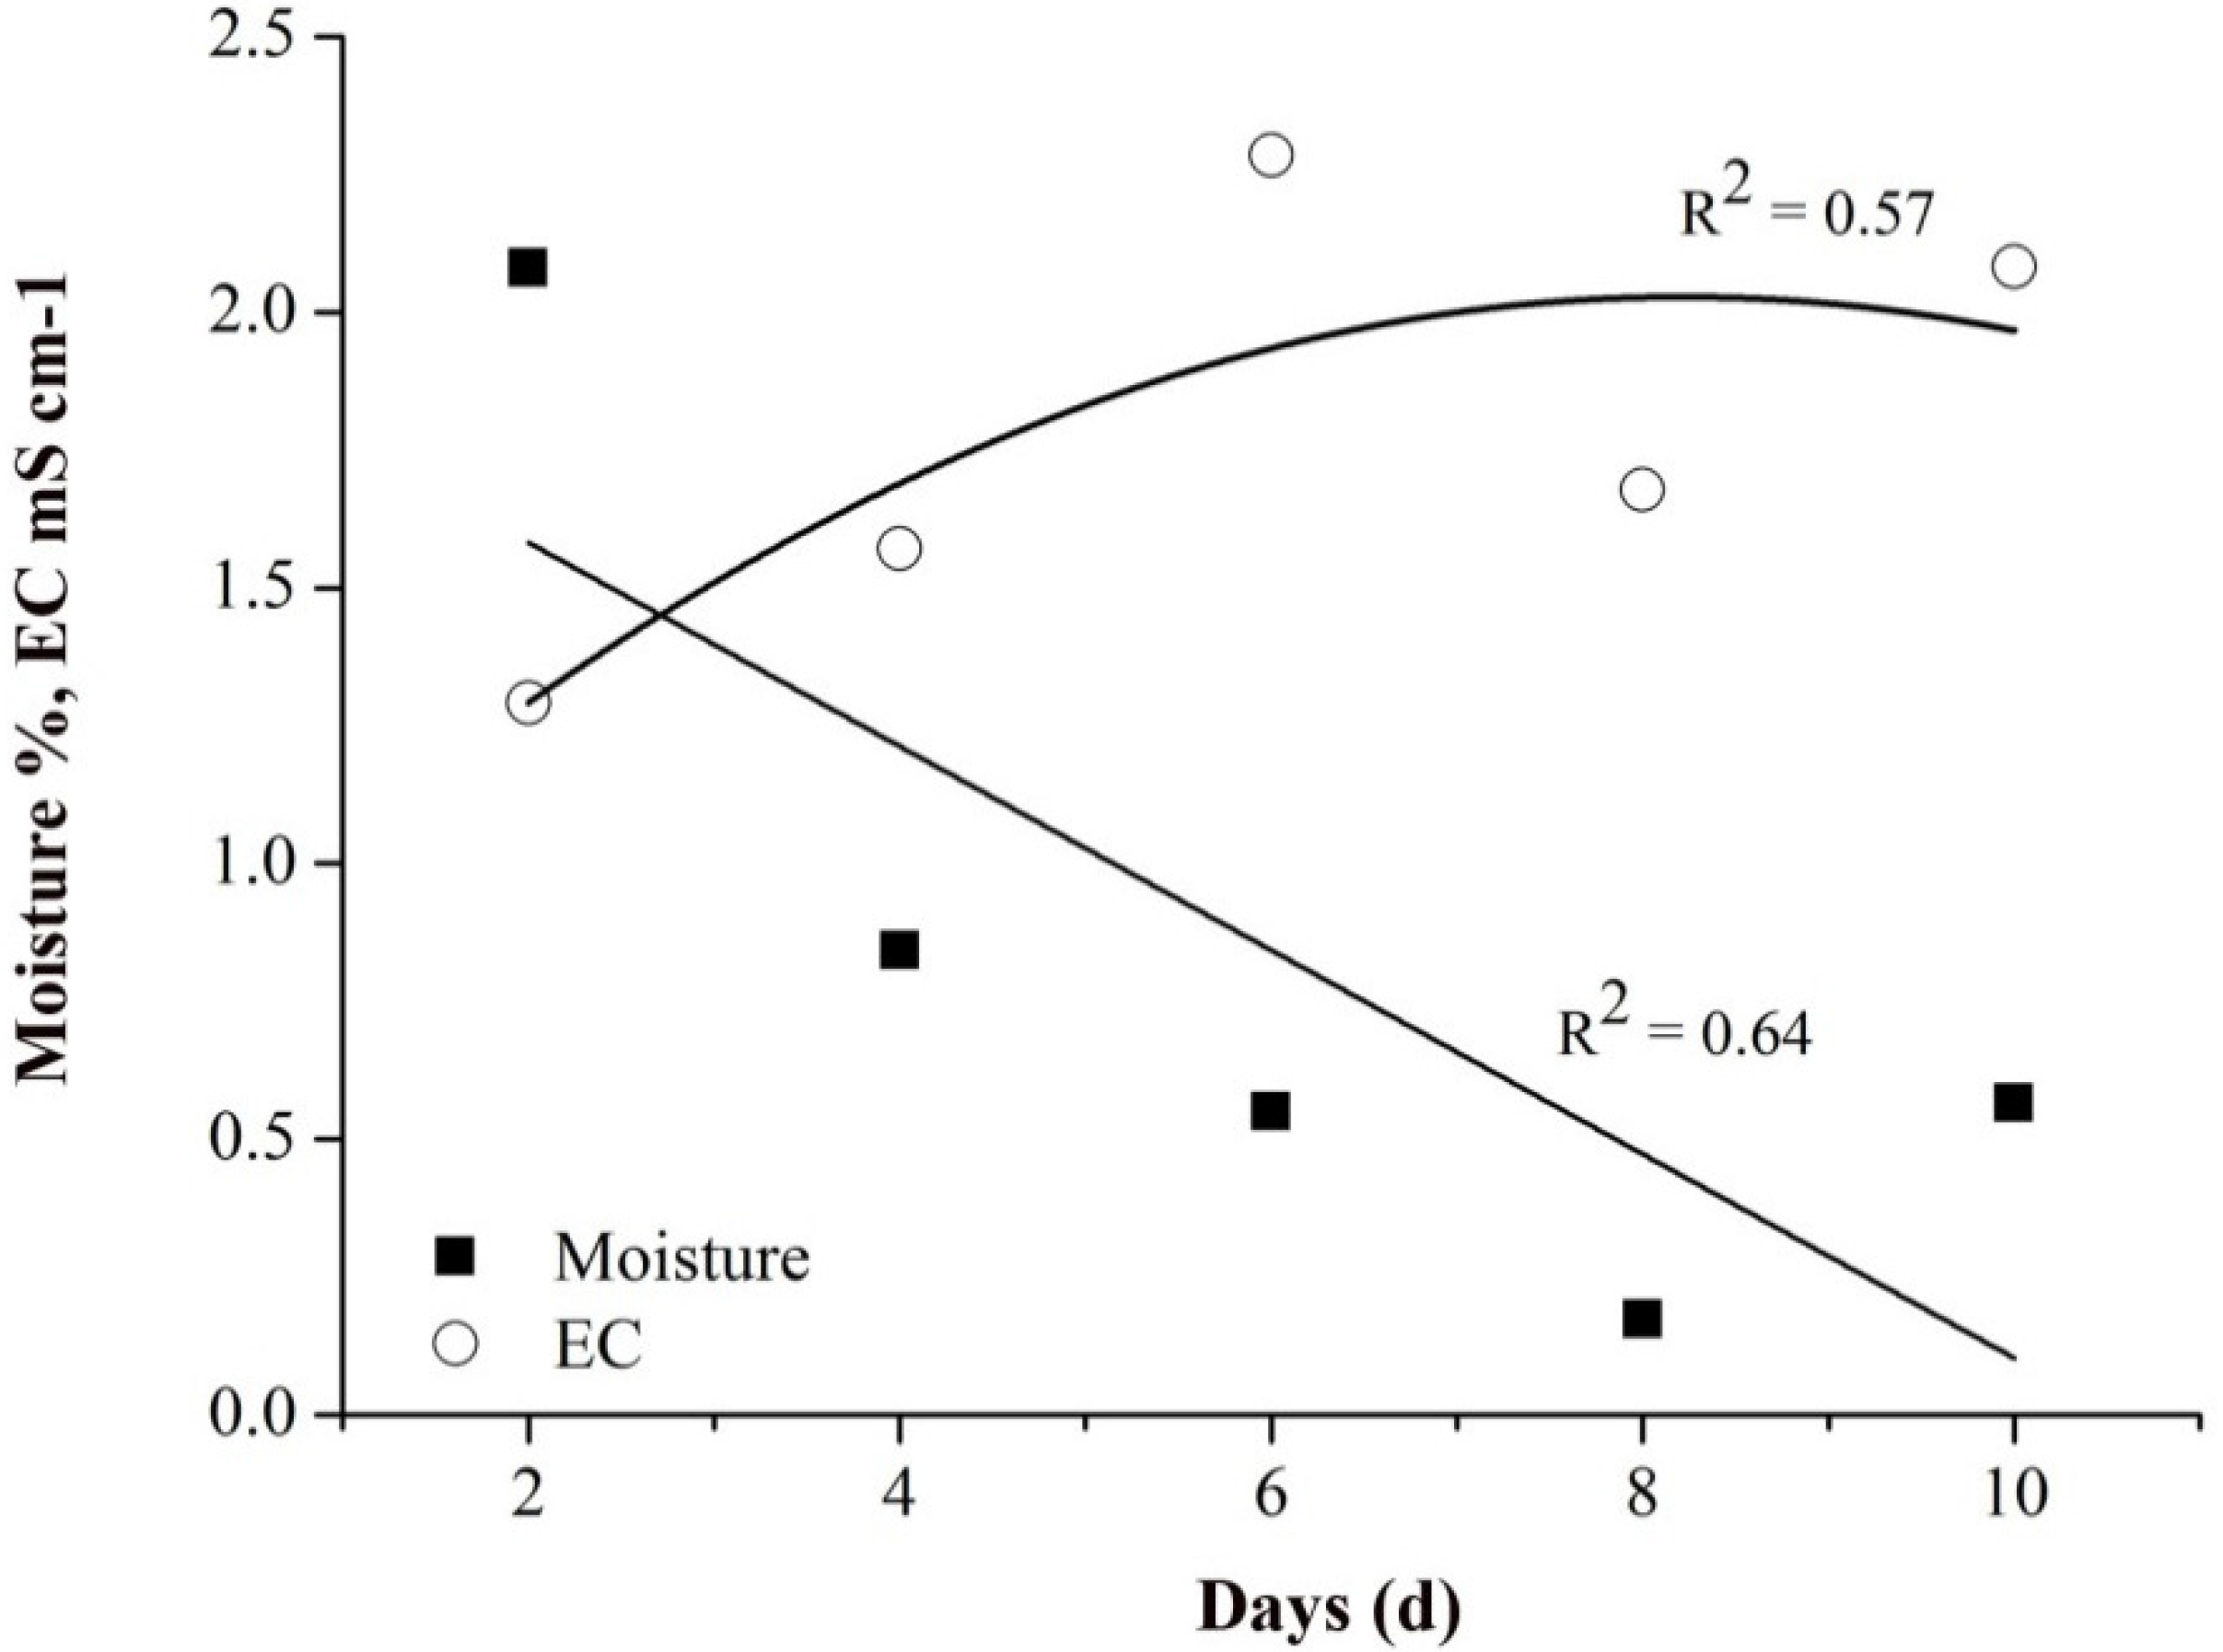
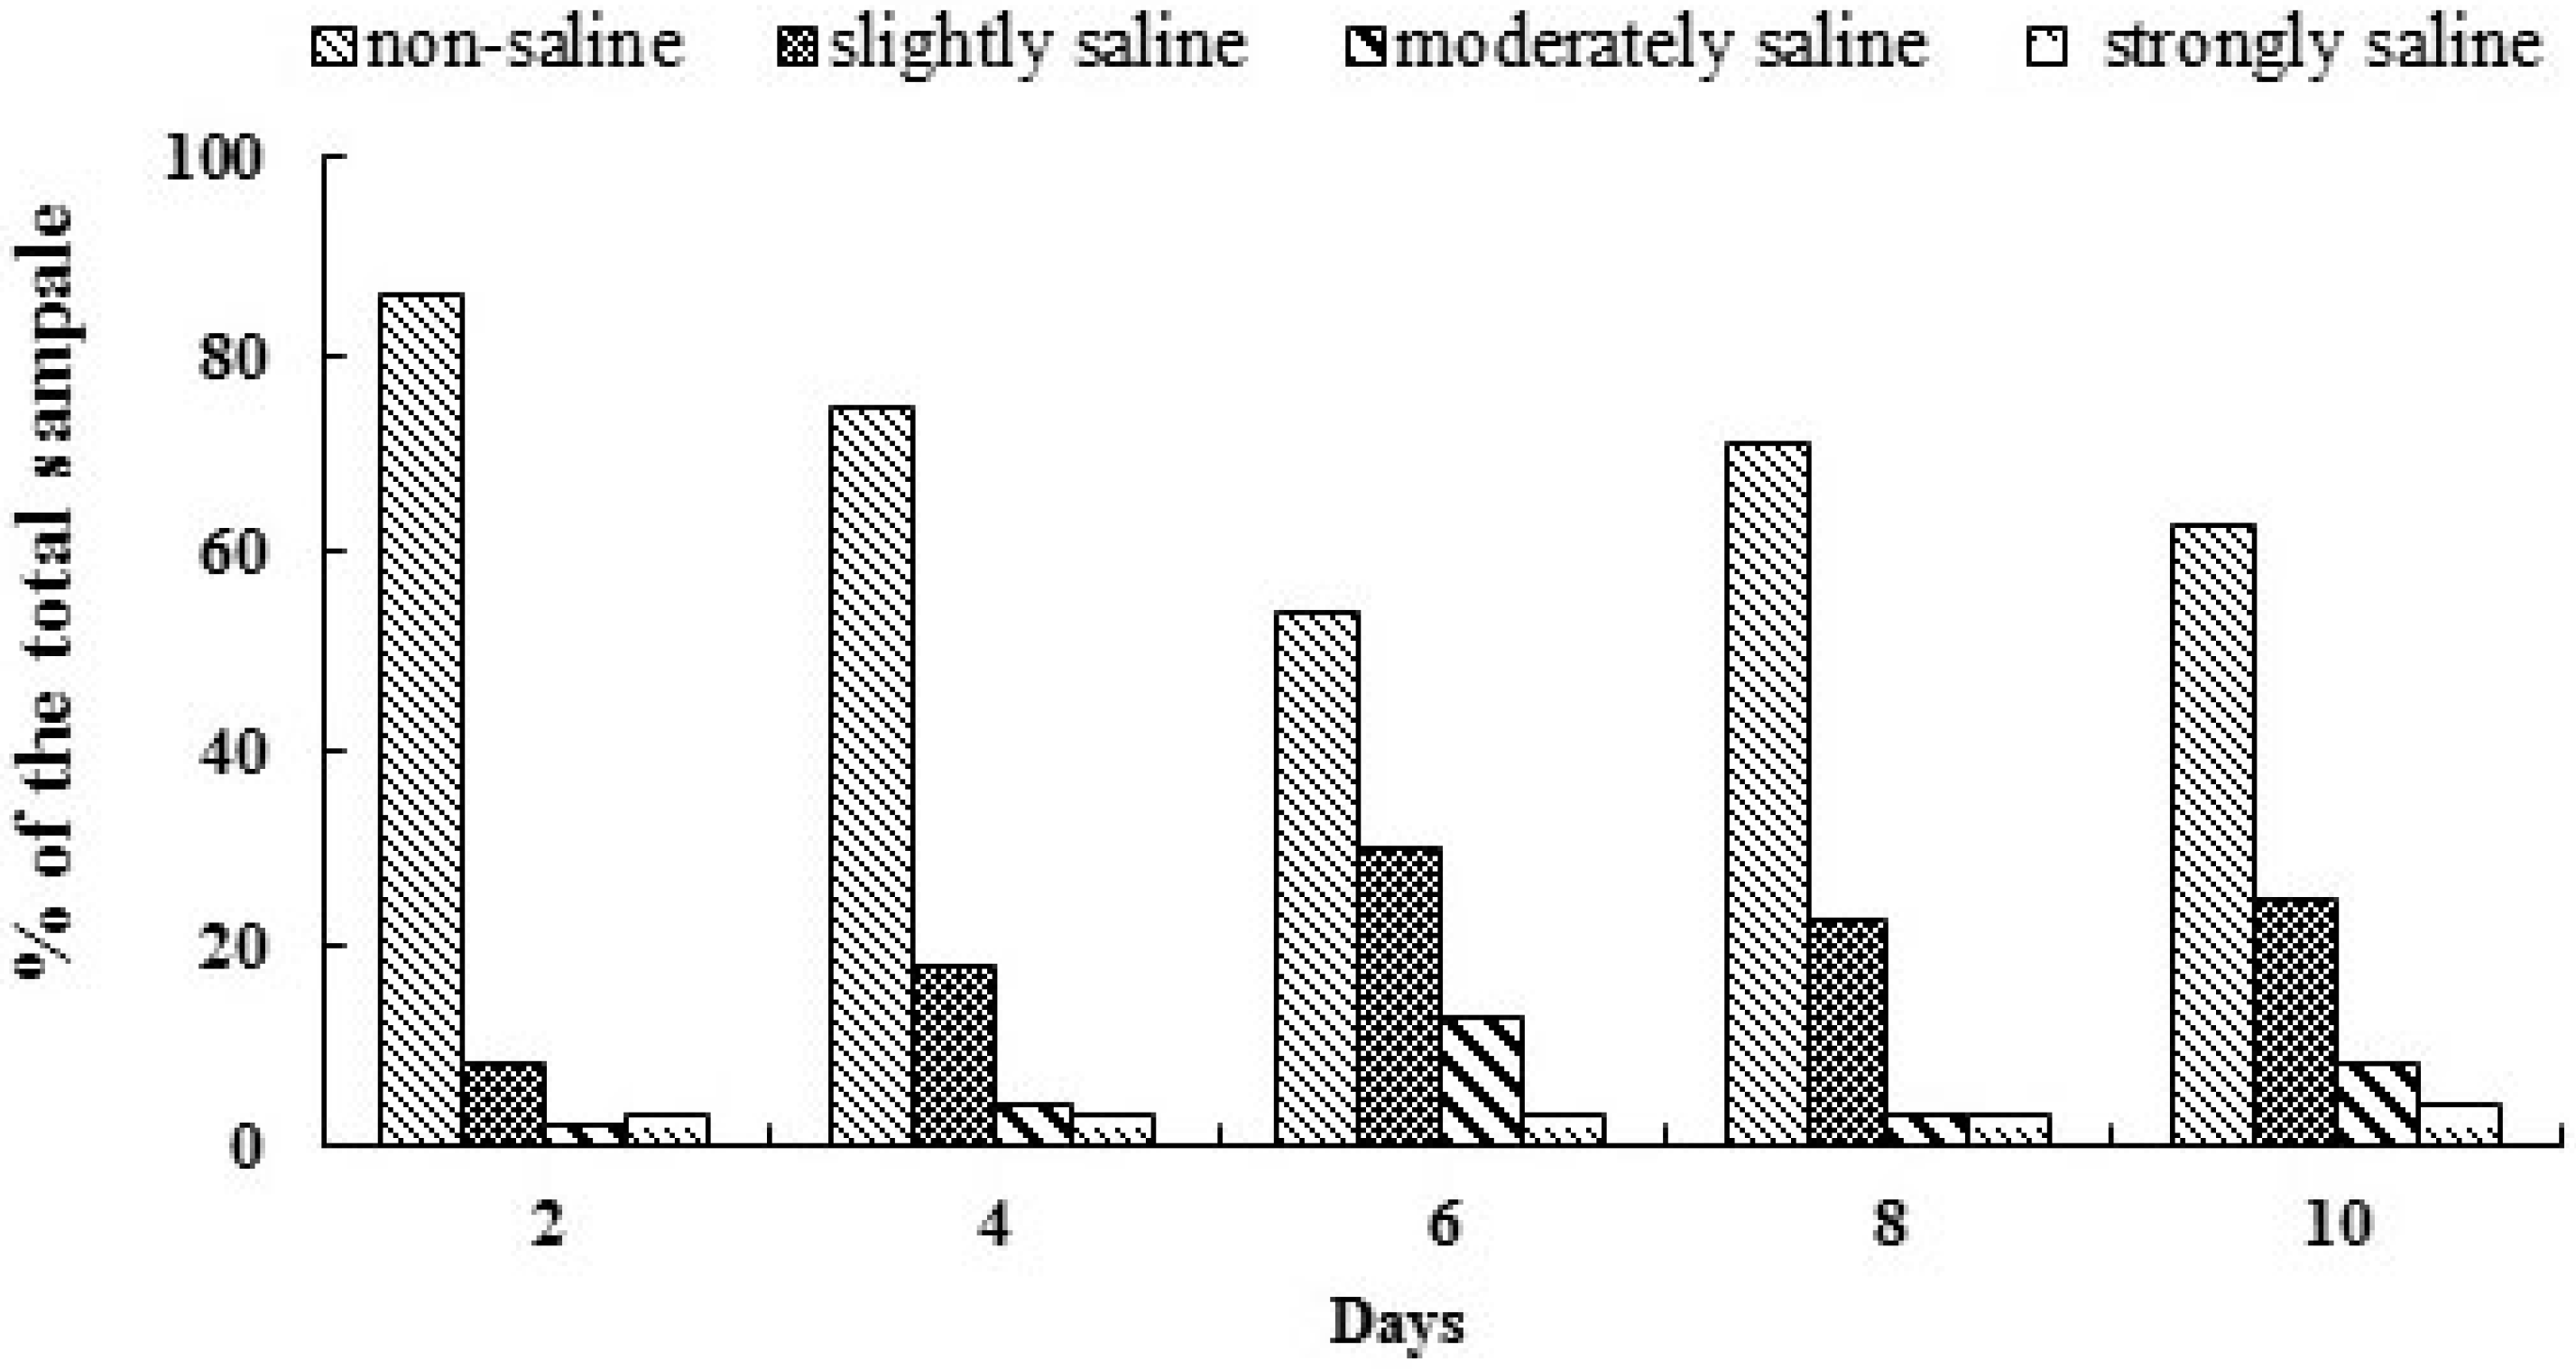
3.2.1. Spatiotemporal Distribution of Soil Moisture and Salinity during the Irrigation Cycle
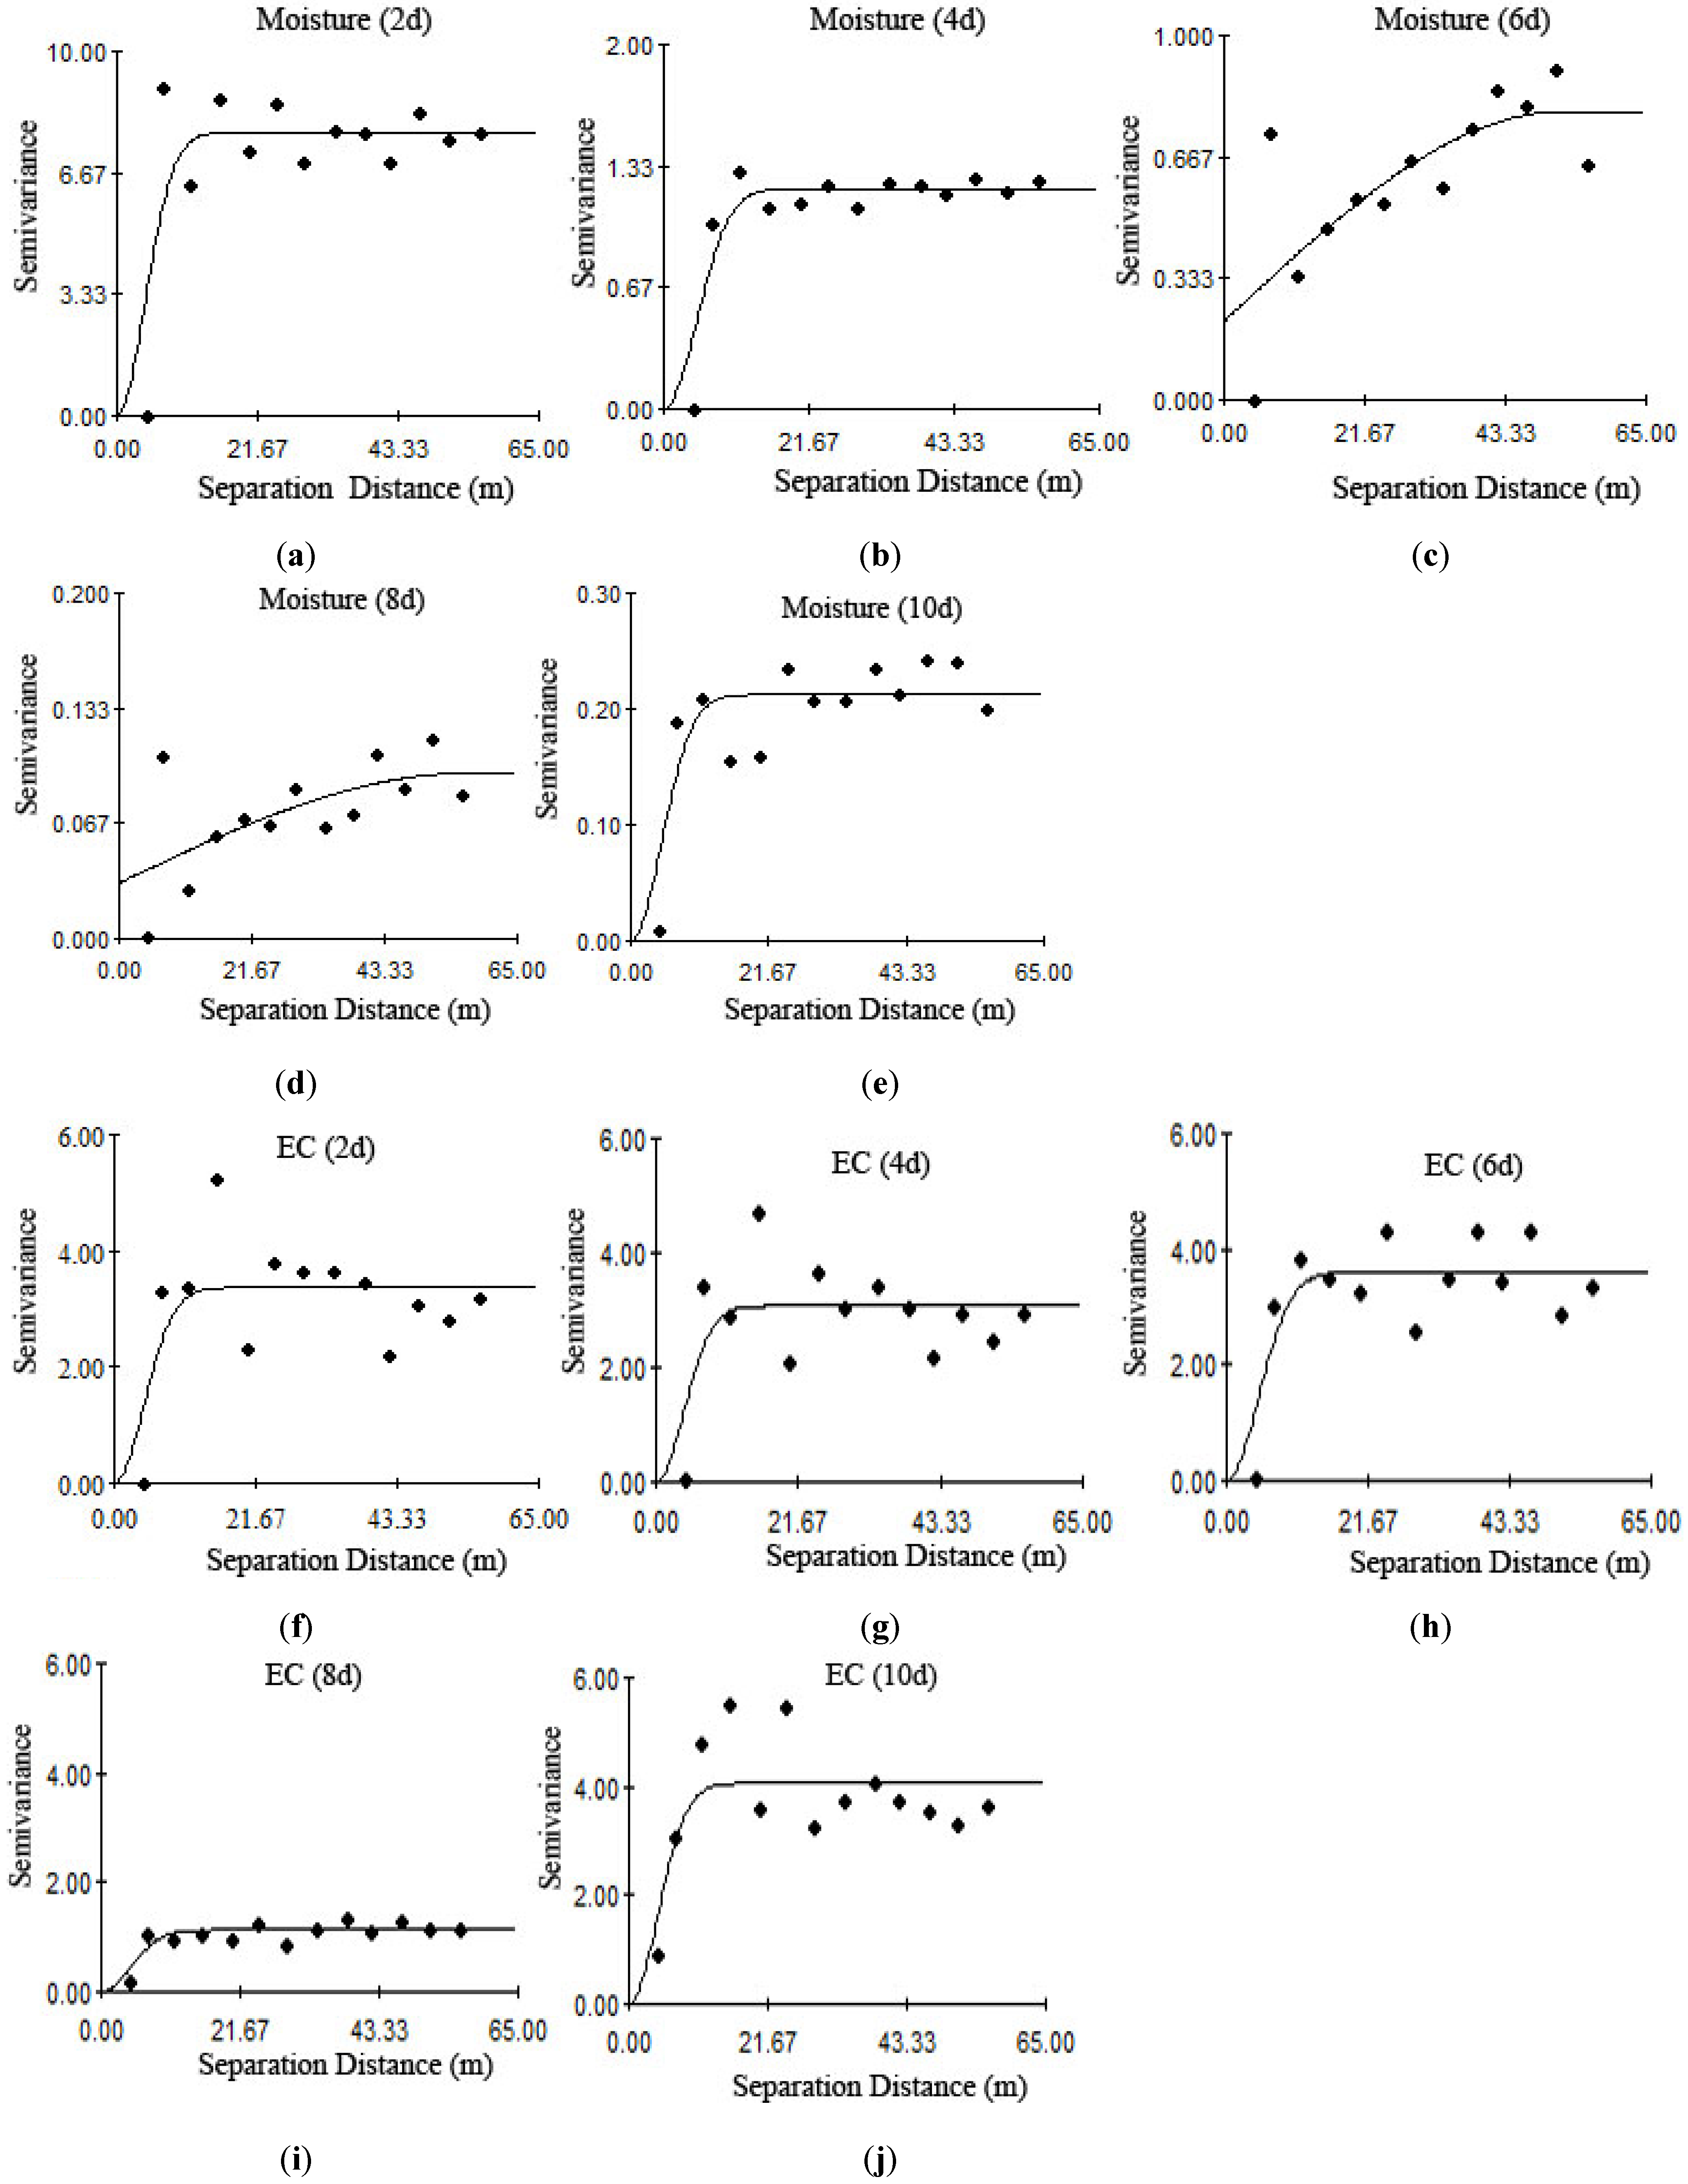
To describe the spatial variation of moisture and salinity in one irrigation cycle, isotropic semivariograms for all studied variables were calculated and the best fitted models were selected based on R2 (Figure 2). Moistures at 6th and 8th day were best fitted by the spherical model, whereas others were best fitted with the Gaussian model.
The nugget/sill ratio has been used extensively to define spatial properties. Table 2 shows that the nugget/sill ratios ranged from 0.03% to 27.31%, indicating that moisture and salinity exhibits strong spatial dependence excluding soil moisture in the 6th day. Their spatial correlation may be controlled by both intrinsic variations of soil properties and extrinsic factors such as topography or human-induced activities [39]. The nugget/sill ratio of moisture of the 6th day was in moderate spatial correlation, implying the interaction of moisture and salt itself, combined the small scale of spatial variation of topography and the influence of vegetation growing on the soil. The sill variance of moisture and salinity decreased during the irrigation cycle except the last day with raining. Except the ranges of moisture on the 6th and 8th day were larger than 50 m, other ranges were all about 6 m (Table 2), confirming that our samples spacing (10 m) is reasonable.
Figure 2. Values of moisture (ae) and EC (fj) variograms of all plots during one irrigation cycle in July. 2d, 4d, 6d, 8d, 10d represent 2nd, 4th, 6th, 8th, and 10th days after watering.
Water 07 04343 g002
Table 2. Parameters of semivariogram models for soil moisture and salinity during one irrigation cycle.
IndexTime (d)Mathematical ModelRange(A0)/mNugget/C0Sill/(C0 + C)C0/(C0 + C)%R2
Moisture2Gaussian6.100.017.770.130.63
4Gaussian6.900.011.210.830.83
6Spherical51.900.220.7927.310.56
8Spherical57.000.030.103.220.38
10Gaussian6.800.000.210.470.68
Salinity2Gaussian6.400.013.360.210.48
4Gaussian6.000.003.070.030.45
6Gaussian6.900.013.600.280.67
8Gaussian6.400.001.130.080.67
10Gaussian6.100.014.060.250.56
Soil moisture and EC maps obtained by ordinary Kriging interpolation are displayed in Figure 3. The values and spatial patterns of soil moisture and salinity were clearly affected by irrigation time and raining. In general, soil moisture decreased gradually during the 10-day irrigation cycle (Figure 3 and Figure 4). Soil moisture was the highest in the 2th day after watering, and then decreased quickly with time, and reached the smallest value in the 8th day. The three smoothed contour maps of moisture distribution during 2-day, 4-day, and 6-day after irrigation display quite similar spatial patterns, with high soil water contents in the southern and eastern sections and low values in the northern and western parts. Furthermore, the area of high moisture content in the southern and eastern sections was decreased during the irrigation and presented a diminishing trend from west to east. This could be ascribed to the east side of the study area closed to quicksand where plants were planted sparser than west, and the plants growth was not as good as the west. If dividing the protection forest area into two parts, projection area of tree crown of west and east part were 0.31% and 0.89%, respectively. Thus, due to the weak canopy shadow, the effect of evaporation in east was higher, and thus soil moisture of east section was lower. Consequently, the locations with relatively higher and lower moisture remained about the same over time, which somewhat revealed the temporal stability of soil moisture spatial patter similar to Zhao et al. [40].
Eight days after irrigation, soil moisture reached stability, and the whole area had no significant differences on 18 and 20 July. This is mainly ascribed to infiltration and evaporation dynamics from topsoil layer. Due to the large water potential difference between soil under the dripper and the fringes of wetting area, moisture spread around at a large rate of the infiltration flux after the irrigation ended. Subsequently, with the decreasing of soil moisture under the dripper and the enlargement of wetting area, suction gradients and unsaturated hydraulic conductivity of the soil decreased, and the rate of migration of moisture also decreased. Generally, the typical distribution of soil moisture was presented at the second day during the drip irrigation cycle (Figure 3). Soil moisture maps of the 4th day can be explained that within the desert highway shelterbelt, the shallow soil was saturated after irrigation, then water evaporated, and water moved up through the capillary rise effectively [41]. At the 6th, 8th, and 10th day after the irrigation, soil moisture content continuously decreased due to strong atmospheric evaporation in desert areas, characterized by point source flowing sideways. Note that there are two kinds of soil water infiltration, i.e., vertical and lateral infiltration. Vertical infiltration dominated when soil is less saturated, otherwise, lateral seepage is dominant. Although sand has strong permeability, lateral seepage processes would not occur until soil on the top-surface gradually saturated the soil below, with continuous drip irrigation. Furthermore, numerous small amounts of dripped water leached salt out by lateral seepage around the dripper, and gradually push the salt outward. Consequently, salt is concentrated on the soil surface and the edge of wetting-front, associated with the strong evaporation and capillary effect. In contrast, there is less salt near the dripper, corresponding to a lower thickness of salt crust and soil EC.
Figure 3. Ordinary Kriged maps of soil moisture and EC during the irrigation cycle in July. 2d, 4d, 6d, 8d, 10d represent 2nd, 4th, 6th, 8th, 10th days after watering.
Water 07 04343 g003
Based on the soil salinity classification system of FAO, five salinity classes were established using the EC values as follows: (1) very strongly saline, >16 mS·cm−1; (2) strongly saline, 8–16 mS·cm−1; (3) moderately saline, 4–8 mS·cm−1; (4) slightly saline, 4–2 mS·cm−1; and (5) non-saline, 0–2 mS·cm−1 [41]. The EC values indicated that the salt concentration over the irrigation cycle was non-saline to slight (Figure 5). In the 10-day irrigation cycle, soil moisture content was decreasing during the 2nd and 8th days and finally increased at the 10th day due to the unexpected rainfall before measurement. With different patterns to soil moisture, EC values increased from the 2nd to the 6th days, gradually decreasing at the 8th day and then increasing at the 10th day (Figure 4). Compared with soil moisture, the spatial distribution of the salinity presented plaques shape, indicating a local secondary salinization. During drip irrigation, soil salt content differs with different distances from the dripper. Note that each of 100 soil cores was a composite of sub-samples taken from five points, with one under the dripper and the other four centered from dripper, spaced 30 cm apart. Wang et al. [42] found that with saline drip-irrigation, the soil EC changing with a distance from the dripper of 30 cm was first increasing then decreasing. Meanwhile, three mechanisms including convection, diffusion, and mechanical dispersion affect salt transport. After saline irrigation, a series of complex chemical reactions, such as dissolution, precipitation, adsorption, desorption, and ion exchange occurred between the different elements of the soil solution and soil solid phase. With evaporation happened on the soil surface, salt in the soil solution can move up and become a precipitate. Consequently, with strong evaporation affected by soil capillary action, salts accumulate on the soil surface and form a salt crust, inhibiting soil evaporation, in turn [6,41]. Overall, non-secondary salinization was dominant at the irrigation cycle and accounted for 86%, 75%, 54%, 71%, and 63% at the 2th, 4th, 6th, 8th and 10th day, respectively (Figure 3).
Figure 4. Functional diagram of averaged moisture and salt changes during the irrigation cycle.
Water 07 04343 g004
Figure 5. Distribution of soil salinity classes during the irrigation cycle.
Water 07 04343 g005
Notably, both moisture and salinity increased at the 10th day (Figure 4). Due to the rainfall at the 10th day, soil salt content could be decreased due to the rainfall input. However, our case showed that this amount of rain actually was not enough to leach out salt from the topsoil. Conversely, it could be very effective to wash the salinity from the branches and leaves to soil surface. Pereira et al. [43] also pointed out that the increased salinization in the surface soil may be attributed to poly-salt or salt excretion from halophytes, indicating that halophytes can gather salt on their surface. There are salt-secreting plants in the shelterbelt, such as Chinese tamarisk, which the salt can be reasonably leached out by the stemflow to the topsoil. Consistent with our findings, Li et al. [44] also demonstrated the chemical elements in soil were formed by the effects of stemflow in the nearby Gurbantunggut Desert. The comparison of the chemical properties of stemflow and bulk precipitation revealed a higher content of chemical elements in the stemflow.

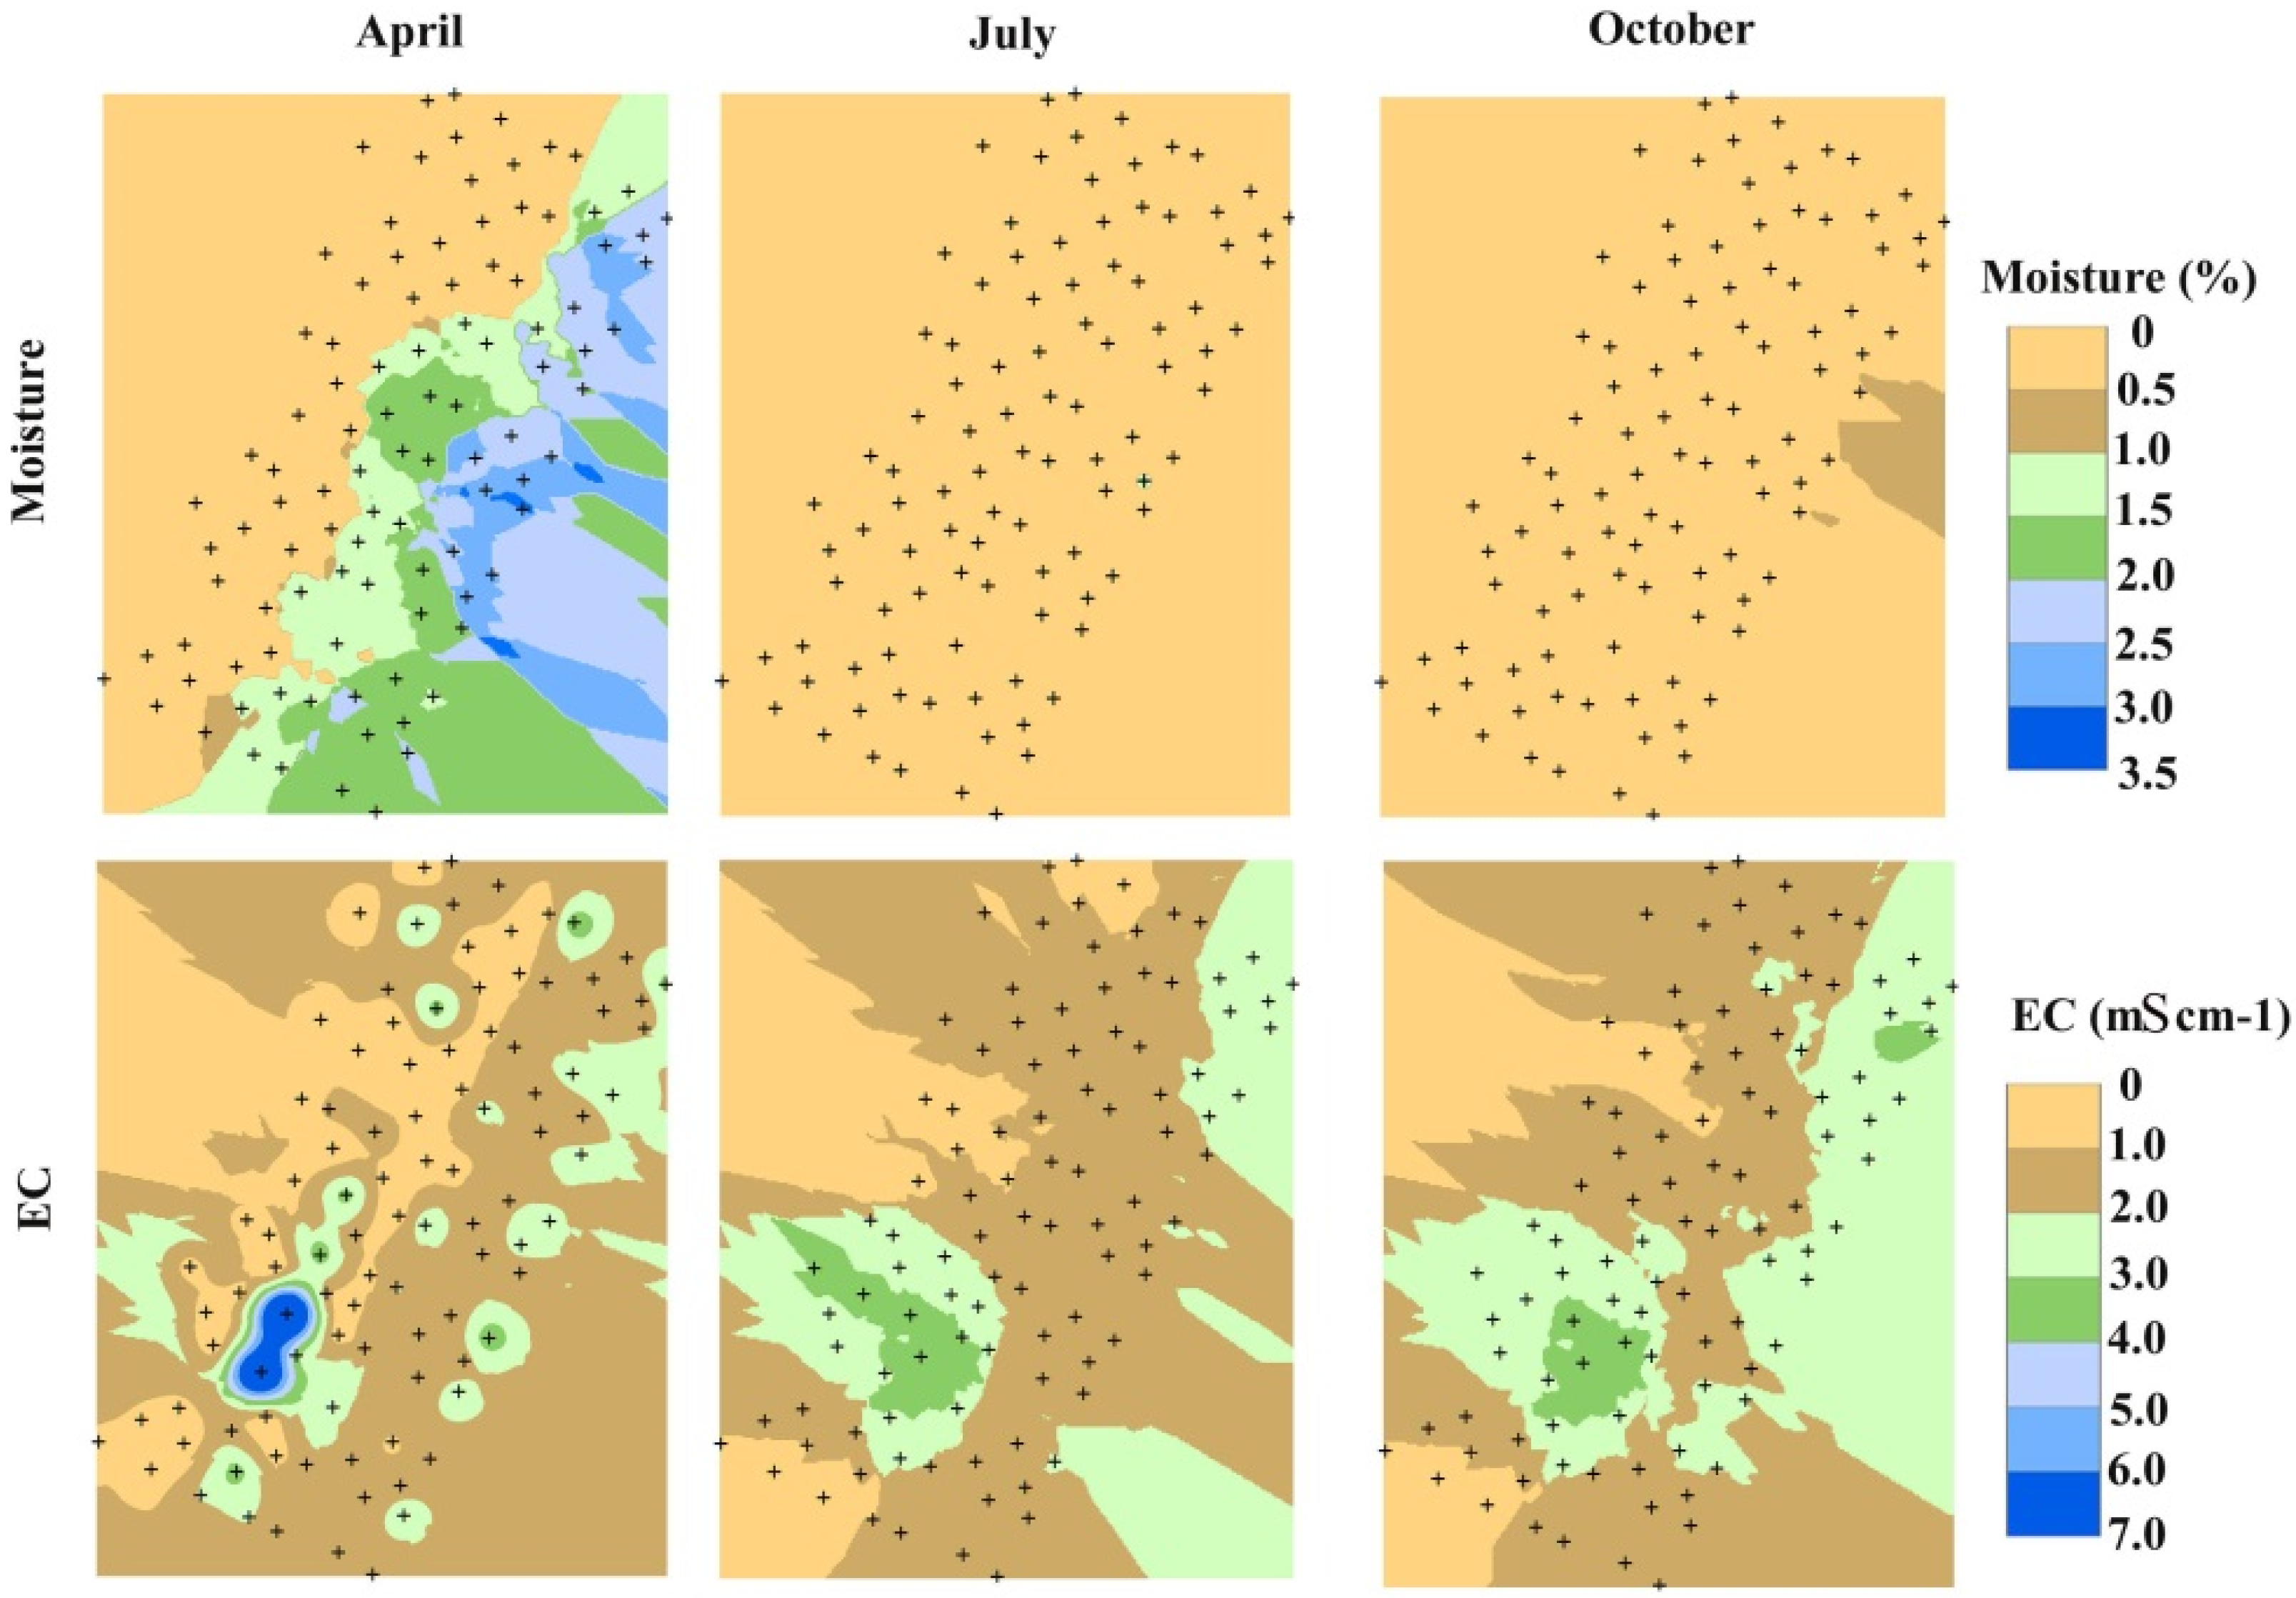
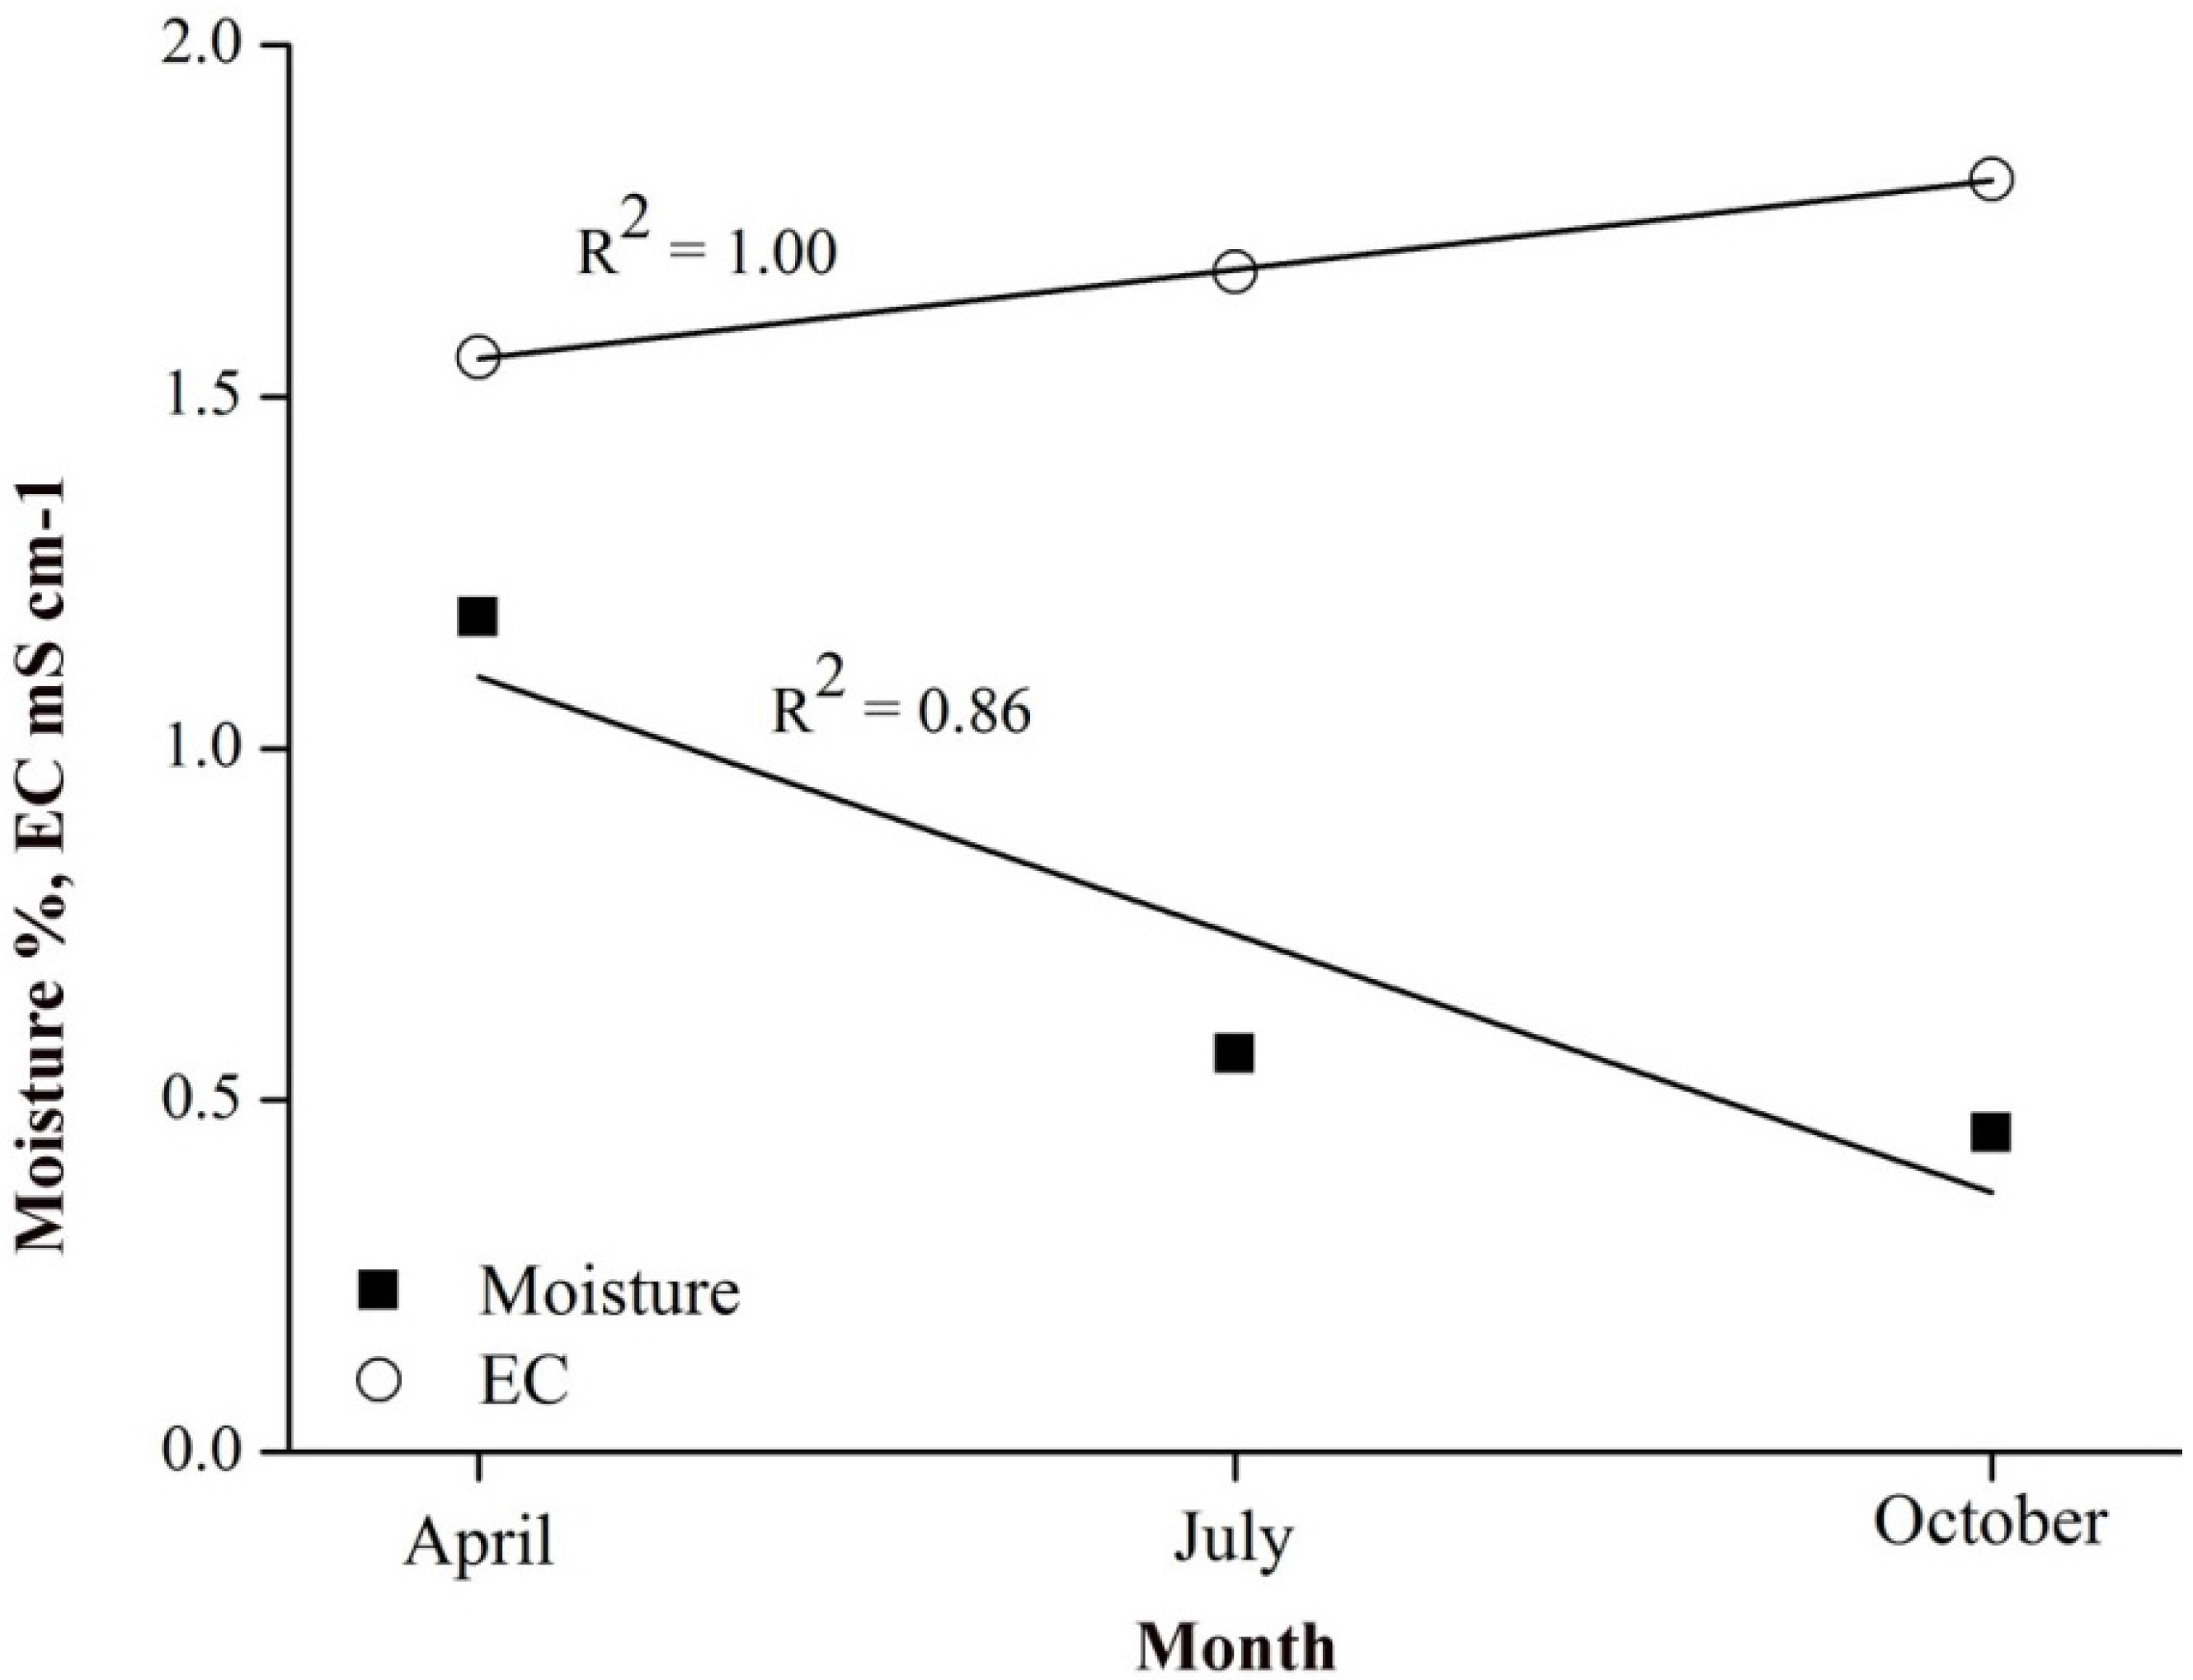
3.2.2. Spatiotemporal Distribution of Soil Moisture and Salinity in Different Seasons
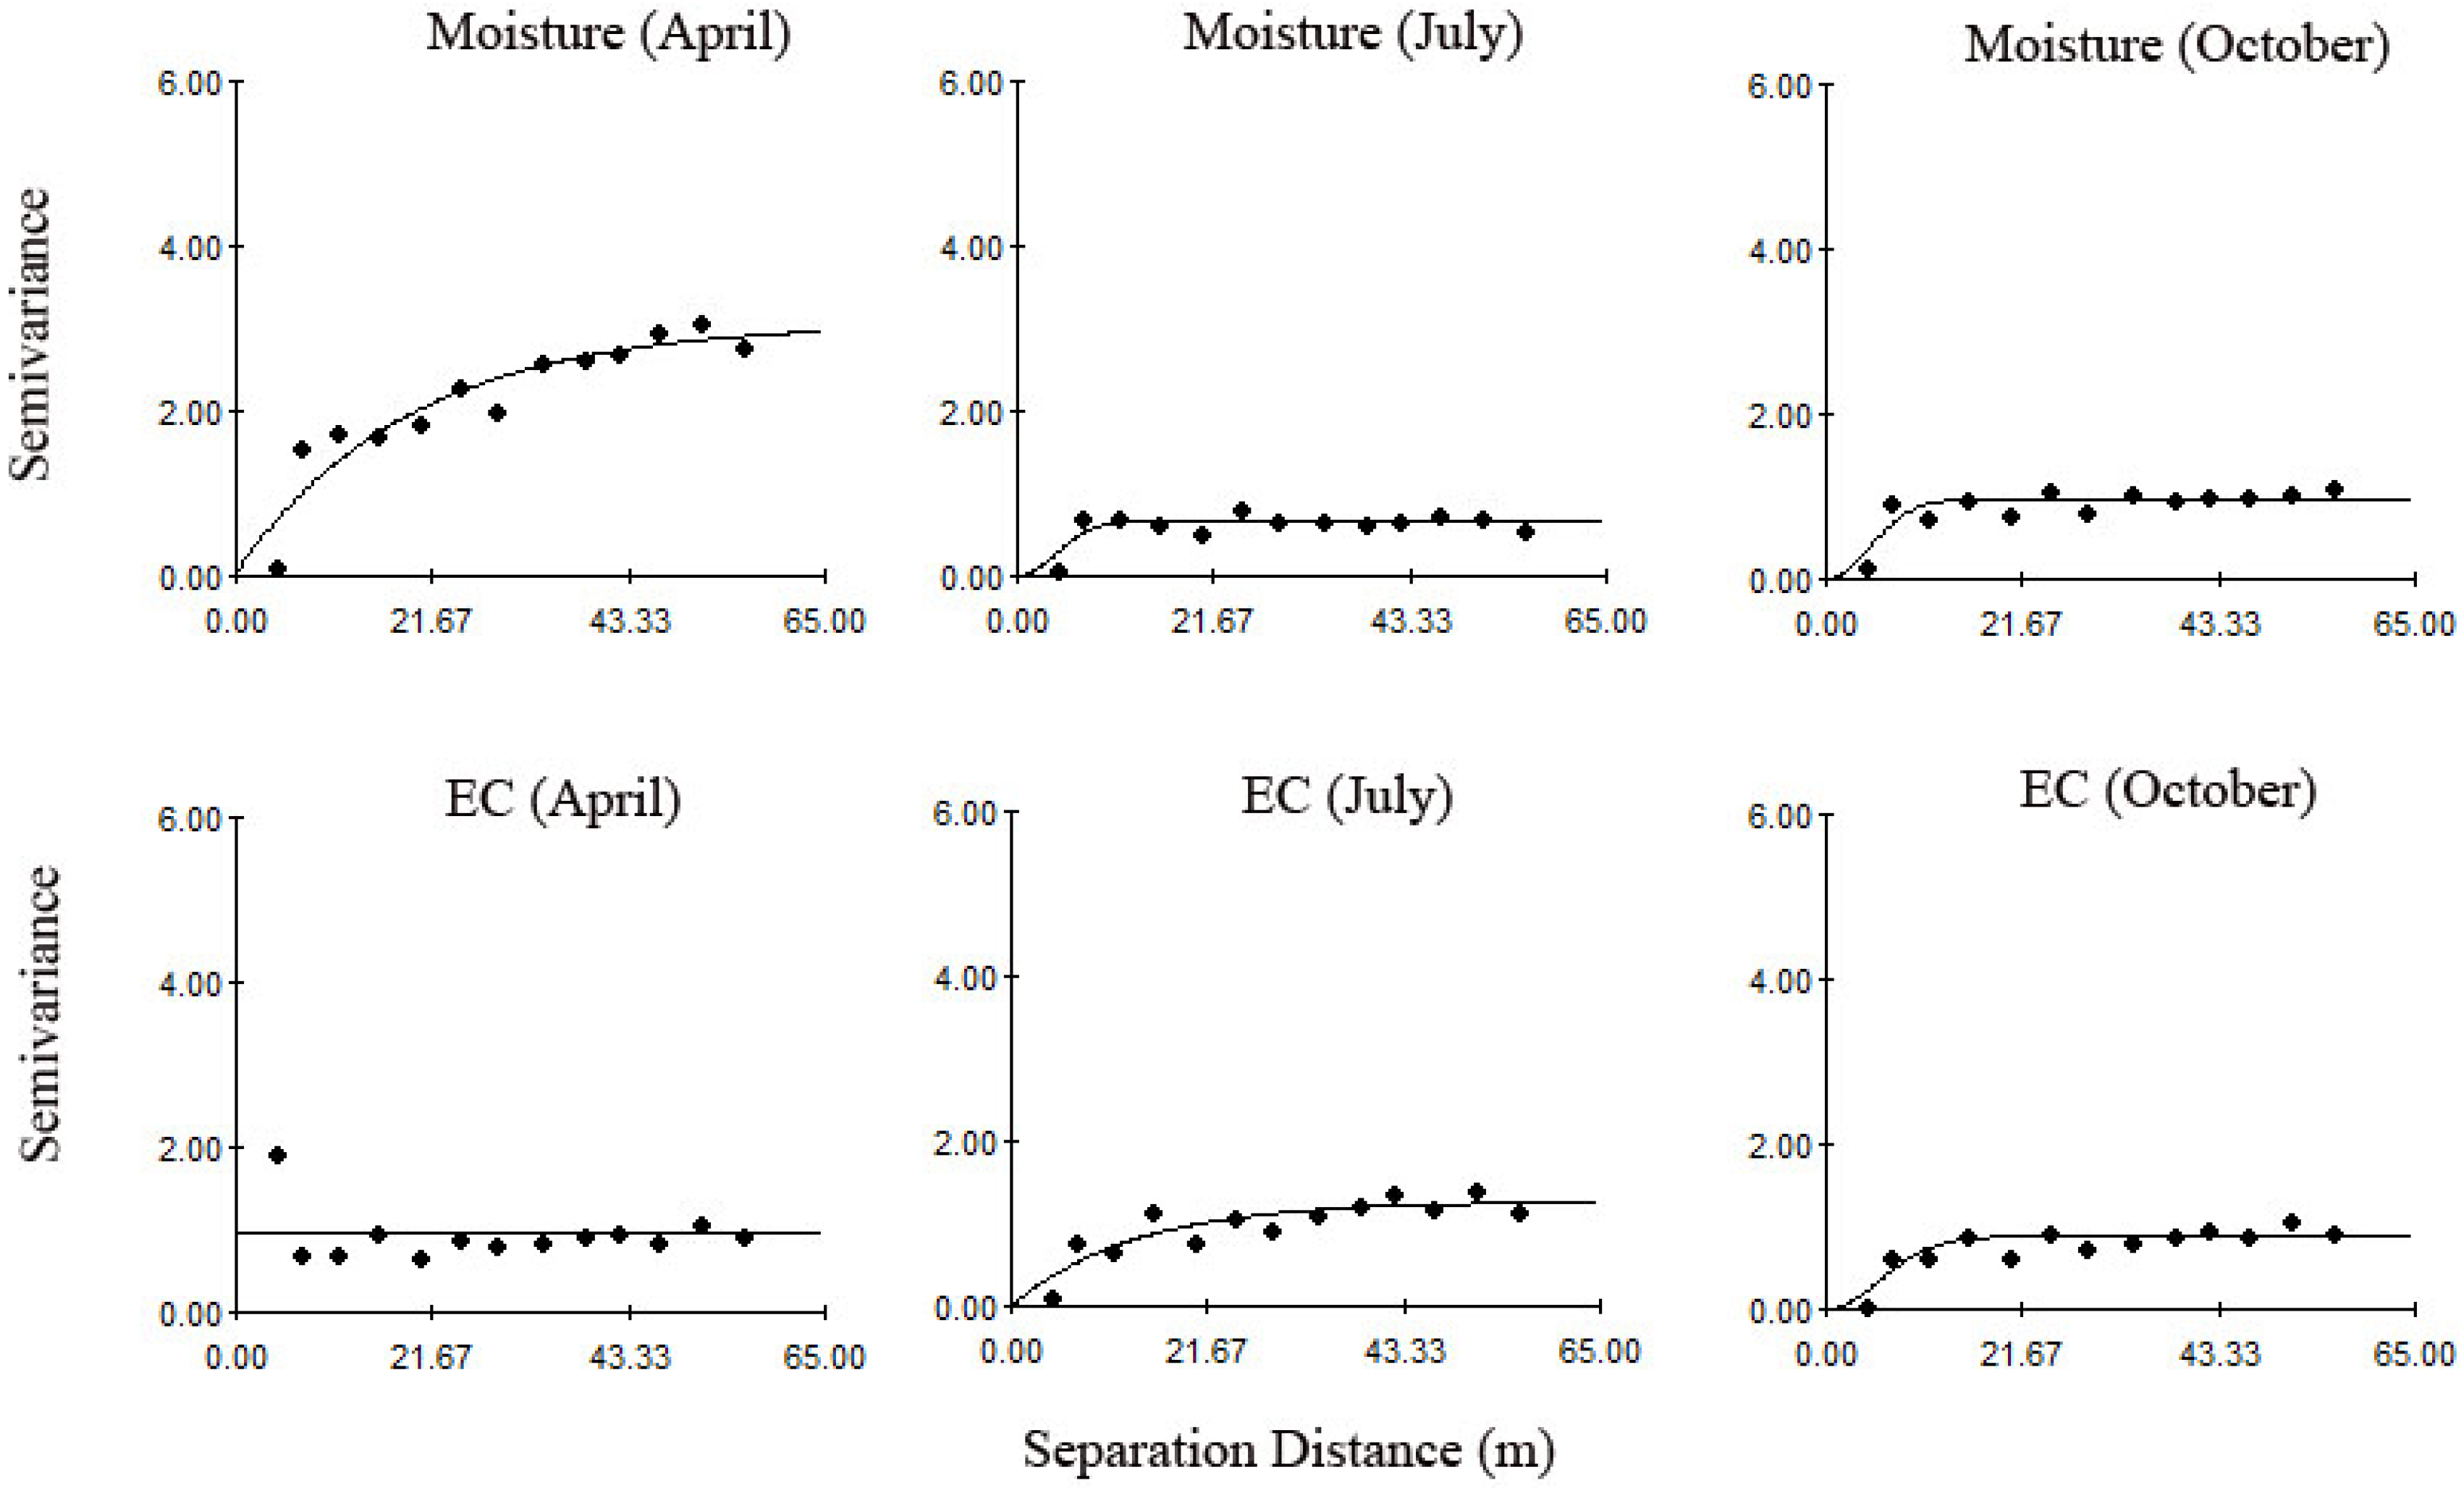
In 2014, soil samples (0–10 cm) at each point were collected in two days before irrigation during the spring (23 April), summer (18 July), and autumn (8 October), respectively, to investigate the seasonal dynamics of soil moisture and salt contents. Soil moisture in spring and salt in autumn reached the highest sill and the comparably high nugget (Figure 6 and Table 3). According to R2, salt in spring did not show an organized spatial pattern; a best fit to the data is accomplished by using a linear model with the strong nugget effects. Nugget/sill ratio of moisture ranged from 0.03% to 3.22%, and salt ranged from 0.08% to 100%, indicating that moisture was the strong spatial dependence and kept relatively stable with the season, whereas salt demonstrated seasonal-dependent spatial heterogeneity. The nugget/sill ratio of salt was in moderate spatial dependence in autumn, strong in summer, and weak in spring (Table 3).
Figure 6. Variograms of soil moisture and EC among different seasons.
Water 07 04343 g006
Table 3. Parameters of semivariogram models for soil moisture and salt among different seasons.
IndexMonthMathematical ModelRange(A0)/mNugget/C0Sill/(C0 + C)C0/(C0 + C)%R2
MoistureAprilExponential57.30.053.071.600.86
JulySpherical57.000.030.103.220.38
OctoberExponential33.900.000.300.030.72
SalinityAprillinear55.830.950. 951000.00
JulyExponential13.400.001.270.080.75
OctoberGaussian52.302.435.8841.330.86
There were strong seasonal variations of soil moisture and salinity (0–10 cm). Soil moisture was the highest in spring and decreased in the later season due to the strong evaporative demand, whereas soil salinity showed the relatively smaller change (Figure 7). Although the amount of irrigation water was the same in different seasons, the accumulative characteristics of irrigation were not. The amount of intensity of water loss was mainly controlled by atmospheric evaporation capacity and soil moisture condition. Note that, although the frequency of irrigation in summer was higher than in spring and autumn, the evaporative demand was the highest in summer. Therefore, soil moisture content due to irrigation was the lowest in the summer. According to local meteorological data, the average temperature in autumn is lower than in summer, but higher than in spring. Figure 8 was indicative of the average moisture content in different seasons, which demonstrated soil moisture in the autumn was higher than in the summer, but lower than in the spring. Accordingly, it may imply that temperature is the main factor controlling soil water content.
Figure 7. Ordinary kriged maps of soil moisture and EC during different seasons.
Water 07 04343 g007
Figure 8. Functional diagram of soil moisture and EC changes in different months.
Water 07 04343 g008
Under saline water irrigation, soil salinity slightly increased in summer, as compared to that in spring (Figure 8). This phenomenon was in accordance with the idea that, with continuing irrigation, salt accumulation and salt leaching occur simultaneously [35]. Similarly, Li et al. [15] reported that soil salinization increased near the surface soil throughout the year.

3.3. Correlation between Selected Parameters

To characterize the relationship between soil moisture, EC, and selected soil properties (SOC, TN, TP, TK, pH, sand, silt, clay and terrain), Pearson's correlation coefficient was calculated for each variable (Table 4). The results indicated that soil moisture is significantly positively correlated with TN and silt content, and negatively correlated with pH and sand content; whereas EC strongly positively correlated with TN, TP and silt content, and negatively with sand content. Remarkably, it seemed that both soil moisture and salt had significant correlation with soil texture and TN. For a finer-textured soil, the water retention capacity is greater than a coarse-textured soil, therefore at a given EC and matric potential, the osmotic potential of the soil solution is lower in the coarse-textured soil [16]. Due to saline water irrigation, a series of biochemical, radiation, and evaporation processes occur, which may input the nutrient components into soil. The artificial shelterbelts could be beneficial for the soil nutrient accumulation due to the vegetative litter decomposition, root growth, decomposition, and other biogeochemical cycles [24]. In addition, the shelterbelt growth and continuation is beneficial for Aeolian sandy soil development [7]. It is well know that sand content reduction corresponding with silt and clay content increase is the key improvements of soil quality. Brantley et al. [45] proved that ions tended to be adsorbed on the clayed soil and could not be extracted easily by water. Therefore, compared with moisture, salinity was significantly intercepted by the more clayed soil. Consequently, as water is absorbed by plants or evaporated, salt remains on the topsoil during early irrigation. In general, soil moisture and nutrients have positive effects on the growth of the shelterbelt, whereas EC has a negative effect on the growth of the shelterbelt. However, with saline drip-irrigation, the soil EC of shelterbelt increased [7], which may be somewhat beneficial to soil development, particularly taking soil texture into effect, causing a trade-off effect for promoting factors and inhibiting factors of plants growth. Wang et al. [46] indicated that clay content determined the moisture and salinity of soil, emphasizing that moisture of the topsoil layer was mainly affected by a single surface factor; ions tended to be adsorbed on the clay complexly and could not be extracted easily by water [45]. As a result, compared with moisture, salinity was more related to soil clay content.
Table 4. Correlation coefficients between soil salinity and environmental factors.
IndexMoisture (%)EC (ms·cm−1)SOC (g·kg−1)TN (g·kg−1)TP (g·kg−1)TK (g·kg−1)pHSand (%)Silt (%)Clay (%)Terrain (m)
Moisture (%)1
EC (mS·cm−1)0.121
SOC (g·kg−1)0.110.101
TN (g·kg−1)0.34 **0.36 **0.101
TP (g·kg−1)−0.060.22 *0.100.21 *1
TK (g·kg−1)0.13−0.090.070.08−0.31 **1
pH−0.28 **−0.19−0.04−0.31 **−0.060.25 *1
Sand (%)−0.23 *−0.40 **−0.39 **−0.40 **−0.14−0.15−0.22 *1
Silt (%)0.23 *0.41 **0.38 **0.40 **0.150.150.22*−1.00 **1
Clay (%)−0.11−0.200.19−0.05−0.22 *−0.020.06−0.27 **0.24 *1
Terrain (m)−0.03−0.050.06−0.04−0.190.120.040.21 *−0.22 *0.061
Notes: * Correlation is significant at the 0.05 level; ** Correlation is significant at the 0.01 level.
Table 4 indicates that SOC had positive correlation with silt content (R2 = 0.38, p < 0.01), negative correlation with sand content (R2 = −0.39, p < 0.01), and no significant correlation with clay content, since soil clay component was rare. Present studies suggest that the change of soil texture is firstly caused by wind erosion, desertification, and then by changes of soil organic matter and nutrient content, which finally results in soil impoverishment [47]. In the process of desertification, soil coarsens, and soil organic matter and nutrient content decrease. It is well known that loss of fine soil particles could result in loss of soil organic matter since organic matter is often combined with fine soil particles. Zhao et al. [48] addressed the idea that content of soil silt, clay, and SOC are the key factors for soil texture and fertility.

4. Conclusions

To obtain more information for further understanding of soil and plant development along the Taklimakan Desert Highway Shelterbelts, a better knowledge of spatial variation of soil moisture and salt are essential. The spatial pattern of soil moisture and salt content in the harsh ecosystem displayed considerable spatial correlation, largely because of the relative static controls of soil properties in dry climates. During the irrigation cycle, soil moisture gradually reduced, which was lower at the northwest than at the southeast. In contrast, soil salinity showed a tendency to increase with the local plaque distribution. Soil moisture was the highest in spring, and summer and autumn had relatively low soil moisture. Salinity was gathered in local area in different seasons. Correlation analysis showed that both soil moisture and salinity were significantly positively correlated with silt content and TN, and negative correlated with sand content. Soil with high moisture and nutrient content and low salt content is more suitable for shelterbelt growth, which pointed out soil moisture and salinity was a contradictory relation in this area. For further understanding of soil and plant development along the Taklimakan Desert Highway Shelterbelt, secondary salinization and soil properties of shelterbelt should be considered. For salt-leaching on top-soil and water supply to the shelterbelt in the northwest of the study area, long-term monitoring for the shelterbelt in the local area and high-water discharge drip irrigation on a regular basis are necessary. Meanwhile, the effects of stemflow to increase soil salinity should not be ignored.

Acknowledgments

This research was financially supported by a grant from the Natural Science Foundation of China (41271341, 41030530, 31300449), Thousand Youth Talents Plan Project (Y472241001) and the Western Light Project of the Chinese Academy of Sciences (XBBS201205). We thank the staff of the Tazhong Station of Desert Research for the field and laboratory assistances.

Author Contributions

All authors contributed to the design and development of this manuscript. Yuan Huang carried out the data analysis and prepared the first draft of the manuscript; Xinwen Xu, Yongdong Wang and Ying Zhao are the graduate advisor of Yuan Huang and contributed many ideas to the study; Jianguo Zhang and Congjuan Li provided some important advices on the concept of methodology and writing of the manuscript. All authors read and approved the final manuscript.

Conflicts of Interest

The authors declare no conflict of interest.

References

  1. Chartzoulakis, K.S. Salinity and olive: Growth, salt tolerance, photosynthesis and yield. Agric. Water Manag. 2005, 78, 108–121. [Google Scholar] [CrossRef]
  2. Beltran, J.M. Irrigation with saline water: Benefits and environmental impact. Agric. Water Manag. 1999, 40, 183–194. [Google Scholar] [CrossRef]
  3. Feikema, P.M.; Morris, J.D.; Connell, L.D. The water balance and water sources of a eucalyptus plantation over shallow saline groundwater. Plant Soil 2010, 332, 429–449. [Google Scholar] [CrossRef]
  4. Lei, J.Q.; Li, S.Y.; Jin, Z.Z.; Fan, J.L.; Wang, H.F.; Fan, D.D.; Zhou, H.W.; Gu, F.; Qiu, Y.; Xu, B. Comprehensive eco-environmental effects of the shelter-forest ecological engineering along the Tarim Desert Highway. Chin. Sci. Bull. 2009, 53, 190–202. [Google Scholar] [CrossRef]
  5. Li, B.; Xu, X.; Lei, J.; Qiu, Y.; Xu, B.; Zhou, H.; Wang, Q.; Wang, B.; Su, W. Site type classification for the shelter-forest ecological project along the Tarim Desert Highway. Chin. Sci. Bull. 2009, 53, 31–40. [Google Scholar] [CrossRef]
  6. Zhang, J.; Xu, X.; Lei, J.; Sun, S.; Fan, J.; Li, S.; Gu, F.; Qiu, Y.; Xu, B. The salt accumulation at the shifting aeolian sandy soil surface with high salinity groundwater drip irrigation in the hinterland of the Taklimakan Desert. Chin. Sci. Bull. 2009, 53, 63–70. [Google Scholar] [CrossRef]
  7. Homer-Dixon, T.F. Environmental scarcities and violent conflict: Evidence from cases. Int. Secur. 1994, 19, 5–40. [Google Scholar] [CrossRef]
  8. Wang, Y.; Xiao, D.; Li, Y.; Li, X. Soil salinity evolution and its relationship with dynamics of groundwater in the oasis of inland river basins: Case study from the Fubei Region of Xinjiang Province, China. Environ. Monit. Assess. 2008, 140, 291–302. [Google Scholar] [CrossRef] [PubMed]
  9. Salvati, L.; Ferrara, C. The local-scale impact of soil salinization on the socioeconomic context: An exploratory analysis in Italy. Catena 2015, 127, 312–322. [Google Scholar] [CrossRef]
  10. Karlen, D.L.; Tomer, M.D.; Neppel, J.; Cambardella, C.A. A preliminary watershed scale soil quality assessment in north central Iowa, USA. Soil Tillage Res. 2008, 99, 291–299. [Google Scholar] [CrossRef]
  11. Talaat, N.B.; Ghoniem, A.E.; Abdelhamid, M.T.; Shawky, B.T. Effective microorganisms improve growth performance, alter nutrients acquisition and induce compatible solutes accumulation in common bean (phaseolus vulgaris l.) plants subjected to salinity stress. Plant Growth Regul. 2014, 75, 281–295. [Google Scholar] [CrossRef]
  12. Garg, N.; Singla, P. Naringenin- and Funneliformis mosseae-mediated alterations in redox state synchronize antioxidant network to alleviate oxidative stress in Cicer arietinum L. Genotypes under salt stress. J. Plant Growth Regul. 2015, 1–16. [Google Scholar] [CrossRef]
  13. Zhang, H.J.; Dong, H.Z.; Li, W.J.; Zhang, D.M. Effects of soil salinity and plant density on yield and leaf senescence of field-grown cotton. J. Agron. Crop Sci. 2012, 198, 27–37. [Google Scholar] [CrossRef]
  14. Shannon, M.C.; Grieve, C.M. Tolerance of vegetable crops to salinity. Sci. Hortic. 1999, 78, 5–38. [Google Scholar] [CrossRef]
  15. Li, C.; Lei, J.; Zhao, Y.; Xu, X.; Li, S. Effect of saline water irrigation on soil development and plant growth in the taklimakan desert highway shelterbelt. Soil Tillage Res. 2015, 146, 99–107. [Google Scholar] [CrossRef]
  16. Sumner, M.; Rengasamy, P.; Naidu, R. Sodic soils: A reappraisal. In Sodic Soil: Distribution, Management and Environmental Consequences; Sumner, M., Naidu, R., Eds.; Oxford University Press: New York, NY, USA, 1998; pp. 3–17. [Google Scholar]
  17. Li, C.J.; Li, Y.; Jian, M.A.; Fan, L.L.; Wang, Q.X. Spatial heterogeneity of soil chemical properties between haloxylon persicum and haloxylon ammodendron populations. J. Arid Land 2010, 2, 257–265. [Google Scholar]
  18. Gu, F.X.W.; Wen, Q.K.; Pan, B.R.; Hu, Y.L.; Xu, H.L. Research on soil enzyme activities of aeolian soil under artificial plantation in Taklimakan Desert heartland. J. Desert Res. 2000, 20, 293–297. [Google Scholar]
  19. Stoyan, H.; De-Polli, H.; Böhm, S.; Robertson, G.P.; Paul, E.A. Spatial heterogeneity of soil respiration and related properties at the plant scale. Plant Soil 2000, 222, 203–214. [Google Scholar] [CrossRef]
  20. Hu, W.; Shao, M.; Han, F.; Klaus, R.; Jing, T. Watershed scale temporal stability of soil water content. Geoderma 2010, 158, 181–198. [Google Scholar] [CrossRef]
  21. Wilczek, A.; Szypłowska, A.; Skierucha, W.; Cieśla, J.; Pichler, V.; Janik, G. Determination of soil pore water salinity using an FDR sensor working at various frequencies up to 500 MHz. Sensors (Basel) 2012, 12, 10890–10905. [Google Scholar] [CrossRef] [PubMed]
  22. Skierucha, W.; Wilczek, A.; Szypłowska, A.; Sławiński, C.; Lamorski, K. A TDR-based soil moisture monitoring system with simultaneous measurement of soil temperature and electrical conductivity. Sensors (Basel) 2012, 12, 13545–13566. [Google Scholar] [CrossRef] [PubMed]
  23. Douaik, A.; van Meirvenne, M.; Tóth, T. Statistical methods for evaluating soil salinity spatial and temporal variability. Soil Sci. Soc. Am. J. 2007, 71, 1629–1635. [Google Scholar] [CrossRef]
  24. Schneider, K.; Huisman, J.A.; Breuer, L.; Frede, H.G. Ambiguous effects of grazing intensity on surface soil moisture: A geostatistical case study from a steppe environment in Inner Mongolia, PR China. J. Arid Environ. 2008, 72, 1305–1319. [Google Scholar] [CrossRef]
  25. Eigenberg, R.A.; Doran, J.W.; Nienaber, J.A.; Ferguson, R.B.; Woodbury, B.L. Electrical conductivity monitoring of soil condition and available N with animal manure and a cover crop. Agric. Ecosyst. Environ. 2002, 88, 183–193. [Google Scholar] [CrossRef]
  26. Zheng, Z.; Zhang, F.; Ma, F.; Chai, X.; Zhu, Z.; Shi, J.; Zhang, S. Spatiotemporal changes in soil salinity in a drip-irrigated field. Geoderma 2009, 149, 243–248. [Google Scholar] [CrossRef]
  27. Corwin, D.L.; Lesch, S.M. Apparent soil electrical conductivity measurements in agriculture. Comput. Electron. Agric. 2005, 46, 11–43. [Google Scholar] [CrossRef]
  28. Nelson, D.W.; Sommers, L.E. Total carbon, organic carbon, and organic matter. Methods soil Anal. 1996, 3, 961–1010. [Google Scholar]
  29. Egner, H.; Riehm, H.; Domingo, W.E. Untersuchungen über die chemische Bodenanalyse als Grundlage für die Beurteilung des Nährstoffzustandes der Böden. II. Chemische Extraktionsmethoden zur Phosphor-und Kaliumbestimmung. Lantbrukshogskolans Unnaler 1960, 26, 199–215. [Google Scholar]
  30. Day, P.R. Particle fractionation and particle-size distribution. Methods Soil Anal. 1965, 9, 548–549. [Google Scholar]
  31. Western, A.W.; Blöschl, G.; Grayson, R.B. Geostatistical characterisation of soil moisture patterns in the Tarrawarra catchment. J. Hydrol. 1998, 205, 20–37. [Google Scholar] [CrossRef]
  32. Augustine, D.J.; Frank, D.A. Effects of migratory grazers on spatial heterogeneity of soil nitrogen properties in a grassland ecosystem. Ecology 2001, 82, 3149–3162. [Google Scholar] [CrossRef]
  33. Goovaerts, P. Geostatistical tools for characterizing the spatial variability of microbiological and physico-chemical soil properties. Biol. Fertil. Soils 1998, 27, 315–334. [Google Scholar] [CrossRef]
  34. Hu, K.; Li, H.; Li, B.; Huang, Y. Spatial and temporal patterns of soil organic matter in the urban–rural transition zone of Beijing. Geoderma 2007, 141, 302–310. [Google Scholar] [CrossRef]
  35. Zhang, J.G.; Chen, H.S.; Su, Y.R. Spatial variability and patterns of surface soil moisture in a field plot of karst area in southwest China. Plant Soil Environ. 2011, 57, 409–417. [Google Scholar]
  36. Corwin, D.L.; Lesch, S.M.; Oster, J.D.; Kaffka, S.R. Monitoring management-induced spatio–temporal changes in soil quality through soil sampling directed by apparent electrical conductivity. Geoderma 2006, 131, 369–387. [Google Scholar] [CrossRef]
  37. Zhang, Z.; Hu, B.; Hu, G. Spatial heterogeneity of soil chemical properties in a subtropical karst forest, southwest China. Sci. World J. 2014, 2014, 9. [Google Scholar] [CrossRef] [PubMed]
  38. McBratney, A.B.; Minasny, B.; Cattle, S.R. From pedotransfer functions to soil inference systems. Geoderma 2002, 109, 41–73. [Google Scholar] [CrossRef]
  39. Liu, Z.P.; Shao, M.A.; Wang, Y.Q. Spatial patterns of soil total nitrogen and soil total phosphorus across the entire loess plateau region of China. Geoderma 2013, 197, 67–78. [Google Scholar] [CrossRef]
  40. Zhao, Y.; Peth, S.; Wang, X.Y.; Lin, H.; Horn, R. Controls of surface soil moisture spatial patterns and their temporal stability in a semi-arid steppe. Hydrol. Processes 2010, 24, 2507–2519. [Google Scholar] [CrossRef]
  41. Abrol, I.P.; Yadav, J.S.P.; Massoud, F.I. Salt-affected soils and their managemen. In FAO Soils Bull; United Nations: Rome, Italy, 1988. [Google Scholar]
  42. Wang, X.J.; Xu, X.W.; Lei, J.Q. Spatiotemporal distribution of salt crust in a shelter-forest belt under drip-irrigation with salt water. Arid Zone Res. 2006, 23, 399–404. [Google Scholar]
  43. Pereira, L.S.; Oweis, T.; Zairi, A. Irrigation management under water scarcity. Agricultural water management. Agric. Water Manag. 2002, 57, 175–206. [Google Scholar] [CrossRef]
  44. Li, C.; Li, Y.; Ma, J. Spatial heterogeneity of soil chemical properties at finescales induced by haloxylon ammodendron (chenopodiaceae) plants in a sandy desert. Ecol. Res. 2011, 26, 385–394. [Google Scholar] [CrossRef]
  45. Brantley, S.L. Understanding soil time. Science 2008, 321, 1454–1455. [Google Scholar] [CrossRef] [PubMed]
  46. Wang, G.; Garcia, D.; Liu, Y.; de Jeu, R.; Johannes Dolman, A. A three-dimensional gap filling method for large geophysical datasets: Application to global satellite soil moisture observations. Environ. Model. Softw. 2012, 30, 139–142. [Google Scholar] [CrossRef]
  47. Lowery, B.; Swan, J.; Schumacher, T.; Jones, A. Physical properties of selected soils by erosion class. J. Soil Water Conserv. 1995, 50, 306–311. [Google Scholar]
  48. Zhao, H.L.; Zhou, R.L.; Zhang, T.H.; Zhao, X.Y. Effects of desertification on soil and crop growth properties in Horqin sandy cropland of Inner Mongolia, north China. Soil Tillage Res. 2006, 87, 175–185. [Google Scholar] [CrossRef]

