
Comparison of the Physical Properties of Showers that the Satisfaction of Shower Feeling among Users in Three Asian Countries


Abstract
:1. Introduction
- (1)
- Satisfaction feelings of nine showerheads are assessed by sensory scale.
- (2)
- The physics of the showerheads spray are determined with existing physical properties test apparatus.
- (3)
- The relationship between water consumptions, satisfaction feelings of shower and physics of shower spray in Taiwan and Vietnam are analyzed.
2. Methods
2.1. Determination of Physical Properties

| Shower No. | S1 | S2 | S3 | S4 | S5 | S6 | S7 | S8 | S9 |
|---|---|---|---|---|---|---|---|---|---|
| Flow Rate [L/min] | 6.5 | 5.5 | 6.9 | 8 | 4.9 | 5.5 | 7.5 | 13 | 9.5 |
| Hole diameter [mm] × Number of holes | φ 1.15 × 42 | φ 0.5 × 33 φ 1.0 × 20 | φ 0.3 × 236 | φ 0.8 × 47 | φ 0.6 × 36 | φ 0.65 × 32 | φ 1.3 × 90 | φ 1.3 × 90 | φ 0.7 × 86 |
| Total area of spray holes [mm2] | 44 | 13 | 17 | 24 | 10 | 11 | 119 | 119 | 33 |
| Spray velocity [m/s] | 2.98 | 8.20 | 6.89 | 5.64 | 8.02 | 8.63 | 1.81 | 1.05 | 4.78 |
| Face plate size [mm] | Lh: 34, 30 Lw: 42 | 36 | 50 | 26 | 48 | 32 | 120 | 120 | 120 |
| Average of hole diameters [mm] | 42 | 52 | 236 | 47 | 36 | 32 | 90 | 90 | 86 |
2.2. Evaluation of Satisfaction
2.2.1. Evaluation Method
2.2.2. Experiment Location, Experiment Period, Subjects
2.2.3. Survey of Bathing Habit
2.3. Survey of Shower Water Temperature
3. Results and Discussion
3.1. Analysis of Relationship between Physical Properties, Usage Water Flow and Satisfaction
| Group | Taiwan | Vietnam |
|---|---|---|
| I Low Flow—High Satisfuction | S1, S3 | S1, S2, S3, S6, S8 |
| II Low Flow—Low Satisfuction | S2, S5, S6, S8 | S5 |
| III Normal Flow—High Satisfuction | S4, S7, S9 | S4, S7, S9 |
| IV Normal Flow—Low Satisfuction | -- | -- |
| Satisfaction | I | II | III | F-Value | Multiple Comparison | |
|---|---|---|---|---|---|---|
| Low Flow | Low Flow | Normal Flow | ** p < 0.001 | |||
| High Satisfuction | Low Satisfuction | High Satisfuction | ||||
| Taiwan | AVERAGE | 5.0 | 3.7 | 4.6 | 9.176 ** | I, III > II |
| SD | 0.3 | 0.2 | 0.2 | |||
| Vietnam | AVERAGE | 4.9 | 3.7 | 4.8 | 5.096 ** | I, III > II |
| SD | 0.2 | 0.3 | 0.2 | |||
| Countries | Physical Properties | Ⅰ | Ⅱ | Ⅲ | F-Value | Multiple Comparison | |
|---|---|---|---|---|---|---|---|
| Low Flow | Low Flow | Normal Flow | ** p < 0.001 | ||||
| High Satisfuction | Low Satisfuction | High Satisfuction | * p < 0.005 | ||||
| Taiwan | Spray Force [N] | AVERAGE | 1.0 | 1.0 | 1.2 | 68.671 * | III > I, II |
| SD | 0.2 | 0.1 | 0.1 | ||||
| Spray Force (per-hole) [N] | AVERAGE | 0.01 | 0.025 | 0.018 | 31.495 ** | II > II, I> I | |
| SD | 0.01 | 0.010 | 0.004 | ||||
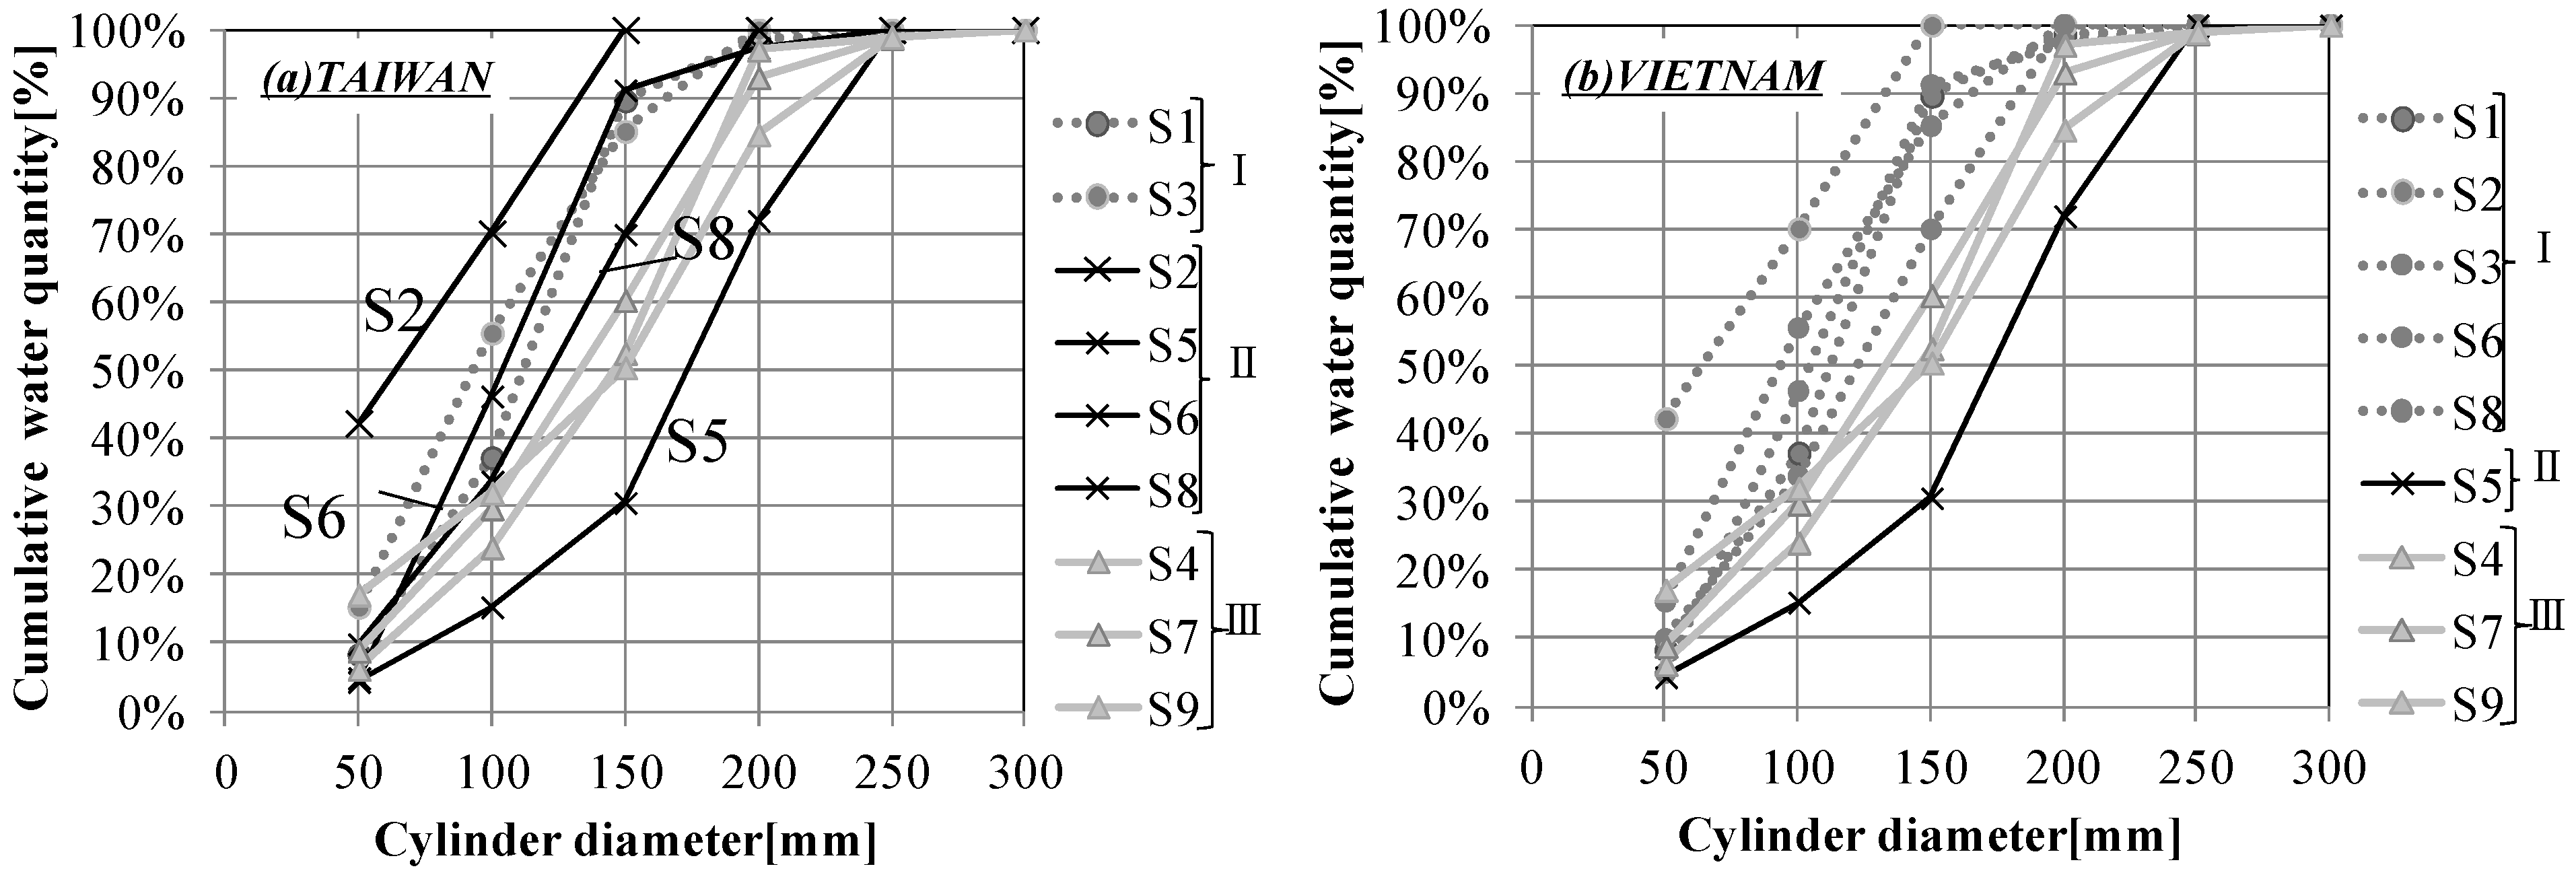
| Spray Pattern φ 100 [%] | AVERAGE | 46 | 42 | 29 | 72.756 ** | I, II > III | |
| SD | 9 | 20 | 4 | ||||
| Spray Pattern φ 150 [%] | AVERAGE | 87 | 74 | 54 | 333.253 ** | I, II > III | |
| SD | 2 | 27 | 4 | ||||
| Temperature Drop [°C] | AVERAGE | 1.9 | 1.9 | 1.5 | 6.993 ** | I, II > III | |
| SD | 0.4 | 0.9 | 0.3 | ||||
| Spray Angle [deg] | AVERAGE | 5 | 5 | 5 | 0.222 | -- | |
| SD | 1 | 2 | 2 | ||||
| Vietnam | Spray Force [N] | AVERAGE | 1.0 | 0.9 | 1.2 | 71.552 ** | III > I > II |
| SD | 0.2 | 0.0 | 0.1 | ||||
| Spray Force (per-hole) [N] | AVERAGE | 0.020 | 0.027 | 0.018 | 6.733 ** | II > I, III | |
| SD | 0.011 | 0.000 | 0.004 | ||||
| Spray Pattern φ 100 [%] | AVERAGE | 49 | 15 | 29 | 109.868 ** | I > III > II | |
| SD | 13 | 0 | 4 | ||||
| Spray Pattern φ 150 [%] | AVERAGE | 87 | 31 | 54 | 519.096 ** | I > III > II | |
| SD | 10 | - | 4 | ||||
| Temperature Drop [°C] | AVERAGE | 1.6 | 3.4 | 1.5 | 150.792 ** | II > I, III | |
| SD | 0.5 | 0.0 | 0.3 | ||||
| Spray Angle [deg] | AVERAGE | 5 | 4 | 5 | 0.872 | -- | |
| SD | 2 | 0 | 2 | ||||
| Countries | I | II | III |
|---|---|---|---|
| Low Flow | Low Flow | Normal Flow | |
| High Satisfuction | Low Satisfuction | High Satisfuction | |
| Taiwan | φ 0.73 | φ 0.78 | φ 0.93 |
| Vietnam | φ 0.79 | φ 0.6 | φ 0.93 |
3.2. Comparison of the Results in Japan, Taiwan and Vietnam
| Physical Properties | Japan | Taiwan | Vietnam |
|---|---|---|---|
| Spray Force [N] | -- | -- | -- |
| Spray Force-per-hole [N] | 0.029 | 0.023 | 0.023 |
| Spray Pattern φ 100 [%] | -- | -- | 20 |
| Spray Pattern φ 150 [%] | -- | 35 | 34 |
| Temperature Drop [°C] | 2.1 | -- | 3.2 |
| Spray Angle [°] | 5 | -- | -- |
4. Conclusions
Acknowledgments
Author Contributions
Conflicts of Interest
References
- Shimizu, Y.; Dejima, S.; Toyosada, K. The CO2 Emission Factor of Water in Japan. Water 2012, 4, 759–769. [Google Scholar] [CrossRef]
- Hakket, M.J.; Gray, N.F. Carbon Dioxide Emission Savings Potential of Household Water Use Reduction in the UK. J. Sustain. Dev. 2009, 2, 36–43. [Google Scholar] [CrossRef]
- Gidding, D. Low Flow Showerheads as a Regional Energy Savings Measure. RTF Meeting 2010. Available online: http://rtf.nwcouncil.org/meetings/2010/02/Measure%20Assessment%20-%20Showerheads%20-%2020100125.docx (accessed on 30 March 2015).
- Okamoto, M.; Sato, M.; Shodai, Y.; Kamijo, M. Identifying the physical properties of showers that influence the satisfaction of shower feeling for the purpose of developing water-saving showers. Water 2015, 7, 4054–4062. [Google Scholar] [CrossRef]
- Water and Energy Efficient Showers: Project Report 2007. Available online: http://www.allianceforwaterefficiency.org/assets/0/28/142/48/88/C86DEB33-2463-4795-BE5E-A66EA64CAB3E.pdf (accessed on 28 March 2015).
- Okamoto, M.; Sato, M.; Shodai, Y. Analysis of factors affecting showering comfort—Comparison between Japan and Taiwan. J. Affect. Eng. 2015, 14, 173–180. [Google Scholar]
- Woolf, D.; Pau, I.; Shouler, M. Shower head design: Increasing performance at lower flow rates. In Proceedings of the 32nd International Symposium on Water Supply and Drainage for Buildings, Taipei, Taiwan, 18–20 September 2006; pp. 18–20.
- Alkhanddar, A.R.; Phipps, D.; Karci, B.; Hordessuex, J. Saving water in showers. J. Phys. Conf. Ser. 2007, 76. [Google Scholar] [CrossRef]
- High-Efficiency Showerhead Performance Study: Final Report 2010. Available online: http://www.map-testing.com/assets/files/Showerhead%20Final%20Dec%202011.pdf (accessed on 28 March 2015).
- Kondo, T.; Hanao, M.; Takasu, N.; Otuka, M.; Kamata, M. Study on methods of designing showerheads: The effects on optimum flow rate and comfort condition resulted from difference in size and angle of shower heads’ hole. J. Arch. Plan. 2003, 563, 61–67. (In Japanese) [Google Scholar]
- Murakawa, S.; Nishina, D.; Inoue, K. A Study on the Design Requirements of Equipment for Taking a Shower: Part 2-Evaluation of Shower Heads Based on the Subject’s Feeling for Uses. J. Soc. Heat. Air Cond. Sanit. Eng. Jpn. 1995, 58, 119–131. (In Japanese) [Google Scholar]
- Kiyono, A.; Inoue, T.; Mae, M.; Iwamoto, S.; Kurafuchi, T.; Otuka, M.; Sato, M.; Yatsuzuka, H.; Hirosawa, S.; Mori, Y.; et al. Study on properties and feelings of hot water saving faucet and showerhead: Part 1 Study on properties of showers by an experiment of force of flow, Summaries of technical papers of annual meeting. Arch. Inst. Jpn. 2013, 2013, 621–622. [Google Scholar]
- Okamoto, M.; Sato, M.; Yamazaki, H.; Shodai, Y.; Cheng, C.L.; Sakaue, K. Study on relationship between the subjective shower feeling and the criteria for low-flow showerhead. In Proceedings of the International Symposium on Water Supply and Drainage for Buildings CIB062, Nagano, Japan, 17–20 September 2013; pp. 645–655.
- Yaita, R.; Okamoto, M.; Sato, M.; Shodai, Y.; Lee, M.C.; Cheng, C.L.; Sakaue, K. Study on Comfort of Hand Shower in Vietnam. In Proceedings of the Society of Heating, Air-Conditioning and Sanitary Engineers of Japan, Akita, Japan, 3–5 September 2013; pp. 33–36.
- Australian Standard. Performance of Showers for Bathing; AS3662:2013; SAI GLOBAL: Sydney, Australia, 2013. [Google Scholar]
- ASME Standard; CSA Standard. Pumbing Supply Fittings; American Society of Mechanical Engineers (ASME) A112.18.1-2012/CSA B125.1-12; CSA Group: Toronto, ON, Canada, 2012. [Google Scholar]
- Australian/NewZealand Standard. Water Efficient Products-Rating and Labelling; AS/NZS6400:2005; SAI GLOBAL: Sydney, Australia, 2005. [Google Scholar]
- Gazerani, P.; Arendt-Nielsen, L. The impact of ethnic difference in response to capsaicin-included trigeminal sensitization. Pain 2005, 117, 223–229. [Google Scholar] [CrossRef] [PubMed]
- Nayak, S.; Shiflett, S.C.; Eshun, S.; Levine, F.M. Culture and gender effects in pain beliefs and the prediction of pain tolerance. Cross Cult. Res. 2000, 34, 135–151. [Google Scholar] [CrossRef]
- Nigel, A.S.; Taylor, N. Ethnic differences in thermoregulation: Genotypic vs. phenotypic heat adaptation. J. Ther. Biol. 2006, 31, 90–104. [Google Scholar]
- Marino, F.E.; Lambert, M.I.; Noakes, T.D. Superior performance of African runners in warm humid but not in cool environmental conditions. J. Appl. Physiol. 2003, 96, 124–130. [Google Scholar] [CrossRef] [PubMed]
- Mohamed, S.; Yutaka, T.; Nobuko, H.; Sirisinghe, R.G.; Mizuho, F.; Chin, M.C. Effects of Exercise in the Heat on Thermoregulation of Japanese and Malaysian Males. J. Physiol. Anthropol. Appl. Hum. Sci. 2005, 24, 267–275. [Google Scholar]
- Lee, J.Y.; Wakabayashi, H.; Wijayanto, T.; Hashiguchi, N.; Saat, M.; Tochihara, Y. Ethnic differences in thermoregulatory responses during resting, passive and active heating: Application of Werner’s adaptation model. J. Appl. Physiol. 2011, 111, 2895–2905. [Google Scholar] [CrossRef] [PubMed]
- Japan Meteorological Agency. Available online: http://www.data.jma.go.jp/obd/stats/etrn/view/nml_sfc_ym.php?prec_no=82&prec_ch=%95%9F%89%AA%8C%A7&block_no=47807&block_ch=%95%9F%89%AA&year=&month=&day=&elm=normal&view= (accessed on 19 March 2015).
- Central Weather Bureau 1981–2010. Available online: http://www.cwb.gov.tw/V7e/climate/monthlyMean/tx.htm (accessed on 19 March 2015).
- Hydro-Meteorological Service of Vietnam. Available online: http://worldweather.wmo.int/082/c00308.htm (accessed on 19 March 2015).
- Kishino, T.; Nagahama, A.; Sasagawa, K.; Matsuda, M. Heart rate variability during the bathing in still water and flowing water. J. Jpn. Soc. Balneol. Climatol. Phys. Med. 1996, 59, 175–183. (In Japanese) [Google Scholar]
- Berardi, U.; Alborzfard, N. Water consumption in dormitories: InsIghts from a survey in the United States. In Sustainable Water Use and Management; Springer International Publishing AG: Cham, Switzerland, 2015. [Google Scholar]
© 2015 by the authors; licensee MDPI, Basel, Switzerland. This article is an open access article distributed under the terms and conditions of the Creative Commons Attribution license (http://creativecommons.org/licenses/by/4.0/).
Share and Cite
Okamoto, M.; Yaita, R.; Sato, M.; Kamijo, M.; Toyosada, K.; Shimizu, Y.; Sakaue, K.; Liao, W.-J.; Lee, M.-C.; Cheng, C.-L. Comparison of the Physical Properties of Showers that the Satisfaction of Shower Feeling among Users in Three Asian Countries. Water 2015, 7, 4161-4174. https://doi.org/10.3390/w7084161
Okamoto M, Yaita R, Sato M, Kamijo M, Toyosada K, Shimizu Y, Sakaue K, Liao W-J, Lee M-C, Cheng C-L. Comparison of the Physical Properties of Showers that the Satisfaction of Shower Feeling among Users in Three Asian Countries. Water. 2015; 7(8):4161-4174. https://doi.org/10.3390/w7084161
Chicago/Turabian StyleOkamoto, Minami, Ryohei Yaita, Minoru Sato, Masayoshi Kamijo, Kanako Toyosada, Yasutoshi Shimizu, Kyosuke Sakaue, Wan-Ju Liao, Meng-Chieh Lee, and Cheng-Li Cheng. 2015. "Comparison of the Physical Properties of Showers that the Satisfaction of Shower Feeling among Users in Three Asian Countries" Water 7, no. 8: 4161-4174. https://doi.org/10.3390/w7084161