1. Introduction
In agricultural countries such as Syria, the availability of water resources is considered to be a key factor for economic development. Syria is classified as a largely arid country, with two thirds of its land being desert and Rocky Mountains [
1]. The percentage of the total irrigated areas served by groundwater increased from 49% in 1985 to 60% in 2004 [
2,
3]. It is well recognized that regional depletion of groundwater resources is a global issue [
4,
5]. Groundwater extraction facilitates social development and economic growth, but at the same time it may cause a decline in groundwater level and degradation of the ecosystem. Over the last few decades, the rapid growth and socioeconomic development in most of the sectors, particularly agriculture and light industry, where groundwater provides the necessary water supply, have severely affected water resources in the entire country. In most cases, there is no consideration given to the sustainability of the groundwater resources.
From a hydrological point of view, Mt. Hermon is an area shared between Syria, Lebanon and Israel. It is located in the transitional zone of the humid coastal region and dry desert area of southern Syria. Mt. Hermon is important because snowmelt and precipitation in this area serve as a feed for all streams, springs and rivers in that area. The drought in the Middle East that began in 2007 has further strained the limited water resources in the region [
6,
7,
8]. The decrease in water resources, as a result of climate variability and increasing water demand, is one of the major challenges facing the inhabitants there who mainly depend on agricultural production. Thus, data on groundwater availability are significant for water-users in that area. The irrigated area is either totally dependent on groundwater or combined with Awaj River water (
Figure 1c) through several canals branching from this river. The knowledge about the aquifer system of this region is limited. The lack of data is due to the inaccessibility to most parts of this massif region and the difficulties of maintaining meteorological stations and collecting related data at high altitude. The absence of hydrological data exchange between Israel, Syria and Lebanon is considered to be another obstacle.
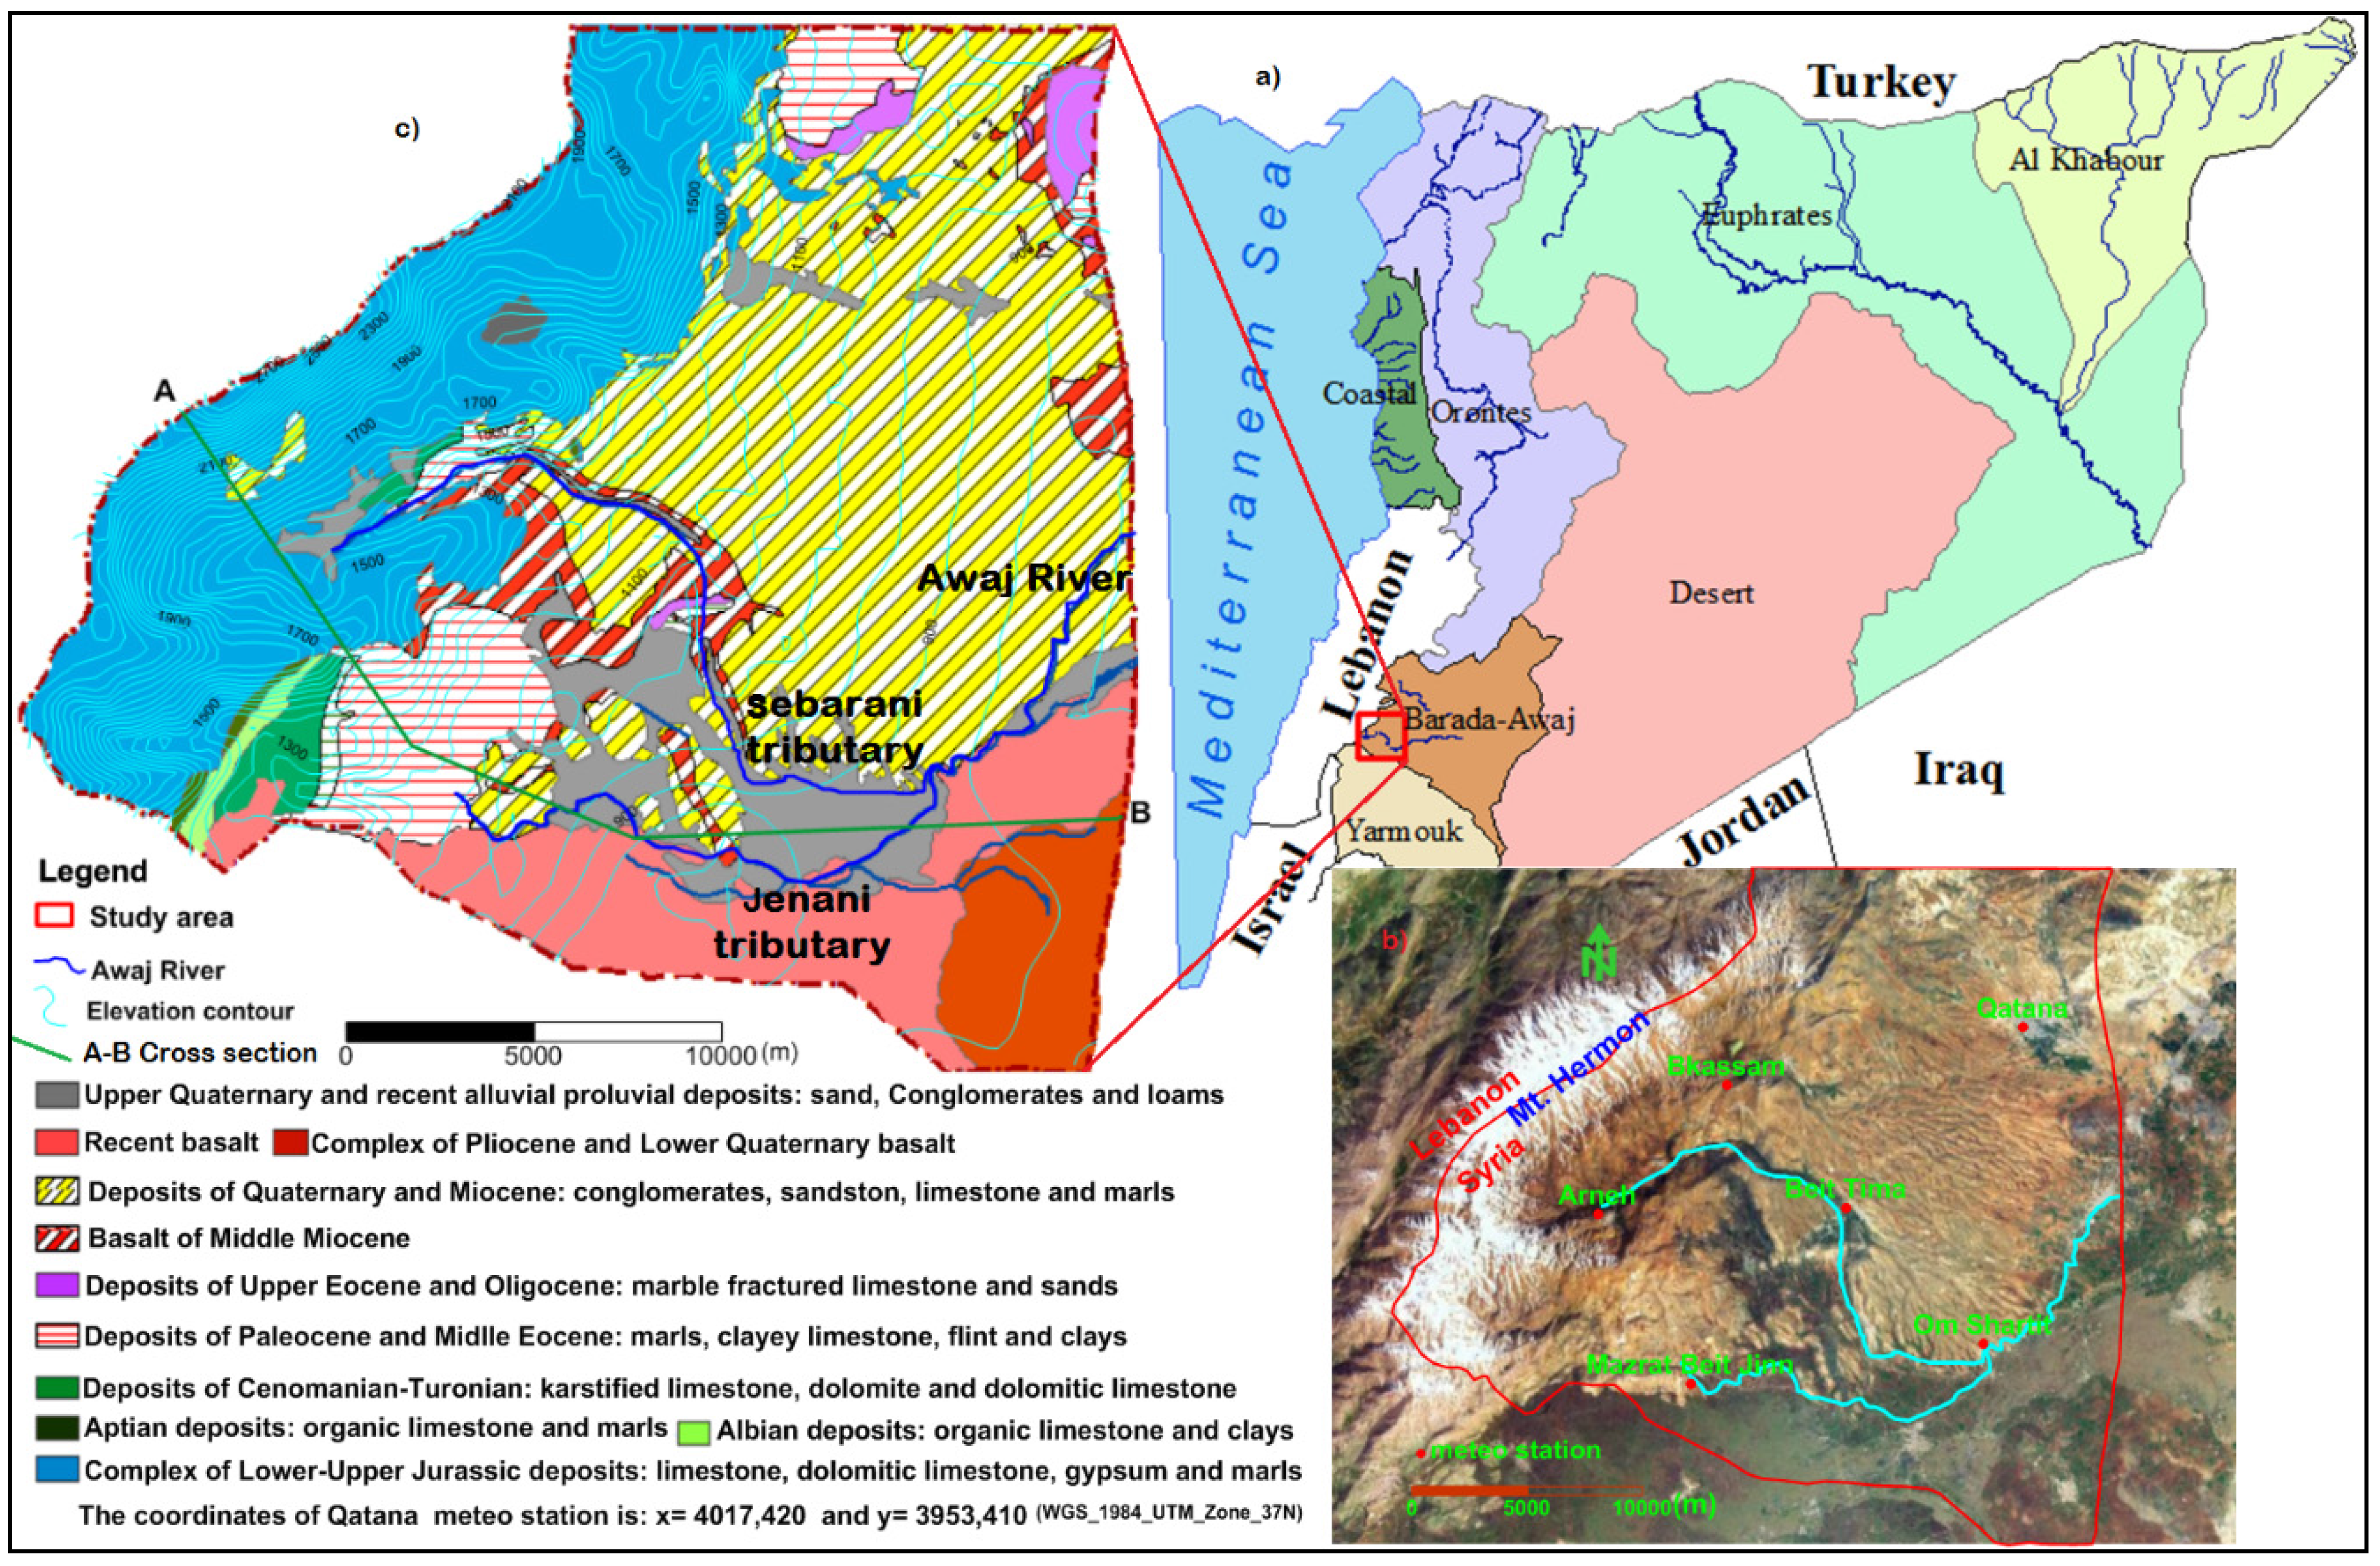
Figure 1.
(a): The location of the study area on the map of Syria which is divided into seven hydrogeological basins; (b): The satellite map of the study area shows Mt. Hermon and the locations of meteorological stations; (c): The geological map of the study area showing different geological formations.
Groundwater modeling has been widely used to investigate groundwater system dynamics and understand flow patterns [
9,
10]. It can also be considered as an alternative approach to overcome the lack of observational data. Groundwater models may provide estimations of the water balance of the system under specified hydrological conditions. The developed model in this case study will be used to calculate the water budget component of the upper aquifer horizon in the model domain, which is considered a vital source for the intensive agricultural activities developed in the study area. Data on water use and pumping are essential in order to develop a water budget or groundwater flow model. The accurate monitoring of agricultural water use is an important factor in reducing the uncertainty of water balance calculation. However, quantifying groundwater abstraction remains a difficult but necessary challenge. Agriculture accounts for 87% of the water withdrawn from Syria’s aquifers, rivers and lakes [
11,
12]. Groundwater abstraction for both agricultural and domestic uses is well developed in the study area. The study aims to (1) develop a groundwater model representing the groundwater flow system in the complex of the northeastern part of Mt. Hermon; (2) improve the hydrogeological understanding of this system and (3) provide a quantitative estimate of the groundwater budget of the upper aquifer horizon of the model domain under steady-state condition. This horizon is densely inhabited and agricultural activities are well concentrated in it. The outcome of the proposed model could be used as a management tool to improve water use in this semi-arid region in order to achieve sustainable use of groundwater resources.
2. General Settings of the Study Area
The Barada and Awaj basin is one of the seven hydrological basins in Syria and is located in the south-west of the country. The study area occupies the southwestern part of this basin where Mt. Hermon is located (
Figure 1a). Mt. Hermon is the highest point of the Anti-Lebanon Mountains. This mountain stretches for a length of 55 km and a width of 25 km of the anticline of mostly karstified limestone [
13]. The general slope of the study area is from west to east and south-east. Its gradient reaches a value of about 50% at the slope of Mt. Hermon and less than 2% in the eastern or south-eastern parts. The elevation of this area varies between 800 and 2800 m a.s.l.
In this part of the Mediterranean region, precipitation is restricted to the months of November to April. The annual amount of precipitation is approximately 300 and 1000 mm·y
−1 in the flatland and the semi-humid mountain region, respectively. The infiltrated precipitation in the mountainous area either discharges locally as a karstic springs in the upper part of the Arneh valley (
Figure 1b) or recharges the aquifers. Climate changes have resulted in a decrease in winter temperatures and total precipitation amount and in an increase in summer temperatures. These factors have led to the domination of a dry continental climate and contributed to the increasing water demand on the unsustainable abstraction of groundwater resources [
14].
The model covers the study area of approximately 600 km
2 (
Figure 1b). This area is considered to be a main recharge region of the Awaj River, which is a main water course in that area. This stream is formed by the junction of two main tributaries (Sebarani and Jenani,
Figure 1c), which are fed by a large number of karst springs distributed along the slope of Mt. Hermon. The annual median discharge of the Awaj River was 4.7 m
3·s
−1 between the years 1982 and 2004 but decreased to approximately 2.2 m
3·s
−1 with a total drought period during summer in more recent years (2004–2014) [
1].
The geological structure of the study area is the result of Jurassic to recent deposition, tectonic, and volcanism. Sporadic uplift along with comprehensive folding and faulting at shallow depth have resulted in a variety of surface forms and geologic structures. It can be divided into three parts: mountain ridges, volcanic district and plain area. The major sharp, deep valleys follow synclinal structures, are formed as strike valleys parallel to hogbacks or are the result of Pleistocene erosion along normal faults of significant displacement. The narrow, deep Arneh valley connects the mountainous part to the plain central region.
3. Geological Settings
The main formations outcropping in the study area range from Middle Jurassic up to the Quaternary period (
Figure 1c). The complex of thick karstified strata of Jurassic limestone, which interbeds with dolomite, dolomitic limestone gypsiferous limestone and marl is outcropped in the western portion of the study area in Mt. Hermon (
Figure 1c). The most important factors controlling karst development in Mt. Hermon are geological features, altitude defining the climatic belts, the local slope gradient and the paleohydrological evolutionary history of the mountain [
15]. The development of karstic features causes a large preferential groundwater flow and relatively little surface runoff [
13].
Limited exposure of Cretaceous and Paleogene is found locally in the south-western portion of the study area (
Figure 1c). The Cretaceous rock sequence ranges from Aptian to Senonian. The Aptian and Albian formations are mostly composed of organic limestone containing marls and clays. The Cenomanian-Turonian rock strata are composed of limestone, dolomitic limestone layers and crystalline dolomite with interbeds of argillaceous limestone, marl and sandstone. The Paleogene formations consist of intercalation of marly layers, marly limestone, clay and the limestone of Upper Eocene which is characterized by nummulites.
The plain areas are characterized by the exposure of the Neogene and Quaternary deposits. These deposits are mainly made of conglomerates, limestone and marly limestone, and dark colored basalt of Miocene age which is characterized by fractures filled with calcite, soil and clay. The Quaternary basalts resulting from lava overflow from volcanic vents [
16] are located in the southern portion of the study area.
The major branches of the Red Sea-Dead Sea-Rift Valley transform faults system form the boundary which links the Arabian plate convergence in southern Turkey with the active seafloor spreading in the Red Sea. This system cuts through the study area which makes it very complex from a tectonic point of view [
17]. Mt. Hermon and its northern extension, the Anti-Lebanon Mountains, are part of the Syrian arc fold system, which is a semi-continuous belt extending from western Egypt through the northern Sinai, the Negev desert and the adjacent offshore water of the south-eastern Mediterranean to Syria in the east [
18]. As a result of folding and faulting structures, the Jurassic formations are in direct contact with the Paleogene and Neogene formations.
4. Characteristics of Hydrogeology and Aquifers
The majority of water flow in the study area exists as subsurface flow. Highly karstified, tectonically broken rocks and the step-like pattern of the slope create favorable infiltration conditions for precipitation in the elevated Jurassic formations. It is believed that faults, conduits, and fractures have an important role in controlling groundwater flow in this aquifer. The exposed part of the karstified Jurassic aquifers in the mountain area shows unfavorable conditions for exploitation, however, when they underlie at a reasonable depth in the plain area, they form a favorable but relatively deep aquifer. The Neogene and Quaternary deposits in the plain area (
Figure 1c) form a porous aquifer. The main aquifers and hydrogeological units are described below.
4.1. Jurassic Aquifer
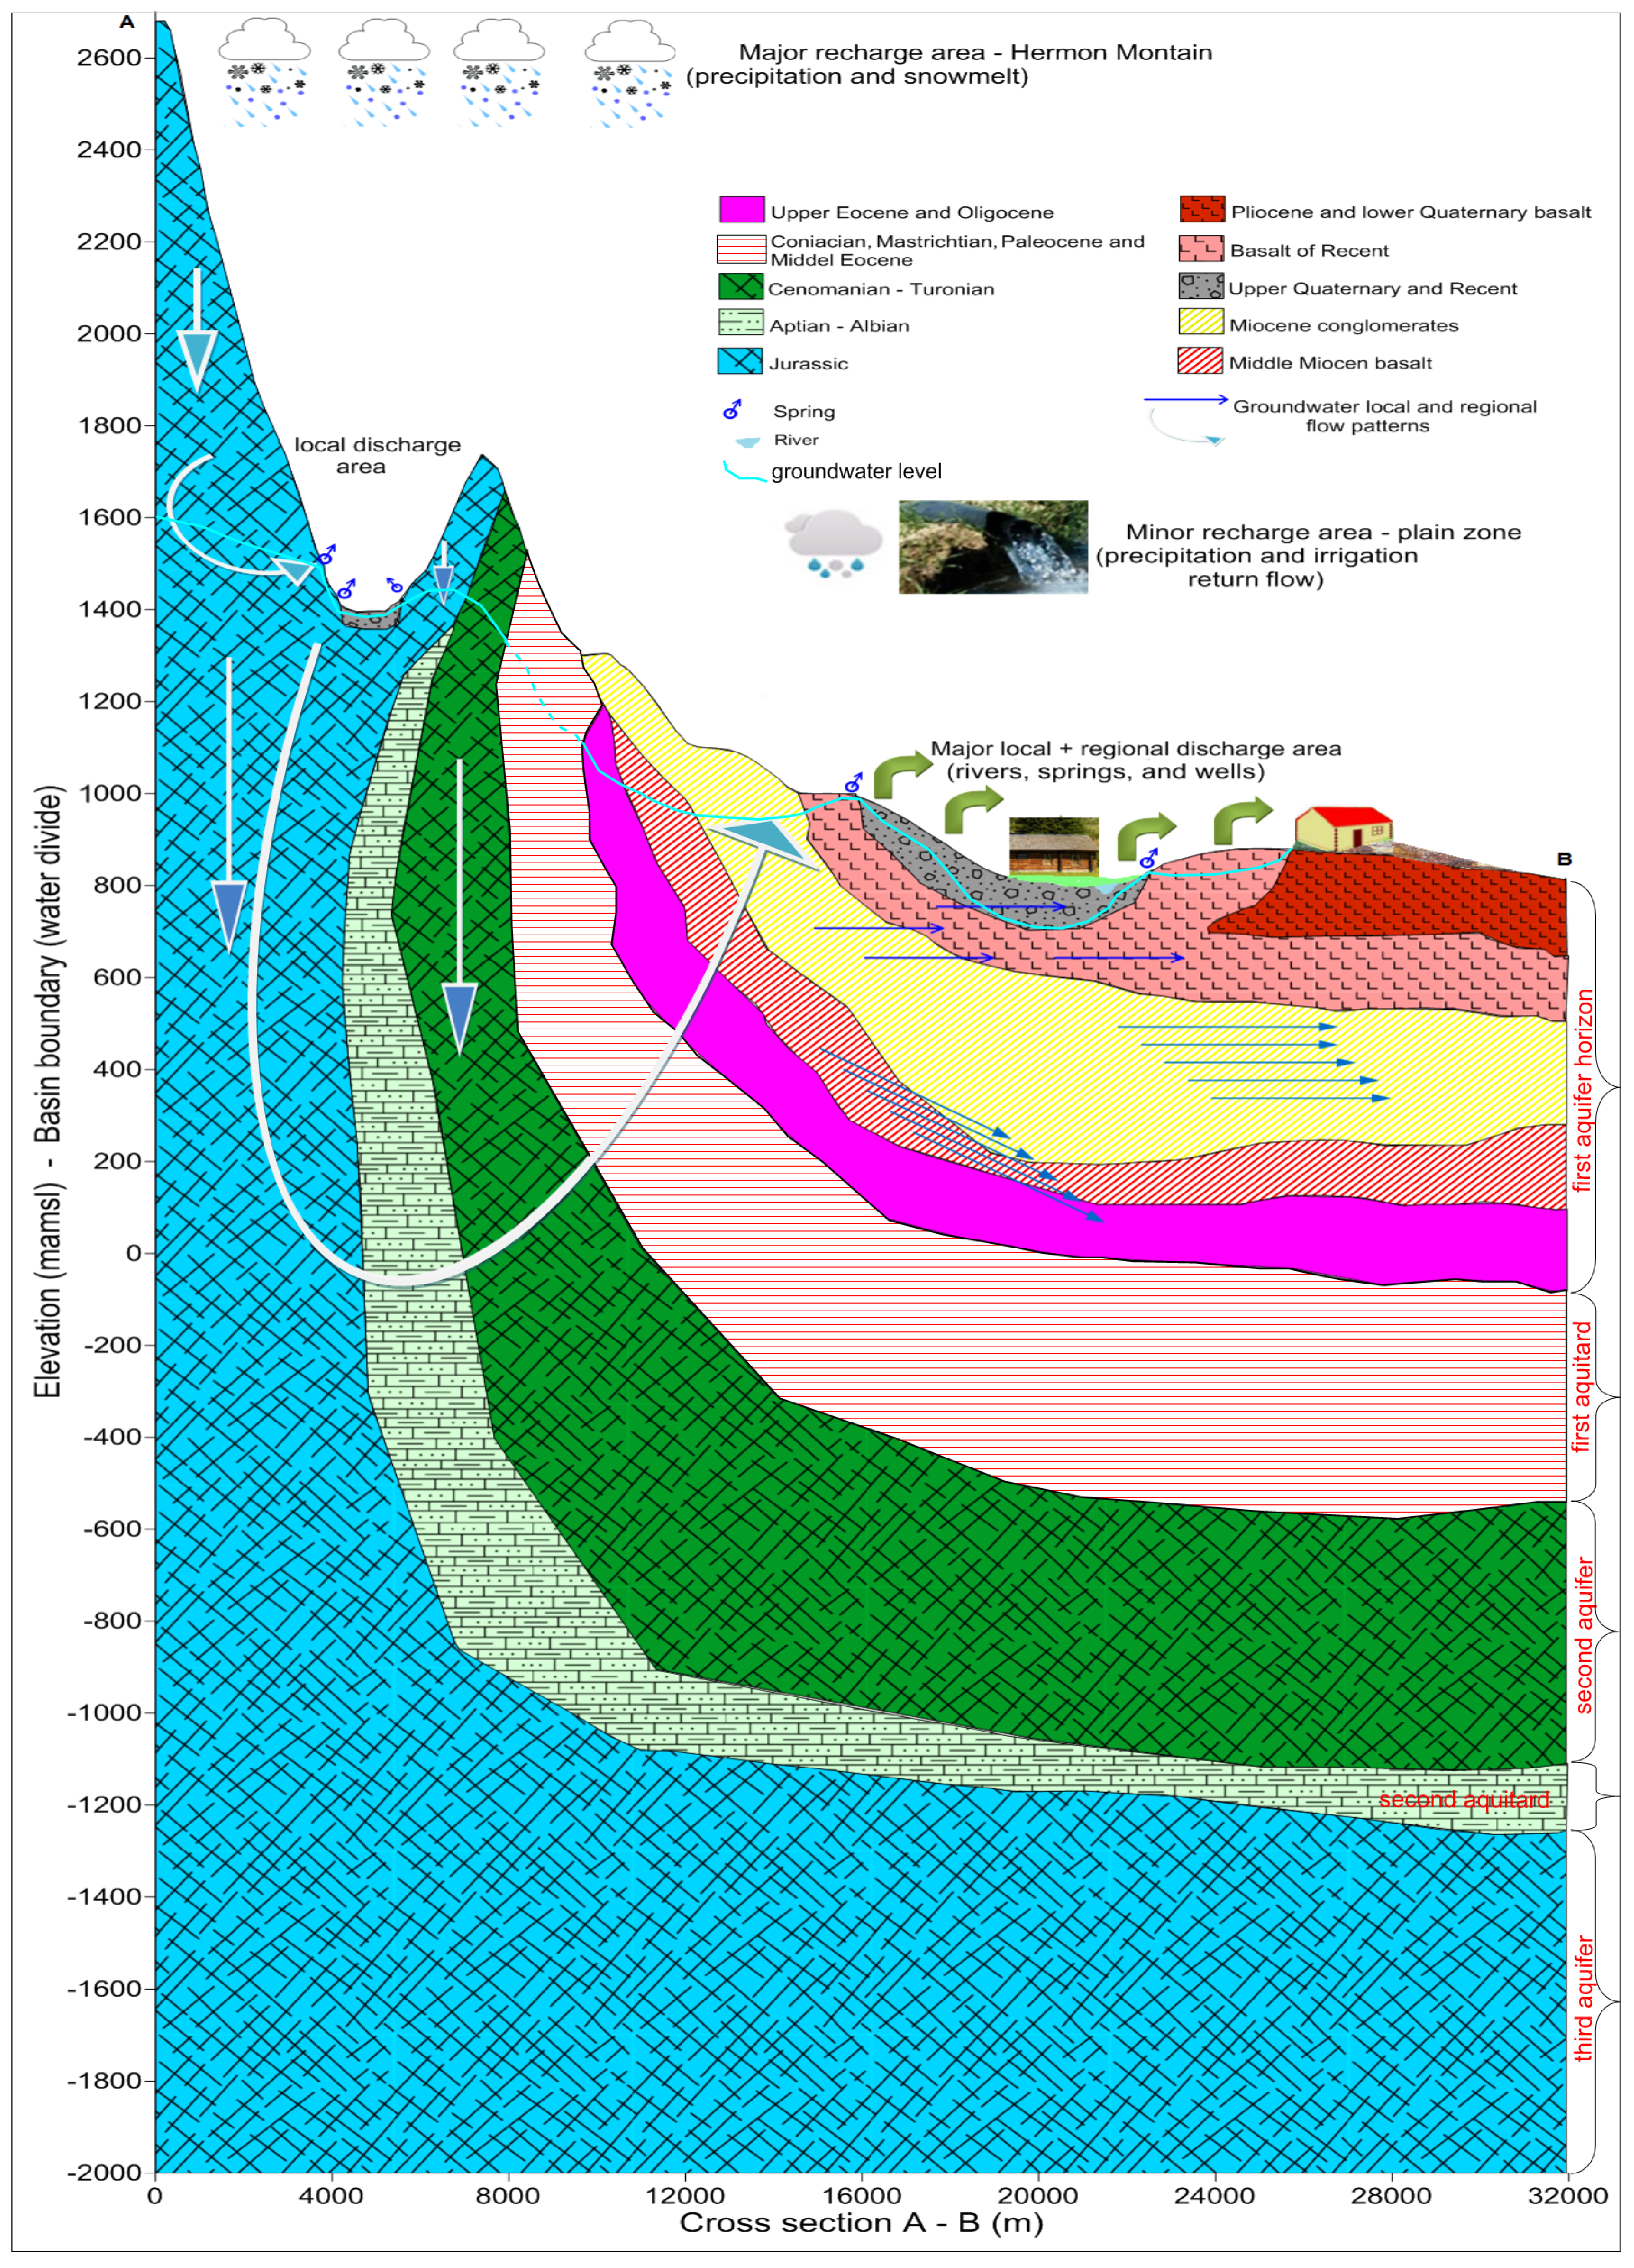
The thickness of the Jurassic aquifer (third aquifer in
Figure 2) in the study area is about 1000 m in average and can reach a thickness of 2000 m in some places within the basin. According to [
19], the hydraulic conductivity of this aquifer ranges between 2 and 99.3 m·d
−1 and on average is about 18 m·d
−1 thus the transmissivity could attain a value of around 3085 m
2·d
−1.
Figure 2.
Hydrogeological cross section A–B demonstrates the conceptual hydrogeological model.
Figure 2.
Hydrogeological cross section A–B demonstrates the conceptual hydrogeological model.
4.2. Cretaceous Aquifer
The Cretaceous aquifer is illustrated by Cenomanian-Turonian strata (second aquifer in
Figure 2). The thickness of this aquifer varies between 400 and 1000 m. The hydraulic conductivity of this aquifer system can increase to 80 m·d
−1 and its transmissivity ranges from 12 to 7435 m
2·d
−1 [
19]. This aquifer unit, together with the Jurassic one, forms the most important water-bearing system in the whole country and even in the Middle East [
19,
20,
21]. These two units form large fresh groundwater reservoirs with large storage and withdrawal capacity as well as a considerable discharge of issuing springs [
22].
4.3. The Sedimentary of Neogene/Quaternary, Volcanic Middle Miocene and Upper Paleogene Limestone Aquifer Horizon
The rock complex of these formations forms the upper aquifer (first aquifer in
Figure 2) in the model domain and covers the most part of the study area; they are widespread from the foothill of Mt. Hermon to the eastern boundaries of this area. This horizon consists of: (1) alluvial deposits of Quaternary; (2) the weakly cemented gravels and conglomerates of Neogene which are associated with interbeds of clay, sandstone and limestone; (3) the hydrolyzed basalt of Miocene, which is associated with thin beds and lenses of sand and sandstone and; (4) the fracturing and karstified limestone of Upper Eocene-Oligocene, which is interbedded with lenses of quartz. The similarity in the hydraulic characteristics of these layers [
23] as well as their hydraulic connections among hundreds of wells, allowed us to consider them as one aquifer horizon.
There are two intercalated aquitards between these hydrogeological units (
Figure 2); the first one consists of deposits of the complex of Coniacian-Mastrichtian and Paleocene- Middle Eocene. Its thickness ranges from 200 to 600 m and is underlaid by Cenomanian-Turonian strata. The second aquitard is illustrated by Aptian-Albian stages and underlying by Jurassic strata. Its average thickness is about 200 m. However, according to [
24], all the aquifers in the Barada and Awaj basin are hydraulically connected, although the connection is weak, because there are no beds between these aquifers acting as real aquicludes.
5. Modeling of Groundwater Flow
5.1. Model Construction
In order to simplify the field conditions of the model domain and based on the cross section A–B (
Figure 1c) and on the horizontal extent of the aquifers and aquitards in the study area, the design of the conceptual groundwater model (
Figure 2) was developed. The vertical and horizontal extent of the subsurface hydrogeological units and their connection are consistent with available information on boreholes [
23]. The recharge and discharge areas are delineated. The conceptual model assumed that the preferential groundwater flow occurs mainly in the Jurassic aquifer and discharges as karstic springs into the upper part of the Arneh valley.
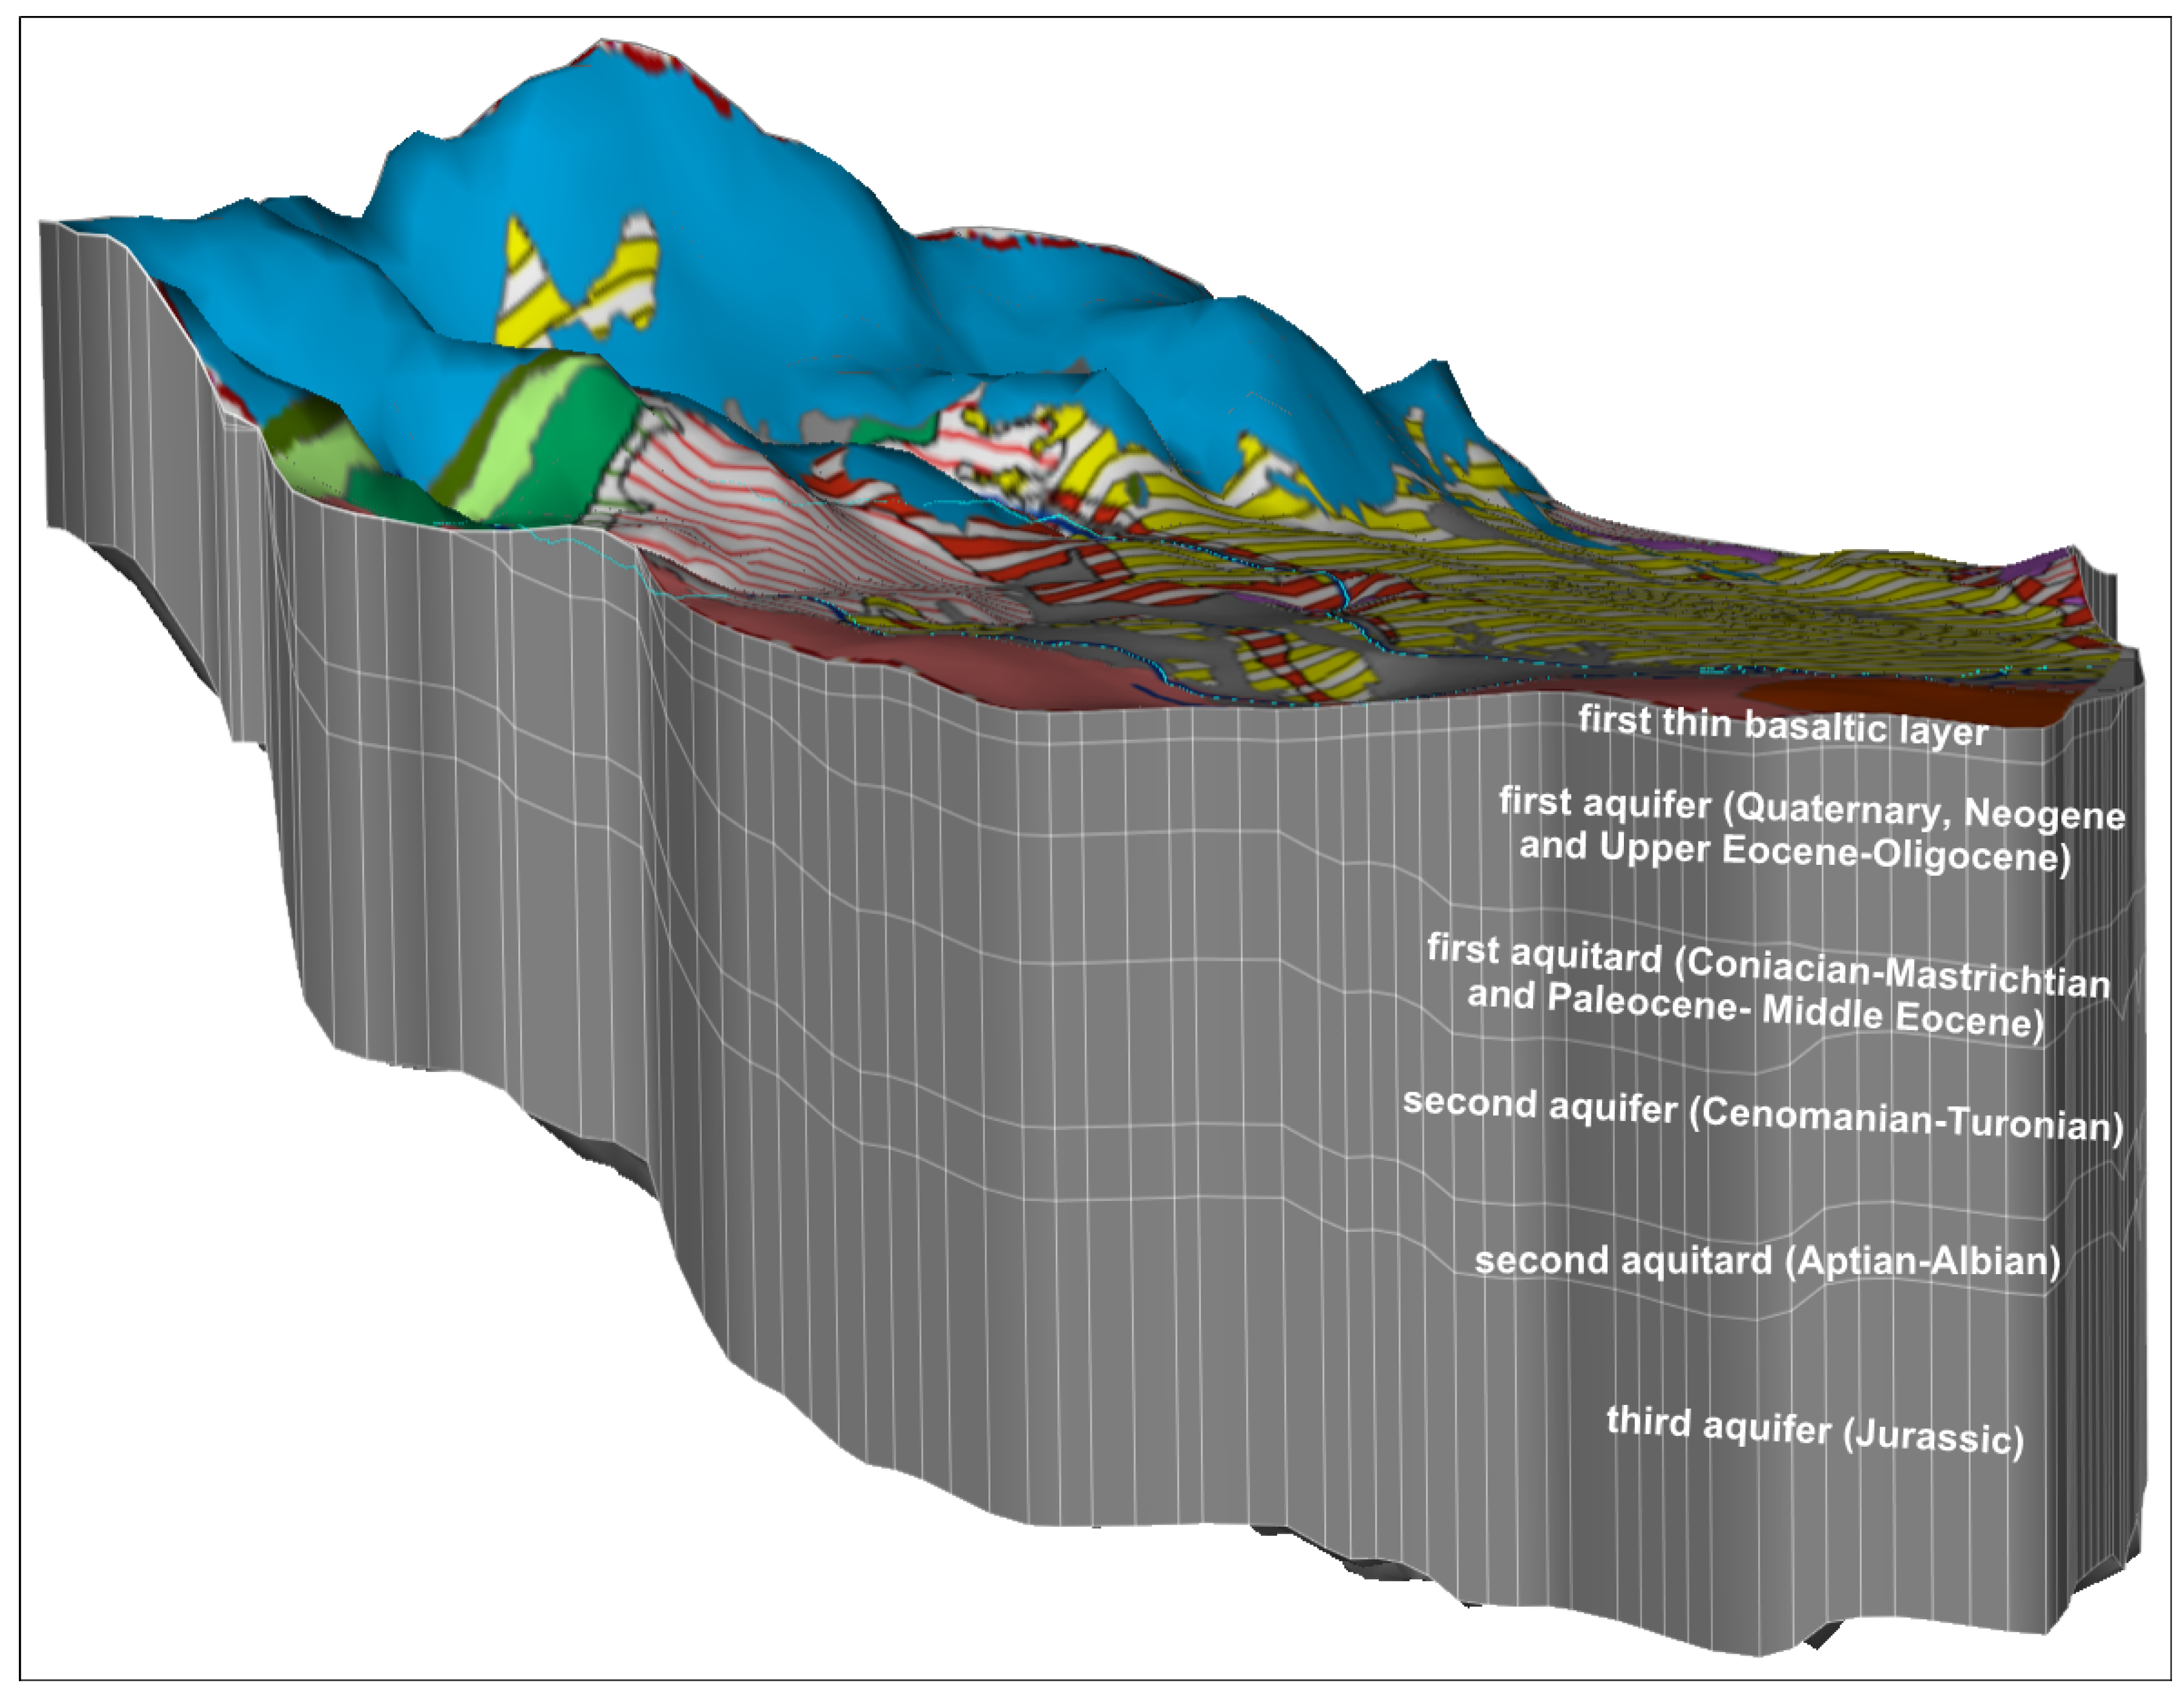
The model contains three aquifers and two aquitards in addition to the Quaternary basaltic layer which occupies the southeastern part of the study area and is considered to be a relatively thin aquitard (
Figure 3). The first aquifer extends in the central, eastern and south-eastern parts of the model domain within an area of about 380 km
2. The thickness of this rock complex varies between 65 and 630 m and reaches its greatest thickness in the east direction. Its top boundary is based on a digital elevation model of the ground surface, excluding the basaltic layer. The second aquifer (Cenomanian-Turonian) extends over an area of about 440 km
2, while the third aquifer (Jurassic) extends over the whole model area. The first and second aquitards occupied an area of about 420 and 450 km
2, respectively. The reason behind the different areas of the model layers is that these layers do not extend to the western site where the Jurassic layer is exposed.
Figure 3.
A three-dimensional (3D) representation of the six layers and seven slices constitute the model domain.
Figure 3.
A three-dimensional (3D) representation of the six layers and seven slices constitute the model domain.
By using FEFLOW version 6 packages [
25], the framework of super elements was defined and then the two-dimensional (2D) horizontal mesh of finite-element was generated using the automatic triangle option (
Figure 4). After this, the three-dimensional (3D) slices elevations, layer properties and boundary conditions were defined. The advanced subsurface flow system was investigated under the steady-state condition. The 3D model grid consists of six layers, which correspond to the aforementioned hydrogeological units, and seven slices (
Figure 3). There is a total of 48,702 two-dimensional triangular prismatic mesh elements, with 29,162 nodes which have been generated based on all the basic geometrical information. The finite element method characterized by its flexibility in generating the mesh and its capacity to simulate complex geometric forms and to refine the nodal grid around points and/or single lines. The finite element grid was generated automatically with reasonable refinement around the points in both the plain and the Arneh valley region which demonstrate the abstraction wells placed in the grid as fixed nodes at their exact positions. The spatial data were prepared by using ArcGIS 10, which can be completely interfaced with FEFLOW.
Figure 4.
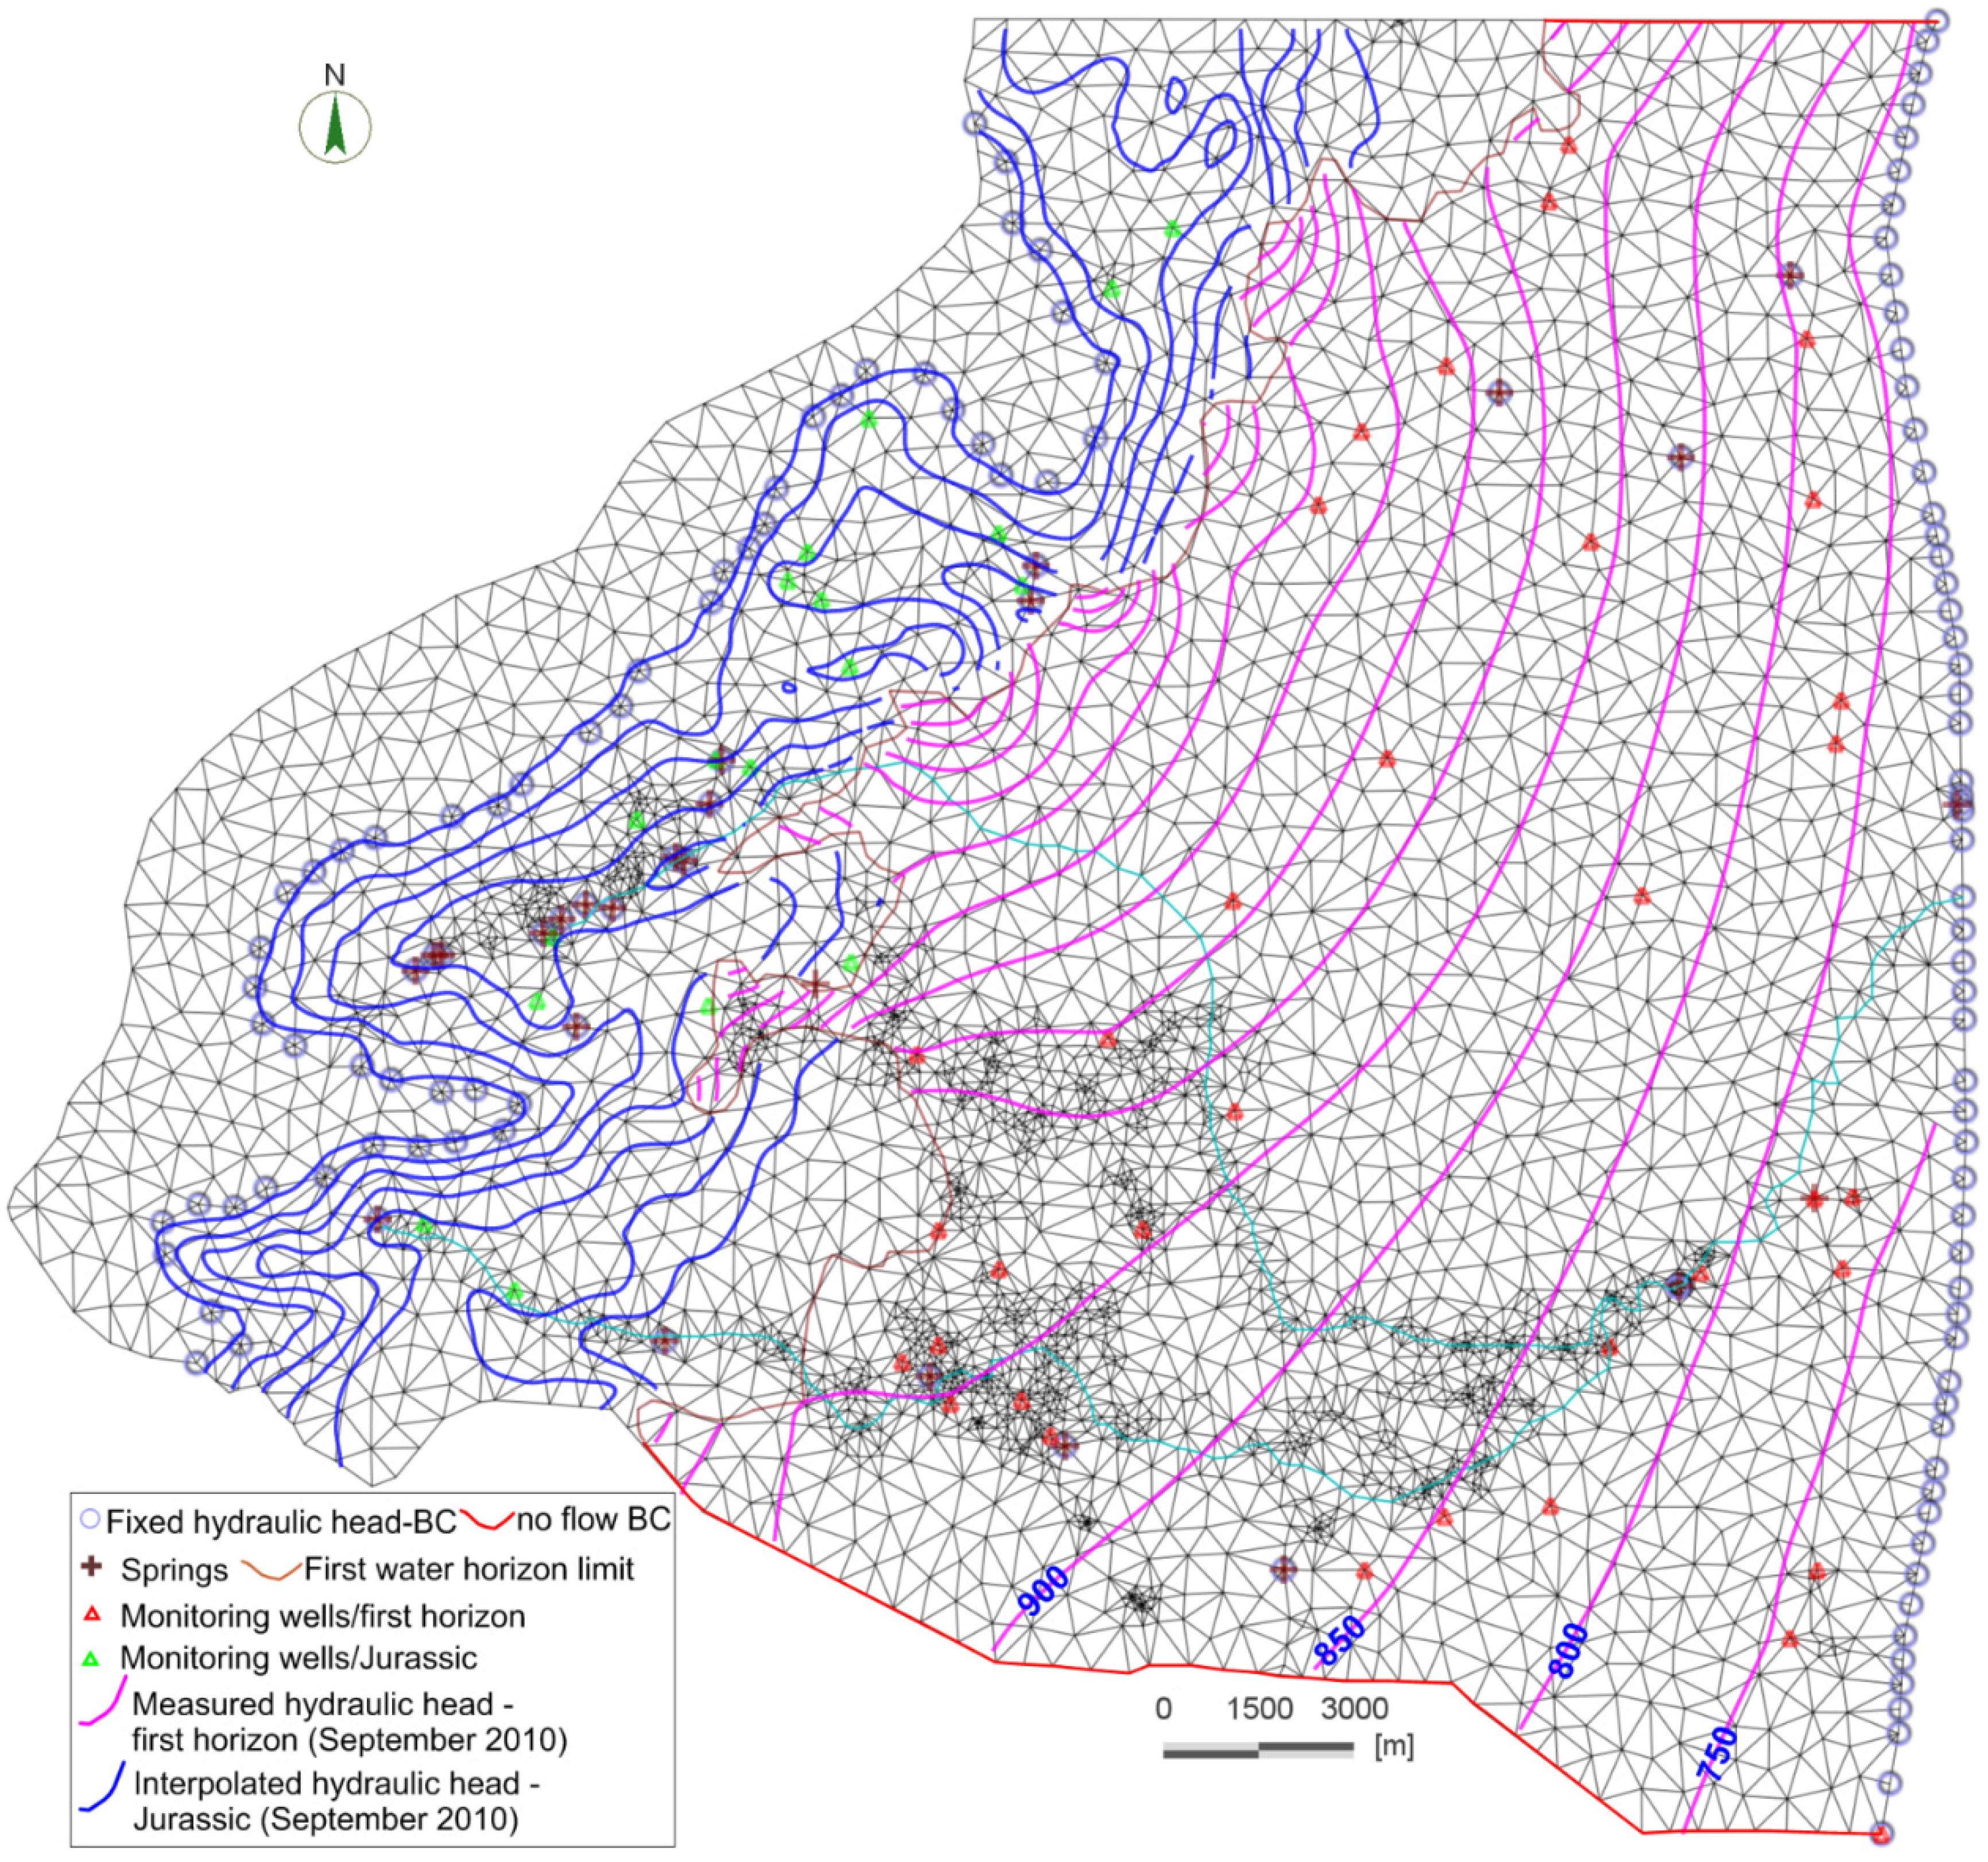
A two-dimensional (2D) FEFLOW representation of the groundwater model mesh and the spatial distribution of boundary conditions, springs and observation wells, as well as the equipotential contours of the measured hydraulic head for September 2010.
Figure 4.
A two-dimensional (2D) FEFLOW representation of the groundwater model mesh and the spatial distribution of boundary conditions, springs and observation wells, as well as the equipotential contours of the measured hydraulic head for September 2010.
5.2. Boundary Conditions
Defining suitable model boundary conditions is an essential step in building numerical groundwater models and is largely responsible for the flow mechanism in the system [
26]. The boundary conditions were determined according to topography and hydro-geological conditions. The hinge axis of Mt. Hermon located at the western and north-western boundaries of the study area forms the western boundary of the model. From the south, the basalt of Quaternary layer forms the southern boundary of the model domain at its limit with the Yarmouk basin (
Figure 1a). This boundary is implemented as a no flow boundary. The north of Qatana village was used as the northern boundary of the model (
Figure 1b). This boundary was also assigned as a no flow boundary since the equipotential contours intersect with this boundary almost in perpendicular form.
According to the geological and hydrogeological features as well as spring discharges and groundwater level fluctuations in the upper aquifer horizon and Jurassic aquifer, we could distinguish between different hydraulic behaviors that characterize each of these aquifers. We assumed that there was a direct hydraulic connection between these two aquifers where the Neogene conglomerates come into direct contact with Jurassic limestone. This contact occurs in the model domain at the interface between these two aquifers.
The non-saturated zone in the exposed part of the Jurassic aquifer was determined based on available groundwater depths in the boreholes and the altitude of springs located in this part. By using topography and the thickness of this zone, we could interpolate the groundwater equipotential contours in this part. The highest value of these contours (1600 m a.s.l) was used as constant hydraulic head (BCs) in the Jurassic aquifer (
Figure 4). The intersection points of these contour lines with the western limit of the upper aquifer, together with the water level measured in the boreholes located in this aquifer during the same period (September 2010), were used to construct the equipotential contour lines for this aquifer. The contour lines were created by using the ordinary kriging algorithm method [
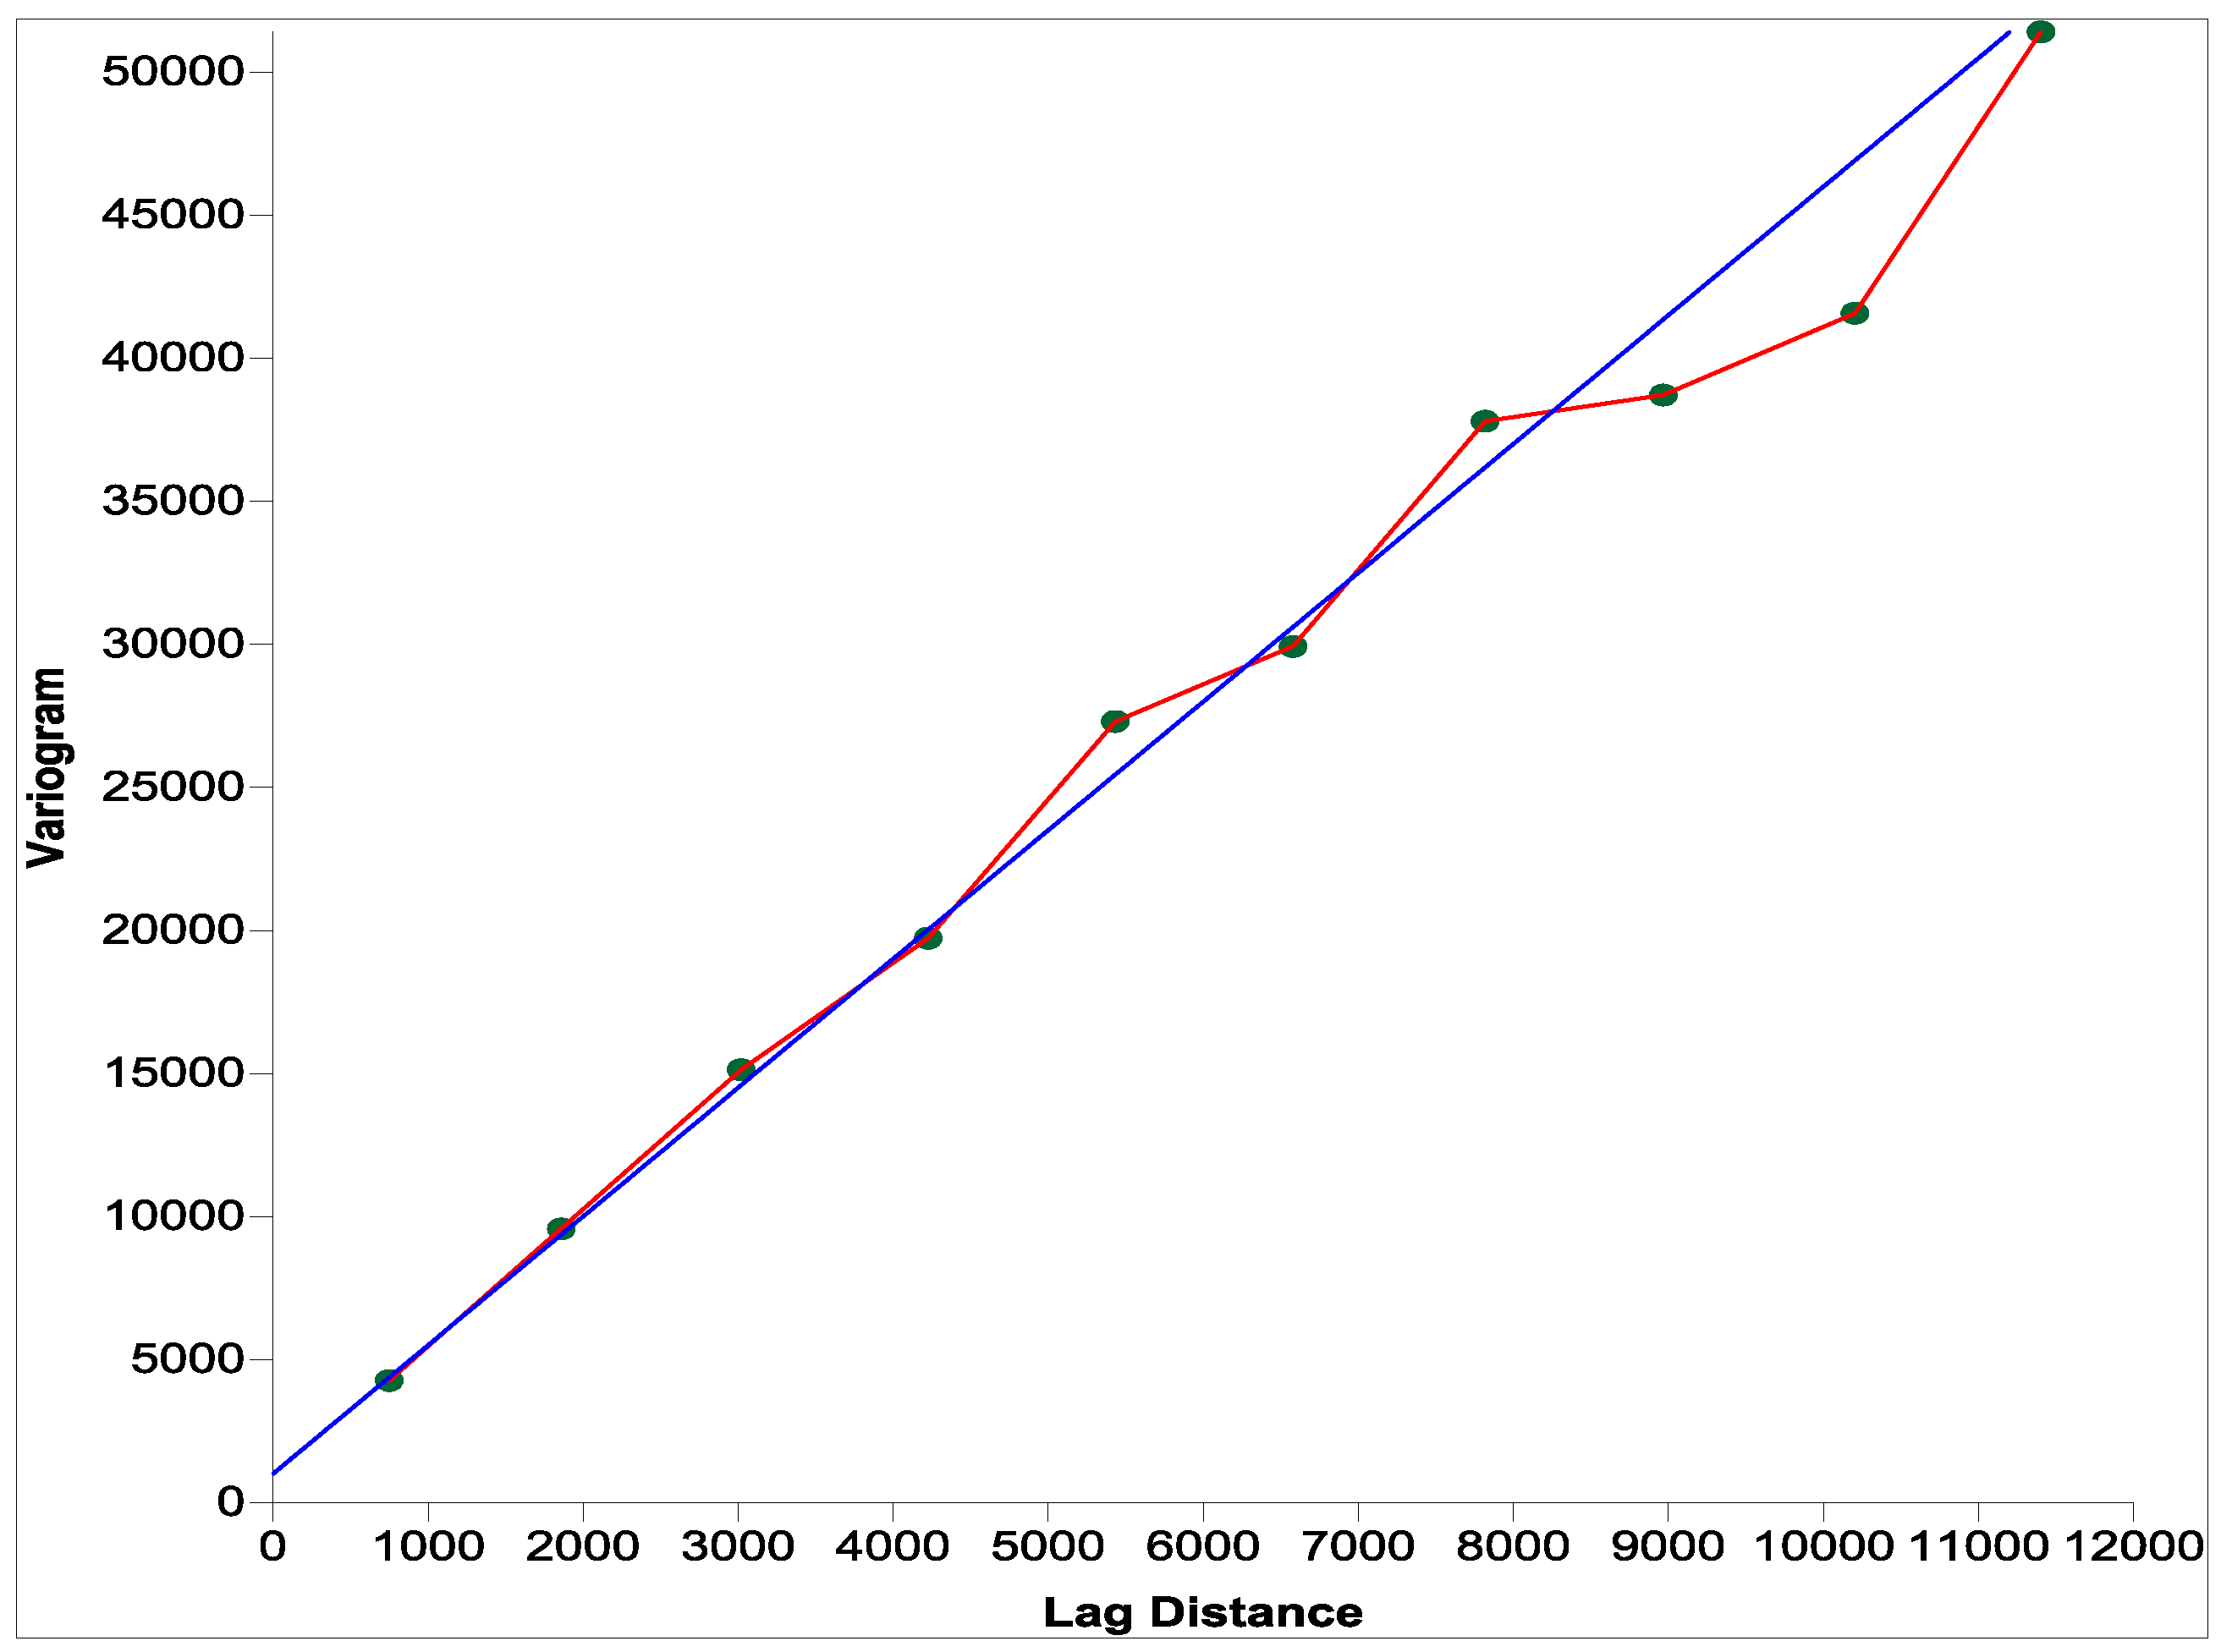
27]. The geostatistic analysis of measured groundwater levels resulted in a linear variogram model (
Figure 5), which was used to perform the kriging interpolation. The resulting contour lines, as well as the simulated one in the exposed part of Jurassic (
Figure 4), were used as reference maps for the steady-state model simulation. The groundwater level interval was taken as 50 m for the upper aquifer horizon and 100 m for the exposed part of Jurassic aquifer. The hydraulic head varies between 700 and 775 m.a.s.l in the outermost nodes on the eastern model boundary and the discrete altitudes of permanent spring discharges were simulated as a constant head (BCs) (
Figure 4).
Figure 5.
A linear variogram model showing best fit for the measured data.
Figure 5.
A linear variogram model showing best fit for the measured data.
In order to simulate the lateral flow of groundwater amount from the Jurassic aquifer into the upper aquifer, the Neumann type flux was implemented.
Under natural conditions, we did not observe a significant relationship between Sebarani tributary and groundwater in the plain region. The measured discharges of this tributary in the two gauging stations where it enters the plain region and before its junction with Jenani tributary are almost the same. The Genani tributary flows in the concrete canal which prevents the interaction between surface water and groundwater. Therefore, both tributaries were excluded from the simulation process. The evapotranspiration was also omitted because the water level is situated in general at a depth of more than 5 m, where evaporation and transpiration cannot occur.
5.4. Recharge
Groundwater recharge rates vary with climate conditions. The other important factors controlling recharge are surface geology, surface topography, soil type, vegetation, and land use. The recharge amount includes the major input from precipitation and minor input from irrigation return flow. A high amount of groundwater recharge occurs by direct vertical percolation of rainfall and snowmelt through the unsaturated zone of the outcropping part of Jurassic formations. The Neogene/Quaternary aquifer receives a lower recharge portion from rainfall but an important recharge from lateral groundwater inflow from adjacent cavernous limestone in the western side and an additional recharge from irrigation return flow. The groundwater may potentially leak upward from deeper aquifers into this aquifer and form another recharge component which is difficult to quantify.
The amount of recharge into the groundwater during the hydrological year 2009–2010 was calculated by using the isohytal method to be 173 Mm
3·y
−1 upon the model area based on available meteorological data in six stations located in the study area (
Figure 1b). The total amount of precipitation, which recharged the upper aquifer horizon, was calculated to be 48 Mm
3·y
−1. The recharge input was entered into the model as a specified flow through the top surface of the first layer. Indirect recharge from conveyance losses of irrigation canals and domestic water, exceeding irrigation water (return flow) and wastewater discharge, were estimated to be 11.8 Mm
3·y
−1. This estimation was based on certain percentages of water that evaporate or return to the water system according to [
29] (
Table 1). The simulation was carried out by assuming a constant daily recharge through all three different regions of the model area (mountain, intermediate and central agricultural regions).
5.5. Net Pumping
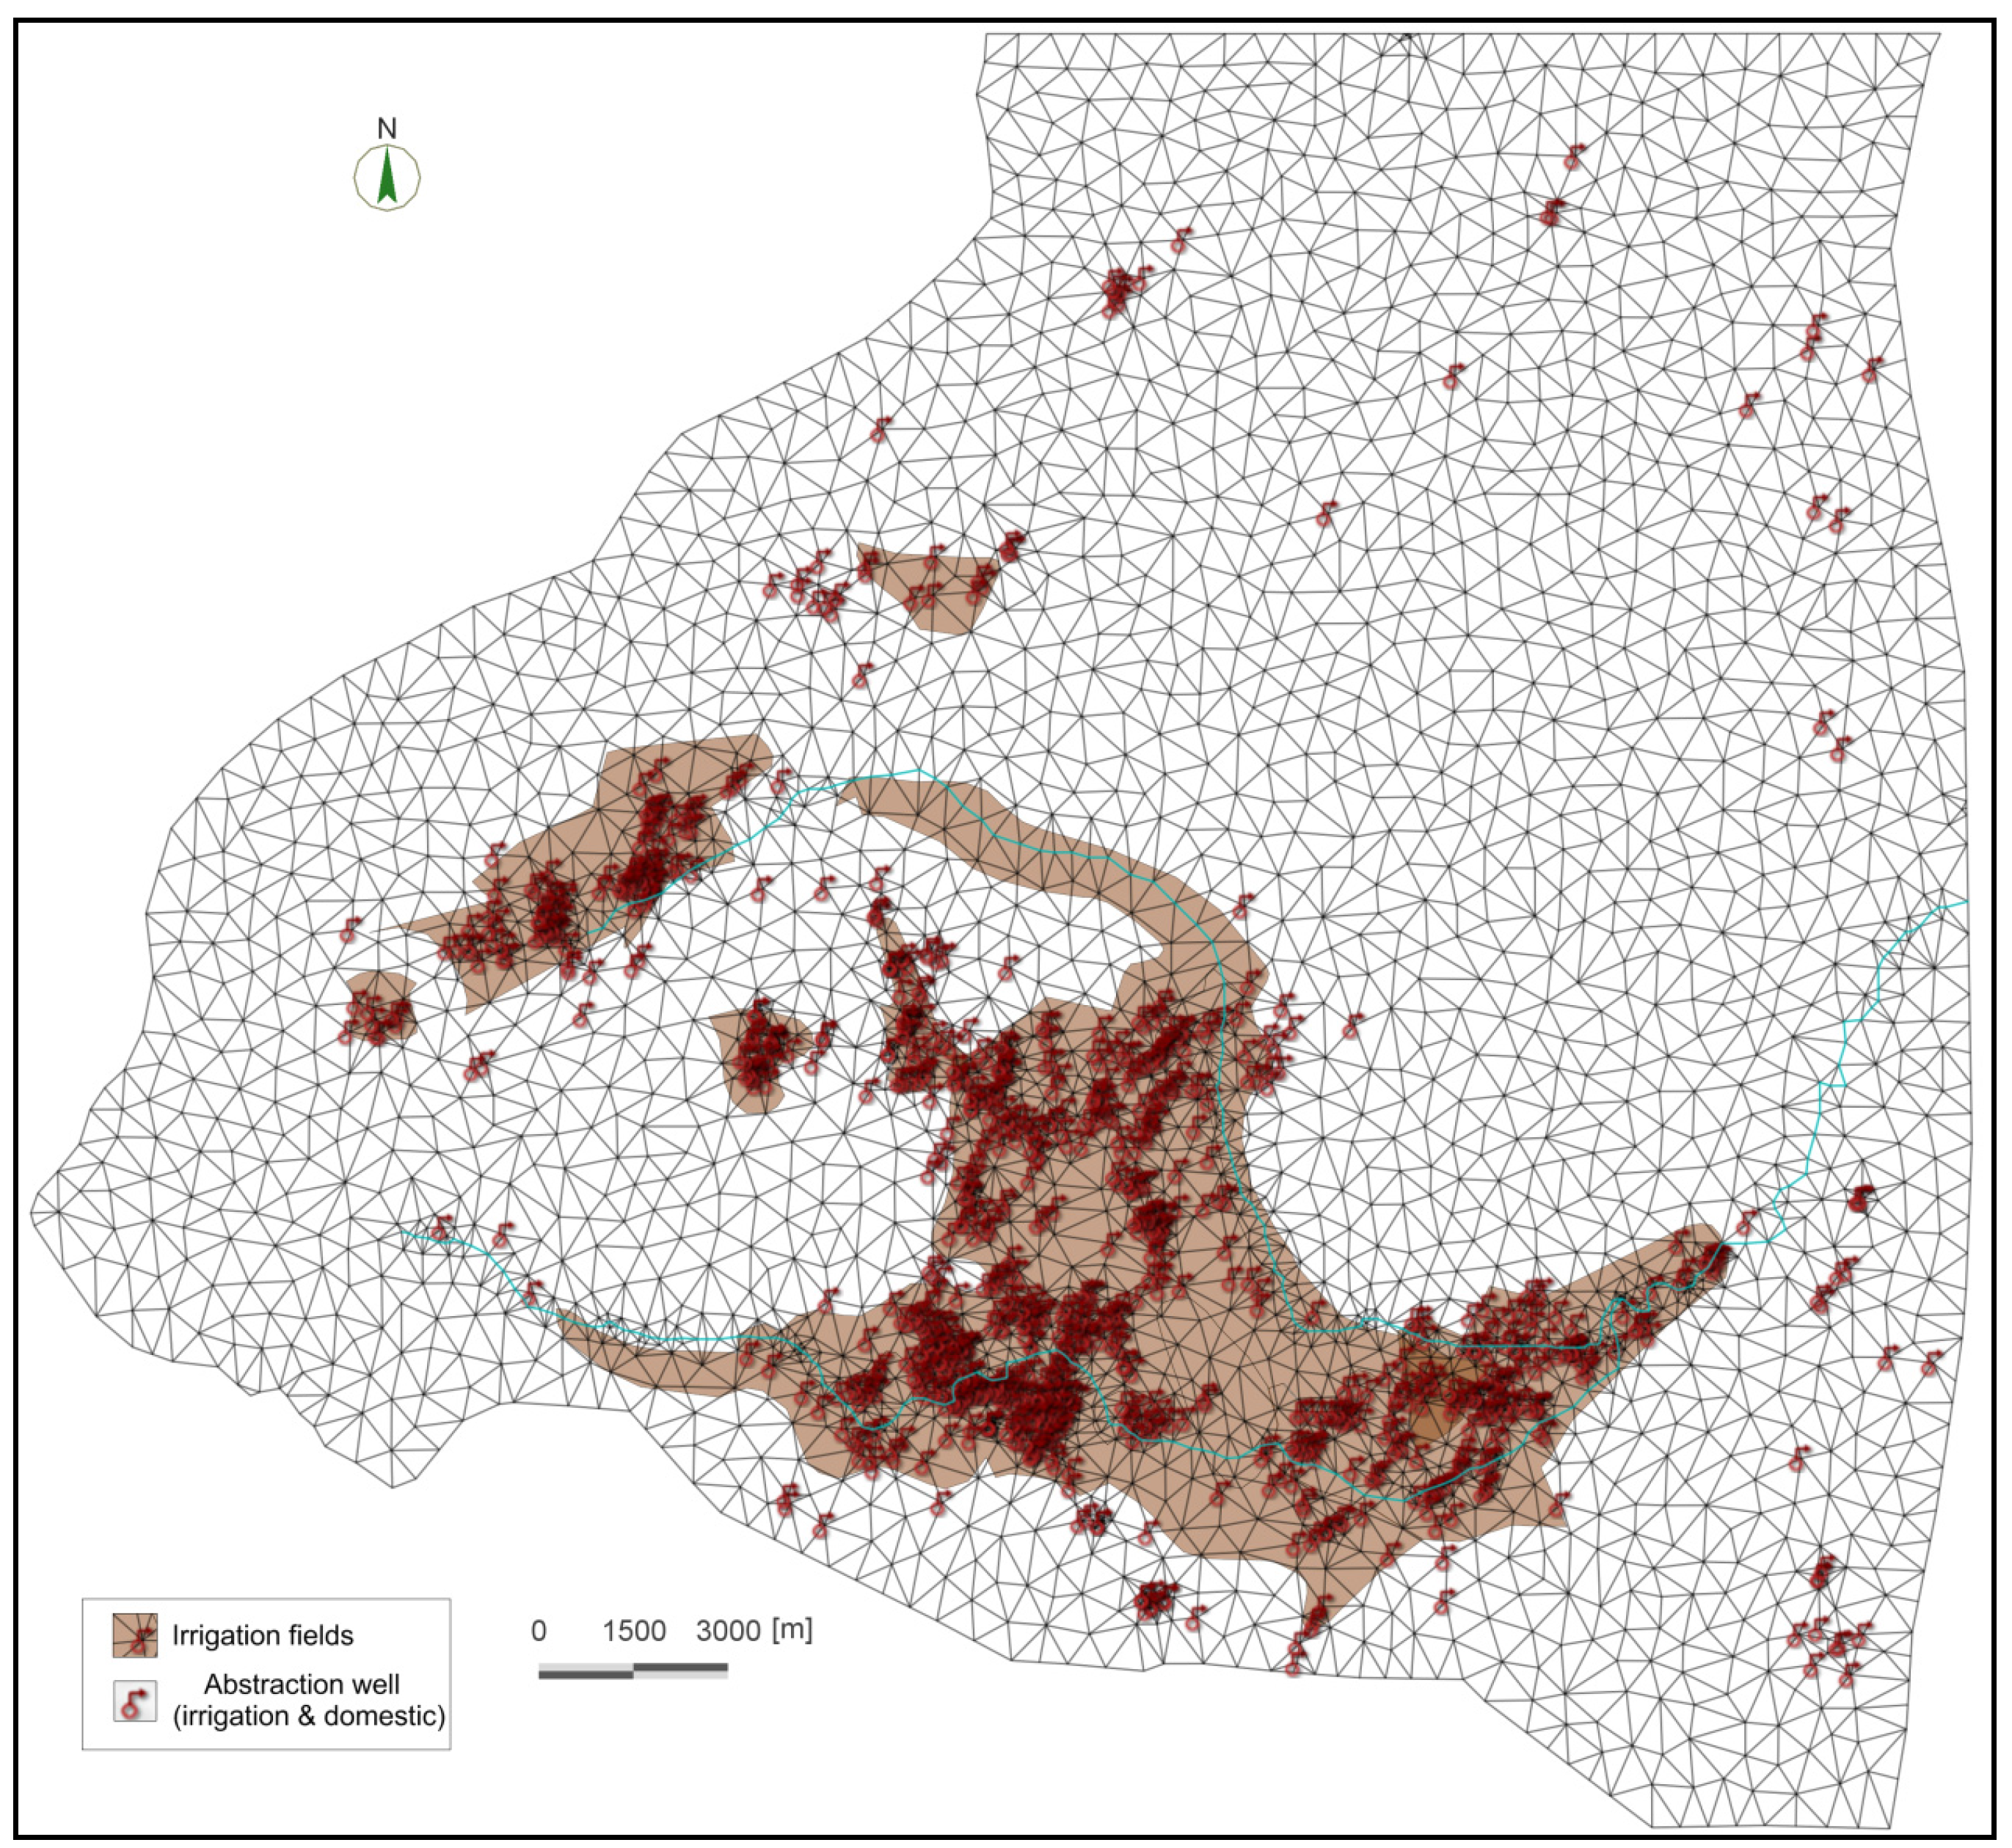
There are a total of 830 wells used for agricultural purposes, most of them located in the plain region. The 101 wells used for domestic purposes are well distributed in the whole model area (
Figure 6). The annual amount of groundwater abstraction from the upper aquifer horizon was 7 and 8 Mm
3·y
−1 for agricultural and domestic purposes, respectively. About 85% of the groundwater abstraction wells are screened over the upper aquifer horizon, while 2% and 13% penetrate the Cretaceous and Jurassic aquifer, respectively. For modeling purposes, the annual pumped volume for each well was converted to m
3·d
−1 and applied as a steady amount throughout the year.
Table 1.
Possible amounts of water entering and leaving a groundwater system of the upper aquifer horizon, used to calculate the groundwater budget in this horizon during the hydrological year 2009–2010.
Table 1.
Possible amounts of water entering and leaving a groundwater system of the upper aquifer horizon, used to calculate the groundwater budget in this horizon during the hydrological year 2009–2010.
| Recharge Components |
| Indirect recharge (conveyance losses of domestic and irrigation water, wastewater discharge and irrigation return flow) | Direct recharge from meteoric infiltration | Lateral inflow from Jurassic aquifer- corresponds to FEFLOW simulation | Upward leakage from deeper aquifers corresponds to FEFLOW simulation |
| (Mm3·y−1) | (Mm3·y−1) | (Mm3·y−1) | (Mm3·y−1) |
| 11.8 | 48 | 52 | 31 |
| Discharge Components |
| Lateral outflow from southern boundary to Yarmouk Basin corresponds to FEFLOW simulation | Spring discharges | Lateral outflow from eastern boundary- corresponds to FEFLOW simulation | Abstraction water for agricultural and domestic use |
| (Mm3·y−1) | (Mm3·y−1) | (Mm3·y−1) | (Mm3·y−1) |
| 3.9 | 37.5 | 81.8 | 15 |
Figure 6.
Location sites of irrigation field and spatial distribution of abstraction wells.
Figure 6.
Location sites of irrigation field and spatial distribution of abstraction wells.
The Awaj River is also used for irrigation in the summer period. The amount of surface water used for irrigation is about 35 Mm
3·y
−1 during the hydrological year 2009–2010. The total area irrigated by both groundwater and surface water is about 75 km
2 of which about 21 km
2 is irrigated by groundwater. The calculated amount of pumped groundwater is less than the amount of water needed for the irrigation if we take into account the amount of 5000 m
3·h
−1·y
−1 reported by the Ministry of Irrigation (MOI) in Syria [
28]. The total discharge of springs located in the upper aquifer was calculated to be 37.5 m
3·y
−1 for the hydrological year 2009–2010.
6. Results and Discussion
6.1. Steady-State Calibration
Model calibration was performed by trial and error by changing the hydraulic conductivity of the model layers until a reasonable agreement between the simulated and measured groundwater levels was achieved. The calibrated hydraulic conductivity for the upper aquifer horizon varied within a reasonable range based on values between 0.3 and 13 m·d−1 reported in the literature. For the other aquifers and aquitards, these values were assigned uniformly because there was insufficient data on their spatial distribution across these layers. The uniform hydraulic conductivities for the Cretaceous and Jurassic aquifers were defined as 25 and 18 m·d−1 respectively, while these values were taken as 0.08 and 0.15 m·d−1 for the first and second aquitards, respectively.
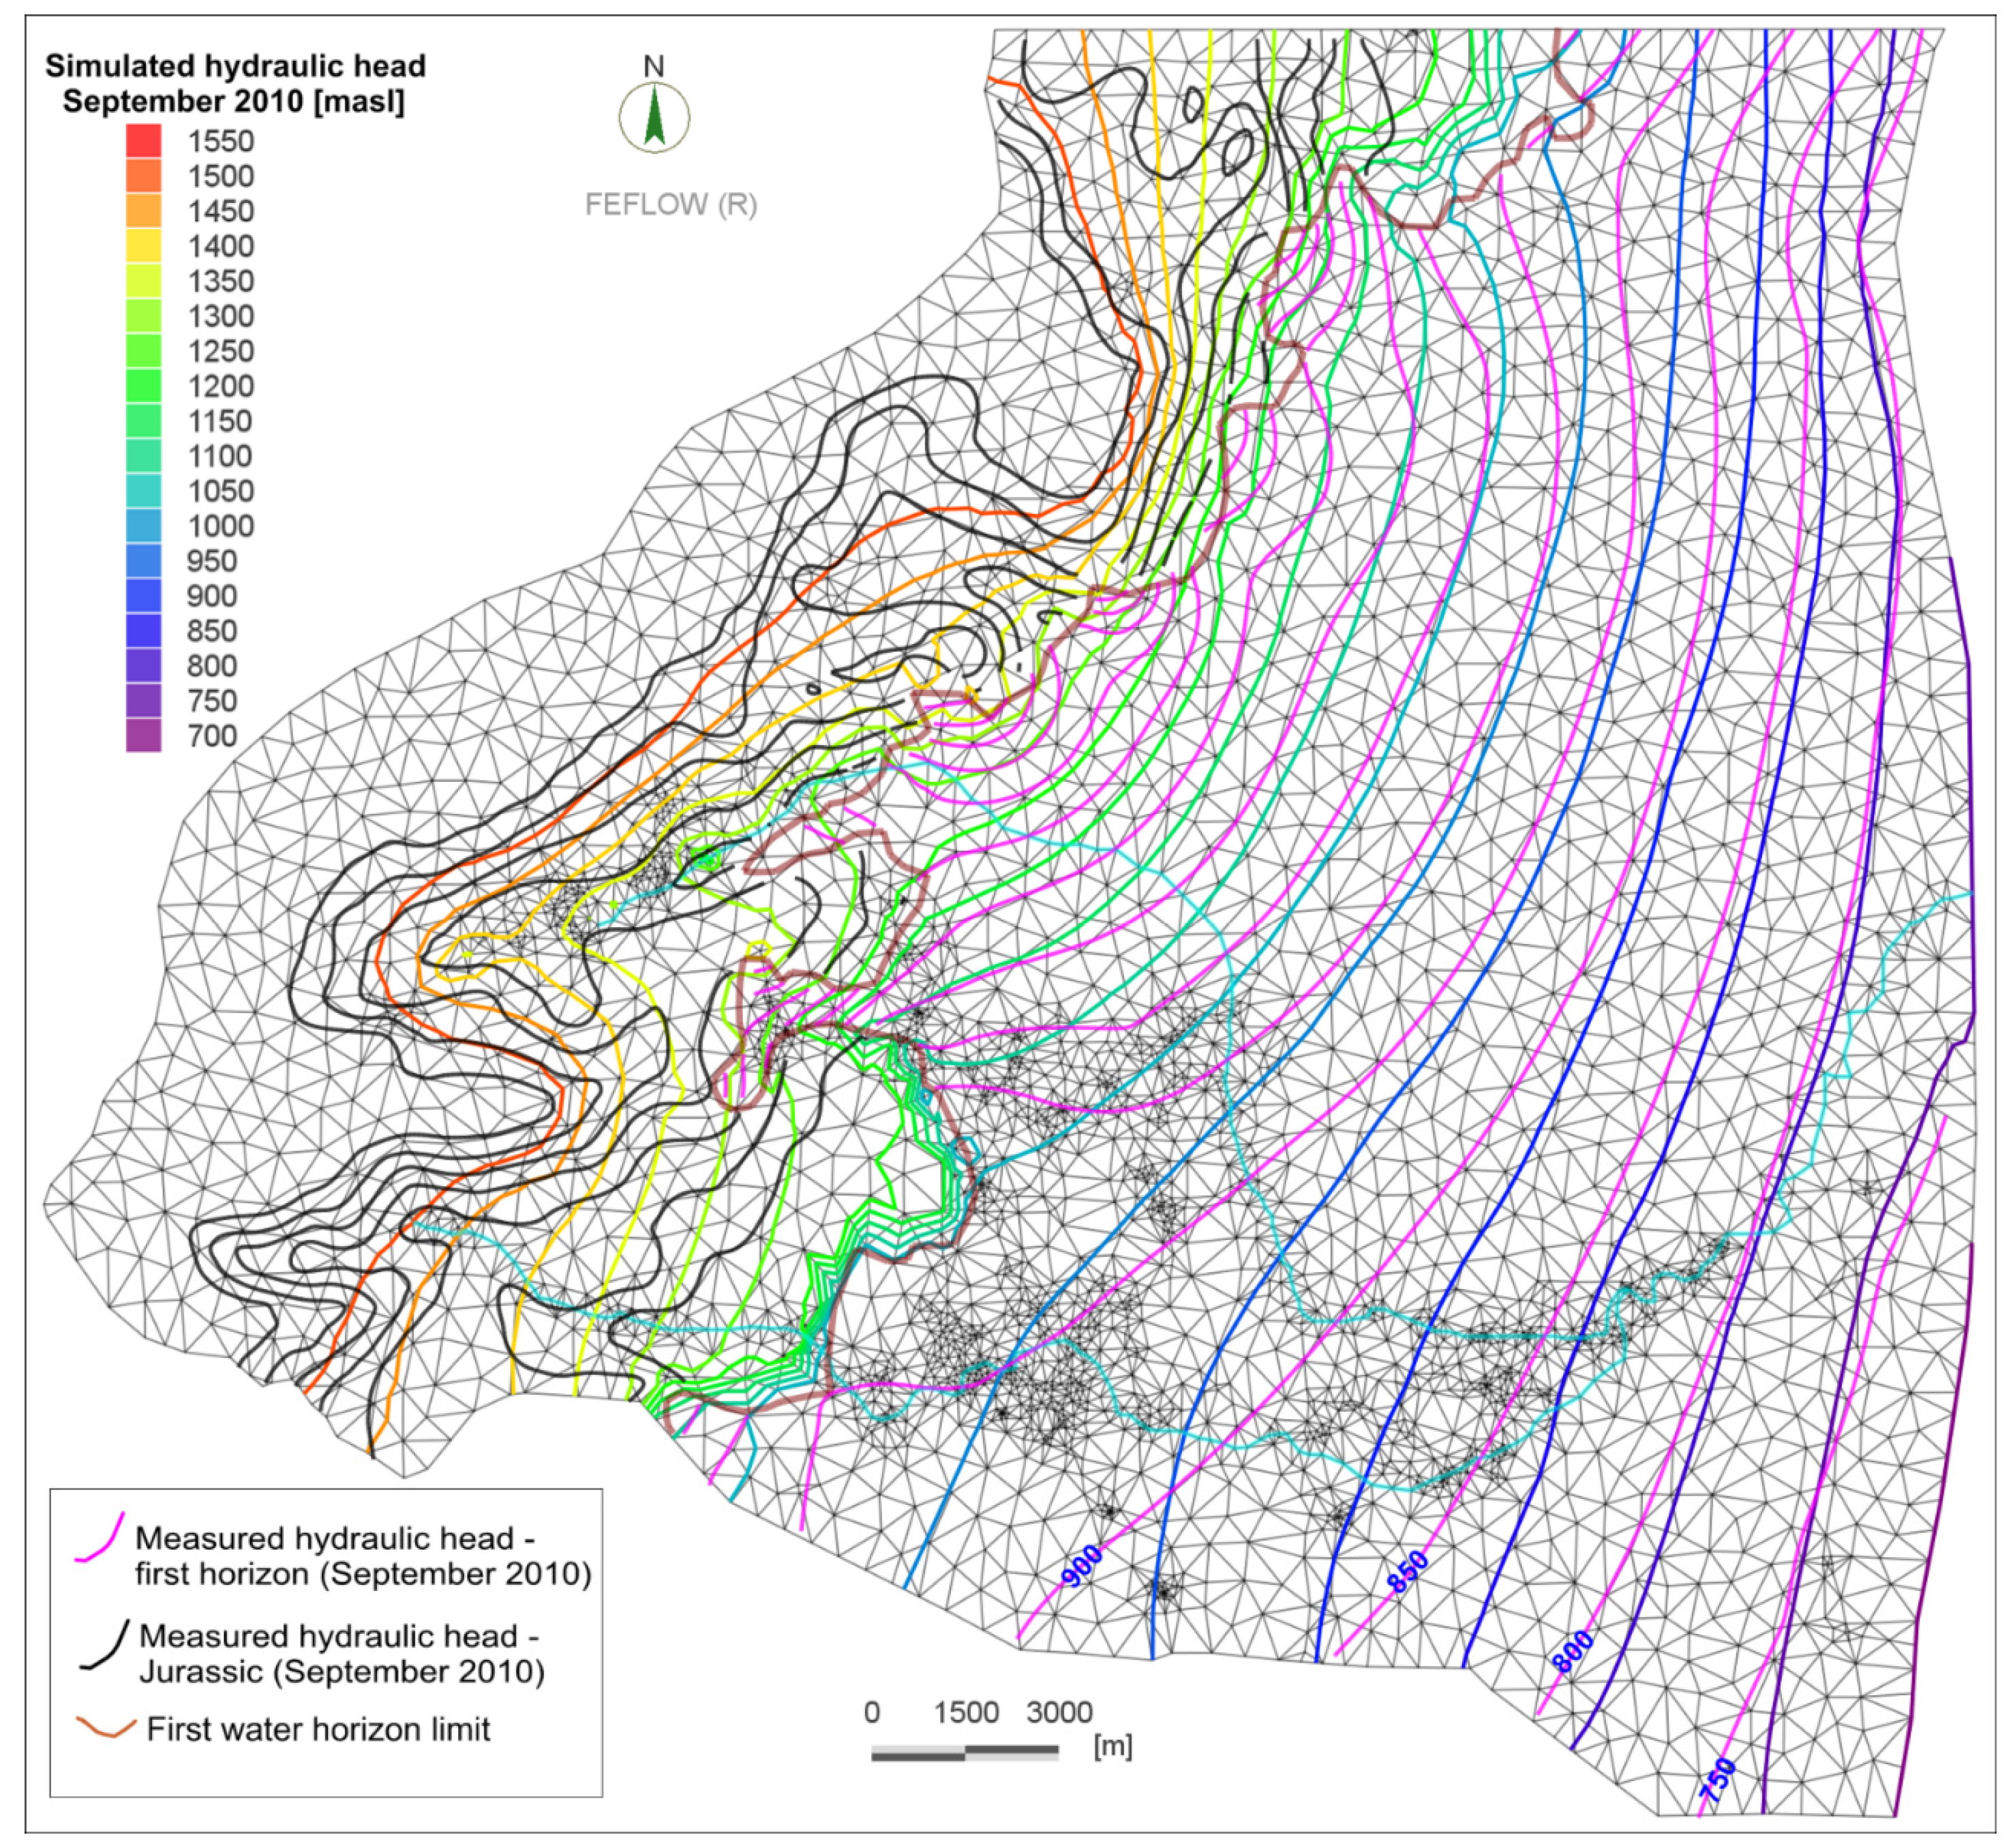
The measured and simulated groundwater level contours (
Figure 7) indicate fairly good agreement in the upper aquifer horizon. In the southern boundaries, where the basaltic layer and the zone which hosts numerous irrigation wells, less agreement was achieved. Furthermore, and due to the definition of no flow boundaries in the north and south part of the model domain, the contours in the model must be perpendicular to these boundaries, while the measured contours are not. This changes the performance of the model near these boundaries. When the upper aquifer horizon comes in contact with the first aquitard, this retards the groundwater flow, and thus the contour lines’ behavior changes and they become denser at this interface. This phenomenon can be observed in two places, in the south-west and north of the study area where this aquitard is located and exposed to the surface.
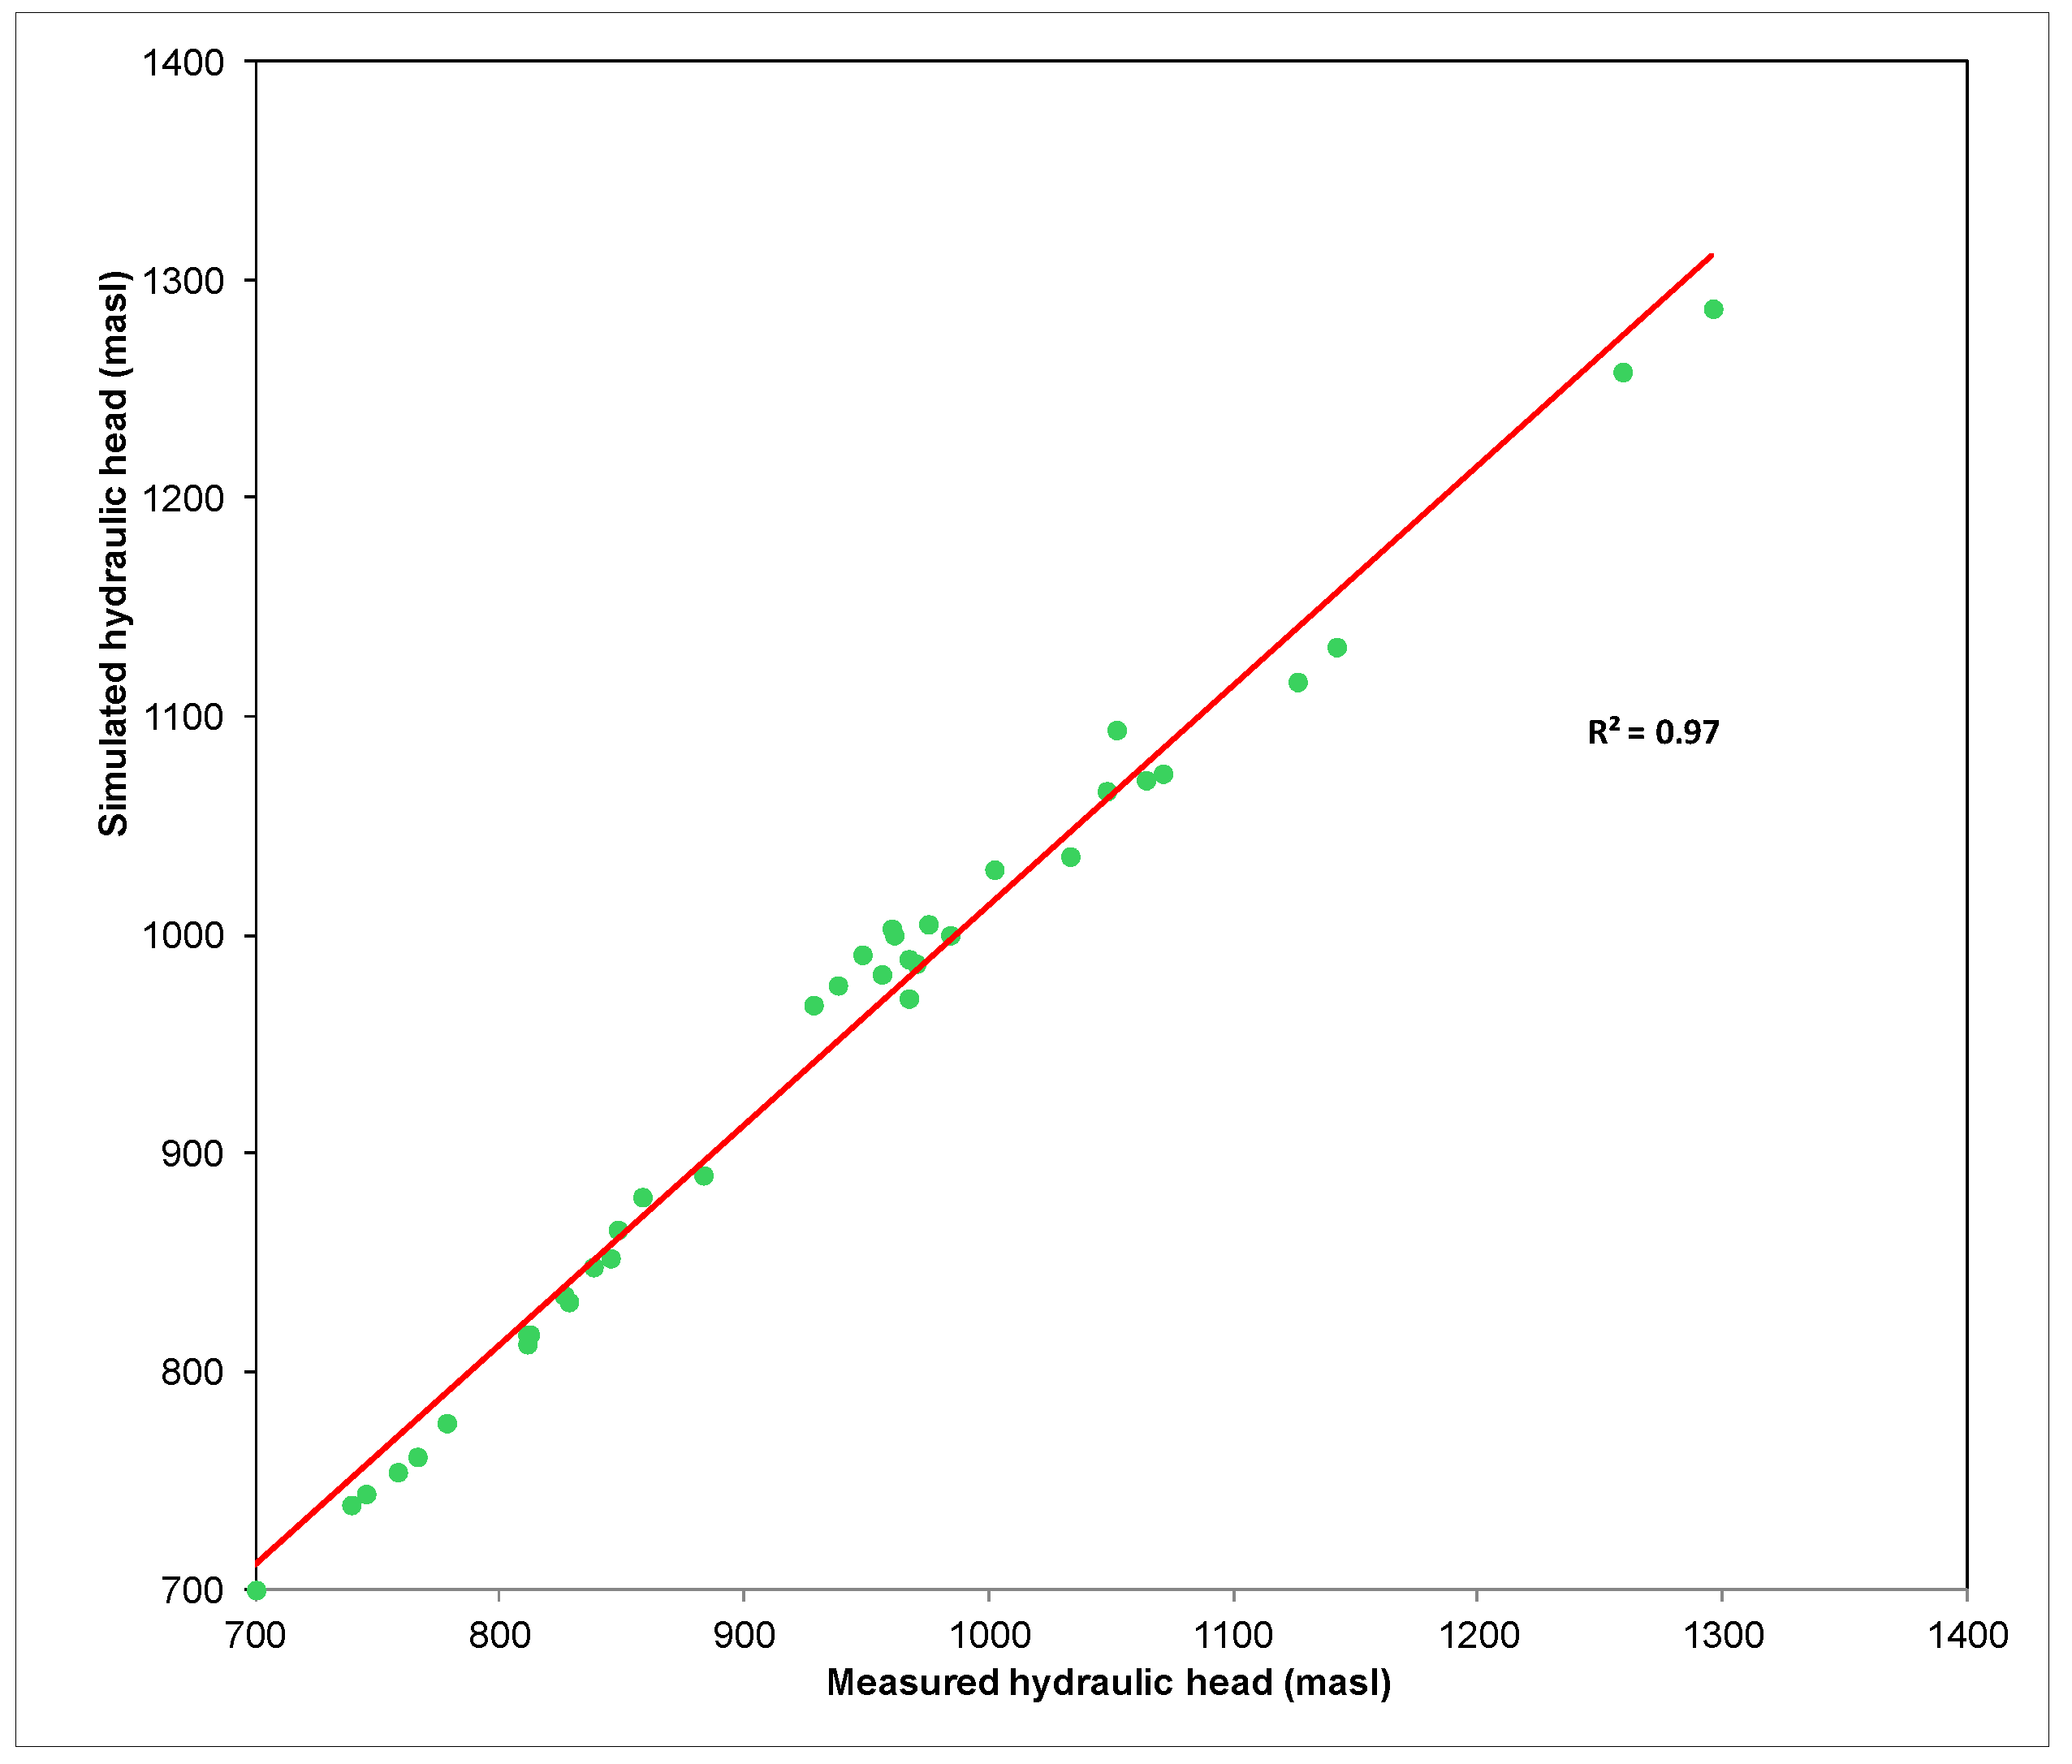
The scatter plot and regression analysis of computed and measured hydraulic heads in the wells located in the upper aquifer horizon are shown in
Figure 8. The result indicates that the agreement between simulated and measured hydraulic heads was reasonably good for the measured points.
The sensitivity of the model to input parameters was tested by changing the parameters of interest over the range of values in order to determine the most sensitive parameters responsible for the aquifer behavior. During calibration, it was found that the parameter having the greatest effect on the simulated result was the spatial distribution of the hydraulic conductivity and, to a lesser extent, the recharge amount.
The flow regime in the upper aquifer horizon shows that the flow direction is towards the east with a higher hydraulic gradient in the western part and moderate hydraulic gradient in the plain region. The map also shows that a part of the major valleys’ groundwater tends to flow towards the southeast direction. This flow can be considered as part of lateral flow where the conduits of Jurassic aquifer are laced through the porous medium of Neogene aquifer. Calibration of the groundwater flow in the other aquifers was not possible due to the lack of groundwater level measurement in these aquifers.
Figure 7.
The comparison between the measured and the simulated initial hydraulic head in the upper aquifer horizon and Jurassic aquifer, September 2010.
Figure 7.
The comparison between the measured and the simulated initial hydraulic head in the upper aquifer horizon and Jurassic aquifer, September 2010.
Figure 8.
Scatter plot of measured and simulated initial hydraulic heads for September 2010.
Figure 8.
Scatter plot of measured and simulated initial hydraulic heads for September 2010.
The hydraulic connections between the model aquifers depend on the hydraulic gradient differences between them. According to the simulation result, this gradient was high enough to permit hydraulic connections between the deep aquifers and the upper aquifer horizon. The amount of upward movement from the deep aquifers to the upper aquifer was calculated to be 31 Mm3·y−1.
6.2. Preliminary Groundwater Balance for the Upper Aquifer Horizon
The computing of a water budget provides information on whether the aquifer system is being depleted and allows calculation of the amount of water exchanged at the model boundaries. This assists in using the available groundwater resources in a sustainable way. The water budget and flow tools in FEFLOW as well as the FEFLOW classic version can be used to quantify the volume of water across lines (aquifer boundaries), polygons (model layers), and boundary conditions (flow in or out of the model). The steady-state calibration result was used to calculate the preliminary water balance in the upper aquifer horizon. The change in groundwater storage can be estimated based on the quantity of water entering into this aquifer and leaving it during a certain period of time using the following equation:
where d
V/d
t is the change in storage (m
3·y
−1); R is the groundwater recharge by precipitation, lateral inflow, upward leakage and indirect recharge through conveyance loss of irrigation and domestic water, irrigation return flow and wastewater discharge (m
3·y
−1); P is the total groundwater pumping (m
3·y
−1); and
Q represents the discharges of the springs and cross-boundary groundwater outflow from the model area (m
3·y
−1). The groundwater budget was calculated based on available recent data of the hydrological year 2009–2010. The precipitation during this year was close to the long-term average [
28]. The groundwater used for irrigation is independent of rainfall because there is no rainfall during the summer period.
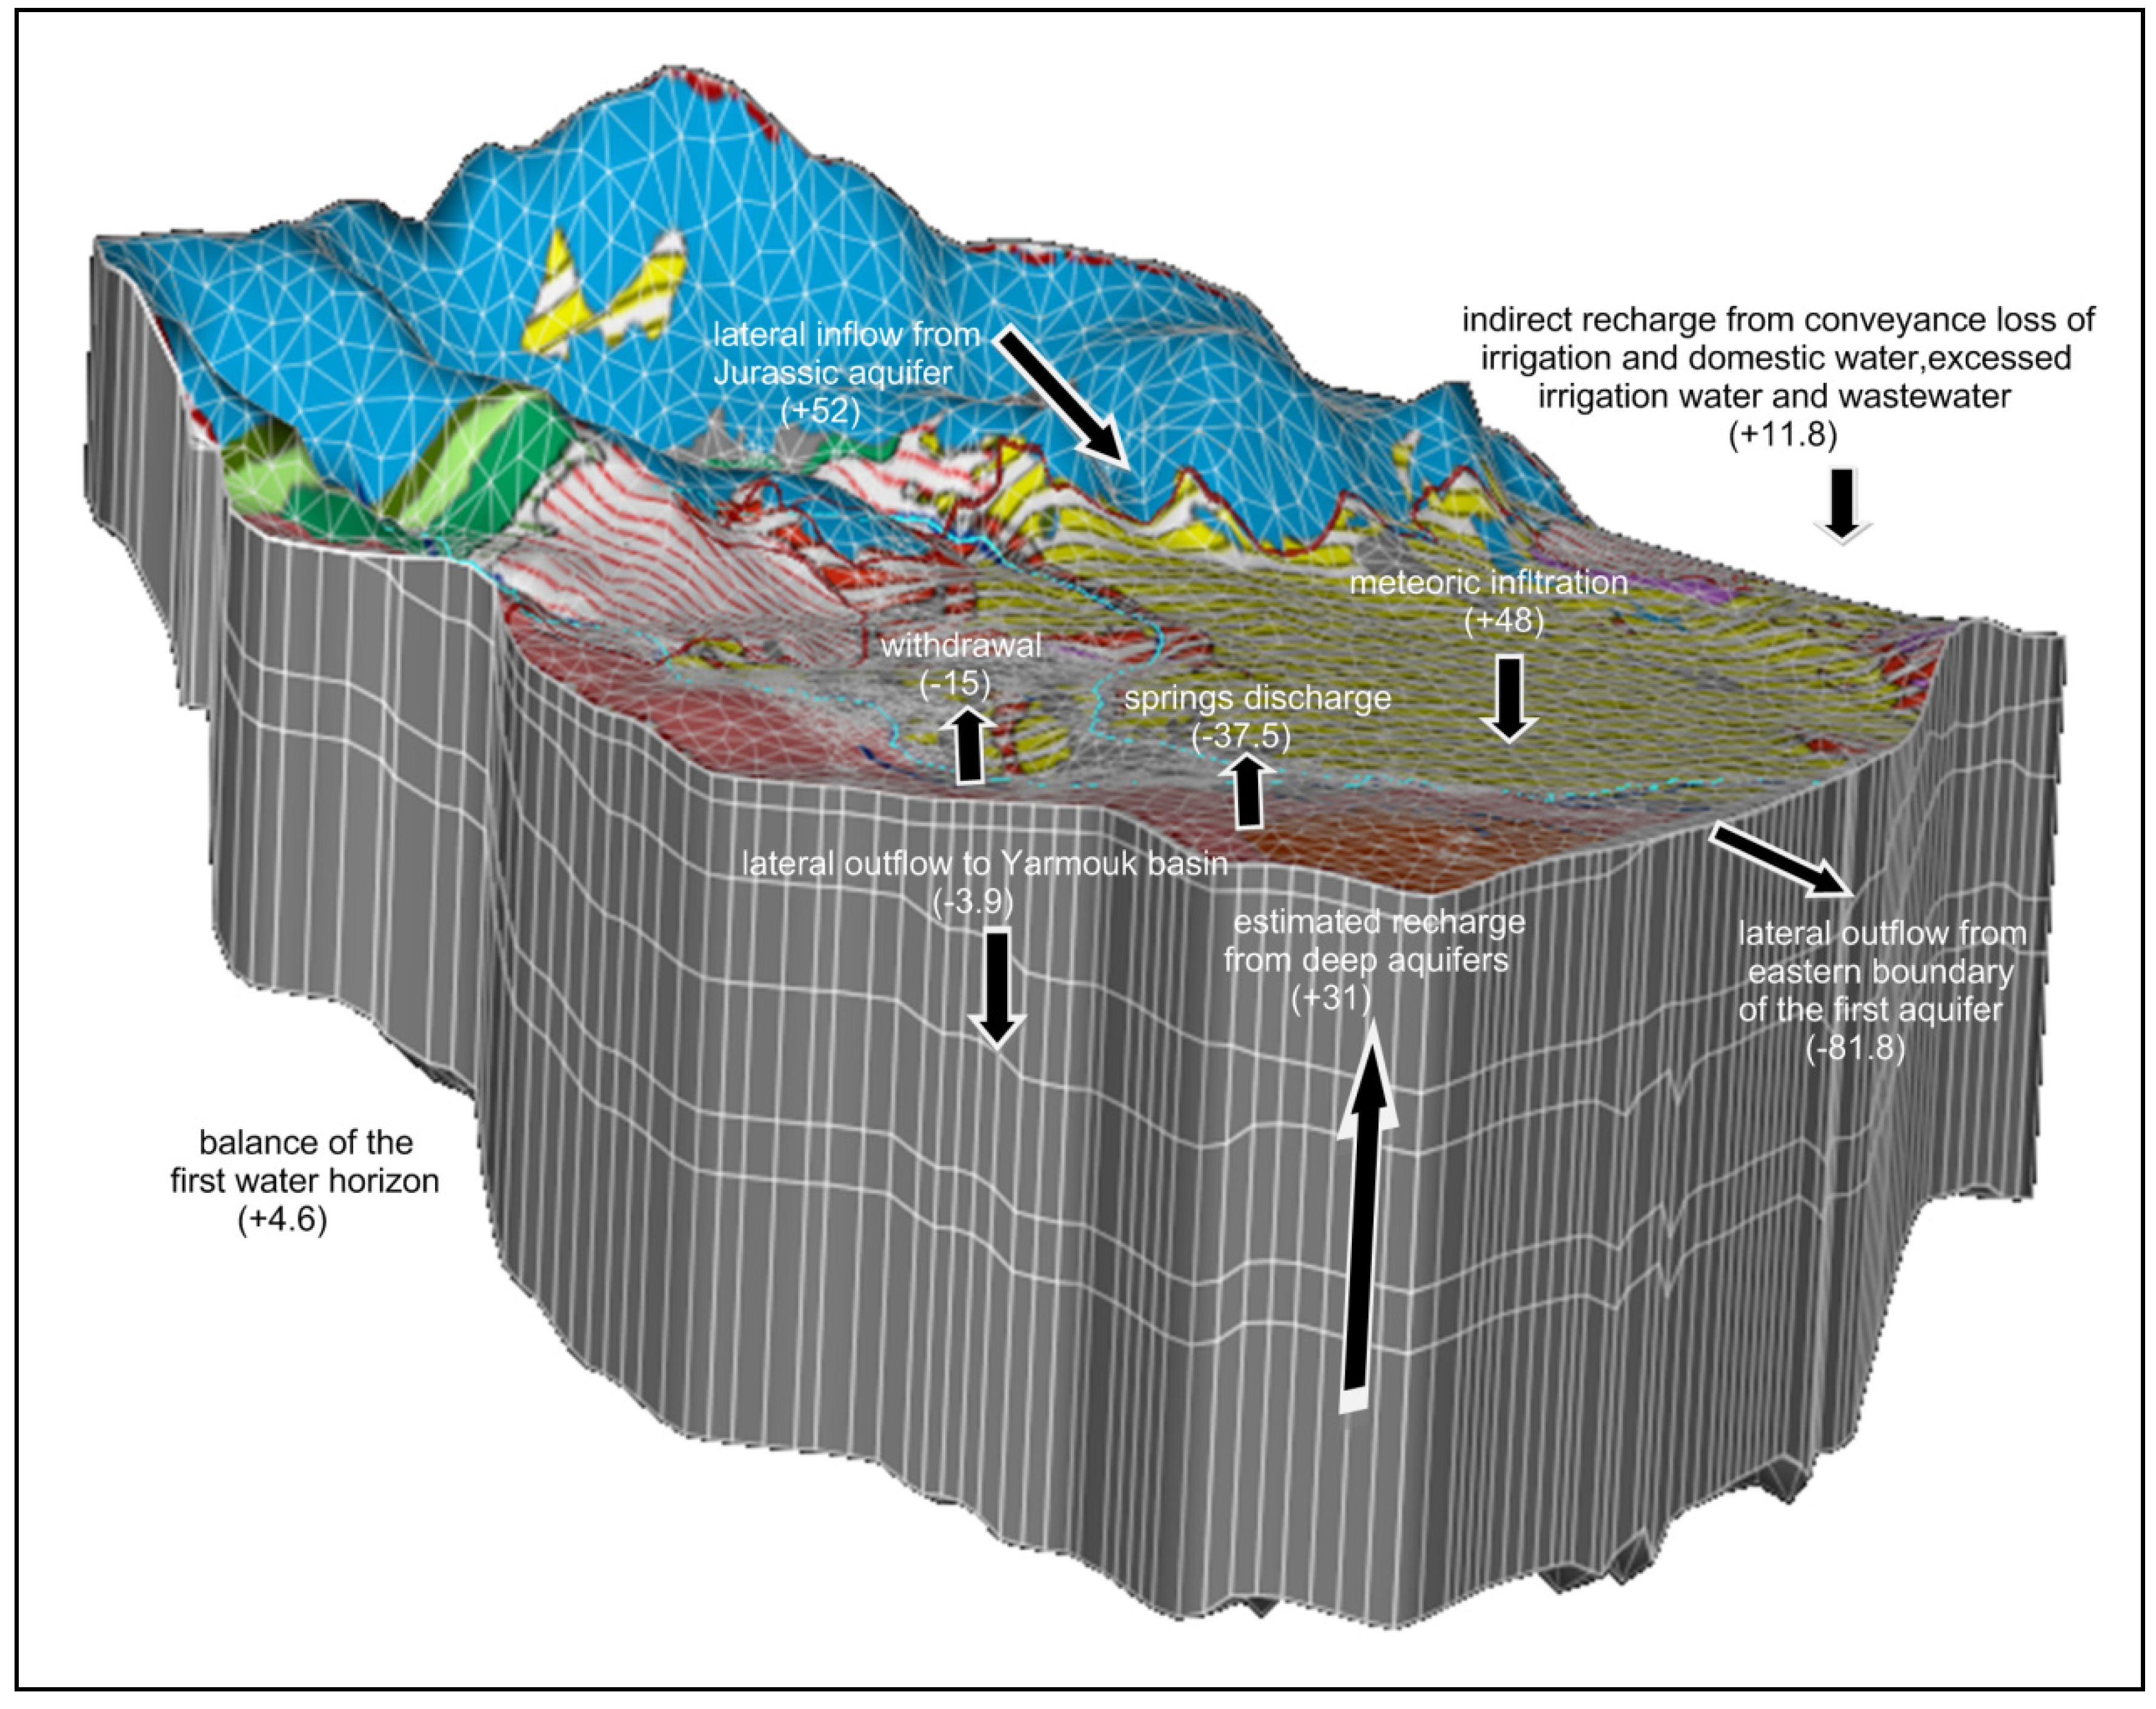
The water budget of the calibrated model domain is balanced with an internal error estimated at less than 1%. However, the water budget applied on the upper aquifer horizon was calculated based on the difference between the simulated and estimated components of inflow and outflow (
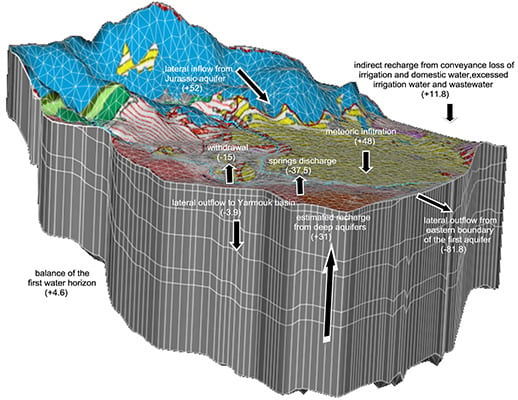
Table 1) using Equation (1) as follows: (11.8 + 48 + 52 + 31) − (3.9 + 37.5 + 81.8 + 15). This calculation indicates a positive imbalance equal to 4.6 Mm
3·y
−1. This imbalance between input and output components is around 3.3% and can be referred to the steady state simulation error which is offset by error in budget estimates in deeper aquifers, so that the overall system gives d
V/d
t = 0. The lateral and upward inflow are the most important input components, providing evidence for the likelihood of large-scale feeding flow from Jurassic aquifers toward the upper aquifer horizon. The atmospheric precipitation is the next most important recharge component. The indirect recharge forms a considerable component in recharging this horizon, which indicates the effect of anthropogenic activities developed in the study area. The largest outflow component is through the eastern boundary. Even given the fact that groundwater flows across the eastern boundary of the model area, the groundwater system in the adjacent eastern region is under great stress compared to the model region. In general, the hydrogeological dynamic characteristics of the study area seem to play a key role in the groundwater flow system despite the development of intensive anthropogenic activities in this area. More data for longer periods and accurate groundwater pumpage as well as details about hydrodynamic characteristics of deep aquifers are required to determine an accurate water budget.
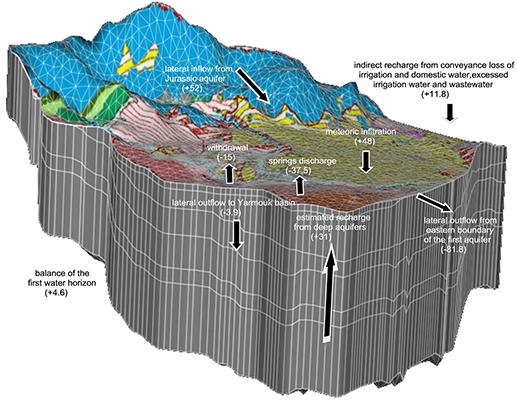
Based on the FEFLOW numerical model and the other primary information utilized within this study, the different components of the water budget of the upper aquifer horizon are shown in
Table 1 and
Figure 9.
Figure 9.
Three dimensional (3D) numerical model showing computed water budget in the upper aquifer horizon applied to steady-state simulation during September 2010. The positive inflow and negative outflow values are expressed in Mm3·y−1.
Figure 9.
Three dimensional (3D) numerical model showing computed water budget in the upper aquifer horizon applied to steady-state simulation during September 2010. The positive inflow and negative outflow values are expressed in Mm3·y−1.
7. Conclusions
The development of the groundwater model in the eastern part of Mt. Hermon is a useful alternative tool to evaluate groundwater resources in this region. The result of the calibrated model shows reasonable agreement between measured and calculated water levels.
Groundwater flow system in the model domain can be divided into two primary components. The first is shallow aquifer in the unconsolidated Quaternary/Neogene formations in the plain region. Water level in this region is affected by lateral inflow and upward movement of deep groundwater. The second is deep aquifer in the Cretaceous and Jurassic strata, where the preferential flow mechanism potentially contributes to the groundwater flow patterns. The hydraulic connection between the two systems is observed at the foothill of Mt. Hermon where the Neogene formations come into direct contact with the Jurassic formations. Groundwater flow in the first system seems to be controlled by bedding and lithostratigraphic units with a minor downward component. In the second system, groundwater flow pathways consist of two main components. The first is local and controlled either by conduits and active fault zones, and subsequently discharges as a preferential flow throughout several karstic springs or recharges the upper aquifer horizon as a lateral groundwater flow. The second is recognized as being regional and controlled by the geological structures as deep vertical groundwater flow discharging by springs or upward groundwater leakage to recharge the upper aquifer.
The most important components of the water budget in the upper aquifer horizon were determined. The result indicated that the lateral discharge from the Jurassic karstic aquifer into Neogene conglomerates and the recharge by infiltrated meteoric precipitation are the most important mechanisms in recharging the upper aquifer horizon. The upward movement of groundwater from deeper aquifers plays a considerable role in recharging this aquifer. However, the lateral discharge from the eastern model domain boundary is the largest discharge component, which indicates that the study area can be considered as a main recharge region of the western side of the Barada and Awaj Basin. Nevertheless, the natural characteristics of the hydrogeological dynamism in the study area seem to play a key role in the groundwater flow system despite the development of intensive agricultural/domestic activities in this area.
The result of this study is in agreement with that obtained by the interpretation of the groundwater hydrochemical characteristics of the study area [
30]. This result clarifies the recharge/discharge mechanisms between two different, but linked, hydrogeological systems (shallow and deep), and helps to quantify the different components of a water budget in the shallow system.
Increasing groundwater model efficiency requires more information about the hydraulic and dispersive characteristics of deep aquifers and karst setting. However, this model can be considered as a basis for the prediction of future changes in the groundwater system when the model is run in a transient state and with the probable application of different scenarios.
Acknowledgments
The authors are grateful to Abdallah AL-Kattea and Kasem Salih from the General Directorate of the Barada and Awaj Basin (GDBAB)-Syria, and Taghreed Alsaleh from Arab Center for the Studies of Arid Zones and Dry Lands (ACSAD) for their assistance in providing the required data and information for the model construction. Special thanks go also to the French Ministry of Foreign Affairs and Campus France for their financial support (grants Nos. 779091L and 839300A). The authors would like to thank two anonymous reviewers, with special thanks to Alon Rimmer, for their valuable comments which helped to improve the quality of this manuscript.
Author Contributions
All the authors contributed extensively to the work presented in this paper. Nazeer M. Asmael and Alain Dupuy designed and implemented the simulation model. Nazeer M. Asmael wrote the manuscript. All the authors performed the conceptual model based on the result of hydrochemistry and isotopes technique, discussed the results and commented on the manuscript at all stages.
Conflicts of Interest
The authors declare no conflict of interest.
References
- Melhem, R.; Higano, Y. Policy measures for river water management in Barada Basin, Syria. Stud. Reg. Sci. 2001, 32, 1–23. [Google Scholar] [CrossRef]
- Ministry of Agriculture and Agrarian Reform (MAAR). Syrian Agriculture Database; MAAR: Damascus, Syria, 2006. [Google Scholar]
- Luijendijk, E.; Bruggeman, A. Groundwater resources in the Jabal Al Hass region, northwest Syria: An assessment of past use and future potential. Hydrogeol. J. 2008, 16, 511–530. [Google Scholar] [CrossRef]
- Konikow, L.; Kendy, E. Groundwater depletion: A global problem. Hydrogeol. J. 2005, 13, 317–320. [Google Scholar] [CrossRef]
- Kløve, B.; Ala-Aho, P.; Bertrand, G.; Gurdak, J.J.; Kupfersberger, H.; Kvaerner, J.; Muotka, T.; Mykrä, H.; Preda, E.; Rossi, P.; et al. Climate change impacts on groundwater and dependent ecosystems. J. Hydrol. 2013, 518, 250–266. [Google Scholar] [CrossRef]
- U.S. Department of Agriculture (USDA). Foreign Agricultural Service Middle East and Central Asia: Continued Drought in 2009/2010 Threatens Greater Food Grain Shortages, 2008. Available online: http://www.pecad.fas.usda.gov/highlights/2008/09/mideast_cenasia_drought/ (accessed on 16 September 2008).
- Integrated Regional Information Networks (IRIN). Syria: Drought Pushing Millions into Poverty. Damascus, 9 September 2010. Available online: http://www.irinnews.org/Report/90442/SYRIA-Drought-pushing-millions-into-poverty (accessed on 12 March 2015).
- Voss, K.A.; Famiglietti, J.S.; Lo, M.; de Linage, C.; Rodell, M.; Swenson, S.C. Groundwater depletion in the Middle East from GRACE with implications for transboundary water management in the Tigris-Euphrates-Western Iran region. Water Resour. Res. 2013, 49, 904–914. [Google Scholar] [CrossRef] [PubMed]
- Anderson, M.P.; Woessner, W.W. Applied Groundwater Modeling, Simulation of Flow and Advective Transport; Academic Press: New York, NY, USA, 1992. [Google Scholar]
- Chiang, W.H.; Kinzelbach, W.; Rausch, R. Aquifer Simulation Model for Windows-Groundwater Flow and Transport Modeling, an Integrated Program; Borntraeger: Berlin, Germany; Stuttgart, Germany, 1998; p. 137. [Google Scholar]
- Food and Agriculture Organization of the United Nations (FAO). AQUASTAT. Available online: http://www.fao.org/nr/water/aquastat/main/index.stm (accessed on 11 February 2015).
- Aw-Hassan, A.; Rida, F.; Telleria, R.; Bruggeman, A. The impact of food and agricultural policies on groundwater use in Syria. J. Hydrol. 2014, 513, 204–215. [Google Scholar] [CrossRef]
- Rimmer, A.; Salingar, Y. Modelling precipitation-streamflow processes in karst basin: The case of the Jordan River sources, Israel. J. Hydrol. 2006, 331, 524–542. [Google Scholar] [CrossRef]
- Alpert, P.; Krichak, D.O.; Sharif, H.; Haim, D.; Osetinsky, I. Climatic trends to extremes employing regional modeling and statistical interpretation over the E. Mediterranean. Glob. Planet. Chang. 2008, 63, 163–170. [Google Scholar] [CrossRef]
- Frumkin, A.; Shimrom, A.E.; Miron, Y. Karst morphology across steep climate gradient southern Mt. Hermon. Z. Geomorphol. 1998, 109, 23–40. [Google Scholar]
- Dubertret, L. L’Hydrologie et aperçu sur l’Hydrographie de la Syrie et du Liban dans leurs relations avec la géologie. Rev. Géogr. Phys. Géol. Dyn. 1933, 4, 347–452. (In French) [Google Scholar]
- Mor, D. A time-table for the Levant Volcanic Province, according to K-Ar dating in the Golan Heights, Israel. J. Afr. Earth Sci. 1993, 16, 223–234. [Google Scholar] [CrossRef]
- Hartmann, A. Process-Based Modeling of Karst Springs in Mt. Hermon, Israel. Ph.D. Thesis, Albert-Ludwigs-Universität Freiburg im Breisgau, Breisgau, Germany, 2008. [Google Scholar]
- Kattan, Z. Characterization of surface water and groundwater in the Damascus Ghotta basin: Hydrochemical and environmental isotopes approaches. Environ. Geol. 2006, 1, 173–201. [Google Scholar] [CrossRef]
- United Nations. Groundwater in Eastern Mediterranean and Western Asia; Natural Resources Water Series No. 9; United Nations: New York, NY, USA, 1982. [Google Scholar]
- Japan International Cooperation Agency (JICA). The Study of Water Resources Development in the Western and Central Basins in Syrian Arab Republic, Phase I; JICA: Osaka, Japan, 2001. Unpublished Report. (In Arabic) [Google Scholar]
- La-Moreaux, P.E.; Hughes, T.H.; Memon, B.A.; Lineback, N. Hydrogeologic assessment-Figeh Spring, Damascus, Syria. Environ. Geol. Water Sci. 1989, 13, 73–127. [Google Scholar] [CrossRef]
- Selkhozpromexport. Water resources use in Barada and Al-Awaj Basins for irrigation of crops. In USSR, Ministry of Land Reclamation and Water Management; Selkhozpromexport: Moscow, Russia, 1986. [Google Scholar]
- Wolfart, R. Hydrogeology of the Damascus Basin (southwest-Syria). Int. Assoc. Sci. Hydrol. 1964, 64, 402–413. [Google Scholar]
- DHI-WASY GmbH. FEFLOW 6—Finite elements subsurface flow and transport simulation system. In User’s Manual; DHI-WASY GmbH: Berlin, Germany, 2010. [Google Scholar]
- Elango, L. Numerical Simulation of Groundwater Flow and Solute Transport, 1st ed.; Allied Publishers Pvt. Ltd.: New Delhi, India, 2005. [Google Scholar]
- Krige, D.G. A statistical approach to some basic mine valuation problems on the Witwatersrand. J. Chem. Metall. Min. Soc. S. Afr. 1951, 52, 119–139. [Google Scholar]
- Ministry of Irrigation (MOI). Annual Water Resources Report of Barada and Awaj Basin, Damascus, Syria; MOI: Damascus, Syria, 2005. unpublished report. (In Arabic) [Google Scholar]
- Water Utility of Damascus Rif (RDAWSA). Interim Report-Hydrogeological Study of Mogher Al Mer Area, Damascus Rural Water and Sanitation Project; RDAWSA: Damascus, Syria, 2006. unpublished report. (In Arabic) [Google Scholar]
- Asmael, N.M.; Huneau, F.; Garel, E.; Celle-Jeanton, H.; le Coustumer, P.; Dupuy, A. Hydrochemistry to delineate groundwater flow conditions in the Mogher Al Mer area (Damascus Basin, Southwestern Syria). Environ. Earth Sci. 2014, 72, 3205–3225. [Google Scholar] [CrossRef]
© 2015 by the authors; licensee MDPI, Basel, Switzerland. This article is an open access article distributed under the terms and conditions of the Creative Commons Attribution license (http://creativecommons.org/licenses/by/4.0/).


 ,
, 
