Article

Evaluation of a Modified Monod Model for Predicting Algal Dynamics in Lake Tai

1
School of Environment, Beijing Normal University, Beijing 100875, China
2
Department of Civil and Environmental Engineering, Old Dominion University, Norfolk, VA 23529-0241, USA
3
Chinese Research Academy of Environmental Sciences, No.8 Dayangfang, Beijing 100012, China
4
Water Conservancy and Civil Engineering College, Inner Mongolia Agricultural University, Hohhot 010000, Inner Mongolia Autonomous Region, China
*
Author to whom correspondence should be addressed.
Water 2015, 7(7), 3626-3642; https://doi.org/10.3390/w7073626
Submission received: 22 May 2015 / Revised: 30 June 2015 / Accepted: 2 July 2015 / Published: 8 July 2015

Abstract

:
Several modified versions of the Monod model have been proposed to simulate algal dynamics in lakes by keeping the parent model’s advantages of simplicity and low data requirement. This study evaluated the performance of a widely-used modified Monod model in predicting algal dynamics at various time scales in Lake Tai, a typical shallow lake in east China, using multiple time series. Chlorophyll-a (Chl-a) concentration was used as a surrogate for algal (CyanoHABs: cyanobacterial harmful algal blooms) growth and the independent variables were total nitrogen (TN), total phosphorus (TP), and either water temperature or air temperature. The evaluation indicated that the model parameters could have distinctly different values, depending on whether or not constraints are imposed, time scales, and types of nutrients. The model performance varied in terms of time scales as well as magnitudes and fluctuations of Chl-a and TN or TP concentrations, achieving a relative better performance for the monthly rather than three-day time scale and for the central part rather than bays of the study lake. The model with TP as the independent variable had a better performance than the model with TN as the independent variable, regardless of the time scale used. The temperature-nutrient interactions were important for algal growth when the temporal fluctuations of these two factors were large but the interactions could become minimal otherwise.

1. Introduction

Eutrophication resulting from cyanobacterial harmful algal blooms (CyanoHABs) is a frequent nuisance phenomenon in freshwater lakes and estuaries around the world, posing a serious threat to aquatic ecosystems and human health [1,2]. The climate change-induced increasing air temperature (AT) and water temperature (WT) are likely to promote a faster algal growth rate [3,4]. Nitrogen (N) and/or phosphorus (P) levels often positively affect phytoplankton growth in lakes. The absolute as well as relative concentrations of the nutrients affect the growth rate, abundance, and composition of phytoplankton in lake water [5] and are usually measured in terms of their trophic state, which is defined as the total weight of biomass in a given water body at the time of measurement [6]. The trophic state of a lake generally increases with increase in its total nitrogen (TN) and total phosphorus (TP) concentrations. In practice, the development of solutions to lake eutrophication problems requires a better understanding of how algal blooms depend on WT and/or AT, TN, and TP [7,8].
Over the past few years, extensive studies have been conducted to examine phytoplankton dynamics, resulting in a variety of models [9,10]. Some 2- and 3-D models have been developed for lakes with sufficient observed data, while simpler models such as the commonly-used Monod model were created to simulate the dynamics of lakes where only limited data are available [11]. For the less well-studied lakes, including Lake Tai, the Monod model is probably more applicable but its parameterization and prediction performance have not yet been conclusively demonstrated, thus limiting confidence in the model.
The Monod model [12] has been used extensively to simulate effects of nutrients on algal growth. For example, Huang et al. [8] set up and used a Monod model to predict short-term (in this case, one- to five-day) phytoplankton distribution in Lake Tai as part of the effort to protect sensitive drinking-water intake areas by avoiding or minimizing the negative impact of algal blooms. Similarly, Pei and Ma [13] used a Monod model to simulate algal dynamics at the annual time scale, and found that the model performed well in capturing the ecological dynamics of a lake in Hangzhou. Ye et al. [14] developed a modified Monod model and applied it to quantify the relationships between algal biomass and both nutrients and temperature in Lake Tai using long-term data. Their results indicated that the annual mean algal biomass increased by a factor of 0.145 for every 1.0 °C rise in temperature. However, as with the others reported in the literature, none of the earlier studies cited above sought to evaluate the performance of a Monod model in terms of its dependence of time scale and time series used.
The main objective of this study was therefore to evaluate the performance of the modified Monod model, which was applied to Lake Tai in a previous study [14], in predicting algal dynamics at various time scales by using multiple sets of time series. Herein, chlorophyll-a (Chl-a) concentration was used as a surrogate for algal (CyanoHABs) growth because of the close positive correlation between them [15], while the independent variables included TN, TP, and WT or AT.

2. Materials and Methods

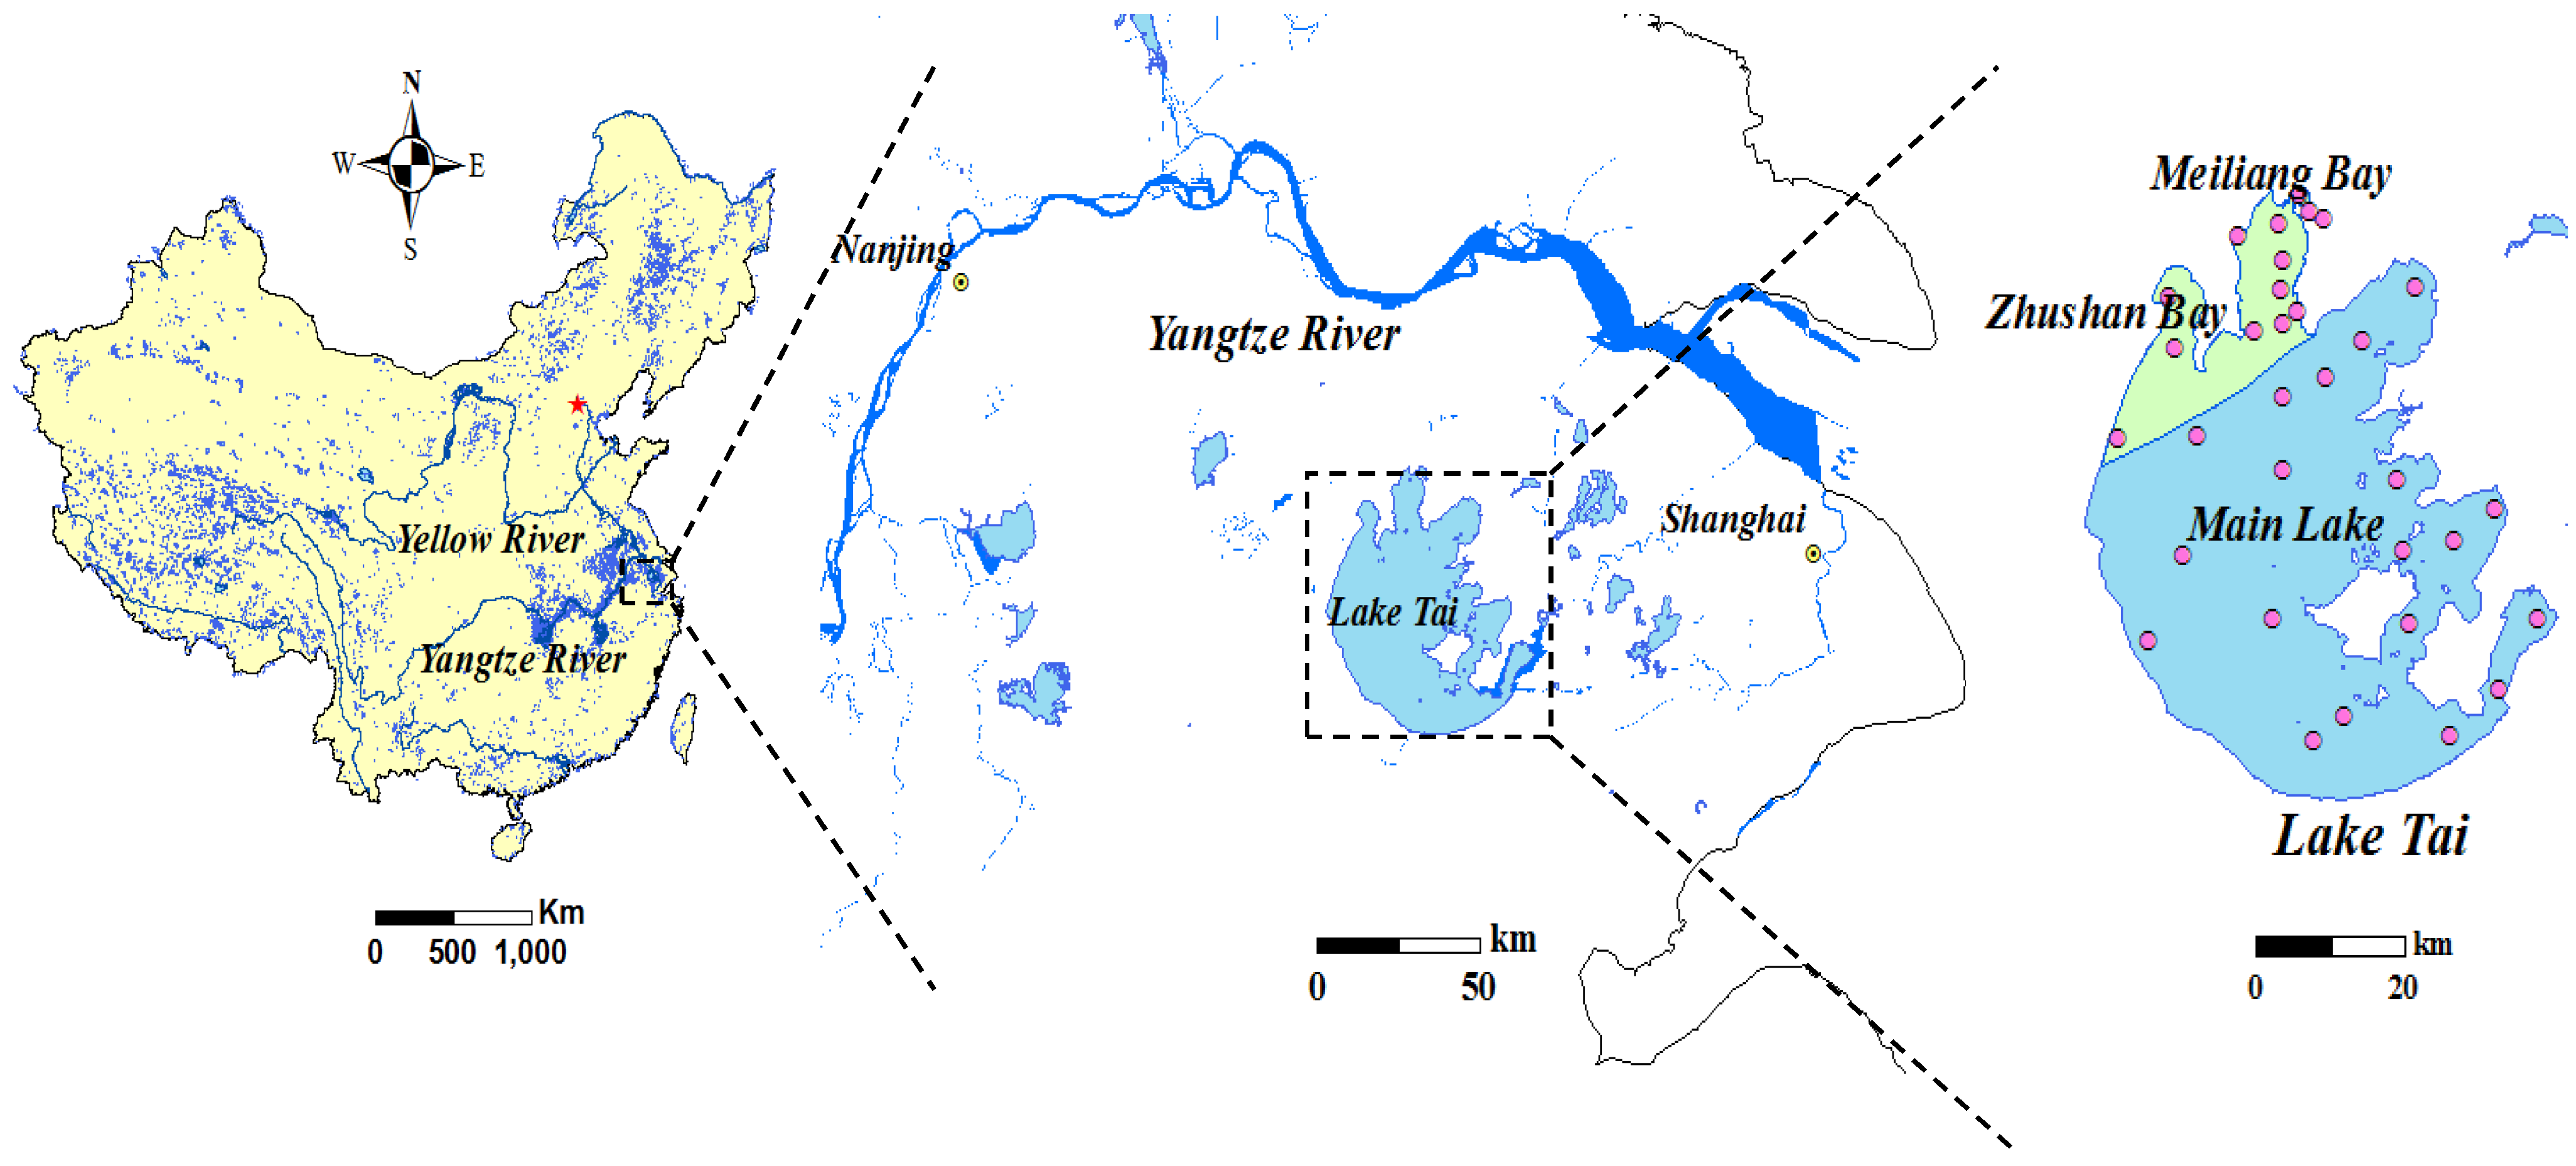
2.1. Site Description

Lake Tai (31°15′ N, 120°14′ E), which is also referred to as Lake Taihu, Tai Lake, or Taihu Lake in literature, is a typical shallow freshwater lake located in the south of the Yangtze River Delta in China [16,17] (Figure 1). The lake has an average water depth of 1.9 m, a surface area of 2338 km2, a maximum volume capacity of 48.6 × 10⁸ m3, and a mean hydraulic retention time of 310 days. It is located in a plain at the center of a dense network of over 200 rivers or tributaries. Annual mean inflow and outflow rates are 183 and 181 m3·s−1, respectively. The largest inflow waterway is the Xitiaoxi River, with an annual mean inflow rate of 26.8 m3·s−1, and the largest outflow waterway is the Taipu River, with an annual mean outflow rate of 70.6 m3·s−1.
Figure 1. Map showing the location of Lake Tai and its subdivisions. Data collection sites are shown in the map on the right hand side.
Water 07 03626 g001
Lake Tai, which is an important regional fresh water resource [18], is infamous for its problems with widespread algal blooms, which seriously degrade the water quality [19]. Across the lake area, the algal bloom is most serious in the two large, semi-enclosed bays, Zhushan Bay and Meiliang Bay [20], so, for the purposes of this study, Lake Tai was subdivided into two zones: Meiliang-Zhushan Bay and Main Lake (Figure 1). Meiliang-Zhushan Bay, which consists of the northern portion of the lake, is severely polluted and tends to receive algae from Main Lake during the summer due to prevalent northeast wind. Main Lake, which has a better water quality than Meiliang-Zhushan Bay, receives direct discharges from several tributaries. TN and TP concentrations in Meiliang-Zhushan Bay are twice those in Main Lake, while Chl-a levels in Meiliang-Zhushan Bay are three times higher than in Main Lake.
Before the 1970s, Lake Tai had prevalent aquatic macrophytes and clear water. However, the lake surface area was reduced by about 528.5 km2 (i.e., 13.6%) from 1949 to 1985, greatly lowering the lake’s self-purification capability. In addition, the rapid development and population growth might result in more nutrients to be transported into the lake via overland runoff. The consequence is that macrophyte-dominated species have been replaced by phytoplankton since 1980s and that algal blooms occur more frequently and persistently. In summer of 1990, algal bloom occurred in the entire Meiliang Bay and lasted for more than a week, causing 118 plants to stop working and Wuxi City to be short of clean drinking water. In recent years, algal bloom tends to expand from Meiliang Bay to the central part of Lake Tai. In this regard, in order to improve the water quality and suppress algal bloom, fresh water has been transferred from Yangtze River through Gonghu Bay and Wangyu River downstream into the lake from time to time since 2002. Water in Lake Tai flows out through Taipu River and the lake level is controlled at 3.0 to 3.5 m. From 2002 to 2011, totally 71 × 108 m3 water had been transferred, with a measurable effect in lowering the lake’s TN and TP concentrations.

2.2. Data and Preprocessing

The data on TN, TP, and Chl-a levels, and WT were synchronously measured at a three-day time interval in Meiliang Bay by the Chinese Academy of Sciences (CAS) Nanjing Institute of Geography and Limnology (NIGL) in 2010 and 2011 by following the guidelines of the Chinese Ministry of Environmental Protection (CMEP) [21]. Daily data on TN, TP, and Chl-a levels in Lake Tai were collected by the Chinese Research Academy of Environmental Sciences (CRAES) for the period from 2005 to 2010. Thirty-two observational sites are distributed across Lake Tai (Figure 1), with 10 sites in Meiliang Bay, three sites in Zhushan Bay, and 19 sites in Main Lake. Daily air temperature data observed at the Wuxiandongshan station were obtained from CRAES for the same record period. CRAES is a government-funded organization that collects and compiles national environmental data in accordance with standards set by China’s State Environmental Protection Administration [21]. All data were checked for accuracy by experts in the relevant field by following strict scientific procedures; the records were deemed to be complete and considered to be reliable for the purposes of this study [22].
The daily data were preprocessed to derive the corresponding monthly time series for Meiliang-Zhushan Bay (13 data collection sites) and Main Lake (19 data collection sites). For each observational site and variable (i.e., TN, TP, Chl-a and AT), the daily values for the month were arithmetically averaged to obtain the monthly value of the variable for that site. These monthly values for the observation sites in Meiliang-Zhushan Bay were then arithmetically averaged to obtain the monthly value for the bay as a whole, while the monthly values for all other sites were arithmetically averaged to obtain the monthly value for Main Lake. As a result, eight monthly time series of TN, TP, Chl-a, and AT were created: four for the bay and another four for Main Lake.

2.3. Methods

2.3.1. Model Description

The original Monod model [23] can be expressed as:
u = u max ( s k + s )
where u is the specific growth rate of phytoplankton (d−1); umax is the maximum specific growth rate of phytoplankton (d−1); s is the limiting nutrient concentration (mg·L−1); and k is the half saturation coefficient (mg·L−1).
Ye et al. [14] assumed that umax is a function of environment factors (e.g., temperature and light) and proposed an alternative model expressed as:
u = A · b T · s k + s
where A is the maximum specific growth rate at a certain temperature (d−1); b is the activation energy dependent constant; and T is the temperature (°C).
Siswanto et al. [15] reported that each Microcystis cell contains about 3.4 × 10⁻¹³ g Chl-a and found that Chl-a concentration can be used as a surrogate of phytoplankton biomass. Based on these two facts, Ye et al. [14] proposed a Chl-a concentration model expressed as:
C = C max · s k + s  
where C is the concentration of Chl-a (ug·L−1); and Cmax is the maximum concentration of Chl-a (ug·L−1).
Combining Equations (2) and (3), Ye et al. [14] formulated a modified Monod model expressed as:
C Chl a = a · b T · s k + s
where CChl-a is the concentration of Chl-a (ug·L−1); and a is the maximum concentration of Chl-a at a particular temperature (ug·L−1).

2.3.2. Estimation of Model Parameters in Equation (4)

The model parameters, including a, b, and k, were determined by adjusting specified initial parameter values to ensure that predicted CChl-a concentrations closely match the corresponding observed values. The adjustment was implemented using the Microsoft Excel® Solver, which determines the optimum value for a formula in a particular target cell on a Microsoft Excel® worksheet by adjusting the values of “other cells” that are related to the target cell by an equation. Herein, the target cell stores the summation of the predicted-observed differences squared, while the “other cells” store values for a, b, and k. Once an equation has been constructed and a set of initial values (and constraints if any) for the parameters are defined, the Solver will try adjusting the parameter values to reach an optimal solution that satisfies all the constraints imposed.
In this study [23], when TN was used as the limiting nutrient, the initial parameter values were specified as a = 10.0, b = 1.0, k = 1.0, whereas when TP was used as the limiting nutrient, the initial parameter values were specified as a = 10.0, b = 1.0, k = 0.001. These were taken as the initial values and then two schemes, one with constraints imposed and another without constraints, were tested for each adjustment. The scheme that imposed no constraints allowed the parameters to take any values that minimized the difference, while the scheme with constraints imposed limits on the parameters and then sought to minimize the difference. The limits were specified in terms of the physical meanings of the parameters as well as the values reported in existing literature [14,15].

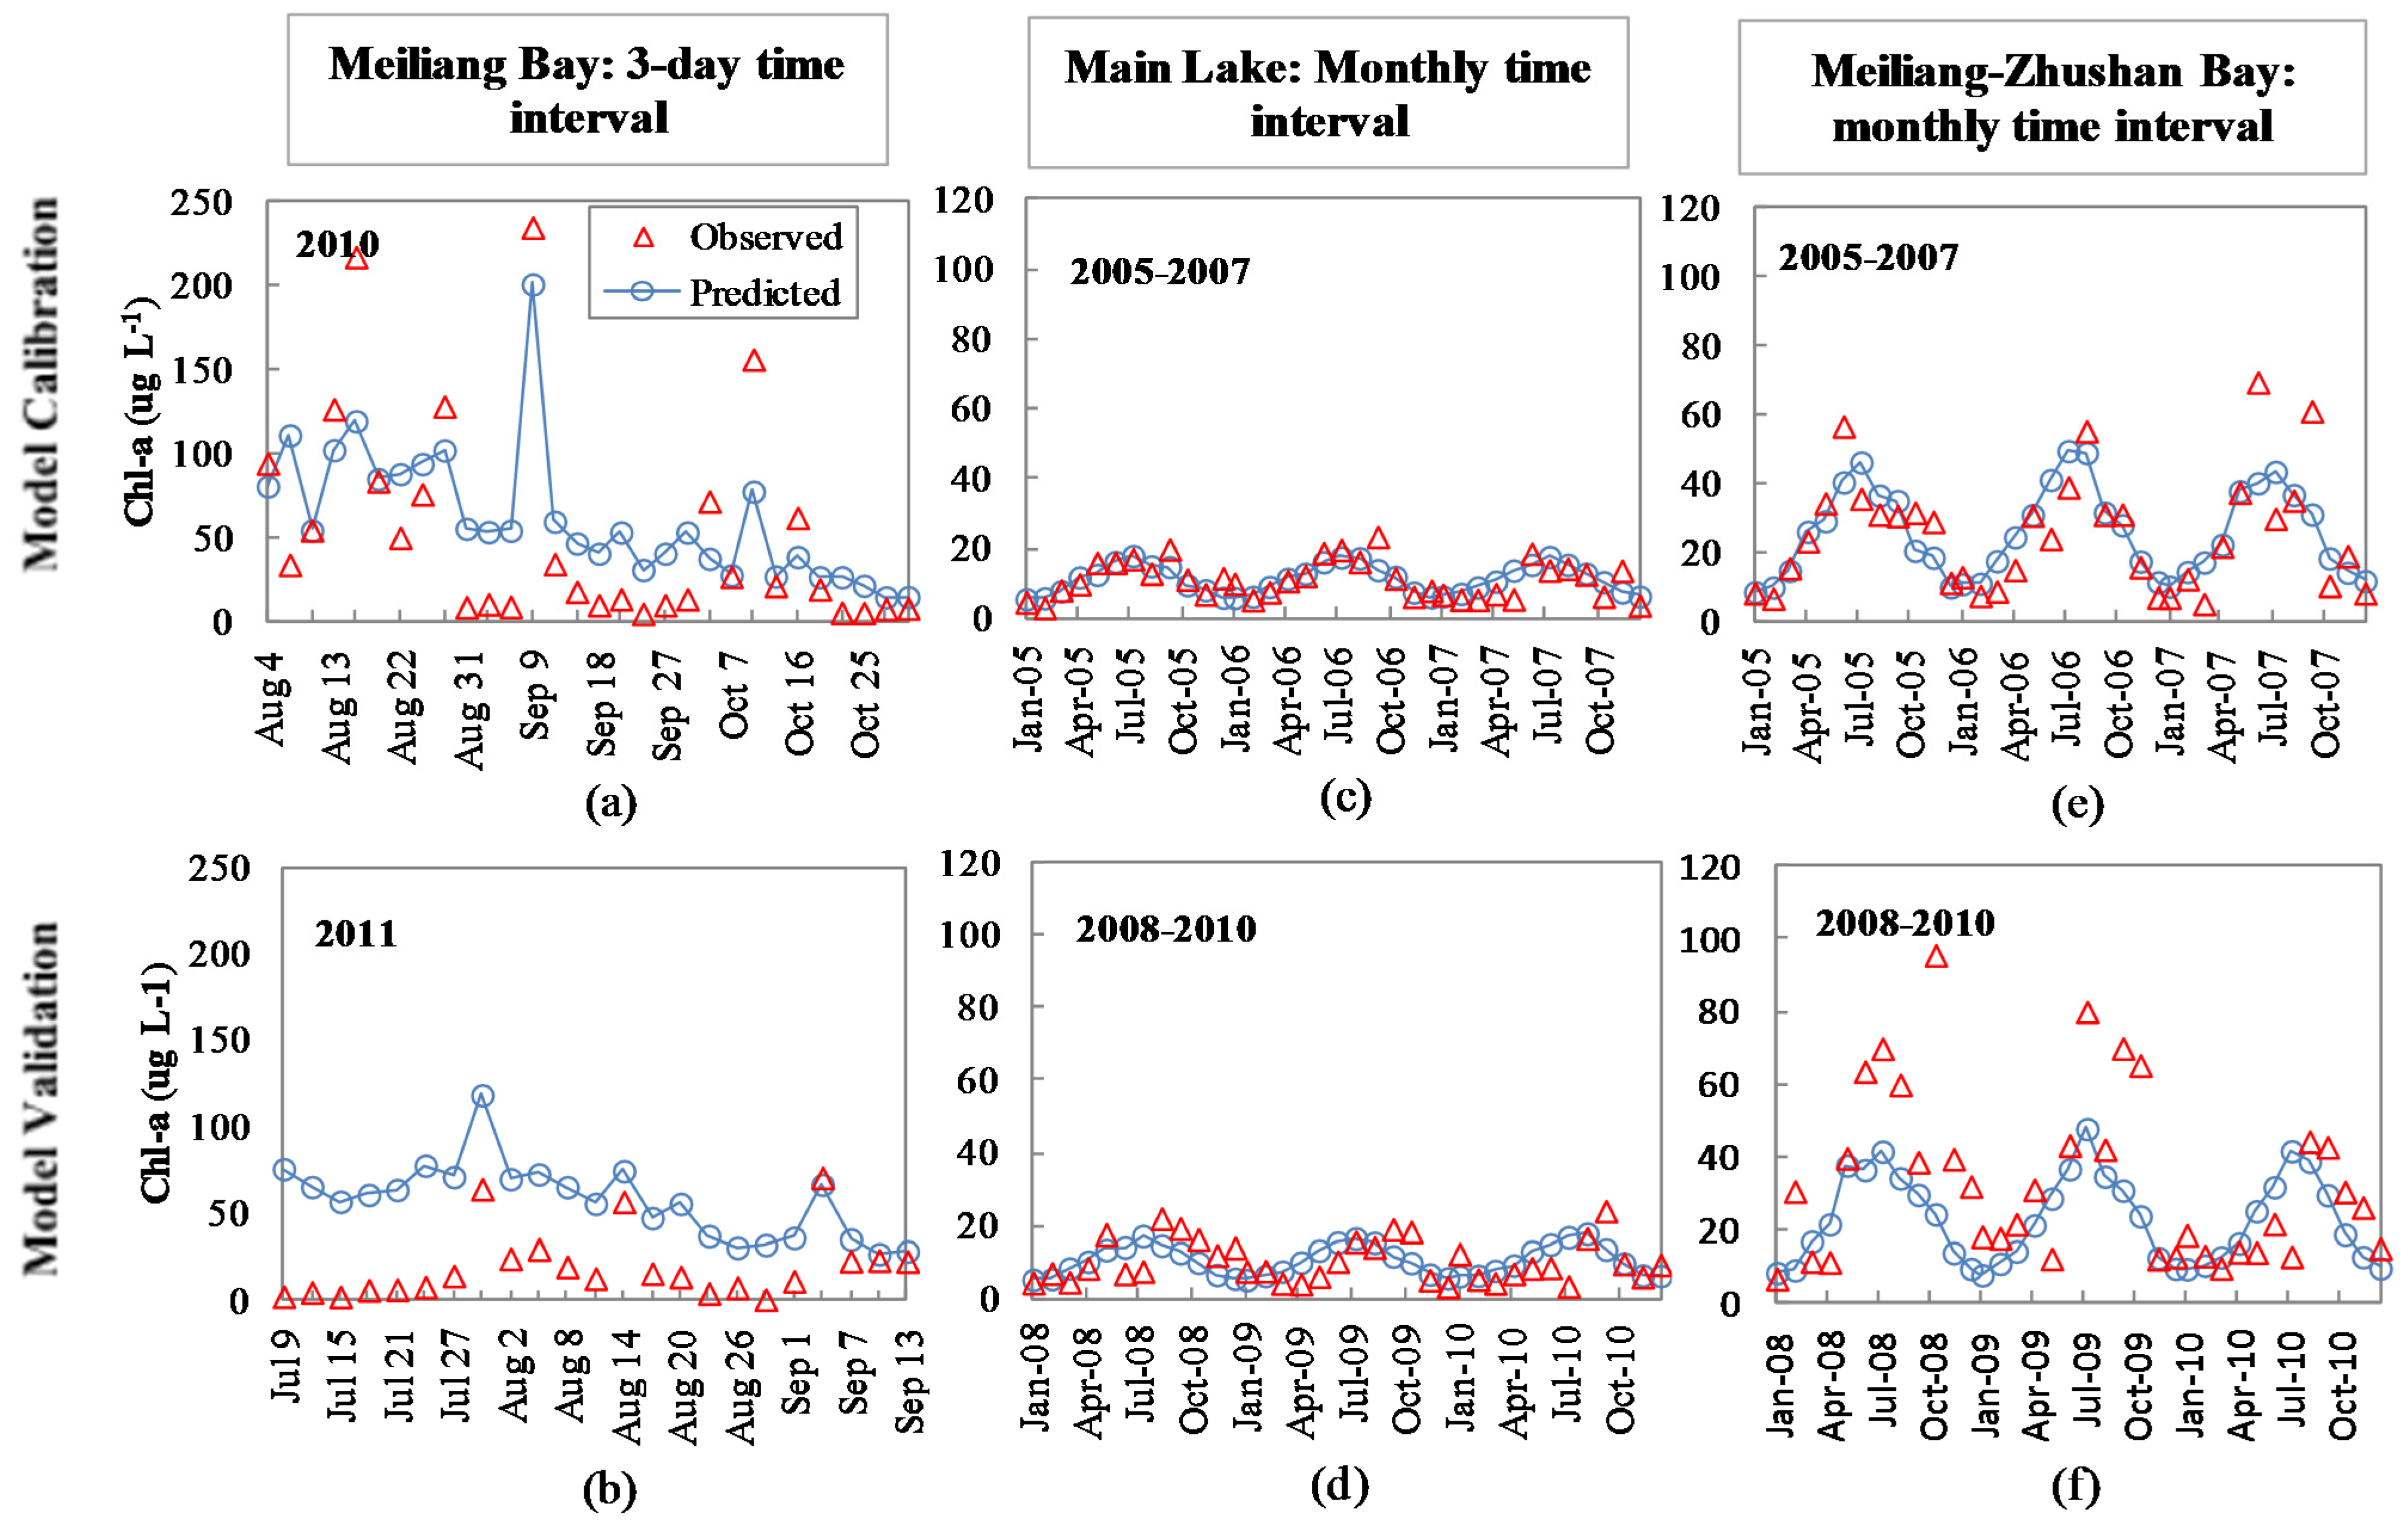
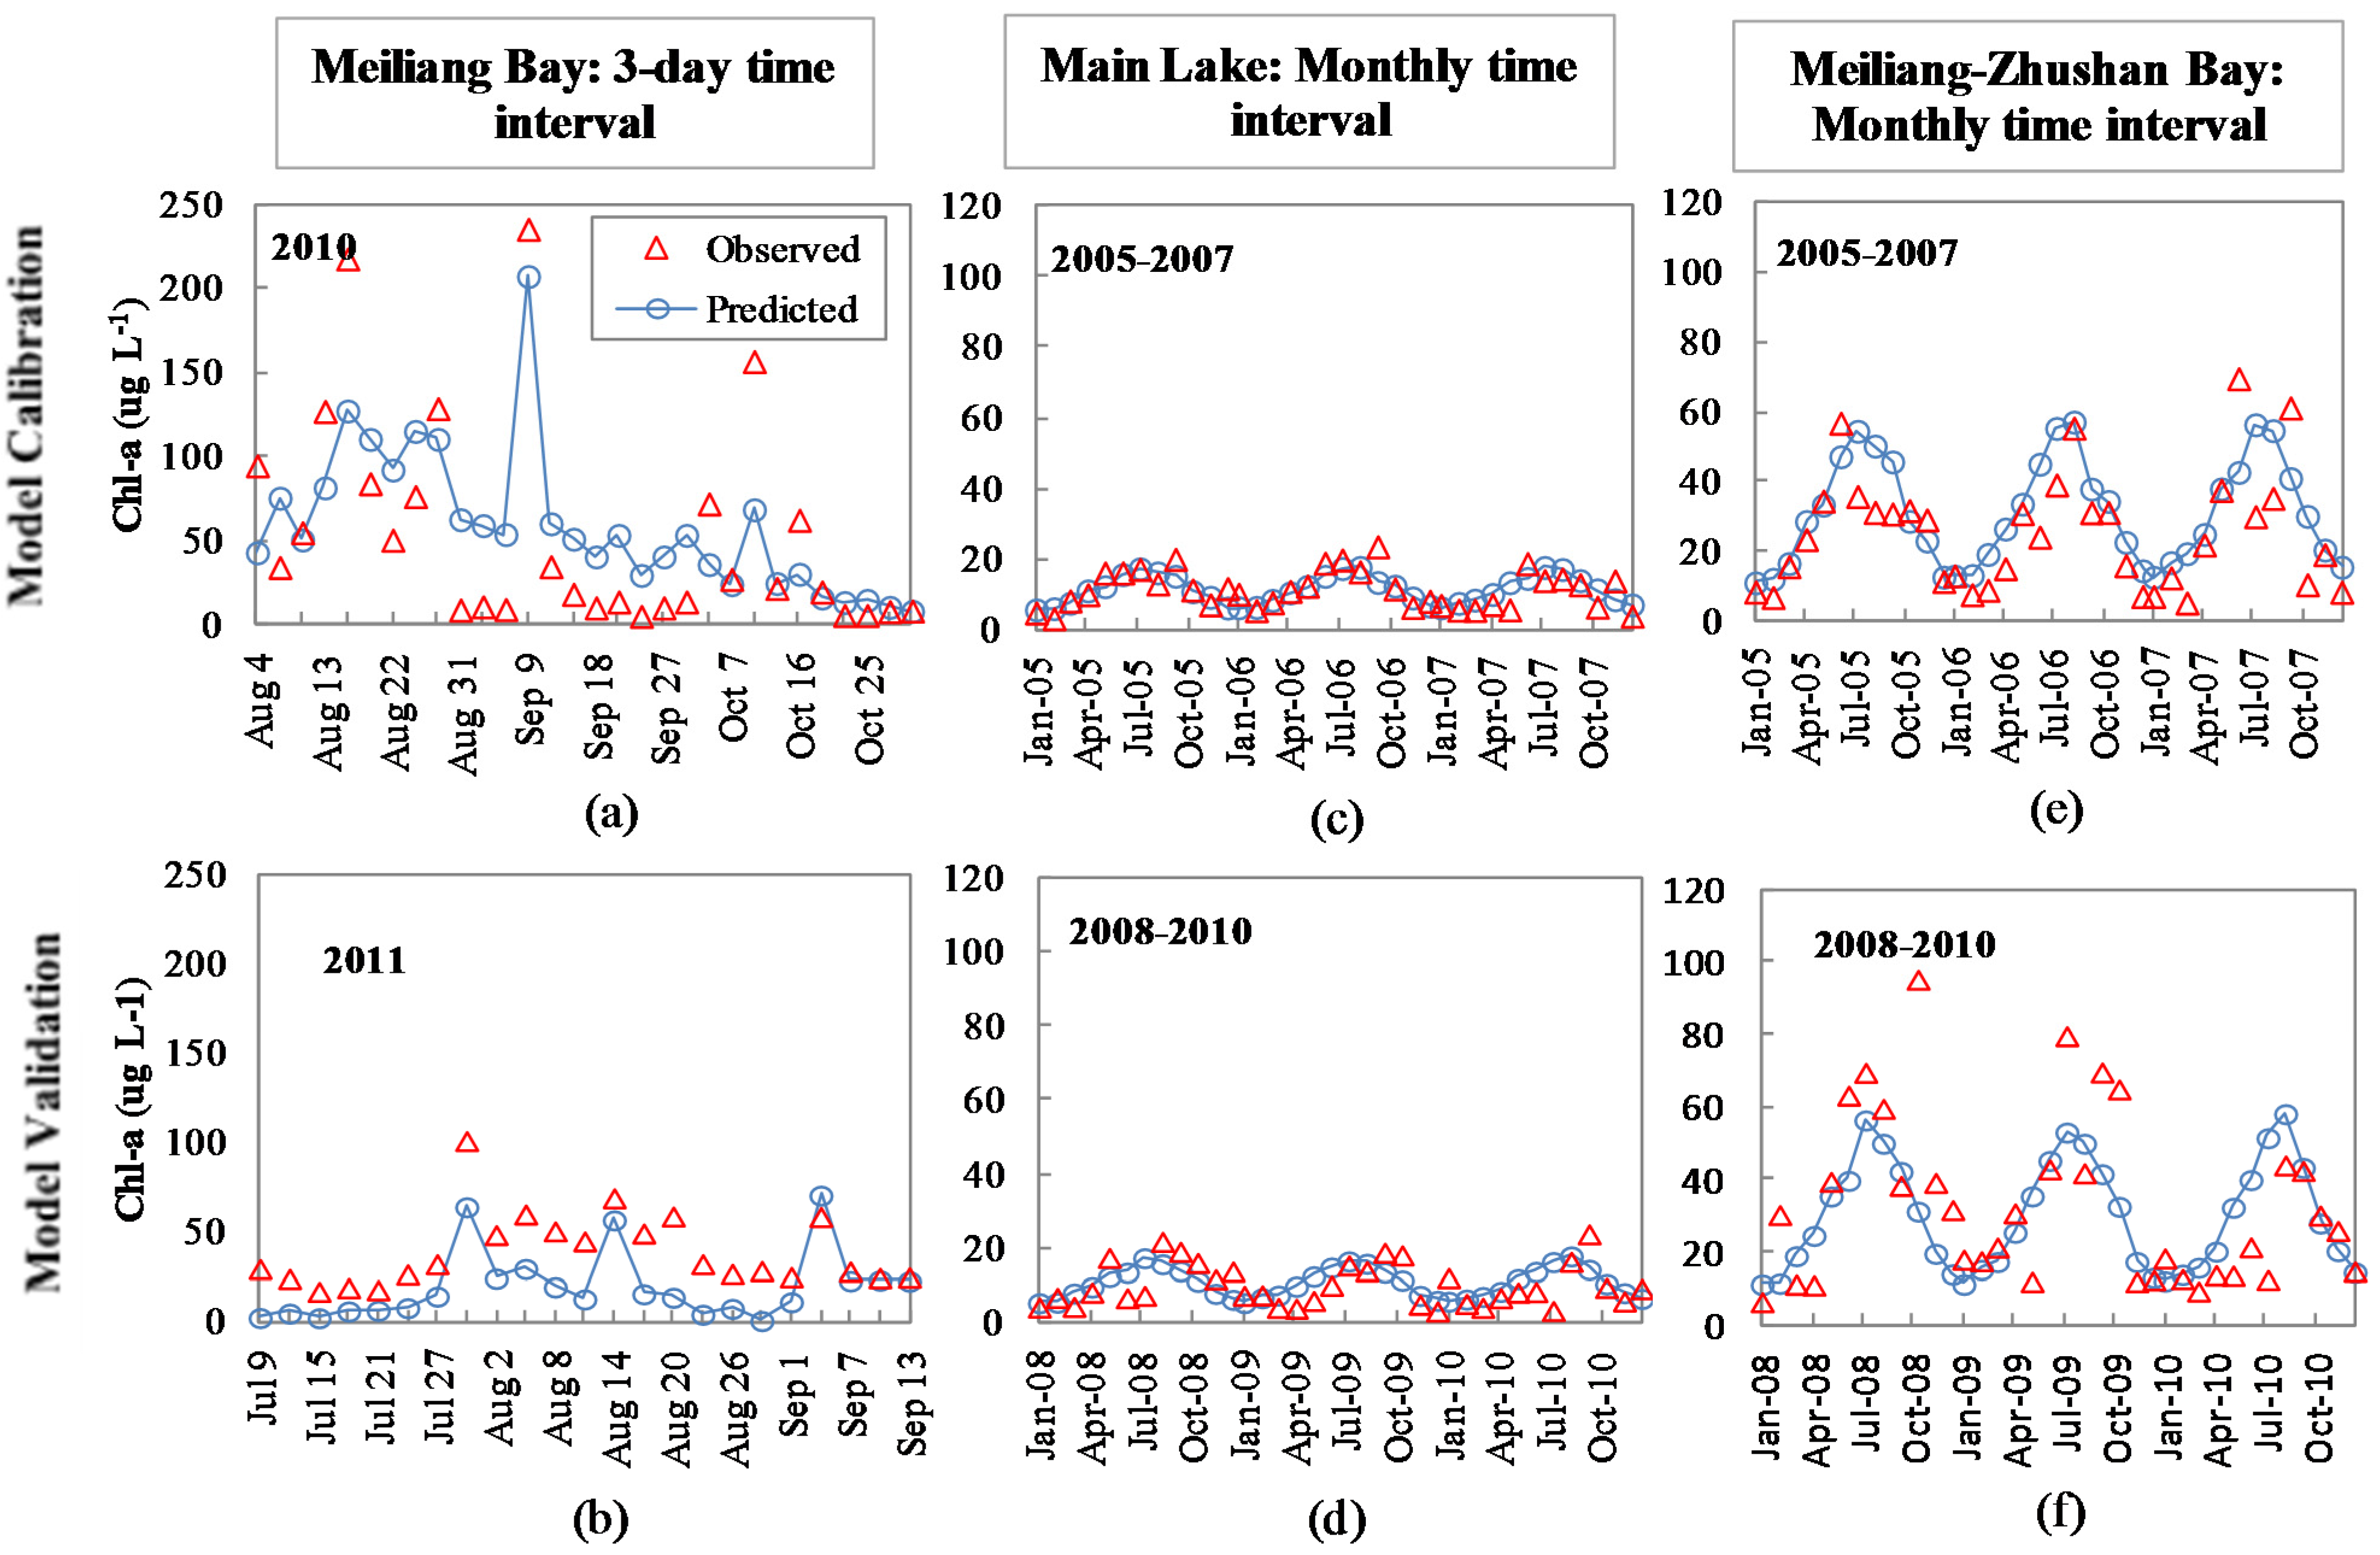
2.3.3. Approach Used for Model Evaluation

In order to investigate the sensitivity of a, b, and k to time scale, one modified Monod model for Meiliang Bay was parameterized using the three-day data for 2010 and two modified Monod models, one for Meiliang-Zhushan Bay and another for Main Lake, were parameterized using the monthly data for a three-year period of 2005 to 2007. For each of the three models, the parameterization was implemented for the two schemes mentioned above. Afterwards, the parameter values, determined by the Solver, were analyzed in accordance with the physical meanings of the parameters and compared with those in literature to verify the reasonability of the values. The models with the most reasonable parameter values (i.e., the calibrated models) were then used to reproduce the three-day time series of 2011 for Meiliang Bay and the monthly time series of the three-year period from 2008 to 2010 for Meiliang-Zhushan Bay and Main Lake. The predicted results were then compared with the observed values to validate the models.
For both calibration and validation, in addition to plots showing predicted versus observed Chl-a concentration, three common statistics, root mean square error (RMSE) [22], Akaike Information Criterion (AIC) [24], coefficient of determination (R2) [22], were also used to assess performance of the models.
RMSE is computed as:
RMSE = i = 1 n [ C ( Chl a ) o , i C ( Chl a ) s , i ] 2 n 1
where C(Chl-a)o,i is the observed concentration of Chl-a at time i (ug·L−1); C(Chl-a)s,i is the predicted concentration of Chl-a at time i (ug·L−1); and n is the number of points in the time series used for model calibration or validation.
AIC is computed as:
AIC = ( 2 K 2 L ) / n
where K is the number of model parameters; and L is the Log-likelihood function.
L can be approximated as:
L = ( n 2 ) · [ ln ( 2 π ) + ln ( RSS n ) + 1 ]
where RSS = (n−1) · (RMSE)2 is the residual sum of squares.
A model with a smaller value of RMSE or AIC was judged to have a relative better performance than a model with a corresponding larger value. The absolute model performance was not the focus of this study and thus the absolute values of RMSE and AIC were not assessed. R2 measures the goodness of fit of a model. R2 can range from zero to one, with a larger value indicating a more accurate fit and thus a better model performance.

3. Results

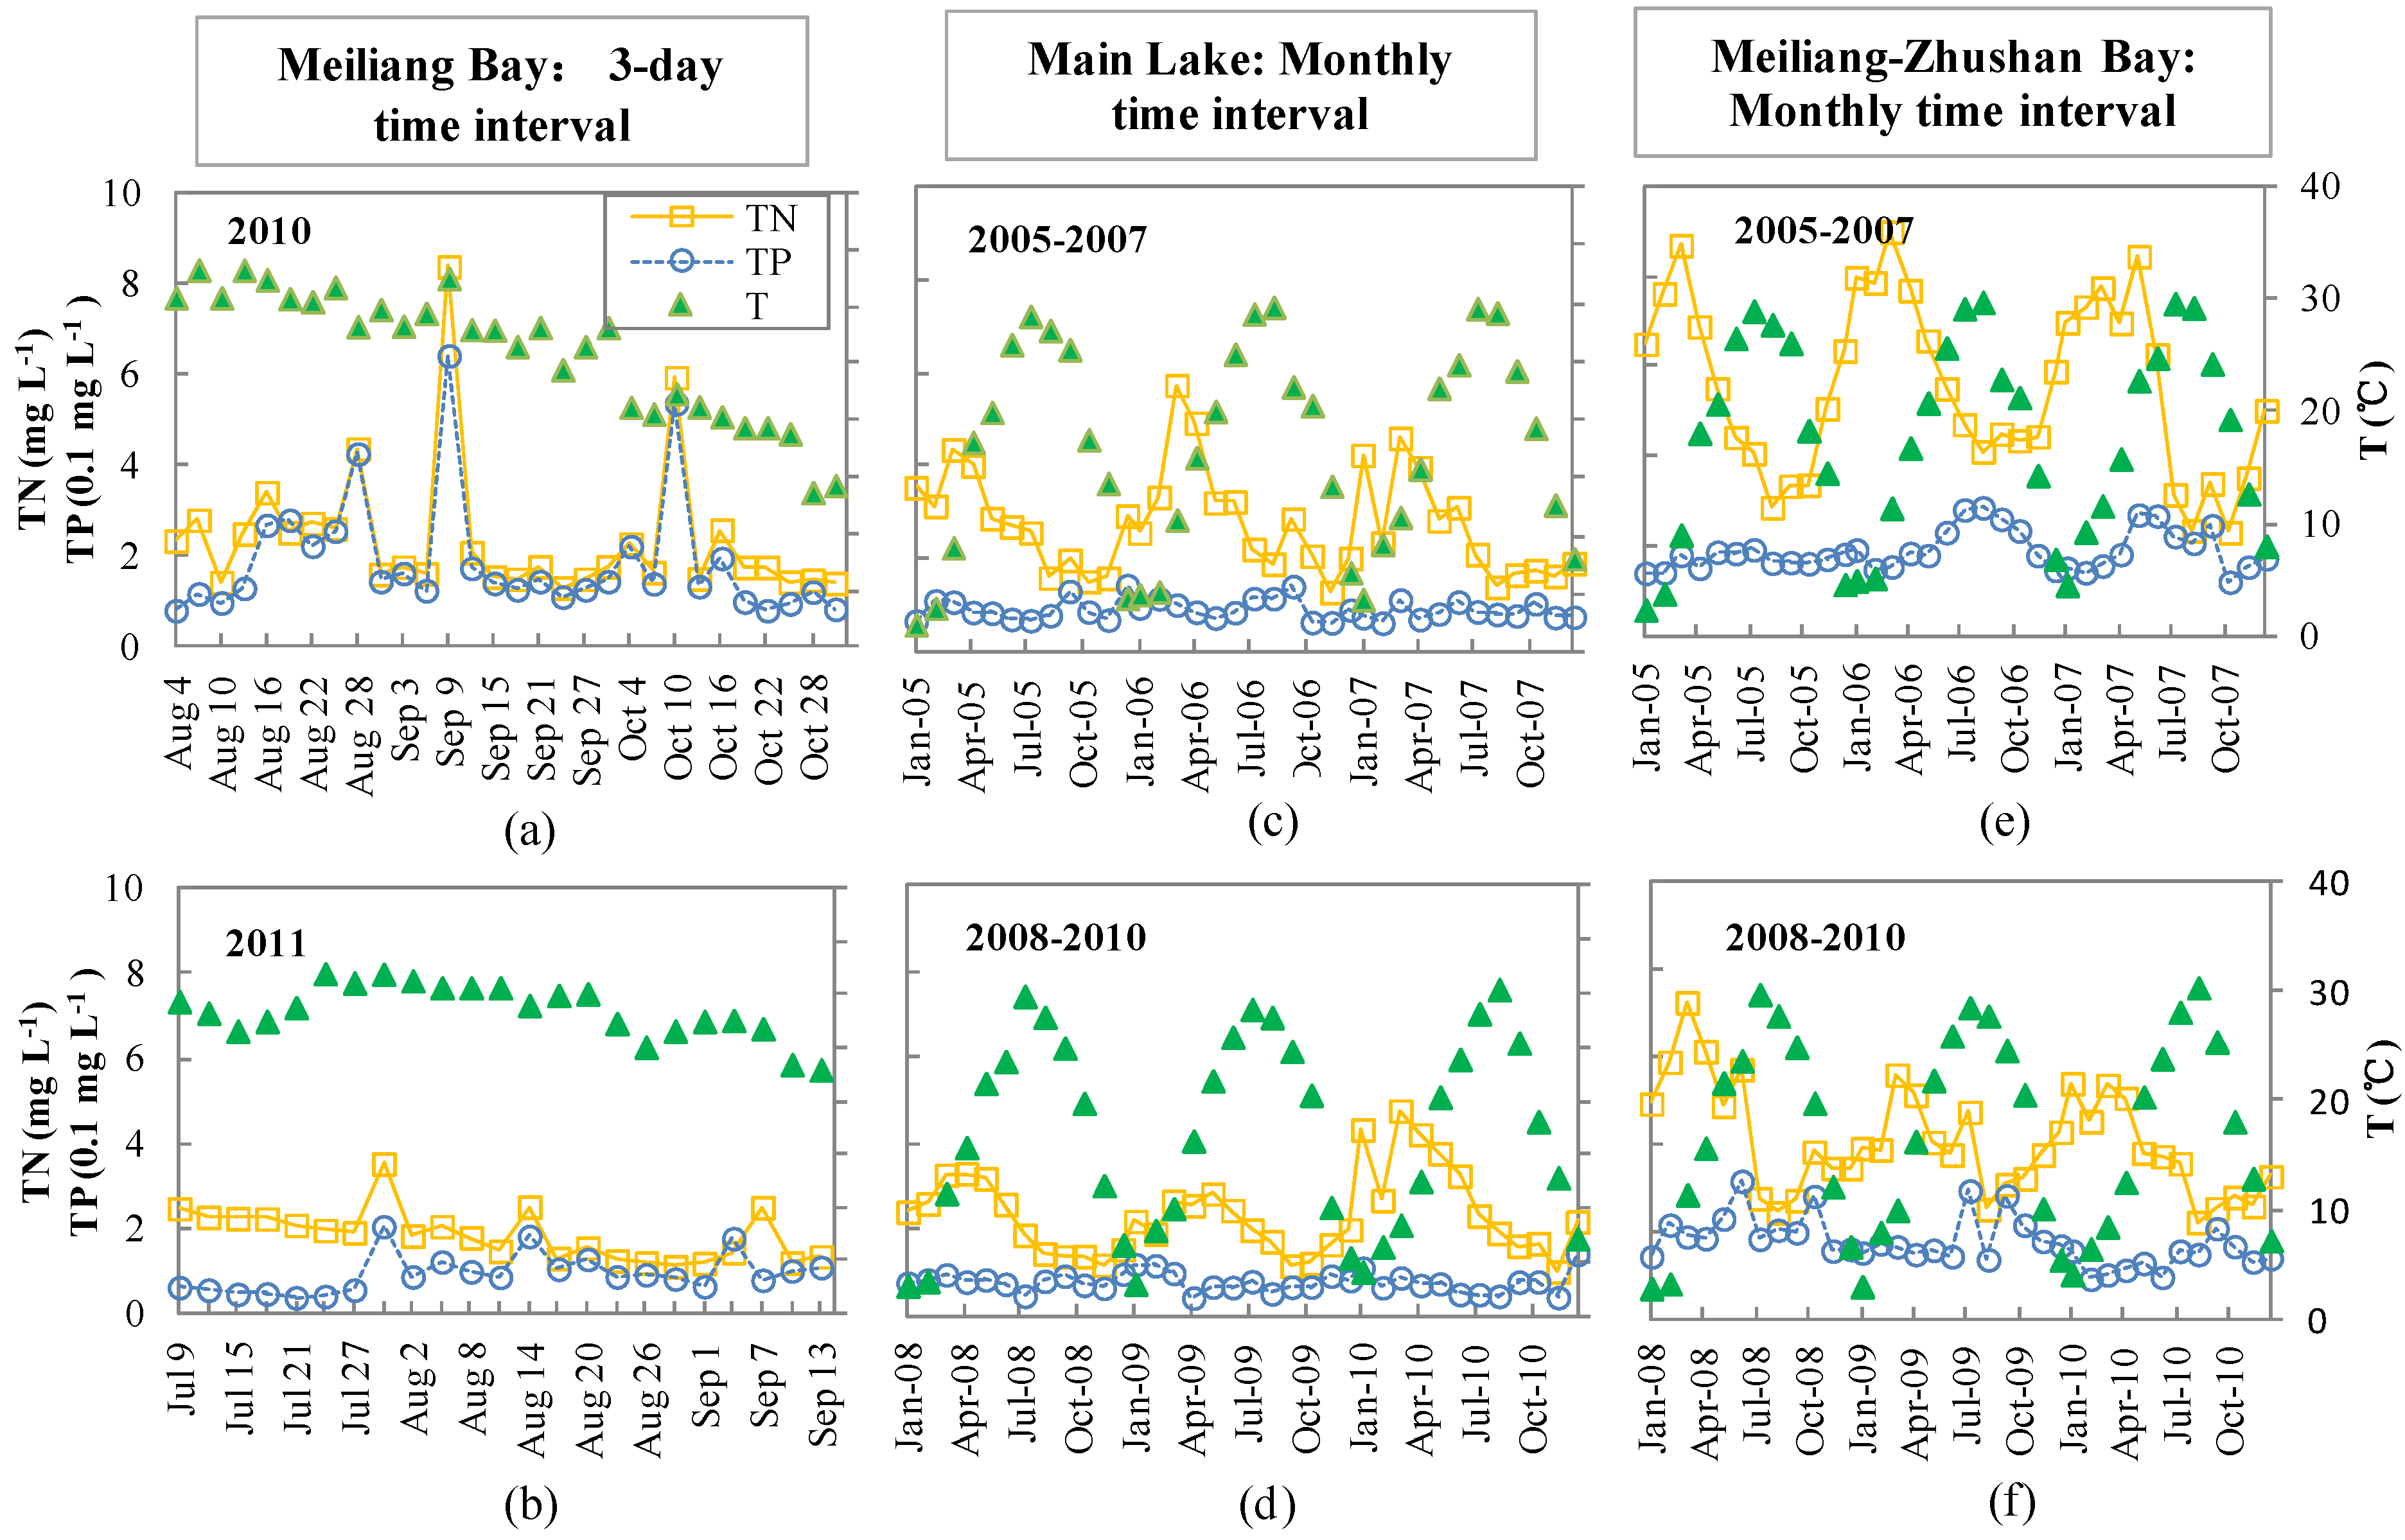
3.1. Observed Temporal Variations of Nutrients and Temperature

Based on the available data, for the three-day time interval, the fluctuations in the values of TN and TP in 2010 were greater than those in 2011 (Figure 2a,b). In 2010, the highest concentrations of TN (8.4 mg·L−1) and TP (0.6 mg·L−1) were recorded on 9 September, whereas, in 2011, the much smaller highest concentrations of TN (3.5 mg·L−1) and TP (0.2 mg·L−1) occurred on 30 July. In both years, the fluctuations in the TN and TP concentrations were synchronized, with peaks and troughs occurring at the same times. In contrast, at the monthly time interval, the fluctuations in the TN and TP concentrations exhibited pseudo-cyclic patterns with distinctively different periods and amplitudes (Figure 2c–f) for Main Lake and Meiliang-Zhushan Bay, indicating that the temporal variations of the recorded nutrient levels were likely independent of observation locations across Lake Tai. This implies that model performance might be independent of locations at which data were collected. Moreover, on a given day, the three-day water temperatures were reasonably comparable with the ambient air temperatures observed at the corresponding monthly time interval (Figure 2). This confirms that for Lake Tai, air temperature can be a good surrogate for water temperature and these two types of temperatures are probably identical in magnitude. Based on these results, this study did not differentiate air temperature from water temperature in evaluating performance of the models.
Figure 2. Temporal variations of nutrients (total nitrogen (TN), and total phosphorus (TP)), water temperature (WT) and ambient air temperature (AT): (a,b) Meiliang Bay, three-day measurement intervals; (c,d) main lake, monthly measurement intervals; and (e,f) Meiliang-Zhushan Bay, monthly measurement intervals. WT is shown in (a,b), and AT in (c) through (f) and designated T in both.
Water 07 03626 g002
As with the TN and TP concentrations, the three-day Chl-a concentration was found to have a larger temporal variation and a greater peak value in 2010 than in 2011, while the monthly Chl-a concentration exhibited pseudo-cyclic patterns with distinctly different periods and amplitudes (Figure 3 and Figure 4). The peak Chl-a concentration (235 ug·L−1) in 2010 was much higher than the peak Chl-a concentration (71 ug·L−1) in 2011. Overall, the variation and magnitude of the Chl-a concentrations were greater in Meiliang-Zhushan Bay than in Main Lake.
Figure 3. Observed and predicted Chlorophyll a (Chl-a) concentrations for: (a,b) Meiliang Bay, three-day measurement intervals; (c,d) main lake, monthly measurement intervals; and (e,f) Meiliang-Zhushan Bay, monthly measurement intervals. The independent variables here are total nitrogen (TN) and temperature.
Water 07 03626 g003

3.2. Model Parameters

In order to apply the modified Monod model defined in Equation (4), the three parameters a, b, and k must be determined using observed data for Chl-a, TN, TP, and temperature. However, these parameters may have distinctly different values, depending on whether limits are imposed or not. In this study, the root mean square errors (RMSEs) (Equation (5)) with no constraints on the ranges of the parameters were much smaller than the corresponding RMSEs with constraints (Table 1). Parameter b was basically independent of types of nutrients and time series regardless of whether constrains were imposed or not, and was determined to be in the range of 1.05 to 1.11.
Figure 4. Observed and predicted Chlorophyll a (Chl-a) concentrations for: (a,b) Meiliang Bay, three-day measurement intervals; (c,d) main lake, monthly measurement intervals; and (e,f) Meiliang-Zhushan Bay, monthly measurement intervals. The independent variables are total phosphorus (TP) and temperature.
Water 07 03626 g004
Table 1. The modified Monod model parameters determined by minimizing the root mean square errors (RMSEs) and akaike information criterion (AIC) without and with constraints on the ranges of the parameters 1.
Observation LocationMeasurement YearsModelNo ConstraintsWith Constraints
Within Lake Tai 2(Time Interval)Parameter 3TNTPTNTP
Meiliang Bay a2144.23190.7730.8814.07
2010b1.051.071.081.11
(once every three-days )k330.914.047.000.50
RMSE33.5935.6438.0039.08
AIC13.4313.5413.6713.73
Main Lake a6.156.146.155.24
2005–2007b1.051.051.051.04
(once every month)k0.710.720.710.08
RMSE3.403.403.403.49
AIC8.958.958.959.00
Meiliang-Zhushan Bay a10.5610.5610.569.89
2005–2007b1.071.071.071.06
(once every month)k2.542.652.540.08
RMSE10.0610.0610.0612.12
AIC11.1211.1211.1211.49
Notes: 1 TN: total nitrogen; TP: total phosphorus; 2 See Figure 1; 3 See Equation (4) for the definitions of a, b, and k.
For the three-day time interval, the values of parameters a and k with no constraints were much larger than those with constraints, and the values determined using TN as the independent variable were much larger than those determined using TP as the independent variable, regardless of whether constraints were imposed or not. In contrast, at the monthly time interval, parameters a and k were less sensitive to the constraints. This indicates that imposing limits can have a significant effect on parameters a and k, but it may have little influence on parameter b. Because the constraints applied herein were based on the physical meanings and literature values of these parameters, the values of parameters a, b and k determined with the constraints imposed were judged to be more reasonable and were thus adopted for the subsequent analyses.
As expected, when TN versus TP was used as the independent variable, either parameter a or k was determined to have distinctly different values, with the values obtained using TN larger than those using TP (Table 1). For given types of nutrients, the values of parameters a and k for the three-day time interval were larger than the corresponding values for the monthly time interval. This indicates that these two parameters can have distinctly different values when the modified Monod model is used for shorter versus longer time intervals. However, parameter b was not sensitive to the time interval used.

3.3. Model Performance with TN Versus TP as the Independent Variable

In terms of the values of RMSE and AIC (Table 2), the performance of the model with TN as the independent variable (hereinafter designated the TN-MonodModel) was comparable to that of the model with TP as the independent variable (hereinafter designated the TP-MonodModel). However, the TP-MonodModel did a better job in reproducing the observed Chl-a concentration than the TN-MonodModel, as indicated by that the values of RMSE and AIC were smaller for the TP-MonodModel than for the TN-MonodModel (Figure 4). Interestingly, both models performed better in reproducing the observed monthly than three-day Chl-a concentration (Figure 3 and Figure 4), indicating that the modified Monod model may suffer from some limitations when capturing Chl-a variations for a time interval shorter than month.
Table 2. Validated parameters, root mean square error (RMSE) and akaike information criterion (AIC) values fitted to the modified Monod model for selected datasets 1.
Time SeriesTN as an Independent VariableTP as an Independent Variable
ModelRMSEAICModelRMSEAIC
Meiliang Bay 2011 (three-day)Cchl-a = 30.88 × 1.08WT × TN/(7.00 + TN)44.5110.50Cchl-a = 14.07 × 1.11WT × TP/(0.5 + TP)24.159.56
Main Lake 2008–2010 (monthly)Cchl-a = 6.15 × 1.05AT × TN/(0.71 + TN)5.639.96Cchl-a=5.24 × 1.04AT × TP/(0.08 + TP)5.159.78
Meiliang-Zhushan Bay 2008–2010 (monthly)Cchl-a = 10.56 × 1.07AT × TN/(2.54 + TN)21.2212.61Cchl-a = 9.89 × 1.06AT × TP/(0.08 + TP)18.5912.34
Notes: 1 Cchl-a (ug·L−1): chlorophyll-a concentration; TN (mg·L−1): total nitrogen concentration; TP (mg·L−1): total phosphorus concentration; AT (°C): air temperature; WT (°C): water temperature.
As expected, both models had a better performance for the calibration than validation period (Table 1 and Table 2; Figure 3 and Figure 4): the values of RMSE ranging from 3.4 to 39.1 for the calibration period while from 5.1 to 44.5 for the validation period. In addition, the observed Chl-a concentration for the calibration period was more accurately reproduced than that for the validation period regardless of the time interval. Further, the models did a better job for Main Lake than for Meiliang-Zhushan Bay (Figure 3c–f and Figure 4c–f).

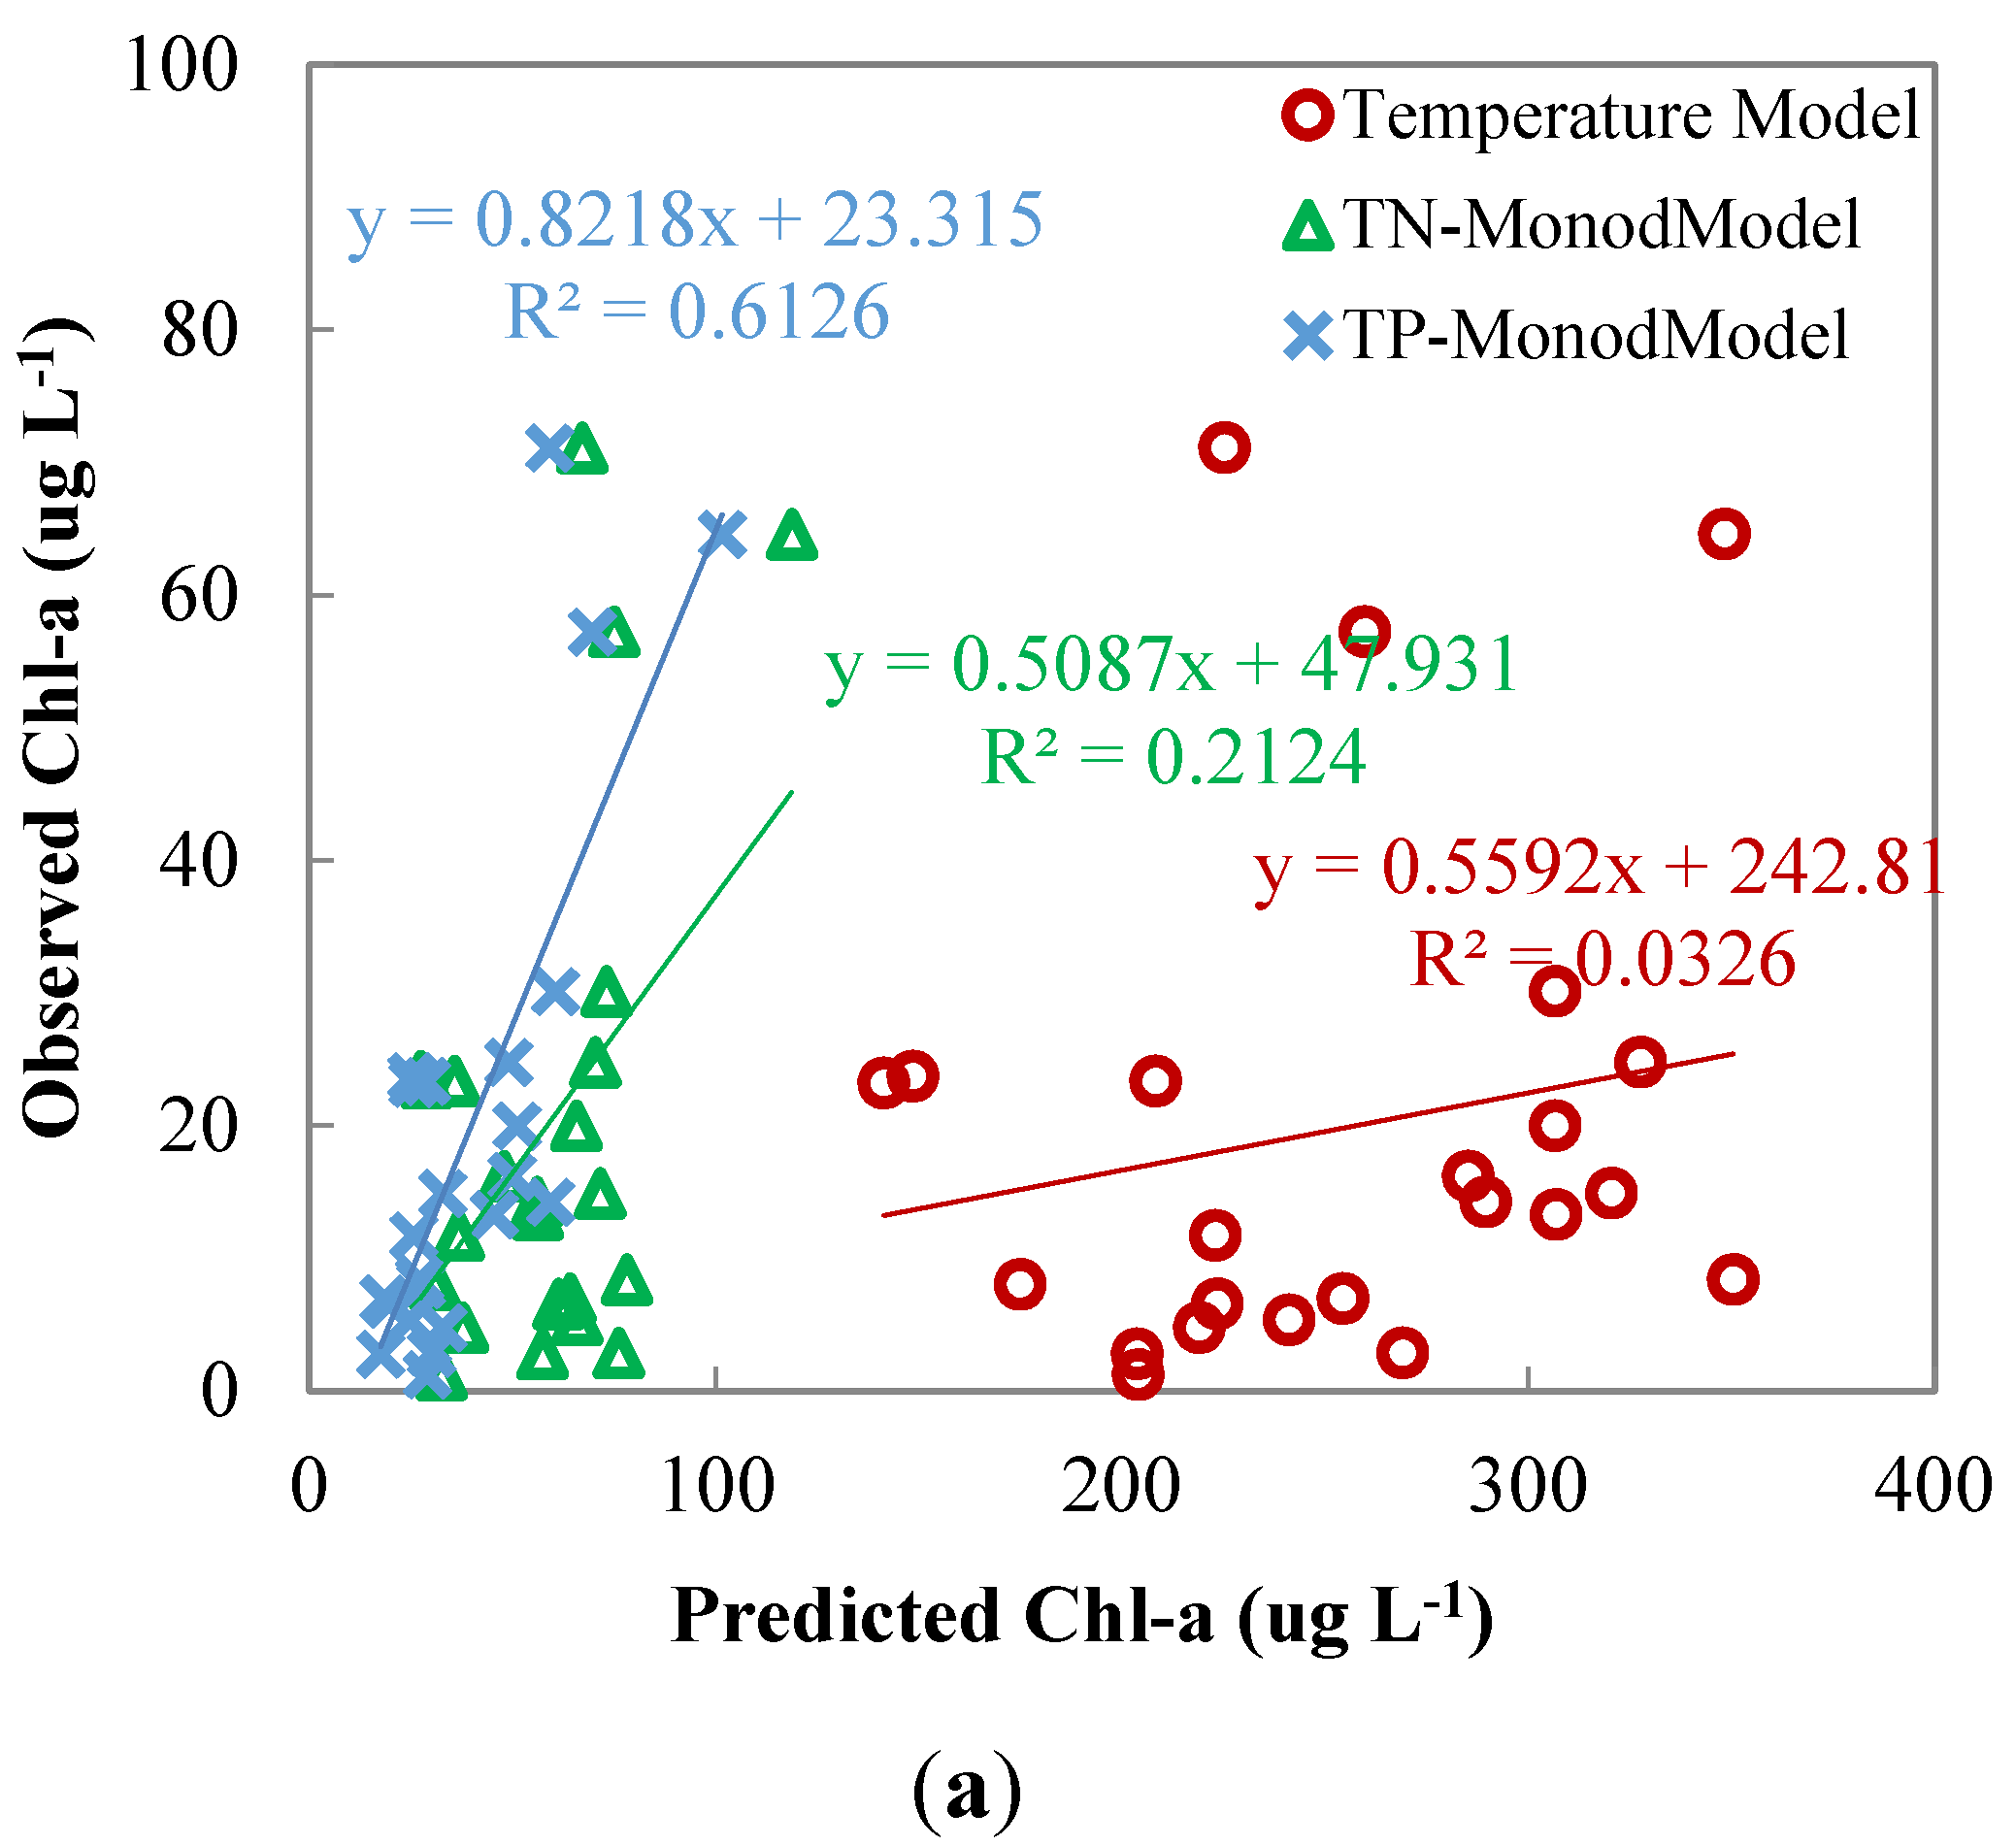
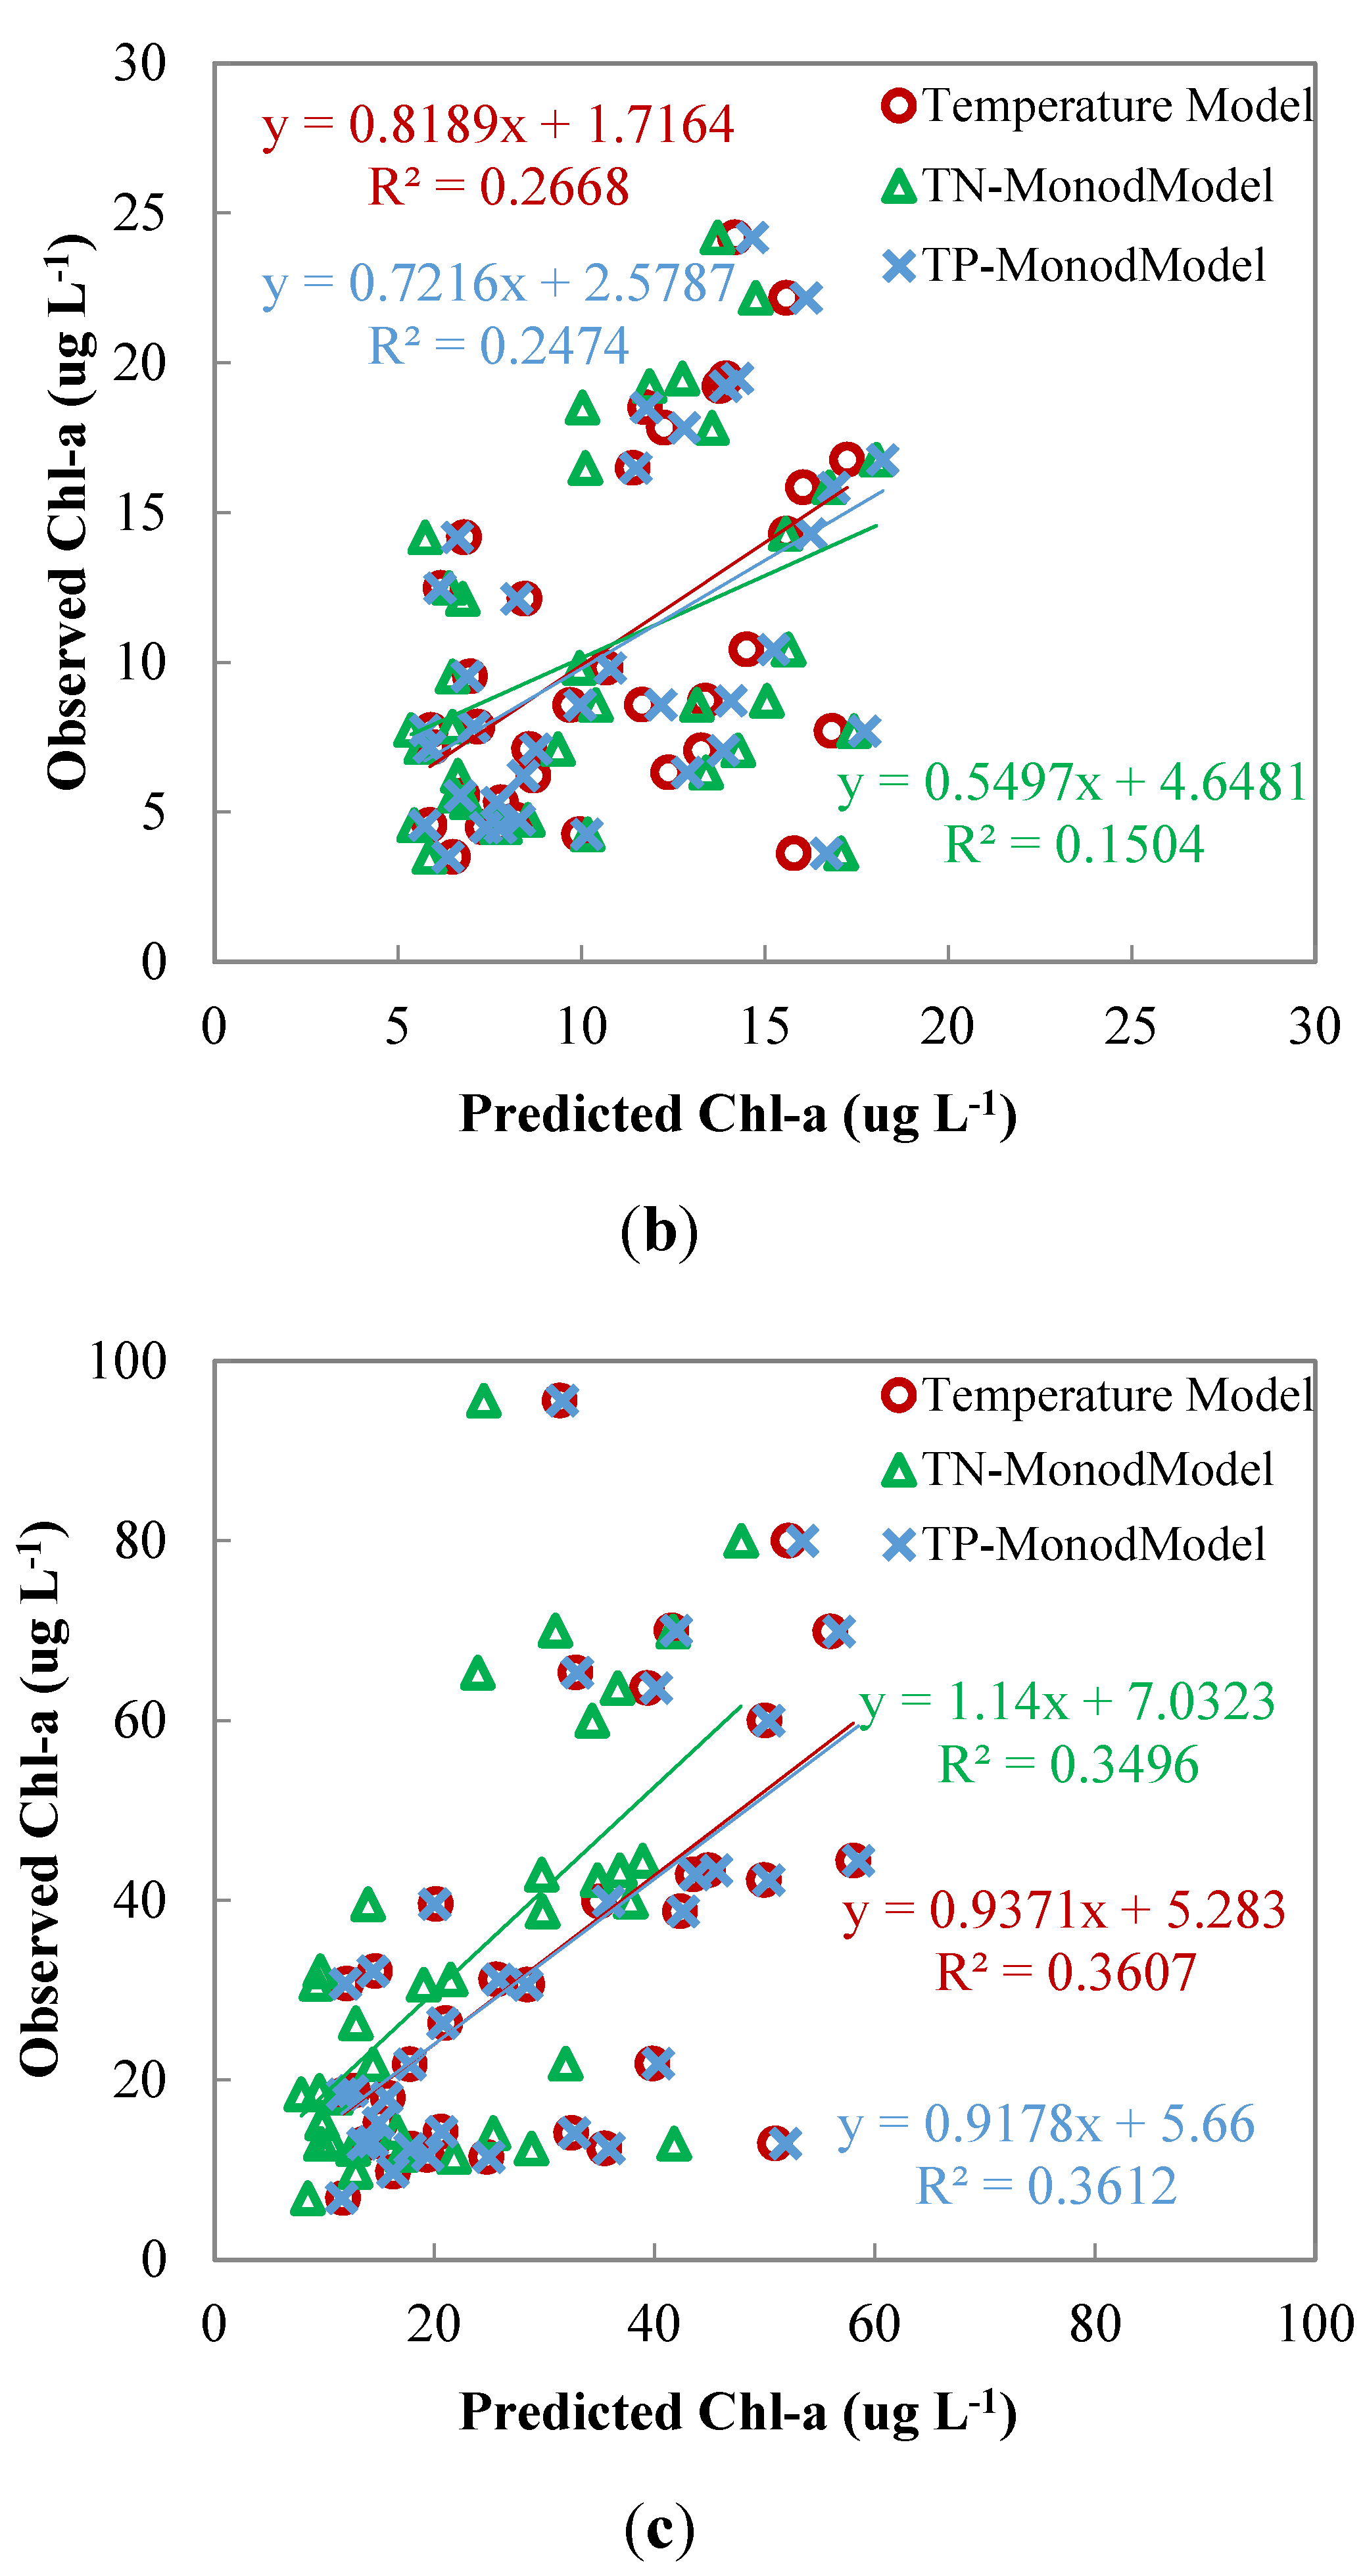
3.4. Control Variables of Chl-a

At the three-day time interval, nutrients (TN and TP) had a greater influence on algal growth than temperature, as indicated by the fact that the temporal variations in TN and TP concentrations were similar with, but the temporal variation in temperature was different from, that of the Chl-a concentration (Figure 2a,b, Figure 3a,b, and Figure 4a,b). The TN and TP concentrations varied synchronically with the Chl-a concentration, with peak concentrations occurring at the same time. For example, for the calibration period, TN and TP reached their highest concentrations of 8.4 and 0.6 mg·L−1 on 9 September 2010, when Chl-a also reached its highest concentration of 235 ug·L−1. Similarly, for the validation period, TN and TP reached their highest concentrations of 3.5 and 0.2 mg·L−1 on 30 July 2011, when once again Chl-a reached its highest concentration of 64.58 ug·L−1. In addition, Chl-a was more sensitive to TP than TN, as indicated by that the TP-MonodModel had smaller values of RMSE and AIC than the TN-MonodModel, regardless of the time intervals (Table 2). A model with temperature as the only independent variable (hereinafter designated as temperature model for description purposes) was also assessed, and it was found that this model (AIC = 13.12; R2 = 0.33) had a worse performance than the TN-MonodModel (AIC = 10.50; R2 = 0.21) and the TP-MonodModel (AIC = 9.56; R2 = 0.61) (Figure 5a).
Figure 5. Observed and predicted Chlorophyll a (Chl-a) concentrations for the validation periods by the modified Monod model with temperature as the sole independent variable (referred to as the temperature model), the modified Monod model with temperature and total nitrogen (TN) as independent variables (referred to as TN-MonodModel), and the modified Monod model with temperature and total phosphorus as independent variables (referred to as TP-MonodModel) for: (a) Meiliang Bay at the three-day measurement interval in 2011; (b) Main Lake at the monthly measurement interval from 2008 to 2010; and (c) Meiliang-Zhushan Bay at the monthly measurement interval from 2008 to 2010.
Water 07 03626 g005aWater 07 03626 g005b
In contrast, for the monthly time interval, temperature had a greater influence on algal growth than either TN or TP (Figure 2c–f, Figure 3c–f, and Figure 4c–f). For both the calibration and validation period, temperature and Chl-a varied synchronically: increasing from January to June and then decreasing from July to December, which means that TN and TP concentrations had a minimal effect on Chl-a concentration. This is verified by the fact that the temperature model had a comparable performance with the TN-MonodModel and TP-MonodModel, as indicated by the close values AIC and R2 (Figure 5b,c). For Main Lake, the AIC values for the temperature model, TN-MonodModel, and TP-MonodModel are 9.70, 9.96, and 9.78, respectively, while for Meiliang-Zhushan Bay, the AIC values are 12.35, 12.61, and 12.34, respectively. Therefore, the TN-MonodModel and TP-MonodModel were judged to have a relative better performance than the temperature model, as indicated by the values of R2.

4. Discussion

For the three-day time interval, the values for parameters a and k with no constraints are much larger than those where constraints were imposed. This is probably because the three-day data might not include the ideal conditions under which a and k are defined: a is the maximum concentration of Chl-a at an optimal temperature while k is the half saturation coefficient. When not constrained, these two parameters were likely determined by extrapolating the conditions presented by the data, which could cause very large unknown uncertainties. In contrast, for the monthly time interval, the values of a and k without constraints are comparable to the corresponding values with constraints. One possible reason is that the monthly data might include conditions that are similar to the ideal condition for a and k, and thus these two parameters were determined by interpolations, making uncertainties much smaller. Hence, although the RMSEs without constraints are much smaller than those with constraints, the values for a and k with constraints were judged to be more meaningful, which is further verified by the fact that the values are compatible with the ones reported by Ye et al. [14] for Lake Tai. Unlike a and k, parameter b, an activation energy dependent constant, is almost independent of types of nutrients and time intervals, regardless of whether constraints were imposed or not. In this study, b was determined to be between 1.05 and 1.11, which is again compatible with the value reported by Ye et al. [14]. This may be because the data included the possible variation ranges of temperature and thus no extrapolation was needed to determine b.
Based on Cross et al. [25], nutrient availability and temperature play key roles in controlling the pathways and rates at which energy and materials move through ecosystems, and these two factors interactively affect the acquisition, storage, and cycling of energy and materials at organizational levels ranging from individuals to whole ecosystems. In the modified Monod model (Equation (4)), a and k reflect linear and nonlinear temperature-nutrient interactions, respectively, and thus either of these two parameters has distinctly different values for different time intervals (i.e., three-day versus monthly) and sites (i.e., Main Lake versus Meiliang Bay versus Meiliang-Zhushan Bay) of Lake Tai (Table 1) because of the different paired values of temperature and TP or TN concentration (Figure 2). In contrast, parameter b reflects temperature only and thus is nearly constant. Thus, it is important to take into account temperature-nutrient interactions in the modified Monod model, as evidenced by the better performance of the TN-MonodModel and TP-MonodModel than the temperature model.
The models did a better job in reproducing the monthly than three-day Chl-a concentration. This is probably because the three-day concentration had a larger temporal fluctuation and because the temperature-nutrient interactions could not be well mimicked by the model. For such a short time interval, the algal growth is likely to be more strongly influenced by the available nutrients and energy from previous times than by those of the current time of interest, whereas for the monthly time interval, the Chl-a concentration in a given month may closely depend on the available nutrients and energy in that month. Ye et al. [14] also found that the modified Monod model had a better performance in reproducing annual Chl-a concentration.
The models did a better job for Main Lake than for Meiliang-Zhushan Bay. The Chl-a concentrations in Meiliang-Zhushan Bay were noticeably higher and had much larger temporal fluctuations (Figure 2, Figure 3 and Figure 4). It is likely that the models suffer from some limitations in tracking the rapid growth and dying off of algae as well as strong temperature-nutrient interactions.
Nitrogen and phosphorus levels often limit phytoplankton growth in Lake Tai. Over the past three decades, it has been changed from a shallow/hyper-eutrophic to a bloom-free/bloom-plagued lake [16]. Ye et al. [14] found that a Monod model with TN concentration as the independent variable had a better performance than a model with TP concentration as the independent variable. This is not supported by our study, however. Our study showed that the TP-MonodModel has a better performance than the TN-MonodModel regardless of time interval (Figure 3 and Figure 4). This inconsistency can be attributed to the distinctly different lake conditions (e.g., TN and TP concentrations) [26,27,28,29]. Xu et al. [30] found that the threshold concentrations of TN and TP for harmful cyanobacterial blooms in Lake Tai are 0.8 mg·L−1 and 50 μg·L−1, respectively. For our two modeling years of 2010 and 2011, TN concentration was always higher than the TN threshold, whereas TP concentration was often lower than the TP threshold (Figure 2). In consequence, phosphorus might become a limiting nutrient for phytoplankton growth in those two years, leading to a sensitive response of Chl-a concentration to TP fluctuation. Nitrogen, on the other hand, was always plentiful for phytoplankton growth and thus TN fluctuation might have no acute effects on Chl-a concentration. Nevertheless, because of the above-threshold TN concentration, on a day or in a month when the temperature was relatively high, the Chl-a concentration could be much higher than the “acceptable” sub-bloom level of 20 μg·L−1 for Meiliang and Meiliang-Zhushan Bays, whereas on a day or in a month when the temperature was relatively low, the Chl-a concentration might become lower than the sub-bloom level for those two bays (Figure 3 versus Figure 2). For Main Lake, Chl-a concentration tended to be lower than the sub-bloom level in the two modeling years regardless of temperature.
Besides temperature, TN, and TP, other factors, such as nitrogen-to-phosphorus ratio [31], anoxia and ferrous iron [32], and climate change [33,34], have been found to affect cyanobacterial dynamics/blooms in lakes. However, limited by data availability, our study could not evaluate prediction performance of the modified Monod model when either of those other factors is used as independent variable s in Equation (4). In the future, in addition to assessing effects of one factor or two at a time and full temperature-nutrient interactions, new variables that can reflect interactive effects of multiple factors may be introduced into Equation (4) to further improve the Monod model while maintaining its simplicity. This can be done by assembling existing results of various previous studies, including the ones cited hereinabove. Nevertheless, as with any types of modeling efforts, a big challenge would be the lack of long-term synchronic data on multiple factors and algal growth for sufficient numbers of representative lakes.

5. Conclusions

This study evaluated the performance of a modified Monod model in predicting algal dynamics at various time scales using multiple sets of time series. The results revealed that the sensitivity of the model parameters closely depended on whether constraints were imposed or not, time scales, and types of nutrients. The values of parameters a and k without constraints were much larger than those with constraints for the three-day time interval, but such discrepancies became minimal for the monthly time interval. In contrast, parameter b was almost independent of types of nutrients and time intervals, regardless of whether constraints were imposed or not. The results indicated that model performance also depended on time intervals as well as magnitudes and temporal fluctuations of Chl-a and TN or TP concentrations, achieving a better performance for the monthly than three-day Chl-a concentration and for Main Lake than Meiliang-Zhushan Bay. The model with TP as the independent variable (i.e., TP-MonodModel) had a better performance than the model with TN as the independent variable (i.e., TN-MonodModel), regardless of time interval. The temperature-nutrient interactions were important for algal growth when the temporal fluctuations of these two factors were large, while the interactions could become minimal otherwise. It is desired that future modeling efforts can also consider more factors (e.g., nitrogen-to-phosphorus ratio and dissolved oxygen content) and factor-to-factor interactions if data are available, maintaining the simplicity of the modified Monod model defined by Equation (4).

Acknowledgments

This study was financially supported by: (1) The Natural Science Foundation of China (NSFC)’s project on The Effect of Hydrology and Hydrodynamics on Eutrophication in Chinese Shallow Lakes (41473110); (2) The Water Pollution Control and Management of Major Projects (WPCMMP) Committee of China (2012ZX07101-002); and (3) the Integrated Technology for Water Pollution Control and Remediation at Watershed Scale and its Benefit Assessment (2014ZX07510-001). The China Scholarship Council (CSC) provided the primary author (Huang) with a scholarship to support a joint Ph.D. studentship at Old Dominion University, Norfolk, Virginia, USA. We would like to thank our colleagues at the Chinese Research Academy of Environment Sciences (CRAES) Groundwater and Environmental Systems Engineering Innovation Base (GESEIB) for providing data. We are also grateful for the thoughtful comments provided by the editors and anonymous reviewers.

Author Contributions

All authors made substantial contributions to data acquisition, model development and evaluation, and interpretation of the results. In addition, all authors participated in drafting and revising the article. Further, all authors gave their approval of the version submitted for publication.

Conflicts of Interest

All authors declare no conflicts of interest. The funding agencies played no roles in design of the study, data collection and analyses, model development and evaluation, interpretation of the results, and writing/revising of the article.

References

  1. Hudnell, H.K. The state of U.S. freshwater harmful algal blooms assessments, policy and legislation. Toxicon 2010, 55, 1024–1034. [Google Scholar] [CrossRef] [PubMed]
  2. Carey, C.C.; Ibelings, B.W.; Hoffmann, E.P.; Hamilton, D.P.; Brookes, J.D. Eco-Physiological adaptations that favour freshwater cyanobacteria in a changing climate. Water Res. 2012, 46, 1394–1407. [Google Scholar] [CrossRef] [PubMed]
  3. Davis, T.W.; Berry, D.B.; Boyer, G.L.; Gobler, C.J. The effects of temperature and nutrients on the growth and dynamics of toxic and non-toxic strains of Microcystis during cyanobacteria blooms. Harmful Algae 2009, 8, 715–725. [Google Scholar] [CrossRef]
  4. Jones, M.L.; Shuter, B.J.; Zhao, Y.M.; Stockwell, J.D. Forecasting effects of climate change on Great Lakes fisheries: Models that link habitat supply to population dynamics can help. Can. J. Fish. Aquat. Sci. 2006, 63, 457–468. [Google Scholar] [CrossRef]
  5. Bergström, A. The use of TN:TP and DIN:TP ratios as indicators for phytoplankton nutrient limitation in oligotrophic lakes affected by N deposition. Aquat. Sci. 2010, 72, 277–281. [Google Scholar] [CrossRef]
  6. Carlson, R.E. A trophic state index for lakes. Limnol. Oceanogr. 1977, 22, 361–369. [Google Scholar] [CrossRef]
  7. Søndergaard, M.; Jeppesen, E.; Lauridsen, T.L.; Skov, C.; Van Nes, E.H.; Roijackers, R.; Lammens, E.; Portielje, R.O.B. Lake restoration: Successes, failures and long-term effects. J. Appl. Ecol. 2007, 44, 1095–1105. [Google Scholar] [CrossRef]
  8. Huang, J.; Gao, J.; Hörmann, G. Hydrodynamic-phytoplankton model for short-term forecasts of phytoplankton in Lake Taihu, China. Limnol. Ecol. Manag. Inland Waters 2012, 42, 7–18. [Google Scholar] [CrossRef]
  9. Hamilton, D.P.; Schladow, S.G. Prediction of water quality in lakes and reservoirs. Part I. Model description. Ecol. Model. 1997, 96, 91–110. [Google Scholar] [CrossRef]
  10. Arhonditsis, G.B.; Brett, M.T. Eutrophication model for Lake Washington (USA): Part I. Model description and sensitivity analysis. Ecol. Model. 2005, 187, 140–178. [Google Scholar] [CrossRef]
  11. Jørgensen, S.E. A review of recent developments in lake modeling. Ecol. Model. 2010, 221, 689–692. [Google Scholar] [CrossRef]
  12. Kayombo, S.; Mbwette, T.S.A.; Katima, J.H.Y.; Jorgensen, S.E. Effects of substrate concentrations on the growth of heterotrophic bacteria and algae in secondary facultative ponds. Water Res. 2003, 37, 2937–2943. [Google Scholar] [CrossRef]
  13. Pei, H.; Ma, J. Study on the algal dynamic model for West Lake, Hangzhou. Ecol. Model. 2002, 148, 67–77. [Google Scholar]
  14. Ye, C.; Shen, Z.; Zhang, T.; Fan, M.; Lei, Y.; Zhang, J. Long-Term joint effect of nutrients and temperature increase on algal growth in Lake Taihu, China. J. Environ. Sci. 2011, 23, 222–227. [Google Scholar] [CrossRef]
  15. Siswanto, E.; Ishizaka, J.; Tripathy, S.C.; Miyamura, K. Detection of harmful algal blooms of Karenia mikimotoi using MODIS measurements: A case study of Seto-Inland Sea, Japan. Remote Sens. Environ. 2013, 129, 185–196. [Google Scholar] [CrossRef]
  16. Paerl, H.W.; Xu, H.; McCarthy, M.J.; Zhu, G.; Qin, B.; Li, Y.; Gardner, W.S. Controlling harmful cyanobacterial blooms in a hyper-eutrophic lake (Lake Taihu, China): The need for a dual nutrient (N &P) management strategy. Water Res. 2011, 45, 1973–1983. [Google Scholar] [PubMed]
  17. Wilhelm, S.W.; Farnsley, S.E.; LeCleir, G.R.; Layton, A.C.; Satchwell, M.F.; DeBruyn, J.M.; Boyer, G.L.; Zhu, G.; Paerl, H.W. The relationships between nutrients, cyanobacterial toxins and the microbial community in Taihu (Lake Tai), China. Harmful Algae 2011, 10, 207–215. [Google Scholar] [CrossRef]
  18. Qin, B.; Zhu, G.; Gao, G.; Zhang, Y.; Li, W.; Paerl, H.W.; Carmichael, W.W. A drinking water crisis in Lake Taihu, China: Linkage to climatic variability and lake management. Environ. Manag. 2010, 45, 105–112. [Google Scholar] [CrossRef] [PubMed]
  19. Huang, C.; Li, Y.; Yang, H.; Sun, D.; Yu, Z.; Zhang, Z.; Chen, X.; Xu, L. Detection of algal bloom and factors influencing its formation in Taihu Lake from 2000 to 2011 by MODIS. Environ. Earth Sci. 2014, 71, 3705–3714. [Google Scholar] [CrossRef]
  20. Xie, L.; Xie, P.; Tang, H. Enhancement of dissolved phosphorus release from sediment to lake water by Microcystis blooms: An enclosure experiment in a hyper-eutrophic, subtropical Chinese lake. Environ. Pollut. 2003, 122, 391–399. [Google Scholar] [CrossRef]
  21. SEPA (State Environmental Protection Administration). Water and Wastewater Monitoring and Analysis Methods, 4th ed.Environmental Science Press: Beijing, China, 2002.
  22. Wang, X.; Yang, X.; Liu, T.; Li, F.; Gao, R.; Duan, L.; Luo, Y. Trend and extreme occurrence of precipitation in a mid-latitude Eurasian steppe watershed at various time scales. Hydrol. Process. 2013, 28, 5547–5560. [Google Scholar] [CrossRef]
  23. Goldman, J.C.; Carpenter, E.J. A kinetic approach to the effect of temperature on algal growth. Limnol. Oceanogr. 1974, 19, 756–766. [Google Scholar] [CrossRef]
  24. Akaike, H. A new look at the statistical model identification. IEEE Trans. Autom. Contrl. 1974, 19, 716–723. [Google Scholar] [CrossRef]
  25. Cross, W.; Hood, J.; Benstead, J.P.; Huryn, A.D.; Nelson, D. Interactions between temperature and nutrients across levels of ecological organization. Glob. Chang. Biol. 2015, 21, 1025–1040. [Google Scholar] [CrossRef] [PubMed]
  26. Capblancq, J. Nutrient dynamics and pelagic food web interactions in oligotrophic and eutrophic environments: An overview. Hydrobiologia 1990, 207, 1–14. [Google Scholar] [CrossRef]
  27. Dokulil, M.; Chen, W.; Cai, Q. Anthropogenic impacts to large lakes in China: The Tai Hu example. Aquat. Ecosyst. Health Manag. 2000, 3, 81–94. [Google Scholar]
  28. Chen, Y.; Fan, C.; Teubner, K.; Dokulil, M. Changes of nutrients and phytoplankton chlorophyll-a in a large shallow lake, Taihu, China: An 8-year investigation. Hydrobiologia 2003, 506–509, 273–279. [Google Scholar] [CrossRef]
  29. Huang, J.; Xu, Q.; Xi, B.; Wang, X.; Jia, K.; Huo, S.; Su, J.; Zhang, T.; Li, C. Effects of lake-basin morphological and hydrological characteristics on the eutrophication of shallow lakes in east China. J. Gt. Lakes Res. 2014, 40, 666–674. [Google Scholar] [CrossRef]
  30. Xu, H.; Paerl, H.W.; Qin, B.; Zhu, G.; Hall, N.S.; Wu, Y. Determining critical nutrient thresholds needed to control harmful cyanobacterial blooms in eutrophic Lake Taihu, China. Environ. Sci. Technol. 2015, 49, 1051–1059. [Google Scholar] [CrossRef] [PubMed]
  31. Orihel, D.M.; Schindler, D.W.; Ballard, N.C.; Graham, M.D.; O’Connell, D.W.; Wilson, L.R.; Vinebrooke, R.D. The “nutrient pump:” Iron-poor sediments fuel low nitrogen-to-phosphorus ratios and cyanobacterial blooms in polymictic lakes. Limnol. Oceanogr. 2015, 60, 856–871. [Google Scholar] [CrossRef]
  32. Molot, L.A.; Watson, S.B.; Creed, I.F.; Trick, C.G.; McCabe, S.K.; Verschoor, M.J.; Sorichetti, R.J.; Powe, C.; Venkiteswaran, J.J.; Schiff, S.L. A novel model for cyanobacteria bloom formation: The critical role of anoxia and ferrous iron. Freshw. Biol. 2014, 59, 1323–1340. [Google Scholar] [CrossRef]
  33. Beaulieu, M.; Pick, F.; Palmer, M.; Watson, S.; Winter, J.; Zurawell, R.; Gregory-Eaves, I. Comparing predictive cyanobacterial models from temperate regions. Can. J. Fish. Aquat. Sci. 2014, 71, 1830–1839. [Google Scholar] [CrossRef]
  34. Taranu, Z.E.; Gregory-Eaves, I.; Leavitt, P.R.; Bunting, L.; Buchaca, T.; Catalan, J.; Domaizon, I.; Guilizzoni, P.; Lami, A.; McGowan, S.; et al. Acceleration of cyanobacterial dominance in north temperate-subarctic lakes during the Anthropocene. Ecol. Lett. 2015, 18, 375–384. [Google Scholar] [CrossRef] [PubMed]

