
Performance of a Rain Barrel Sharing Network under Climate Change


1
Korea Institute of Civil Engineering and Building Technology, 283 Goyangdae-ro, Goyang 411-712, Korea
2
Department of Civil Engineering, Seoul National University of Science and Technology, 232 Gongneung-ro, Seoul 139-798, Korea
3
Department of Civil Engineering, Yeungnam University, 280 Daehak-ro, Gyeongsan 712-749, Korea
*
Author to whom correspondence should be addressed.
†
These authors contributed equally to this work.
Water 2015, 7(7), 3466-3485; https://doi.org/10.3390/w7073466
Submission received: 5 May 2015
/
Revised: 18 June 2015
/
Accepted: 23 June 2015
/
Published: 1 July 2015
Abstract
:Rain barrels can be technically shared through social practices or mutual agreement between individual households. This study proposes the evaluation system for a rain barrel sharing network (RBSN) considering three performance criteria of reliability, resiliency, and vulnerability, under plausible climate change scenarios. First, this study shows how the system can be improved in terms of the performance criteria using historical daily rainfall data based on the storage-reliability-yield relationship. This study then examined how the benefits from RBSN are affected by climate change after 100 years. Three climate change scenarios (A1B, A2 and B2) and three global circulation models were used for this purpose. The results showed that the reliability and vulnerability are improved due to sharing and their improvements become larger under climate change conditions. In contrast, the resiliency reduces slightly due to sharing and its reduction is attenuated under climate change conditions. In particular, vulnerability will be reduced significantly under climate change. These results suggest that the sharing of various water resources systems can be an effective climate change adaptation strategy that reduces vulnerability and increases the reliability of the system.
1. Introduction
A rainwater harvesting system (RWHS) is defined as the gathering and storage of water running off surfaces onto which rain has directly fallen [1] using cisterns, rain barrels, and other forms of collecting systems. The benefit of RWHS can be summarized as follows [2]. First, it covers the peaks in demand that are greater than the flow of the water source. Therefore, it helps smooth out the variations in water supply and sustainable water resources management. Second, RWHS provides water security in cases of supply interruptions or disasters. In addition, it provides harvested rainwater for household water use, a source of chemically untreated water, reducing peak flows in urban catchments, thermal storage, freeze protection, etc. A RWHS typically consists of natural landforms and artificial facilities that store rainwater in the hydrologic cycle [3]. Therefore, RWHSs have been facilitated for a range of purposes in many countries. For example, RWHSs were built for potable use [4,5,6,7], household irrigation, and other uses [3,8,9], and for agricultural irrigation in both urban and agricultural areas [10,11]. RWHSs are also used widely as a practical approach for sustainable water resources management, particularly in urban areas [12,13].
Previous research on RWHS has focused primarily on the optimal size of rainwater storage using a fundamental mass balance relation [14] to describe the behavior of a RWHS in terms of the yield after spillage (YAS) and the yield before spillage (YBS) rules. These rules were used to determine the size of a rainwater storage vessel [11,15]. The concept of RWHS is similar to that of stormwater basins or reservoir systems, and various methodologies have been applied to estimate the size of the rainwater storage. An analytical equation for storm-water detention [16], a common storage-reliability-yield (SRY) relationship concept [17], or a dimensionless methodology [18] were also used to determine the optimal size of a rainwater storage. On the other hand, a regional assessment of the performance of a RWHS has been conducted continuously to understand how societal and climatic factors interact to affect the behavior of a RWHS [19,20,21,22].
The performance of RWHS under climate change conditions is being assessed in various ways. Lash et al. [23] developed a tool integrating various sizing approaches under climate change. Palla et al. [24] tested the performance of RWHS under various European climate zones and found that the antecedent dry weather period is the main hydrological parameter affecting the performance, whereas the rainfall depth, intensity, and duration showed a weak correlation. Lo et al. [25] reported that a residential RWHS with non-potable water use is affected more by climate change than a non-residential RWHS. Youn et al. [13] examined the required capacity of an RWHS for a specific deficit rate under climate change and found that the capacity is reduced under climate change conditions. Most studies of the performance of RWHS are limited to a single RWHS and its performance under climate change.
The impact of climate change on water resources depends on both the external dynamics and internal system characteristics [26]. The external dynamics refers to changes in the volume, the timing, and quality of streamflow and recharge. The internal system characteristics mean how the management of the system evolves, and what adaptations to climate change are implemented. Therefore, the system most vulnerable to climate change will be an uncontrolled system [27]. The adaptation is referred to as adjustments in ecological, social, or economic systems in response to actual or expected climatic stimuli and their impact [28]. Indeed, the impact assessment of climate change depends not only on the changes in external forces such as increased monthly variation of precipitation and extended dry seasons but also on the internal system characteristics, which can be improved using so-called adaptation strategies under climate change.
One of the characteristics of RWHS is the possibility of sharing with neighbors. In fact, the accessibility to a RWHS depends on the purpose of water use. For example, it is difficult to share the RWHS with neighbors for the purpose of toilet or laundry use. On the other hand, for irrigation purposes, it is rather easy to share the RWHS with an extra length of hose from the attached tap. If it is possible to recharge a neighbor’s rain tank in the same way, then it can serve all the purposes of water use of a neighbor. The sharing can be promoted and encouraged by social practices and programs. In contrast to previous studies on the reliability of RWHS, this study focused on the possibility of sharing RWHS. Seo et al. [29] showed that sharing improves the reliability of the RWHS in a sample community composed of four prospective users’ water tanks. The sharing network can have a range of forms depending on the number of users attending the sharing strategy. The results showed that the size of a RWHS can be reduced with a sharing network for a given reliability and the reduction of tank size is maximized if all four users share their tanks with others. Seo et al. [30] examined the impact of climate change on the benefit of sharing rain barrels and reported that the benefit of sharing can be even larger under climate change scenarios in terms of the reliability of the RWHS system.
The performance of a RWHS under climate change should be evaluated carefully from various points of view because it can be affected strongly by the individual characteristics of the demands that compose the rain barrel network [30,31]. Seo et al. [31] also mentioned that the reliability is not sufficient to analyze the performance of the rain barrel sharing network (RBSN). Typically, a RBSN is considered a reservoir [17] and similar approaches of reliability have been adapted for performance analysis [32,33]. In contrast, there are no reports on the analysis of RBSN under climate change with further performance criteria except for the reliability. Since Seo et al. [29] considered the possibility of sharing RWHSs, the basic idea of RBSN has been developed to examine the potential benefits by establishing sharing networks among the individual systems under climate change.
Therefore, this study evaluated a RBSN under climate change with the introduction of additional performance criteria, which quantify the reliability, resiliency, and vulnerability of a system. The behaviors of RBSNs under climate change scenarios were analyzed and compared with those of historical rainfall data. Three scenarios suggested by Intergovernmental Panel on Climate Change (IPCC) [34] and the precipitation projections of three global circulation models (GCMs) were utilized to examine the performances of four RBSNs. The water demand is assumed to be a random variable to include the uncertainty of individual water uses, as in previous studies [29,30].
2. Methods
2.1. Study Area
This study utilizes the regional climate change prediction for 113 mid-sized catchments (mean catchment area of 938 km2) in South Korea suggested by the Ministry of Land, Transportation, and Maritime Affairs (MLTM) [35]. As a methodology for downscaling the results from GCMs, the MLTM [35] adopted a statistical downscaling approach based on a combination of the cyclostationary empirical orthogonal function (CSEOF) analysis and a weather generator (WXGEN) developed by Sharpley and Williams [36]. The CSEOF generates localized climate scenarios with a resolution of approximately 20 km from the coarse-scale GCM simulations, which have a resolution of approximately 100–350 km, and the WXGEN disaggregates monthly data to daily simulations.
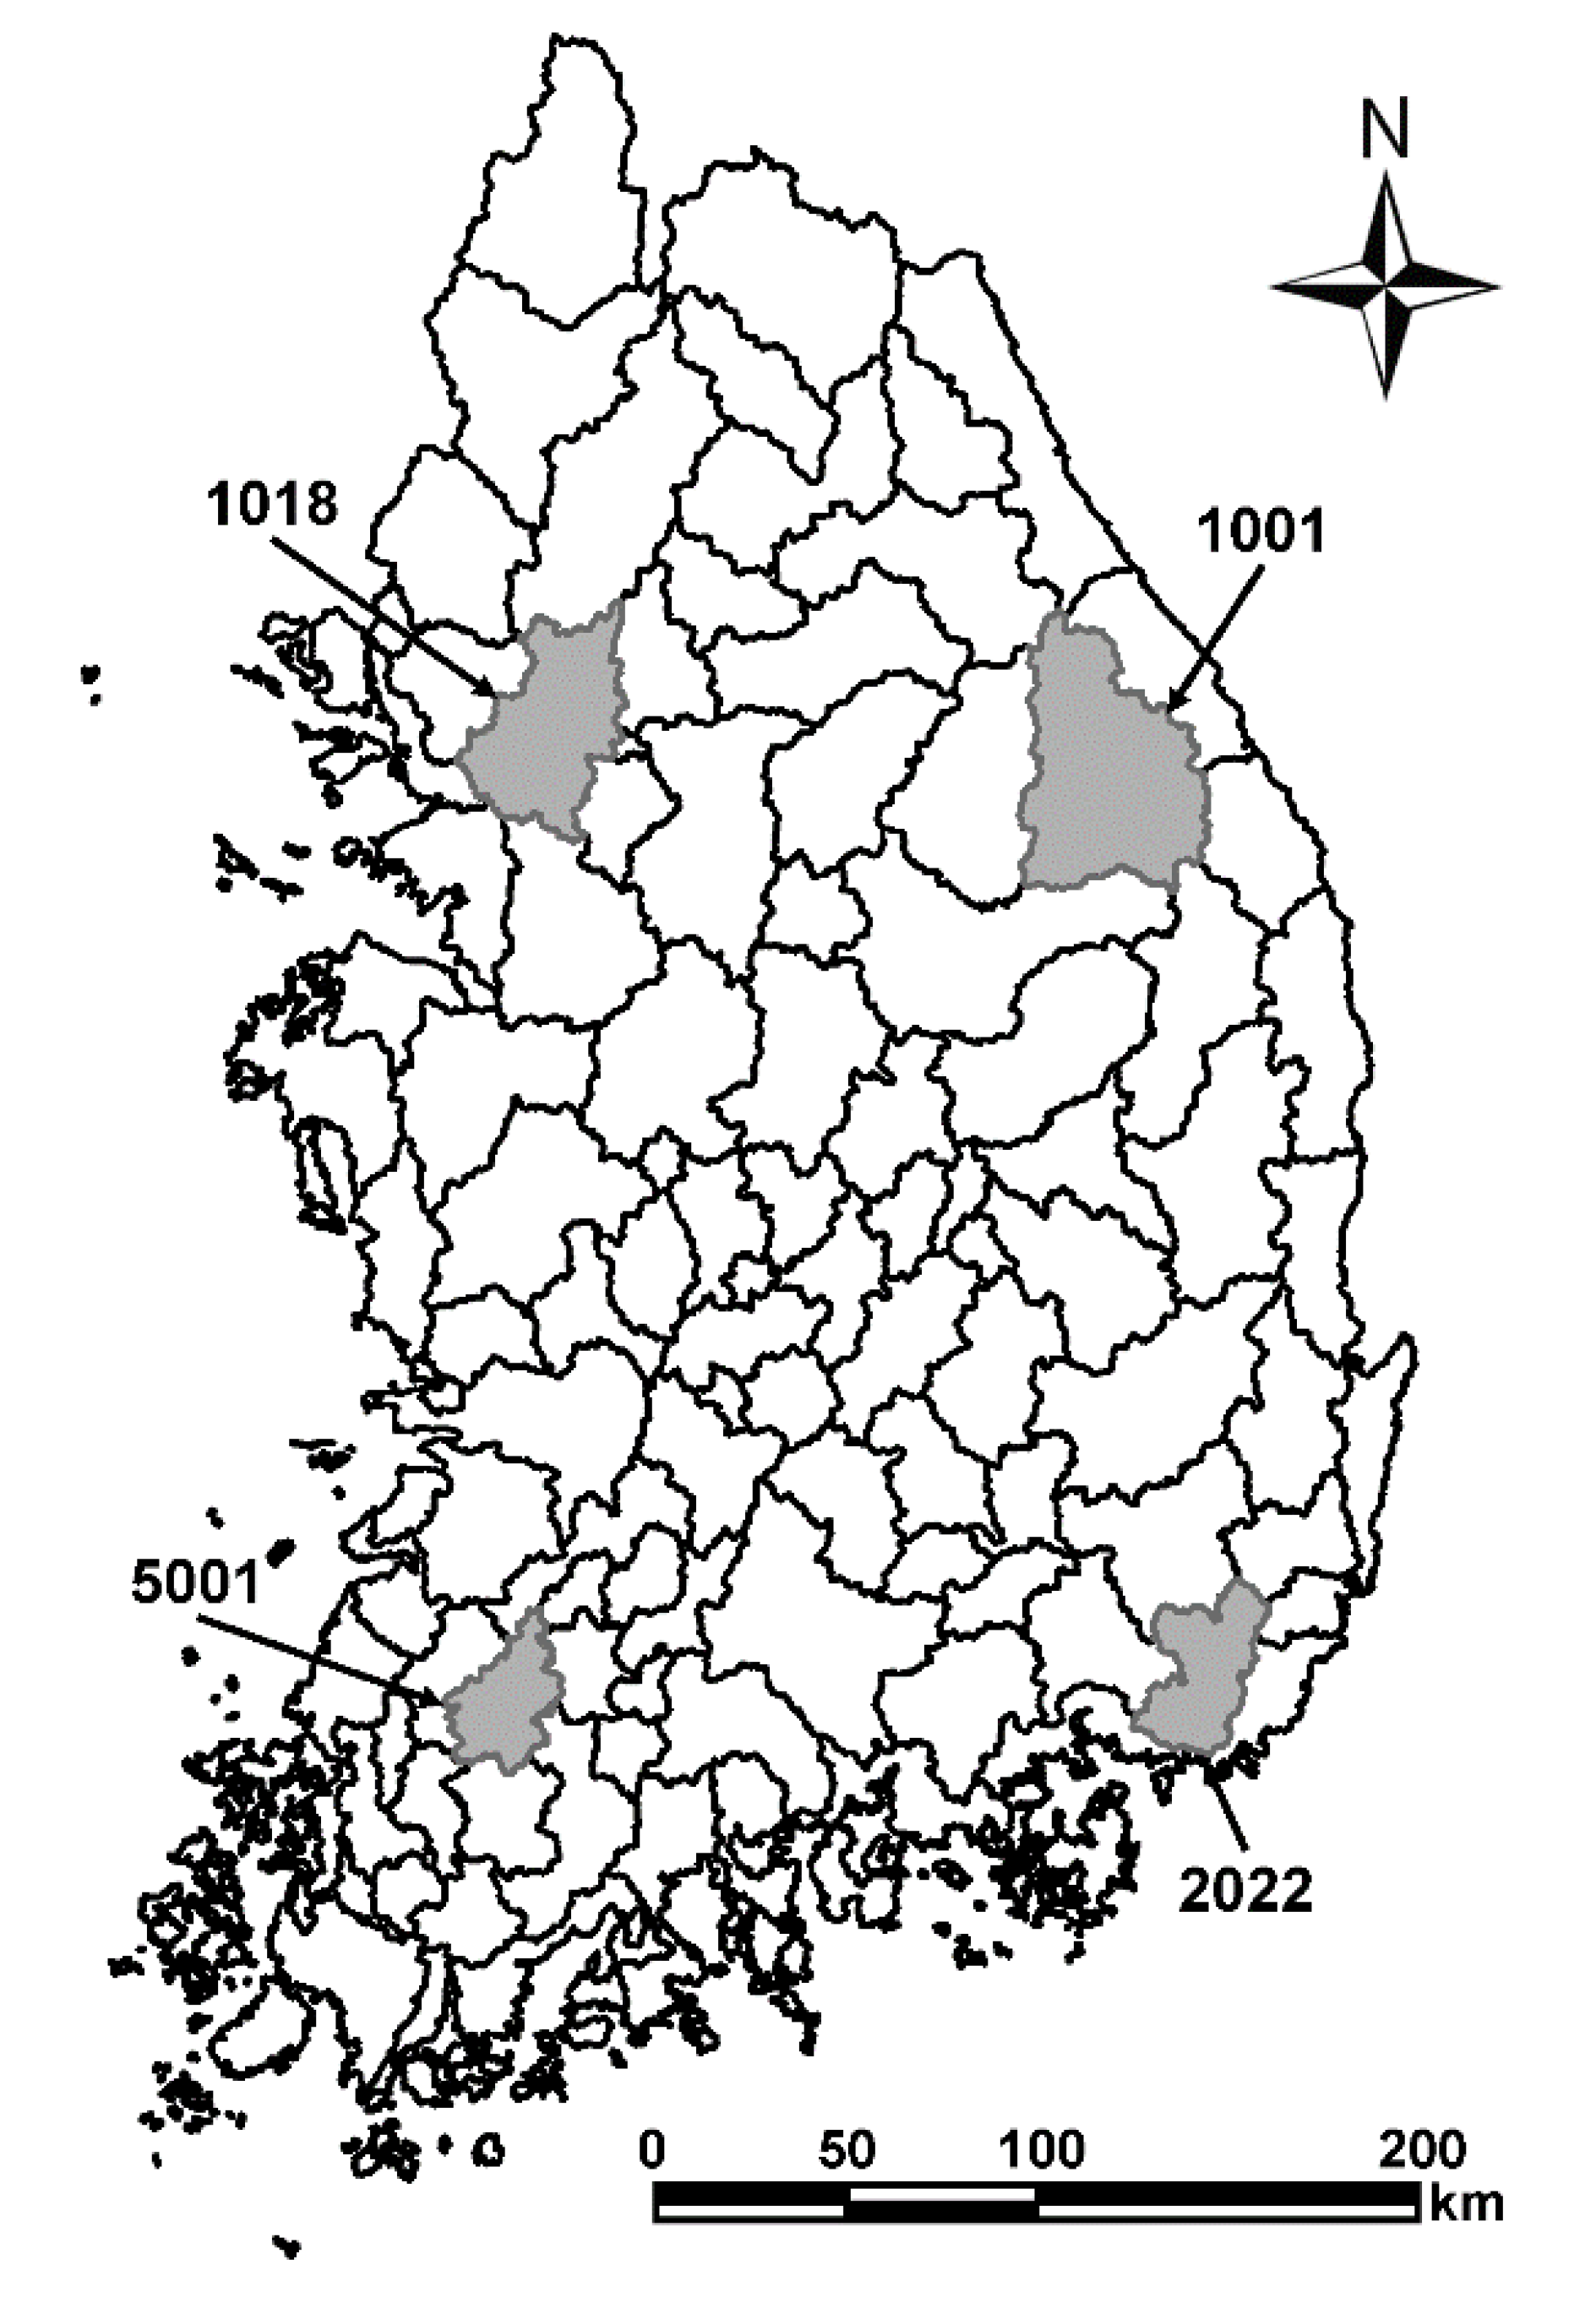
To generate the daily weather variables using the spatially downscaled monthly climate simulations, WXGEN was calibrated and verified using long-term historical climate data [35]. The relative monthly changes in precipitation and temperature were then calculated using the downscaled monthly simulations for two future time slices (2020s and 2080s) relative to the reference period. The relative monthly change indicates the absolute difference for temperature and relative percentage difference for precipitation. The generated daily precipitation and temperature using WXGEN for the future period were then adjusted by the relative monthly changes [35]. Figure 1 shows the locations of four catchments selected for an assessment of the impact from climate change on the performance of the connected RWHSs in this study. Table 1 lists the catchment area and annual mean precipitations of the four test catchments.
Figure 1.
Four test catchments considered in this study.


| Catchment | Area (km2) | Major Cities | Rivers | Annual Mean Precipitation (mm) |
|---|---|---|---|---|
| 1001 | 2448 | Gangneung | Han River | 1320 |
| 1018 | 1537 | Seoul | Han River | 1248 |
| 2022 | 916 | Busan | Nakdong River | 1380 |
| 5001 | 715 | Gwangju | Yeongsan River | 1356 |
2.2. Climate Change Scenarios and GCMs
The climate change projections from three GCMs (CNRM1, CSIRO, and ECHO-G) and their three emission scenarios (B1, A1B, and A2) were obtained from the IPCC Data Distribution Centre (DDC) and used to obtain the regional future precipitation in South Korea [35,37]. The storyline for each scenario is based on a specific socioeconomic development condition, population growth, and advances in technologies [34], as shown in Table 2; the A1 scenarios incorporate very rapid economic growth, a global population that peaks mid-century and declines thereafter, and the rapid introduction of new and more efficient technologies.The B1 scenarios assume a convergent world with the same global population that peaks mid-century and declines thereafter, as in the A1 storyline, but with rapid changes in economic structures toward a service and information economy, with decreases in material intensity, and the introduction of clean and resource-efficient technologies. In contrast, A2 scenarios assume a very heterogeneous world: self-reliance and preservation of local identities, continuously increasing global population, economic development that is primarily regionally oriented, and a more fragmented and slower per capita economic growth and technological change than other storylines. According to the total cumulative carbon dioxide emissions (GtC), the B2 scenario covers from low to medium-low (<1450 Gtc), whereas the A1B and A2 scenarios cover from medium-low to high (>1450 Gtc).
Table 2.
Description of climate change scenarios [34].
| Storyline | Description |
|---|---|
| A1 | Very rapid economic growth, global population that peaks mid-century and declines thereafter, and the rapid introduction of new and more efficient technologies (three groups: A1FI, A1T, A1B). |
| A2 | A very heterogeneous world: self-reliance and preservation of local identities, continuously increasing global population, economic development primarily regionally oriented and more fragmented and slower per capita economic growth and technological change compared to other storylines. |
| B1 | A convergent world with the same global population that peaks midcentury and declines thereafter, as in the A1 storyline, but with rapid changes in economic structures toward a service and information economy, with reductions in material intensity, and the introduction of clean and resource-efficient technologies. The emphasis is on global solutions to economic, social, and environmental sustainability, including improved equity, but without additional climate initiatives. |
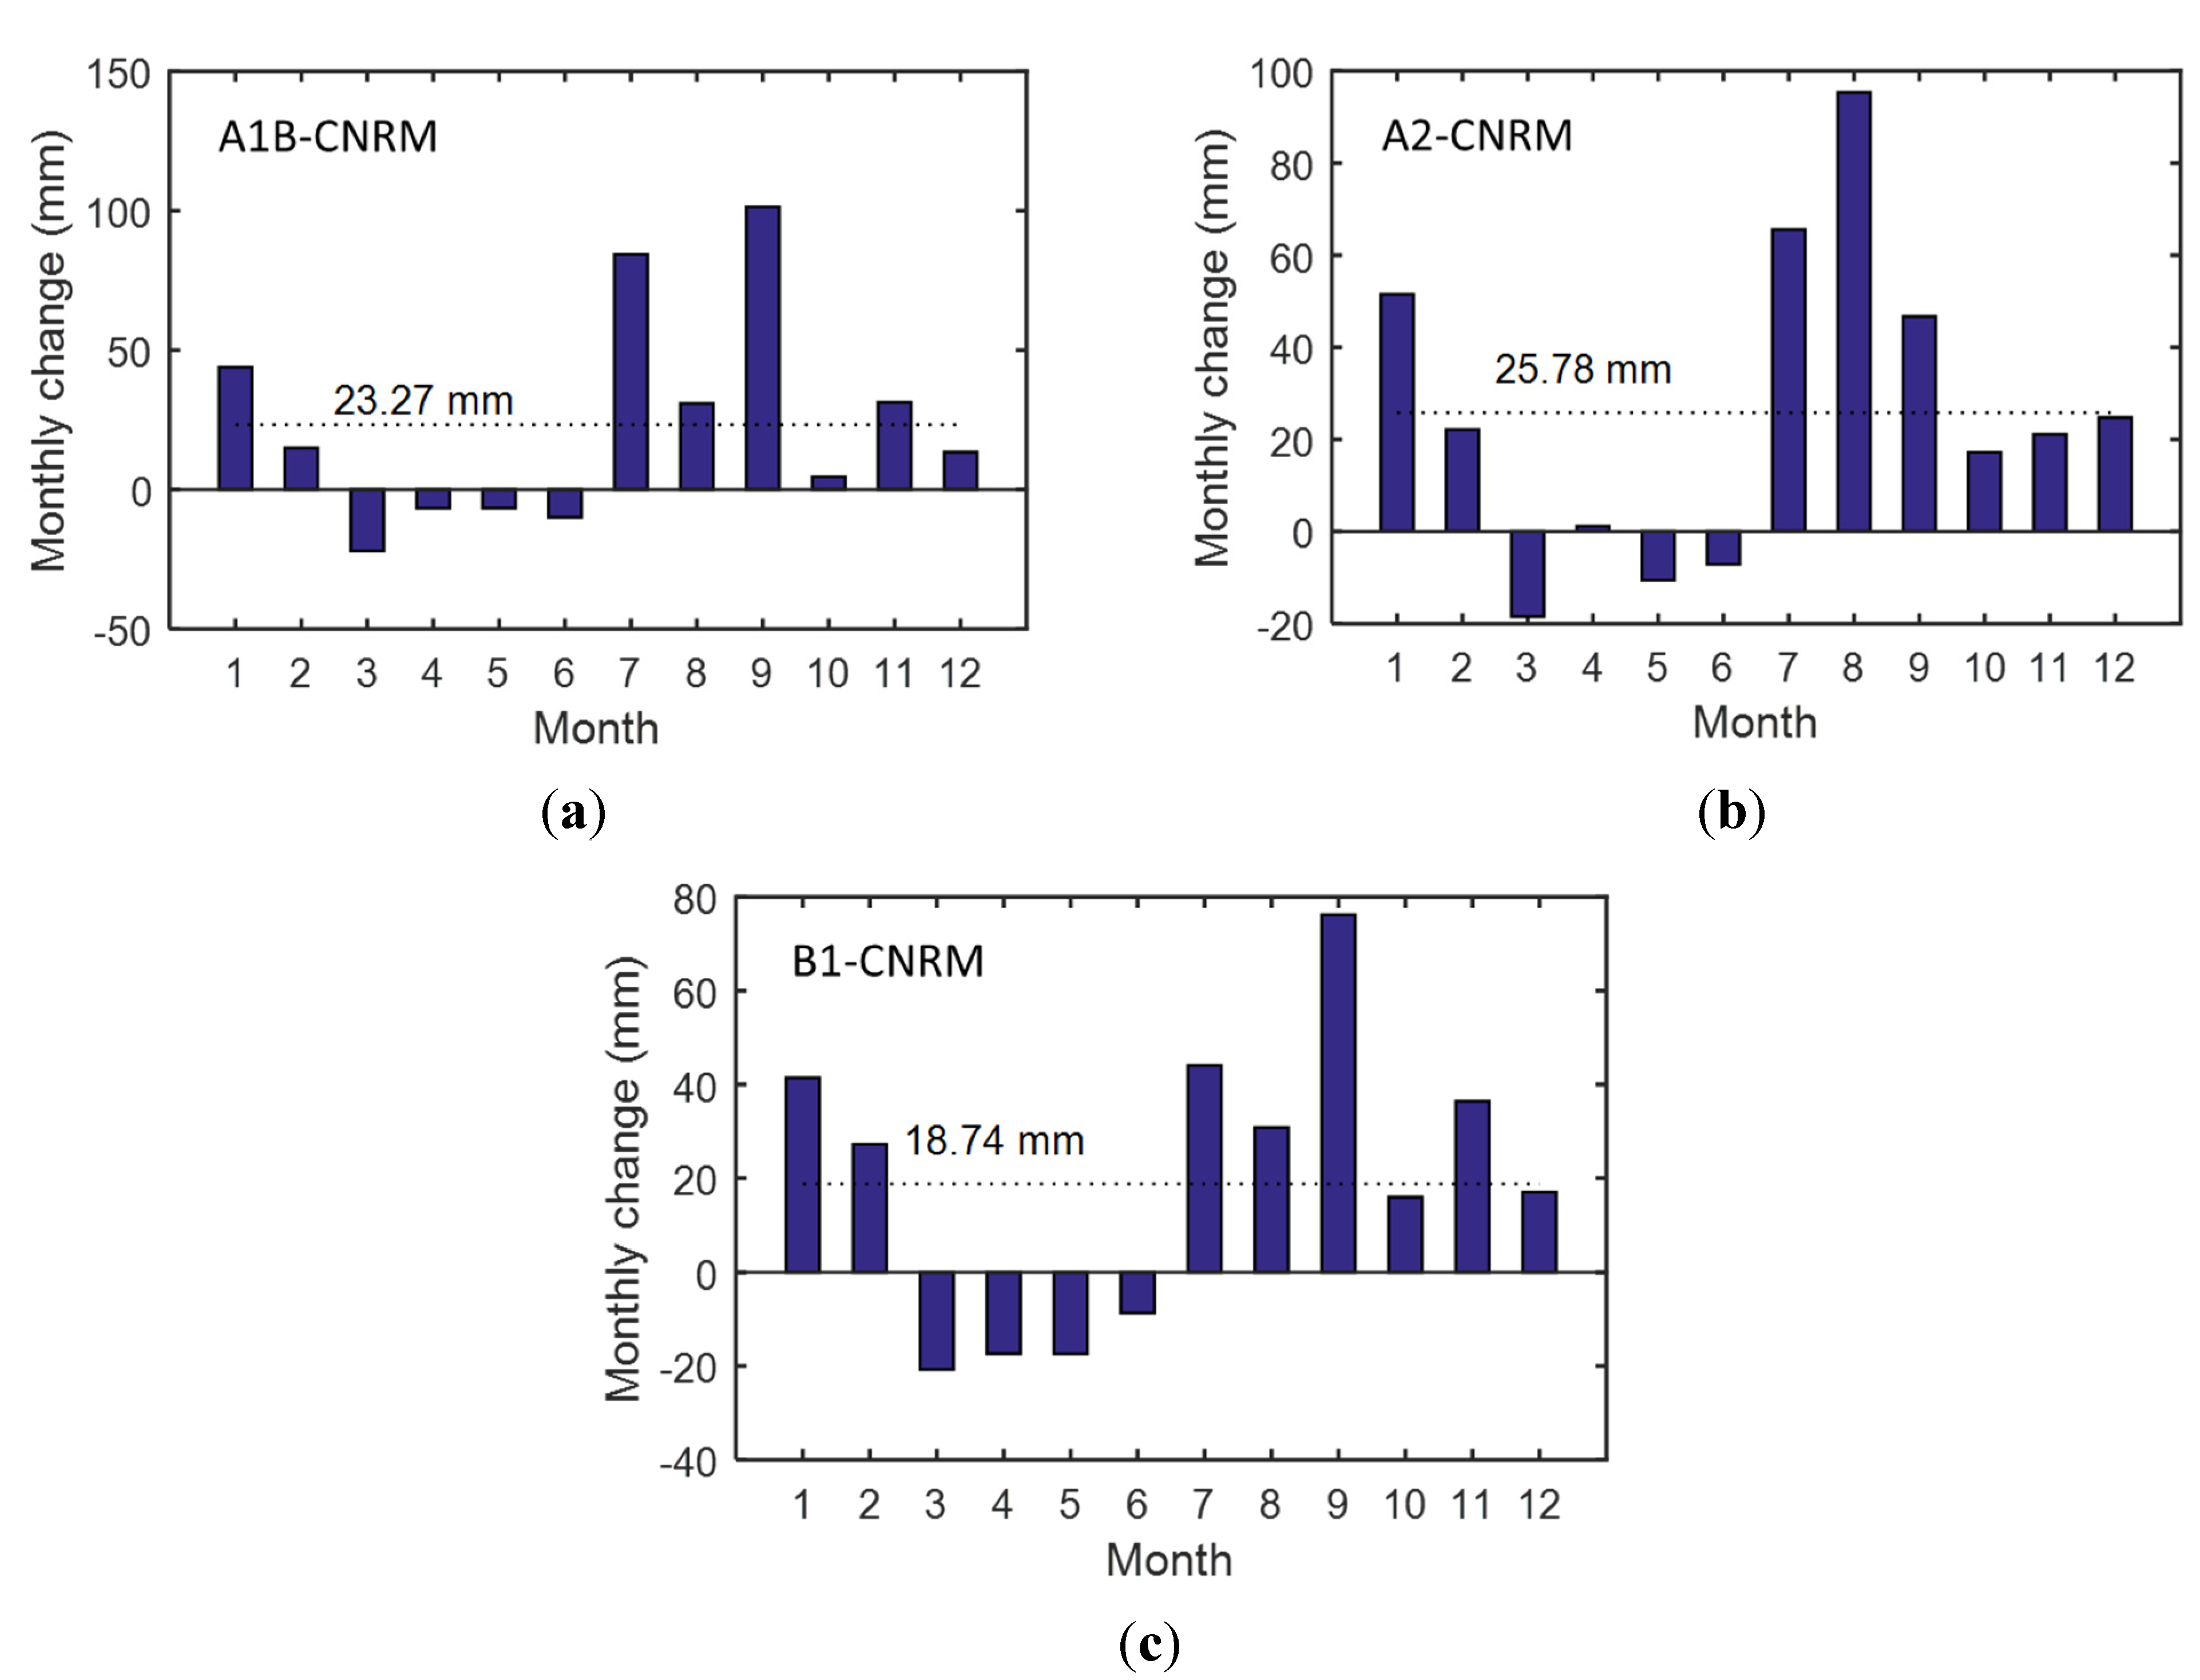
This study used daily rainfall for the historical simulation (1970–1999) and also for the future (climate change) simulation (2070–2099) using the A1B, A2, and B1 scenarios. The monthly precipitation changes (mm) of the three scenarios of CNRM for the test catchment 1001 during the period from 2070 to 2099 are compared as shown in Figure 2. The A2 scenario shows the maximum annual precipitation show a 25.78 mm increase and the greatest variation in monthly precipitation changes whereas the B1 scenario shows a minimum annual increase of 18.74 mm as well as the lowest monthly variation. All three scenarios showed a decrease in precipitation in the dry season from March to June but an increase in the wet season from July to September.
Figure 2.
Monthly changes in precipitation under three climate change scenarios of CNRM for the test catchment 1001 during 2070–2099, (a) A1B; (b) A2 and (c) B1.
Figure 2.
Monthly changes in precipitation under three climate change scenarios of CNRM for the test catchment 1001 during 2070–2099, (a) A1B; (b) A2 and (c) B1.
2.3. Rain Barrels Sharing Network
Rain barrels with various forms can be shared easily with neighbors depending on their water use patterns and storage capacities. They can be large storage volumes shared by a community or individually owned vessels networked through social programs that encourage the sharing of private rain barrels. This study introduces four prospective users to consider the benefit of connecting users and forming a shared network. Table 3 lists all possible network configurations for four users. Every user was assumed to have equal accessibility to all rain barrels within the network. In this study, the connections a1, b1, and c1 are considered as representative cases for three connection types (Nc = 1, 2 and 3).
| No. of Connections (Nc) | Possible Sharing Networks of Individual Rain Barrels | ||||||
|---|---|---|---|---|---|---|---|
| 1 |  |  |  |  |  |  | |
| (a1) | (a2) | (a3) | (a4) | (a5) | (a6) | ||
| 2 |  |  |  |  |  |  |  |
| (b1) | (b2) | (b3) | (b4) | (b5) | (b6) | (b7) | |
| 3 |  | ||||||
| (c1) | |||||||
2.4. Storage-Reliability-Yield (SYR) Relationship
Given the water demands for all users of a shared network, the RWHS required size for a given reliability can be obtained using the SRY curve method [17]. The rain water storage per unit area is given as a function of the demand, reliability, and precipitation as follows:
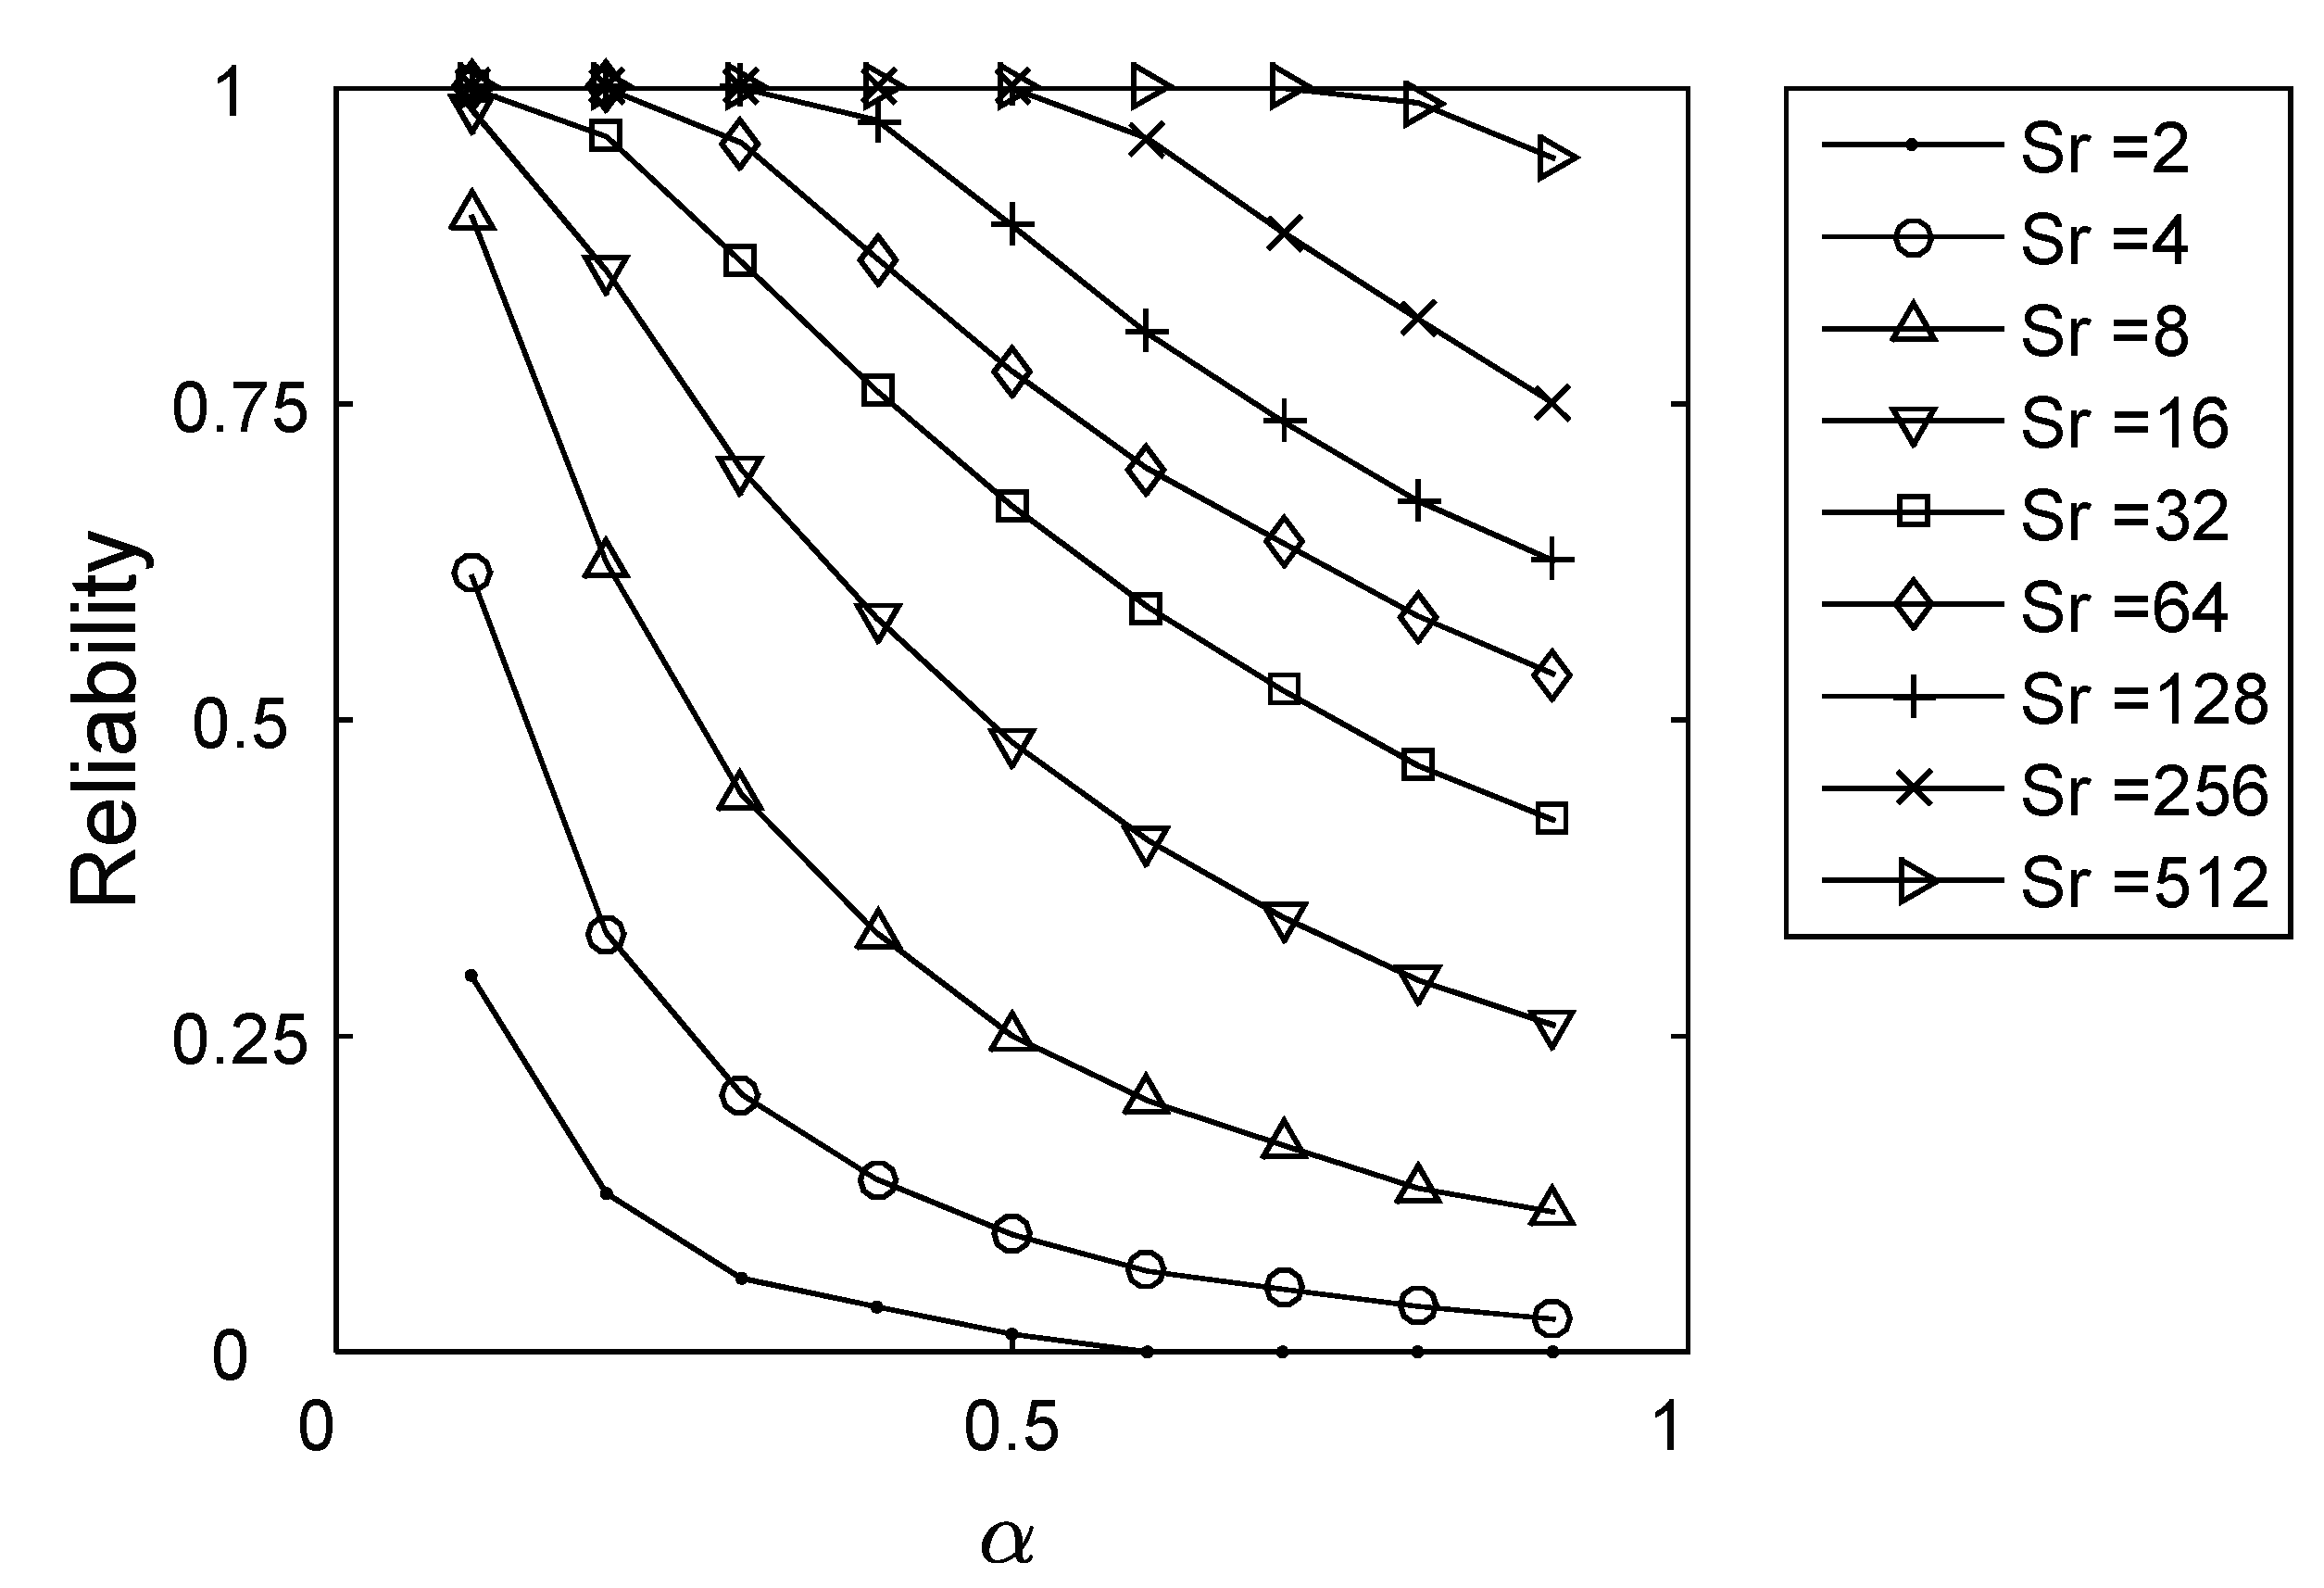
where Sr is the total storage volume of rain barrels in the system, X is the water demand, R is the reliability, and P is the precipitation for a given time period. An example of the SRY curves is shown in Figure 3, where the reliability increases with increasing storage for a given yield ratio (α). The yield ratio is defined as a normalized yield (water demand) divided by the mean daily rainfall (μp) of each station per unit collecting (roof) area:
Figure 3.
Storage-reliability-yield relation curves based on historical rainfall data (1970–1999) in a test catchment, 1018, depending on yield ratio (α) and storage size (Sr) in mm/m2.
Figure 3.
Storage-reliability-yield relation curves based on historical rainfall data (1970–1999) in a test catchment, 1018, depending on yield ratio (α) and storage size (Sr) in mm/m2.

This study assumes the water demand (yield ratio, α) as a random variable with a probability distribution. The daily water demand comprises several water uses such as small daily consumption and large intermittent consumption [9]. Therefore, this study assumed that the daily water demand follows a log-normal distribution to consider its uncertainty because water demand varies with the purpose, timing, and level of use. The storages (depth) are normalized per unit area. Assuming that every user has a unit area of rainfall catchment, the new set of demands should be normalized with the contributing area before estimating the required storage for the target reliability. Therefore, the total storage of four users can be expressed as follows [29]:
where Srtotal is the total storage, Sri is the required storage for user i, and Ci is a new combination of demands created by the shared network between users of which the weight is ai, which is the contributing area obtained by a summation of the distributing ratio.
2.5. Characteristics in Demand
Individual water uses can be strongly correlated with each other because they are influenced by the local meteorology and environment. In addition, the socioeconomic living standards of the water users can be similar locally. Therefore, this study introduces a correlation in the water demand. For simplicity, the same constant correlation was assumed for all users. Let X be a multivariate lognormal random vector with a mean μ' and covariance matrix Σ'.
where
with the following mean and variance:
Any covariance matrix is symmetric and real-valued, which can be decomposed as follows:
where C is a lower triangular matrix called the Cholesky factor of Σ, and CT is a transposed matrix of C. One obtains the correlated random variables by multiplying the vector of the uncorrelated random variables by the Cholesky factor:
where Xu are uncorrelated random variables with a size of n × m (m observations of length n) and X (n × m) is the correlated random variables according to Σ (m × m).
In addition to the correlation in demand, this study also incorporated different means and variances. In a previous study, Seo et al. [29] considered homogeneous users with the same means and variances and heterogeneous users with different means and variances. In contrast, this study introduced only heterogeneous users with more different means and variances to simplify the uncertain water demand. Table 4 lists the test cases with different means and variances as well as the correlation in demand considered in this study.
| Cases | Correlation (ρ) | Mean (μ) | Variance (σ2) |
|---|---|---|---|
| Different Means/Different Variances | 0, 0.90 | μ1 = 0.2 | σ21 = 0.25, σ22 = 0.50, σ23 = 0.75, σ24 = 1.00 |
| μ2 = 0.4 | |||
| μ3 = 0.6 | |||
| μ4 = 0.8 |
2.6. Performance Criteria of Reliability, Resiliency, and Vulnerability
For a given α, the reliability can be obtained from the number of failure days for a given period [17]:
where R is reliability and n and nf are the total number of days, and the number of failure days. The resiliency is defined as the inverse of the mean days of consecutive failure time periods [38]:
where γ is the resiliency, R is the reliability, and rf is the ratio of the total number of days when the condition moves from success to failure state divided by the total number of days. The vulnerability is defined as an indicator of the severity of failure as follows [38]:
where ν is the vulnerability, F is a set of failure states, ej is the probability of sj, and sj is denoted as an numerical indicator of the severity of the failure state. This study assumes that the numerical indicator of severity is equivalent to the deficit amount of demand. Therefore, the vulnerability is defined as a mean deficit amount of demand.
3. Results and Discussion
3.1. Performance of a RBSN under the Historical Rainfall Data
The reliability, resiliency, and vulnerability of RBSNs for four different test catchments were calculated using the historical rainfall data from 1970 to 1999 as shown in Figure 4, Figure 5 and Figure 6, respectively.
Basically, Figure 4 is identical to Figure 3, which shows the SYR relations. The reliability increases with increasing storage size. In addition, the larger the storage container, the greater the effectiveness of the RBSNs. Figure 4 basically shows that the reliability of an RBSN increases with an increase in the number of connections (Nc) for a given storage size. This result is similar to those reported by Seo et al. [29,31] in that the sharing network improves the system reliability, and is particularly higher with different demands. Furthermore, this result also shows that an improvement in the sharing network is not expected for lower reliabilities less than 55% overall.
Figure 4.
Reliabilities of the four RBSNs under the historical rainfall (1970−1999) for the test catchments (a) 1001; (b) 1018; (c) 2022 and (d) 5001.
Figure 4.
Reliabilities of the four RBSNs under the historical rainfall (1970−1999) for the test catchments (a) 1001; (b) 1018; (c) 2022 and (d) 5001.

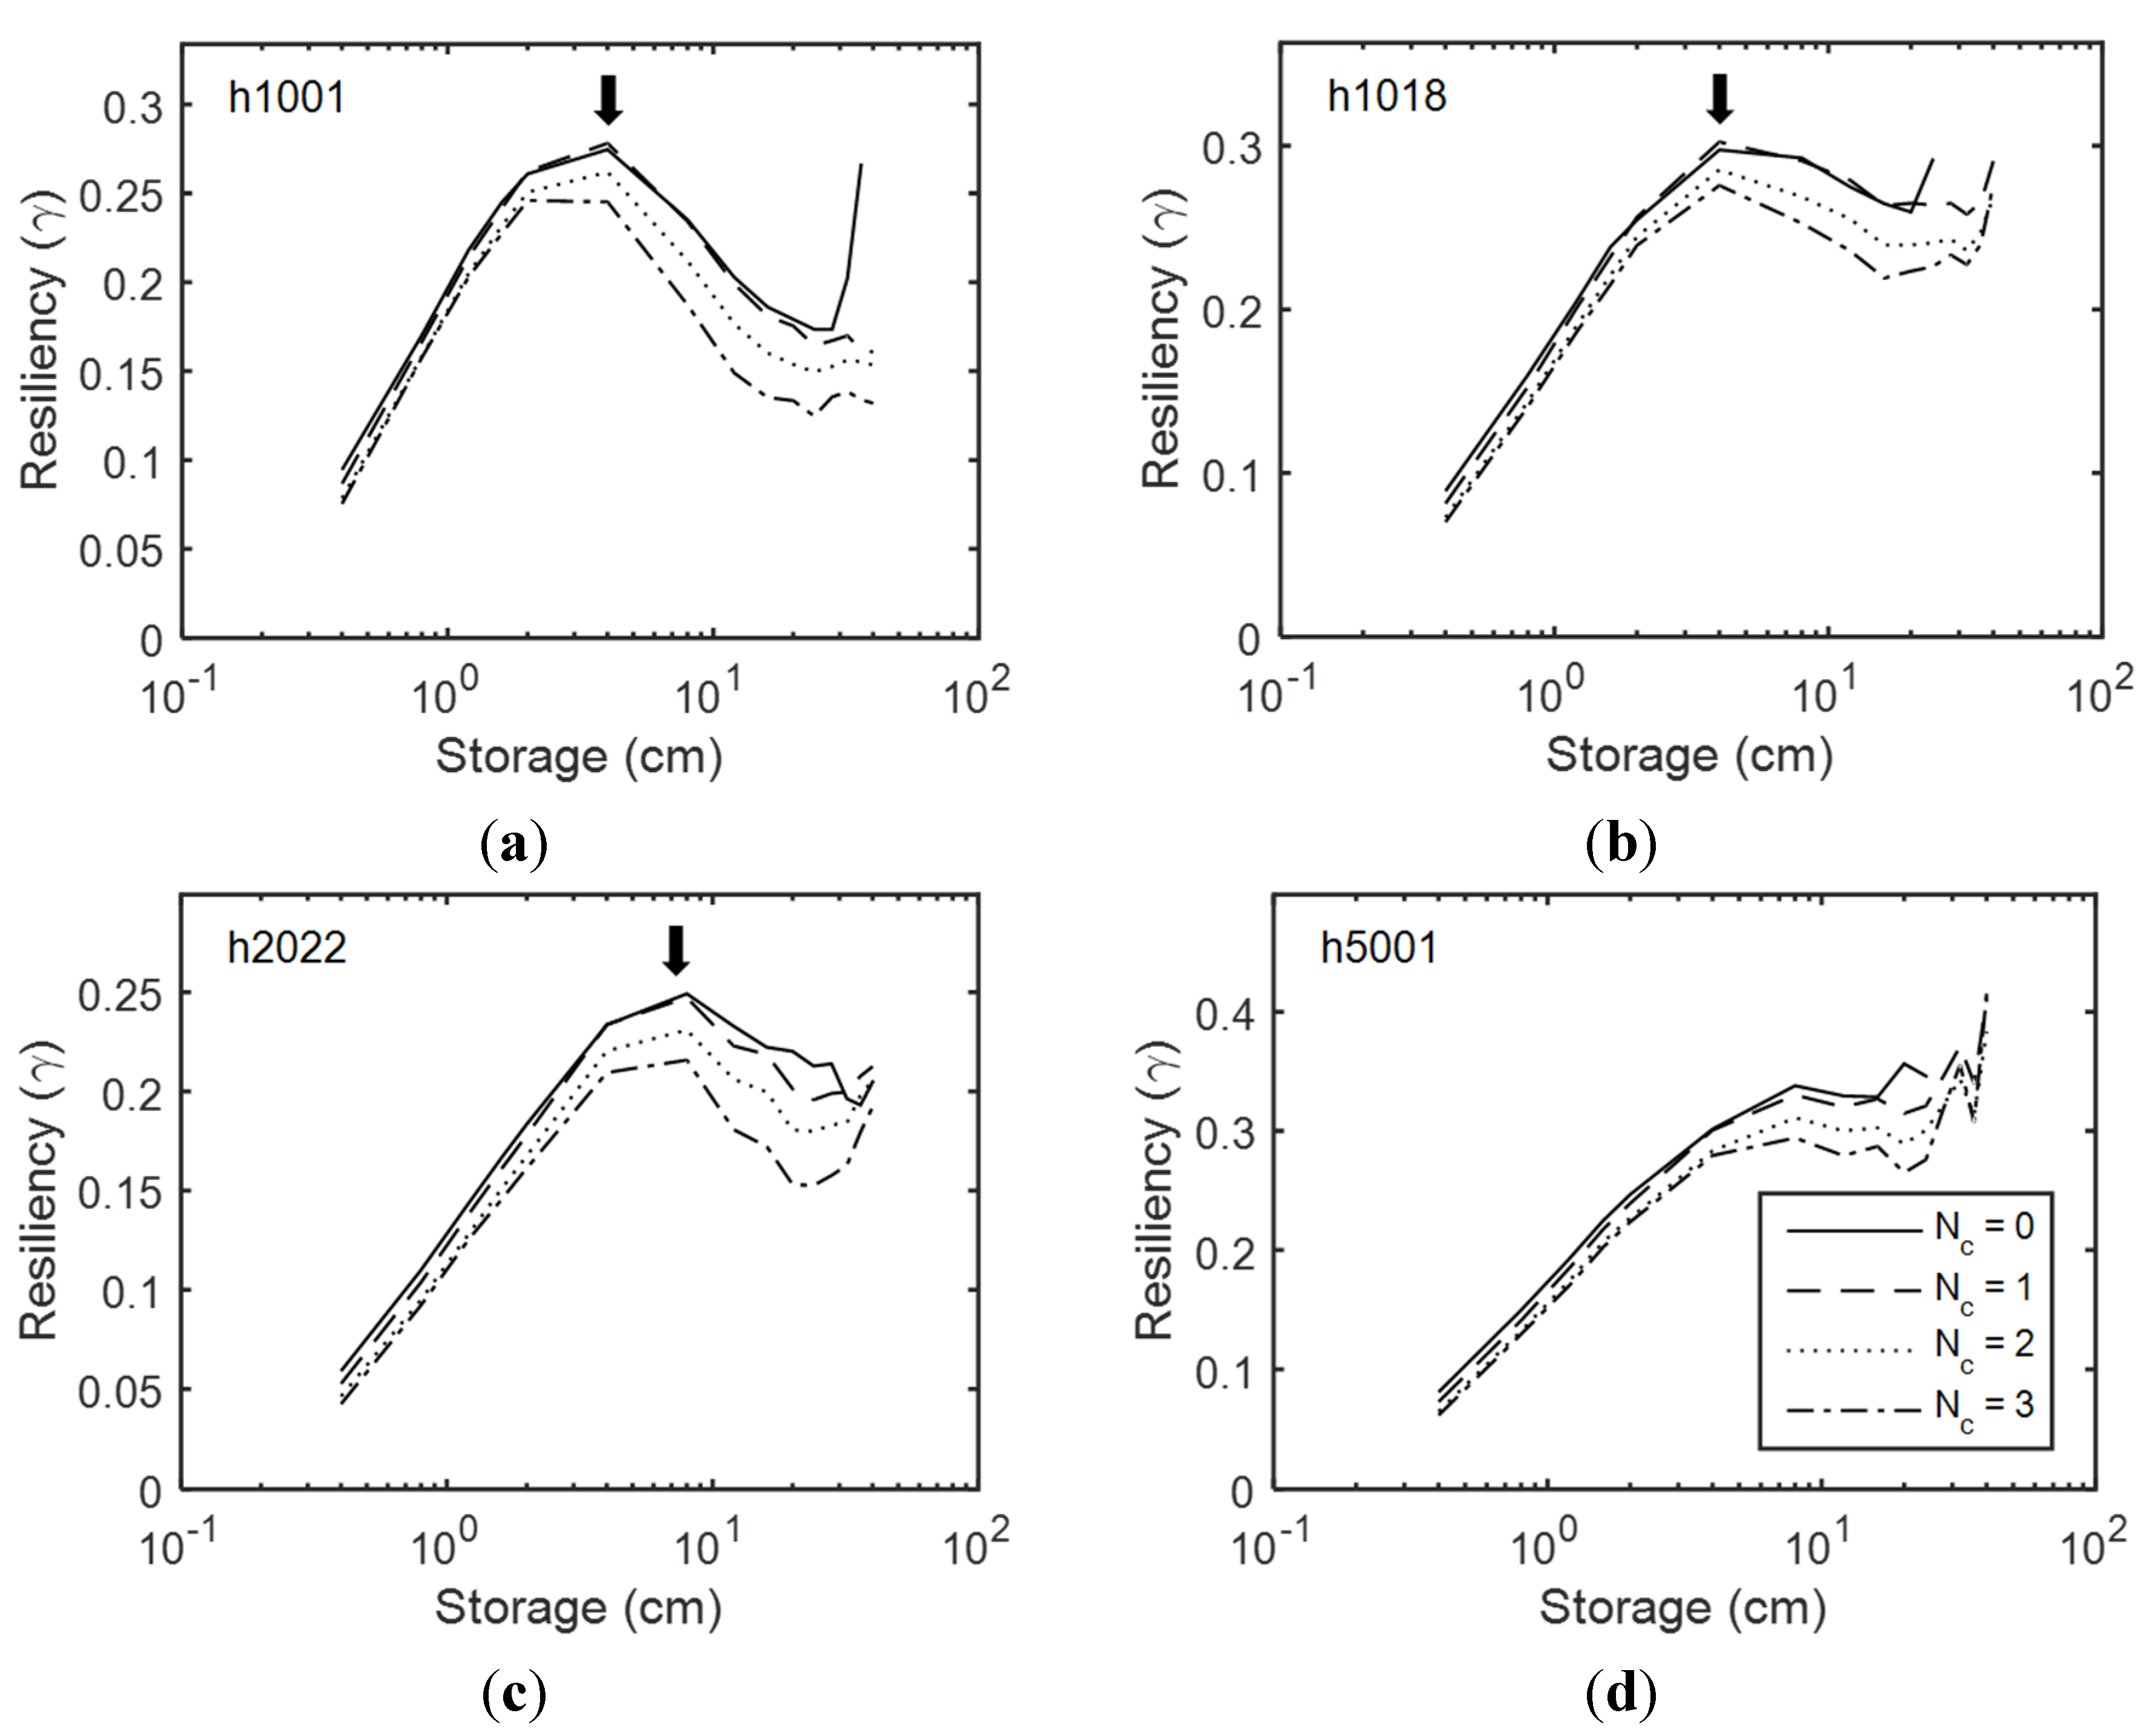
In contrast to reliability, the resiliency decreases with an increasing number of connections (Nc), which implies that a connected system has difficulties in recovering from a failure state. More days are needed to recover from failure when the rain barrels are connected. As shown in Figure 5, the resiliency reaches its maximum at the storage interval, 1–10 cm, and does not increase monotonously with increasing storage size. The resiliency (Equation (11)) is defined as the inverse of the mean duration of continuous failure, which can be obtained by the total number of failure days divided by the number of transitions from a success to a failure state. The number of failures decreases with increasing storage size until it reaches a threshold, which is much larger than zero. On the other hand, the number of transitions from a success to a failure state decreases sharply to the order of zero and peaks around the storage near 2 cm of storage depth. As the storage increases, the resiliency reaches its maximum in the vicinity of the peak number of the transition and continues to decrease because the number of failure days is still large. These are shown in the simulation results for the test catchments 1001, 1018, and 2022, whereas 5001 does not show the maximum resiliency clearly. The resiliency of 5001 presents the maximum at the maximum of its storage. Recently, a new concept of resilience was defined as the degree to which the system minimizes level of service failure magnitude and duration over its design life when subject to exceptional conditions [39]. The new concept comprises both traditional resiliency (failure duration) and vulnerability (failure magnitude) defined by Hashimoto et al. [38]. Therefore, if a different definition of resilience (e.g., [39]) had been used, the results might show that resilience does not decrease whilst reliability and vulnerability increased, but this was left for future studies.
Figure 5.
Resiliencies of the four RBSNs under the historical rainfall (1970–1999) for the test catchments (a) 1001; (b) 1018; (c) 2022 and (d) 5001.
Figure 5.
Resiliencies of the four RBSNs under the historical rainfall (1970–1999) for the test catchments (a) 1001; (b) 1018; (c) 2022 and (d) 5001.

The behavior of vulnerability is quite different from those of the reliability and resiliency. First, the vulnerability does not show large changes as the storage size increases. That is, the deficit in demand and the number of failure days are independent of the storage. The vulnerability focuses on how bad things may become instead of on how long the failure persists, which is described by the resiliency. Therefore, the behavior of the vulnerability is naturally different from that of the resiliency. On the other hand, vulnerability decreases as the number of connection (Nc) increases. This means that the RBSN lowers vulnerability. Table 5 lists the percentage changes in the performance criteria of the test catchment 1001. The results from the simulation using the historical data revealed that sharing rain barrels has benefits for both reliability (7.3% increase for a storage size of 20 cm/m2) and vulnerability (40.0% decrease for a storage size of 10 cm/m2) of the system but not for resiliency (25.0% decrease for a storage size of 20 cm/m2). RBSN shows the largest positive effectiveness on the vulnerability and the smallest effect on the reliability, whereas the resiliency is reduced by RBSN. Therefore, resiliency should be included when the RBSNs are planned and designed.
Figure 6.
Vulnerabilities of four RBSNs under the historical rainfall (1970–1999) for the test catchments (a) 1001; (b) 1018; (c) 2022 and (d) 5001.
Figure 6.
Vulnerabilities of four RBSNs under the historical rainfall (1970–1999) for the test catchments (a) 1001; (b) 1018; (c) 2022 and (d) 5001.
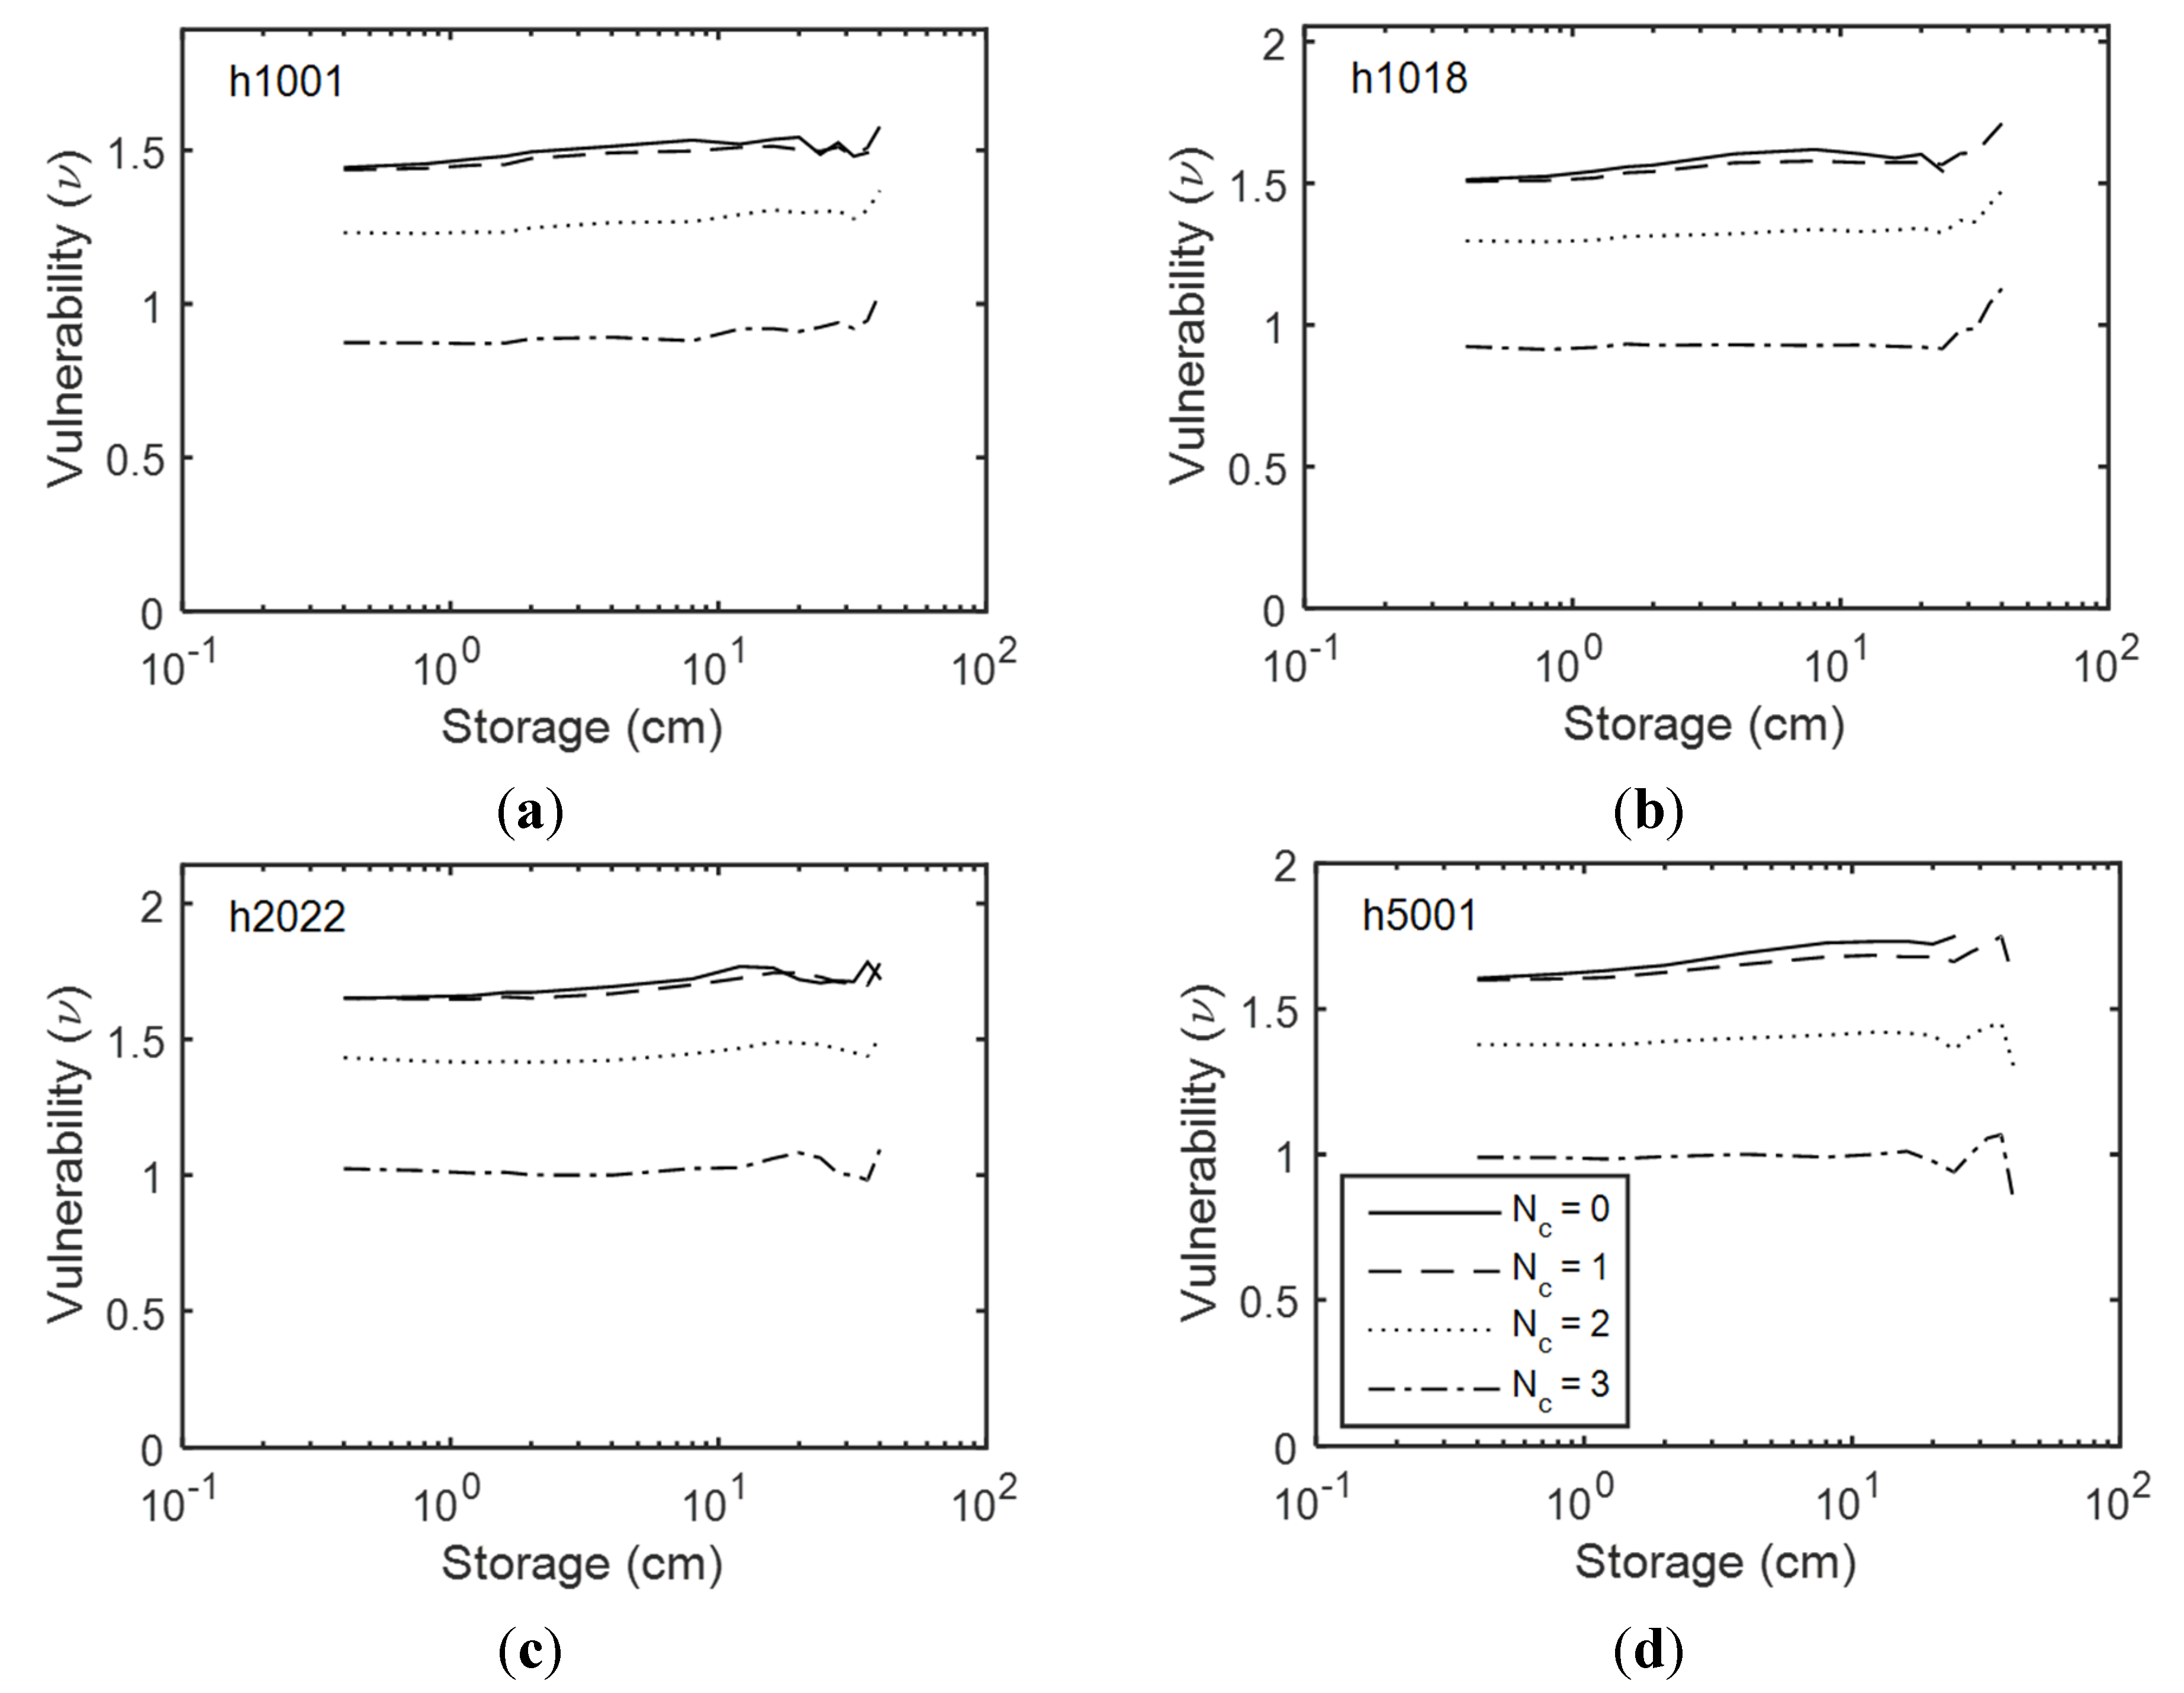
Table 5.
Percentage changes in the performance criteria for historical rainfall data (1970–1999) for 1001.
| Storage (cm/m2) | Nc | Reliability, R | Resiliency, γ | Vulnerability, ν |
|---|---|---|---|---|
| 10 | 1 | −1.4% | 0.0% | −3.3% |
| 2 | 1.4% | −11.1% | −16.7% | |
| 3 | 5.4% | −22.2% | −40.0% | |
| 20 | 1 | 0.0% | −2.8% | −2.0% |
| 2 | 1.2% | −11.1% | −15.3% | |
| 3 | 7.3% | −25.0% | −36.7% |
3.2. Performance of a Sharing Rain Barrel Network under Climate Change
The reliability, resiliency, and vulnerability of RBSNs for four different test catchments were calculated using the climate change scenarios of three GCMs from 2070 to 2099. Figure 7, Figure 8 and Figure 9 show the results for the A1B scenario of CNRM1, respectively.
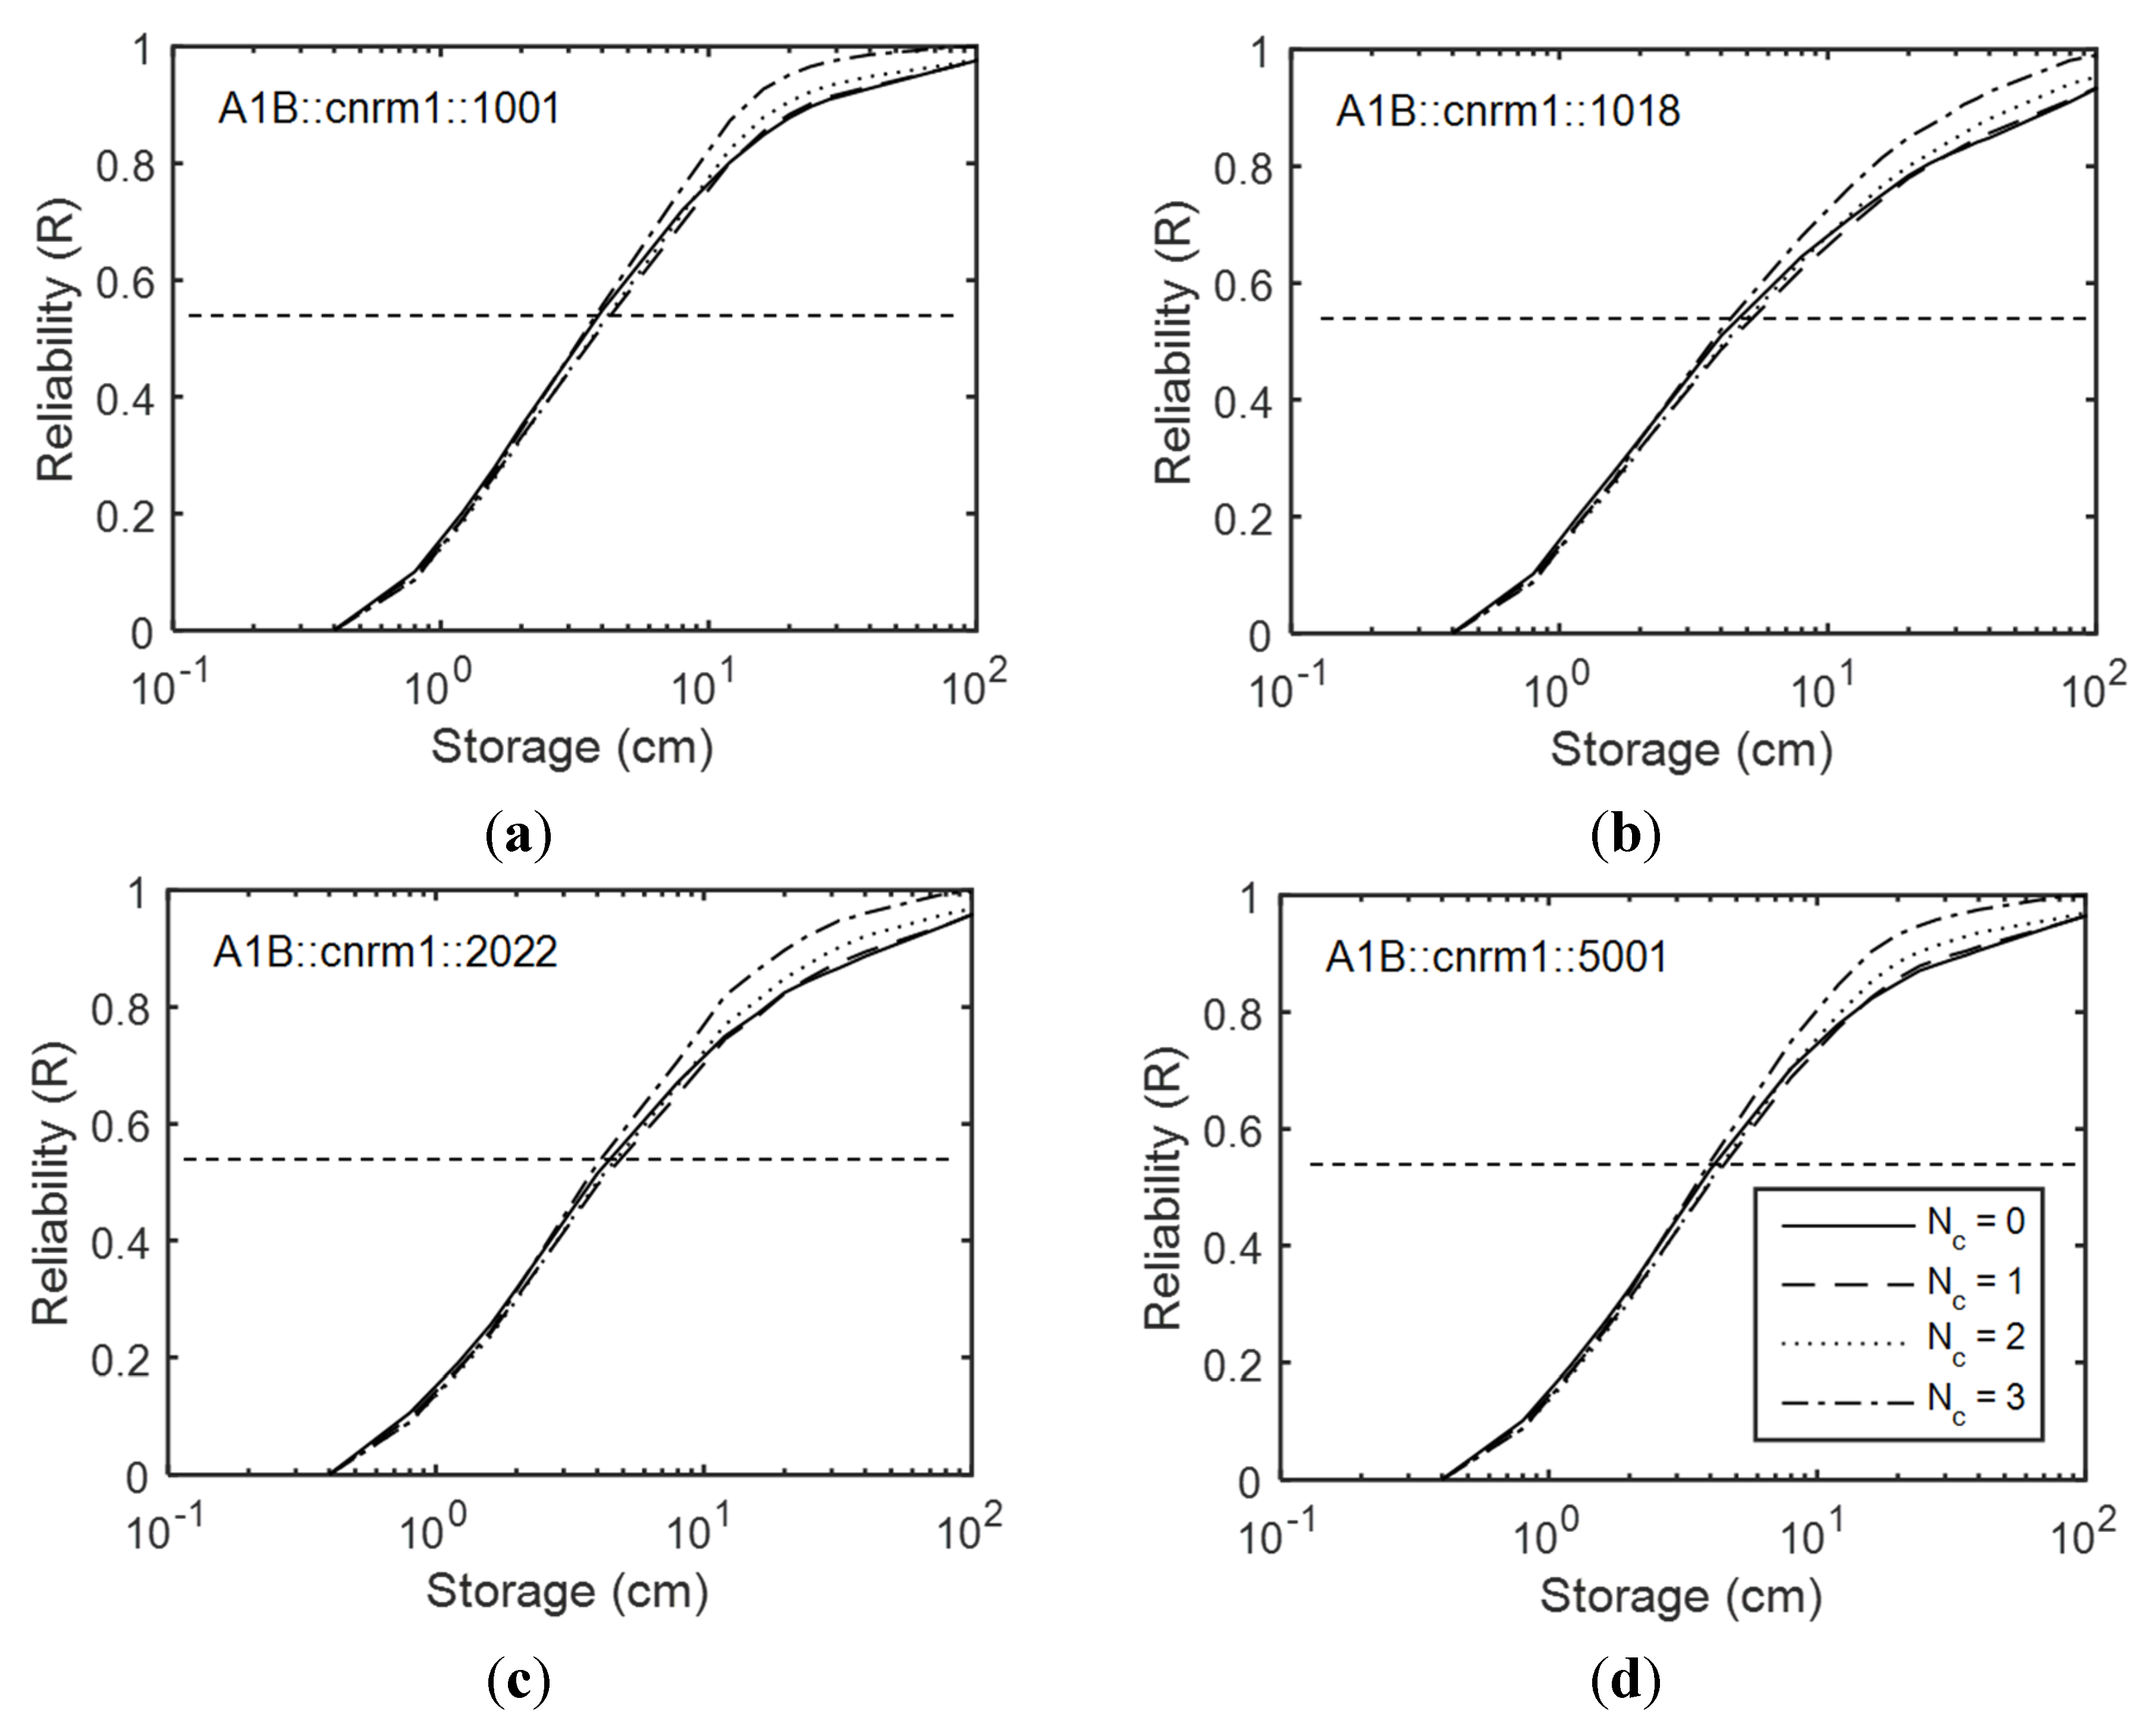
Both reliabilities under the historical and climate change scenarios show similar behaviors. The reliability increases with increasing number of connections (Nc). This is consistent with previous results, as shown in Figure 4. On the other hand, the effect on the reliability under climate change is larger. This means that the storage size for the same target reliability can be reduced under climate change conditions by introducing a sharing strategy. In this regard, the logarithmic scale in the x axis (storage) in Figure 7 implies a large increase in the required storage for target reliability.
Figure 7.
Reliabilities of four RBSNs under a projected climate change scenario (A1B, CNRM1) (2070–2099) for the test catchments (a) 1001; (b) 1018; (c) 2022 and (d) 5001.
Figure 7.
Reliabilities of four RBSNs under a projected climate change scenario (A1B, CNRM1) (2070–2099) for the test catchments (a) 1001; (b) 1018; (c) 2022 and (d) 5001.
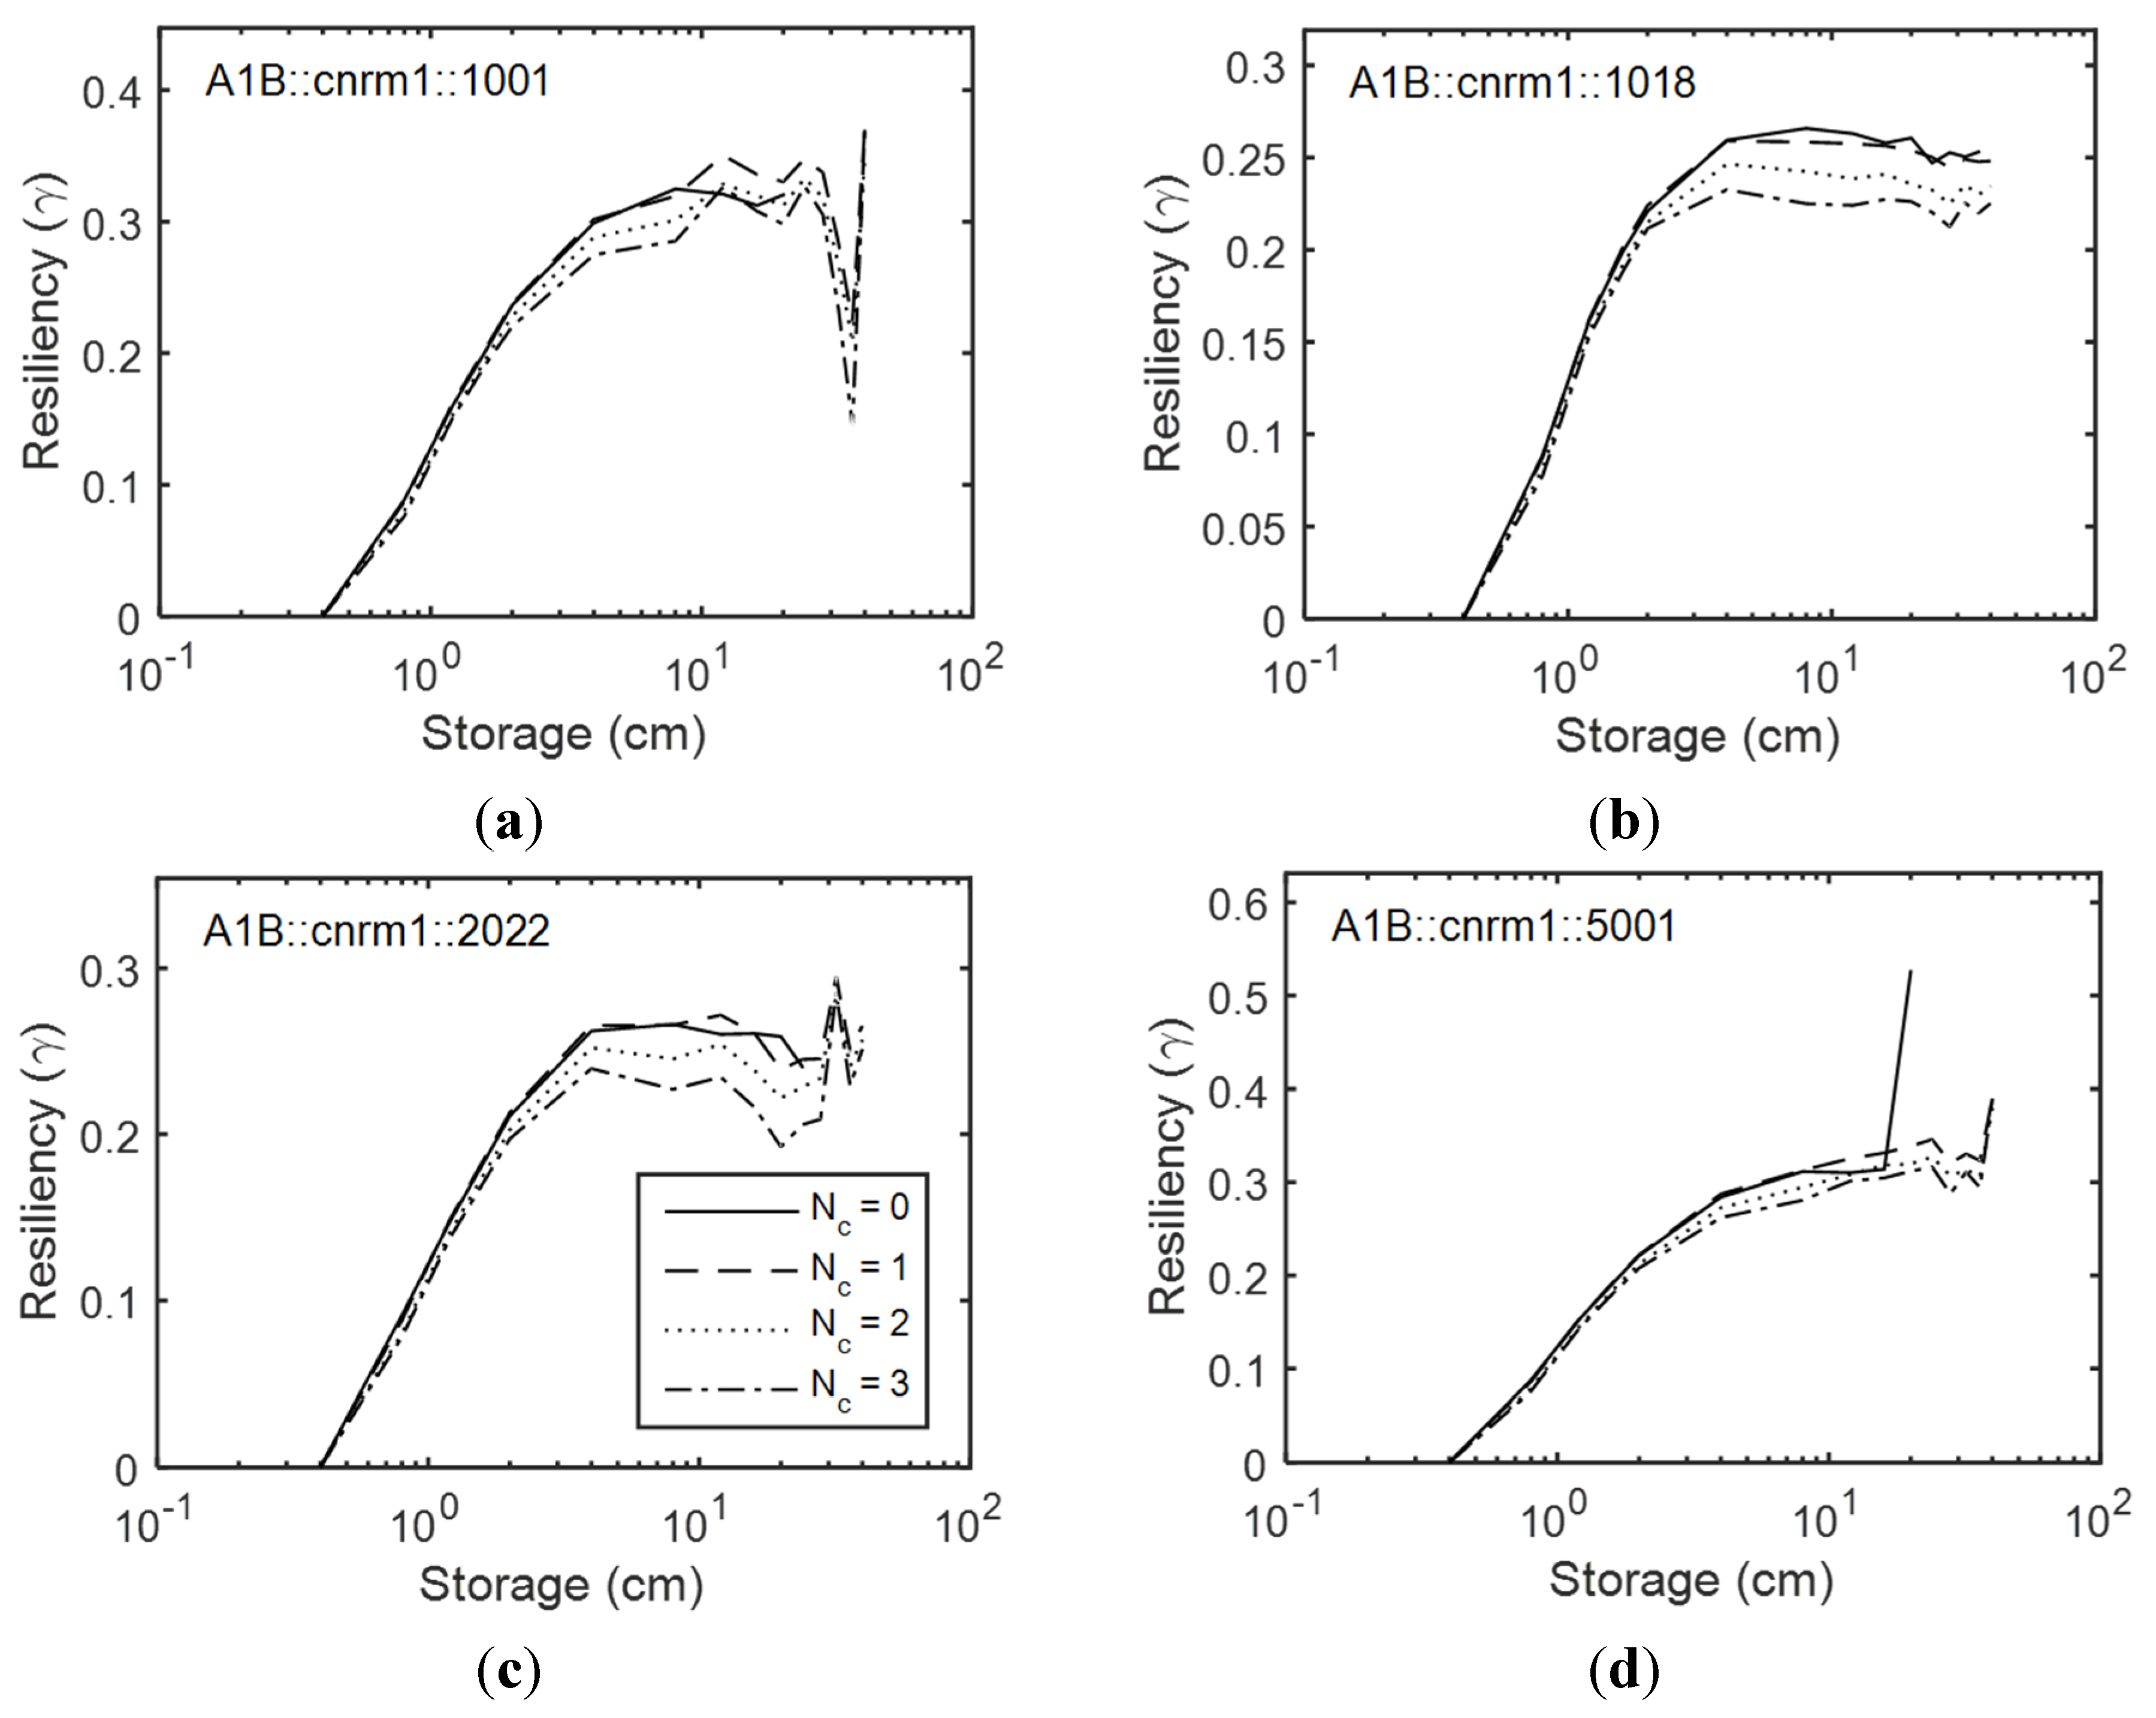
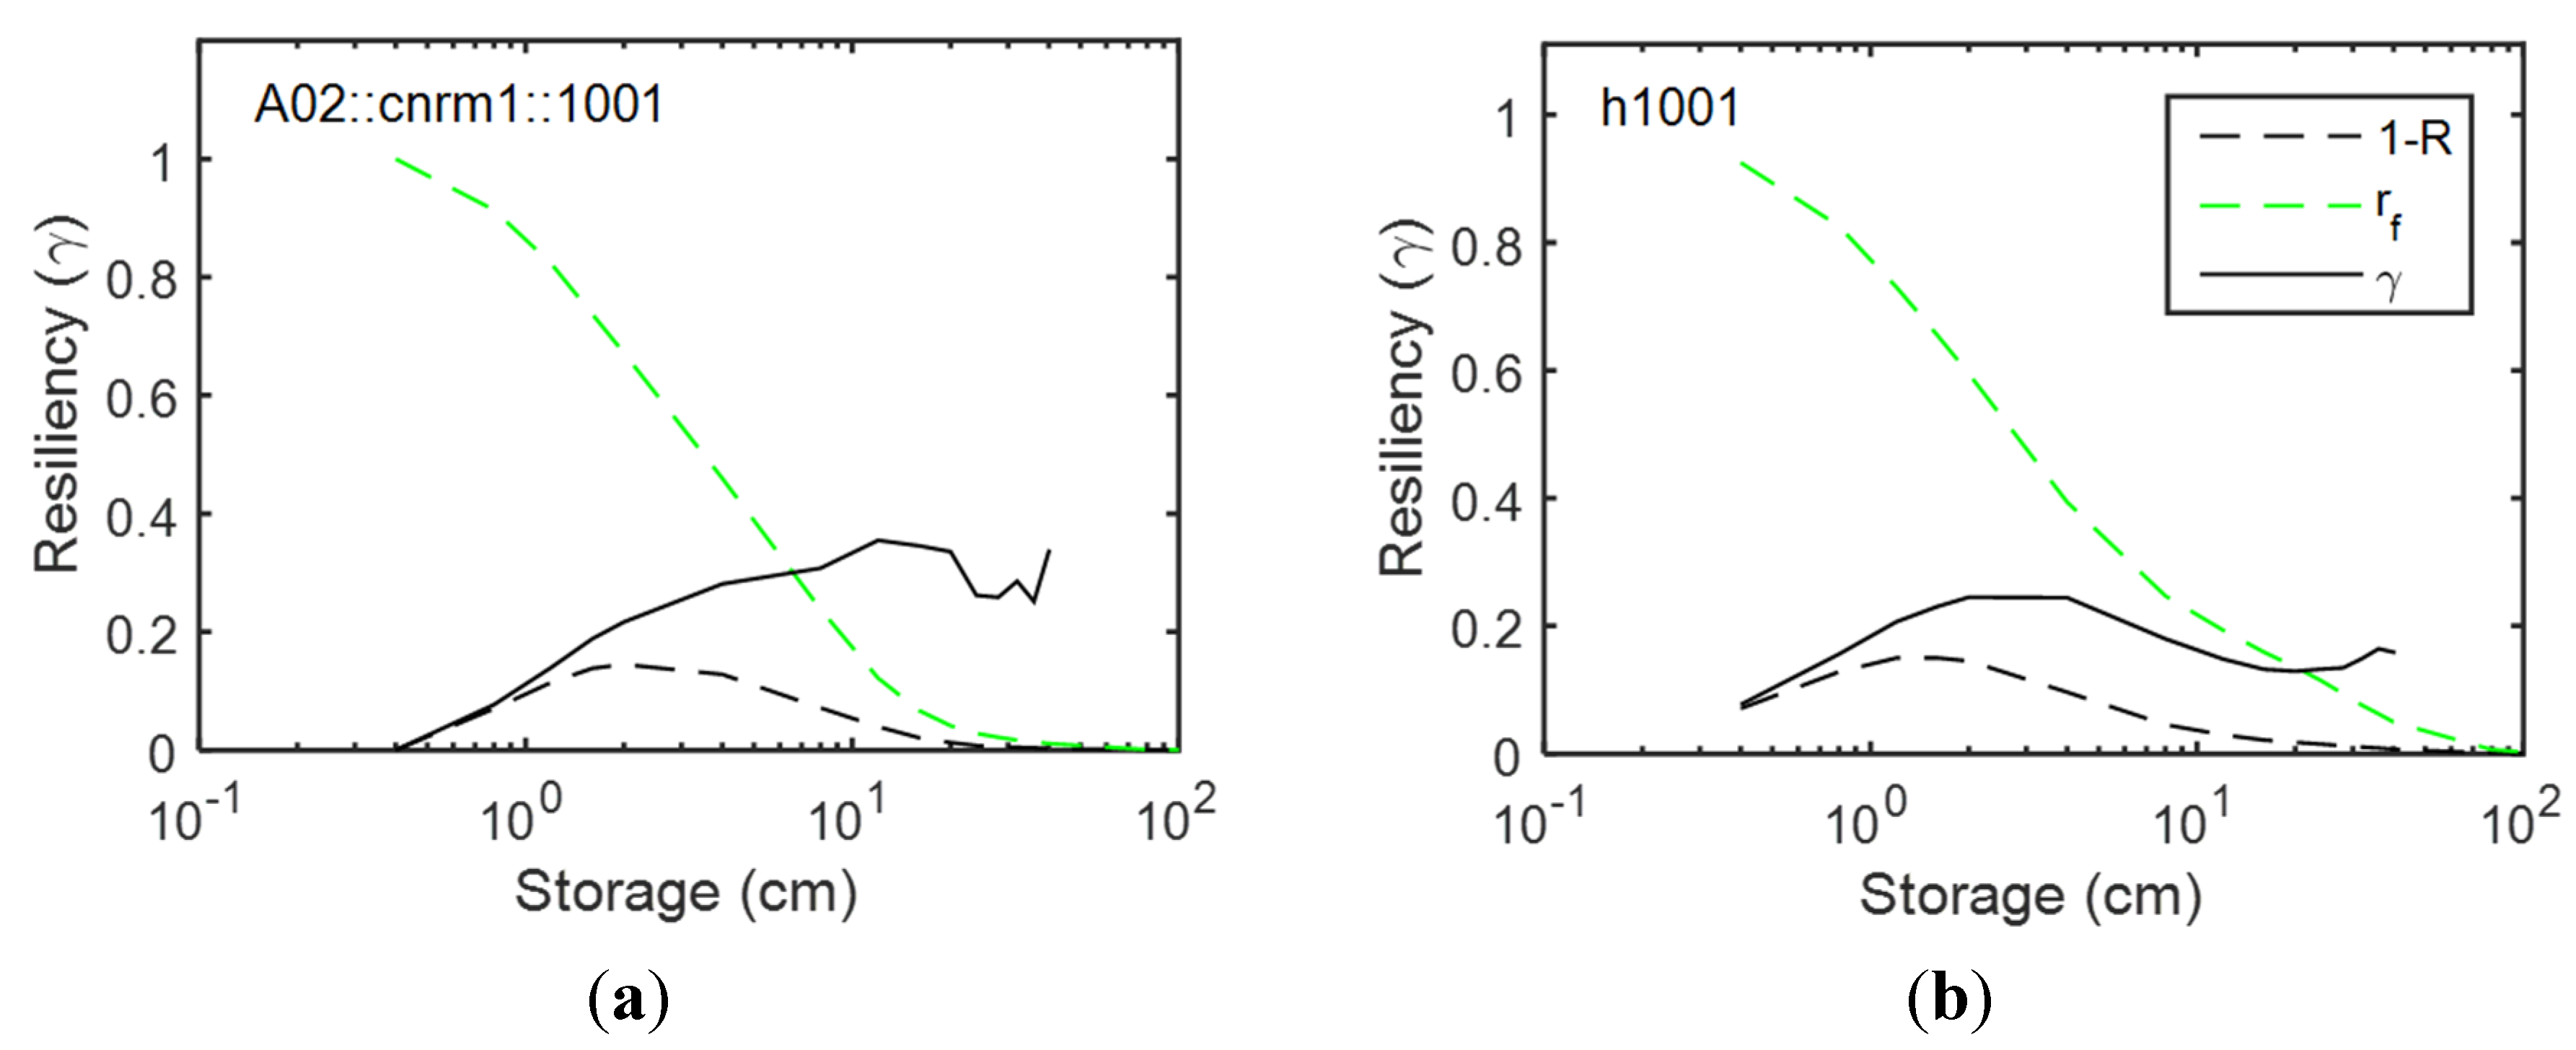
The resiliency increases for three test catchments 1001, 2022, and 5001, but not 1018, as shown in Figure 8. The behavior of the resiliency depending on the number of connection (Nc) is similar to the results from a historical rainfall simulation (Figure 5). That is, the resiliency decreases with an increase in the number of connections (Nc). It can be inferred that a system behaves slowly and becomes less sensitive to external forces (rainfall) as it gets heavier (increasing Nc). The differences in resiliency between the numbers of connections (Nc) decreases under climate change overall. On the other hand, the extent of the reduced resiliency for all test catchments decreases, compared to the historical data simulation (Figure 5). Figure 9 shows the changes in resiliency in terms of (1-R) and rf, which are the components of the resiliency (Equation (11)). As mentioned earlier, the resiliency has its maximum for storage containers from 100 to 101, which is caused mainly by the increasing rf in the corresponding region of the storage containers despite the continuous decreasing (1-R). In addition, the behavior of rf is similar to (1-R) under climate change scenarios, as shown in Figure 9. On the other hand, the reliability increases sharply up to 1 as the storage increases, which is faster than the historical simulation. As a result, the consequent resiliency does not show a peak, which was observed in the historical simulation but not in simulation with climate change scenarios.
Figure 8.
Resiliencies of four RBSNs under a projected climate change scenario (A1B, CNRM1) (2070–2099) for the test catchments (a) 1001; (b) 1018; (c) 2022; and (d) 5001.
Figure 8.
Resiliencies of four RBSNs under a projected climate change scenario (A1B, CNRM1) (2070–2099) for the test catchments (a) 1001; (b) 1018; (c) 2022; and (d) 5001.

Figure 9.
Behavior of the resiliency for (a) historical and (b) climate change scenarios (A2, CNRM1) for a test catchment, 1001 with Nc =3.
Figure 9.
Behavior of the resiliency for (a) historical and (b) climate change scenarios (A2, CNRM1) for a test catchment, 1001 with Nc =3.
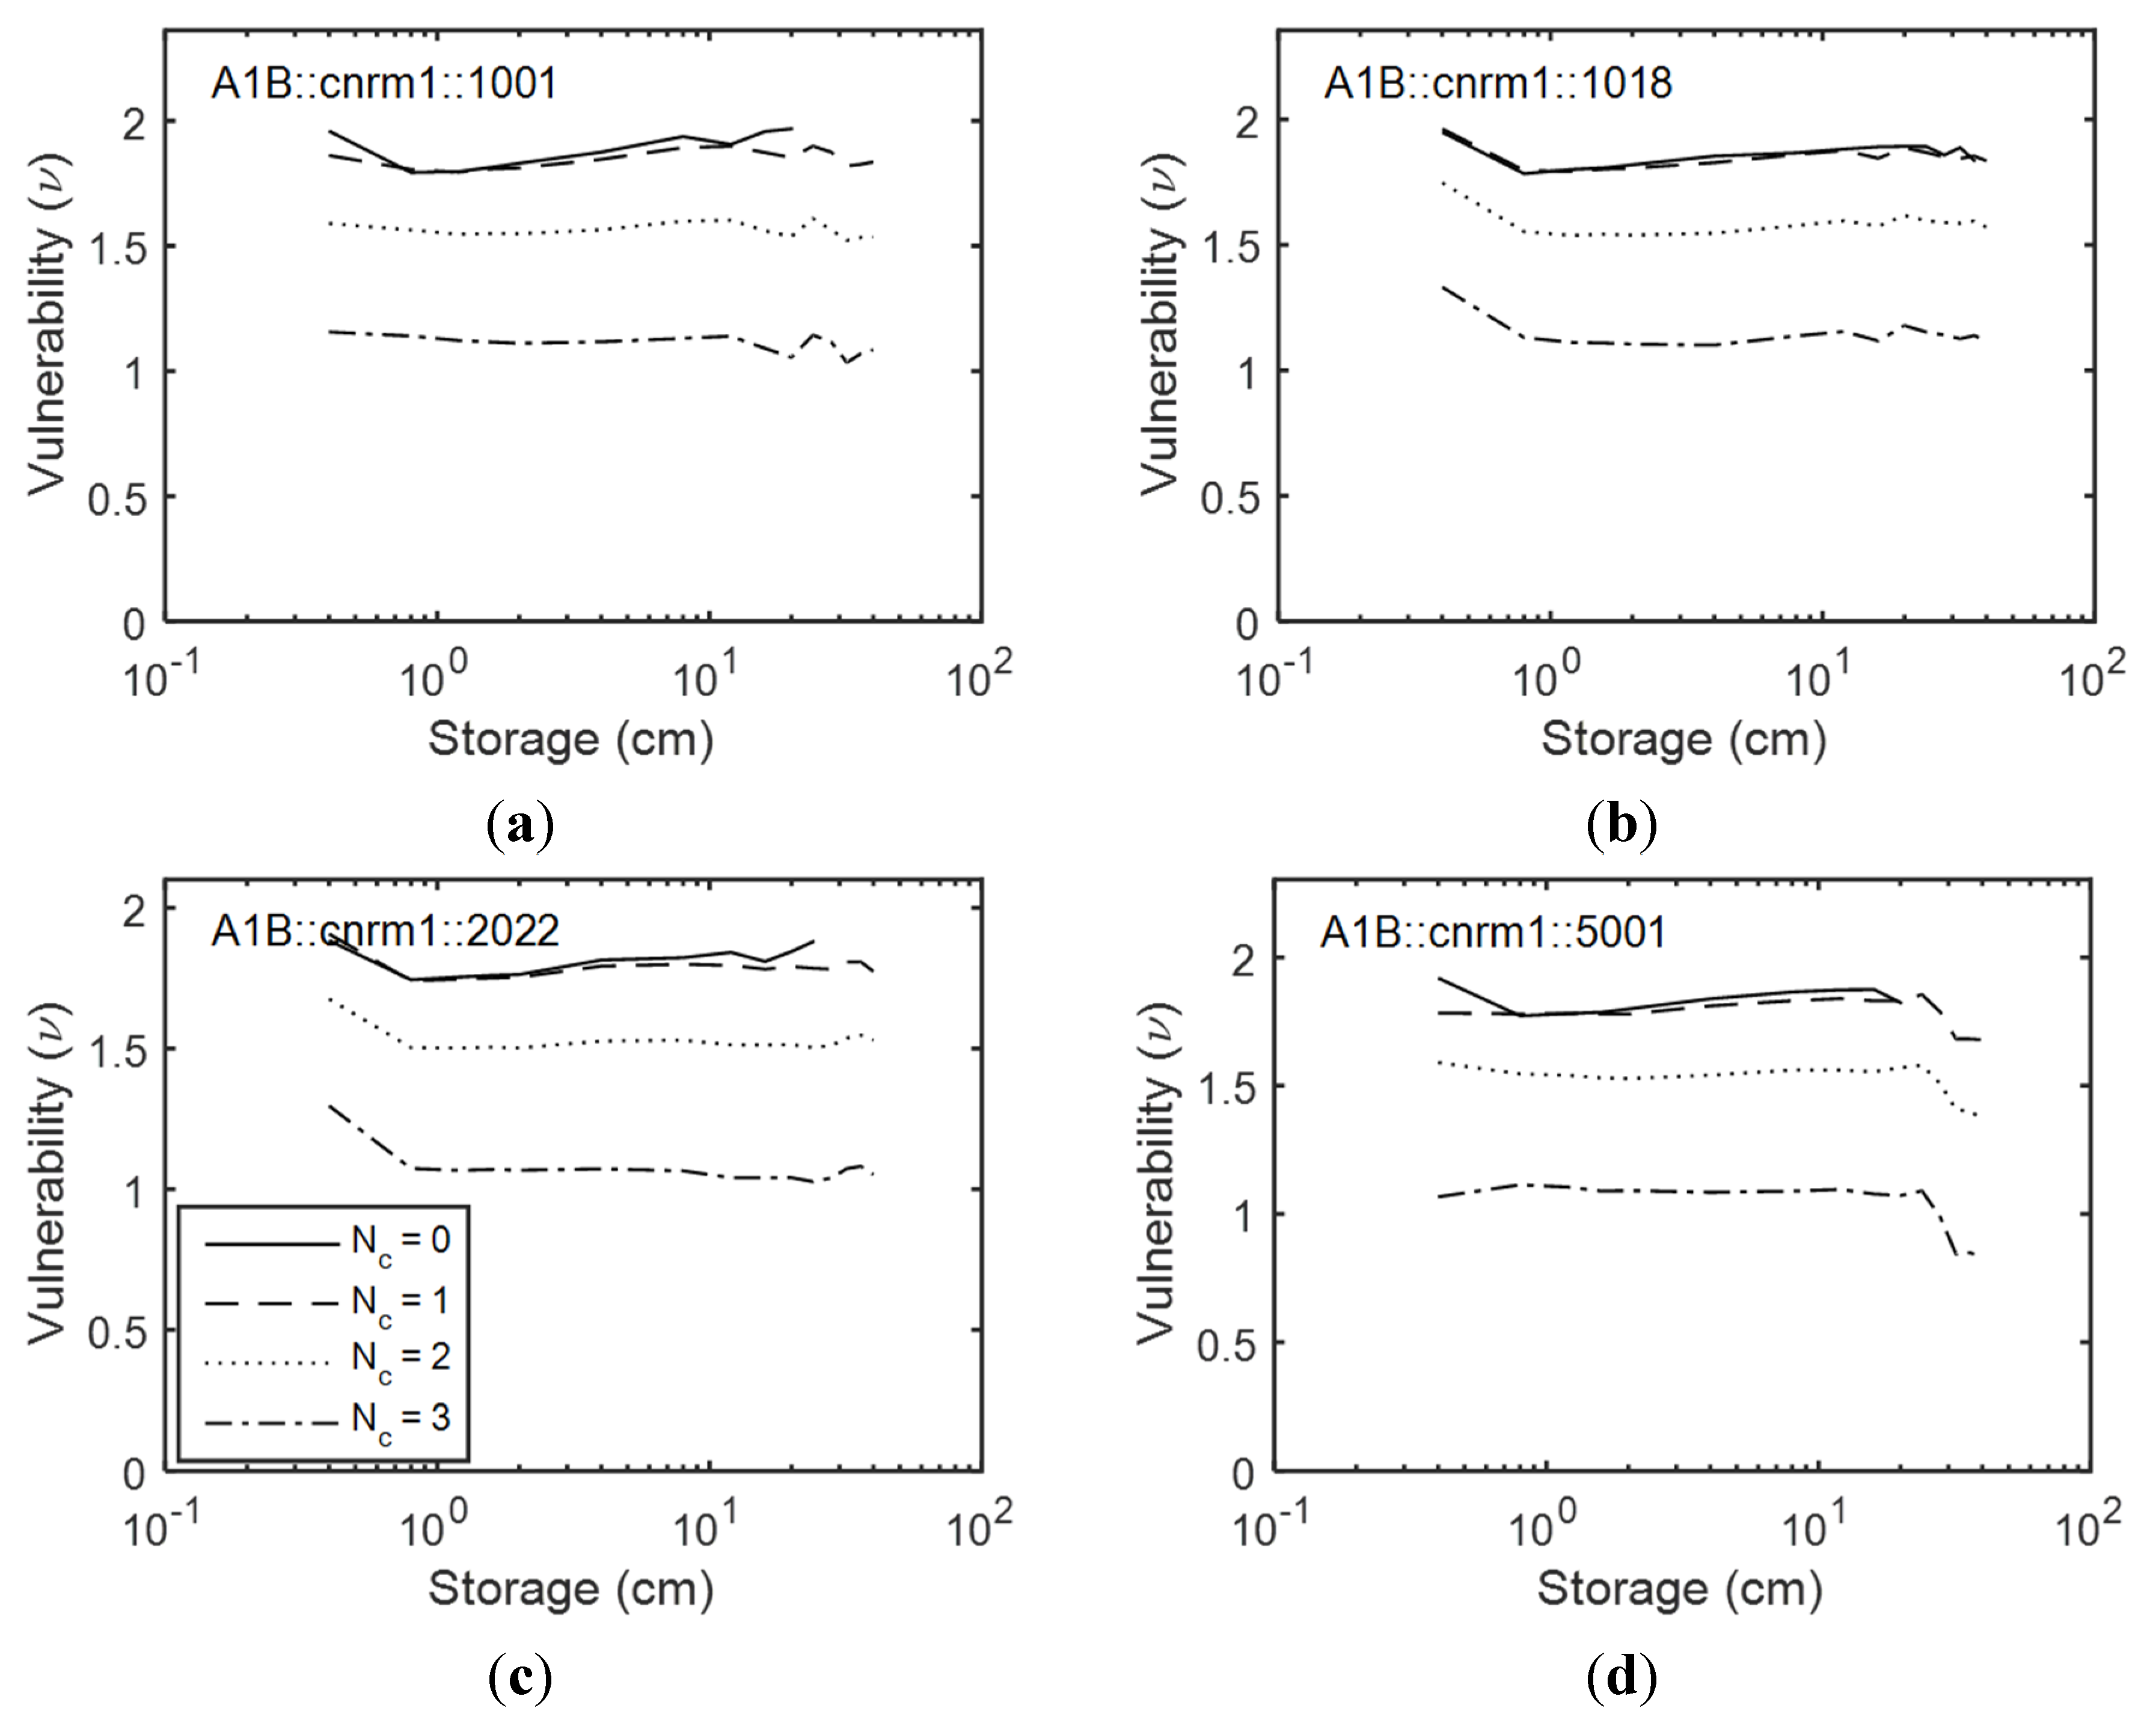
Comparing Figure 6 and Figure 10, the vulnerability itself under climate change is significantly increased. That is, the RBSNs under climate change have experienced more severe failures due to the increased precipitation, compared to the historical climate condition [13]. In other words, the benefit or improvement through the sharing of rain barrels becomes much larger in terms of vulnerability. Therefore, the vulnerability due to climate change can be lowered considerably by the RBSN strategy.
Figure 10.
Vulnerabilities of four RBSNs under a projected climate change scenario (A1B, CNRM1) (2070–2099) for the test catchments (a) 1001; (b) 1018; (c) 2022 and (d) 5001.
Figure 10.
Vulnerabilities of four RBSNs under a projected climate change scenario (A1B, CNRM1) (2070–2099) for the test catchments (a) 1001; (b) 1018; (c) 2022 and (d) 5001.

Table 6 lists the percentage changes in the performance criteria of the test catchment 1001 under climate change. Similar to the results of historical precipitation (Table 5), RBSN shows the largest positive effectiveness on the vulnerability and the small effect on the reliability, whereas the resiliency is reduced by RBSN. Therefore, the resiliency should be included when the RBSNs are planned and designed. The reliability increases to 10.5% and the vulnerability decreases to 46.4% when the number of connections (Nc) is three. In contrast, the resiliency still decreases by 7.7% with the sharing strategy. This result shows that the improvements in the reliability and vulnerability are more prominent under climate change conditions. Moreover, the resiliency, which is negatively affected by sharing, becomes less affected under climate change.
Table 6.
Percentage changes in the performance criteria for the climate change rainfall data (2070–2099) for 1001.
| Storage (cm/m2) | Nc | Reliability, R | Resiliency, γ | Vulnerability, ν |
|---|---|---|---|---|
| 10 | 1 | 0.0% | 4.6% | 0.0% |
| 2 | 1.3% | –1.5% | –15.8% | |
| 3 | 7.9% | –7.7% | –39.5% | |
| 20 | 1 | 0.0% | 4.6% | -5.6% |
| 2 | 4.7% | –1.5% | –20.9% | |
| 3 | 10.5% | –7.7% | –46.4% |
The percentage changes of three performance criteria for the test catchment 1001 were calculated for three climate change scenarios of three GCMs with and without the correlation in the water demands as shown in Table 7. The correlation in the water demands deteriorates the improvement by introducing the RBSN for the A1B scenario regardless of the selection of GCM. In contrast, the correlation does not greatly affect the reliability under A2 and B1 scenarios. The resiliency decreases more under A2 and B1 scenarios compared to its performance under A1B. The vulnerability under different scenarios and GCMs shows little differences and is commonly expected to undergo an approximately 40% reduction through the introduction of a RBSN.
Table 7.
Percentage changes in the performance criteria for the test catchment 1001 (2070–2099) for a storage size of 20 cm/m2 and Nc = 3, depending on GCMs and climate change scenarios.
| Scenario | GCM | Correlation | Reliability, R | Resiliency, γ | Vulnerability, ν |
|---|---|---|---|---|---|
| A1B | CNRM1 | N | 10.5% | −7.7% | −46.4% |
| Y | 6.7% | −3.3% | −36.8% | ||
| CSIRO | N | 10.2% | 6.7% | −41.7% | |
| Y | 8.9% | 3.3% | −31.4% | ||
| ECHO-G | N | 11.8% | 3.2% | −45.0% | |
| Y | 9.2% | −1.7% | −37.5% | ||
| A2 | CNRM1 | N | 9.2% | −18.2% | −45.0% |
| Y | 9.1% | 1.5% | −40.0% | ||
| CSIRO | N | 9.0% | −2.4% | −41.5% | |
| Y | 9.6% | −2.0% | −35.0% | ||
| ECHO-G | N | 8.6% | −16.7% | −36.8% | |
| Y | 10.8% | −22.6% | −42.1% | ||
| B1 | CNRM1 | N | 8.3% | −25.3% | −44.4% |
| Y | 9.6% | −16.7% | −37.1% | ||
| CSIRO | N | 8.3% | −2.0% | −37.5% | |
| Y | 8.3% | −1.2% | −45.0% | ||
| ECHO-G | N | 8.3% | −22.9% | −40.0% | |
| Y | 8.3% | −3.6% | −40.0% |
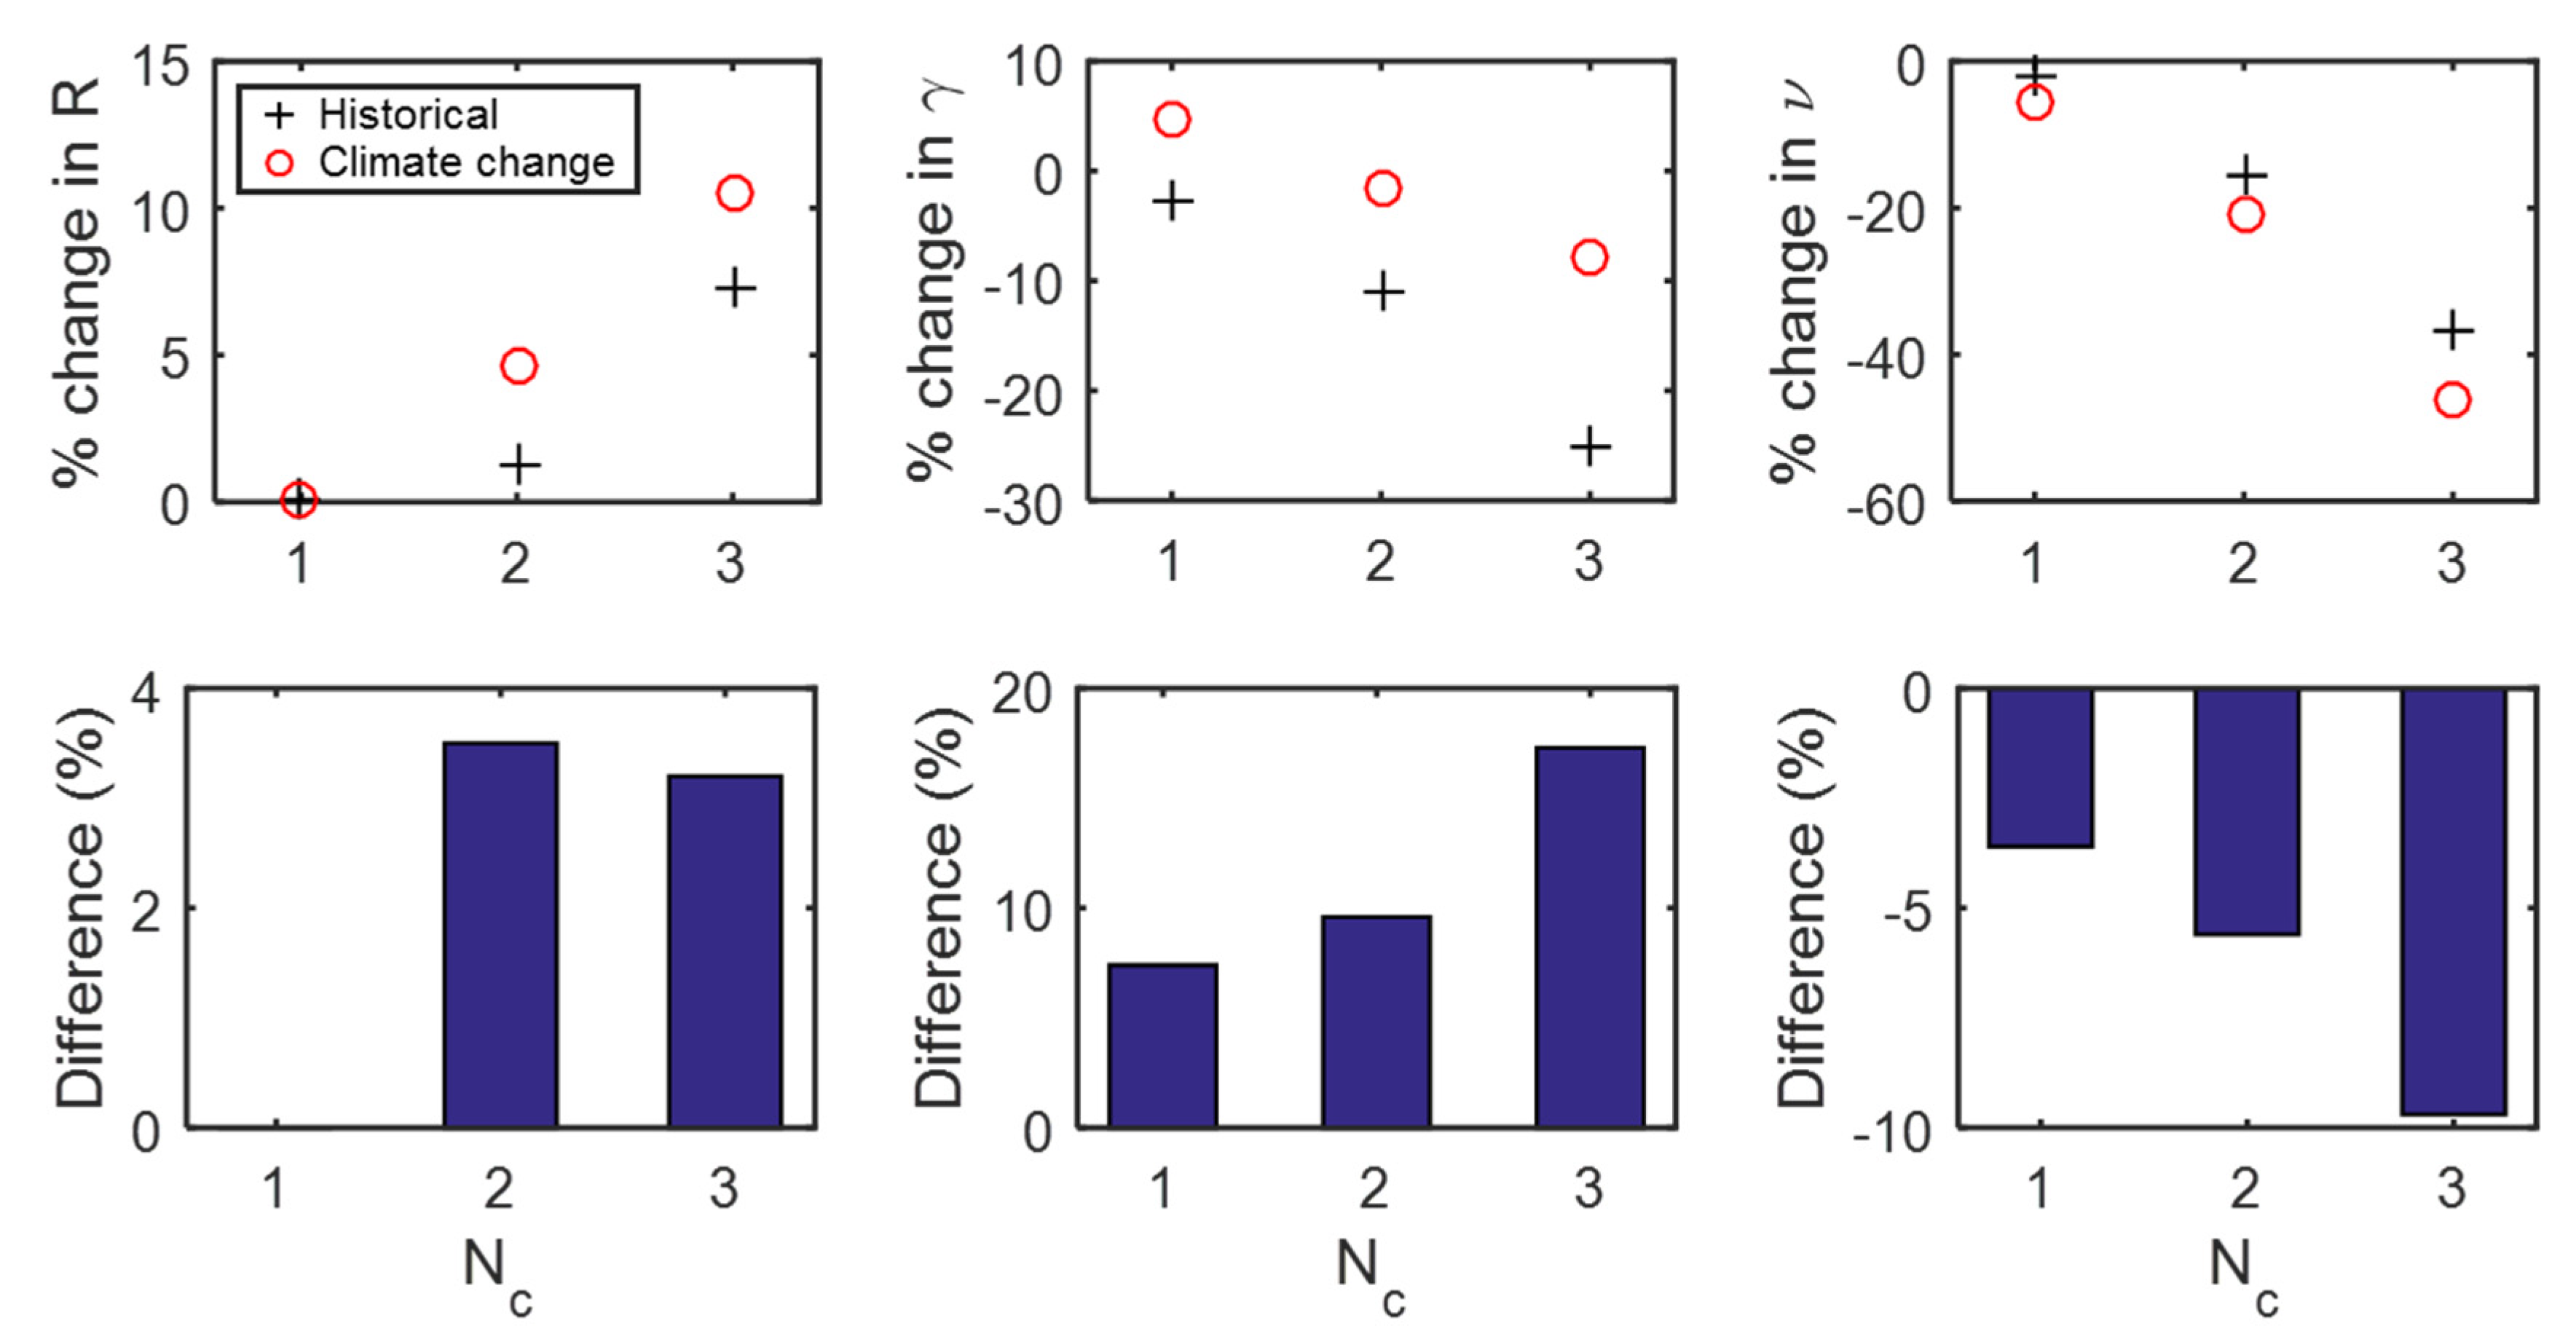
The benefits from the sharing network in terms of the three performance criteria under historical and climate change conditions (A1B, CNRM1) were compared for a specific storage size of 20 cm/m2 as shown in Figure 11. As a result, under climate change conditions, the benefit from RBSNs generally increases the overall performance in terms of reliability, resiliency and vulnerability. The reliability and the resiliency increase to 3.5% and 17.3%, respectively, and the vulnerability decreases to −9.7% under climate change. Therefore, the sharing strategies of several rain barrels will be an effective climate change adaptation measure in South Korea.
Figure 11.
Comparison of the benefits from the sharing network in terms of performance criteria under historical (1970–1999) and climate change conditions (2070–2099) for a storage size of 20 cm/m2.
Figure 11.
Comparison of the benefits from the sharing network in terms of performance criteria under historical (1970–1999) and climate change conditions (2070–2099) for a storage size of 20 cm/m2.

4. Conclusions
This study proposed three performance criteria in a sample community with four prospective users under historical and plausible climate change conditions. This study showed that the reliability, resiliency, and vulnerability should be evaluated to consider the various impacts of RBSNs. As a result, the benefits from RBSNs in terms of the reliability and vulnerability are strengthened but the negative impacts occur in resiliency under both historical and climate change scenarios. Historical simulation results showed that reliability and vulnerability were improved by up to 7.3% and 36.7%, respectively, whereas climate change scenarios showed that both were improved up to 10.5% and 46.4%, respectively. Historical and climate change simulation (A1B) showed that the resiliency was reduced by up to 25% and 7.7%, respectively. That is, the resiliency should be included when the RBSNs are planned and designed. This also shows that improvements for reliability and vulnerability are more prominent under climate change conditions and the resiliency, which is adversely affected by sharing, becomes less affected under climate change. Furthermore, the heterogeneous users with more different means and variances reduce the improvement due to the introduction of RBSNs for the A1B scenario of all GCMs considered.
The climate change impacts depend on the changes in the external influences, such as increased monthly variations of precipitation and extended dry seasons, as well as the adaptive capacity of the system, which can be improved by adaptation or mitigation strategies for climate change. This study suggests that RBSNs can be a potential adaptation strategy that strengthens the vulnerability and the reliability of the water resources system and reduces the extent of reduced resiliency for the future climate change scenarios. The benefit of RBSNs envisions a new societal strategy for countries where RWHSs are chosen in order to address a number of social, economic, and environmental problems, which might worsen in the future.
Acknowledgments
This study was supported by the Basic Science Research Program of the National Research Foundation of Korea (NRF) from the Ministry of Science, Information and Communication Technology (ICT) and Future Planning (NRF–2013R1A1A1058964) and also supported by a grant from a Strategic Research Project funded by the Korea Institute of Civil Engineering and Building Technology.
Author Contributions
Yongwon Seo proposed the basic idea of the research. Seong Jin Noh performed the numerical simulation. The manuscript was written by Seong Jin Noh with the contribution of Eun-Sung Chung and Yongwon Seo.
Conflicts of Interest
The authors declare no conflict of interest.
References
- Pacey, A.; Cullis, A. Rainwater Harvesting: The Collection of Rainfall and Runoff in Rural Areas; ITDG Publishing: London, UK, 1986. [Google Scholar]
- Ludwig, A. Water Storage: Tanks, Cisterns, Aquifers, and Ponds for Domestic Supply, Fire and Emergency Use—Includes How to Make Ferrocement Water Tanks; Oasis Design: Santa Barbara, CA, USA, 2005. [Google Scholar]
- Su, M.D.; Lin, C.H.; Chang, L.F.; Kang, J.L.; Lin, M.C. A probabilistic approach to rainwater harvesting systems design and evaluation. Resour. Conserv. Recycl. 2009, 53, 393–399. [Google Scholar] [CrossRef]
- Abdulla, F.A.; Al-Shareef, A.W. Roof rainwater harvesting systems for household water supply in Jordan. Desalination 2009, 243, 195–207. [Google Scholar] [CrossRef]
- Fewkes, A. Modelling the performance of rainwater collection systems: Towards a generalised approach. Urban Water 2000, 1, 323–333. [Google Scholar] [CrossRef]
- Ghisi, E.; Bressan, D.L.; Martini, M. Rainwater tank capacity and potential for potable water savings by using rainwater in the residential sector of Southeastern Brazil. Build. Environ. 2007, 42, 1654–1666. [Google Scholar] [CrossRef]
- Imteaz, M.A.; Ahsan, A.; Naser, J.; Rahman, A. Reliability analysis of rainwater tanks in Melbourne using daily water balance model. Resour. Conserv. Recycl. 2011, 56, 80–86. [Google Scholar] [CrossRef]
- Basinger, M.; Montalto, F.; Lall, U. A rainwater harvesting system reliability model based on nonparametric stochastic rainfall generator. J. Hydrol. 2010, 392, 105–118. [Google Scholar] [CrossRef]
- Villarreal, E.L.; Dixon, A. Analysis of a rainwater collection system for domestic water supply in Ringdansen, Norrkoping, Sweden. Build. Environ. 2005, 40, 1174–1184. [Google Scholar] [CrossRef]
- Fox, P.; Rockström, J.; Barron, J. Risk analysis and economic viability of water harvesting for supplemental irrigation in semi-arid Burkina Faso and Kenya. Agric. Syst. 2005, 83, 231–250. [Google Scholar] [CrossRef]
- Liaw, C.H.; Tsai, Y.L. Optimum storage volume of rooftop rain water harvesting systems for domestic use. J. Am. Water Resour. Assoc. 2004, 40, 901–912. [Google Scholar] [CrossRef]
- Daigger, G.T. Evolving urban water and residuals management paradigms: Water reclamation and reuse, decentralization, and resource recovery. Water Environ. Res. 2009, 81, 809–823. [Google Scholar] [CrossRef] [PubMed]
- Youn, S.G.; Chung, E.S.; Kang, W.G.; Sung, J.H. Probabilistic estimation of the storage capacity of a rainwater harvesting system considering climate change. Resour. Conserv. Recycl. 2012, 65, 136–144. [Google Scholar] [CrossRef]
- Jenkins, D.; Pearson, F.; Moore, E.; Sun, J.K.; Valentine, R. Feasibility of Rainwater Collection System in California; California Water Resources Center, University of California: Davis, CA, USA, 1978. [Google Scholar]
- Mitchell, V.G. How important is the selection of computational analysis method to the accuracy of rainwater tank behaviour modelling? Hydrol. Process. 2007, 21, 2850–2861. [Google Scholar] [CrossRef]
- Guo, Y.P.; Baetz, B.W. Sizing of rainwater storage units for green building applications. J. Hydrol. Eng. 2007, 12, 197–205. [Google Scholar] [CrossRef]
- Hanson, L.; Vogel, R.; Kirshen, P.; Shanahan, P.; Starrett, S. Generalized storage-reliability-yield equations rainwater harvesting systems. In Proceedings of the World Environmental & Water Resources Congress, Kansas City, MO, USA, 17–19 May 2009; pp. 1–10.
- Campisano, A.; Modica, C. Optimal sizing of storage tanks for domestic rainwater harvesting in sicily. Resour. Conserv. Recycl. 2012, 63, 9–16. [Google Scholar] [CrossRef]
- Rahman, A.; Keane, J.; Imteaz, M.A. Rainwater harvesting in greater Sydney: Water savings, reliability and economic benefits. Resour. Conserv. Recycl. 2012, 61, 16–21. [Google Scholar] [CrossRef]
- Bhattacharjee, A. Rainwater Bank: A Self-Sufficient Solution of Water Supply System in Bangladesh. Master’s Thesis, Seoul National University, Seoul, Korea, August 2014. [Google Scholar]
- Hajani, E.; Rahman, A. Reliability and cost analysis of a rainwater harvesting system in Peri-urban regions of greater Sydney, Australia. Water 2014, 6, 945–960. [Google Scholar] [CrossRef]
- Burns, M.J.; Fletcher, T.D.; Duncan, H.P.; Hatt, B.E.; Ladson, A.R.; Walsh, C.J. The performance of rainwater tanks for stormwater retention and water supply at the household scale: An empirical study. Hydrol. Process. 2015, 29, 152–160. [Google Scholar] [CrossRef]
- Lash, D.; Ward, S.; Kershaw, T.; Butler, D.; Eames, M. Robust rainwater harvesting: Probabilistic tank sizing for climate change adaptation. J. Water Clim. Chang. 2014, 5, 526–539. [Google Scholar] [CrossRef] [Green Version]
- Palla, A.; Gnecco, I.; Lanza, L.G.; la Barbera, P. Performance analysis of domestic rainwater harvesting systems under various European climate zones. Resour. Conserv. Recycl. 2012, 62, 71–80. [Google Scholar] [CrossRef]
- Lo, K.; Koralegedara, S. Effects of climate change on urban rainwater harvesting in Colombo city, Sri Lanka. Environments 2015, 2, 105–124. [Google Scholar] [CrossRef]
- Intergovernmental Panel on Climate Change (IPCC). Climate Change 2007: Synthesis Report. Contribution of Working Groups i, ii and iii to the Fourth Assessment Report of the Intergovernmental Panel on Climate Change; IPCC: Geneva, Switzerland, 2007; p. 104. [Google Scholar]
- Arnell, N.; Liu, C.; Compagnucci, R.; Cunha, L.D.; Hanaki, K.; Howe, C.; Mailu, G.; Shiklomanov, I.; Stakhiv, E. Hydrology and water resources. In Climage Change 2001: Impacts, Adptation and Vulnerability. Contributions of Working Group ii to the Third Assessment Report of the Intergovernmental Panel on Climate Change; MacCarthy, J.J., Canziani, O.F., Dokken, D.J., White, K.S., Eds.; Cambridge University Press: Cambridge, UK, 2001; pp. 191–234. [Google Scholar]
- Smit, B.; Pilifosova, O.; Burton, I.; Challenger, B.; Huq, S.; Klein, R.J.T.; Yohe, G. Adaptation to climate change in the context of sustainable development and equity. In Working Group II: Impacts, Adaptation and Vulnerability; MacCarthy, J.J., Canziani, O.F., Dokken, D.J., White, K.S., Eds.; Cambridge University Press: Cambridge, UK, 2001; pp. 877–912. [Google Scholar]
- Seo, Y.; Choi, N.J.; Park, D. Effect of connecting rain barrels on the storage size reduction. Hydrol. Process. 2012, 26, 3538–3551. [Google Scholar] [CrossRef]
- Seo, Y.; Ahn, J.; Kim, Y.O. The impact of climate change on the benefit of a rain barrel sharing network. Resour. Conserv. Recycl. 2013, 74, 66–74. [Google Scholar] [CrossRef]
- Seo, Y.; Park, S.Y.; Kim, Y.O. Potential benefits from sharing rainwater storages depending on characteristics in demand. Water 2015, 7, 1013–1029. [Google Scholar] [CrossRef]
- Rahman, M.; Yusuf, F.U.A.M.S. Rainwater harvesting and the reliability concept. In Proceedings of the 8th ASCE Specialty Conference on Probabilistic Mechanics and Structural Reliability, Notre Dame, IN, USA, 24–26 July 2000.
- Imteaz, M.A.; Rahman, A.; Ahsan, A. Reliability analysis of rainwater tanks: A comparison between south-east and central Melbourne. Resour. Conserv. Recycl. 2012, 66, 1–7. [Google Scholar] [CrossRef]
- Intergovernmental Panel on Climate Change (IPCC). Special Report on Emissions Scenarios: A Special Report of Working Group iii of the Intergovernmental Panel on Climate Change; Cambridge University Press: Cambridge, UK, 2000; p. 570. [Google Scholar]
- Ministry of Land, Transport and Maritime Affairs. Climate Change Assessment and Projection for Hydrology in Korea; Seoul National University: Seoul, Korea, 2011; p. 619.
- Sharpley, A.N.; Williams, J.R. Erosion Productivity Impact Calculator: 1. Model Documentation (EPIC); Unitied States Department of Agriculture: Washington, DC, USA, 1990; p. 235.
- Kim, K.Y.; North, G.R. EOFs of harmonizable cyclostationary processes. J. Atmos. Sci. 1997, 54, 2416–2427. [Google Scholar] [CrossRef]
- Hashimoto, T.; Stedinger, J.R.; Loucks, D.P. Reliability, resiliency, and vulnerability criteria for water resource system performance evaluation. Water Resour. Res. 1982, 18, 14–20. [Google Scholar] [CrossRef]
- Butler, D.; Farmani, R.; Fu, G.; Ward, S.; Diao, K.; Astaraie-Imani, M. A new approach to urban water management: Safe and sure. Procedia Eng. 2014, 89, 347–354. [Google Scholar] [CrossRef] [Green Version]
© 2015 by the authors; licensee MDPI, Basel, Switzerland. This article is an open access article distributed under the terms and conditions of the Creative Commons Attribution license (http://creativecommons.org/licenses/by/4.0/).
Share and Cite
MDPI and ACS Style
Noh, S.J.; Chung, E.-S.; Seo, Y. Performance of a Rain Barrel Sharing Network under Climate Change. Water 2015, 7, 3466-3485. https://doi.org/10.3390/w7073466
AMA Style
Noh SJ, Chung E-S, Seo Y. Performance of a Rain Barrel Sharing Network under Climate Change. Water. 2015; 7(7):3466-3485. https://doi.org/10.3390/w7073466
Chicago/Turabian StyleNoh, Seong Jin, Eun-Sung Chung, and Yongwon Seo. 2015. "Performance of a Rain Barrel Sharing Network under Climate Change" Water 7, no. 7: 3466-3485. https://doi.org/10.3390/w7073466