
Stormwater Field Evaluation and Its Challenges of a Sediment Basin with Skimmer and Baffles at a Highway Construction Site


Abstract
:1. Introduction

2. Data Collection Plan
2.1. Rainfall and Flow Monitoring


2.2. Stormwater Runoff Sampling
2.3. Turbidity and TSS Measurements of Stormwater Runoff Samples
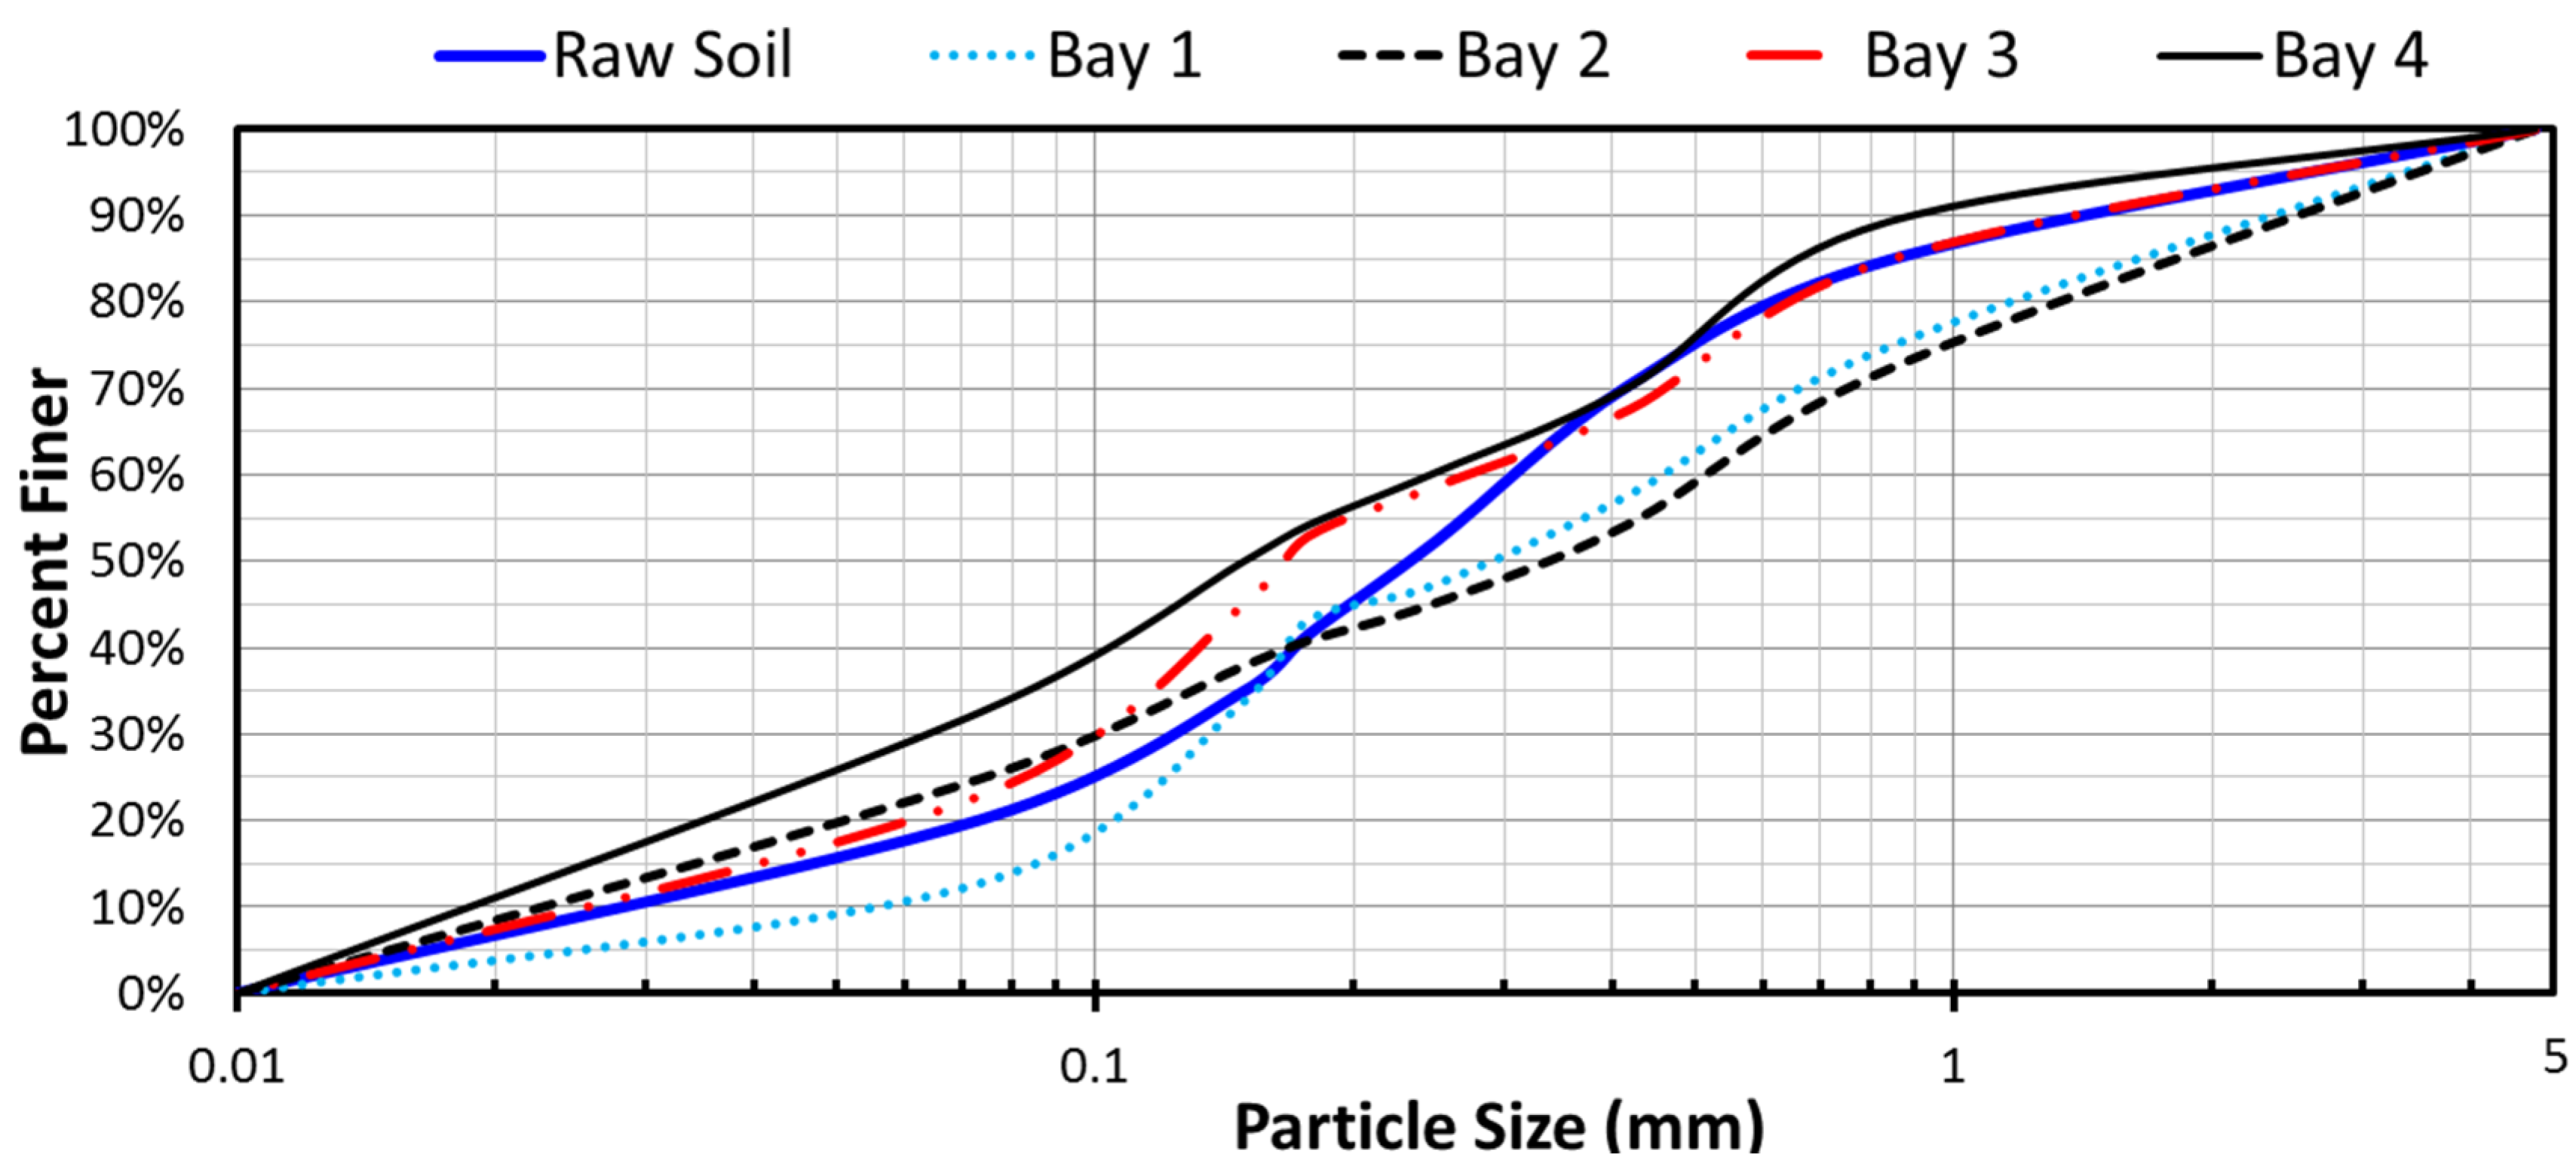
2.4. Soil Samples for Determining Particle-Size Distribution
2.5. Sediment Basin Survey
3. Sediment Basin at Franklin County, AL, USA
3.1. Study Site
3.2. Data Collection Phases
4. Performance Data of the Sediment Basin
4.1. Phase I Results

| Date 1 | Rainfall [mm (mm/h)] 2 | No of Data | Turbidity (NTU) | TSS (mg/L) | ||||||
|---|---|---|---|---|---|---|---|---|---|---|
| Max | Min | Avg. | STD | Max | Min | Avg. | STD | |||
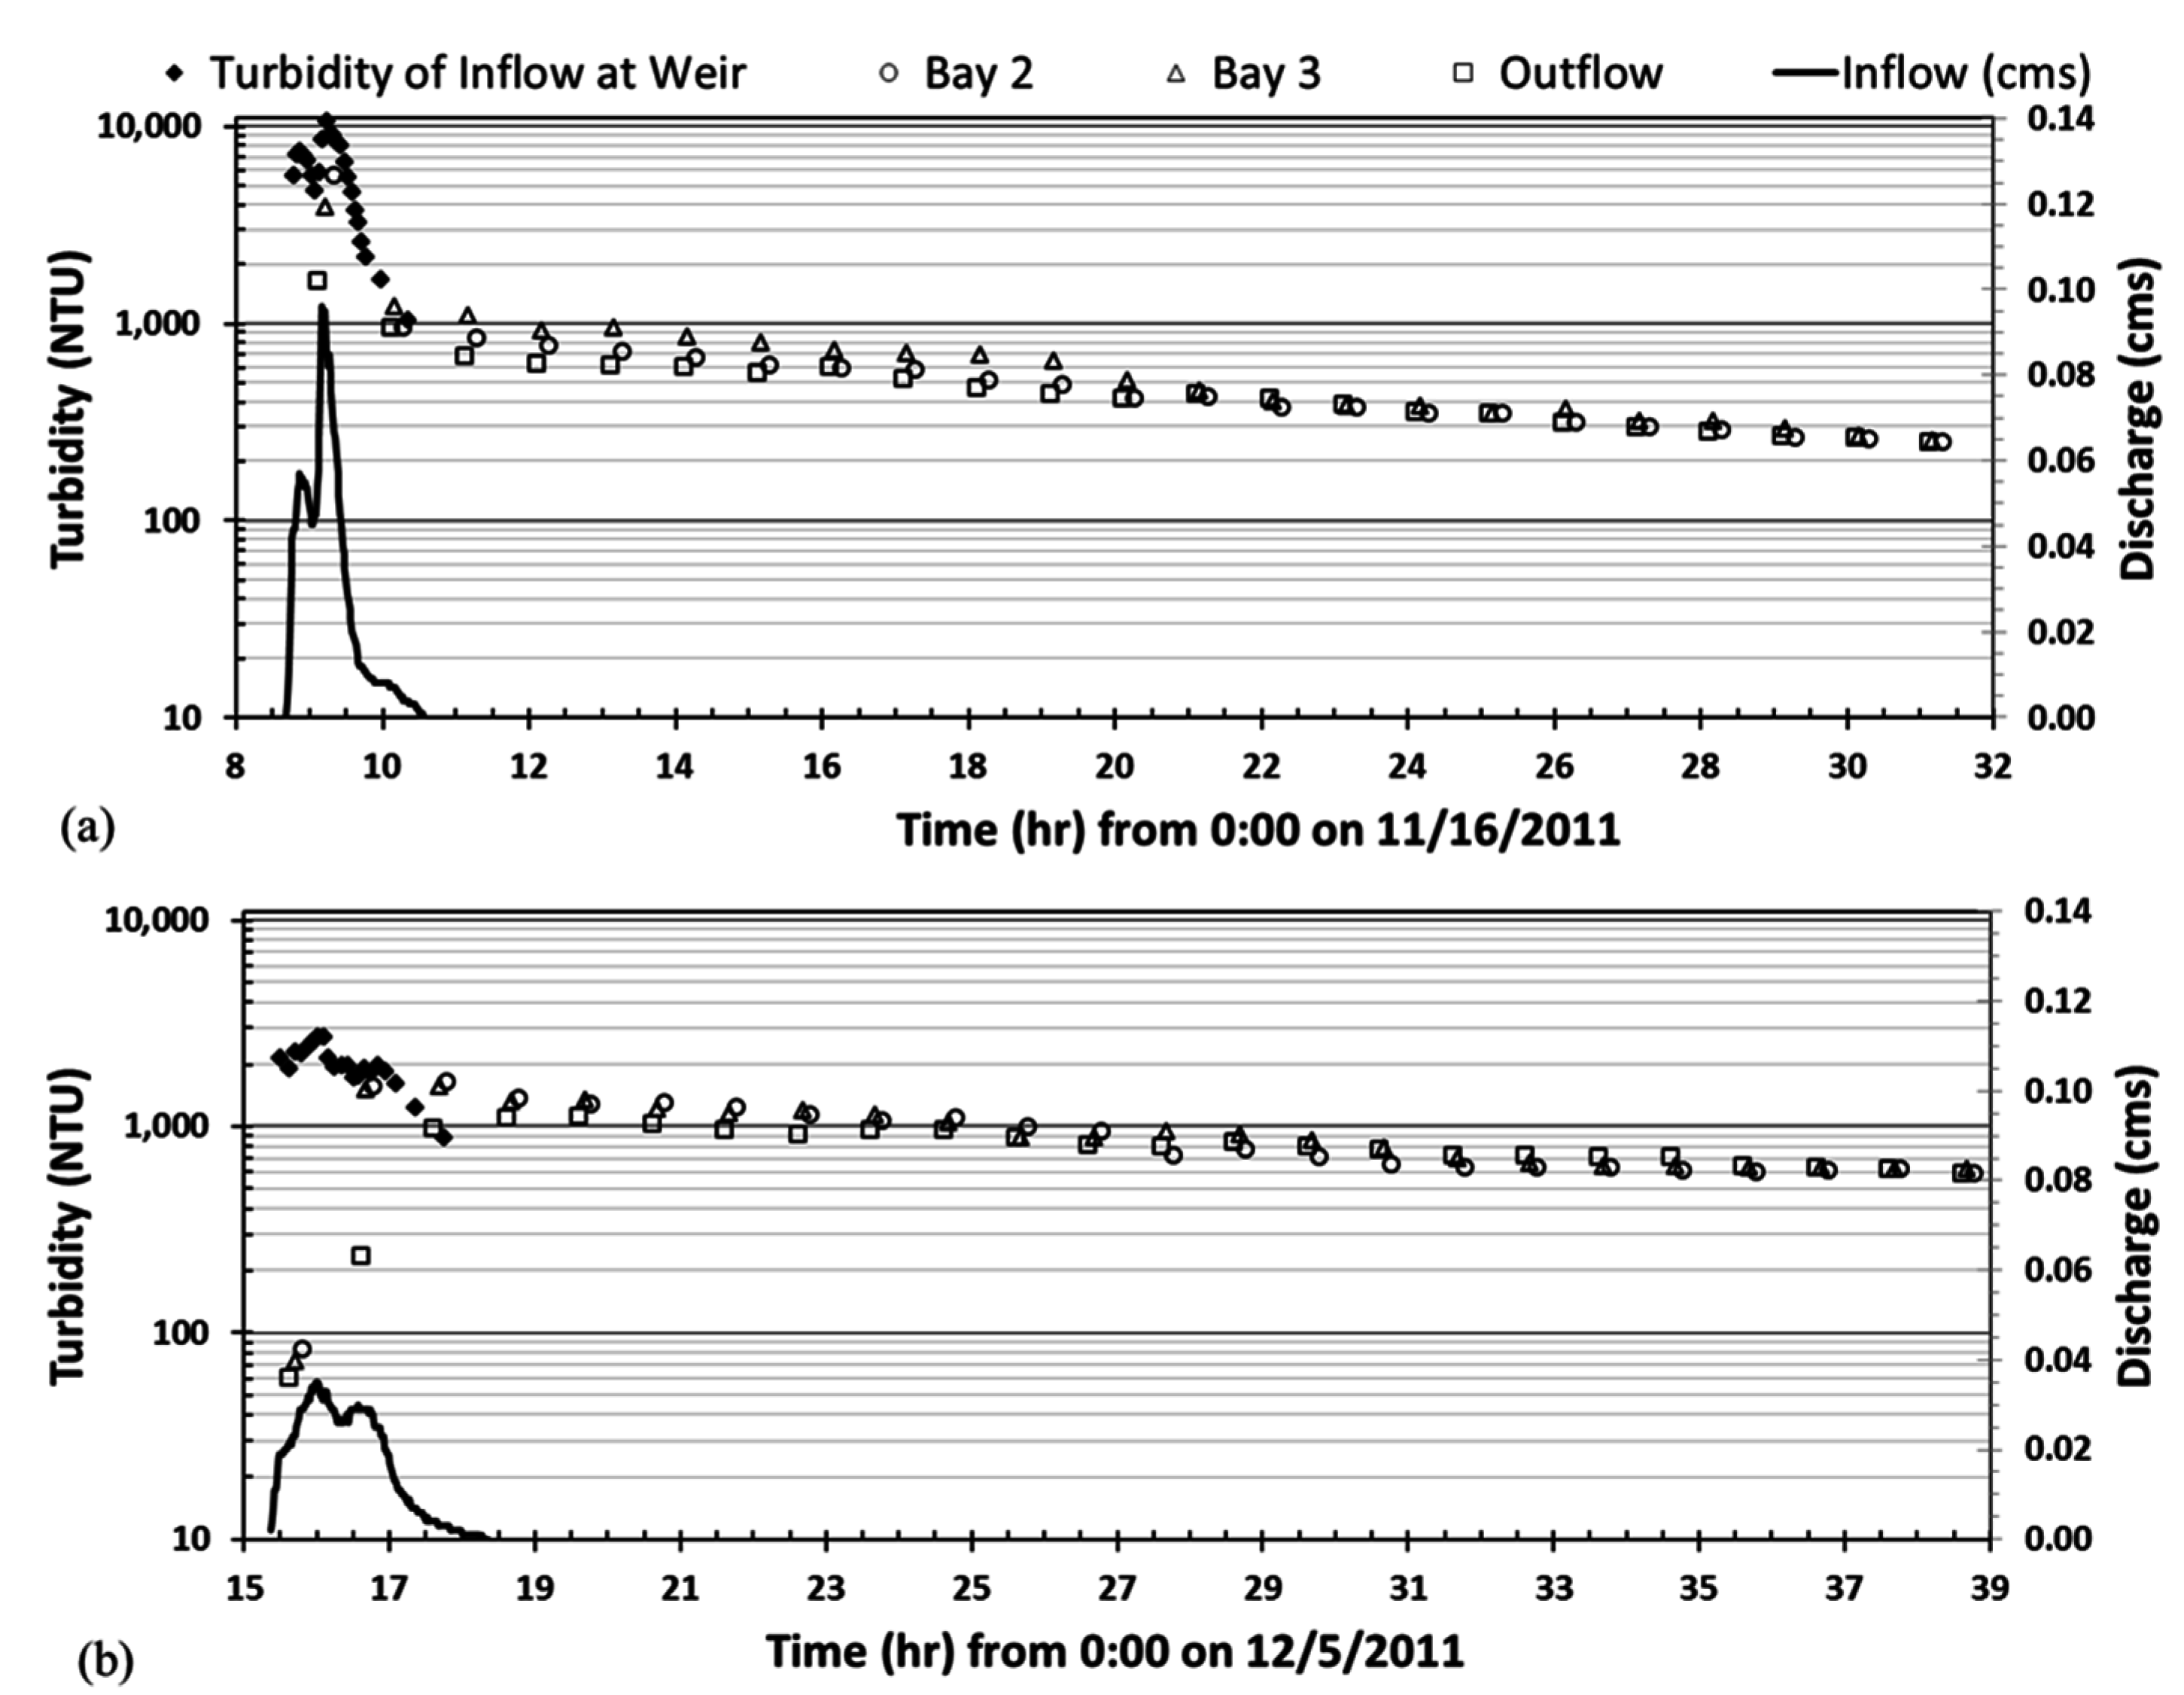
| 16 November 2011 3 | 34.3 (56.3) | 23 | 10,656 | 1030 | 5855 | 2582 | 10,545 | 790 | 5430 | 2689 |
| 5 December 2011 3 | 27.7 (27.4) | 21 | 2724 | 878 | 1989 | 446 | 1950 | 465 | 1305 | 380 |
| 17 January 2012 4 | 31.0 (83.3) | 28 | 28,352 | 3488 | 9902 | 6234 | 26,325 | 2720 | 7433 | 5632 |
| 26 January 2012 4 | 18.5 (12.2) | 24 | 785 | 191 | 506 | 149 | 435 | 95 | 275 | 75 |
| 1 February 2012 4,5 | 11.7 (24.4) | 24 | 3688 | 508 | 1905 | 1067 | 2645 | 250 | 1105 | 745 |
| 4 February 2012 4 | 22.4 (15.2) | 27 | 3892 | 616 | 1944 | 914 | 2315 | 255 | 1068 | 561 |

4.2. Phase II Results

4.3. Overall Basin Performance
| Rainfall Event | Inflow (Weir) | Outflow (Skimmer) | Removal Efficiency | ||||||
|---|---|---|---|---|---|---|---|---|---|
| EMC TSS (mg/L) | EMC Turbidity (NTU) | TSS Load (kg) | EMC TSS (mg/L) | EMC Turbidity (NTU) | TSS Load (kg) | by TSS | by NTU | by Load | |
| 16 November 2011 | 6519.6 | 6830 | 1197.7 | 221.5 | 478 | 25.3 | 96.6% | 93.0% | 97.9% |
| 5 December 2011 | 1331.2 | 2024 | 224.0 | 319.6 | 793 | 36.6 | 76.0% | 60.8% | 83.7% |

5. Lessons Learned
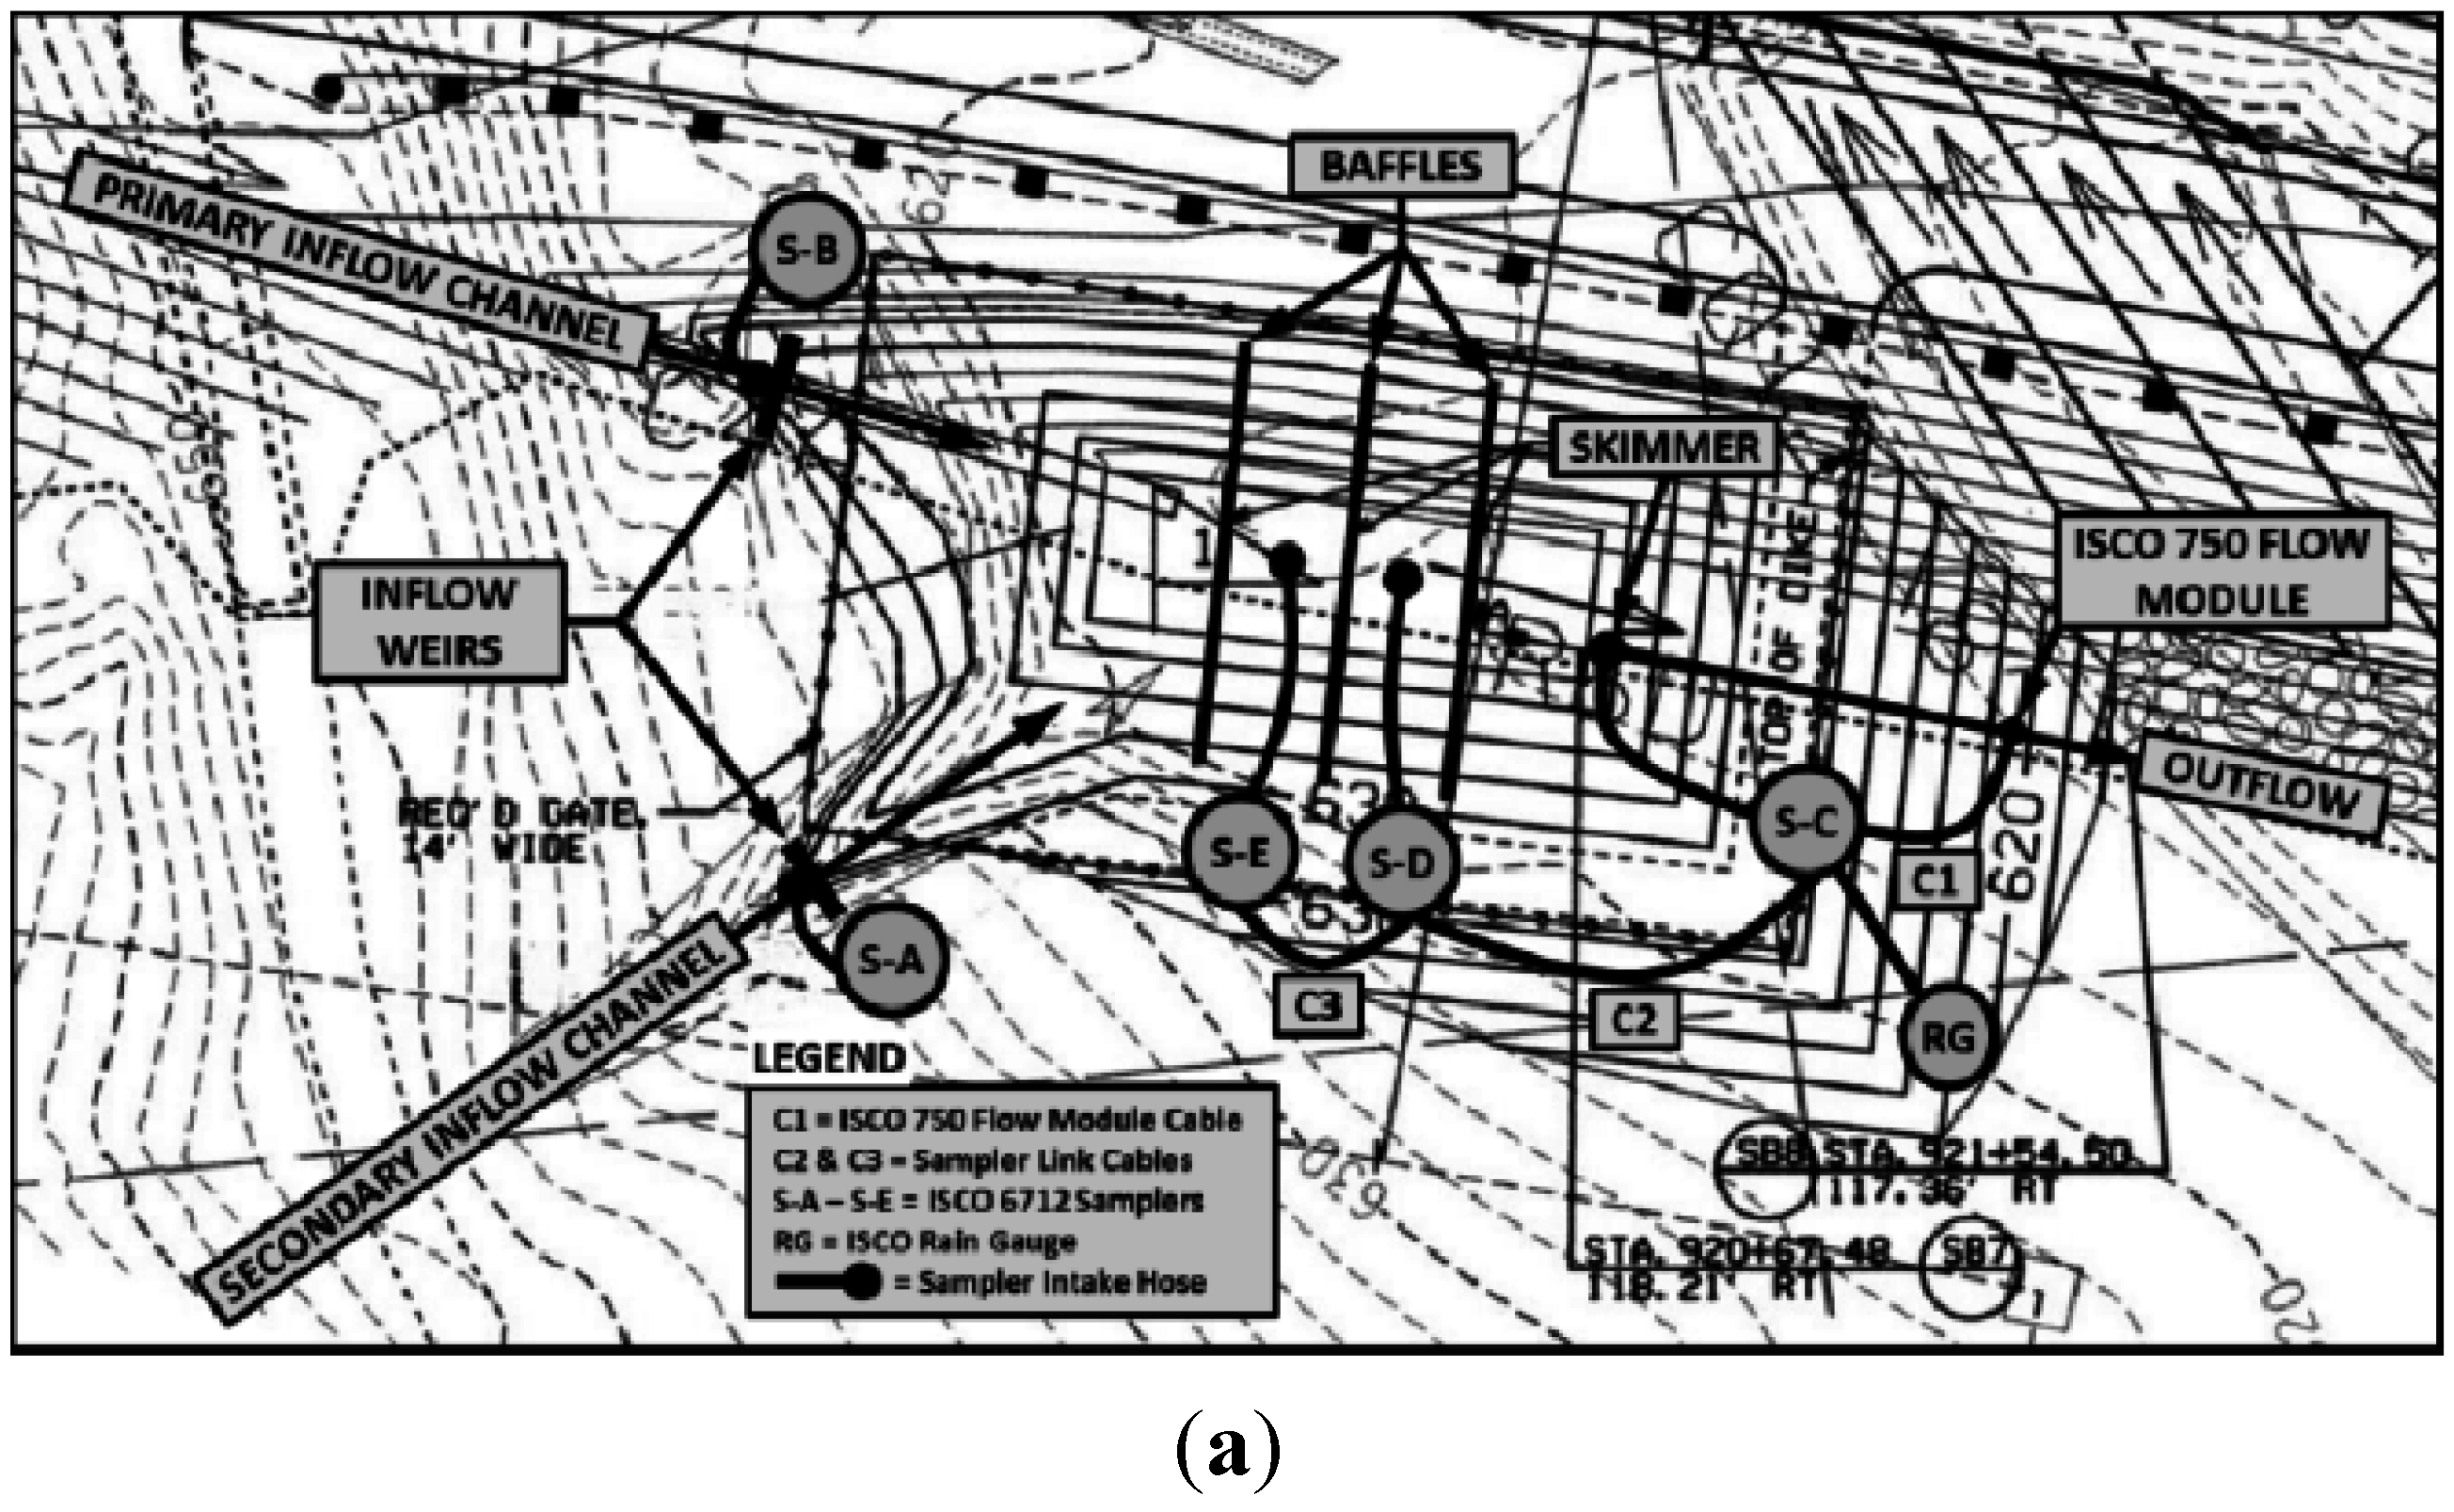
- The monitoring team needs to provide clear instructions to the construction contractor on where monitoring equipment will be located at the sediment basin. Figure 2a shows a schematic diagram (using the original design drawing as background) of the sediment basin monitored in the study, providing the approximate locations of the monitoring equipment. Figure 2a was developed for the contractor to appropriately construct the basin (i.e., weir installation, baffle placement, site preparation for sampler’s installation, etc.) for the researchers to install all monitoring equipment immediately after the construction of the sediment basin is complete. A similar diagram was not prepared for a different sediment basin in the same construction project, which was supposed to be monitored. Wet weather conditions prevented the contractor and researchers from properly installing the data collection equipment since site preparation instructions were not provided in advance to the contractor. This resulted in the site not being properly prepared when the basin was originally constructed and the researchers not being able to install monitoring equipment in a timely fashion. Therefore, this particular basin was not monitored and data was never collected resulting in a missed opportunity.
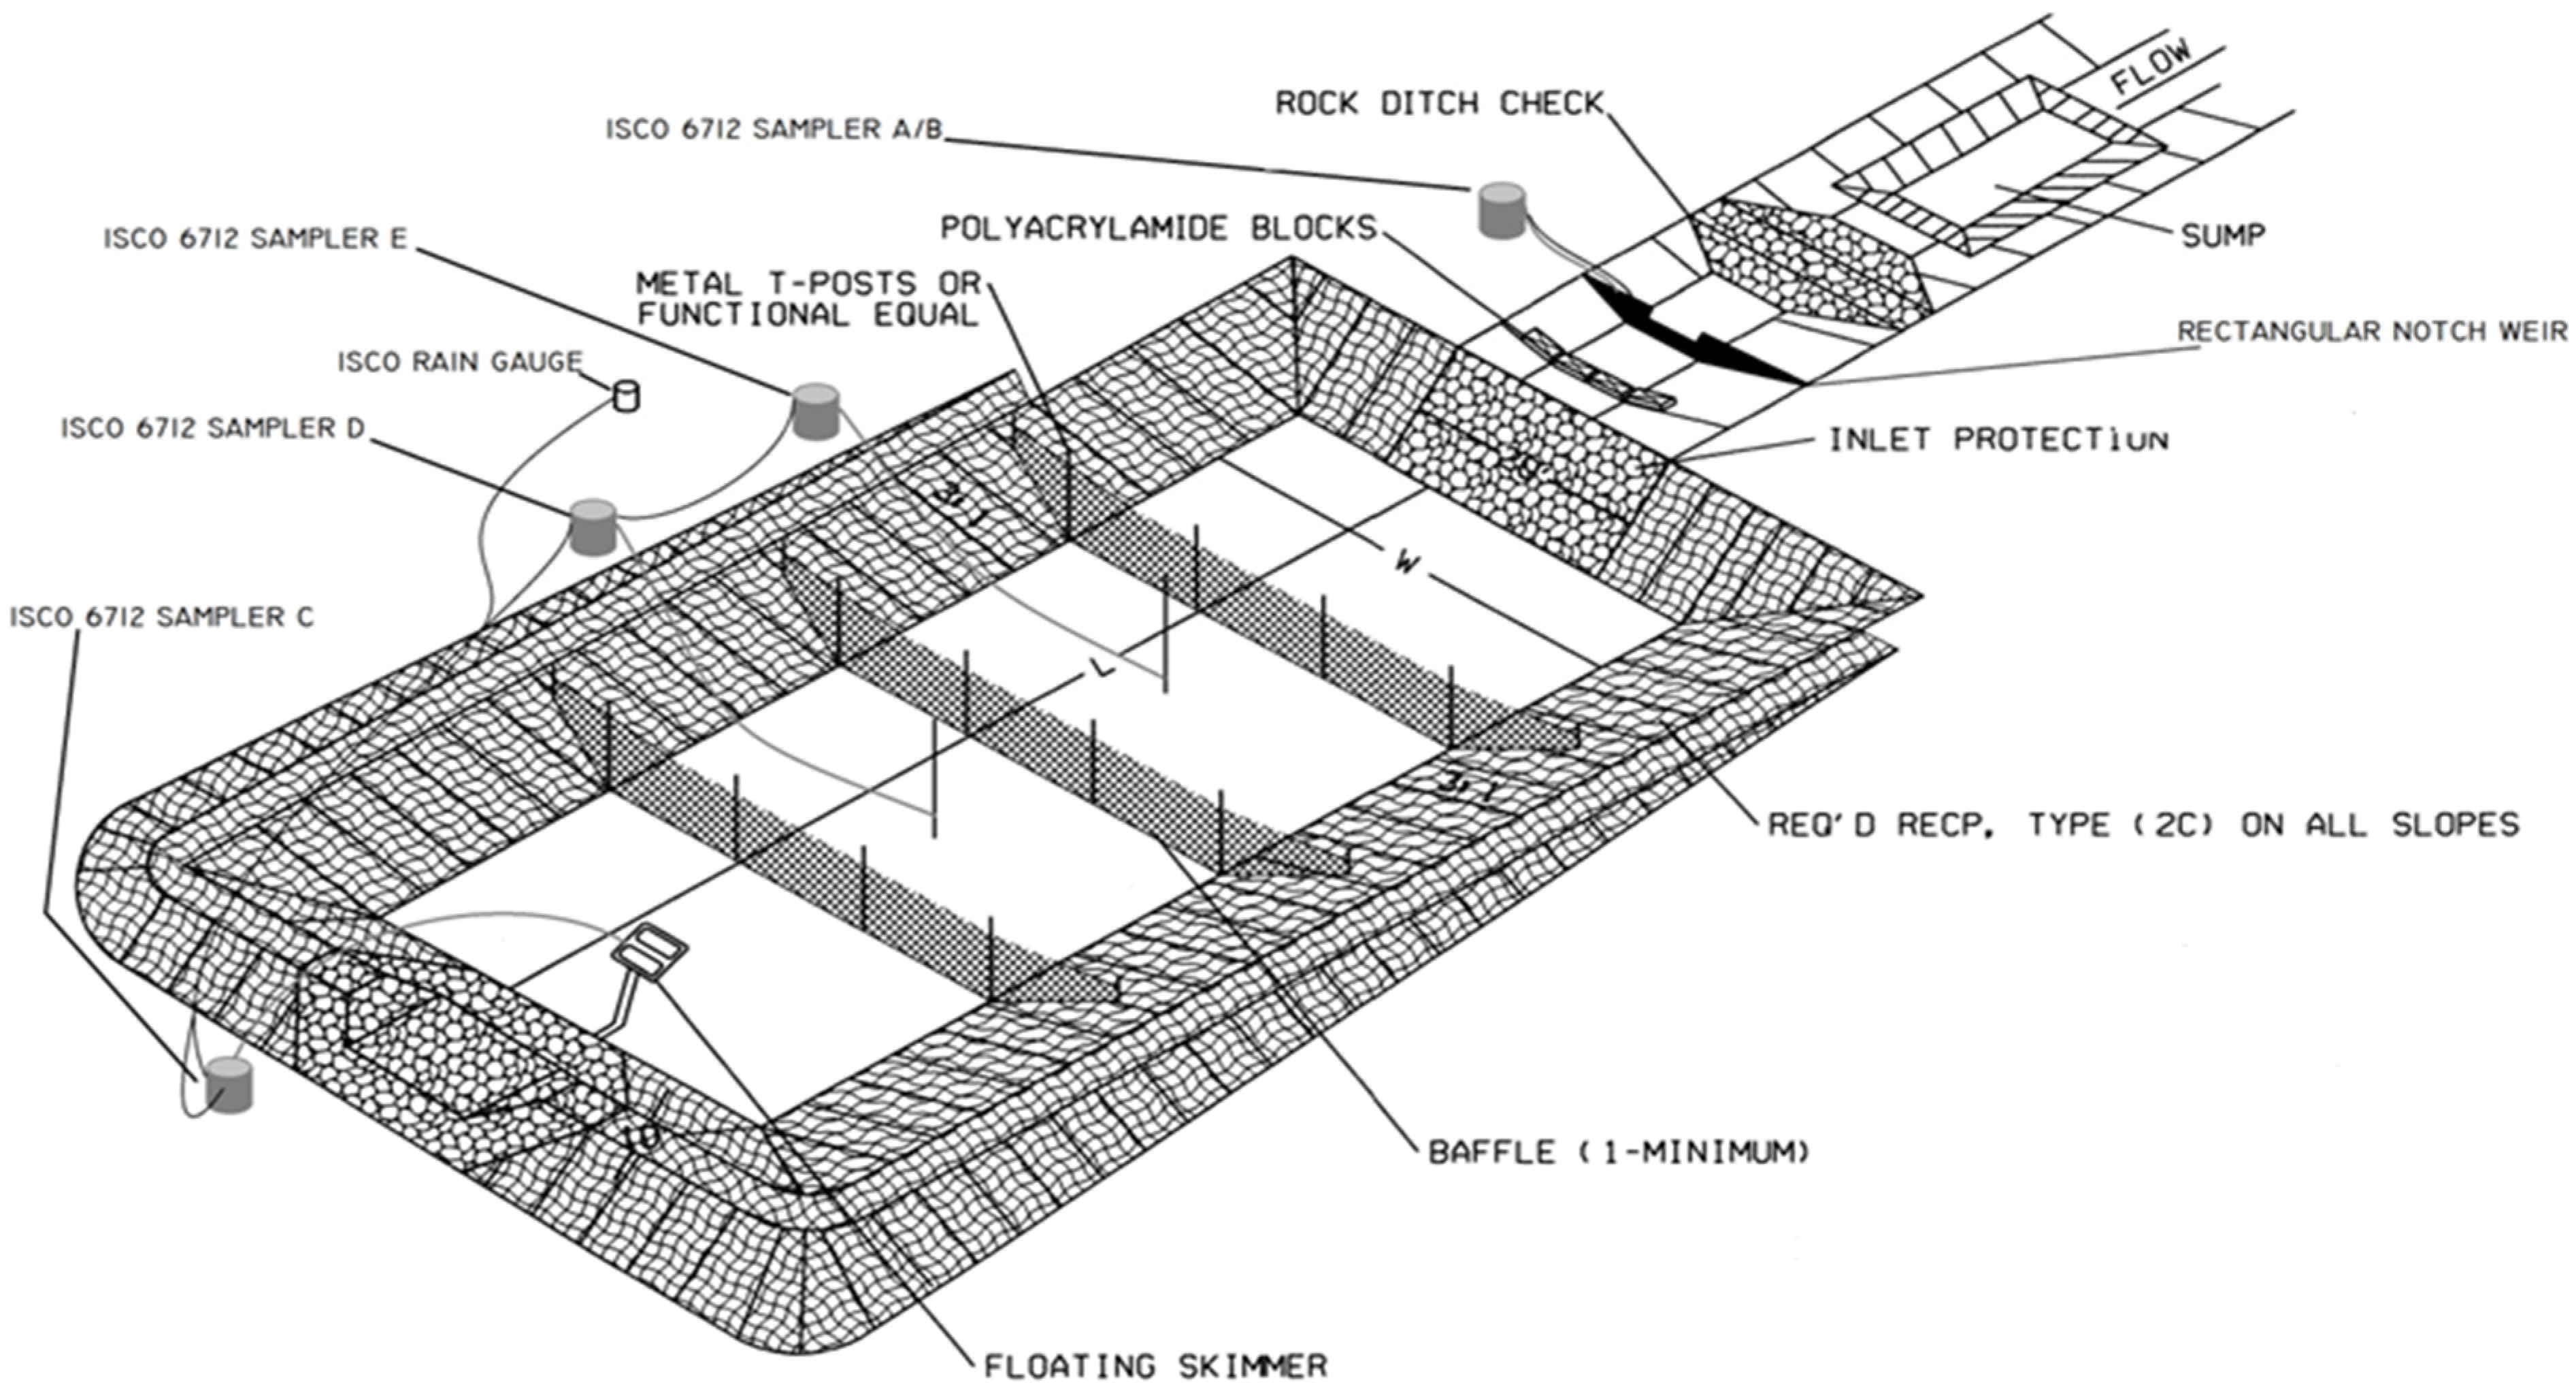
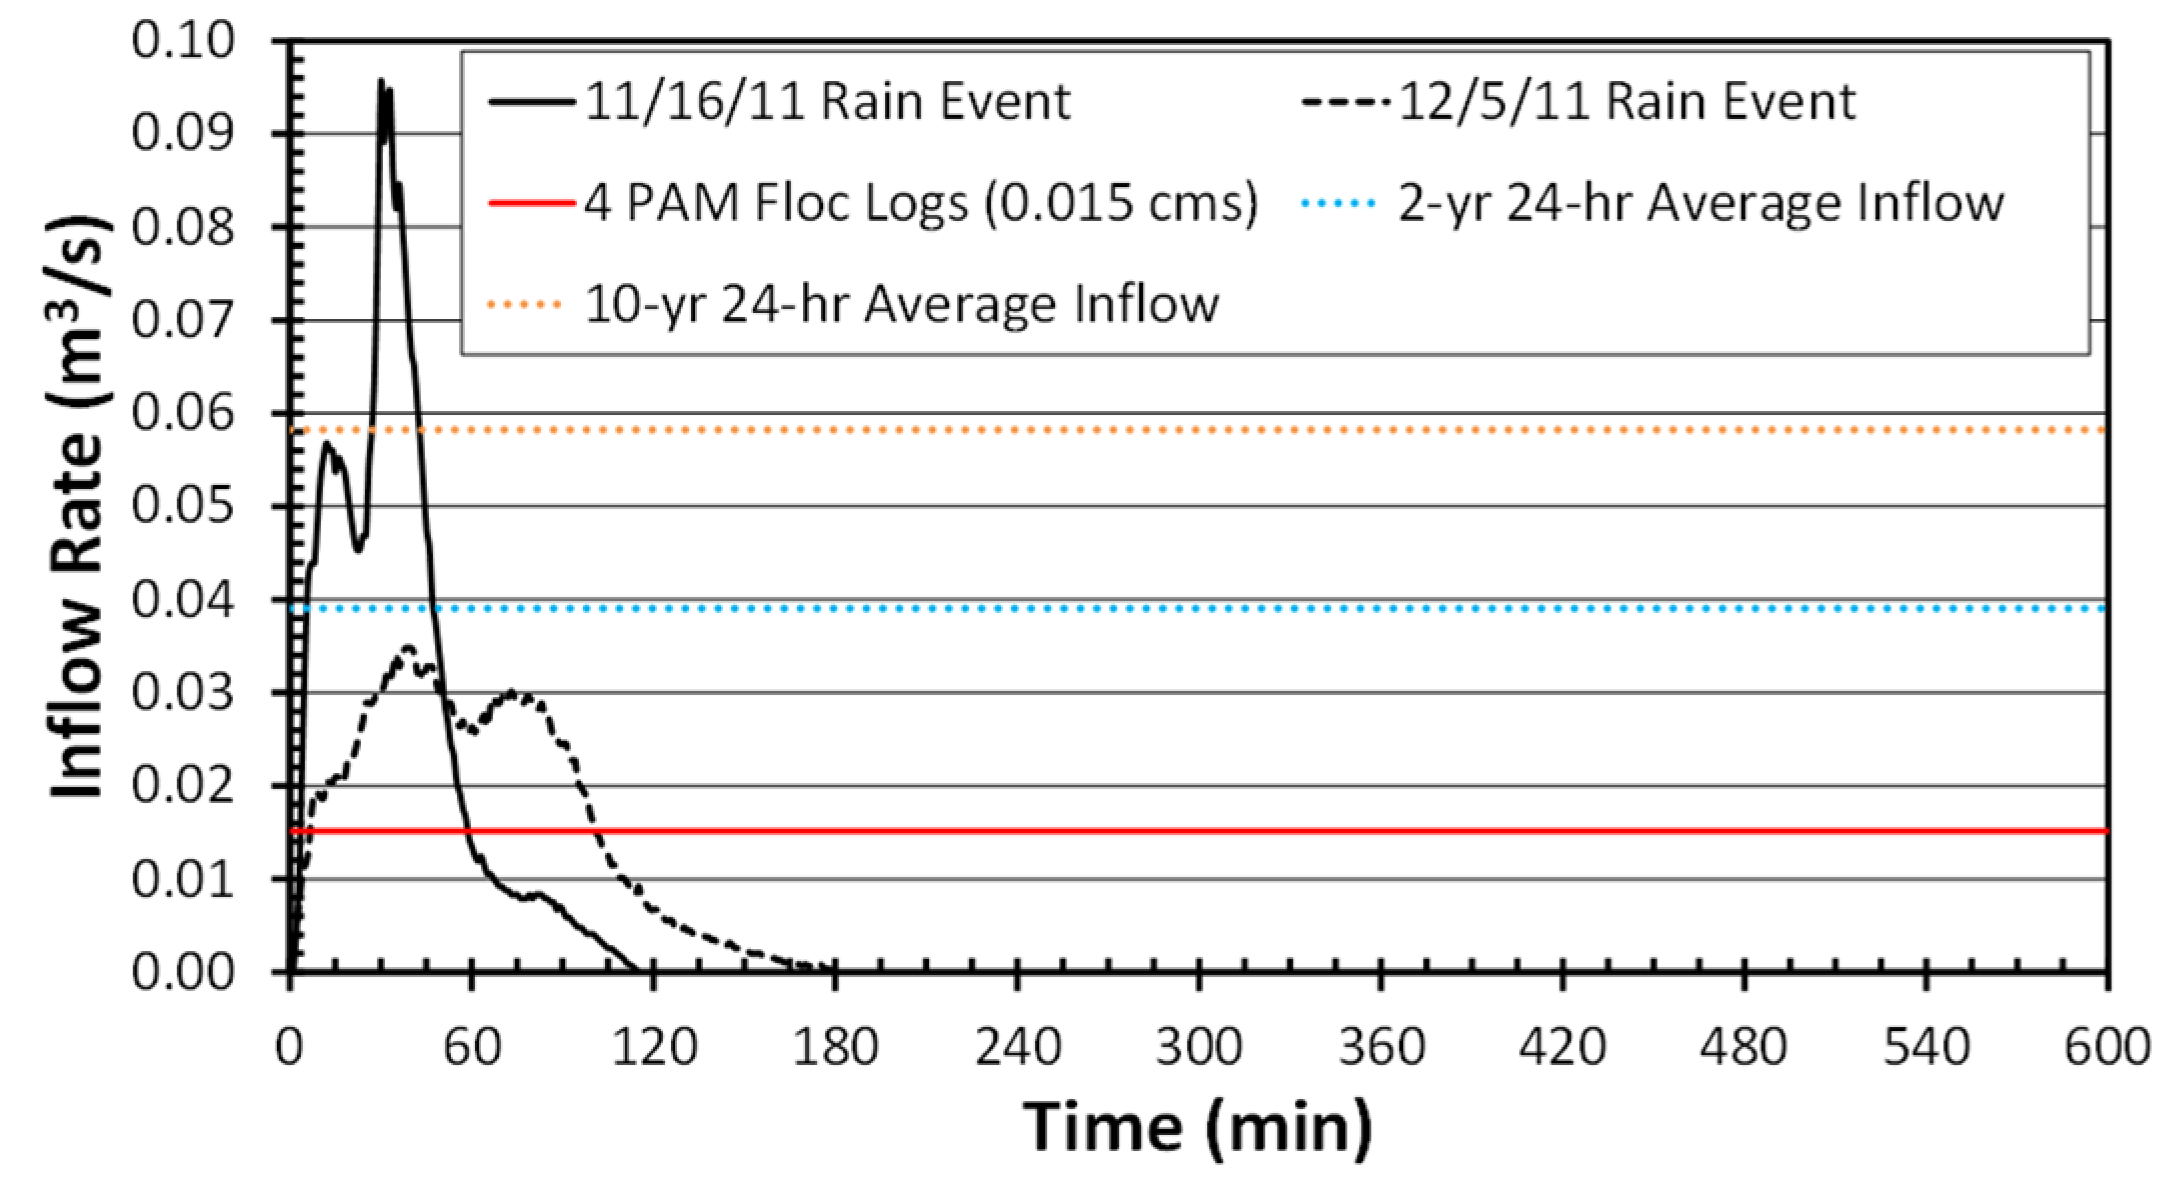
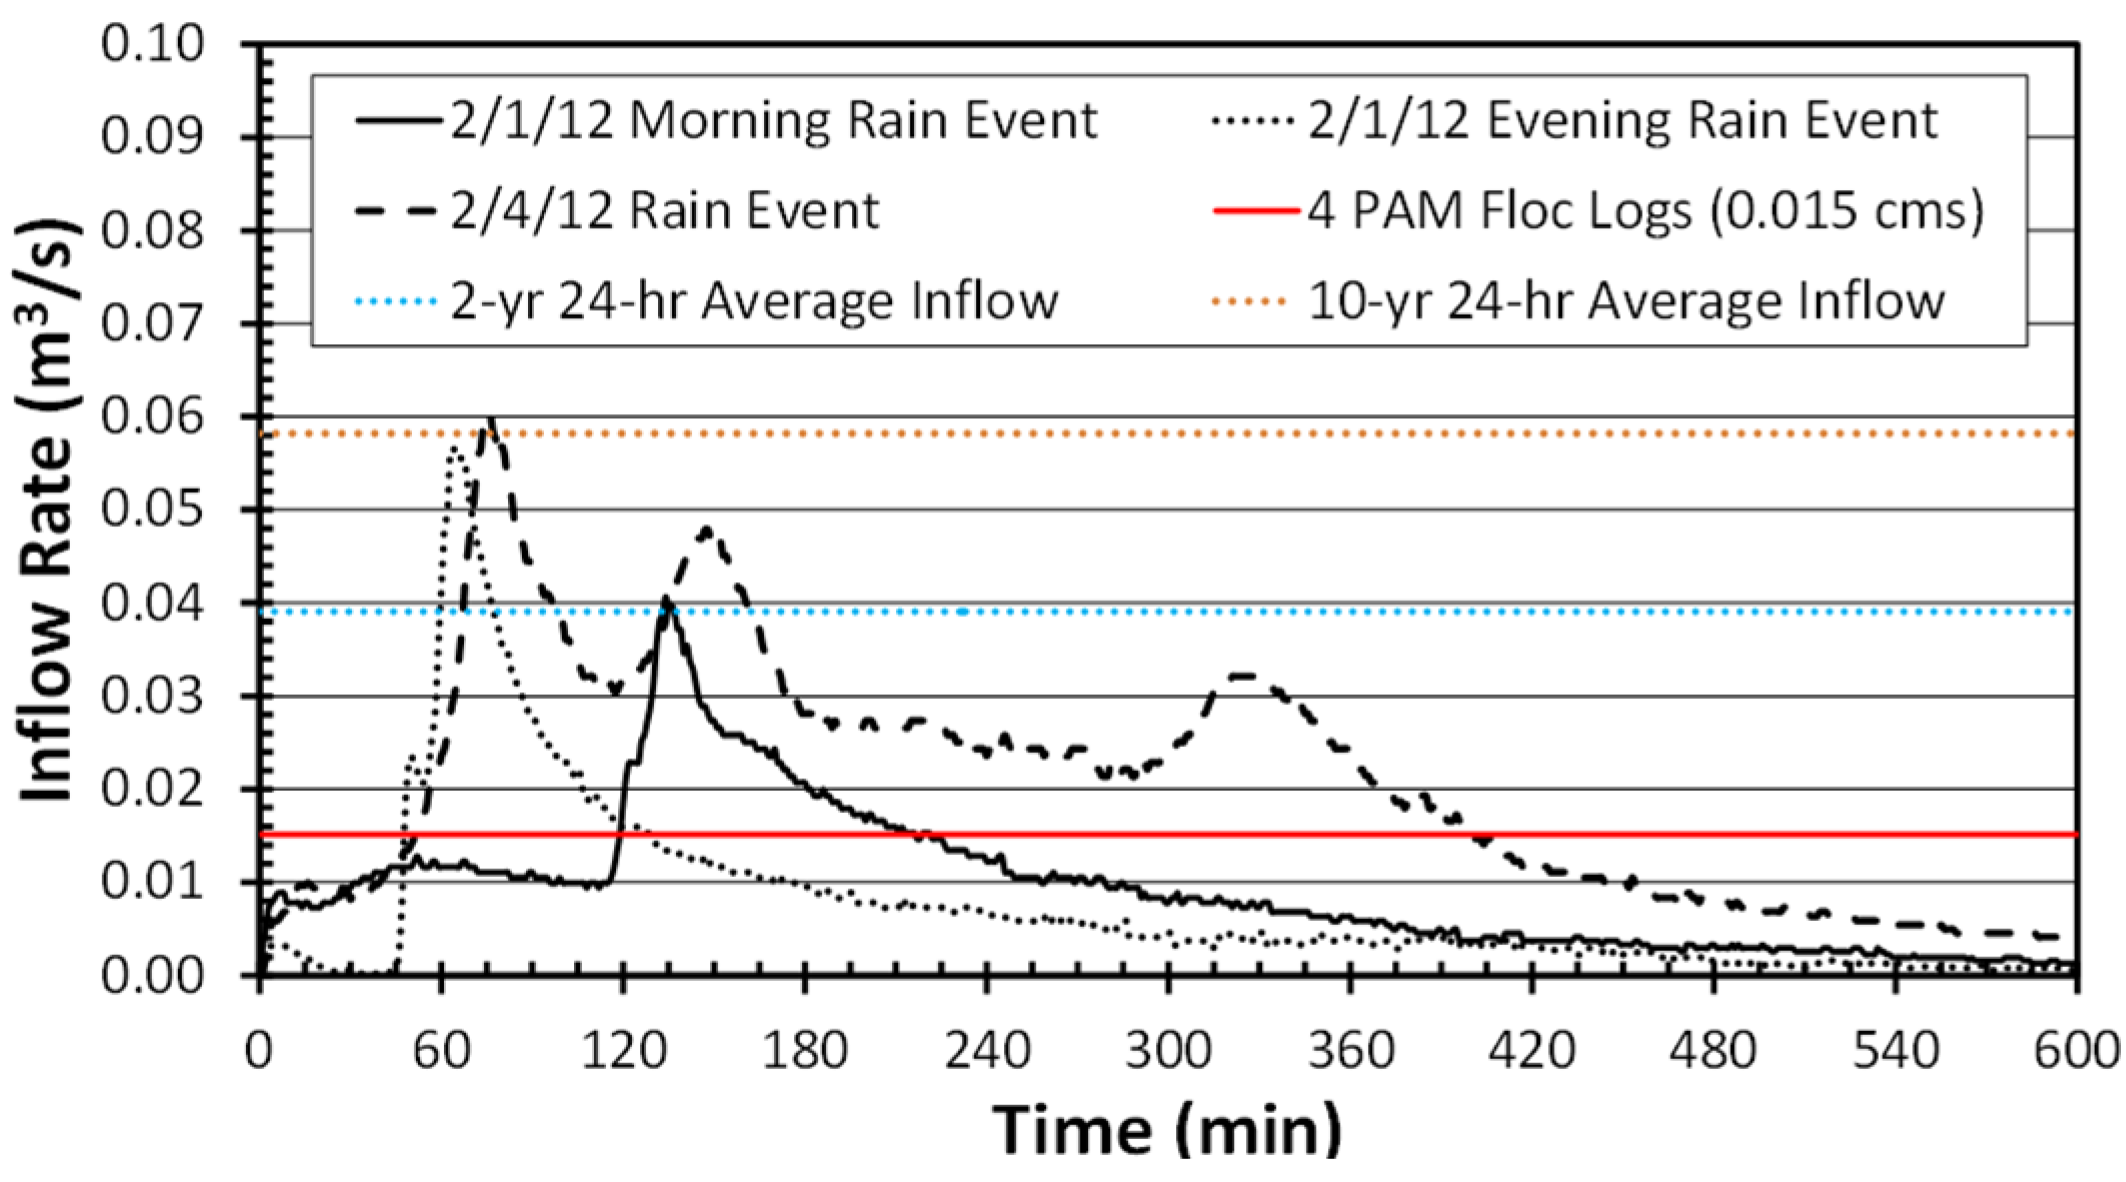
- The monitoring team and the basin design standards need to provide appropriate instructions to the contractor on the proper use, dosage, and placement of PAM floc blocks. For the 2009 sediment basin design used on the ALDOT construction project, the proper placement and number of PAM blocks are important to ensure that sediment-laden stormwater inflow is properly dosed to promote flocculation of suspended sediment and deposition within the basin. Figure 1 is a part of the project drawing for the construction project that shows the placement of four PAM floc blocks in the inflow channel downstream of the rock ditch check and weir structure. The drawing also includes a special project note (not shown in Figure 1) stating:“4. Payment for polyacrylamide block will be paid under item 655-W. Four (4) blocks shall be placed at the inlet end of the basin. Block condition shall be monitored and blocks shall be replaced when they have degraded to the point they no longer appear to be effective.”The contractor followed the drawing and the special project note verbatim and installed four PAM floc blocks after the inflow weir without considering the actual amount of flow expected from the contributing drainage area.
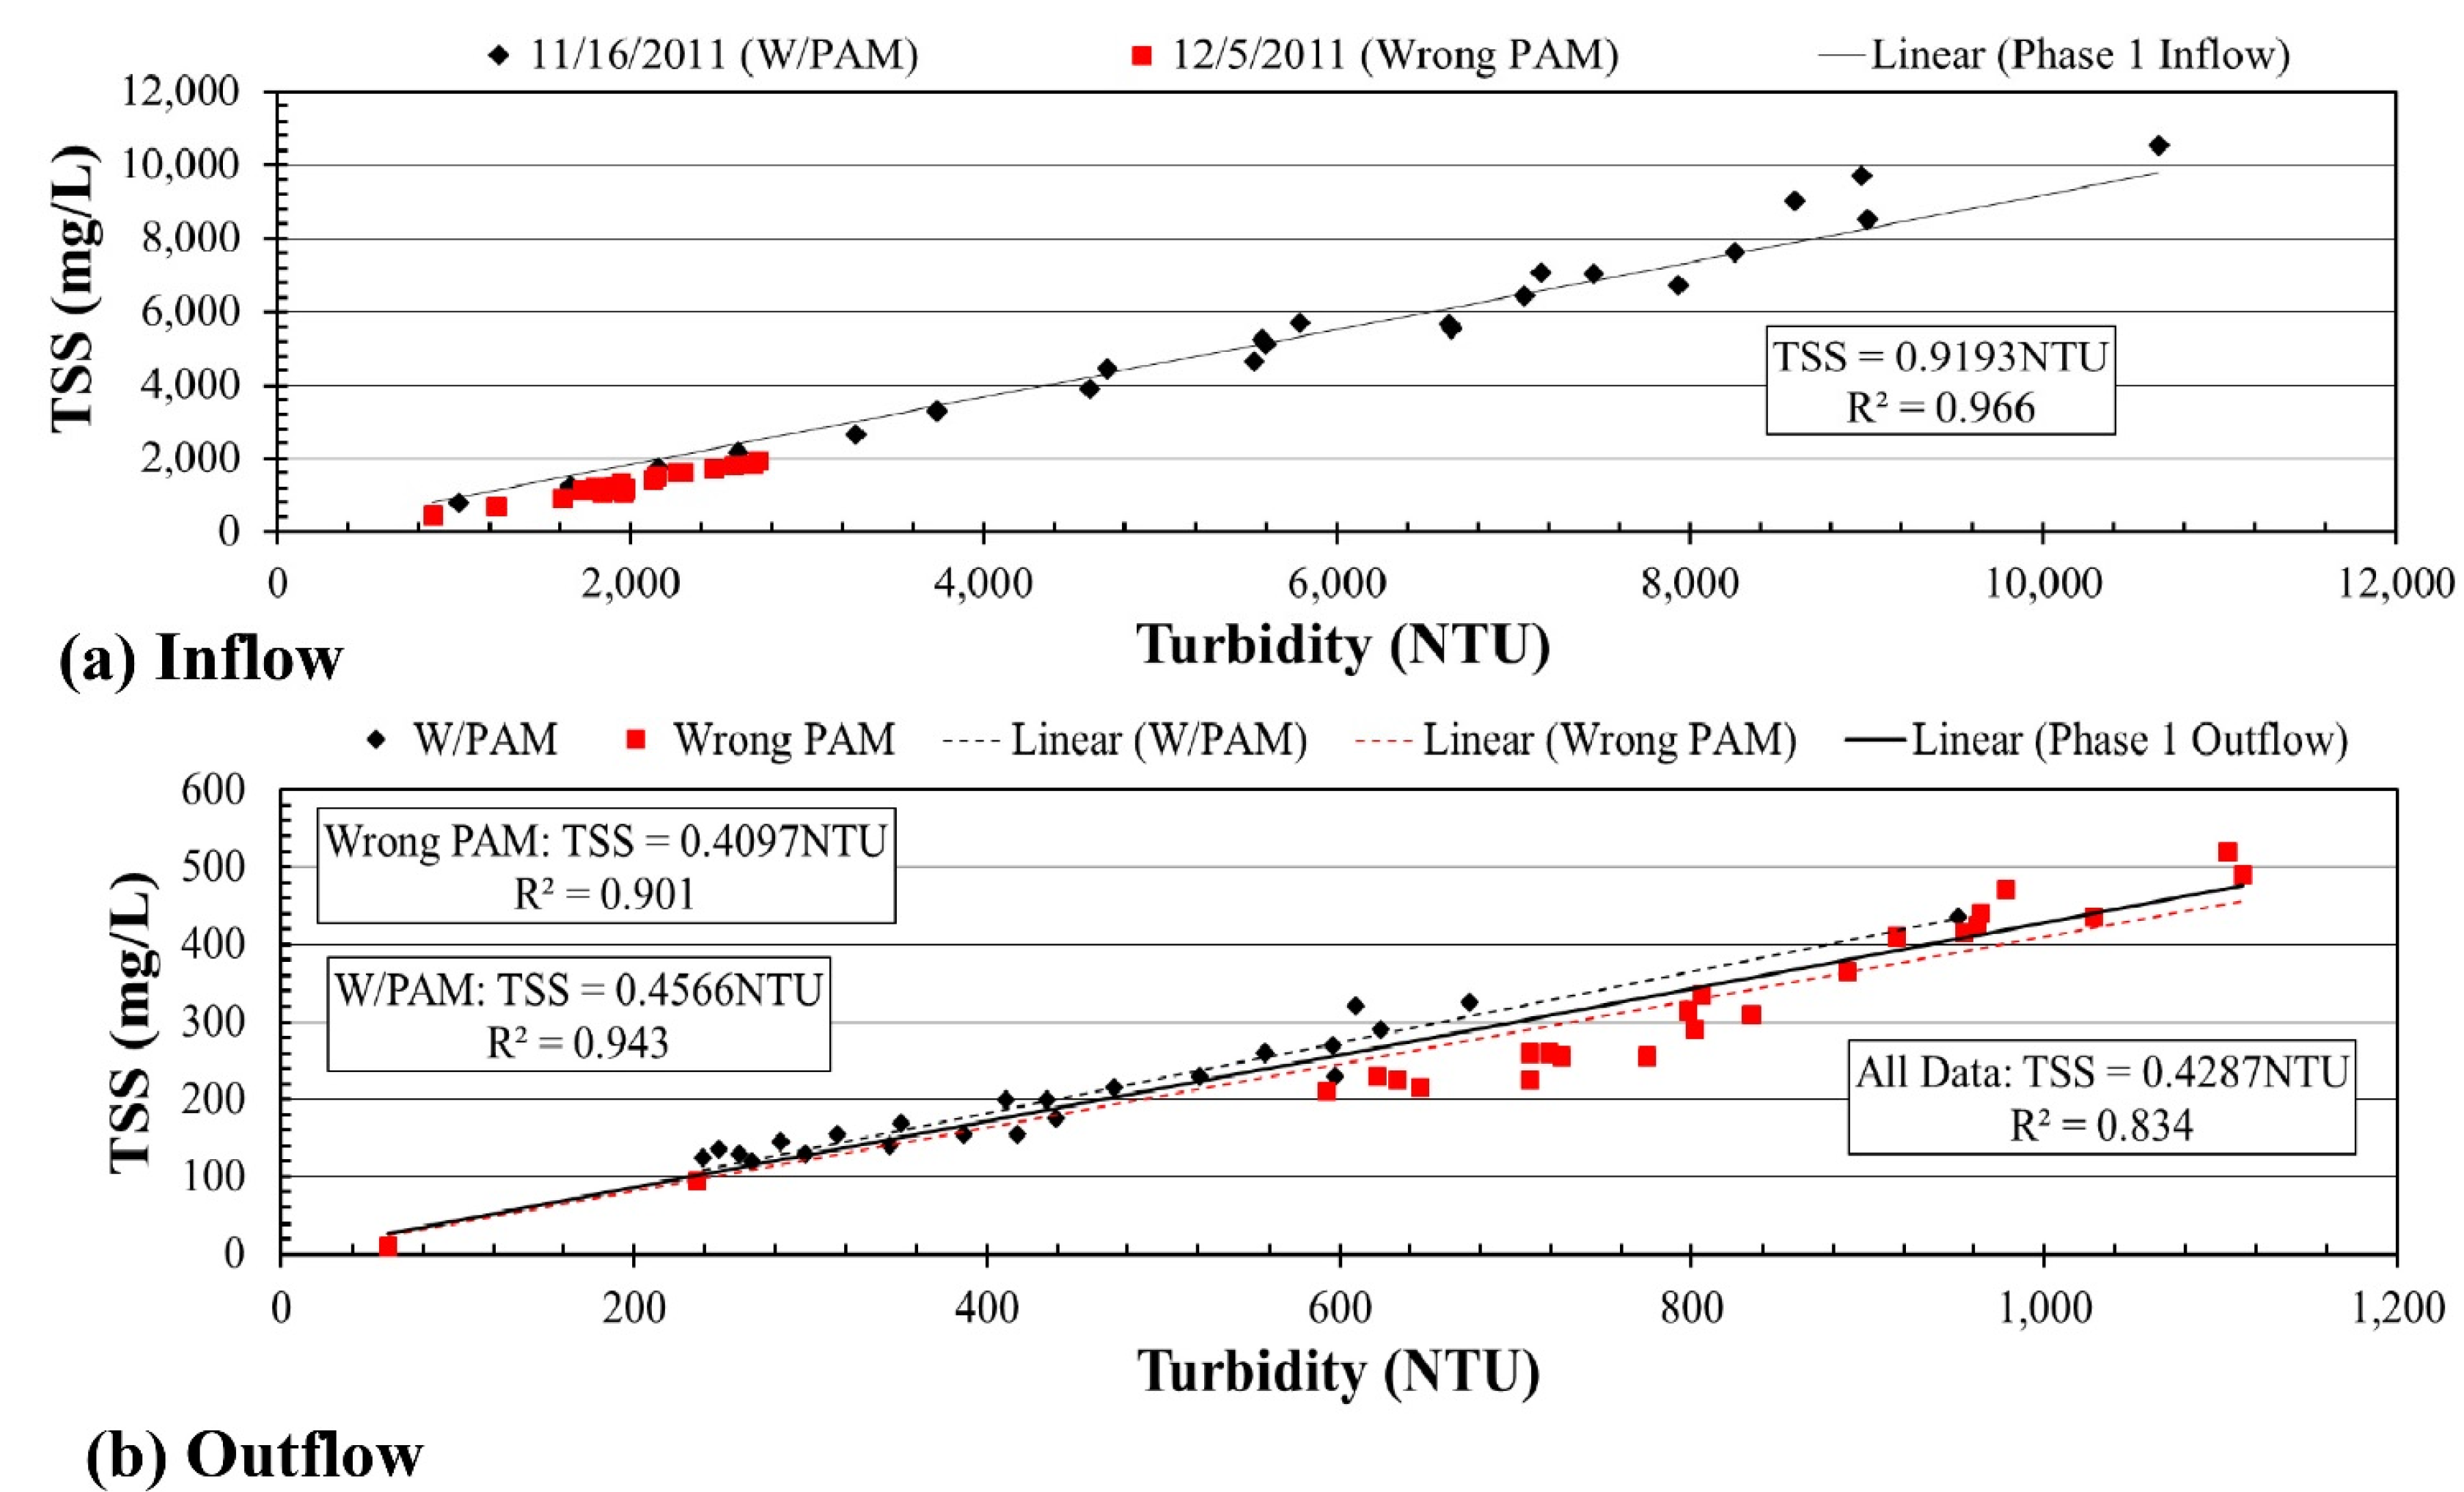
- The monitoring team needs to provide the contractor with specific instructions on using the correct type of PAM that is decided based upon laboratory testing of the local site soil properties. Appropriate PAM floc blocks were purchased by the contractor from APS after the soil samples from the construction site were tested by the manufacturer. After the 16 November 2011 rain event, the contractor cleared a large amount of small #4 aggregate from the rock ditch check that had washed into the weir and accidently removed the correct PAM. The contractor then placed four new PAM floc blocks in the channel downstream of the weir, but during a visit to the basin following the rain event on 5 December 2011, the researcher discovered that those PAM blocks were not the soil prescribed type of PAM (possibly left over from a previous project). Therefore, during the Phase I data collection effort, two conditions were observed: (1) correct PAM placement and (2) incorrect (i.e., wrong type) PAM placement in the inflow channel. These two conditions are referred to as “w/PAM” and “w/wrong PAM”, respectively, when data collection results are discussed.
- If a weir is used for data collection, clear instructions need to be provided to the contractor on the proper installation. The runoff should not be allowed to flow around and under the weir, which will result in inaccurate flow rate measurements. As a result of improper construction and installation of the weir at the primary inflow channel by the contractor (when the monitoring team was not on-site), no or a few inflow samples were collected for three rainfall events (on 7, 8, and 11 January 2012 in Table 1) during Phase II data collection. After the weir was appropriately reinstalled on 24 January 2012, only four sets of complete inflow data were collected for Phase II, which are listed in Table 1.
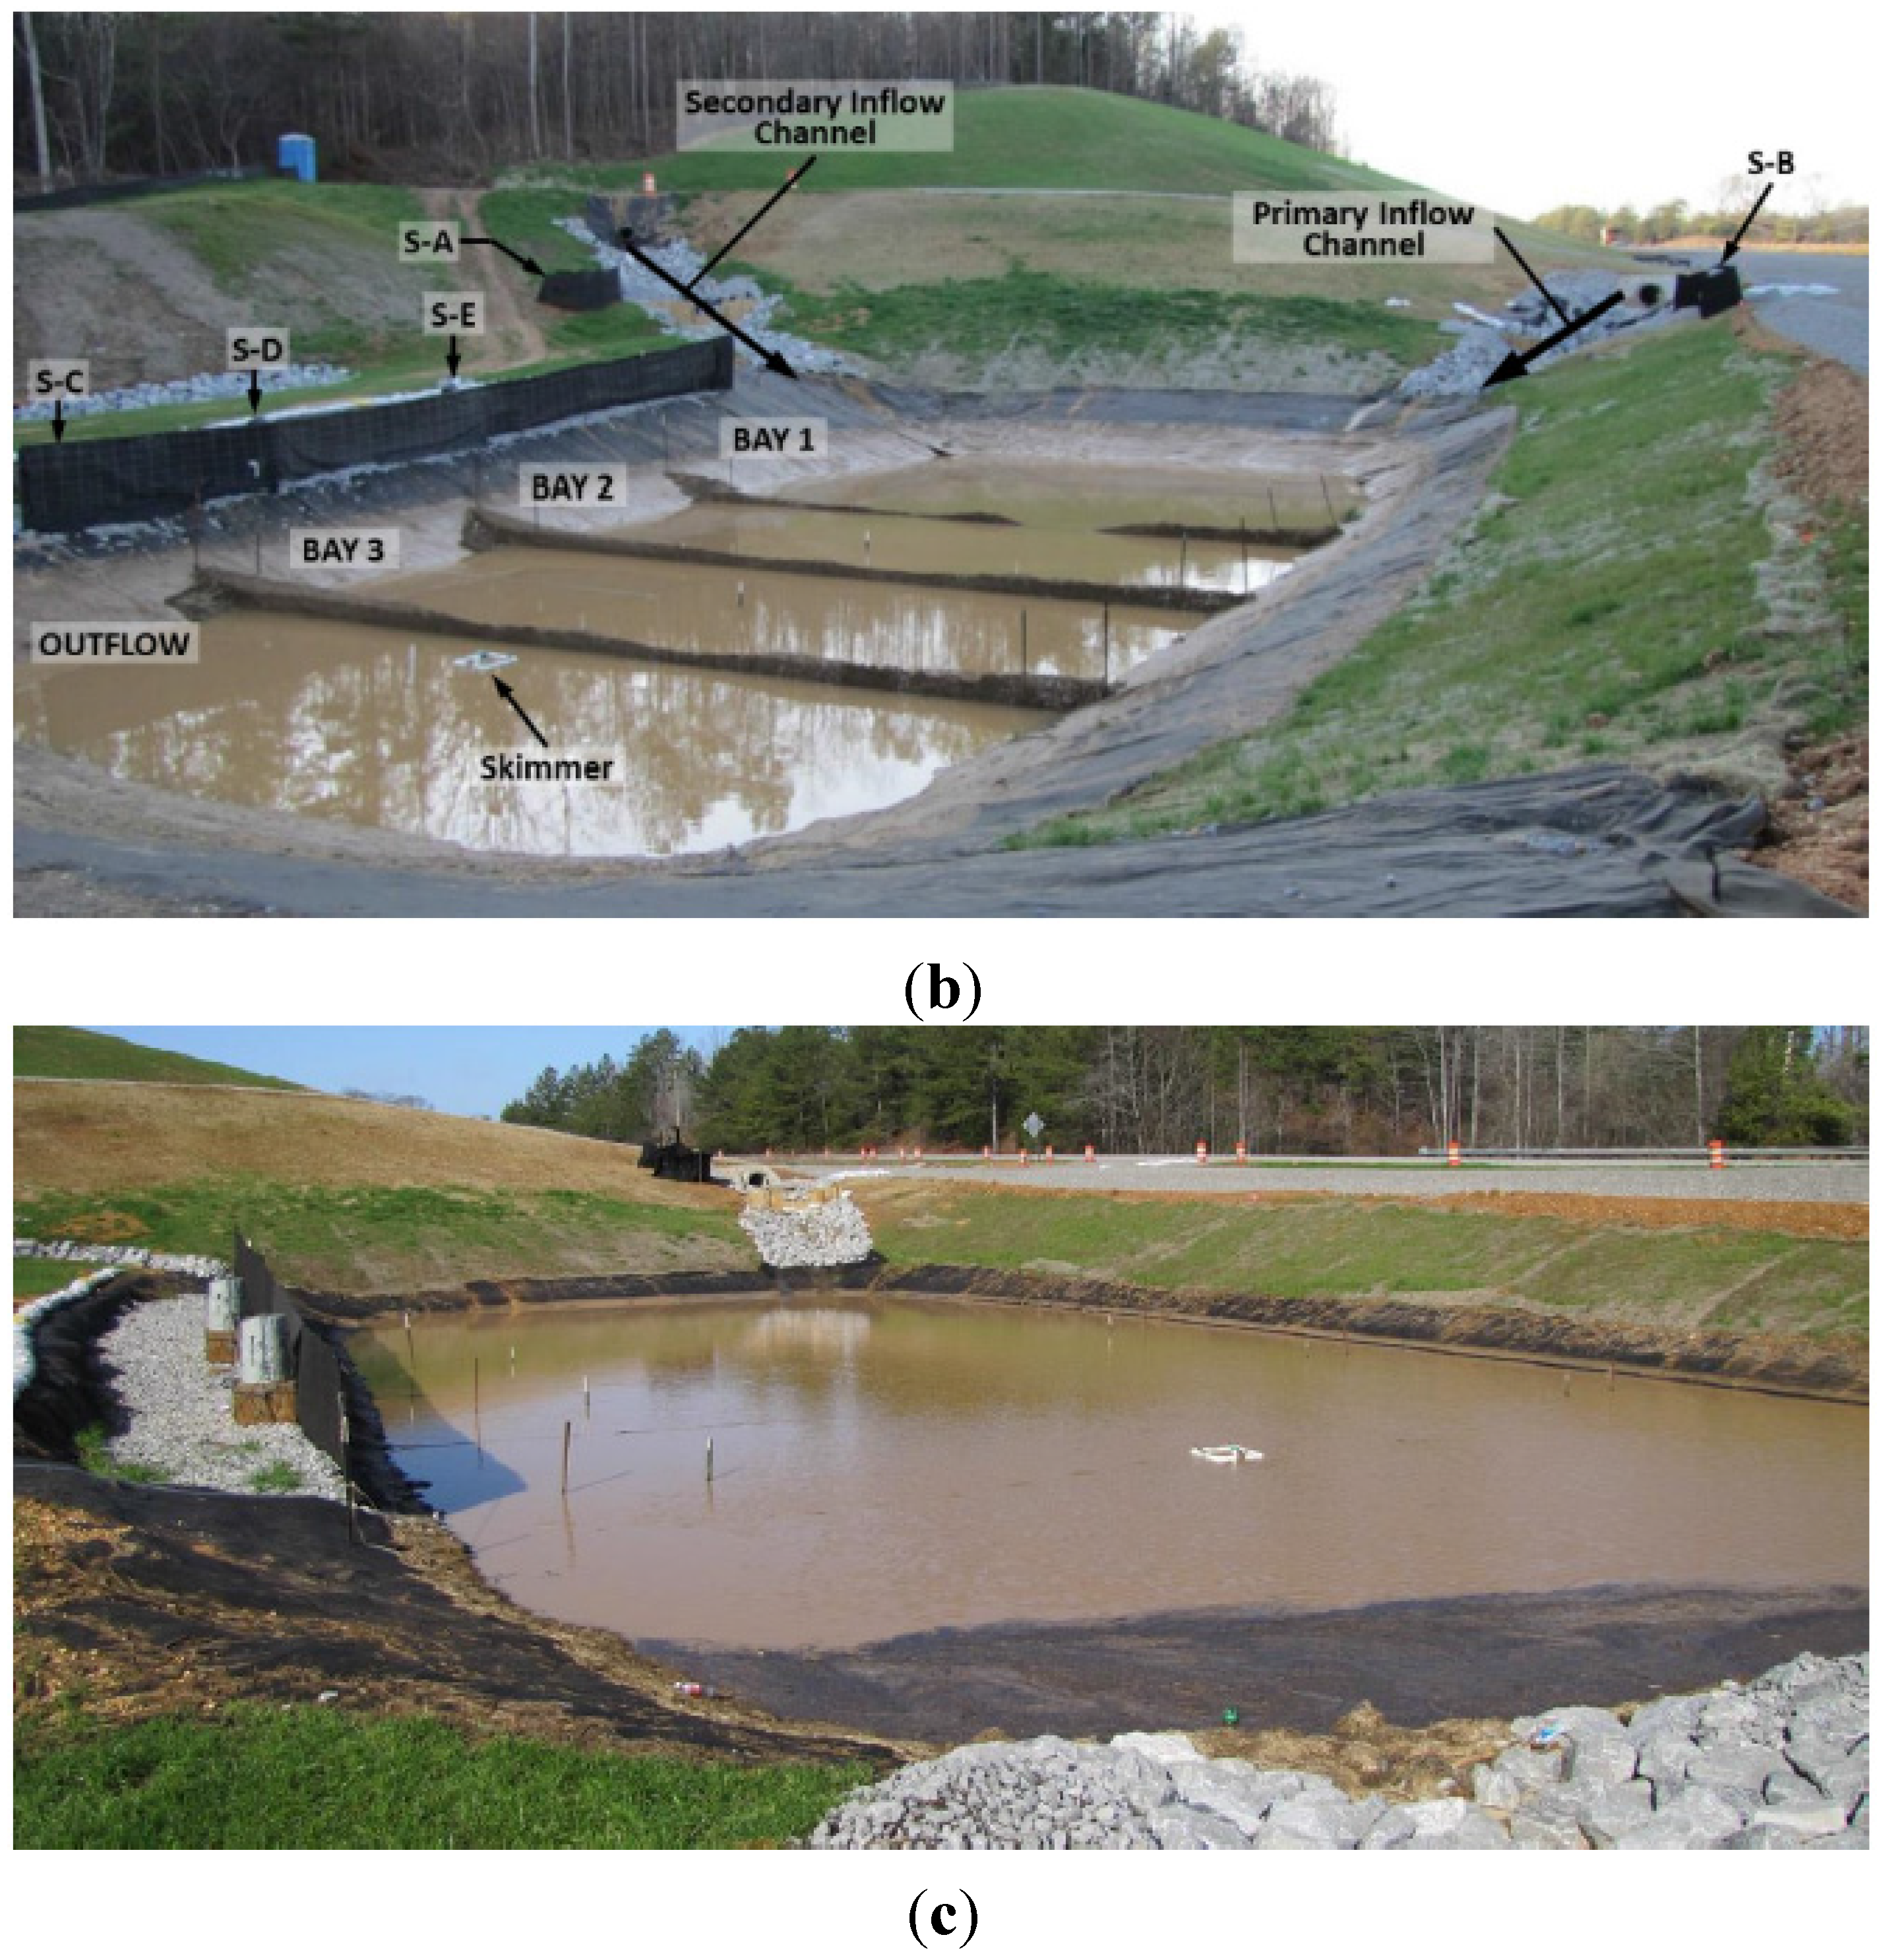
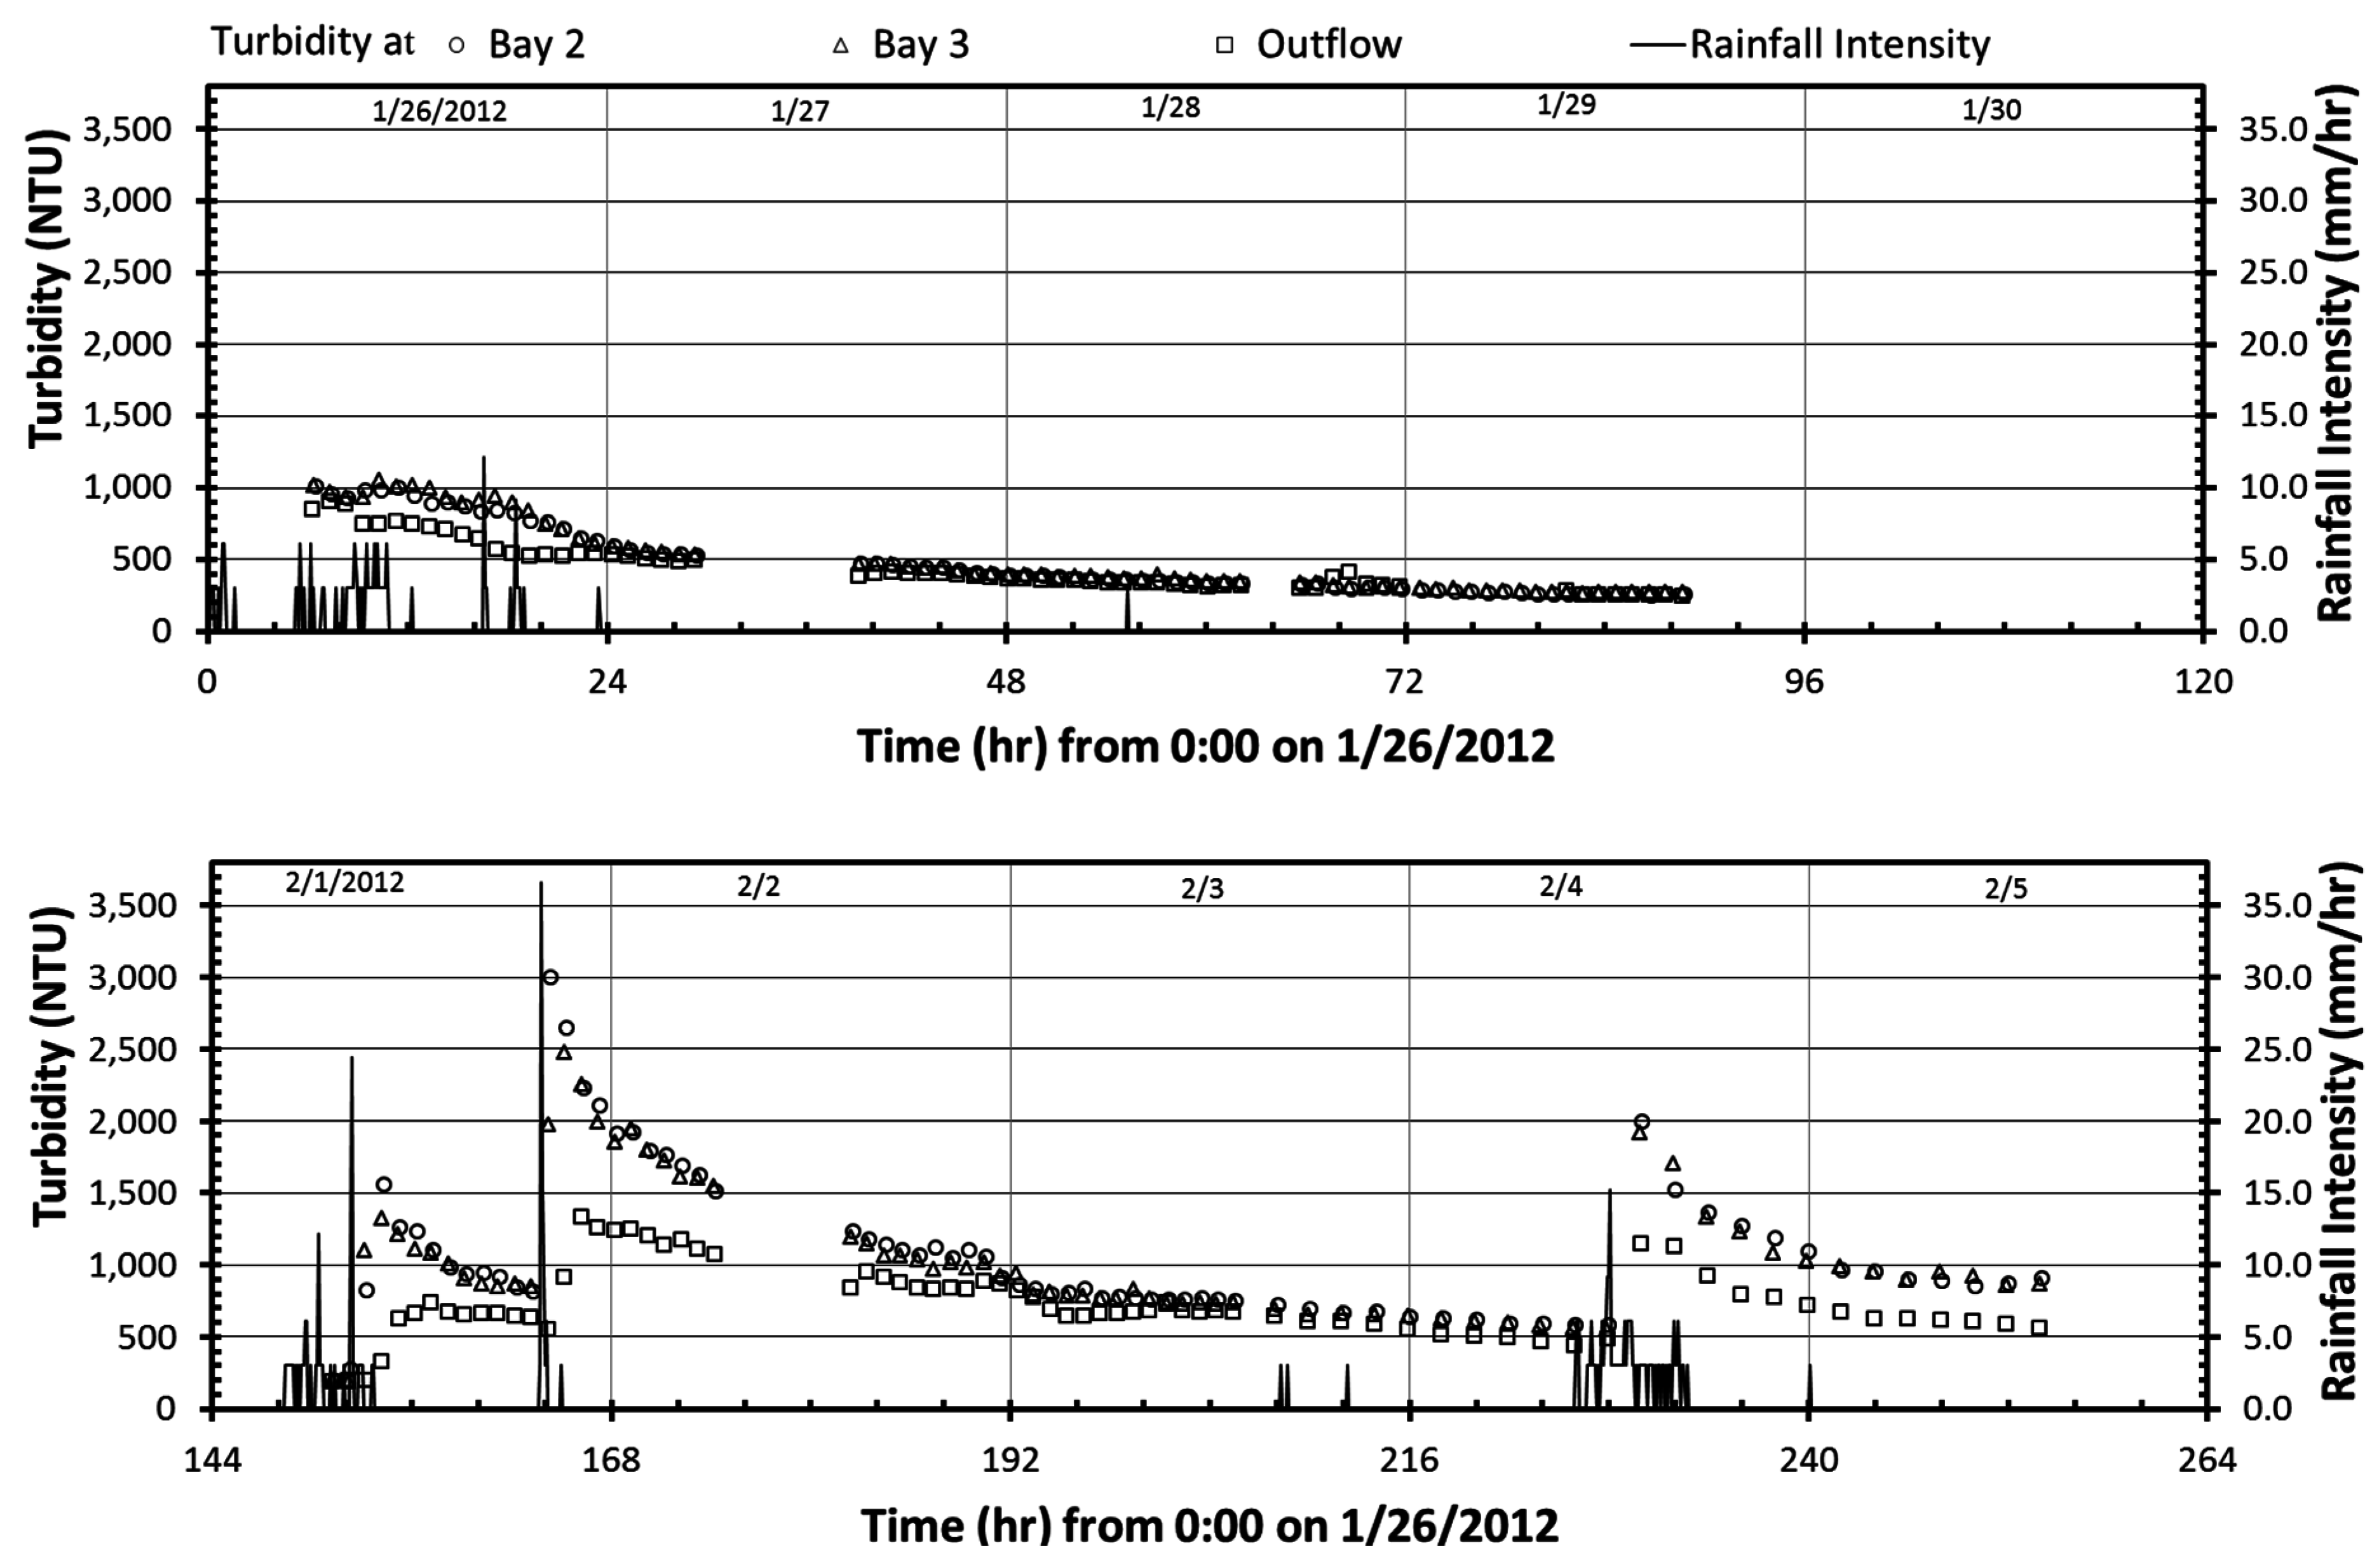
- The baffle height requirement should be clearly stated (e.g., in notes) and not just shown in the design drawing for the construction and installation of a sediment basin. The purpose of the baffles are to help slow inflow velocities and distribute the flow across the entire width of the basin, thereby creating favorable conditions for sedimentation [7] to occur under non-turbulent flow conditions as shown in Figure 2b. The problem observed during data collection, as shown in Figure 2c, was that when runoff from a rain event completely filled the basin, the water level within the basin overtopped the baffles, creating a fully mixed condition within the basin, disabling the primary function of the baffles. The runoff from the rainfall event on 26 January 2012 (Figure 5 top) was fully contained in the basin and the water level was lower than the baffle height, therefore, outflow turbidity was low. However, the rainfall events on 1 February 2012 and 4 February 2012 (Figure 5 bottom) created overflow through the spillway and the water level was higher than the baffle height, therefore, outflow turbidity was much higher. In the case of the basin monitored, the height of the baffles was 1.22 m when the contractor used available coir baffle materials, whereas the full depth of the sediment basin was 1.98 m. For the baffles to function properly, as designed, it is imperative that the height of the baffles be greater than the maximum potential water level within the sediment basin, just prior to discharge over the emergency spillway.
6. Challenges of Data Collection and Basin Operations
- There were six rainfall events that occurred during Phase I of the construction effort, and complete data collections were developed for two of these six rainfall events (16 November 2011 and 5 December 2011, Figure 3). Freezing temperatures and redirecting the runoff as construction progressed, prevented complete data collection for the other four events.
- Due to the large concentrated inflow created on 17 January 2012, damage occurred to the primary inflow channel and weir, rendering the weir useless for future data collection until properly repaired.
- To ensure adequate performance, it is important that the basin is sized appropriately to capture and detain stormwater runoff for the maximum potential drainage area contributing runoff into the basin during the life of the project.
- Resuspension of deposited sediments from previous rainfall events resulted in higher turbidity in the basin and reduced the efficiency of the basin. The period with no rain after 26 January 2012 allowed sediments to continuously settle (Figure 5) but three rain events from 1 to 4 February 2012 resulted in complex and dynamic variations of turbidity and TSS in the basin under a limited PAM condition.
- The turbidity of sediment-laden inflow from a construction site actually depends less on the total amount of rainfall from an event (e.g., 2-year, 24-h design storm) but more on rainfall intensity. For example, the rainfall event on 17 January 2012 had a total rainfall depth of 31.0 mm with a maximum five-minute rainfall intensity of 88.4 mm/h that generated inflow with maximum measured turbidity and TSS of 28,352 NTU and 26,325 mg/L, respectively. The total rainfall depth for the event was much less than 124.5 mm rainfall for a 2-year, 24-h storm in Franklin County, AL, but the maximum five-minute rainfall intensities for the 2-year and 10-year, 24-h design storms are only 11.2 mm/h and 16.3 mm/h, respectively, using Type II NRCS rainfall distribution [36]. A basin designed using a 2-year, 24-h storm would have adequate storage volume to hold runoff generated from the event, but whether the basin can sufficiently handle high turbidity generated from other high intensity rainfall impulses is unknown and needs to be further studied.
- It is difficult and challenging to dose sediment-laden stormwater inflow with the exact amount of flocculating agent across all rainfall events since rainfall is a stochastic variable. This can be considered as a challenge for specification writing by agencies and basin operations by contractors. This will be discussed in detail in the next section.
7. Discussion and Recommendations


8. Summary and Conclusions
- The sediment basin did effectively remove sediments during the early stages of construction when the basin’s influent most likely contained a relatively large percentage of large-size sediment particles. The sediment basin removed 97.9% and 83.7% of sediments generated by rainfall events on 16 November 2011 and 5 December 2011, respectively.
- High-intensity rainfall impulses generated high turbidity inflows from the construction site, re-suspended previously settled sediments within the basin, and suddenly increased in-basin turbidity, which could be several times higher than turbidity of water already in the basin.
- The lessons learned and the challenges of the field data collection to evaluate the performance of the sediment basin were listed and summarized, which will benefit the professional community for planning future studies on sediment basin monitoring efforts.
Acknowledgment
Author Contributions
Conflicts of Interest
References
- United States Environmental Protection Agency (USEPA). Stormwater Phase II Finale Rule—Construction Site Runoff Control Measure; EPA Federal Register: Washington, DC, USA, 2005; Volume 833-F-00-008.
- United States Environmental Protection Agency (USEPA). Effluent Limitations Guidelines and Standards for the Construction and Development Point Source Category; USEPA: Washington, DC, USA, 2013.
- National Pollutant Discharge Elimination System Permit—General Perimt. Available online: http://adem.alabama.gov/programs/water/waterforms/ALR10CGP.pdf (accessed on 29 June 2015).
- United States Environmental Protection Agency (USEPA). Development Document for Final Effluent Guidelines and Standards for the Construction & Development Category; USEPA, Office of Water: Washington, DC, USA, 2009.
- Alabama Soil and Water Conservation Committee (ASWCC). Alabama Handbook for Erosion Control, Sediment Control, and Stormwater Management on Construction Site and Urban Areas; ASWCC: Montgomery, AL, USA, 2006; Volume 1, p. 374.
- Jarrett, A.R. Design of perforated risers to control dewatering of sedimentation basins. Appl. Eng. Agric. 1993, 9, 37–42. [Google Scholar] [CrossRef]
- Alabama Soil and Water Conservation Committee (ASWCC). Alabama Handbook for Erosion Control, Sediment Control, and Stormwater Management on Construction Site and Urban Areas; ASWCC: Montgomery, AL, USA, 2009.
- Millen, J.A.; Jarrett, A.R.; Faircloth, J.W. Experimental evaluation of sedimentation basin performance for alternative dewatering systems. Trans. Am. Soc. Agric. Eng. 1997, 40, 1087–1095. [Google Scholar] [CrossRef]
- Rauhofer, J.; Jarrett, A.R.; Shannon, R.D. Effectiveness of sedimentation basins that do not totally impound a runoff event. Trans. Am. Soc. Agric. Eng. 2001, 44, 813–818. [Google Scholar] [CrossRef]
- Bidelspach, D.A.; Jarrett, A.R.; Vaughan, B.T. Influence of increasing the delay time between the inflow and outflow hydrographs of a sediment basin. Trans. Am. Soc. Agric. Eng. 2004, 47, 439–444. [Google Scholar] [CrossRef]
- Thaxton, C.S.; Calantoni, J.; McLaughlin, R.A. Hydrodynamic assessment of various types of baffles in a sediment retention pond. Trans. Am. Soc. Agric. Eng. 2004, 47, 741–749. [Google Scholar] [CrossRef]
- Thaxton, C.S.; McLaughlin, R.A. Sediment capture effectiveness of various baffle types in a sediment retention pond. Trans. Am. Soc. Agric. Eng. 2005, 48, 1795–1802. [Google Scholar] [CrossRef]
- McCaleb, M.M.; McLaughlin, R.A. Sediment trapping by five different sediment detention devices on construction sites. Trans. ASABE 2008, 51, 1613–1621. [Google Scholar] [CrossRef]
- Kang, J.; King, S.E.; McLaughlin, R.A. Impacts of flocculation on sediment basin performance and design. Trans. Am. Soc. Agric. Eng. 2014, 57, 1099–1107. [Google Scholar]
- North Carolina Department of Transportation (NCDOT). Sediment traps and barriers. In North Carolina Erosion and Sediment Control Planning and Design Manual; NCDOT: Raleigh, NC, USA, 2013; p. 58. [Google Scholar]
- Hossain, M.A.; Alam, M.; Yonge, D.R.; Dutta, P. Efficiency and flow regime of a highway stormwater detention pond in washington, USA. Water Air Soil Pollut. 2005, 164, 79–89. [Google Scholar] [CrossRef]
- McLaughlin, R.A.; Hayes, S.A.; Clinton, D.L.; McCaleb, M.M.; Jennings, G.D. Water quality improvements using modified sediment control systems on construction sites. Trans. ASABE 2009, 52, 1859–1867. [Google Scholar] [CrossRef]
- Bidelspach, D.A.; Jarrett, A.R. Electro-Mechanical outlet flow control device delays sediment basin dewatering. Appl. Eng. Agric. 2004, 20, 759–763. [Google Scholar] [CrossRef]
- Bhardwaj, A.K.; McLaughlin, R.A. Simple polyacrylamide dosing systems for turbidity reduction in stilling basins. Trans. ASABE 2008, 51, 1653–1662. [Google Scholar] [CrossRef]
- Haan, C.T.; Barfield, B.J.; Hayes, J.C. Design Hydrology and Sedimentology for Small Catchments; Academic Press: New York, NY, USA, 1994. [Google Scholar]
- Bentzen, T.R.; Larsen, T.; Rasmussen, M.R. Predictions of resuspension of highway detention pond deposits in interrain event periods due to wind-induced currents and waves. J. Environ. Eng. 2009, 135, 1286–1293. [Google Scholar] [CrossRef]
- Barfield, B.J.; Clar, M. Development of New Design Criteria for Sediment Traps and Basins; Maryland Resource Administration: Annapolis, MD, USA, 1985. [Google Scholar]
- Line, D.E.; White, N.M. Efficiencies of temporary sediment traps on two North Carolina construction sites. Trans. Am. Soc. Agric. Eng. 2001, 44, 1207–1215. [Google Scholar]
- Comings, K.J.; Booth, D.B.; Horner, R.R. Storm water pollutant removal by two wet ponds in bellevue, Washington. J. Environ. Eng. 2000, 126, 321–330. [Google Scholar] [CrossRef]
- Zhou, S.; McCorquodale, J.A. Modeling of rectangular settling tanks. J. Hydraul. Eng. 1992, 118, 1391–1405. [Google Scholar] [CrossRef]
- Pitt, R.E.; Clark, S.E.; Lake, D.W. Construction Site Erosion and Sediment Controls: Planning, Design, and Performance; DEStech Publications, Inc.: Lancaster, PA, USA, 2007; p. 381. [Google Scholar]
- Madaras, J.S.; Jarrett, A.R. Spatial and temporal distribution of sediment concentration and particle size distribution in a field scale sedimentation basin. Trans. Am. Soc. Agric. Eng. 2000, 43, 897–902. [Google Scholar] [CrossRef]
- Bhardwaj, A.K.; McLaughlin, R.A.; Babcock, D.L. Energy dissipation and chemical treatment to improve stilling basin performance. Trans. ASABE 2008, 51, 1645–1652. [Google Scholar] [CrossRef]
- Zech, W.C.; Logan, C.P.; Fang, X. State-of-the-practice: Evaluation of sediment basin design, construction, maintenance, and inspection procedures. ASCE Pract. Period. Struct. Des. Constr. 2014, 19, 04014006. [Google Scholar] [CrossRef]
- Hach Company. Determining the Relationship between Turbidity and Total Suspended Solids. In Hach Method 8366 Analytical Procedures; Hach Company: Loveland, CO, USA, 2011. [Google Scholar]
- American Society of Testing and Materials (ASTM). ASTM d6913-04(2009)e1: Standard Test Methods for Particle-size Distribution (Gradation) of Soils Using Sieve Analysis; American Society of Testing and Materials (ASTM) International: West Conshohocken, PA, USA, 2009. [Google Scholar]
- North Carolina Department of Transportation (NCDOT). Sediment traps and barriers. In Practice Standards and Specifications; NCDOT: Raleigh, NC, USA, 2006. [Google Scholar]
- Logan, C.P. Assessing Performance Characteristics of Sediment Basins Constructed in Franklin County of Alabama. Master’s Thesis, Auburn University, Auburn, AL, USA, 2012. [Google Scholar]
- Wanielista, M.P.; Yousef, Y.A. Stormwater Management; John Wiley & Sons, Inc.: New York, NY, USA, 1993. [Google Scholar]
- U.S. Department of Agriculture (USDA). Soil Survey of Porter County, Indiana; USDA Soil Conservation Service: Washington, DC, USA, 1981.
- Viessman, W.; Lewis, G.L. Introduction to Hydrology, 5th ed.; Pearson Education: Upper Saddle River, NJ, USA, 2003; p. 612. [Google Scholar]
- U.S. Environmental Protection Agency (USEPA). National Pollutant Discharge Elimination System General Permit for Discharges from Construction Activities; USEPA: Washington, DC, USA, 2012.
© 2015 by the authors; licensee MDPI, Basel, Switzerland. This article is an open access article distributed under the terms and conditions of the Creative Commons Attribution license (http://creativecommons.org/licenses/by/4.0/).
Share and Cite
Fang, X.; Zech, W.C.; Logan, C.P. Stormwater Field Evaluation and Its Challenges of a Sediment Basin with Skimmer and Baffles at a Highway Construction Site. Water 2015, 7, 3407-3430. https://doi.org/10.3390/w7073407
Fang X, Zech WC, Logan CP. Stormwater Field Evaluation and Its Challenges of a Sediment Basin with Skimmer and Baffles at a Highway Construction Site. Water. 2015; 7(7):3407-3430. https://doi.org/10.3390/w7073407
Chicago/Turabian StyleFang, Xing, Wesley C. Zech, and Christopher P. Logan. 2015. "Stormwater Field Evaluation and Its Challenges of a Sediment Basin with Skimmer and Baffles at a Highway Construction Site" Water 7, no. 7: 3407-3430. https://doi.org/10.3390/w7073407