Article

A Comparative Analysis of Runoff and Soil Loss Characteristics between “Extreme Precipitation Year” and “Normal Precipitation Year” at the Plot Scale: A Case Study in the Loess Plateau in China

1
China Land Surveying and Planning Institute, Key Laboratory of Land Use, Ministry of Land and Resources, Beijing 100035, China
2
College of Forestry, Shanxi Agricultural University, Taigu, Shanxi 030801, China
3
College of Resources Science and Technology, Beijing Normal University, Beijing 100875, China
4
School of Geography, Beijing Normal University, Beijing 100875, China
*
Author to whom correspondence should be addressed.
Water 2015, 7(7), 3343-3366; https://doi.org/10.3390/w7073343
Submission received: 21 April 2015 / Revised: 17 June 2015 / Accepted: 18 June 2015 / Published: 26 June 2015

Abstract

:
The highest annual precipitation in Ansai during the past 60 years was observed in 2013. Studying the effects of such extreme annual precipitation on soil erosion can deepen similar research and help predict environmental damage under future extreme rainfall. We selected the runoff plots (area: 4 m × 10 m) of three land-use types: cultivated land (C), wild grassland (W) and switchgrass (S). We monitored corresponding indices in the “extreme year” (2013) and “normal year” (2010–2012). The results were as follows: (1) The rainfall parameters (rainfall amount, EI30, EI60) in the “extreme year” were all higher than those in the “normal year”, especially in July; (2) In July and August, the runoff and soil loss of cultivated land in the “extreme year” increased by 1492.5% and 538.2%, respectively, compared to those in the “normal year”. The silt content of sediment was the highest generally, but the sand content increased relatively in the “extreme year”; (3) The effect of rainfall on soil erosion was the smallest in W; (4) In the “extreme year”, the same EI30 generated more runoff and soil loss than those in the “normal year”. The high antecedent precipitation which would cause high antecedent soil moisture was one of the reasons. The threshold value (100 MJ·mm·ha−1·h−1) of EI30 related to extreme erosion risk was proposed.

1. Introduction

Rainfall characteristics play an important role in runoff generation and soil erosion in the Loess Plateau [1]. Rainfall characteristics become more variable and stochastic in the context of climate change, which increases the uncertainties and risks of water erosion in the real world [2]. The changes in precipitation are not the same all over the world. Rainfall amounts were expected to increase in the USA [3], whereas Karl [4] denoted a decreasing rainfall trend for the Mediterranean area, and Ramos and Martínez-Casasnovas [5] confirmed no trend in the annual precipitation in NE Spain. Average annual precipitation decreases for 2020–2030 and 2040–2050 for the Middle East and Northern Africa region [6]. In China, during 2021–2050 and 2071–2100, there is less co-occurrence of consecutive wet and dry days, and more joint extreme heavy precipitation events with various aspects, implying less risk of co-occurrence of floods and droughts in the same year but higher risk of floods [7]. A number of theoretical modeling and empirical analyses have suggested that striking changes in the frequency and intensity of extreme events, including floods, may occur even when there are only small changes in the mean climate [8,9]. Groisman et al. [10] showed that on a global scale, changes in extreme rainfall tend to be larger than changes in mean rainfall totals, and that increases in rainfall extremes occurred in many regions where no change or even a decrease in total rainfall was observed. Other studies also predicted that the intensity, frequency and regime of extreme precipitation events would increase further [11]. Zhang and Liu [12] declared that rainfall erosivity, which is the major driving force of water erosion, would increase 8%–35% in the Chinese Loess Plateau over the next 10 decades.
Soil loss increases with rainfall at a higher rate; for example, Favis-Mortlock and Boardman [13] used the Erosion Productivity Impact Calculator (EPIC) model and found that a 7% increase in precipitation could lead to a 26% increase in erosion in the United Kingdom. Furthermore, the effects of extreme rainfall on hydrological and erosion processes are very important, which often cause extreme runoff and soil loss events. Many studies have clearly denoted that large-magnitude, low-frequency extreme events are assumed to be dominant with respect to soil erosion [14,15]. Mannaerts and Gabriels [16] found that the dominant seasonal concentration of soil loss was limited to only a few major storms. The annual nutrient loss due to soil erosion under extremely heavy rainfall exceeds 50% of the total amount [17]. Therefore, studying extreme rainfall and the erosion response is significant to understanding the dynamics of hydrological and erosion processes.
There are two main experimental methods to study the effects of extreme rainfall on hydrological and erosion processes: one is by rainfall simulation, and the other is long-term observation under natural rainfall. The research by rainfall simulation can be performed in a shorter period of time, which accelerates the estimation of interdependencies between the factors and effects of erosion processes. Nevertheless, many studies confirmed that the results based on simulated conditions cannot accurately reveal the laws of nature compared to research under natural conditions [18]. The intensity of natural rainfall fluctuates randomly at all times [19,20], and the movement of storms (direction, velocity, etc.) is also expected to affect the associated soil loss [20]. The above characteristics of natural rainfall are difficult to actualize in simulation research. Conversely, the main advantage of a natural rainfall approach is the reflection of real situations, whereas the main disadvantage is the long time required to collect a sufficient amount of data to estimate suitable quantitative indicators. Thus, research on soil erosion during one or two extreme rainfall events was often carried out due to the difficulty of performing research over long periods [21,22]. Moreover, the values of rainfall extremes in nature have been observed to be more stochastic and unpredictable [23]. Therefore, studying the effects of natural extreme rainfall on erosion processes is at the mercy of the forces of nature; runoff and soil loss data for natural extreme rainfall is scarce and valuable. The annual precipitation in Yan’an during 2013 was 959.1 mm, which was the largest value in the past 60 years; the monthly precipitation (568.0 mm) during July in 2013 even exceeded the average annual precipitation (538.8 mm) from 1953 to 2012. The Yan’an area had never experienced such high annual precipitation, and the hydrological and erosion processes that resulted from the rainfall were also never observed. Therefore, studying the effects of such extreme annual precipitation on soil erosion can supplement data for similar research; furthermore, the results of this study have an instructive function for predicting environmental damage for future rainfall conditions under the context of climate change.
In this study, we selected runoff plots of three land-use types: cultivated land (C), wild grassland (W) and switchgrass (Panicum virgatum) (S). Rainfall erosivity (EI30) was used to identify extreme rainfall events, and the effects of these rainfall events on soil erosion were studied. The differences of rainfall parameters, runoff, soil loss, nutrient loss and sediment particle size distribution between the “extreme year” (2013) and “normal year” (2010–2012) were analyzed. The correlation between the runoff, soil loss and rainfall parameters were analyzed. The objectives of this research were as follows: (1) quantify the higher degree of runoff, nutrient loss and soil loss during the extreme rainfall year; (2) reveal the varying degrees of the effects of rainfall characteristics on the runoff and soil loss between the “extreme year” and “normal year”; (3) propose a suitable land use type to cope with extreme rainfall and discuss the threshold value of rainfall erosivity to prevent extreme erosion risk.

2. Materials and Methods

2.1. Study Area

The study area is located at the Ansai Research Station of Soil and Water Conservation, Chinese Academy of Sciences. The Ansai station is located in the Loess hill and gully region in the central Loess Plateau, its corresponding geographic coordinates are 109°19′23″ E and 36°51′30″ N, and the location of the study area is shown in Figure 1. This area is covered by a thick mantle of loess, an erosion-prone, fine silt soil, which is vulnerable to water erosion. Ansai is characterized by a warm, temperate, semi-arid and continental monsoon climate with distinct wet and dry seasons. The multi-year average, maximum and minimum temperatures in this area are 8.8, 37.3 and −18.5 °C, respectively. The average annual precipitation (1953–2012) of Yan’an (a city in the vicinity of Ansai station) was 539 mm. The rainfall shows high seasonal variability: 71% of the annual precipitation occurs between June and September.
Figure 1. Location and layout of the runoff plot (C: cultivated land, S: switchgrass, W: wild grassland).
Water 07 03343 g001

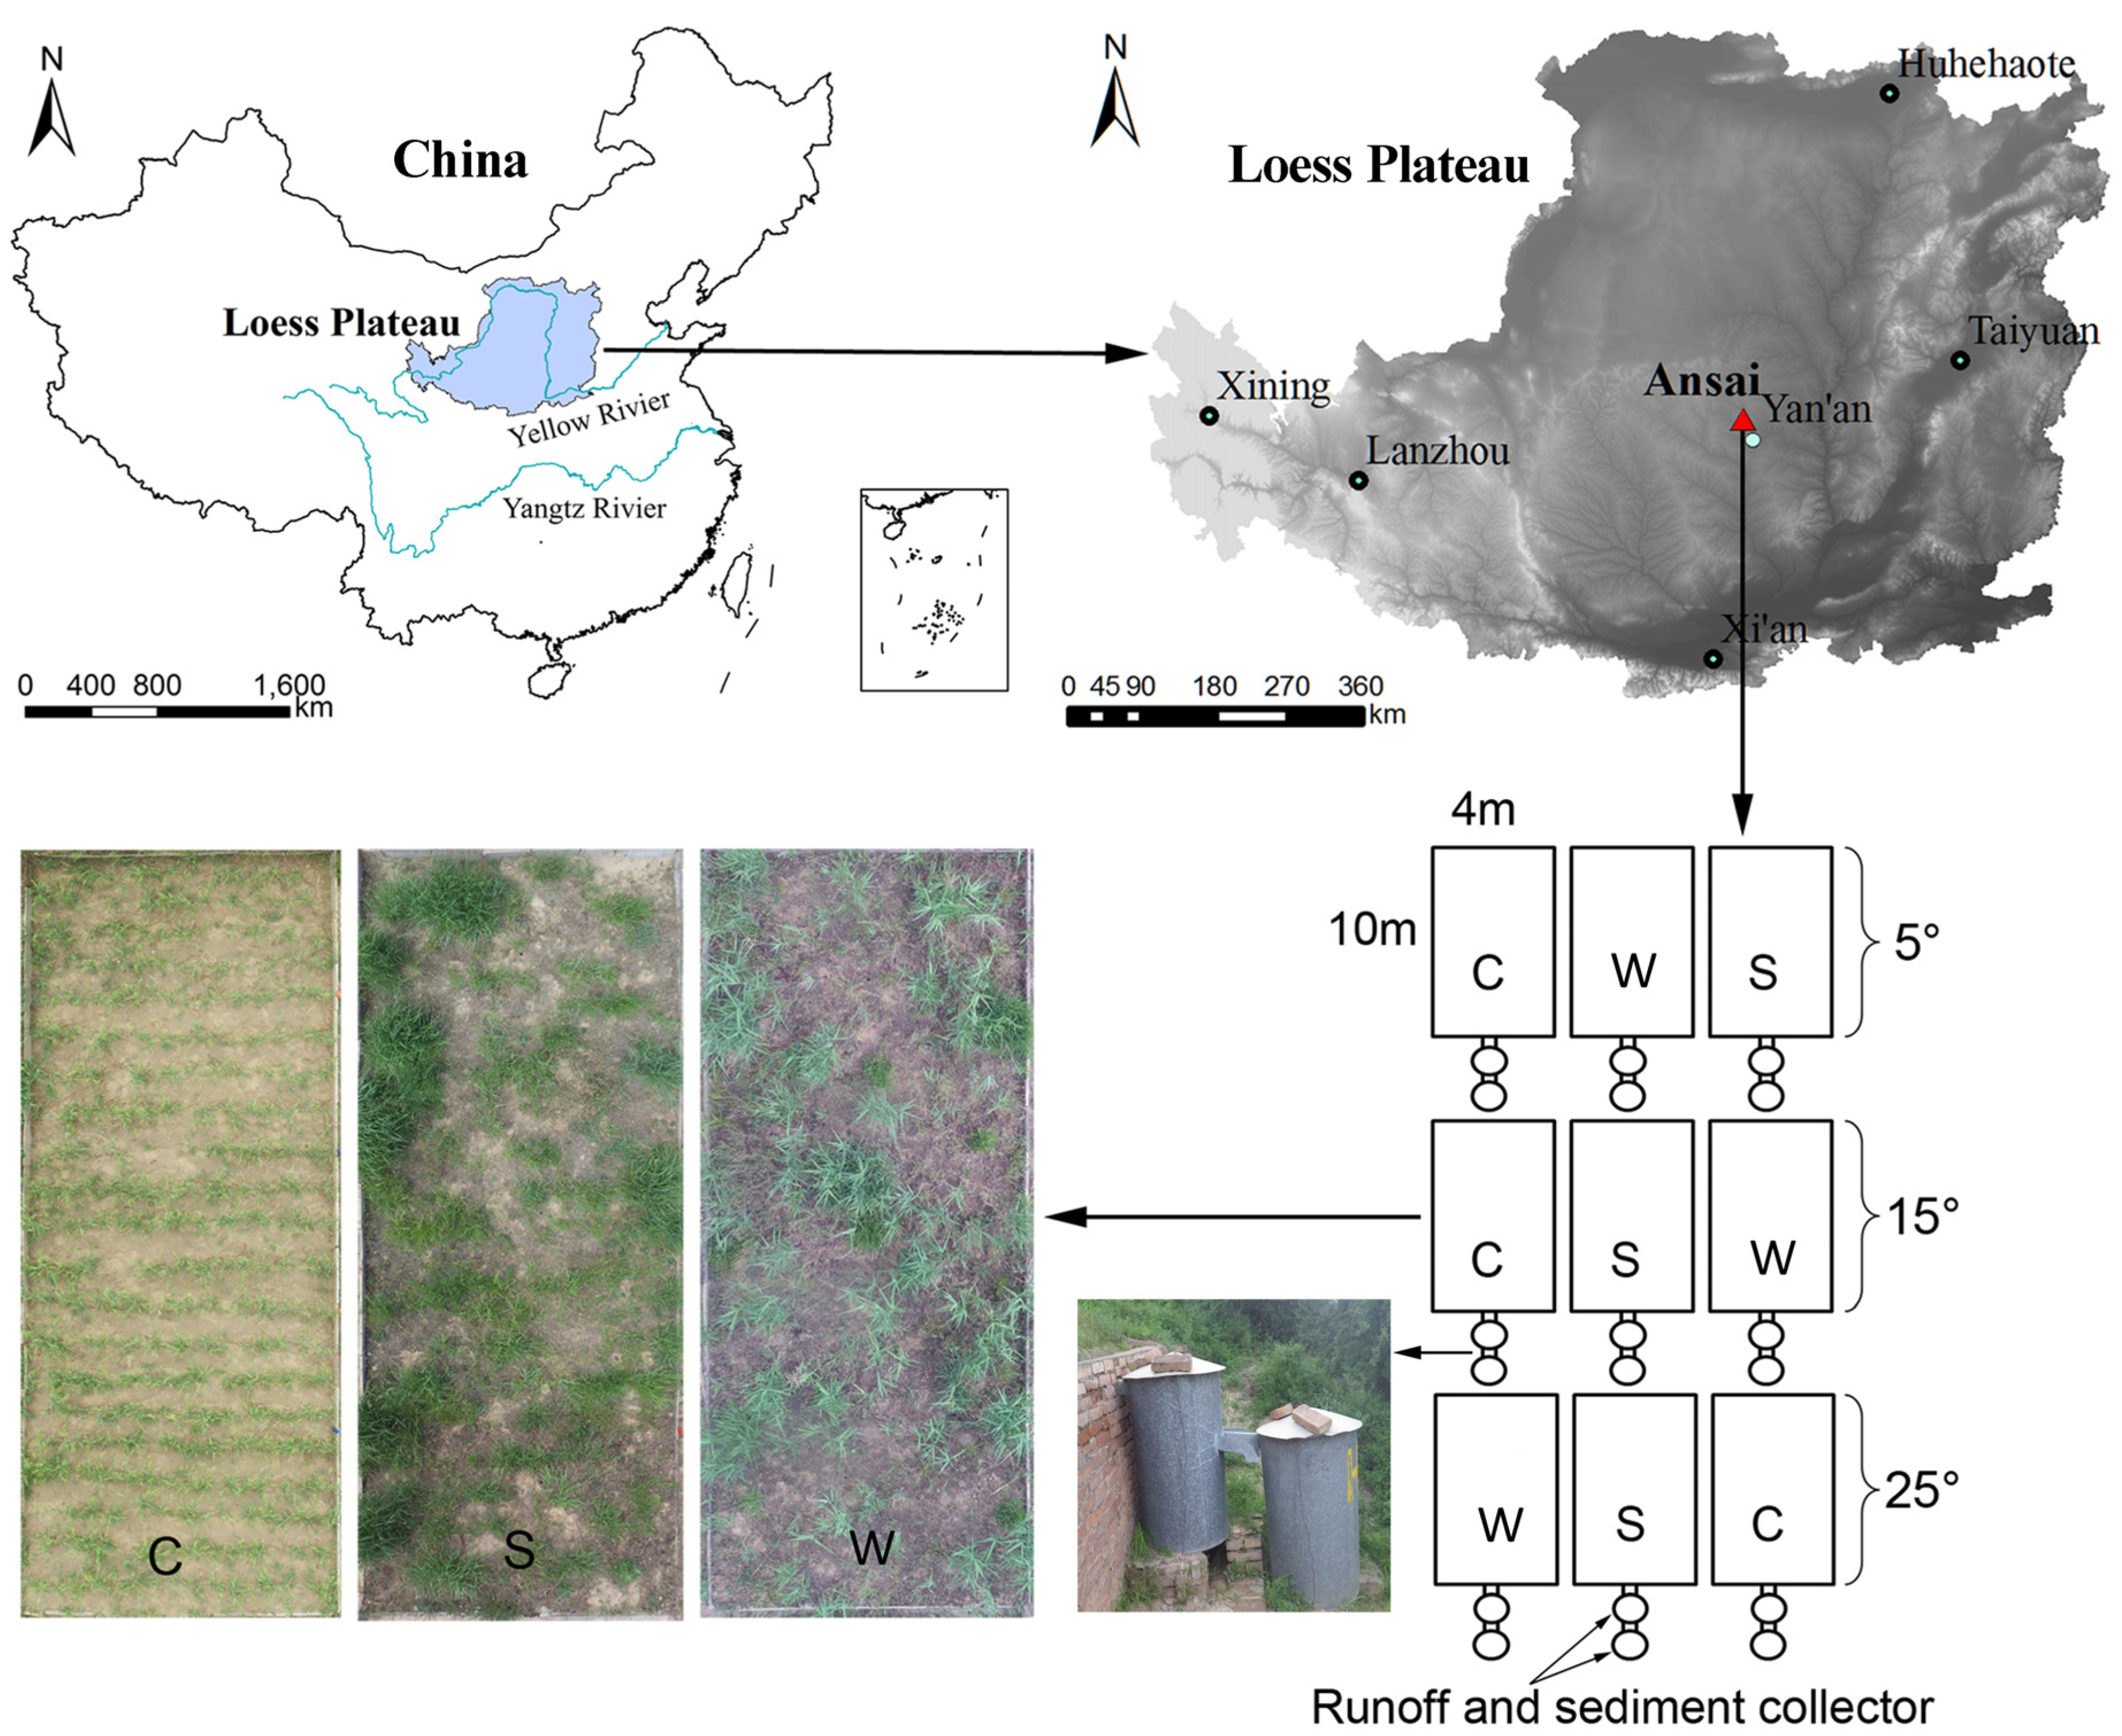
2.2. Runoff Plot Design

The runoff plots were located on 5°, 15° and 25° slopes. The slope direction was 82° northeast, and the horizontal projection area of the runoff plot was 4 m × 10 m (Figure 1). We designated three land-use types for this study: C (cultivated land), S (switchgrass) and W (wild grassland). Cultivated land related to food supplies; switchgrass was an important energy plant; wild grassland was often used in the Grain for Green Project (GGP) in the Loess Plateau of China. C was planted using the local traditional rotation of foxtail millet (Setaria italica) and broom corn millet (Panicum miliaceum). Foxtail millet was planted in May of the first year, and broom corn millet was planted in May of the second year, with annually alternating rotations. These crops were planted perpendicular to the slope direction. S is a perennial herb planted in 2006. After planting, the aboveground portion of the herb was mowed each year during the fall; in the spring of the second year, the herb naturally germinated. W was derived from the discontinuation of the cultivated land in 2006, in which the major plants included blue grass (Poa annua), green bristlegrass (Setaria viridis) and capillary artemisia (Artemisia capillaris). The average vegetation cover during the growing season (from June to September) for C, S and W was 33%, 55% and 62%, respectively. The texture of the topsoil for runoff plots was silt loam; silt dominated the content (70.6%), followed by sand (25.1%) and clay (4.3%). Each plot was surrounded by cement slabs, and the runoff plot was connected to two 60-cm-diameter galvanized tin buckets, which were used to monitor the amount of runoff and soil loss in each plot (Figure 1).

2.3. Data Collection and Calculation

2.3.1. Compilation of Rainfall Data over the Past 60 Years

Long-term rainfall data near the runoff plot were lacking, so rainfall data from Yan’an were used to describe the rainfall tendencies at the Ansai station over the past 60 years. The rainfall data were downloaded from the China Meteorological Data Sharing Service System [24].

2.3.2. Monitoring and Calculation of the Rainfall Parameters

We installed an automated rain gauge with 0.2-mm accuracy next to the runoff plot to record data during 2006–2013. We calculated the rainfall amount, rainfall duration, maximum rainfall intensity over 5 min (I5), 10 min (I10), 20 min (I20), 30 min (I30) and 60 min (I60) for each single rainfall event based on these data. The kinetic energy of the rainfall (E) was calculated using the formula of Forster et al. [25].
According to the Universal Soil Loss Equation (USLE)/Revised Universal Soil Loss Equation (RUSLE), the product (EI30) of the rainfall kinetic energy and maximum rainfall intensity over 30 min represents the rainfall erosivity [26] and reflects the erosion effect of rainfall on soil. Not all rainfall events cause soil erosion, only rainfall that produces enough runoff to transport sediment is erosive. Rain showers of less than 12.7 mm and separated from other rain periods by more than six hours were omitted from the erosion index computations, unless as much as 6.4 mm of rain fell in 15 min [26]. Xie et al. [27] determined the threshold value (rain showers of more than 12 mm) for erosive rain by using rainfall and soil loss data from the Zizhou experimental station of the Yellow River Basin in China; this threshold value was adopted to separate erosive rain events in this study. We calculated the product of the kinetic energy of rainfall and rainfall intensity parameters (i.e., EI5, EI10, EI20, EI30 and EI60) for erosive rainfall events.
The antecedent precipitation index (API) reflects the antecedent soil moisture content, which is an important factor that affects runoff and soil loss [28,29,30,31]. The API was calculated using the formula of Heggen [32], who expressed the API as a precipitation moving average with decay:
API i ( t ) = d = 1 i P t d k d
where i is the number of antecedent days (i = 15 in this study); k is the decay constant, which should generally lie between 0.80 and 0.98 (k = 0.85 in this study); and Pt–d is the precipitation total for day t–d.

2.3.3. Determination of Extreme Rainfall

Because EI30 reflects the erosion effect of rainfall on soil, extreme rainfall events were determined from the EI30 instead of the rainfall amount. The EI30 of the rainfall events were calculated based on erosive rainfall data (rainfall amount exceeded 12 mm) from June to September over seven years (2006–2012). Extreme rainfall events were defined as those in which the EI30 exceeded the 95th percentile. The 95th percentile was the average of the annual 95th percentile for seven years (2006–2012); the value was 159 MJ·mm·ha−1·h−1. There are two advantages in this method for defining extreme rainfall: first, the deletion of rainfalls less than 12 mm, which do not generate soil loss, so higher threshold value of extreme rainfall was obtained, which corresponded with the real state of extreme erosion; second, the extreme rainfall events determined by the EI30 are more closely correlated with soil loss.

2.3.4. Monitoring Runoff, Soil Loss and Nutrient Loss

From 2010 to 2013, we measured the volume of the runoff (i.e., the amount of runoff (cm3) after each rainfall) in the runoff-collecting bucket. The ratio of runoff to the area of the plot represents the runoff depth (cm). The runoff coefficient was computed as the ratio of the runoff depth to the rainfall depth in each plot. The soil-water-suspension in the runoff-collecting bucket was collected and allowed to sit for 24 h, the sediment was separated from the water, and the remaining water was allowed to naturally evaporate, at last the sediment was dried in an oven at 105 °C for 8 h and weighed. The ratio of mass of the sediment to the area of the plot represents the soil loss (t/ha). The runoff-collecting buckets were cleaned after each collection of sediment and runoff. The sediment for all of the soil loss events in each year for each land-use type was mixed. The soil organic matter (SOM) concentration of the sediment was determined by the potassium dichromate volumetric method [33], and the total nitrogen (TN) and total phosphorus (TP) concentrations were measured using an element analyzer Vario EL III (Elementar Analysensysteme Co., Hanau, Germany). The nutrient loss was calculated from the nutrient concentration and soil loss amount. We used a laser particle size analyzer (Malvern Instruments Ltd., Worcestershire, UK) to measure the percentages of sand (>0.05 mm), silt (0.002–0.05 mm) and clay (<0.002 mm) of the sediment.

2.4. Data Analysis

The average values of all indices over three years (2010–2012) represented the hydrology and soil erosion conditions for the “normal year”, whereas 2013 was an “extreme year”. The differences of rainfall parameters, runoff, soil loss and nutrient loss between the “extreme year” (2013) and “normal year” (2010–2012) were analyzed.
Two way (year and slope; land use type and slope) ANOVA without replication [34] was used to test whether the soil and water loss for the land use types as well as those between the “extreme year” and “normal year” were significantly different. Then, the least significant difference (LSD) multiple comparison test (p < 0.05) was used. Slope effects also can be revealed in the statistical analysis, but were not discussed as this is not the focus of the article. The relationships between the runoff depth, soil loss and rainfall parameters were investigated through Pearson correlation and regression analysis.

3. Results and Discussion

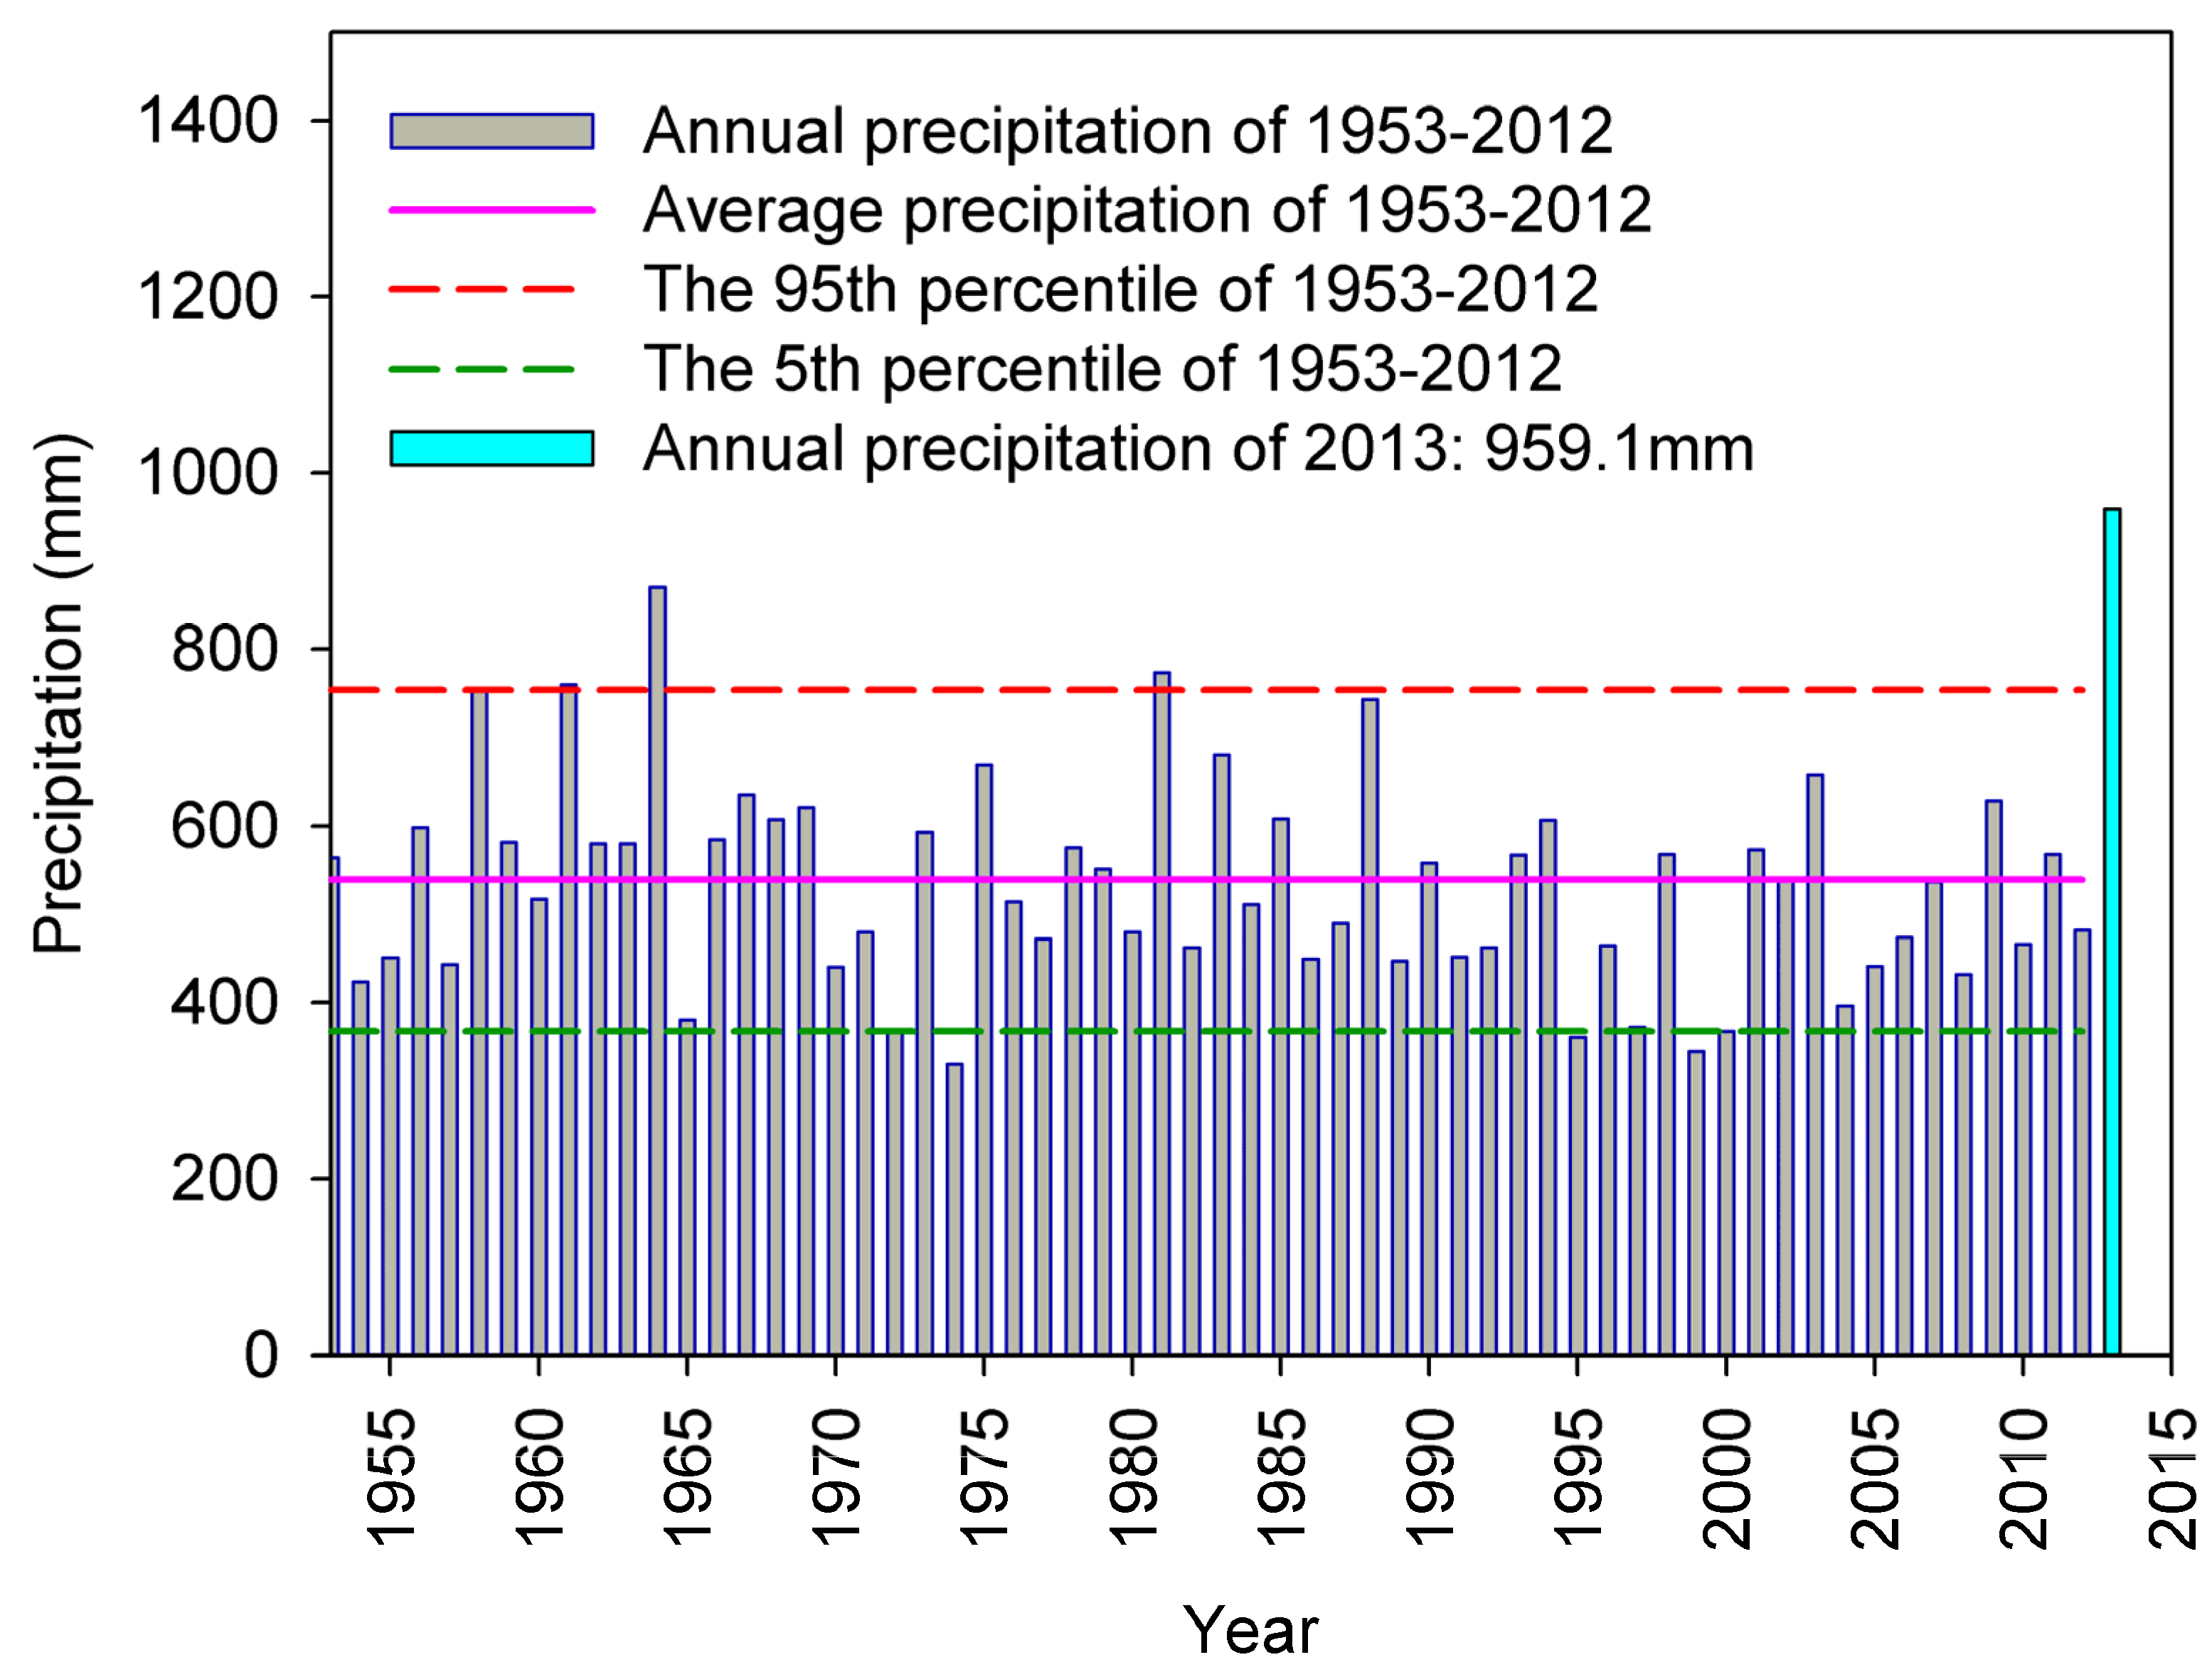
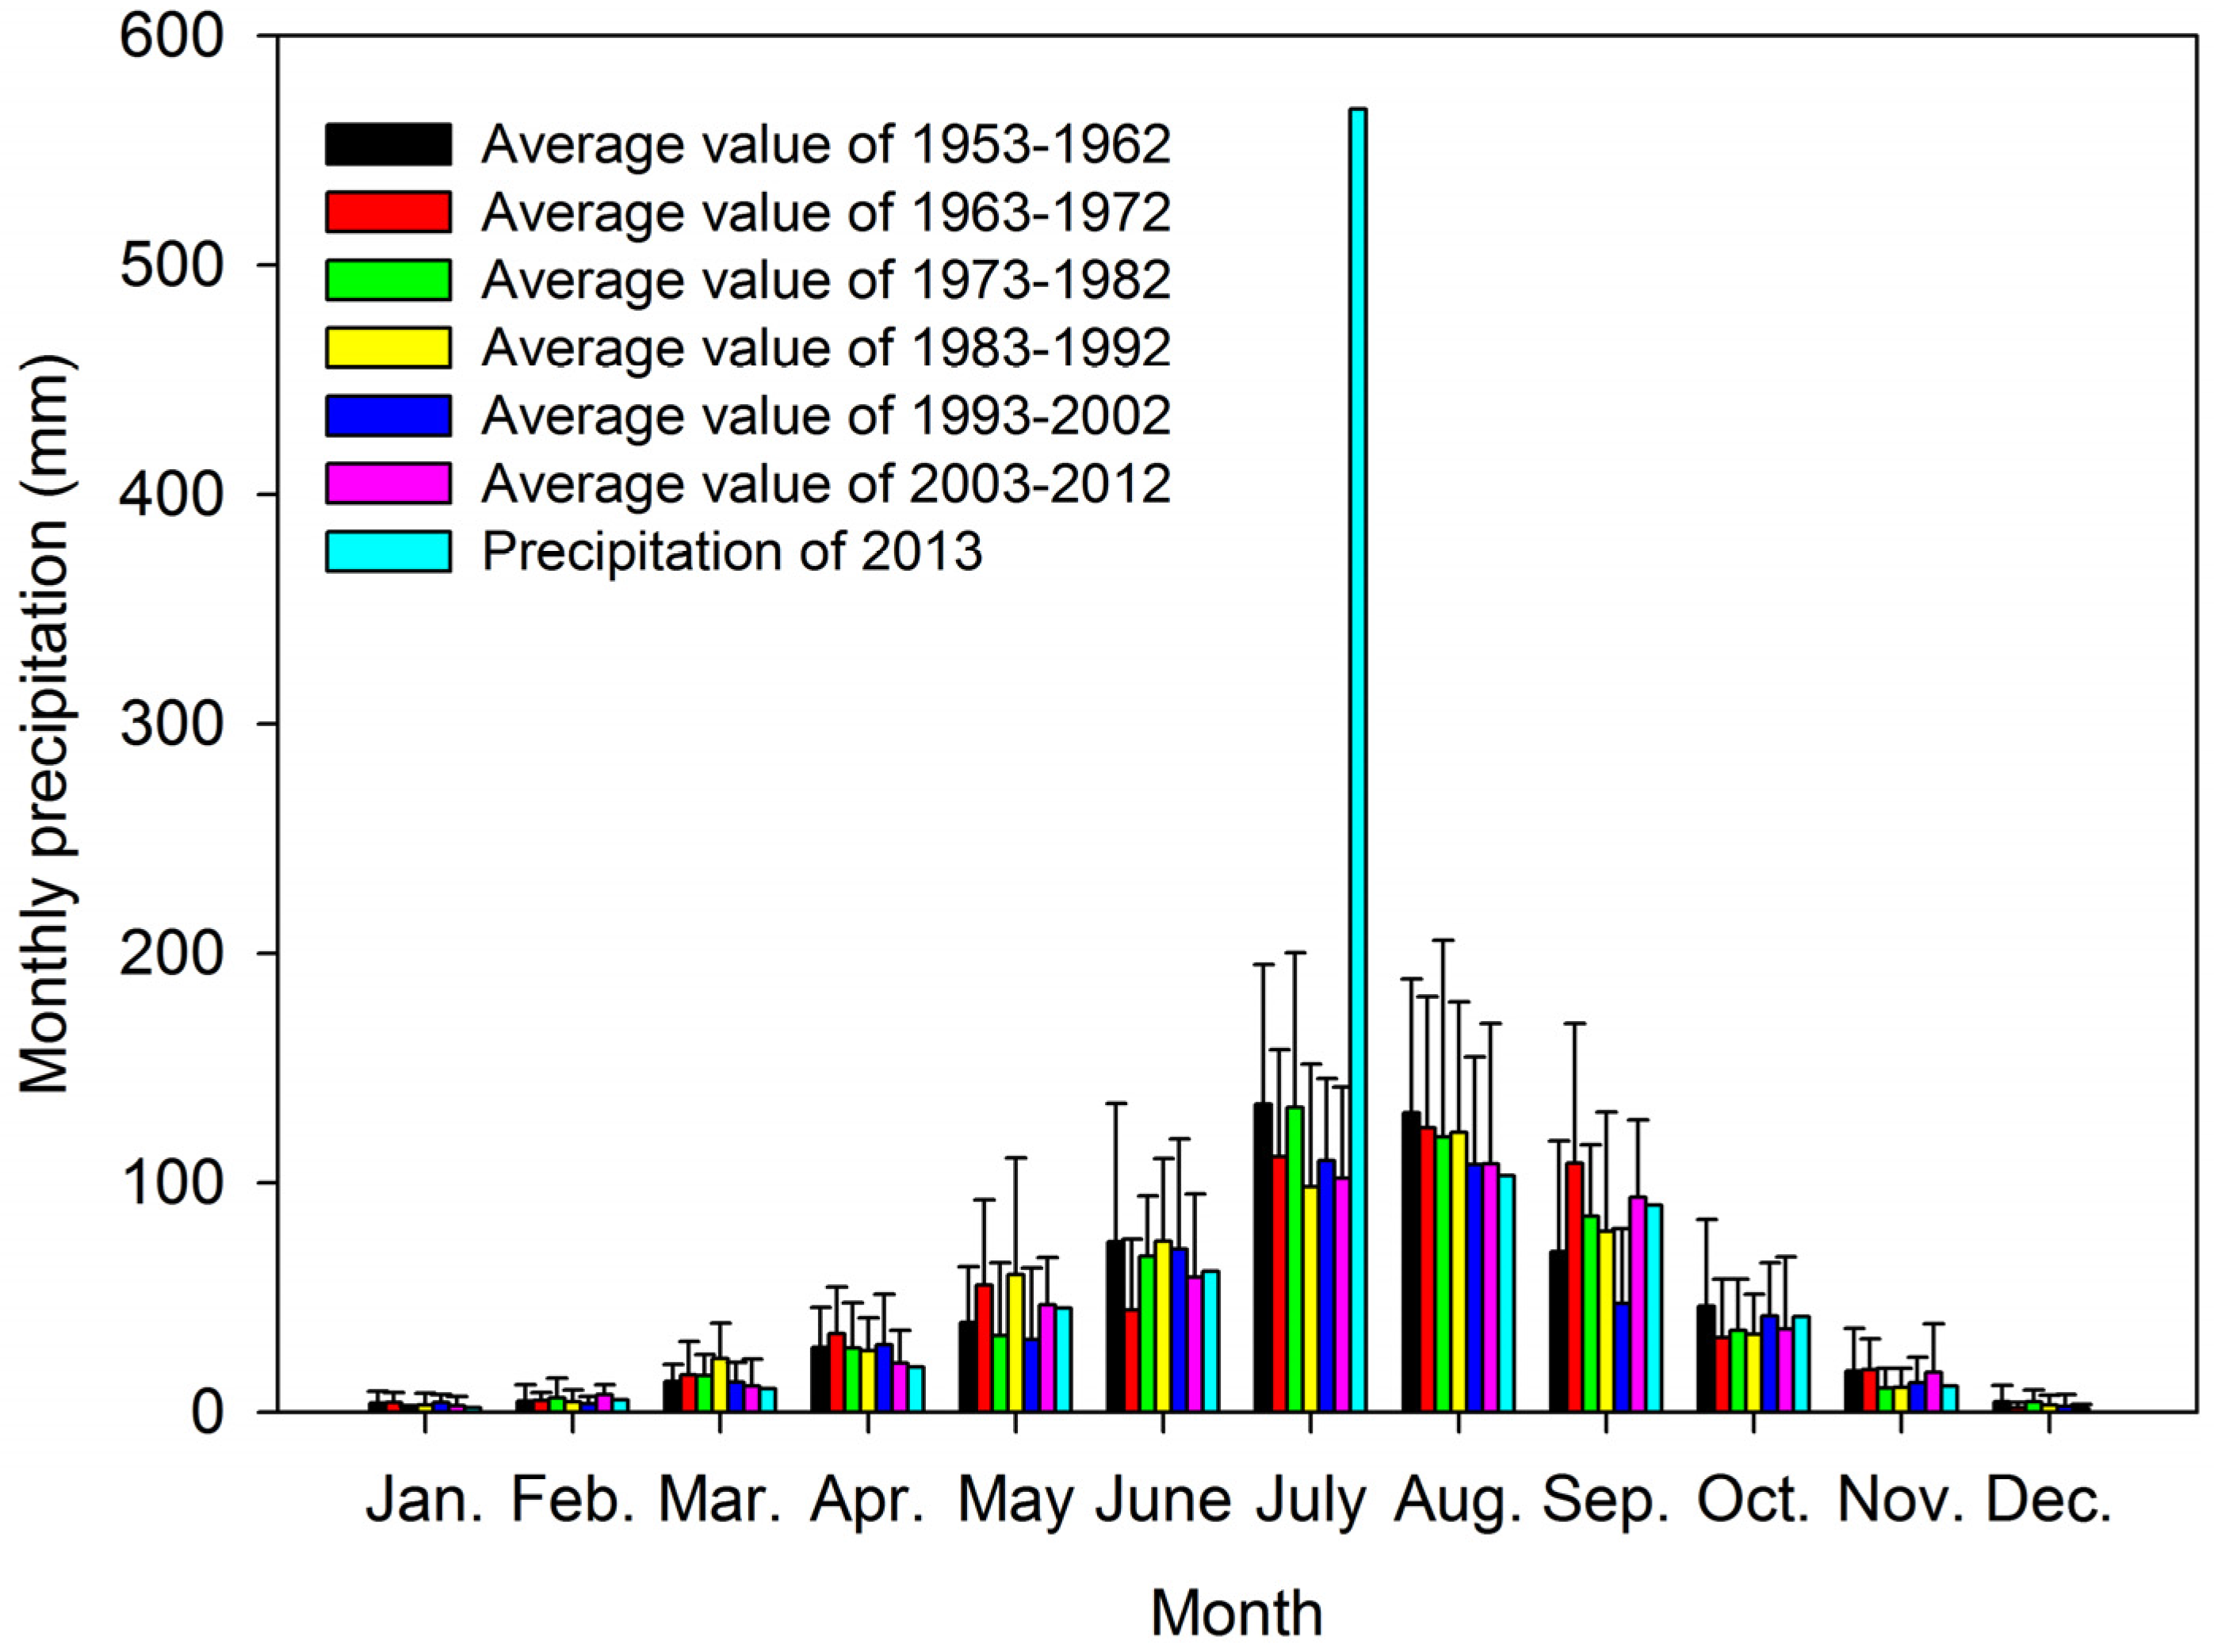
3.1. Annual Rainfall Amount and Monthly Rainfall Distribution in the “Extreme Year”

Rainfall data of Yan’an were used to describe the long-term tendencies of rainfall at the Ansai station. Figure 2 shows that annual precipitation ranged between 330 and 871 mm from 1953–2012; the average annual precipitation over the 60-year period was 538.8 mm, and the 5th and 95th percentiles were 366.9 mm and 754.3 mm, respectively. The annual precipitation for 2013 was 959.1 mm, which was much higher than the average level for 1953–2012 (the difference was 420.3 mm) and the 95th percentile (the difference was 204.8 mm). According to the criteria of the World Meteorological Organization (WMO), i.e., when the difference between the specific rainfall variable and corresponding mean values of 30-year measurements exceeds the double variance of each variable, the specific rainfall value is defined as extreme rainfall [35]. The variance of annual precipitation from 1953 to 2012 was 115.3; thus, 2013 was an “extreme year” in terms of the annual precipitation.
Figure 2. Variation of annual precipitation from 1953 to 2013 in Yan’an.
Water 07 03343 g002
Figure 3 reveals that the rainfall showed high seasonal variability: 71.4% of the annual precipitation occurred between June and September over the 60-year period (1953–2012). During the “extreme year” 2013, monthly rainfall was within the normal range except for that of July, in which the total rainfall (568 mm) was as high as 4.95 times of long-term average (114.8 mm). Therefore, the extreme rainfall amount in July was the major contributor (59.2%) to the total rainfall in 2013; this July rainfall even exceeded the average annual rainfall from 1953 to 2012 (538.8 mm).
Figure 3. Monthly rainfall distribution in Yan’an.
Water 07 03343 g003

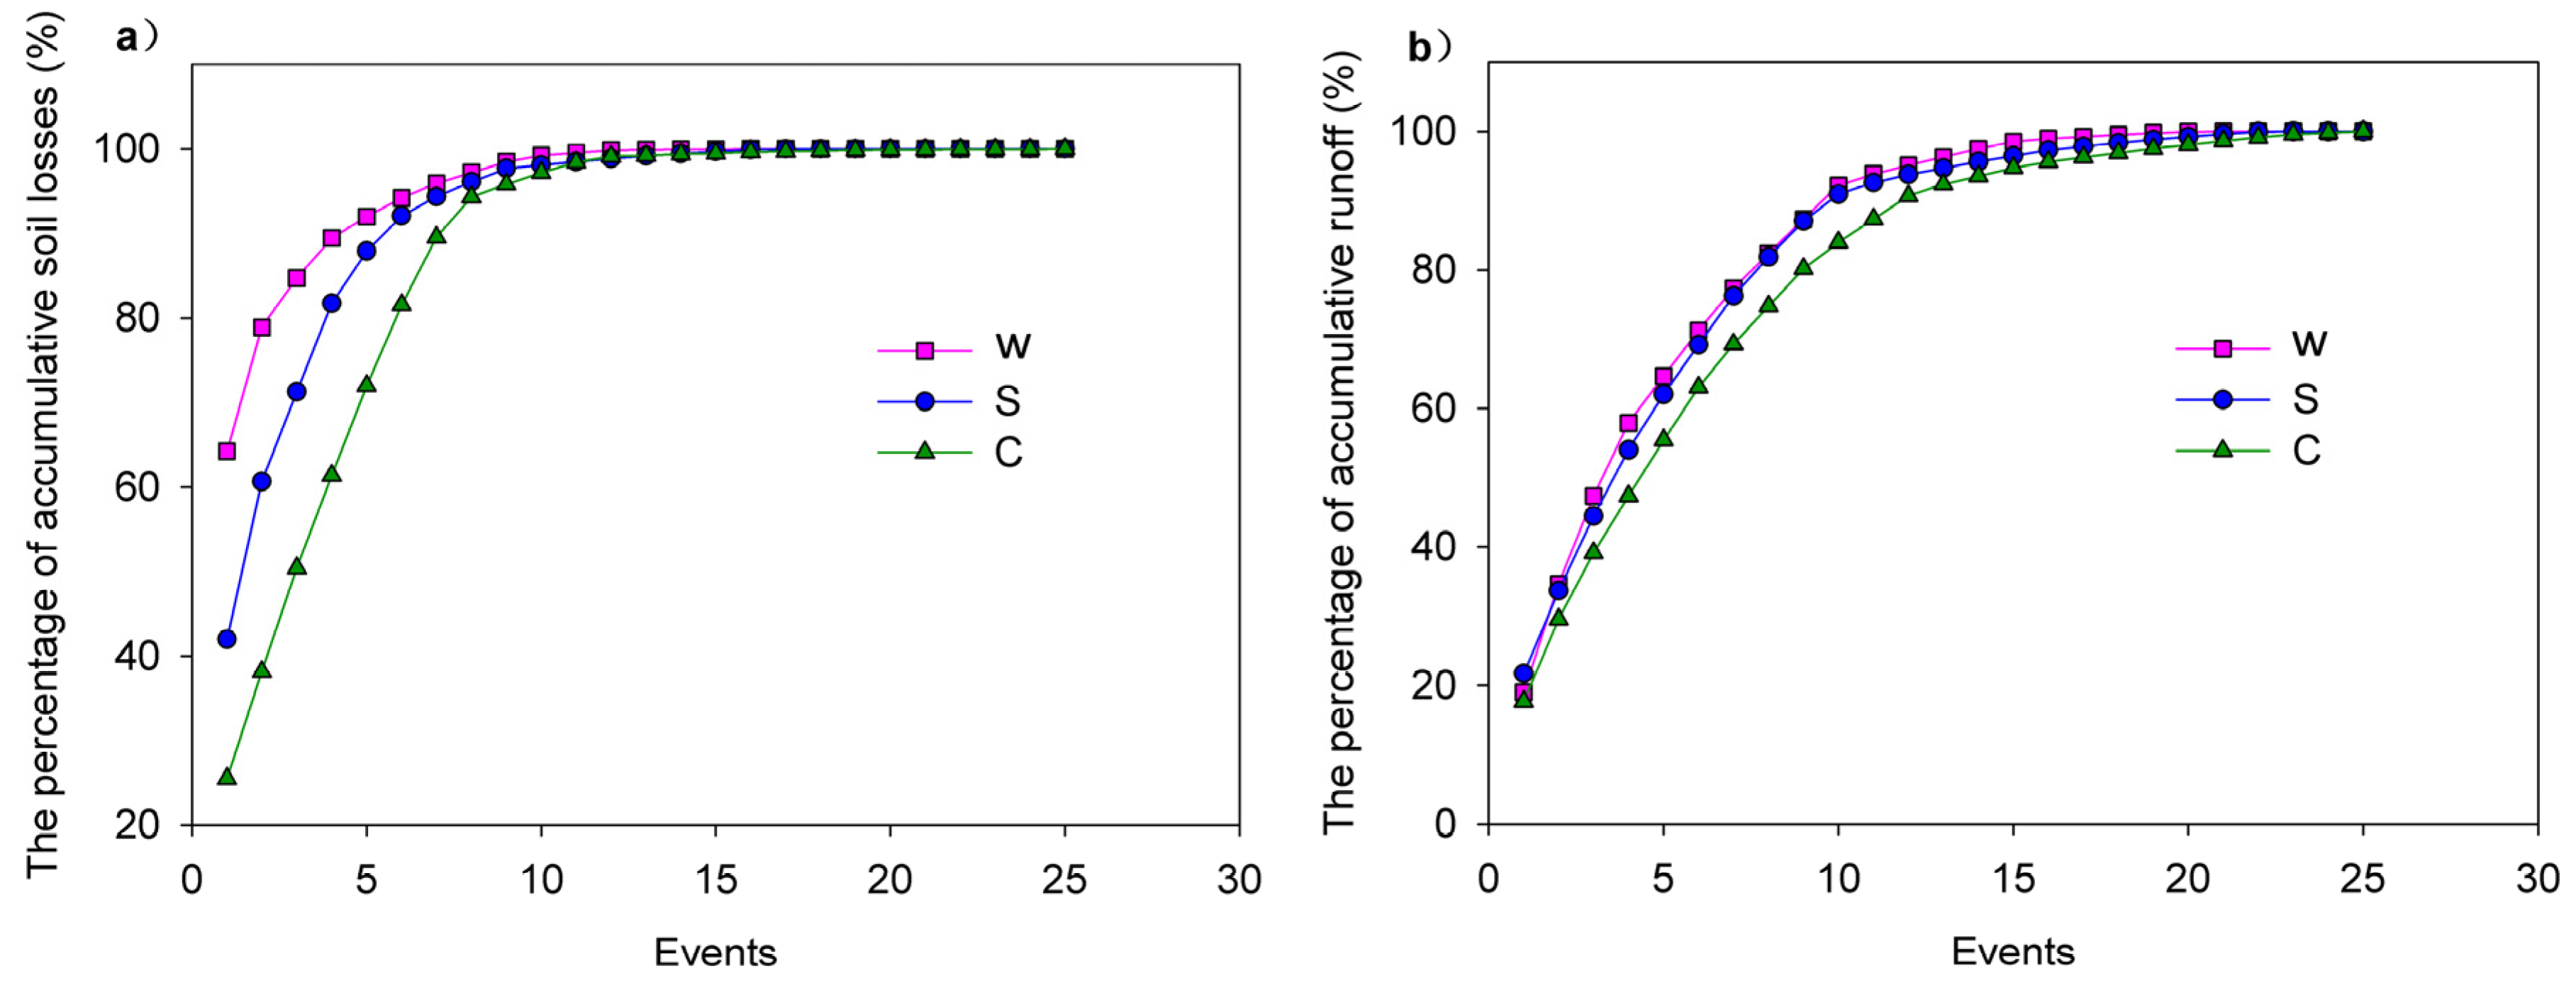
3.2. Runoff Depth and Soil Losses in Rainfall Events from 2010 to 2013

In 2010, 2011 and 2012, the cumulative rainfall amount of all the erosion producing events from June to September was 117.8 mm, 187.4 mm and 203.7 mm, respectively; in each year one rainfall event exceeded the threshold value (159 MJ·mm·ha−1·h−1) of extreme rainfall. The API ranged between 0 and 40.1 mm, with an average value of 16.6 mm (Table 1). In 2013, the cumulative rainfall amount of the soil loss events from June to September was 483.4 mm; the soil loss events mainly occurred in July and August, and there were four extreme rainfall events. The API ranged between 2.7 and 71.0 mm with an average of 31.7 mm.
The total annual runoff and soil losses for each year were mainly influenced by several extreme rainfall events. More than 50% of the annual runoff and soil losses were affected by extreme events, except for the runoff of cultivated land in 2012. Twenty-five runoff and soil loss events occurred during the entire study period (2010–2013), and the high proportion of soil loss was produced by the extreme events. This phenomenon is illustrated in Figure 4, which shows the percentage of the accumulated soil loss and runoff as a function of the number of events. The four most extreme erosion events were responsible for 89.5%, 81.8% and 61.4% of the total soil losses in the cultivated land, switchgrass land and wild grassland, respectively. The cumulative soil loss curves were different from the cumulative runoff curves. The four most extreme runoff events were responsible for 57.9%, 54.0% and 47.3% of the total runoff in the cultivated land, switchgrass land and wild grassland; the contribution rates of the four most extreme runoff events was lower than those of extreme soil loss events.
Many studies have clearly denoted that large-magnitude, low-frequency events were assumed to be dominant with respect to soil erosion [14,15]. Steegen et al. [36] also found that the occurrence of important events was the major factor explaining the differences in sediment and nutrient export between two catchments. Several researchers discussed the magnitude of the erosion. Wainwright [37] noted that soil loss caused by the extreme rainfall (100 mm/h) reached 34 t/ha. Martínez-Casasnovas et al. [38] measured that a soil loss of 282 t/ha occurred during a storm with a maximum intensity of 187 mm/h.
Table 1. Runoff depth and soil losses in rainfall events from 2010 to 2013.
DateRainfall (mm)API a (mm)EI30 bWSC
Runoff Depth (mm)Soil Loss (t/ha)Runoff Depth (mm)Soil Loss (t/ha)Runoff Depth (mm)Soil Loss (t/ha)
11 August 201050.015.3273.11.30.0082.30.0305.42.001
20 August 201033.011.438.10.00.0000.20.0000.40.033
21 August 201034.837.855.70.10.0000.30.0001.10.015
Sum117.864.5366.81.40.0082.90.0306.92.049
24 July 201110.44.539.10.10.0000.20.0030.40.028
30 July 201142.813.1133.01.30.0041.60.0074.80.634
14 August 201143.426.8365.01.80.0293.40.0717.13.360
18 August 201168.221.861.30.00.0000.40.0020.60.035
23 August 201122.629.528.70.00.0250.00.0000.50.056
Sum187.495.6627.23.10.0585.60.08213.34.112
24 June 201232.10.067.20.10.0000.10.0000.50.019
15 July 201214.47.475.60.30.0040.20.0070.70.292
21 July 201254.48.3149.20.40.0010.70.0053.00.057
13 August 201212.46.56.70.00.0000.00.0000.20.004
18 August 201255.09.681.30.30.0000.20.0051.00.006
20 August 20127.040.118.40.10.0000.20.0050.50.049
6 September 201228.417.7177.81.70.0152.20.0274.80.595
Sum203.789.5576.32.92.03.60.04810.81.022
20 June 201340.42.771.20.30.0000.40.0000.60.005
4 July 201354.429.2235.74.10.1694.50.1048.45.169
9 July 201396.660.1466.05.00.7429.10.70915.510.741
13 July 201396.671.0205.83.30.0675.00.3156.75.302
27 July 201367.648.0156.92.80.0204.00.17910.44.612
7 August 201313.415.15.70.00.0000.00.0000.20.059
11 August 201314.615.574.81.30.0553.00.0373.34.027
24 August 201357.016.3305.91.60.0153.00.1777.24.470
25 August 20138.442.67.40.10.0000.50.0062.90.493
23 September 201334.416.919.90.30.0000.40.0001.50.014
Sum483.4317.41549.418.81.06929.91.52856.634.892
Notes: a API represent the antecedent precipitation index; b The unit is MJ·mm·ha−1·h−1.
Soil-loss tolerance denotes the maximum rate of soil erosion that can occur and still permit crop productivity to be sustained. The term considers the loss of productivity due to erosion but also considers the rate of soil formation from parent material, the role of topsoil formation, the loss of nutrients and the costs to replace them. Chen et al. [39] considered that the soil-loss tolerance was 2 t/ha/a for the agricultural soils in the Loess Plateau of China. In each year except 2012, the annual soil losses of the cultivated land exceeded the soil-loss tolerance. In the “extreme year”, the soil losses were 17.5 times the soil-loss tolerance. Consequently, soil losses will result in soil quality degradation if no soil conservation actions are carried out in the sloping cropland, which implies a risk to the sustainability of the agricultural system.
In the “extreme year”, the number of soil loss events, annual runoff and soil losses were higher than the corresponding values in any one year from 2010 to 2012. The extreme rainfall events in 2010–2012 were also not comparable with those in the “extreme year”. For example, the highest soil loss of rainfall event was 10.74 t/ha in cultivated land (9 July 2013), which was much higher than those recorded for extreme rainfall events during 2010–2012 and even higher than the total soil losses for the three-year period. Therefore, it is necessary to compare the soil erosion characteristics in the “extreme year” with those in the “normal year”.
Figure 4. The percentage of accumulative soil loss (a) and runoff (b) in relation to the number of events from 2010 to 2013 (the events were independently ranked from largest to smallest for soil loss and runoff).
Water 07 03343 g004

3.3. Comparing the Monthly Rainfall Characteristics in the “Extreme Year” with Those in the “Normal Year”

The monthly rainfall parameters were calculated from the automated rain gauge data. As illustrated in Table 2, nearly all rainfall parameters in June, July and August of 2013 (“extreme year”), except for the rainfall duration in August, were all higher than those of the “normal year” (the average monthly values of 2010–2012). Compared to the “normal year”, the increment percentage rates of the rainfall parameters in the “extreme year” were the highest in July, while they were lower in June and the lowest in August. The monthly rainfall in July 2013 was 515.4 mm and therefore 424.5% higher than that in the “normal year”, whereas the increment rate (595.7%) of EI30 was the highest one. Although the rainfall amount and rainfall duration in September of 2013 were also higher than that in the “normal year”, the composite indices in 2013, including the kinetic energy of the rainfall and rainfall intensity, were lower than in the “normal year”.
Table 2. Comparing the monthly rainfall parameters in the “extreme year” (2013) with those in the “normal year” (2010–2012).
MonthYearRainfall (mm)Rainfall Duration (h)E aEI5 bEI10 bEI20 bEI30 bEI60 b
June2010–201249.142.94.161.155.646.441.033.9
201379.848.64.9118.789.083.171.254.4
Change rate (%)62.413.419.594.260.278.973.860.7
July2010–201298.345.79.4373.9247.7193.1153.0114.0
2013515.4169.547.91850.11533.61285.41064.5754.0
Change rate (%)424.5270.9407.2394.8519.2565.8595.7561.5
August2010–2012117.351.616.2648.5503.1411.6314.4242.0
2013154.438.516.6721.6583.2452.8393.8331.1
Change rate (%)31.7−25.43.111.315.910.025.236.8
September2010–201291.442.85.1156.5127.6102.182.159.4
201392.458.94.748.345.336.531.823.0
Change rate (%)1.137.6−8.4−69.1−64.5−64.3−61.3−61.3
Notes: a The unit is MJ·ha−1; b The unit is MJ·mm·ha−1·h−1.

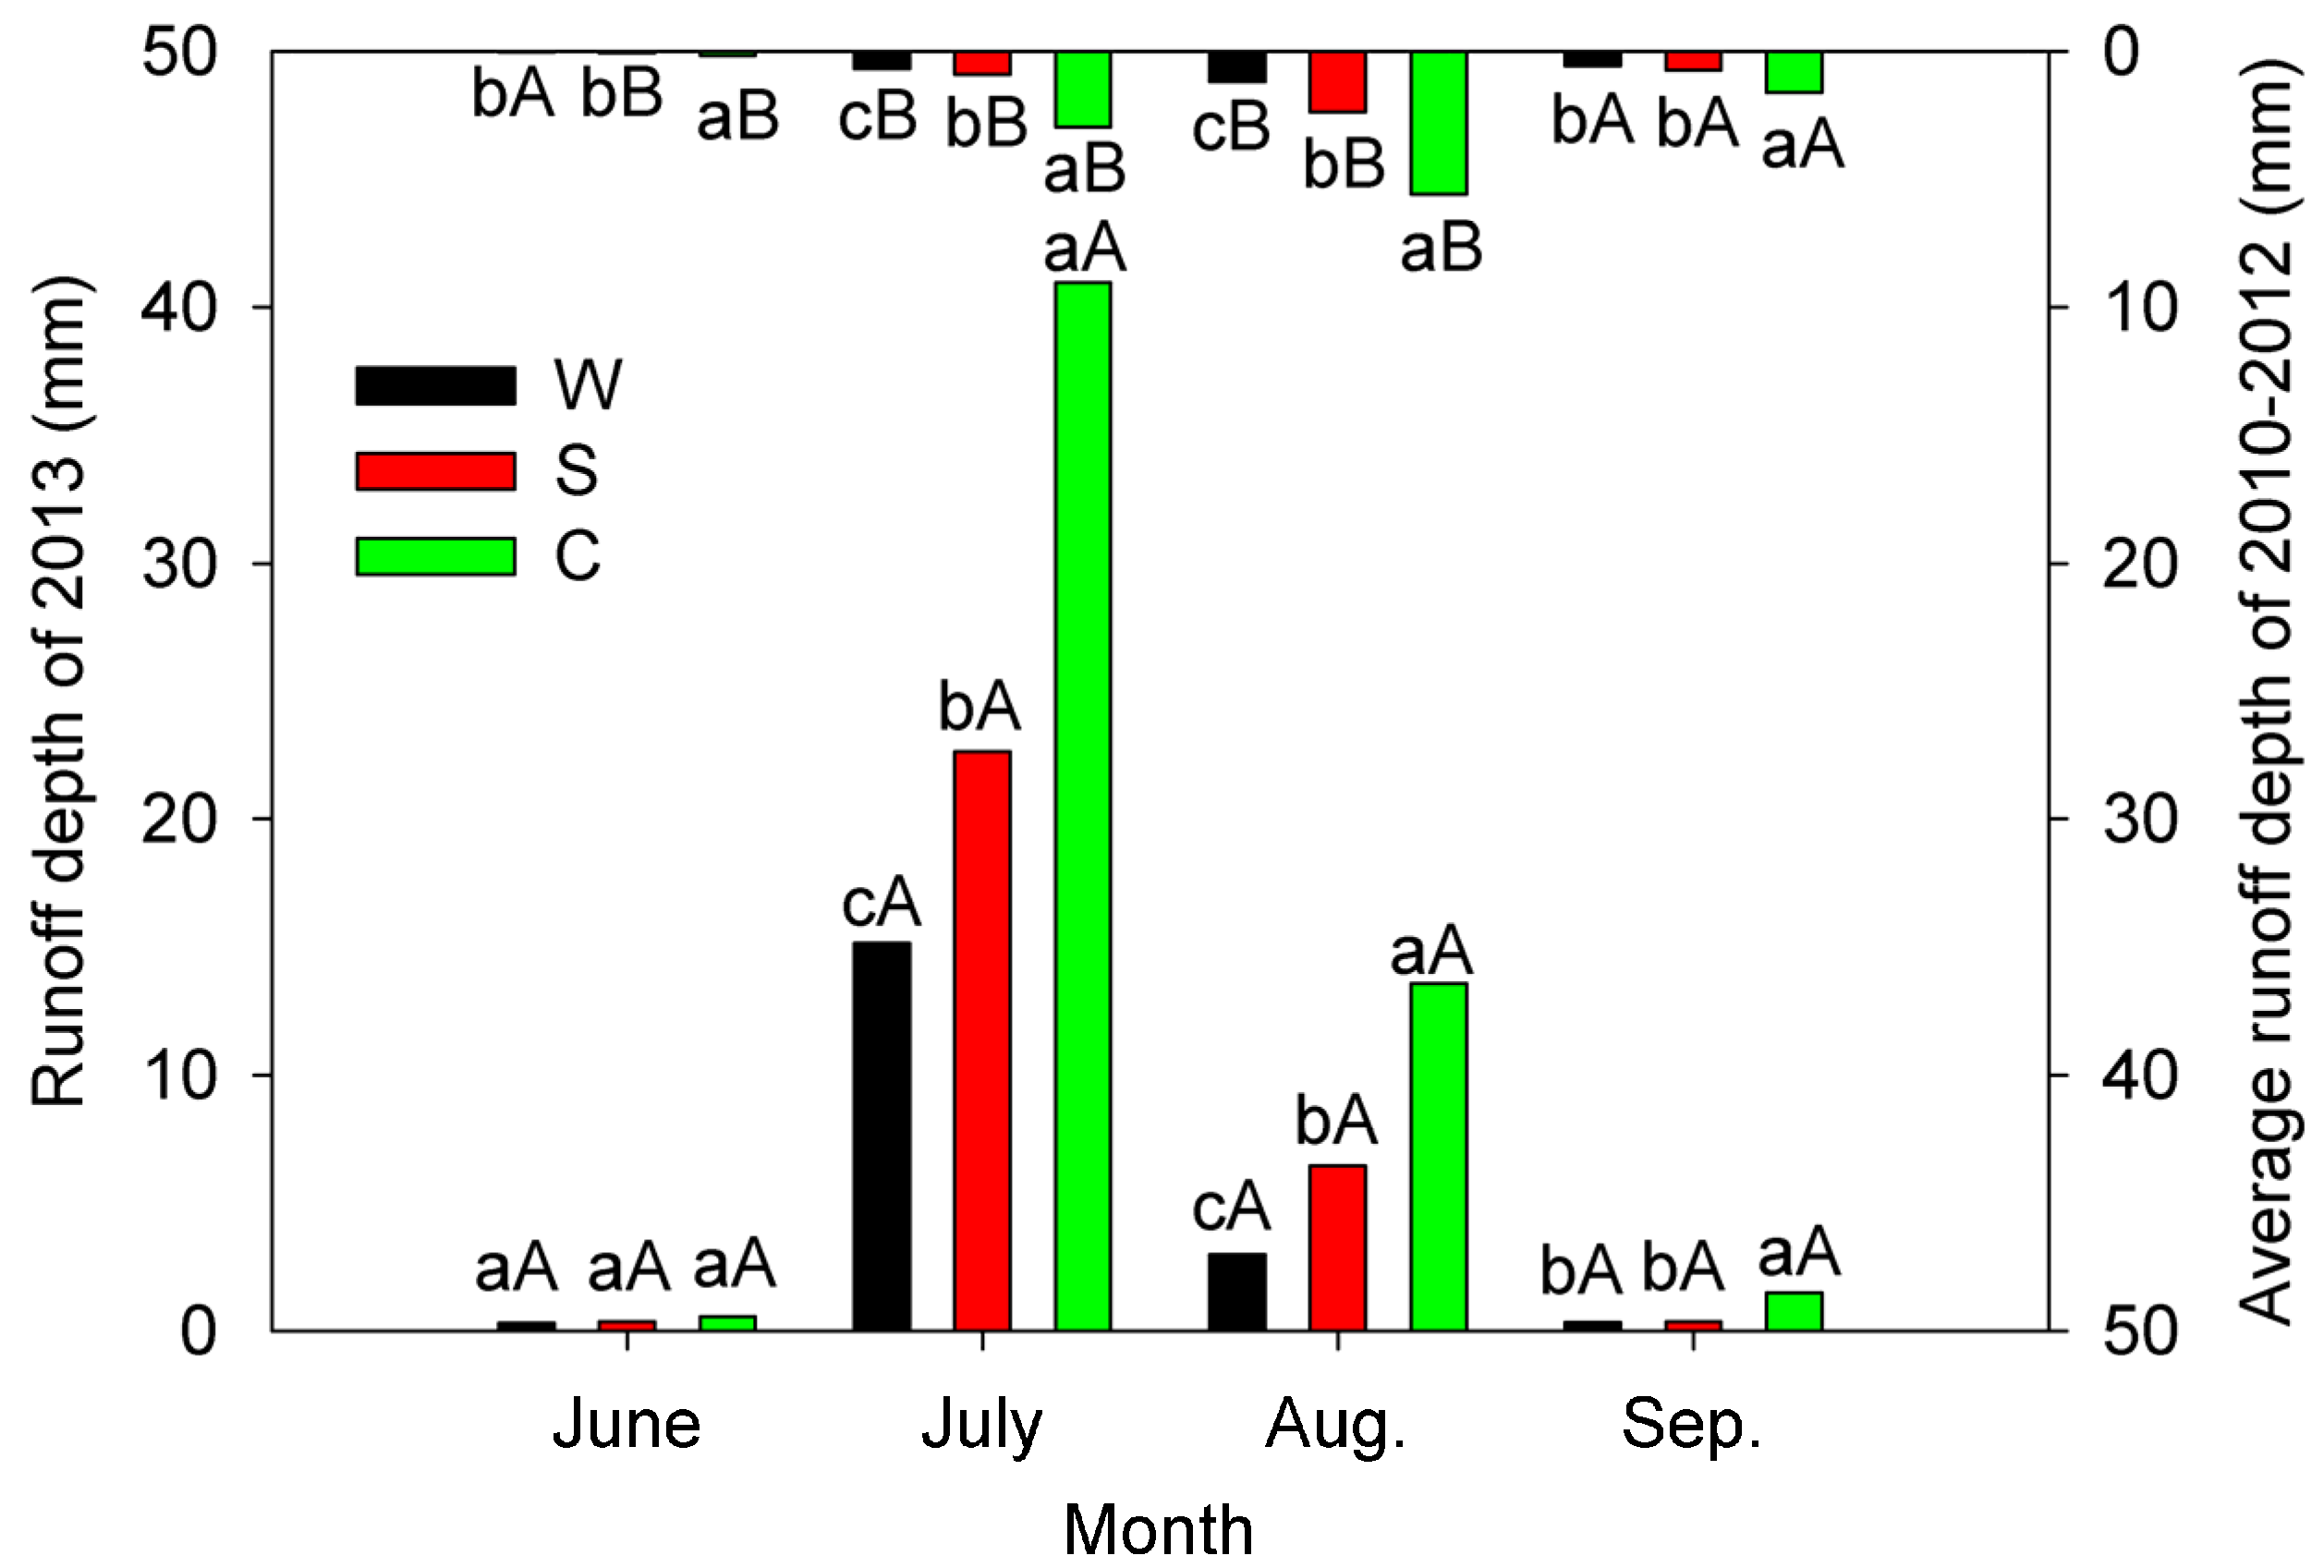
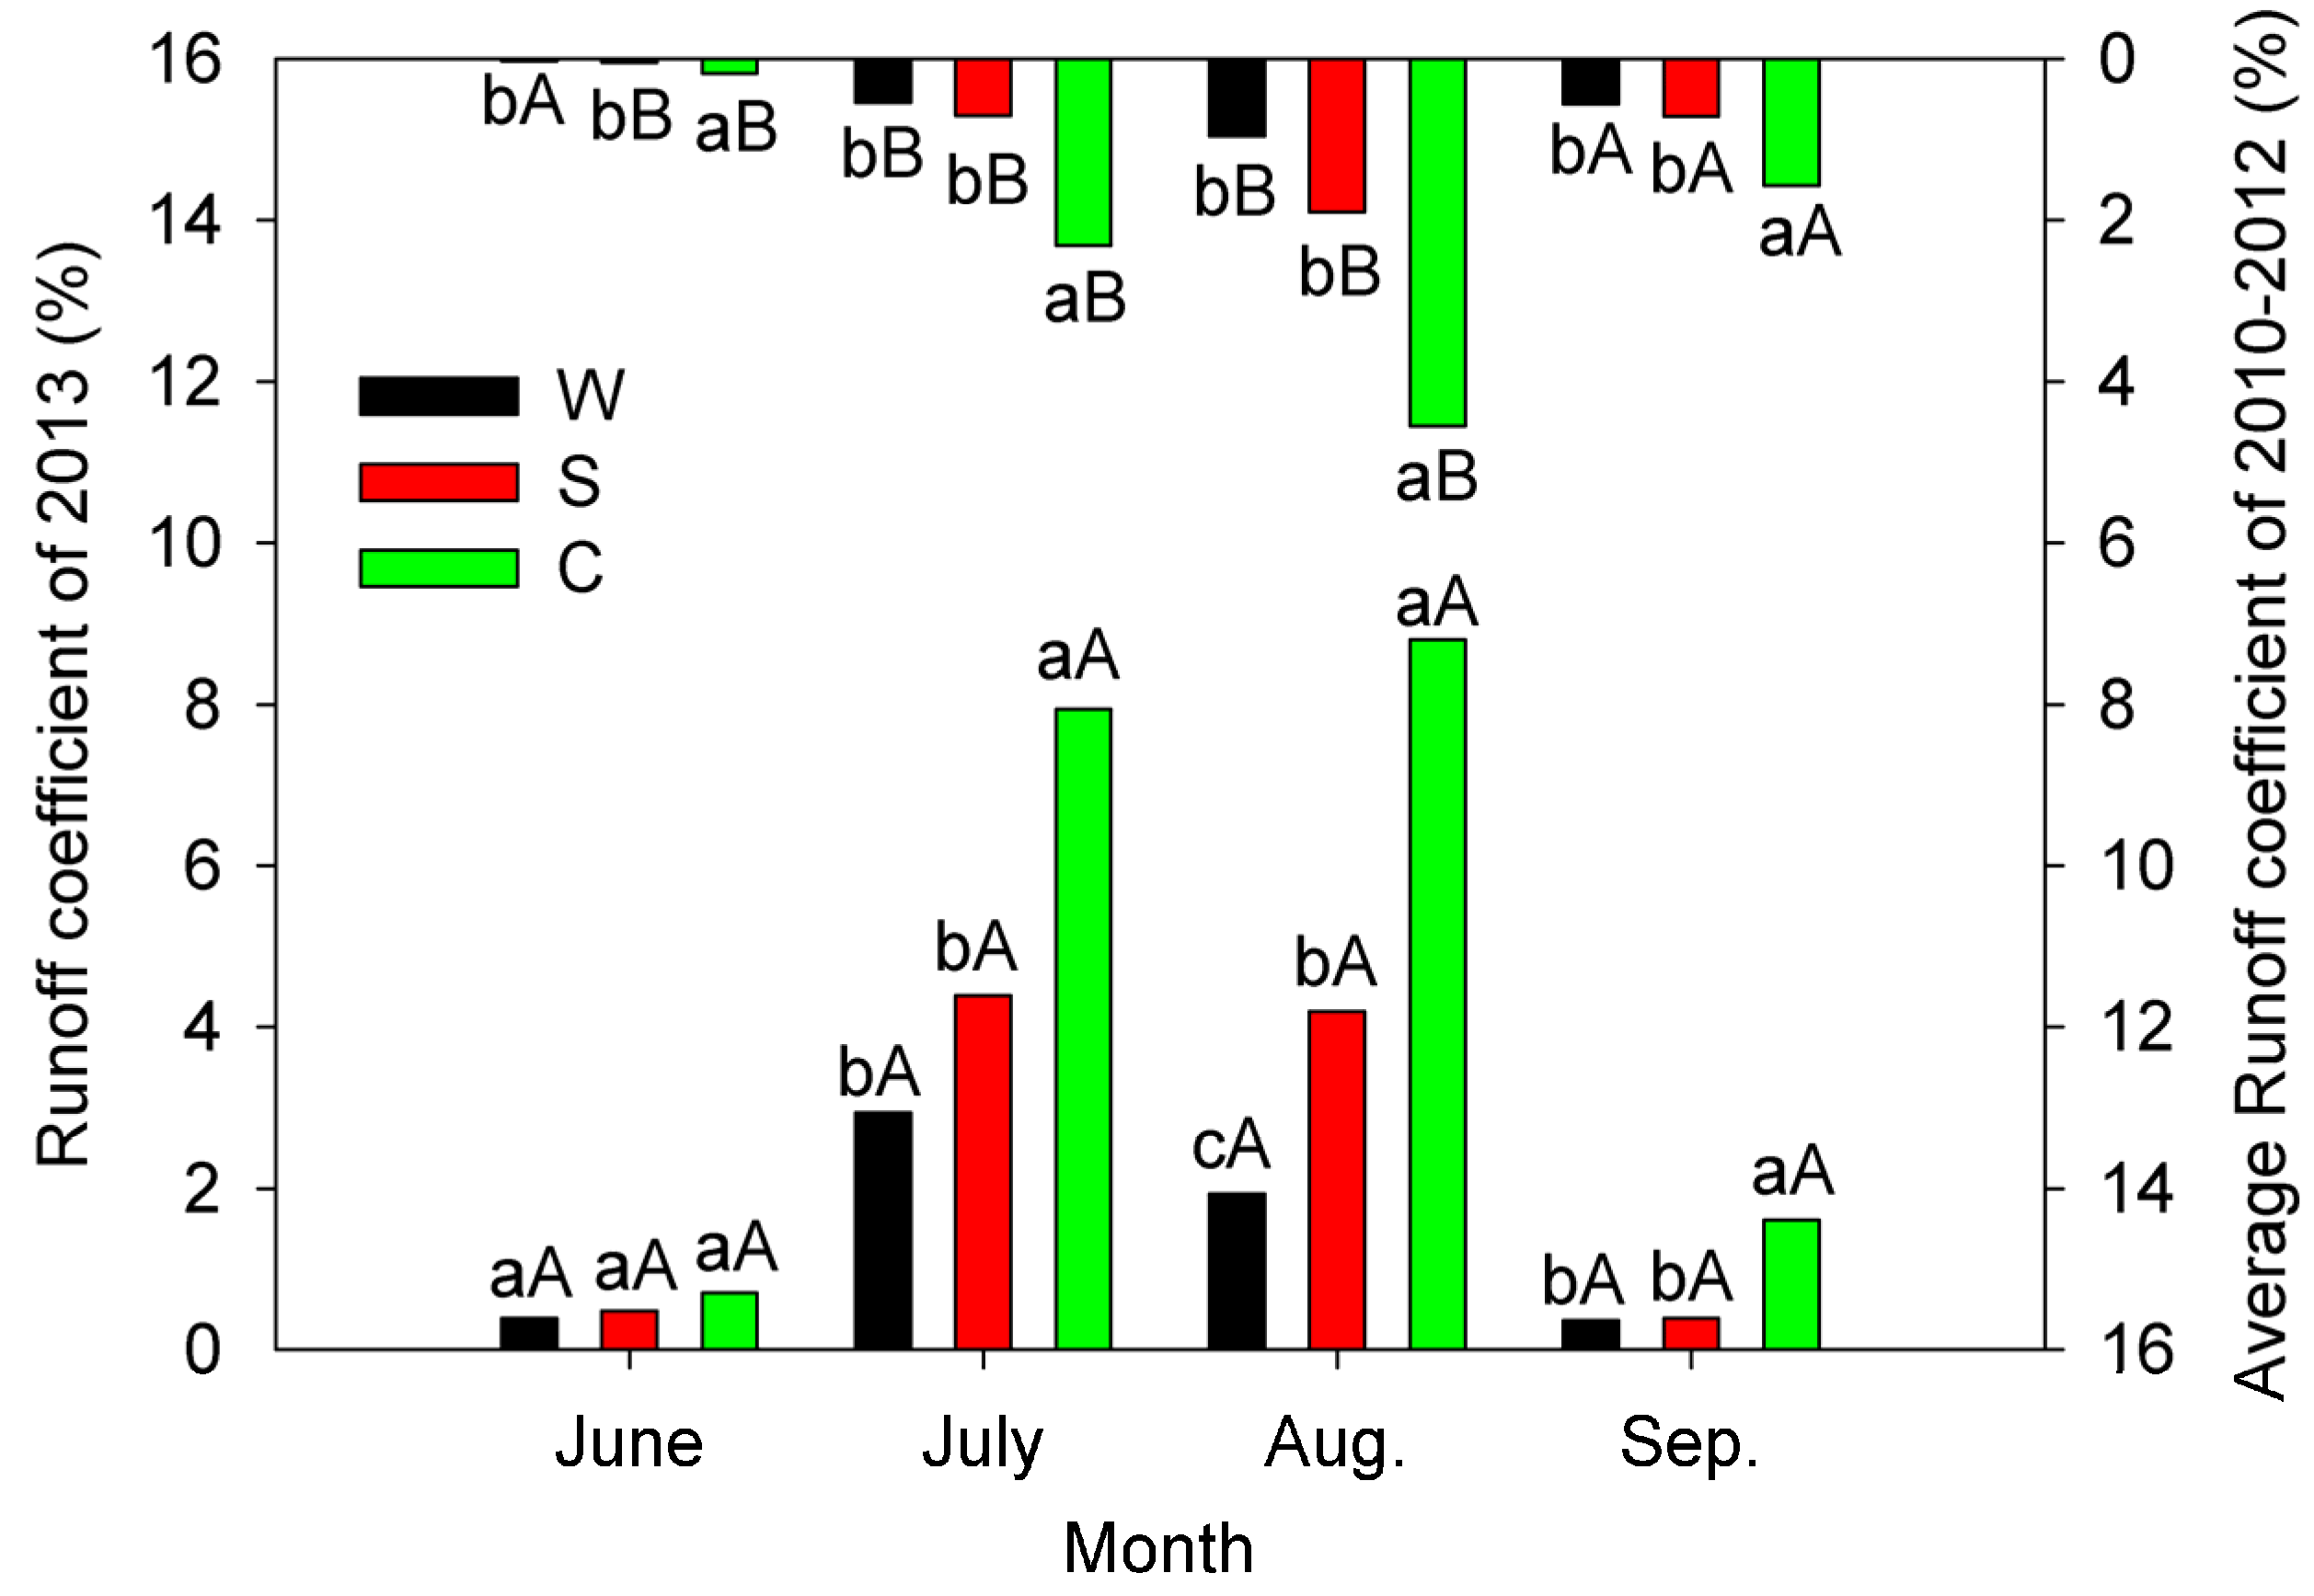
3.4. Comparing the Monthly Runoff Depth and Runoff Coefficients in the “Extreme Year” with Those in the “Normal Year” for Three Land Use Types

The runoff occurred mainly in July and August and varied greatly between the “extreme year” and “normal year” (Figure 5). The runoff depth in July 2013 for W, S and C increased significantly (p < 0.05) by 2093.6%, 2438.9% and 1287.2%, respectively, as compared with that in the “normal year”. The runoff depth in August 2013 for W, S and C increased also significantly (p < 0.05) by 153.5%, 173.7%, and 142.9%, respectively, as compared with that of the “normal year”. Thus, the increasing rate of the runoff depth was the highest in July. The runoff depth in C during July and August was significantly (p < 0.05) higher than that in W and S (the runoff depth of C was 170.4%–376.0% higher than that of W and 80.9%–231.0% higher than that of S), the runoff depth in S was significantly (p < 0.05) higher than that in W, or the difference between S and W was not significant.
The runoff coefficient is the ratio of runoff vs. rainfall amount, reflecting how much rainfall was lost as runoff. Figure 6 shows that the runoff coefficients in June, July and August of the “extreme year” were higher than those of the “normal year”, indicating that more rainfall was lost as runoff in the “extreme year” than that in the “normal year”, possibly because of the high antecedent precipitation before runoff events in the “extreme year”. The antecedent precipitation index (API) reflects the fluctuating infiltration capacity of the soil associated with the frequency and depth of previous rainfall events. Soil moisture data are significantly correlated with subsequent precipitation, and API has been used as a reasonable way to estimate the soil moisture status [28,29,31,40]. In the “extreme year”, the high API (Table 1) indicates high antecedent soil moisture. The antecedent soil moisture affected the partitioning of rainfall into infiltration and runoff [2,41,42]. Wet soil doubles the runoff coefficient and shortens the time to runoff, compared with the same soils when dry [43]. Zehe et al. [44] also found a very strong positive correlation between the antecedent soil moisture at the forested site and the runoff coefficients of rainfall-runoff events; the antecedent soil moisture at the forest site explains 92% of the variability in the runoff coefficients.
Figure 5. Monthly runoff depth in the “extreme year” and “normal year”. The capital letters represent the significance of the difference (p < 0.05) between the “extreme year” and “normal year” for one land use type in one month, whereas the lower-case letters in the figure represent the significance of the difference (p < 0.05) among different land-use types for one month in the same year. If one common letter is displayed, the difference is not significant; if different letters are displayed, the difference is significant. For example, the green bar was marked with “A” in August 2013, and that of 2010–2012 was marked with “B”, so the difference of runoff depths represented by two green bars was significant; green, red and black bar in July 2013 was marked with “a”, “b” and “c”, respectively, which meant that the difference of runoff depths among land-use types was significant. The same is the case for Figure 6, Figure 7, Figure 8 and Figure 9.
Water 07 03343 g005
Figure 6. Monthly runoff coefficients in the “extreme year” and “normal year”. The capital and lower-case letters represent the significance of the difference (p < 0.05) as those in Figure 5.
Water 07 03343 g006

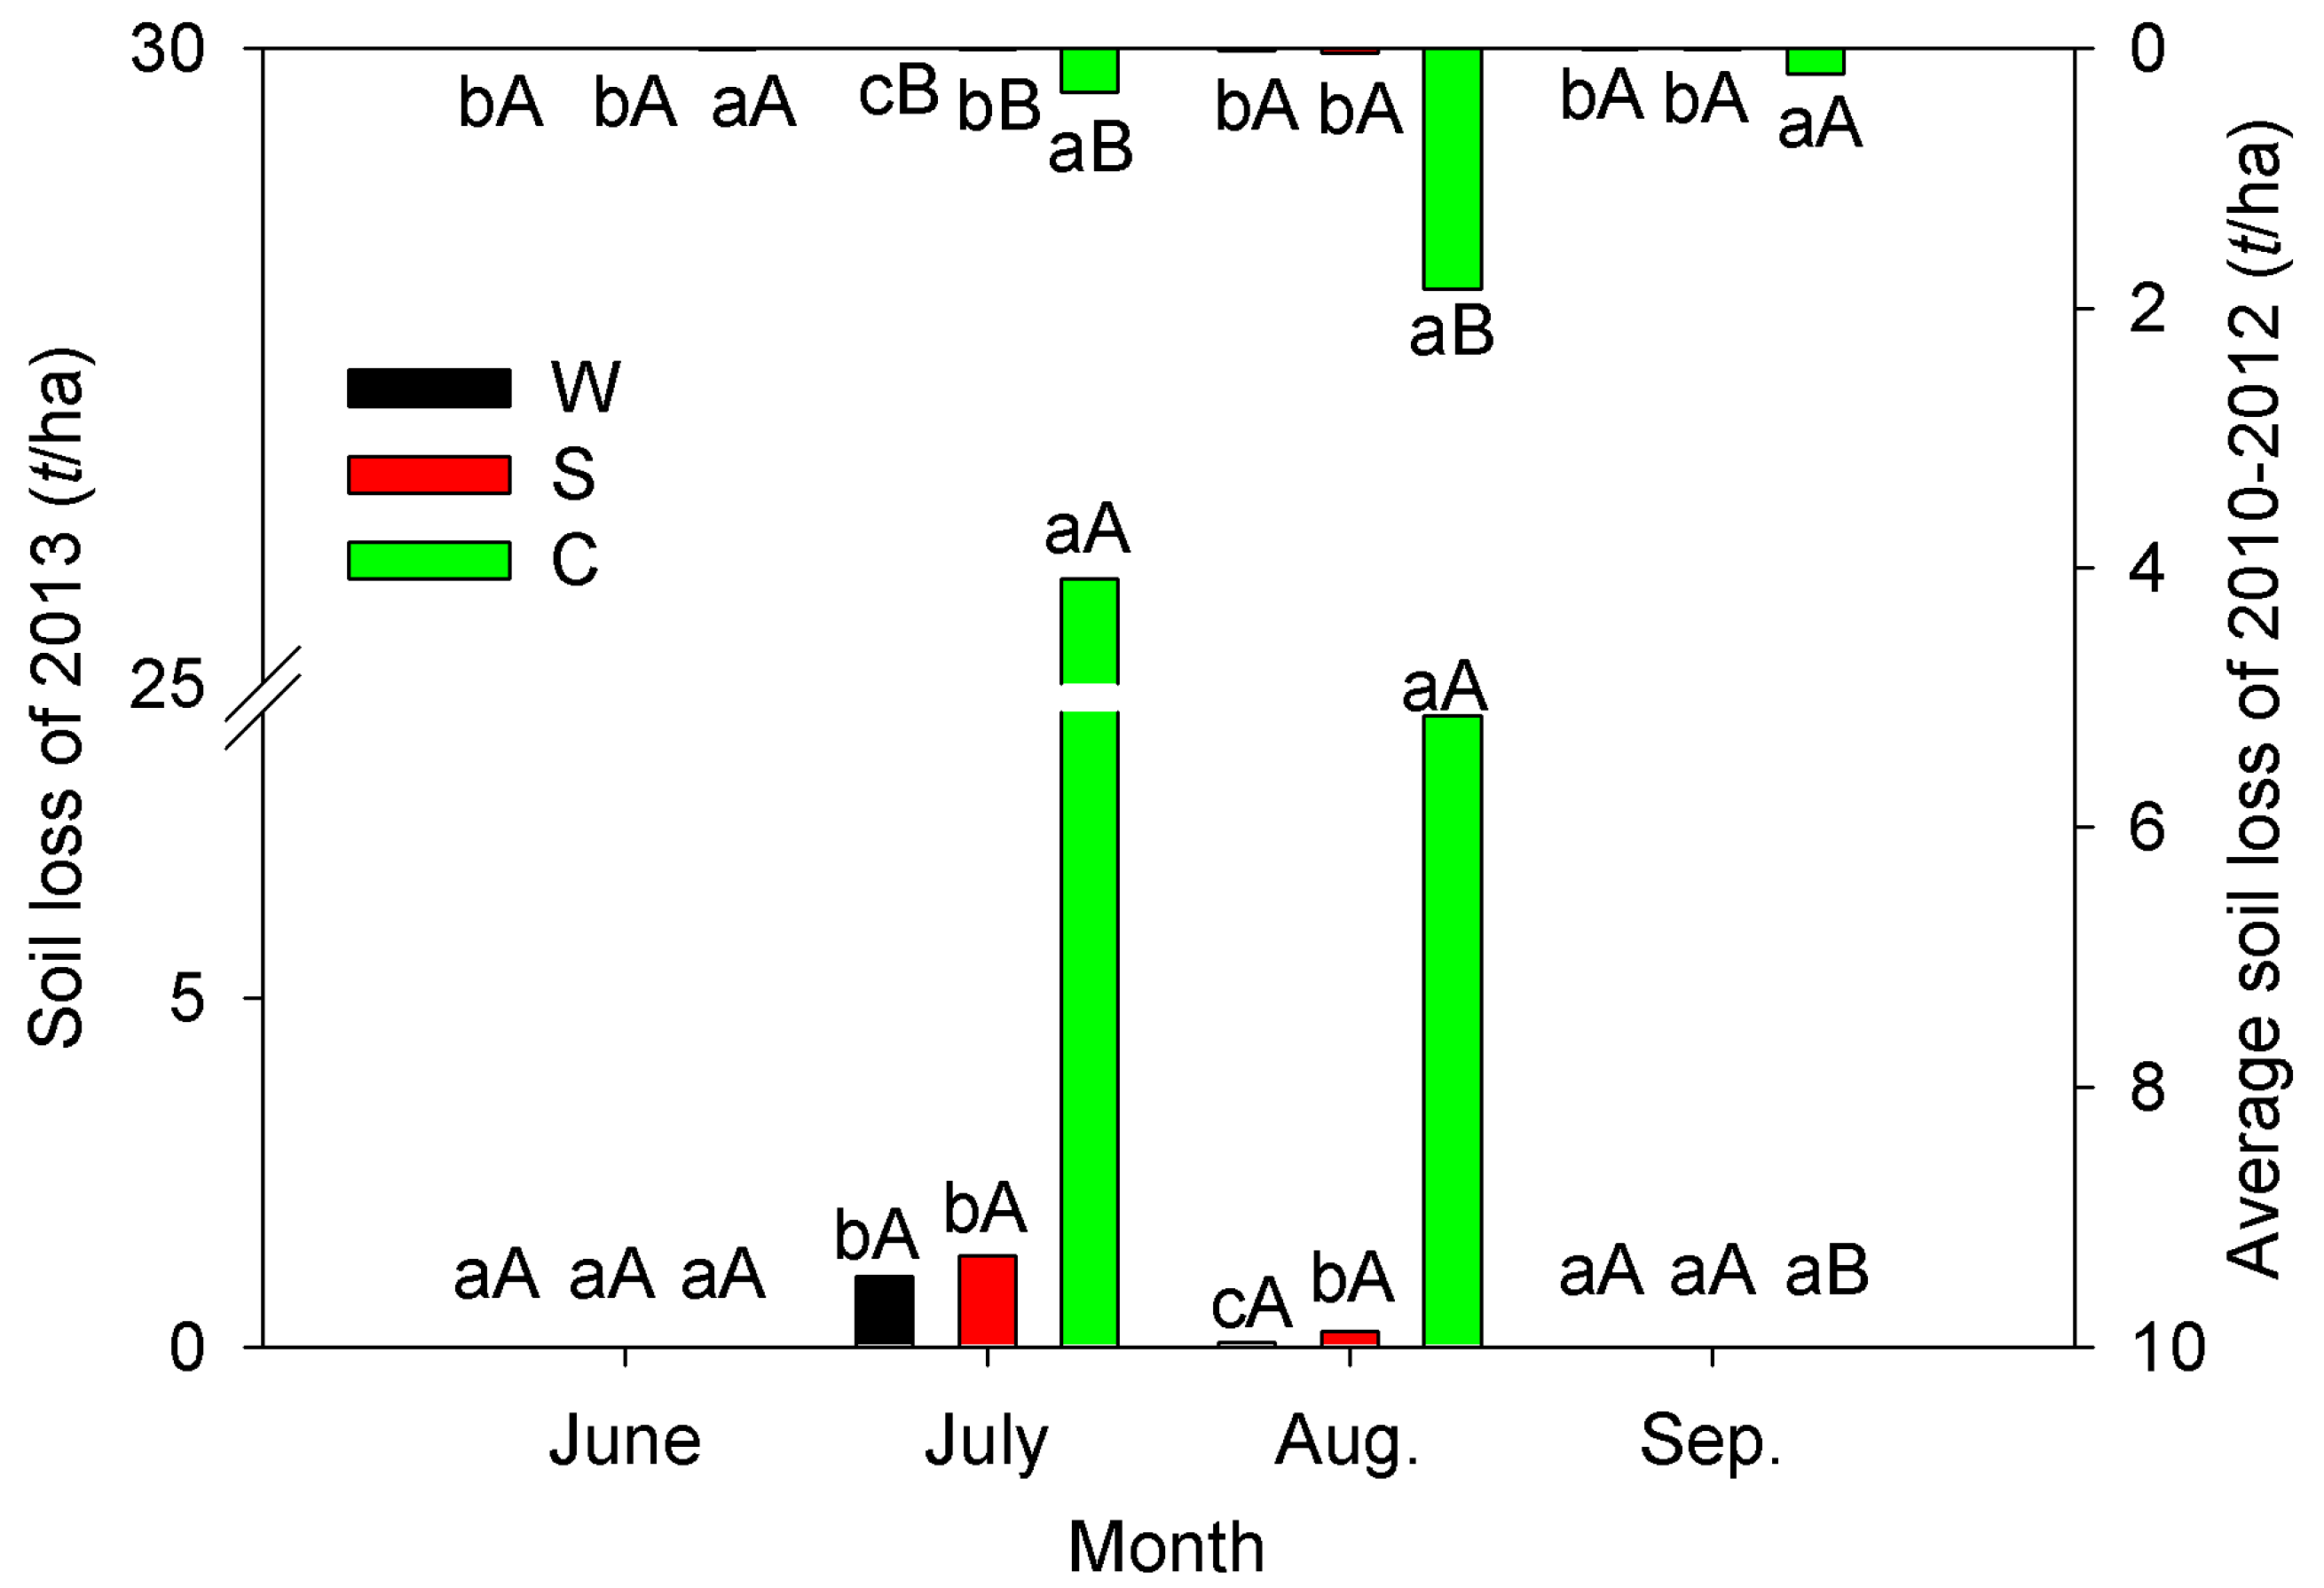
3.5. Comparing the Monthly Soil Losses in the “Extreme Year” with Those in the “Normal Year” for Three Land Use Types

Figure 7 shows that the variations in the monthly soil losses were similar to those in the runoff, with the soil losses concentrated in July and August. The “extreme year” soil losses in July for W, S and C increased significantly (p < 0.05) by 37,344.7%, 18,034.0%, 7566.3%, respectively, as compared with those of the “normal year”. The “extreme year” soil losses in August for W, S and C increased by 229.1%, 491.2%, 388.4%, respectively, as compared with those of the “normal year”, but only the difference for C was significant (p < 0.05), which suggests that W and S still had corresponding soil conservation ability to the rainfall level in this month. For the “extreme year” compared with “normal year”, the soil loss increasing rates for July during the “extreme year” were much higher than those for August. Therefore, July was an important month for soil loss in the “extreme year”, accounting for 72.4% of the total annual soil loss in cultivated land. The soil losses in C were significantly (p < 0.05) higher than those in W and S in July and August (2485.6%–12,873.2% higher than those in W and 1875.0%–4866.3% higher than those in S). Obviously, the increasing rates of soil loss were higher than those of the runoff (Figure 4). In July and August, the soil losses in S were significantly (p < 0.05) higher than those in W, or the difference between S and W was not significant. The differences in the soil losses among the land use types were not significant in June and September of 2013, the possible reasons for which are explained below. Although the rainfall amount in June of 2013 was higher than that during the “normal year”, a drought occurred in the spring of 2013; the total rainfall amount in May was only 24.4 mm, which was less than half of that in the “normal year” (56.4 mm). Therefore, water infiltration was the dominant process in dry soil, while water erosion was slightly present. Moreover, though the rainfall amount and rainfall duration in September of 2013 were higher than those in the previous three years, the composite indices that incorporate the kinetic energy of the rainfall and rainfall intensity (rainfall erosivity) were lower than those during the “normal year”; thus, the soil losses were small and the differences were not significant among the land use types.
Figure 7. Monthly soil losses in the “extreme year” and “normal year”. The capital and lower-case letters represent the significance of the difference (p < 0.05) as those in Figure 5.
Water 07 03343 g007

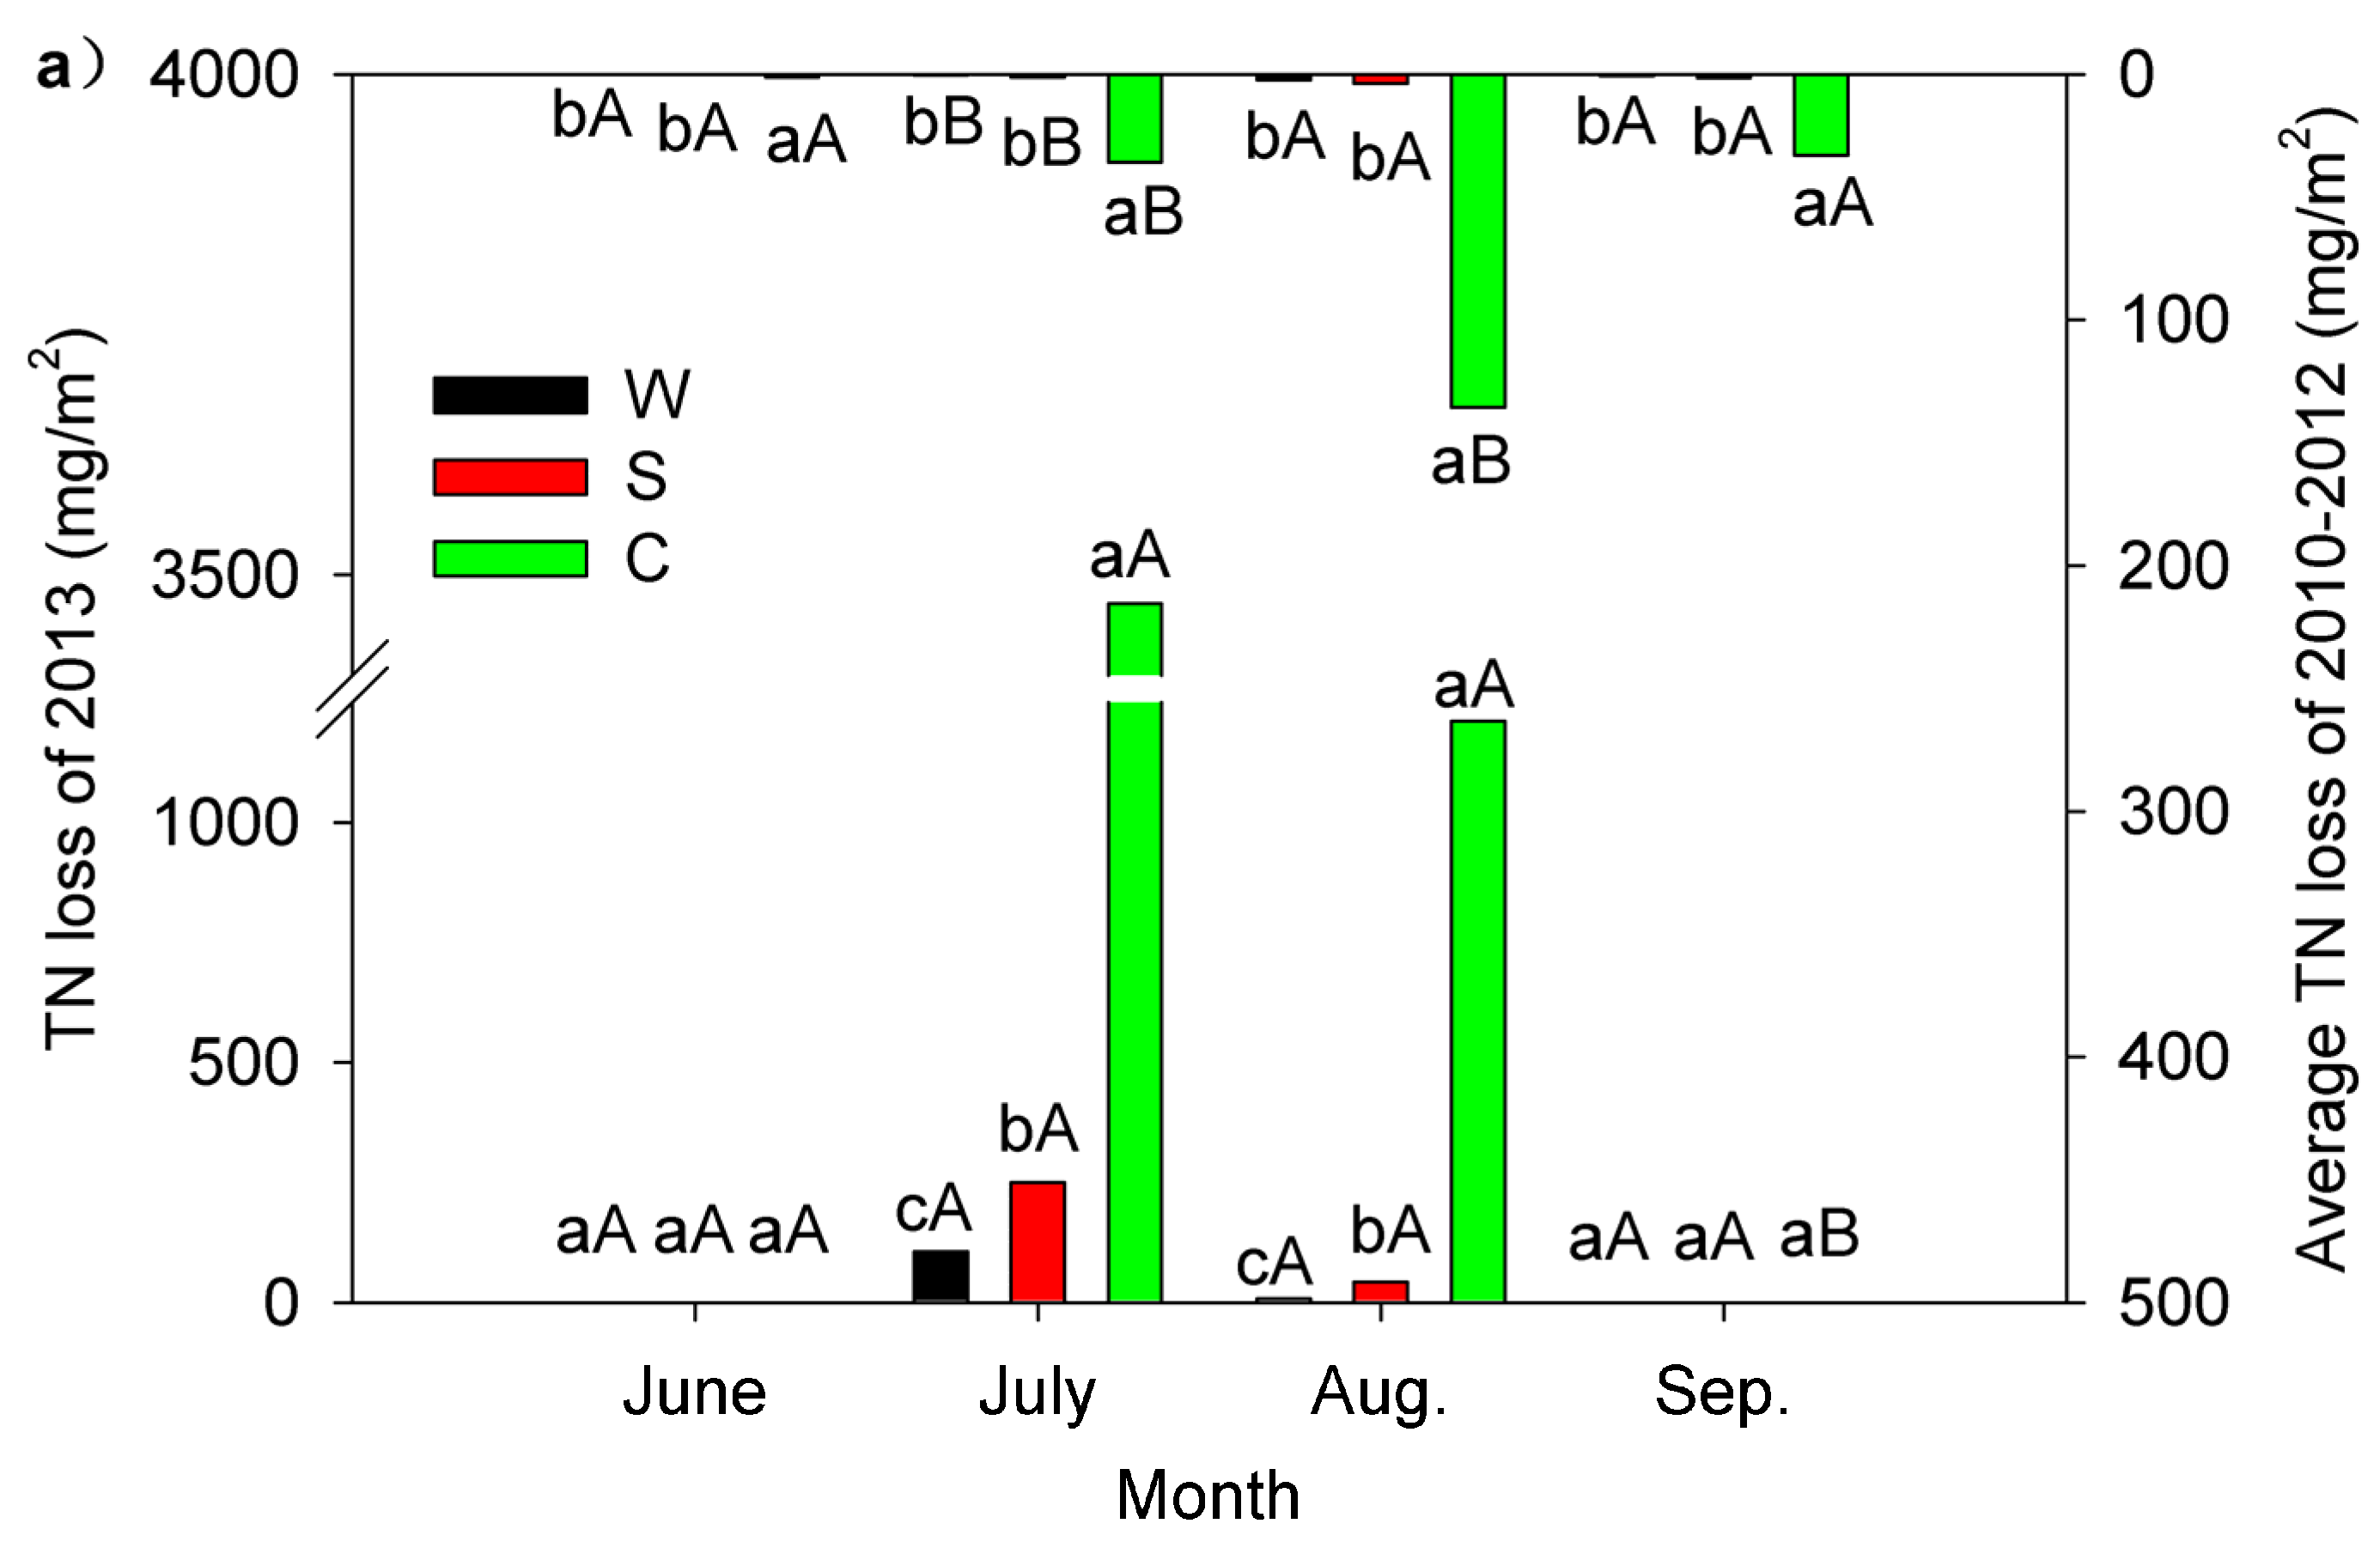
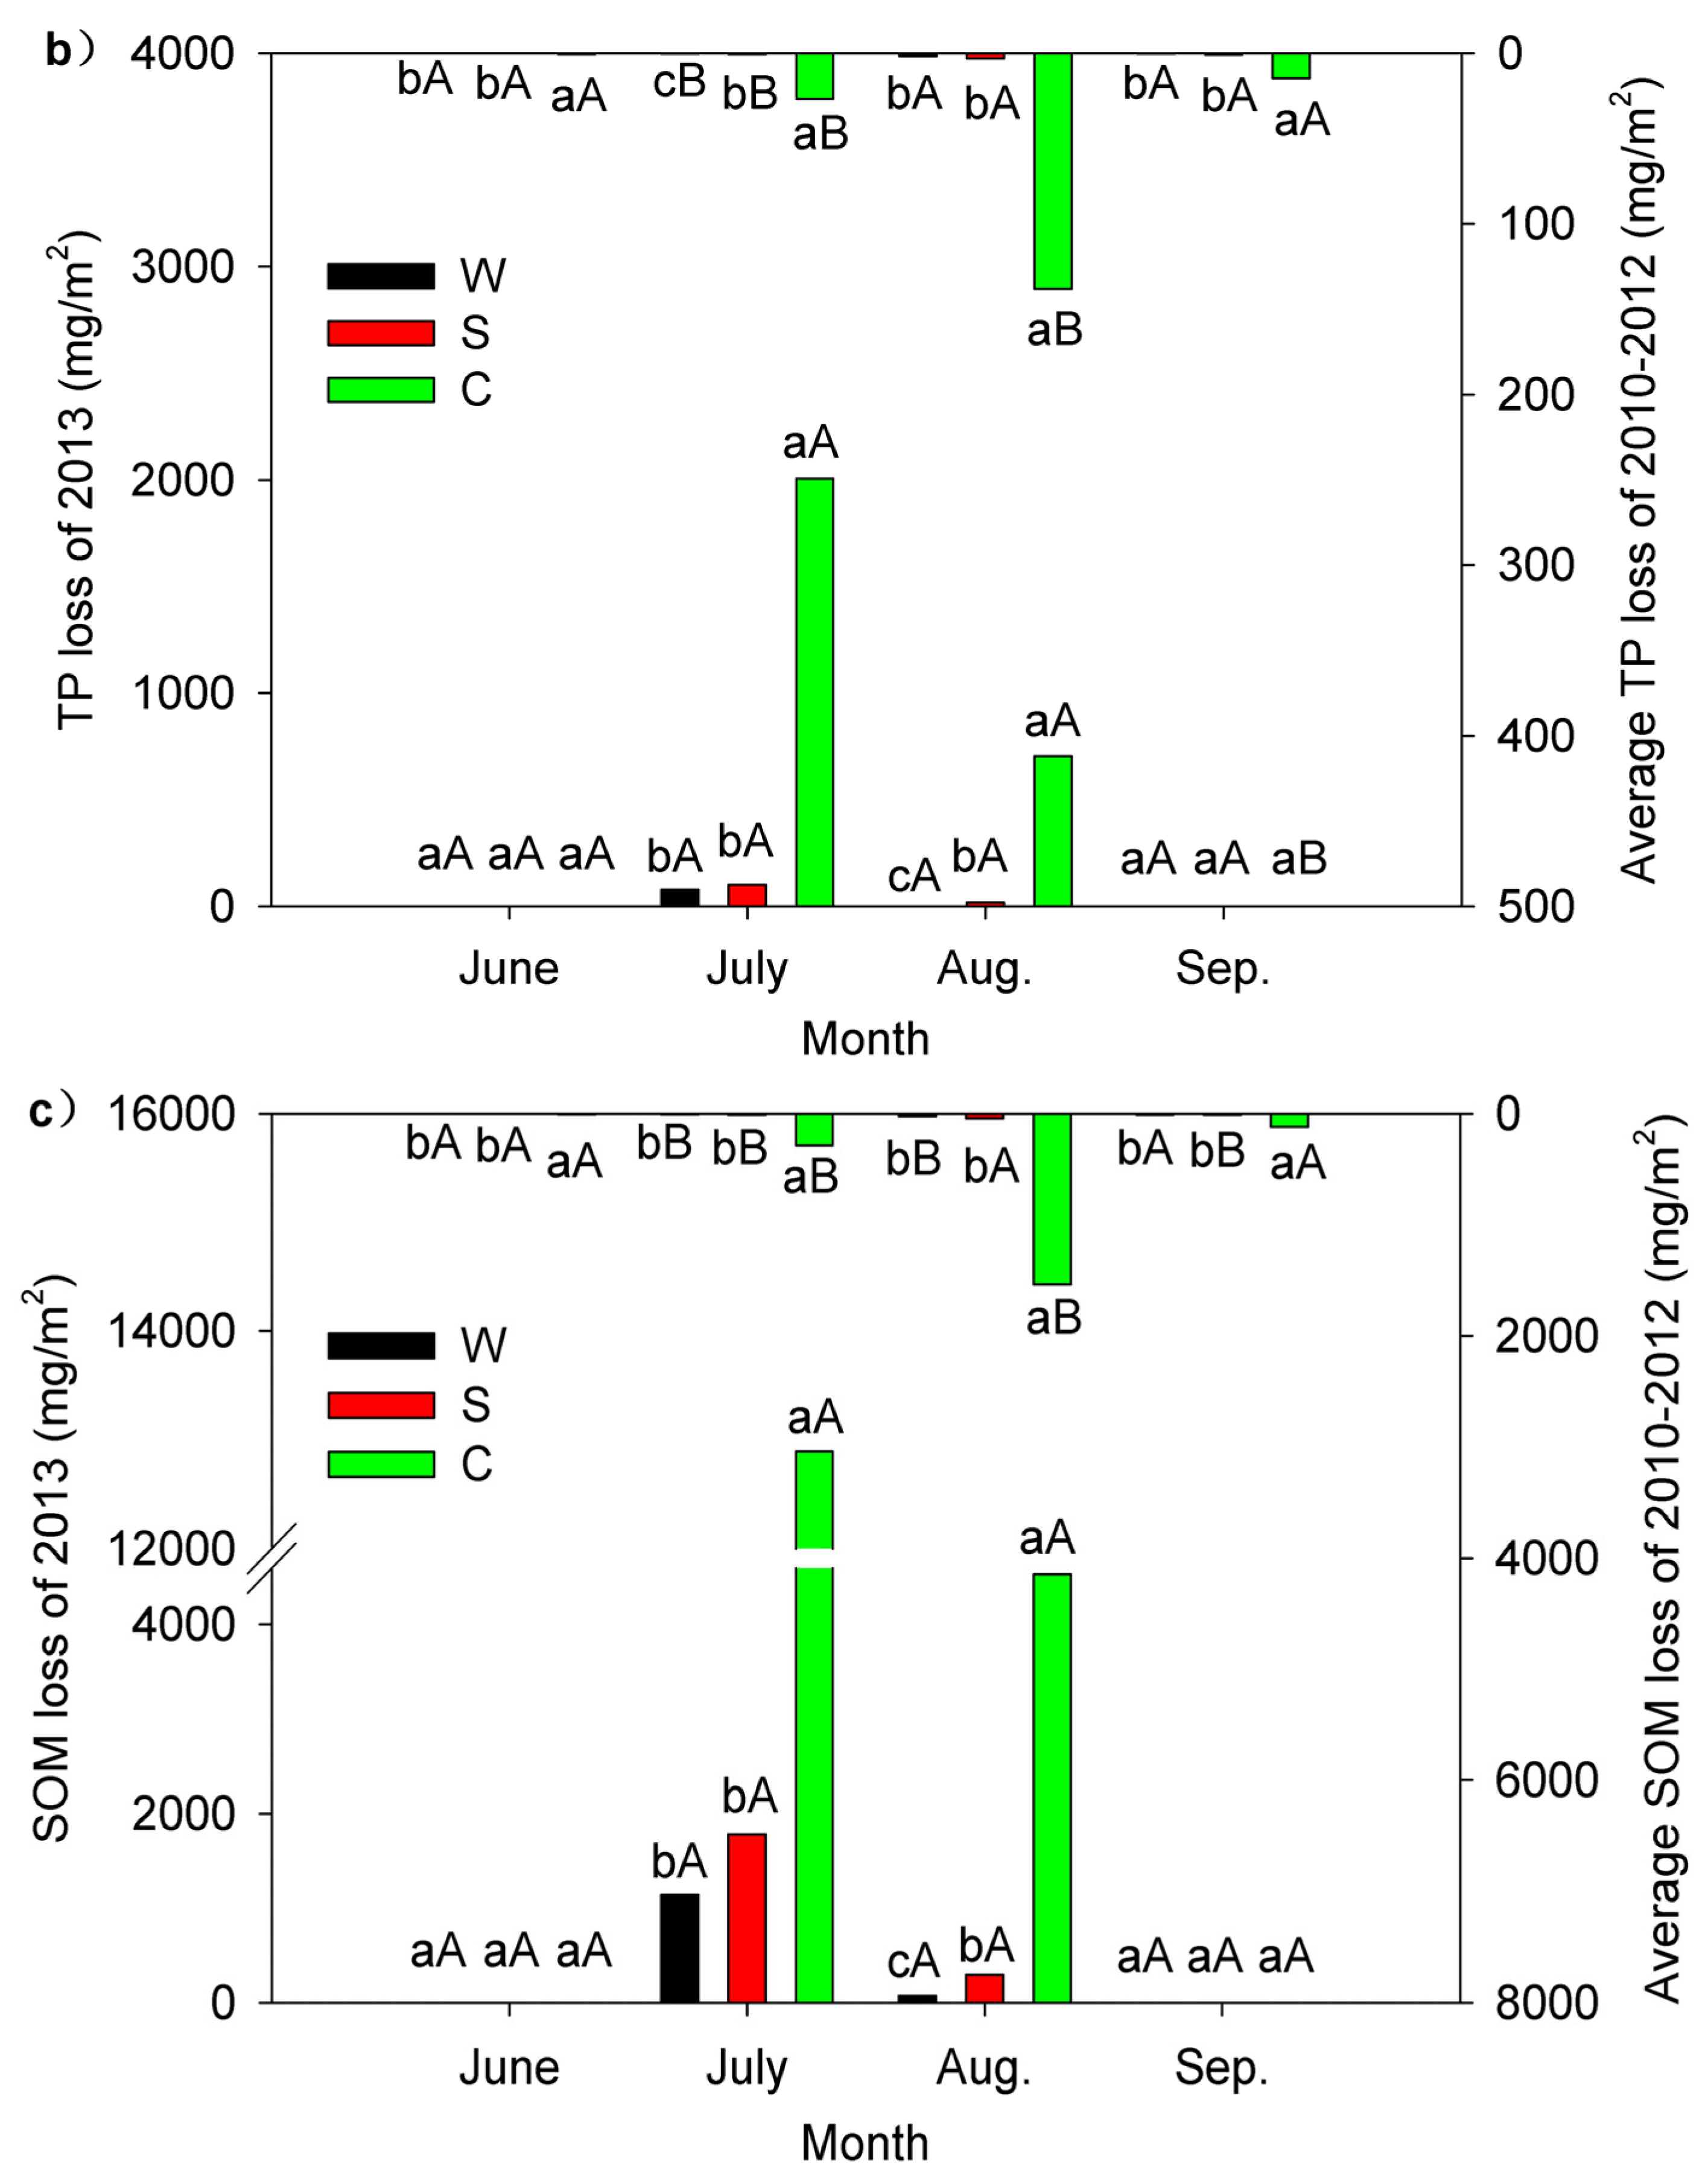
3.6. Comparing the Soil Nutrient Losses Characteristics in the “Extreme Year” with Those in the “Normal Year”

Figure 8 reveals that nutrient loss associated with soil loss mainly occurred in July and August. In July and August of 2013, the soil nutrient losses were much higher than those in the “normal year”; the results of the significance test were similar to those for the soil loss. In July of 2013, the TN loss in C was as high as 3471.9 mg/m2, which was 100 times of that in the “normal year”; the TN losses in W and S increased by 9576.2% and 23,434.9%, respectively, as compared with the “normal year”. In August of 2013, the TN losses in W, S and C increased by 226.9%, 1046.6%, and 792.9%, respectively, as compared with the “normal year”. The TN losses in C during July and August were significantly (p < 0.05) higher than in W and S (3165.3%–15,751.3% higher than W and 1290.3%–3549.2% higher than those in S). The TN losses in S were significantly (p < 0.05) higher than those in W, or the difference between S and W was not significant.
The variations in the TP and SOM losses were similar to those for TN, but the SOM losses were much higher than for TN and TP.
The nutrient losses were associated with soil loss; extreme soil loss events necessarily induced extreme nutrient loss, especially in the “extreme year”. Ramos and Martínez-Casasnovas [5] studied nutrient losses from a vineyard soil in Northeastern Spain caused by an extraordinary rainfall event. The nutrient losses amounted to 10,850 mg/m2 of N and 10,860 mg/m2 of P, which were much higher than the annual losses obtained in the same area with a total annual rainfall of 937 mm. In this study, one extreme soil erosion event occurred on 9 July 2013. The TN, TP and SOM losses in the cultivated land were 1378.2 mg/m2, 843.3 mg/m2 and 5464.8 mg/m2, which were also higher than for other extreme soil erosion events. The high antecedent soil moisture caused by antecedent precipitation may be an important factor that affected the nutrient loss. An et al. [45] found that saturation and seepage condition caused greater soil loss and nutrient transport than free drainage condition, which was similar to this study.
Figure 8. Monthly nutrient losses in the “extreme year” and “normal year”. (a) TN loss; (b) TP loss; (c) SOM loss. The capital and lower-case letters represent the significance of the difference (p < 0.05) as those in Figure 5.
Water 07 03343 g008aWater 07 03343 g008b

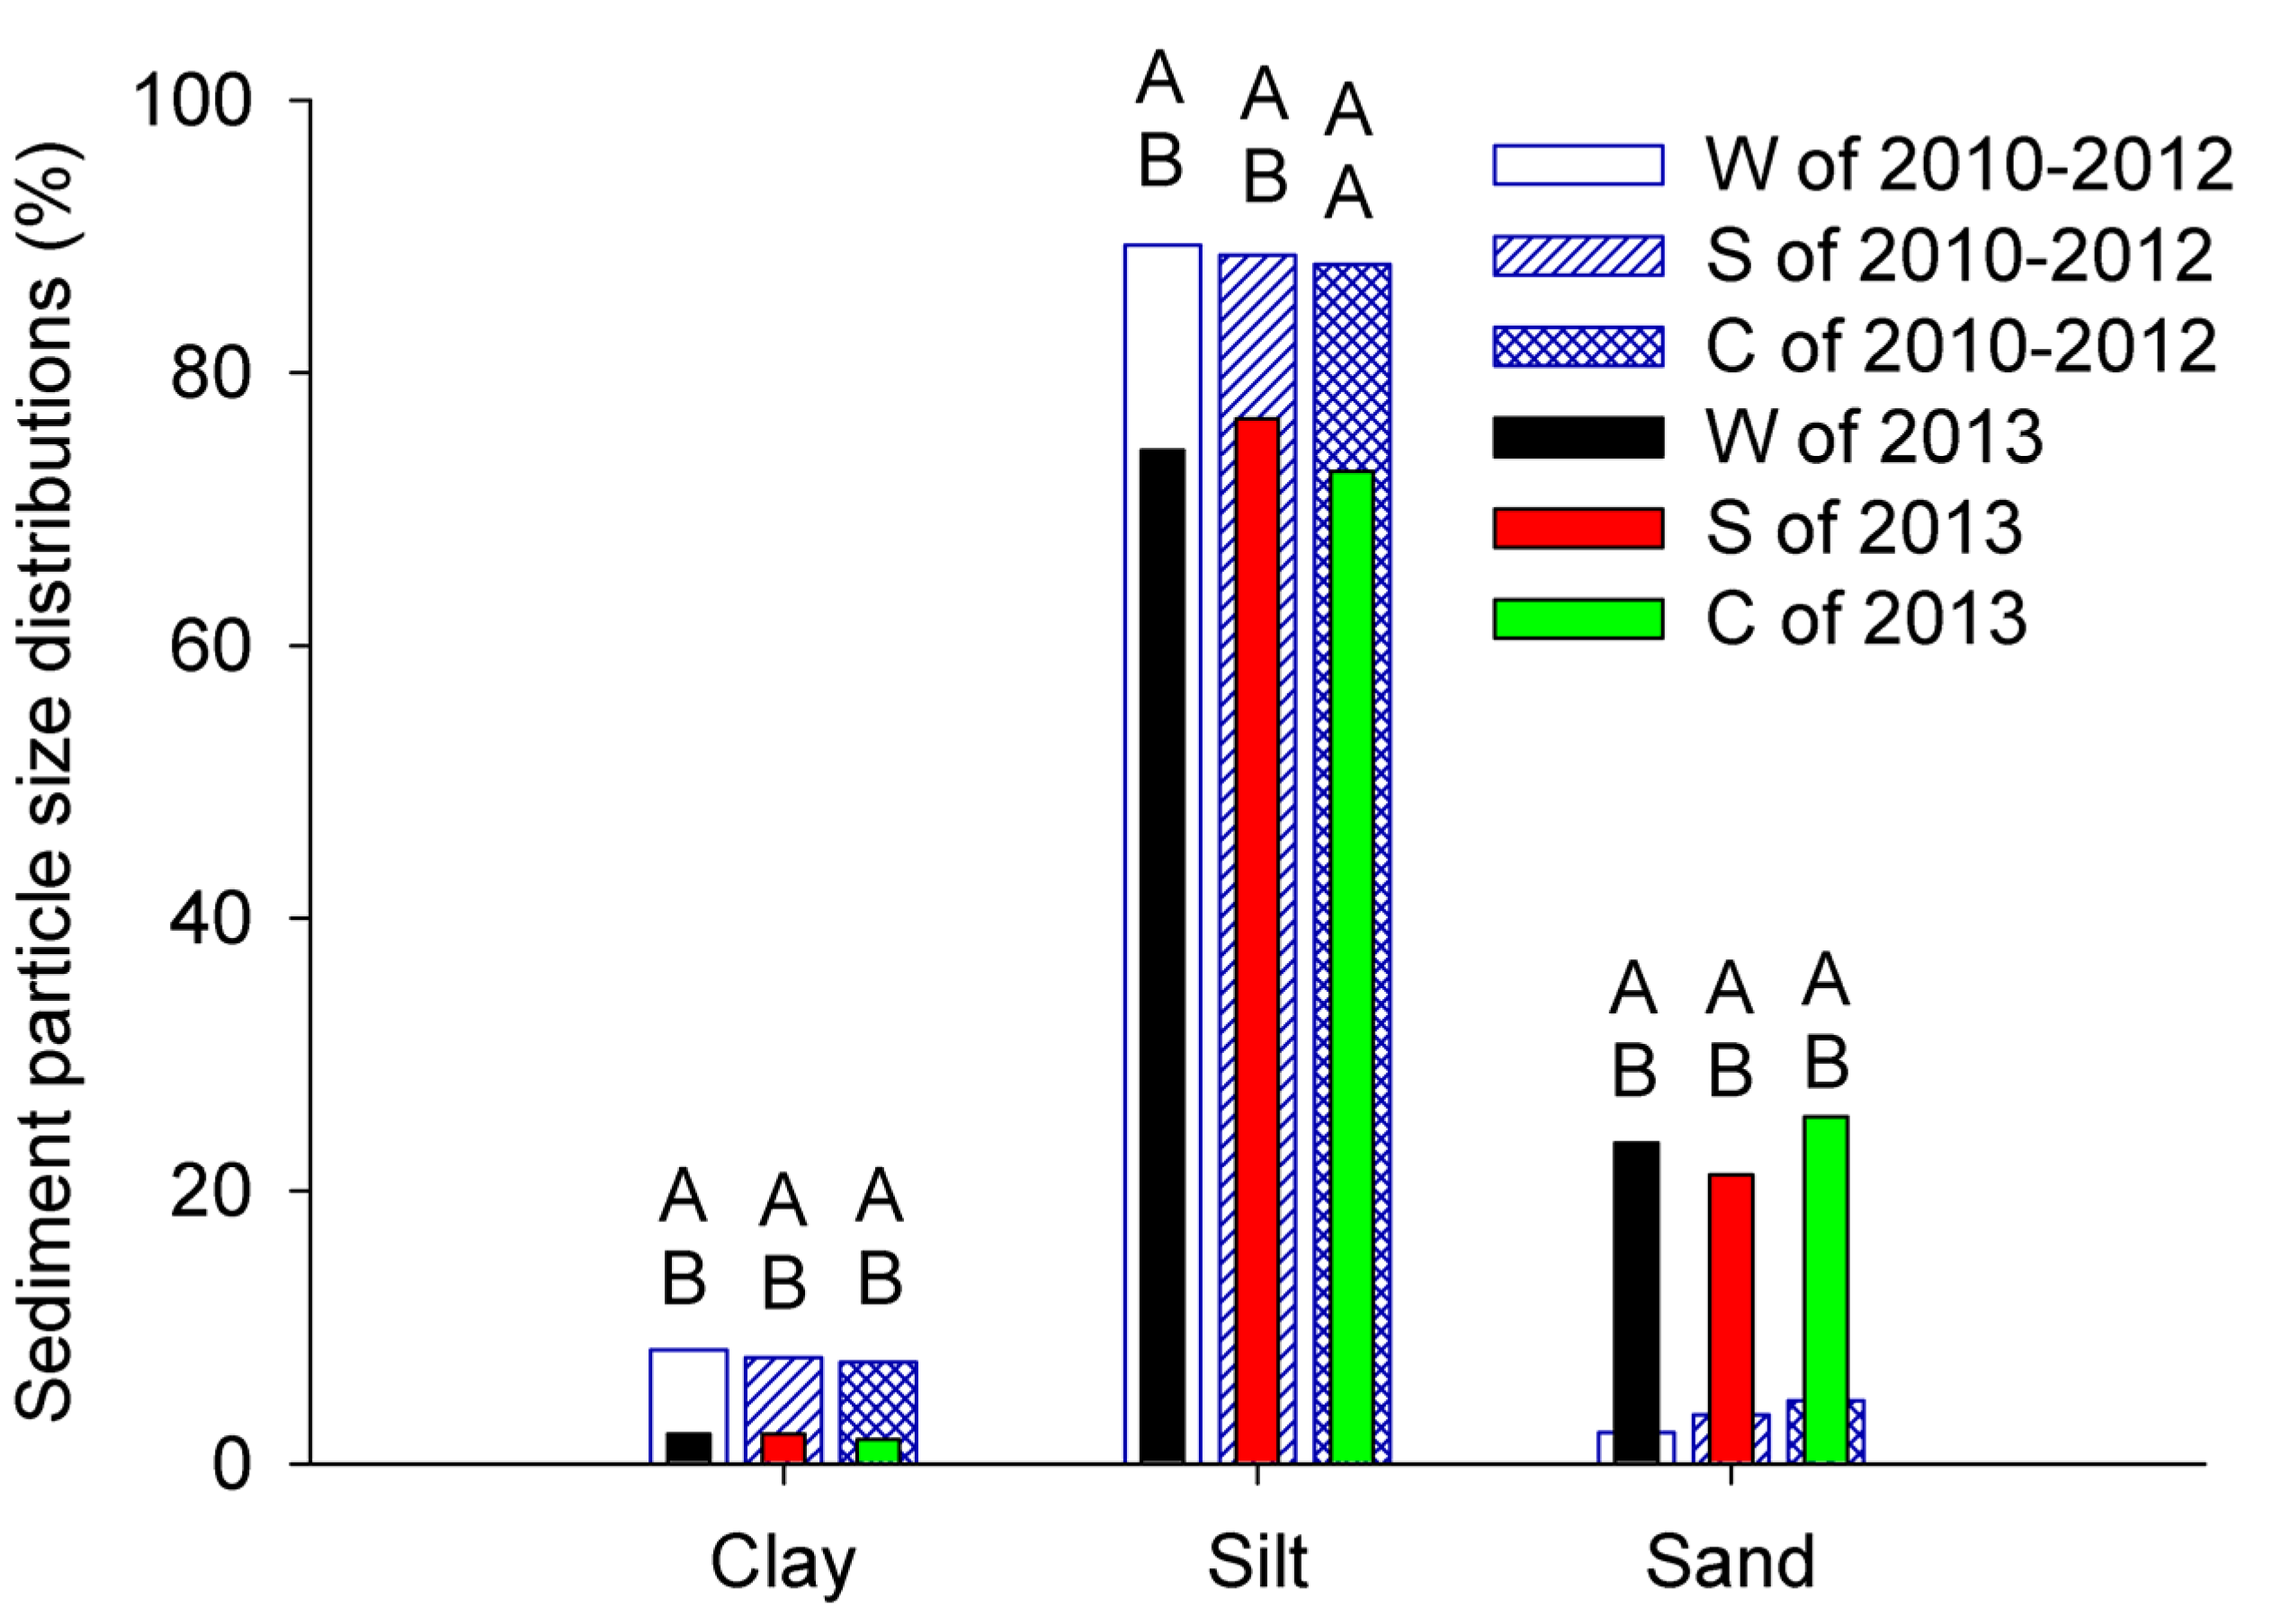
3.7. Sediment Particle Size Distributions in the “Extreme Year” and “Normal Year”

Soil erosion is a selective process that sweeps away fine materials and nutrients from sloped land [46,47,48,49,50]. The trend of different particle fractions was silt > clay > sand in the “normal year”, whereas the trend was silt > sand > clay in the “extreme year” (Figure 9). The sum of percentage composition of clay and silt accounted for 95.4% and 74.6% in the “normal year” and “extreme year”, respectively. However, compared to particles composition in the “normal year”, sand contents increased whereas silt and clay contents were relatively decreased in the “extreme year”; the difference was significant (p < 0.05) except for the silt content in the cultivated land. For example, the sand content was 25.4% for cultivated land in the “extreme year”, whereas the figure was only 4.6% in the “normal year”. Therefore, the detachment, transport and deposition processes of eroded soil in the “extreme year” were different from those during the “normal year”.
The sediment particle size distributions were influenced by hydraulic conditions and erosion processes. High intensity rainfall induced overland flow that had enough kinetic energy to detach topsoil and transport bulky grains; thus, the coarse fractions of the sediment increased [51,52,53,54]. Interrill runoff selectively transported fine fractions because the erosive capacity of interrill runoff was inadequate to transport coarse particles or the coarse particles were deposited preferentially [55]. In contrast, the rill flow had greater erosive power than that of sheet flow, and rill erosion was not as selective as sheet erosion [56]. Therefore, once rills developed, the amount of larger particles of sediment increased, and the particle-size distribution of the transported sediment became similar to that of the parent material [57,58]. Generating rill erosion needs certain critical hydraulic conditions. For the cinnamon soil in the Loess Plateau of China, Liu et al. [59] found that sheet erosion only lasted 15 min, then rill erosion occurred on 15° bare soil plots (under a rainfall intensity of 1.5 mm/min). For the loess soil in Ansai County (the soil was same with this study), Zhang et al. [60] concluded that the critical runoff energy for generating rill erosion was 0.045 J on 20° bare soil plots. In this study, runoff in the “extreme year” was much higher than that in the “normal year”, and the overland flow had enough kinetic energy to generate rills. A lot of rills even ephemeral gullies were observed in the “extreme year”. More rill and ephemeral gully occurrences were possibly responsible for the increase of the sand content in the “extreme year”. However, a quantitative measurement of the rills was not carried out due to limited manpower and the risk of landsides near the runoff plot.
Many other factors such as vegetative cover [49,61] and soil type [62] also affected the sediment particle size distributions. Some authors derived contrary conclusions regarding the relationship between hydraulic conditions and the sediment particle size distributions [62,63]. Moreover, the size distribution of the transported sediment in the field (effective size distribution) was different from equivalent measurements of the same samples after chemical and mechanical dispersion (ultimate size distribution) [61,62,64]. The ultimate size distribution was analyzed in this study, and the effective size distribution will be measured in a subsequent study.
Figure 9. Sediment particle size distributions in the “extreme year” and “normal year”. The capital letters represent the significance of the difference (p < 0.05) as those in Figure 5.
Water 07 03343 g009

3.8. Pearson Correlation Analysis between the Runoff Depths, Soil Losses and Rainfall Parameters

As illustrated in Table 3, the correlation coefficients between runoff, soil losses and rainfall amount, API in the “extreme year” were higher than those in the “normal year”. The correlations were significant in the “extreme year” except for the cultivated land, whereas the correlations were not significant in the “normal year” for all land use types. The correlations between runoff, soil losses and rainfall kinetic energy (E) were significant, except for those between E and soil loss in the wild grassland, and the correlation coefficients were higher in the “extreme year” than those in the “normal year”. The composite indices that incorporate the kinetic energy of rainfall and rainfall intensity (i.e., EI5, EI10, EI20, EI30 and EI60) represent the rainfall erosivity. The correlation coefficients between runoff, soil losses and composite indices were higher than those between runoff, soil losses and single rainfall parameters (rainfall amount or E). Furthermore, the correlation between EI30 and soil loss for each land use type was the highest in the “normal year”, and this correlation was also high despite it being slightly lower than the correlation between another composite index (EI5 or EI20) and soil loss in the “extreme year”, so EI30 was selected to represent rainfall erosivity as that in USLE/RUSLE.
Table 3. Pearson correlation analysis between rainfall parameters and runoff and soil losses.
YearLand UseRunoff Depth and Soil LossRainfall AmountAPIEEI5EI10EI20EI30EI60
2010–2012 (N = 15)WRunoff depth0.2620.0620.673 **0.737 **0.835 **0.827 **0.883 **0.865 **
Soil loss0.0080.3510.3270.3960.558 *0.528 *0.596 *0.533 *
SRunoff depth0.3370.1490.745 **0.806 **0.915 **0.908 **0.951 **0.937 **
Soil loss0.1970.1930.618 *0.725 **0.881 **0.863 **0.919 **0.866 **
CRunoff depth0.3790.0990.786 **0.833 **0.906 **0.905 **0.945 **0.943 **
Soil loss0.2460.1730.667 **0.775 **0.914 **0.906 **0.929 **0.897 **
2013 (N = 10)WRunoff depth0.835 **0.671 *0.893 **0.901 **0.890 **0.865 **0.859 **0.798 **
Soil loss0.5820.4830.6160.825 **0.830 **0.844 **0.790 **0.650 *
SRunoff depth0.822 **0.694 *0.884 **0.959 **0.950 **0.925 **0.905 **0.814 **
Soil loss0.831 **0.706 *0.846 **0.911 **0.908 **0.914 **0.890 **0.781 **
CRunoff depth0.790 **0.679 *0.864 **0.927 **0.937 **0.916 **0.898 **0.828 **
Soil loss0.778 **0.637 *0.868 **0.975 **0.968 **0.942 **0.924 **0.848 **
Notes: The unit of each index is the same as that in Table 2; N is the number of soil erosion events; * represents a significant correlation at the 0.05 level; and ** represents a significant correlation at the 0.01 level; API represent the antecedent precipitation index.
Therefore, the runoff and soil losses during the “normal year” were weakly correlated with the rainfall amount and depended more on the comprehensive effects of the rainfall’s kinetic energy and rainfall intensity. Liu et al. [59] concluded that the runoff volume was significantly correlated to EI30 on abandoned cropland. Arnaez et al. [65] also found that multiple variables (rainfall intensity, kinetic energy, runoff, etc.) could explain more variance of soil losses than single variable, such as rainfall intensity.
Generally, two major reasons are possibly responsible for the significant positive correlation between the rainfall amount and runoff. First, during high intensity rainfall, the runoff generation exceeds infiltration and major rainfall is lost as runoff. Second, with high soil moisture content even saturated soil moisture, water rarely infiltrates and major rainfall is lost as runoff. In the “normal year”, moderate rainfall amounts would result in moderate soil moisture, and the weak correlation between the rainfall amount and runoff was observed. The difference between the rainfall intensity in the “normal year” and “extreme year” was not conspicuous; therefore, the significant correlation between the rainfall amount and runoff in the “extreme year” was caused by high soil moisture content which resulted from high and continuous rainfall.
The relatively strong correlation between runoff, soil loss and API in the “extreme year” suggests that persistent rainfall enhanced the effect of antecedent soil moisture on the runoff and soil loss. The higher the API value, the more runoff and soil loss occurred.

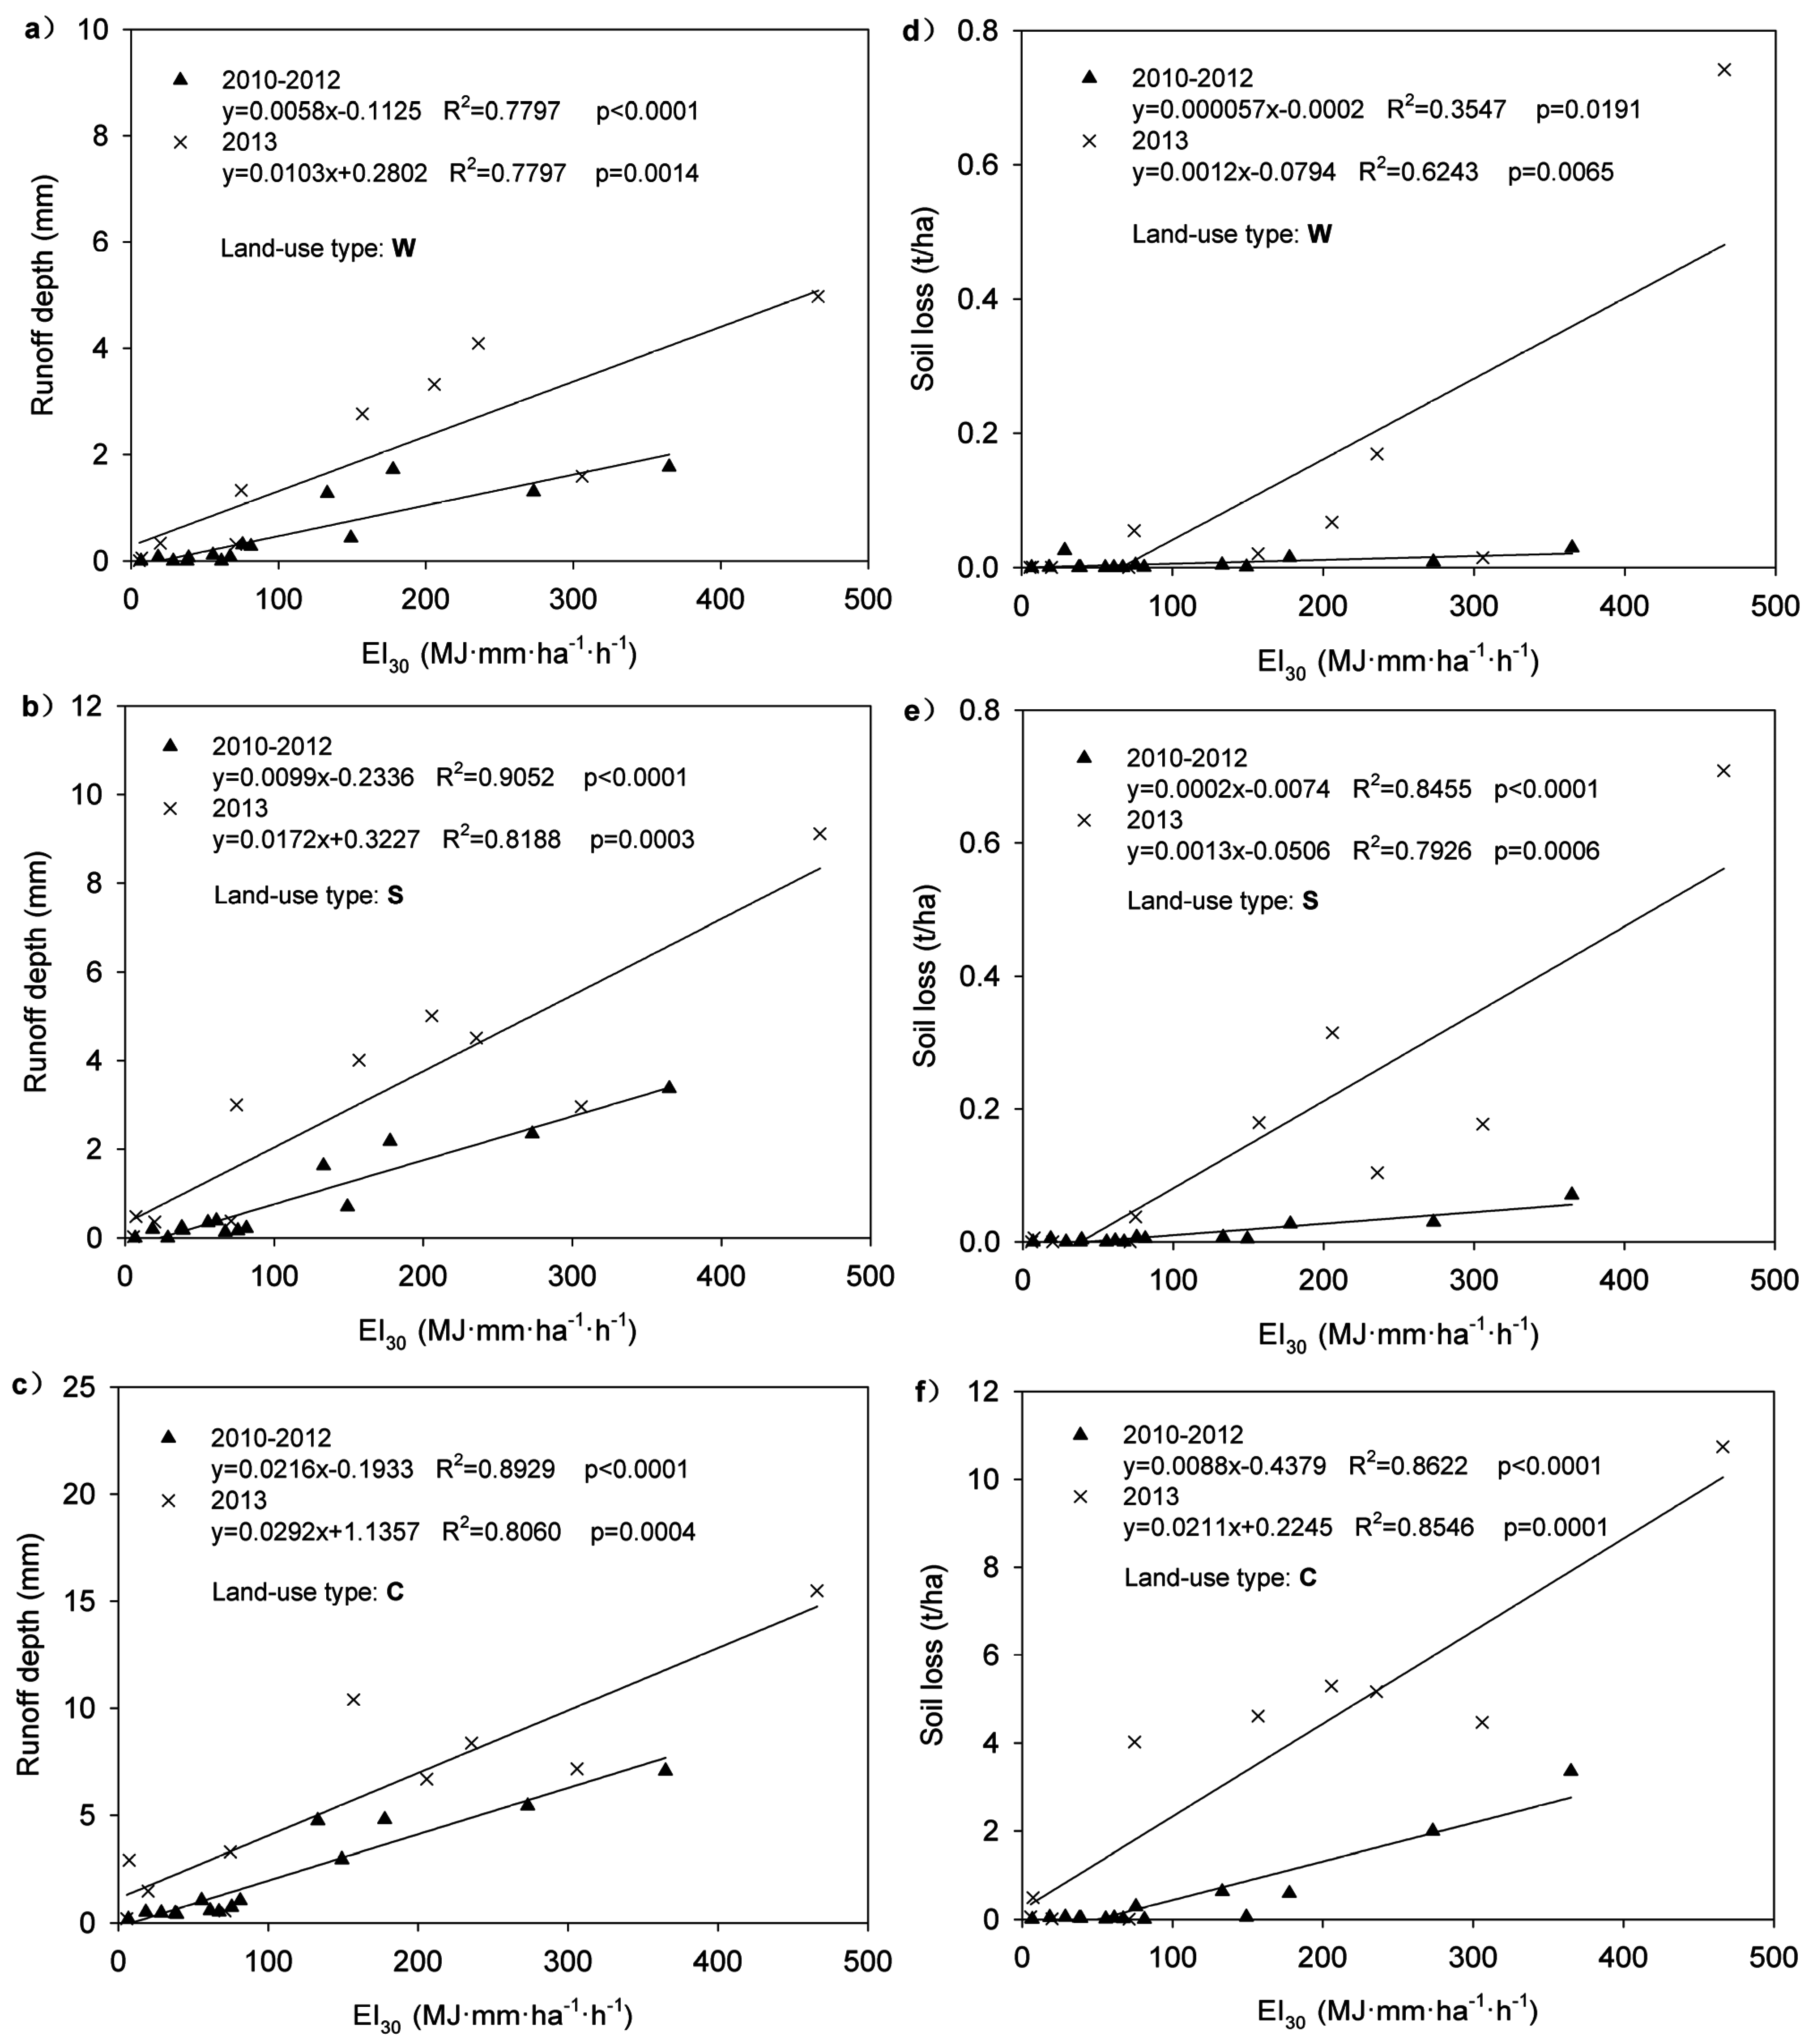
3.9. The Effect of Rainfall Erosivity (EI30) on Runoff and Soil Losses

Linear-regression analysis was carried out to reveal the effect of rainfall erosivity (EI30) on the runoff and soil losses. R2 is the coefficient of determination, which reflects the degree of the dependent variable explained by the independent variable. As illustrated in Figure 10, the R2 for regression equations between runoff, soil losses and EI30 ranged between 0.78 and 0.91, except for that between the soil loss and EI30 in the wild grassland. Thus, EI30 can explain more than 78% of the variation in the runoff and soil loss, which suggests that EI30 was the dominant factor that controlled the runoff and soil loss. For the same land use type, the slopes of the regression equations in the “extreme year” were higher than those in the “normal year”, indicating that the runoff and soil loss increased with EI30 at a higher rate in the “extreme year”, especially for soil loss.
In the “extreme year”, the same rainfall erosivity generated more runoff and soil loss than in the “normal year”, which may be explained by the high API value. The antecedent precipitation as well as antecedent soil moisture had a significant impact on the runoff and soil loss [2,44,45,66,67,68]. Greater soil erosion was observed during the wet season in Spain [69]. Successive antecedent precipitation might cause high runoff and soil loss [67]. The antecedent soil moisture was closely associated with antecedent precipitation [28,29,31,40]. The hydraulic gradient decreased as the soil moisture content increased [70], and the reduction in the infiltration rate caused higher runoff and, consequently, higher soil loss. Zhang and Zheng [71] studied the effects of near-surface soil water conditions on soil erosion processes and found that soil loss from saturated condition, 75% of soil moisture and 50% of soil moisture were 50, 25 and 1.3 times greater, respectively, than that from 25% of soil moisture.
Soil loss increased with EI30 at a higher rate in the “extreme year”. There is another possible reason for this phenomenon: rills increased and ephemeral gullies occurred. Soil erosion by water was divided into rill and interrill components [72]. The soil loss increased several or even a dozen times once rills occurred on the hillslope [73,74].
The runoff and soil losses values were low and the variation was small (accounting for 6.2%–38.3% of the total variation in the soil loss events over four years) for one land use type, as the EI30 for the events were less than 100 MJ·mm·ha−1·h−1 (these events accounted for 60% of the total soil loss events over four years). Conversely, when EI30 exceeded 100 MJ·mm·ha−1·h−1, the runoff and soil loss increased considerably with the increase of EI30, and the variation was great. Therefore, we deduced that the threshold value of EI30 should be 100 MJ·mm·ha−1·h−1, which was related to extreme erosion risk. The rainfall events for which EI30 exceeded 100 MJ·mm·ha−1·h−1 were the important objects in controlling soil erosion, and relative protection measures must be prepared in advance.
Figure 10. Linear-regression between EI30 and runoff (a, b, c) and soil loss (d, e, f) for land use types in the “normal year” and “extreme year”
Water 07 03343 g010
In both the “normal year” and “extreme year”, the general trend for the slopes of regression equations (Figure 10) of three land use types was W < S < C, indicating that the impact of rainfall erosivity on runoff and soil loss for various land use types was different. The magnitudes of the runoff and soil loss (Figure 5 and Figure 7), the R2 of the regression equation between soil loss and EI30 (Figure 10) and the correlation coefficient between the soil loss and rainfall parameters (Table 3) were the lowest for the wild grassland. The results revealed that the effect of rainfall on soil erosion was the smallest in wild grassland, which had the highest capability for soil conservation. Consequently, wild grassland is a suitable land use type to cope with extreme rainfall.

4. Conclusions

The annual precipitation reached 959.1 mm in 2013 which was an extreme wet year, and the rainfall amount in July contributed the most (59.2%) to the annual rainfall. The rainfall parameters in June, July and August in this “extreme year” were all higher than those in the “normal year”. The EI30 threshold value for determining extreme rainfall events was 159 MJ·mm·ha−1·h−1. The runoff and soil losses caused by several extreme rainfall events represented 44.7%–92.2% and 50.1%–100% of the total annual runoff and soil loss, respectively. On average, one extreme rainfall event was observed in each “normal year”, whereas four occurred in the “extreme year”.
Soil erosion events mainly occurred in July and August, the runoff, soil and nutrient loss in the “extreme year” increased greatly as compared with those in the “normal year”. Silt content dominated the sediment composition, but the sand content increased relatively in the “extreme year”. The normal trend for the runoff, soil and nutrient loss in the various land use types was W < S < C. The correlation and regression analysis also showed that the effect of rainfall on soil erosion was the smallest in the wild grassland.
In the “extreme year”, the same rainfall erosivity (EI30) generated more runoff and soil loss than in the “normal year”, the high antecedent precipitation being one of the reasons for this. The threshold value of EI30 (100 MJ·mm·ha−1·h−1) was proposed, which was related to the risk of extreme erosion.

Acknowledgments

This work is supported by the National Natural Science Foundation of China (No. 41171069) and the Open Foundation of the Key Laboratory of Land Use, Ministry of Land and Resources, China. We are also grateful to the Ansai Research Station of Soil and Water Conservation, Chinese Academy of Sciences for their support and contributions to this fieldwork.

Author Contributions

Qiang Feng performed the experimental work and prepared the manuscript. Xudong Guo, Wenwu Zhao and Yang Qiu designed the field experiment and reviewed the manuscript. Xiao Zhang performed the experimental work and data collection.

Conflicts of Interest

The authors declare no conflict of interest.

References

  1. Fang, H.Y.; Cai, Q.G.; Chen, H.; Li, Q.Y. Effect of rainfall regime and slope on runoff in a gullied loess region on the Loess Plateau in China. Environ. Manag. 2008, 42, 402–411. [Google Scholar] [CrossRef] [PubMed]
  2. Wei, L.; Zhang, B.; Wang, M. Effects of antecedent soil moisture on runoff and soil erosion in alley cropping systems. Agric. Water Manag. 2007, 94, 54–62. [Google Scholar] [CrossRef]
  3. McCarthy, J.J.; Canziani, O.F.; Leary, N.A.; Dokken, D.J.; White, K.S. Climate Change 2001: Impacts, Adaptation and Vulnerability: Contribution of Working Group II to the Third Assessment Report of the Intergovernmental Panel on Climate Change; Cambridge University Press: New York, NY, USA, 2001; pp. 735–800. [Google Scholar]
  4. Karl, T.R. Regional trends and variations of temperature and precipitation. In The Regional Impacts of Climate Change: An Assessment of Vulnerability; Watson, R.T., Zyinyowera, M.C., Moss, R.H., Eds.; Cambridge University Press: New York, NY, USA, 1998; pp. 411–437. [Google Scholar]
  5. Ramos, M.C.; Martínez-Casasnovas, J.A. Trends in precipitation concentration and extremes in the Mediterranean Penedes-Anoia region, NE Spain. Clim. Chang. 2006, 74, 457–474. [Google Scholar] [CrossRef]
  6. Terink, W.; Immerzeel, W.W.; Droogers, P. Climate change projections of precipitation and reference evapotranspiration for the Middle East and Northern Africa until 2050. Int. J. Climatol. 2013, 33, 3055–3072. [Google Scholar] [CrossRef]
  7. Li, J.; Zhang, Q.; Chen, Y.D.; Singh, V.P. Future joint probability behaviors of precipitation extremes across China: Spatiotemporal patterns and implications for flood and drought hazards. Glob. Planet Chang. 2015, 124, 107–122. [Google Scholar] [CrossRef]
  8. Katz, R.W.; Brown, B.G. Extreme events in a changing climate: Variability is more important than averages. Clim. Chang. 1992, 21, 289–302. [Google Scholar] [CrossRef]
  9. Wagner, D. Scenarios of extreme temperature events. Clim. Chang. 1996, 33, 385–407. [Google Scholar] [CrossRef]
  10. Groisman, P.Y.; Knight, R.W.; Easterling, D.R.; Karl, T.R.; Hegerl, G.C.; Razuvaev, V.N. Trends in intense precipitation in the climate record. J. Clim. 2005, 18, 1326–1350. [Google Scholar] [CrossRef]
  11. Easterling, D.R.; Meehl, G.A.; Parmesan, C.; Changnon, S.A.; Karl, T.R.; Mearns, L.O. Climate extremes: Observations, modeling, and impacts. Science 2000, 289, 2068–2074. [Google Scholar] [CrossRef] [PubMed]
  12. Zhang, X.C.; Liu, W.Z. Simulating potential response of hydrology, soil erosion, and crop productivity to climate change in Changwu tableland region on the Loess Plateau of China. Agric. For. Meteorol. 2005, 131, 127–142. [Google Scholar] [CrossRef]
  13. Favis-Mortlock, D.; Boardman, J. Nonlinear responses of soil erosion to climate change: A modelling study on the UK South Downs. Catena 1995, 25, 365–387. [Google Scholar] [CrossRef]
  14. Mano, V.; Nemery, J.; Belleudy, P.; Poirel, A. Assessment of suspended sediment transport in four alpine watersheds (France): Influence of the climatic regime. Hydrol. Process. 2009, 23, 777–792. [Google Scholar] [CrossRef]
  15. Estrany, J.; Garcia, C.; Batalla, R.J. Hydrological response of a small mediterranean agricultural catchment. J. Hydrol. 2010, 380, 180–190. [Google Scholar] [CrossRef]
  16. Mannaerts, C.M.; Gabriels, D. A probabilistic approach for predicting rainfall soil erosion losses in semiarid areas. Catena 2000, 40, 403–420. [Google Scholar] [CrossRef]
  17. Gao, C.; Zhu, J.; Zhu, J.; Hosen, Y.; Zhou, J.; Wang, D.; Wang, L.; Dou, Y. Effects of extreme rainfall on the export of nutrients from agricultural land. Acta Geogr. Sin. 2005, 60, 991–997. (In Chinese) [Google Scholar]
  18. Van den Elsen, H.G.M.; Hessel, R.; Liu, B.; Trouwborst, K.O.; Stolte, J.; Ritsema, C.J.; Blijenberg, H. Discharge and sediment measurements at the outlet of a watershed on the Loess Plateau of China. Catena 2003, 54, 147–160. [Google Scholar] [CrossRef]
  19. Willems, P. A spatial rainfall generator for small spatial scales. J. Hydrol. 2001, 252, 126–144. [Google Scholar] [CrossRef]
  20. De Lima, J.L.; Singh, V.P.; de Lima, M.I.P. The influence of storm movement on water erosion: Storm direction and velocity effects. Catena 2003, 52, 39–56. [Google Scholar] [CrossRef]
  21. Cerdan, O.; Bissonnais, Y.; Couturier, A.; Bourennane, H.; Souchère, V. Rill erosion on cultivated hillslopes during two extreme rainfall events in Normandy, France. Soil Till. Res. 2002, 67, 99–108. [Google Scholar] [CrossRef]
  22. Ramos, M.C.; Martınez-Casasnovas, J.A. Nutrient losses from a vineyard soil in Northeastern Spain caused by an extraordinary rainfall event. Catena 2004, 55, 79–90. [Google Scholar] [CrossRef]
  23. Weltzin, J.F.; Loik, M.E.; Schwinning, S.; Williams, D.G.; Fay, P.A.; Haddad, B.M.; Zak, J.C. Assessing the response of terrestrial ecosystems to potential changes in precipitation. Bioscience 2003, 53, 941–952. [Google Scholar] [CrossRef]
  24. China Meteorological Data Sharing Service System. Available online: http://www.escience.gov.cn/metdata/page/index.html (accessed on 21 January 2014). (In Chinese)
  25. Foster, G.R.; McCool, D.K.; Renard, K.G.; Moldenhauer, W.C. Conversion of the universal soil loss equation to SI metric units. J. Soil Water Conserv. 1981, 36, 355–359. [Google Scholar]
  26. Wischmeier, W.H.; Smith, D.D. Predicting Rainfall Erosion Losses: A Guide to Conservation Planning; USDA Agriculture Handbook 537; U.S. Government Printing Office: Washington, DC, USA, 1978; pp. 5–7.
  27. Xie, Y.; Liu, B.; Nearing, M.A. Practical thresholds for separating erosive and non-erosive storms. Trans. ASAE 2002, 45, 1843–1847. [Google Scholar]
  28. Sittner, W.T.; Schauss, C.E.; Monro, J.C. Continuous hydrograph synthesis with an API-type hydrologic model. Water Resour. Res. 1969, 5, 1007–1022. [Google Scholar] [CrossRef]
  29. Findell, K.L.; Eltahir, E.A. An analysis of the soil moisture-rainfall feedback, based on direct observations from Illinois. Water Resour. Res. 1997, 33, 725–735. [Google Scholar] [CrossRef]
  30. Brocca, L.; Melone, F.; Moramarco, T.; Morbidelli, R. Antecedent wetness conditions based on ERS scatterometer data. J. Hydrol. 2009, 364, 73–87. [Google Scholar] [CrossRef]
  31. Zhao, Y.; Wei, F.; Yang, H.; Jiang, Y. Discussion on using antecedent precipitation index to supplement relative soil moisture data series. Procedia Environ. Sci. 2011, 10, 1489–1495. [Google Scholar] [CrossRef]
  32. Heggen, R.J. Normalized antecedent precipitation index. J. Hydrol. Eng. 2001, 6, 377–381. [Google Scholar] [CrossRef]
  33. Bao, S.D. Soil and Agricultural Chemistry Analysis; China Agriculture Press: Beijing, China, 2005; pp. 30–35. (In Chinese) [Google Scholar]
  34. Sokal, R.R.; Rohlf, F.J. The Principles and Practice of Statistics in Biological Research; W.H. Freeman and Co.: New York, NY, USA, 1995; pp. 340–348. [Google Scholar]
  35. Wei, W.; Chen, L.; Fu, B.; Lv, Y.; Gong, J. Responses of water erosion to rainfall extremes and vegetation types in a loess semiarid hilly area, NW China. Hydrol. Process. 2009, 23, 1780–1791. [Google Scholar] [CrossRef]
  36. Steegen, A.; Govers, G.; Takken, I.; Nachtergaele, J.; Poesen, J.; Merckx, R. Factors controlling sediment and phosphorus export from two Belgian agricultural catchments. J. Environ. Q. 2001, 30, 1249–1258. [Google Scholar] [CrossRef]
  37. Wainwright, J. Infiltration, runoff and erosion characteristics of agricultural land in extreme storm events, SE France. Catena 1996, 26, 27–47. [Google Scholar] [CrossRef]
  38. Martínez-Casasnovas, J.A.; Ramos, M.C.; Ribes-Dasi, M. On-Site effects of concentrated flow erosion in vineyard fields: Some economic implications. Catena 2005, 60, 129–146. [Google Scholar] [CrossRef]
  39. Chen, Q.; Wang, K.; Qi, S.; Sun, L.; Wu, X. Soil loss tolerance of sloping field in semi-arid hilly-gully area of Loess Plateau. Bull. Soil Water Conserv. 2003, 23, 1–4. (In Chinese) [Google Scholar]
  40. Xie, W.; Wang, J. Assessment of soil water content in field with antecedent precipitation index and groundwater depth in the Yangtze River Estuary. J. Integr. Agric. 2013, 12, 711–722. [Google Scholar] [CrossRef]
  41. Bárdossy, A.; Lehmann, W. Spatial distribution of soil moisture in a small catchment. Part 1: Geostatistical analysis. J. Hydrol. 1998, 206, 1–15. [Google Scholar] [CrossRef]
  42. Seeger, M.; Errea, M.P.; Beguerı́a, S.; Arnáez, J.; Martı́, C.; Garcı́a-Ruiz, J.M. Catchment soil moisture and rainfall characteristics as determinant factors for discharge/suspended sediment hysteretic loops in a small headwater catchment in the Spanish Pyrenees. J. Hydrol. 2004, 288, 299–311. [Google Scholar] [CrossRef]
  43. Li, X.Y.; Contreras, S.; Solé-Benet, A.; Cantón, Y.; Domingo, F.; Lázaro, R.; Puigdefábregas, J. Controls of infiltration–runoff processes in Mediterranean karst rangelands in SE Spain. Catena 2011, 86, 98–109. [Google Scholar] [CrossRef]
  44. Zehe, E.; Gräff, T.; Morgner, M.; Bauer, A.; Bronstert, A. Plot and field scale soil moisture dynamics and subsurface wetness control on runoff generation in a headwater in the Ore Mountains. Hydrol. Earth Syst. Sci. 2010, 14, 873–889. [Google Scholar] [CrossRef]
  45. An, J.; Zheng, F.; Römkens, M.J.; Li, G.; Yang, Q.; Wen, L.; Wang, B. The role of soil surface water regimes and raindrop impact on hillslope soil erosion and nutrient losses. Nat. Hazards 2013, 67, 411–430. [Google Scholar] [CrossRef]
  46. Thomas, A.D.; Walsh, R.P.; Shakesby, R.A. Nutrient losses in eroded sediment after fire in eucalyptus and pine forests in the wet Mediterranean environment of northern Portugal. Catena 1999, 36, 283–302. [Google Scholar] [CrossRef]
  47. Bajracharya, R.M.; Lal, R.; Kimble, J.M. Erosion effects on carbon dioxide concentration and carbon flux from an Ohio Alfisol. Soil Sci. Soc. Am. J. 2000, 64, 694–700. [Google Scholar] [CrossRef]
  48. Polyakov, V.; Lal, R. Modeling soil organic matter dynamics as affected by soil water erosion. Environ. Int. 2004, 30, 547–556. [Google Scholar] [CrossRef] [PubMed]
  49. Zhang, G.H.; Liu, G.B.; Wang, G.L.; Wang, Y.X. Effects of vegetation cover and rainfall intensity on sediment-bound nutrient loss, size composition and volume fractal dimension of sediment particles. Pedosphere 2011, 21, 676–684. [Google Scholar] [CrossRef]
  50. Li, G.L.; Pang, X.M. Difference in organic carbon contents and distributions in particle-size fractions between soil and sediment on the Southern Loess Plateau, China. J. Mt. Sci. 2014, 11, 717–726. [Google Scholar] [CrossRef]
  51. Meyer, L.D.; Harmon, W.C.; Dowell, L.L. Sediment sizes eroded from crop row side slopes. Trans. ASAE 1980, 23, 891–898. [Google Scholar] [CrossRef]
  52. Slattery, M.C.; Burt, T.P. Size characteristics of sediment eroded from agricultural soil: Dispersed versus non-dispersed, ultimate versus effective. River Geomorphol. 1995, 1, 1–17. [Google Scholar]
  53. Wan, Y.; El-Swaify, S.A. Sediment enrichment mechanisms of organic carbon and phosphorus in a well-aggregated Oxisol. J. Environ. Q. 1998, 27, 132–138. [Google Scholar] [CrossRef]
  54. Hu, H.; Hong, T.; Ma, Y.; Liu, K. Study on soil and sediment particle size distribution and nutrient loss. J. Soil Water Conserv. 2007, 21, 26–29. (In Chinese) [Google Scholar]
  55. Parsons, A.J.; Abrahams, A.D.; Luk, S.H. Size characteristics of sediment in interrill overland flow on a semiarid hillslope, southern Arizona. Earth Surf. Proc. Land. 1991, 16, 143–152. [Google Scholar] [CrossRef]
  56. Proffitt, A.P.B.; Rose, C.W. Soil erosion processes. II. Settling velocity characteristics of eroded sediment. Aust. J. Soil Res. 1991, 29, 685–695. [Google Scholar] [CrossRef]
  57. Govers, G. Selectivity and transport capacity of thin flows in relation to rill erosion. Catena 1985, 12, 35–49. [Google Scholar] [CrossRef]
  58. Panuska, J.C.; Karthikeyan, K.G.; Miller, P.S. Impact of surface roughness and crusting on particle size distribution of edge-of-field sediments. Geoderma 2008, 145, 315–324. [Google Scholar] [CrossRef]
  59. Liu, Y.; Fu, B.; Lü, Y.; Wang, Z.; Gao, G. Hydrological responses and soil erosion potential of abandoned cropland in the Loess Plateau, China. Geomorphology 2012, 138, 404–414. [Google Scholar] [CrossRef]
  60. Zhang, Y.D.; Wu, S.F.; Feng, H.; Huo, Y.Y. Experimental study of rill dynamic development process and its critical dynamic conditions on loess slope. J. Sediment Res. 2013, 2, 25–32. [Google Scholar]
  61. Martínez-Mena, M.; Rogel, J.A.; Albaladejo, J.; Castillo, V.M. Influence of vegetal cover on sediment particle size distribution in natural rainfall conditions in a semiarid environment. Catena 2000, 38, 175–190. [Google Scholar] [CrossRef]
  62. Martínez-Mena, M.; Castillo, V.; Albaladejo, J. Relations between interrill erosion processes and sediment particle size distribution in a semiarid Mediterranean area of SE of Spain. Geomorphology 2002, 45, 261–275. [Google Scholar] [CrossRef]
  63. Wu, F.; Shi, Z.; Fang, N.; Yue, B. Temporal variations of clay content in eroded sediment under different rainfall condition. Environ. Sci. 2012, 33, 2497–2502. (In Chinese) [Google Scholar]
  64. Wu, F.; Shi, Z.; Yue, B.; Wang, L. Particle characteristics of sediment in erosion on hillslope. Acta Pedol. Sin. 2012, 49, 1235–1240. (In Chinese) [Google Scholar]
  65. Arnaez, J.; Lasanta, T.; Ruiz-Flaño, P.; Ortigosa, L. Factors affecting runoff and erosion under simulated rainfall in Mediterranean vineyards. Soil Till. Res. 2007, 93, 324–334. [Google Scholar] [CrossRef]
  66. Zehe, E.; Blöschl, G. Predictability of hydrologic response at the plot and catchment scales: Role of initial conditions. Water Resour. Res. 2004, 40. [Google Scholar] [CrossRef]
  67. Peng, T.; Wang, S.J. Effects of land use, land cover and rainfall regimes on the surface runoff and soil loss on karst slopes in southwest China. Catena 2012, 90, 53–62. [Google Scholar] [CrossRef]
  68. Ziadat, F.M.; Taimeh, A.Y. Effect of rainfall intensity, slope, land use and antecedent soil moisture on soil erosion in an arid environment. Land. Degrad. Dev. 2013, 24, 582–590. [Google Scholar] [CrossRef]
  69. Cerda, A. The effect of season and parent material on water erosion on highly eroded soils in eastern Spain. J. Arid Environ. 2002, 52, 319–337. [Google Scholar] [CrossRef]
  70. Bradford, J.M.; Ferris, J.E.; Remley, P.A. Interrill soil erosion processes: I. Effect of surface sealing on infiltration, runoff, and soil splash detachment. Soil Sci. Soc. Am. J. 1987, 51, 1566–1571. [Google Scholar] [CrossRef]
  71. Zhang, Y.B.; Zheng, F.L. Effects of near surface soil water conditions on soil erosion process. Sci. Soil Water Conserv. 2007, 5, 5–10. (In Chinese) [Google Scholar]
  72. Foster, G.R.; Meyer, L.D. Transport of soil particles by shallow flow. Trans. ASAE 1972, 15, 99–102. [Google Scholar]
  73. Meyer, L.D.; Foster, G.R.; Nikolov, S. Effect of flow rate and canopy on rill erosion. Trans. ASAE 1975, 18, 905–911. [Google Scholar] [CrossRef]
  74. Auerswald, K.; Fiener, P.; Dikau, R. Rates of sheet and rill erosion in Germany—A meta-analysis. Geomorphology 2009, 111, 182–193. [Google Scholar] [CrossRef]

