1. Introduction
The efficiency of water utilities has received much attention because reducing costs could facilitate an increase in investments to reduce water leakage and improve customer service quality. Furthermore, the financial context of the economic crisis affecting EU countries imposes the need for high efficiency on service providers, implying that utilities should become more efficient, rather than cut services or raise taxes to cover extra costs.
Many scholars have attempted to highlight the existence of economies of scale and scope in this industry to develop a comprehensive framework that can facilitate managerial and political decision making but the results have been inconclusive [
1,
2,
3,
4]. In particular, many of the studies that considered integration of various activities related to water services focused on the vertical integration of water delivery and wastewater services. By contrast, literature on economies of density in the water industry is quite scarce [
1,
3], making further empirical studies necessary.
The present study aims to contribute to the literature by analyzing the efficiency of water utilities operating in Denmark. Addressing this lack of conclusive results, we investigate the existence of economies of scale, scope, and customer density in the country’s water utilities that have never previously been analyzed with reference to these major issues. In fact, a paper [
5] highlighted a scarcity of scientific studies conducted on water utility performance in Northern and Eastern Europe. Only very few recent studies have focused on these countries. For instance, Nauges and Van Den Berg [
6] considered Moldovian and Romanian utilities; Malmsten and Lekkas [
7] analyzed economies of scope in Sweden’s water industry; and Zschille and Walter [
8], De Witte and Dijkgraaf [
9] and Peda, Grossi and Liik [
10] focused on economies of scale in Germany, the Netherlands, and Estonia, respectively. Our research method is based on two-stage Data Envelopment Analysis (DEA) [
3] applied here to 101 Danish utilities: Efficiency is estimated in Stage 1, applying the non-parametric technique DEA. The effects on performance of the exogenous variables size, scope of operations, and population density are observed in Stage 2.
Section 2 of the paper offers a review of the literature on scale, diversification, and customer density in the water sector and their impact on utility costs.
Section 3 provides an overview of the Danish water and wastewater markets.
Section 4 describes the research method with particular attention to data collection and analysis.
Section 5 outlines the key findings of our empirical research, shows how the selected operational and environmental variables affect the efficiency of water utilities, and discusses the main implications for government policy. We conclude the study in
Section 6.
2. Literature Review
Many empirical studies conducted worldwide have addressed the relationship between the performance of water utilities and their size and diversification, as well as the possible existence of economies of scale, scope, and density. Economies of scale arise when a unit increase in output results from a less than proportional increase in input. Economies of scope occur when an entity’s unit average cost to produce two or more products or services is lower than when they are produced by separate entities. In the water industry, economies of density pertain to two main types: (1) Output or production density, which refers to the change in costs for increases in the total volume of water produced or wastewater treated for a constant number of customers and network length; and (2) Customer density, which indicates the quantum change in costs for increases in the number of customers for a constant network length [
6].
There is a lack of consensus in study results. Most studies confirm the presence of economies of scale in the water industry [
11,
12,
13], but others highlight diseconomies of scale in various countries [
14,
15,
16,
17,
18,
19,
20].
By contrast [
21], in relation to wastewater activities, there is consensus that economies of scale do exist, although there is no clarity on what scale generates them: For instance an author [
22] studying firms in the United Kingdom, found scale economies up to 16.6 million cubic meters per year of water treated. However, this consensus could be because the wastewater industry has attracted less research and most such studies have focused on firms managing water supply as well as wastewater services [
23,
24].
There is also a lack of consensus on the existence of economies of scope [
25]. While there is considerable evidence that economies of scope exist for water production and distribution [
4], results from studies on joint water and wastewater services differ. Studies focused mainly on the United Kingdom and Portugal [
4,
12] revealed contrasting results. Some scholars [
26,
27] highlighted economies of scope, while a more recent study [
28] underlined the existence of diseconomies of scope. Similarly, as regards Portugal, two articles [
29,
30] described economies of scope, while others [
31,
32] showed diseconomies of scope. Moreover, Carvalho and Marques [
29] showed that joint water and wastewater services hindered performance, compared with water supply services alone. However, they observed economies of scope in Portugal, where a positive influence of joint water, wastewater, and urban waste services emerged. On the other hand, Garcia, Moureaux and Reynaud [
33] analyzed US data and showed that separating the production and distribution stages might lead to cost savings, except for the smallest services. When only the wastewater treatment sector is considered, the results are more convergent.
Finally, a relevant body of literature addresses economies of density [
34]. In the water industry, economies of density exist when unit costs decrease with greater population density or with an increase in water provided per kilometres of mains, because the cost of infrastructure required per service is less. In other words, water utilities may have significant economies of customer and output density [
3]. Since differences in population density are likely to influence utilities costs [
4], further research is needed to understand this issue better.
3. An Overview of the Danish Water Sector
Denmark provides an appealing setting for comparing the performance of water utilities since it has a well-developed benchmarking system with detailed, publicly available data provided separately for water and wastewater facilities. Utility companies of different sizes involved in water supply and/or wastewater services coexist and serve different areas and populations. The Danish water sector is highly decentralized with 98 municipalities responsible for providing water and wastewater services to a population of 5.58 million in an area of 42,895 km
2 [
35]. Like European countries such as Austria and Sweden, Denmark allows private sector participation on a non-profit basis. Compared to other European countries, Denmark’s water industry is characterized by: Low population density (129.7 inhabitants per square kilometre in 2011); a high level of decentralization (more than 2000 utilities); one of the highest tariffs in Europe (the unit price of water and wastewater services to Danish households in 2007–2008, including taxes, was 6.70 USD/m
3); one of the lowest water losses rates (the difference between water volumes pumped out and water volumes registered by consumers was only 1.7 m
3 per km of pipes per day in 2009).
The Danish water sector underwent major reform in 2009, aimed at enhancing quality and efficiency. The Water Sector Reform Act introduced a regulatory authority, imposed a process of corporatization and introduced a tariff method based on a revenue cap system. The Danish Water Utility Regulatory Authority is independent and responsible for the economic regulation of the water and wastewater companies in Denmark. The economic regulation covers the approximately 300 largest companies, that supply at least more than 200,000 m3 water, or are owned by the municipalities.
The economic regulation in the water sector act covers:
Comparison of the companies’ efficiency (benchmarking);
Determination of annual price caps on companies’ prices;
Supervision of water companies’ internal monitoring system;
Guidance of the companies in the rules and how companies must report;
Contribution to the development of the regulation.
Other relevant entities are: The Nature Agency under the Ministry for Environment, which is responsible for drinking water quality, and for the rules regarding which activities the companies can perform; the Ministry of the Environment, which is in charge of administrative and research tasks in the area of environmental protection and planning; and the Ministry of Business and Growth, which is responsible for a number of policy areas important for the general business environment, including business regulation, Intellectual Property Rights, competition and consumer policy, the financial sector and shipping. At regional and local level, much of the administrative responsibility has been delegated to municipalities.
Two benchmarking processes are in force in Denmark. The first, introduced by law, is mandatory and allows comparison of water utility performance to determine the efficiency penalty to apply to the growth rate of annual revenues. The growth rate is estimated by subtracting the efficiency penalty from the annual consumer price index. A DEA method is used to evaluate a firm’s potential for efficiency improvement: The so called “efficiency potential” is the percentage decrease in consumed input at constant output. The penalty on increment in revenues is directly proportional to efficiency potential.
Until 2011, prices were set applying the break-even principle: Water prices covered the costs of water protection, catchment, treatment, and distribution, and wastewater prices covered the costs of drainage, treatment, and discharge. Prices differed from area to area in relation to structural factors (e.g., population density, age of plants and geographical features) and political policies (e.g., investment choices and funding arrangements). In 2011, price caps were applied and since 2012 have been based on benchmarking results. This was to provide incentives for efficiency because companies that reduce their costs should make profits, even though such profits cannot be distributed but have to be reinvested in the sector, enhancing company consolidation [
36]. As in Portugal and The Netherlands, Denmark has to introduce competition into the water sector to enhance efficiency and quality [
37,
38]. To design this mandatory system, the Utility Secretariat is supported by the Danish Water and Waste Water Association (DANVA), which since 1999 has been conducting a second kind of benchmarking, involving more than a hundred of firms on a voluntary basis [
39]. Unlike the mandatory process, DANVA publishes much data on operating costs for water and wastewater services every year and other information on technical issues (energy consumed, volume treated, length of mains and sewers
etc.). The main aim of this voluntary benchmarking is to share experience among firms and improve their willingness and knowledge to do better.
4. Data and Method
4.1. Data Collected
A DANVA benchmarking report [
40] lists 101 Danish water utilities providing water services in Denmark in 2010. In that year, they supplied approximately 54% of the Danish population with drinking water and treated wastewater from approximately 65% of the population. Of these, 39 firms supplied only drinking water, while 44 provided wastewater transport and treatment services. The remaining 18 firms provided both services to their customers. Although the firms represent only 4% of Danish water utilities, they cover a large part of the country. The other 96% is made up of small firms, serving scattered villages and groups of houses, often organized as consumers’ cooperatives. Since their data is not publicly available, they were excluded from the study in favor of large, well corporatized water and wastewater utilities.
Data on the populations served, length of water mains and sewers, financial statistics, and annual sales volume was gathered for all companies. The financial data referred specifically to information on water and wastewater management: Production costs for groundwater protection, water catchment and treatment, distribution costs and customer handling costs in the case of water; transport costs, treatment costs and customer handling costs in the case of wastewater. All costs were expressed in Danish krone (DKK).
The dataset analyzed in this study consists of 606 data items on these 101 utilities.
Table 1 contains descriptive statistics, which reveal sharp differences in the sizes of the populations served. Small utilities provided services for only a few tens of kilometres and operated alongside well-structured firms that provided water services to thousands of inhabitants. This scale difference is also seen in the data on costs, with the minimum costs for the wastewater sector being smaller by a factor of 78 than the maximum costs.
Table 1.
Descriptive statistics of the sample observed.
Table 1.
Descriptive statistics of the sample observed.
| Firms Features | Max | Min | Mean | SD |
|---|
| Water Utilities (57 firms) |
| Operation costs (Danish krone–DKK) | 194,856,156 | 2,591,755 | 19,005,173 | 27,980,508 |
| Volume of water sold (m3) | 48,714,039 | 245,664 | 3,604,061 | 6,592,749 |
| Mains length (km) | 1460 | 49 | 466 | 352 |
| Population served | 533,875 | 4500 | 52,810 | 77,513 |
| Population density (pop./km of mains) | 545 | 30 | 123 | 101 |
| Wastewater Utilities (62 firms) |
| Operation costs (DKK) | 147,296,850 | 5,331,962 | 39,925,518 | 29,723,605 |
| Volume of water inflow (m3) | 11,812,097 | 626,287 | 3,113,549 | 2,026,060 |
| Sewer length (km) | 2496 | 55 | 819 | 494 |
| Population served | 533,875 | 8486 | 61,470 | 84,074 |
| Population density (pop/km of mains) | 3849 | 16 | 146 | 498 |
In comparison with other developed European countries, Denmark’s water and wastewater utilities are smaller, serve a smaller population, and operate in less dense areas. Notably, evidence from a study on Italy [
3] shows that in 2008, large Italian multi-utilities collected on average 138 million EUR in revenues, and served more than 1 million people in high density population areas (more than 182 inhabitants per km of mains). Thus, we set out to understand how the peculiarities of the Danish water sector affect firms’ efficiency.
To improve our knowledge of the sample observed, we divided this dataset into different groups according to three criteria. First, we categorized companies into clusters of mono- and multi-utilities. The former consisted of units that provided only water or wastewater services; the latter featured companies offering both services. Second, considering the ratio of the population serviced to kilometres of mains or sewers, we identified four groups of approximately equal size, based on their customer densities: Very high density (VHD), high density (HD), low density (LD), and very low density (VLD). Adopting the same criteria, we distinguished three groups of equal size (large, medium, and small firms) on the basis of population served.
Table 2 provides an overview of the clusters, along with their descriptive statistics. With respect to the size of water utilities, some firms are three to seven times smaller than others when measured by operational costs and volumes of water sold. Multi-utilities are larger than mono-utilities on all indicators, except volumes of water. However, the gap does not seem to be large. The VLD cluster includes firms with the widest mains networks that serve the smallest average populations. In terms of average volumes, VLD utilities provide approximately the same amount as LD utilities. The resulting high consumption per capita in VLD utilities is probably because they incur greater water losses than other clusters.
Table 2.
Main features of each cluster.
Table 2.
Main features of each cluster.
| Firms Features | Number of Firms | Average Operational Costs | Average Mains/ Sewer Length | Average Population Served | Average Volume of Water Sold |
|---|
| Water Utilities |
| Large | 19 | 37,908,394 | 707 | 107,905 | 7,479,694 |
| Medium | 19 | 12,744,045 | 468 | 35,509 | 2,211,968 |
| Small | 19 | 6,363,081 | 225 | 15,017 | 1,120,522 |
| Mono-utility (Water) | 39 | 18,596,037 | 444 | 50,664 | 3,612,553 |
| Multi-utility (Water & Wastewater) | 18 | 19,891,635 | 517 | 57,460 | 3,585,663 |
| Very high density | 14 | 32,582,171 | 338 | 93,966 | 6,493,163 |
| High density | 14 | 20,702,304 | 523 | 63,494 | 3,933,292 |
| Low density | 15 | 12,679,187 | 441 | 30,887 | 2,038,699 |
| Very low density | 14 | 10,508,886 | 568 | 24,459 | 2,062,903 |
| Wastewater Utilities |
| Large | 20 | 62,062,657 | 1,040 | 129,845 | 4,967,923 |
| Medium | 21 | 30,142,124 | 736 | 37,099 | 2,329,990 |
| Small | 21 | 31,564,325 | 711 | 17,466 | 2,232,819 |
| Mono-utility | 44 | 40,767,104 | 820 | 58,699 | 3,770,914 |
| Multi-utility | 18 | 42,397,987 | 816 | 67,937 | 4,042,910 |
| Very high density | 15 | 36,855,757 | 536 | 116,984 | 6,314,824 |
| High density | 15 | 56,762,420 | 1,080 | 77,028 | 4,345,716 |
| Low density | 16 | 27,278,274 | 725 | 31,036 | 1,983,021 |
| Very low density | 16 | 44,129,022 | 934 | 20,833 | 2,766,490 |
Among companies operating in the wastewater sector, the difference in size is even smaller than that recorded for the water sector: Large firms are twice the size of the smallest when measured in terms of operational costs, sewer length, and volumes of water sold in the sewer system catchment area. Similarly, there is almost no difference between mono- and multi-utilities. Finally, the VLD cluster shows a wide sewer network that serves the smallest average population.
4.2. The Data Envelopment Analysis (DEA) Model
To detect economies of scale, scope, and density in the Danish water industry, we applied atwo-stage method, based on DEA and regression analysis. Unlike previous research [
41], we did not use regression analysis solely as a control method to confirm the DEA results. Instead, after creating a ranking based on the DEA scores, we applied a regression model to determine the influences of the three independent variables (
i.e., customer density, degree of investment diversification and firm size). This two-stage method has previously been applied to study the water sector [
3,
42,
43,
44,
45,
46,
47].
As a non-parametric technique, DEA is used to determine a frontier and calculate an efficiency ratio for each unit. Through a linear programming approach, DEA identifies an efficient virtual producer for each unit; the efficiency ratio is the distance separating the virtual from the real unit. Charnes, Cooper and Rhodes [
48] used this linear programming method to build a production frontier, in which decision-making units (DMUs) can scale inputs and outputs linearly without any variation in efficiency. However, this assumption is valid only for a limited range of production, when all units operate on an optimal scale. Banker, Charnes amd Cooper [
49] therefore removed the constant return to scale (CRS) assumption and determined a scale effect (SE) and a pure technical efficiency VRSTE, which in combination yield a global efficiency index, CRSTE. Specifically, the VRSTE measures the real capacity of a company to purchase, mix, and consume inputs; Its SE indicates the effectiveness of the decision to operate at a certain production scale. To evaluate SE, we must consider the distance between the variable return scale (VRS) frontier and the CRS frontier for each DMU. In line with most DEA research [
1], we opted for the VRS assumption and thereby highlighted the real determinants of global efficiency in water utilities by distinguishing pure efficiency from scale efficiency.
If efficiency is the capacity to reduce the inputs consumed at a given level of output, we must choose the measures to use as inputs and outputs in the DEA model carefully. According to the data available in the 2011 DANVA benchmarking report, we considered two sets of inputs and outputs for the water and wastewater sectors. For the water sector, we used three inputs (production, distribution, and customer handling) and one output (namely volumes of water sold). For the wastewater sector, the inputs we used were transport, treatment, and customer handling costs, while the output measure was volumes of water settled in the sewer catchment area. This choice is quite consistent with mainstream literature [
1,
50] which usually identifies staff costs, operational expenditure, energy costs and mains length as input and the water or wastewater volume and customers served as output. The inclusion of costs among inputs makes it possible to observe the combined effect of any change in purchasing price and operational efficiency.
To solve the chosen linear programming model, we used DEAP Version 2.1, a freely downloadable software for efficiency analysis developed by the Centre for Efficiency and Productivity Analysis. With this software, users can define their own linear programming model by choosing a specific kind of return to scale (constant or variable), as well as the orientation toward input or output and the number of stages needed to solve the problem. We have already addressed the choice of the return to scale assumption; we discuss the other two aspects here.
Input-oriented models identify an efficiency improvement as a proportional reduction in the consumption of inputs with the same amount of outputs; output-oriented models view efficiency as an increase in the production of outputs, given a certain amount of input. Scholars use the output orientation model when the DMUs observed have a certain amount of resources and must maximize outputs; however, if DMUs need to produce a fixed level of output and yet aim to reduce their consumption of inputs, an input-oriented model is more appropriate. For water utilities, outputs (measured by cubic meters of water delivered, or by inhabitants served) remain fairly constant over time, but inputs depend on price fluctuations and internal efficiency. Therefore, most studies in this field and those listed in our literature review used input-oriented models [
1,
50].
For the current study we adopted the following linear programming model, assuming VRS and input orientation:
In the model, ф is the efficiency of firm j0m, λjxjm is the virtual DMU obtained combining input x consumed by the other DMUs with weights λ. The model verifies the possibility of identifying a virtual DMU for each firm, which produces the same amount of output but with a lower consumption of input. The second equation sets the output of the virtual DMU λjyjn greater or equal to those of the real firm yj0n. Finally, the equation setting the sum of weights λj equal to 1 admits a production frontier with variable return to scale.
Finally, we can choose between one- and multi-stage models. The efficient projected points determined by a one-stage DEA model [
48] may not comply with the criterion of Pareto optimality, in which case they should not be classified as efficient points—A problem due to the input/output slacks that arise when it is still possible to increase outputs or reduce inputs beyond an efficient projected point on the frontier. In response, in line with Coelli [
51], we adopted a multi-stage linear programming model that can set aside slacks and give a Pareto-optimal set of projected points.
4.3. Statistical Analysis
The final part of this section provides a description of the statistical analysis applied to DEA scores, in terms of CRSTE, VRSTE, and SE. Existing DEA studies seek to group DMUs using environmental and operational variables, such as geographical localization or size, to identify influences on efficiency [
3,
24,
42,
45,
52]. To achieve a similar objective, we conducted a statistical analysis to compare the means, medians, and variances of the DEA scores for the different clusters, whilst also applying non-parametric rank statistics. We assessed whether differences were statistically significant,
i.e., whether the variables used to group firms were determinants of performance. In so doing, we conducted an outlier detection process based on data normalization [
53]. More specifically, the environmental and operational continuous variables used to group firms and then to make inferences (on population served and population density) were normalized using mean value (μ) and standard deviation (σ) to obtain
z-scores. Outliers are cases associated with large standard
z-score values. Standardizing variables converts them to a standard deviation unit of measurement so that the distance from the mean for any case on any variable is expressed in comparable units. Thus, the
z-score of a raw score
x is determined as follows:
Outliers are observations whose
z-score exceeds a certain threshold chosen by the researcher. According to Stevens [
54], the
z-score cut-off depends on the number of items in the database. Since samples for water and wastewater sectors are between 50 and 100 units, the
z-score cut-off is 2.48 [
55]. With this threshold, three outliers were identified in the water sample and seven in the wastewater sample. After outlier detection and exclusion, both samples included 55 firms (38 water firms and 17 combined firms; 39 wastewater firms and 16 combined firms).
We then applied the Mann-Whitney test, Bartlett’s test, and
t-tests to find differences between the two clusters based on diversification (
i.e., mono- and multi-utilities). Bartlett’s test indicated differences across groupings based on size (small–medium–large) and density (VHD–HD–LD–VLD). Non-parametric rank statistics, such as the Mann-Whitney test, are particularly appropriate for testing DEA outcomes because the distribution of efficiency scores is generally unknown [
52].
Next we used a regression model to verify the findings of these tests and further explore the causal relationship. The model related each DEA score of both samples to three independent variables, namely:
- •
Size (SIZE), i.e., total population served, to reveal scale economies;
- •
Investment diversification (DID), a dummy variable that may correspond to the mono- or multi-utility cluster, such that it verifies the presence of economies of scope for the firms observed;
- •
Customer density (CD), i.e., population served per unit mains/sewer length, which indicates the presence of economies of density.
We ran the model three times, once for each DEA score (CRSTE, VRSTE and SE), as follows:
To avoid any multicollinearity problem the Pearson correlation index was estimated for continuous variables, such as SIZE and CD, while a chi-square test was used to observe any associations between the scope of operations (DID) and SIZE or CD. The correlation index between SIZE and CD was quite low (0.27 for the water and 0.36 for the wastewater sector), allowing us to include both independent variables in the regression function. Similarly there was no association between DID and SIZE or CD, except in the water sector.
Table 3 shows the results of chi square tests for both sectors.
Table 3.
Chi square test to detect associations between scope and size or density.
Table 3.
Chi square test to detect associations between scope and size or density.
| Segment Observed | Density | Size |
|---|
| Water sector | DID-CD: χ2 = 9.255 **; p-value = 0.026 | DID-SIZE: χ2 = 0.917; p-value = 0.63 |
| Wastewater sector | DID-CD: χ2 = 5.876; p-value = 0.11 | DID-SIZE: χ2 = 0.751; p-value = 0.68 |
Since the null hypothesis of independence between DID and CD for the water sector was rejected, two reduced models with only two variables were defined:
We chose a Tobit regression function because of its ability to describe the relationship between a non-negative dependent variable and independent variables. Scholars frequently associate Tobit functions with DEA models when studying performance across several industries because the dependent variable, measured by DEA scores, is constrained between 0 and 1 [
43,
56,
57,
58,
59,
60,
61].
This two-stage approach is not without critics [
62,
63]. DEA scores are expected to be correlated with each other, as the calculation of efficiency of one firm incorporates observation of all other firms. Thus, regression analysis cannot be robust with this multicollinearity problem. For this reason, a double bootstrapping technique can better reveal the impact of exogenous and operational variables on efficiency scores [
10,
64]. However, Banker and Natarajan [
65] demonstrated that two-stage DEA with ordinary least squares or Tobit outperforms one-stage parametric methods, such as translog and Cobb–Douglas, in defining the production frontier. Furthermore, a two-stage approach, such as the one used here, yields consistent estimators of the impact produced by environmental and operational variables on efficiency. Moreover, as highlighted by Marques, Berg and Shinji [
66] when using DEA, then adjusting for environmental variables is complex because of the imposition of separability conditions and depends on the correlation between the inputs and outputs and the exogenous features of the external environment. So, the Authors investigated the influence of exogenous variables (institutional and operational environment) by using a recently developed, robust technique [
66].
Despite criticism of the two-stage method, it offers an appropriate means to answer our research questions, considering its widespread prior use [
43,
45,
47,
67] as well as its effectiveness compared with alternative approaches, such as the one-stage parametric method [
65], OLS, the Papke–Wooldridge Method and the unit-inflated beta model [
68].
5. Results and Discussion
The efficiency scores for Danish utilities showed some remarkable differences between the water and wastewater sectors, as shown in
Figure 1 and
Figure 2. Danish water utilities are far from efficient and yet much more efficient than wastewater utilities.
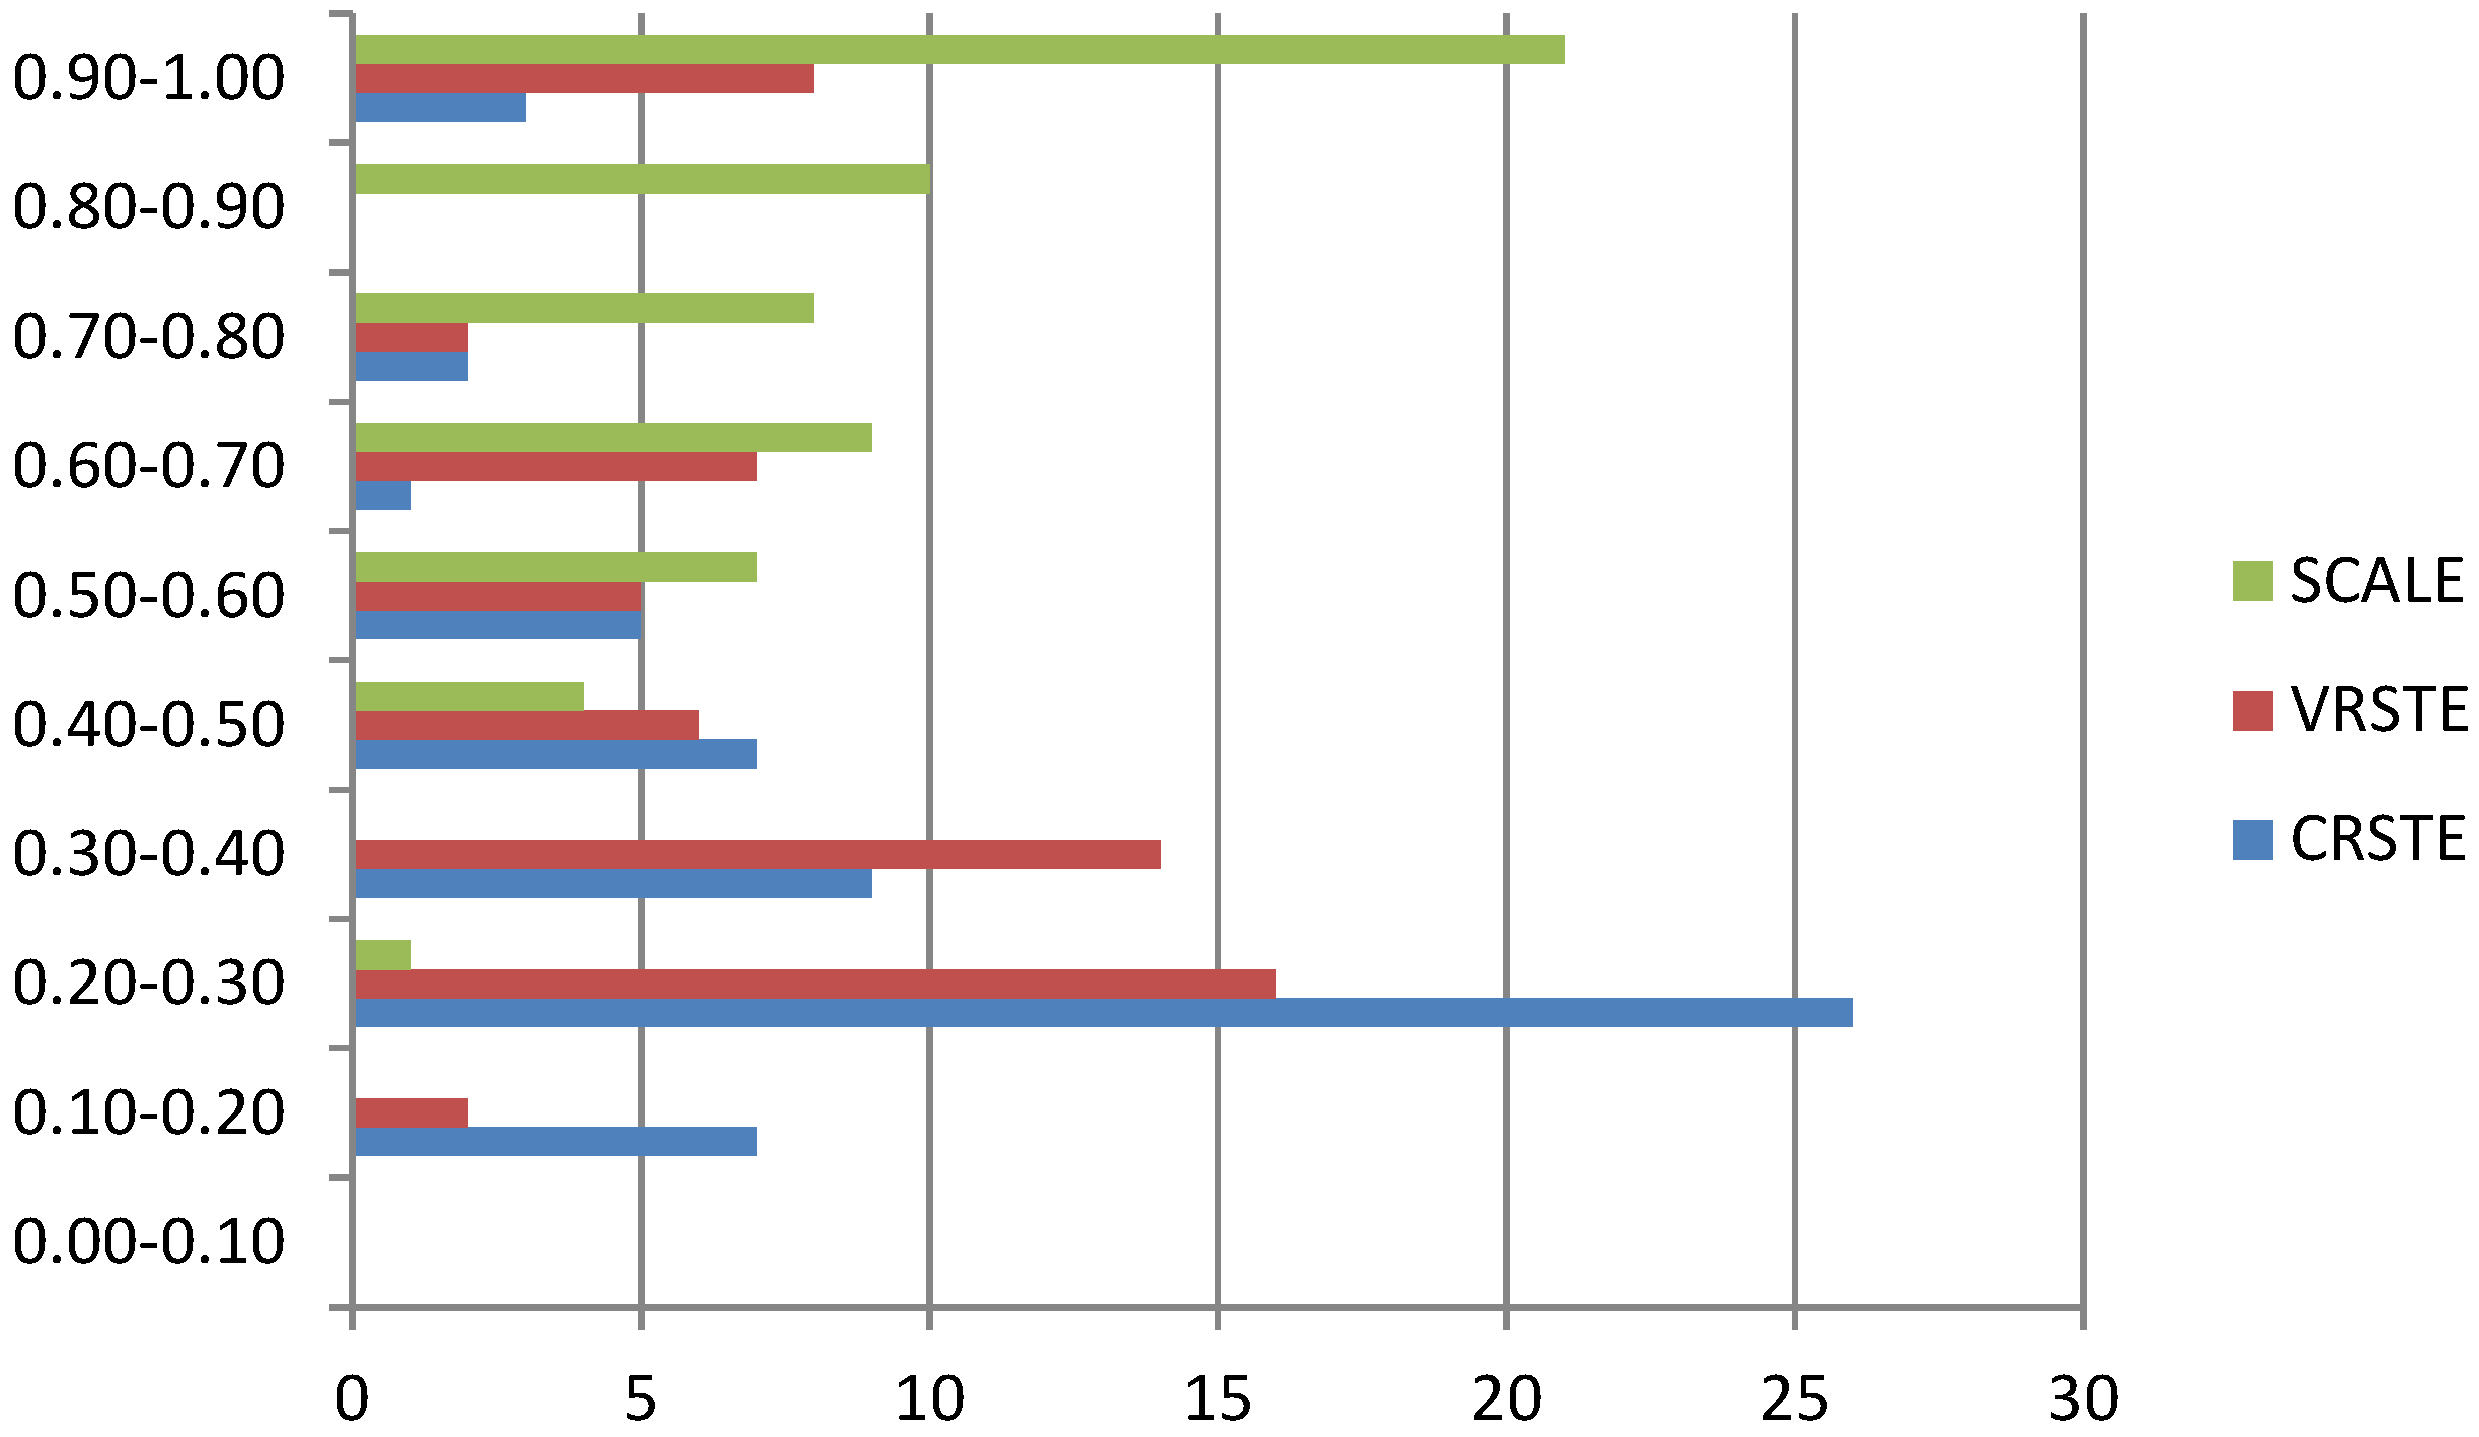
The average scores for water utilities are quite high (CRSTE 0.63; VRSTE 0.77; and SE 0.83). The results imply that, on average, Danish water firms could reduce the consumption of inputs by at least 37% (100%–63%) without any output decrease. The score of global efficiency is due to good capacities to purchase, mix and consume inputs and, above all, to the optimal scale of DMUs: 21 out of 57 Danish water firms (36%) are near the efficiency frontier according to VRS, as they achieve a VRSTE score between 0.9 and 1; 47% show a small distance between their own “best virtual producers” on VRS and CRS frontiers (see VRSTE and SCALE score distributions of
Figure 1).
Figure 1.
Efficiency distribution of Danish water utilities.
Figure 1.
Efficiency distribution of Danish water utilities.
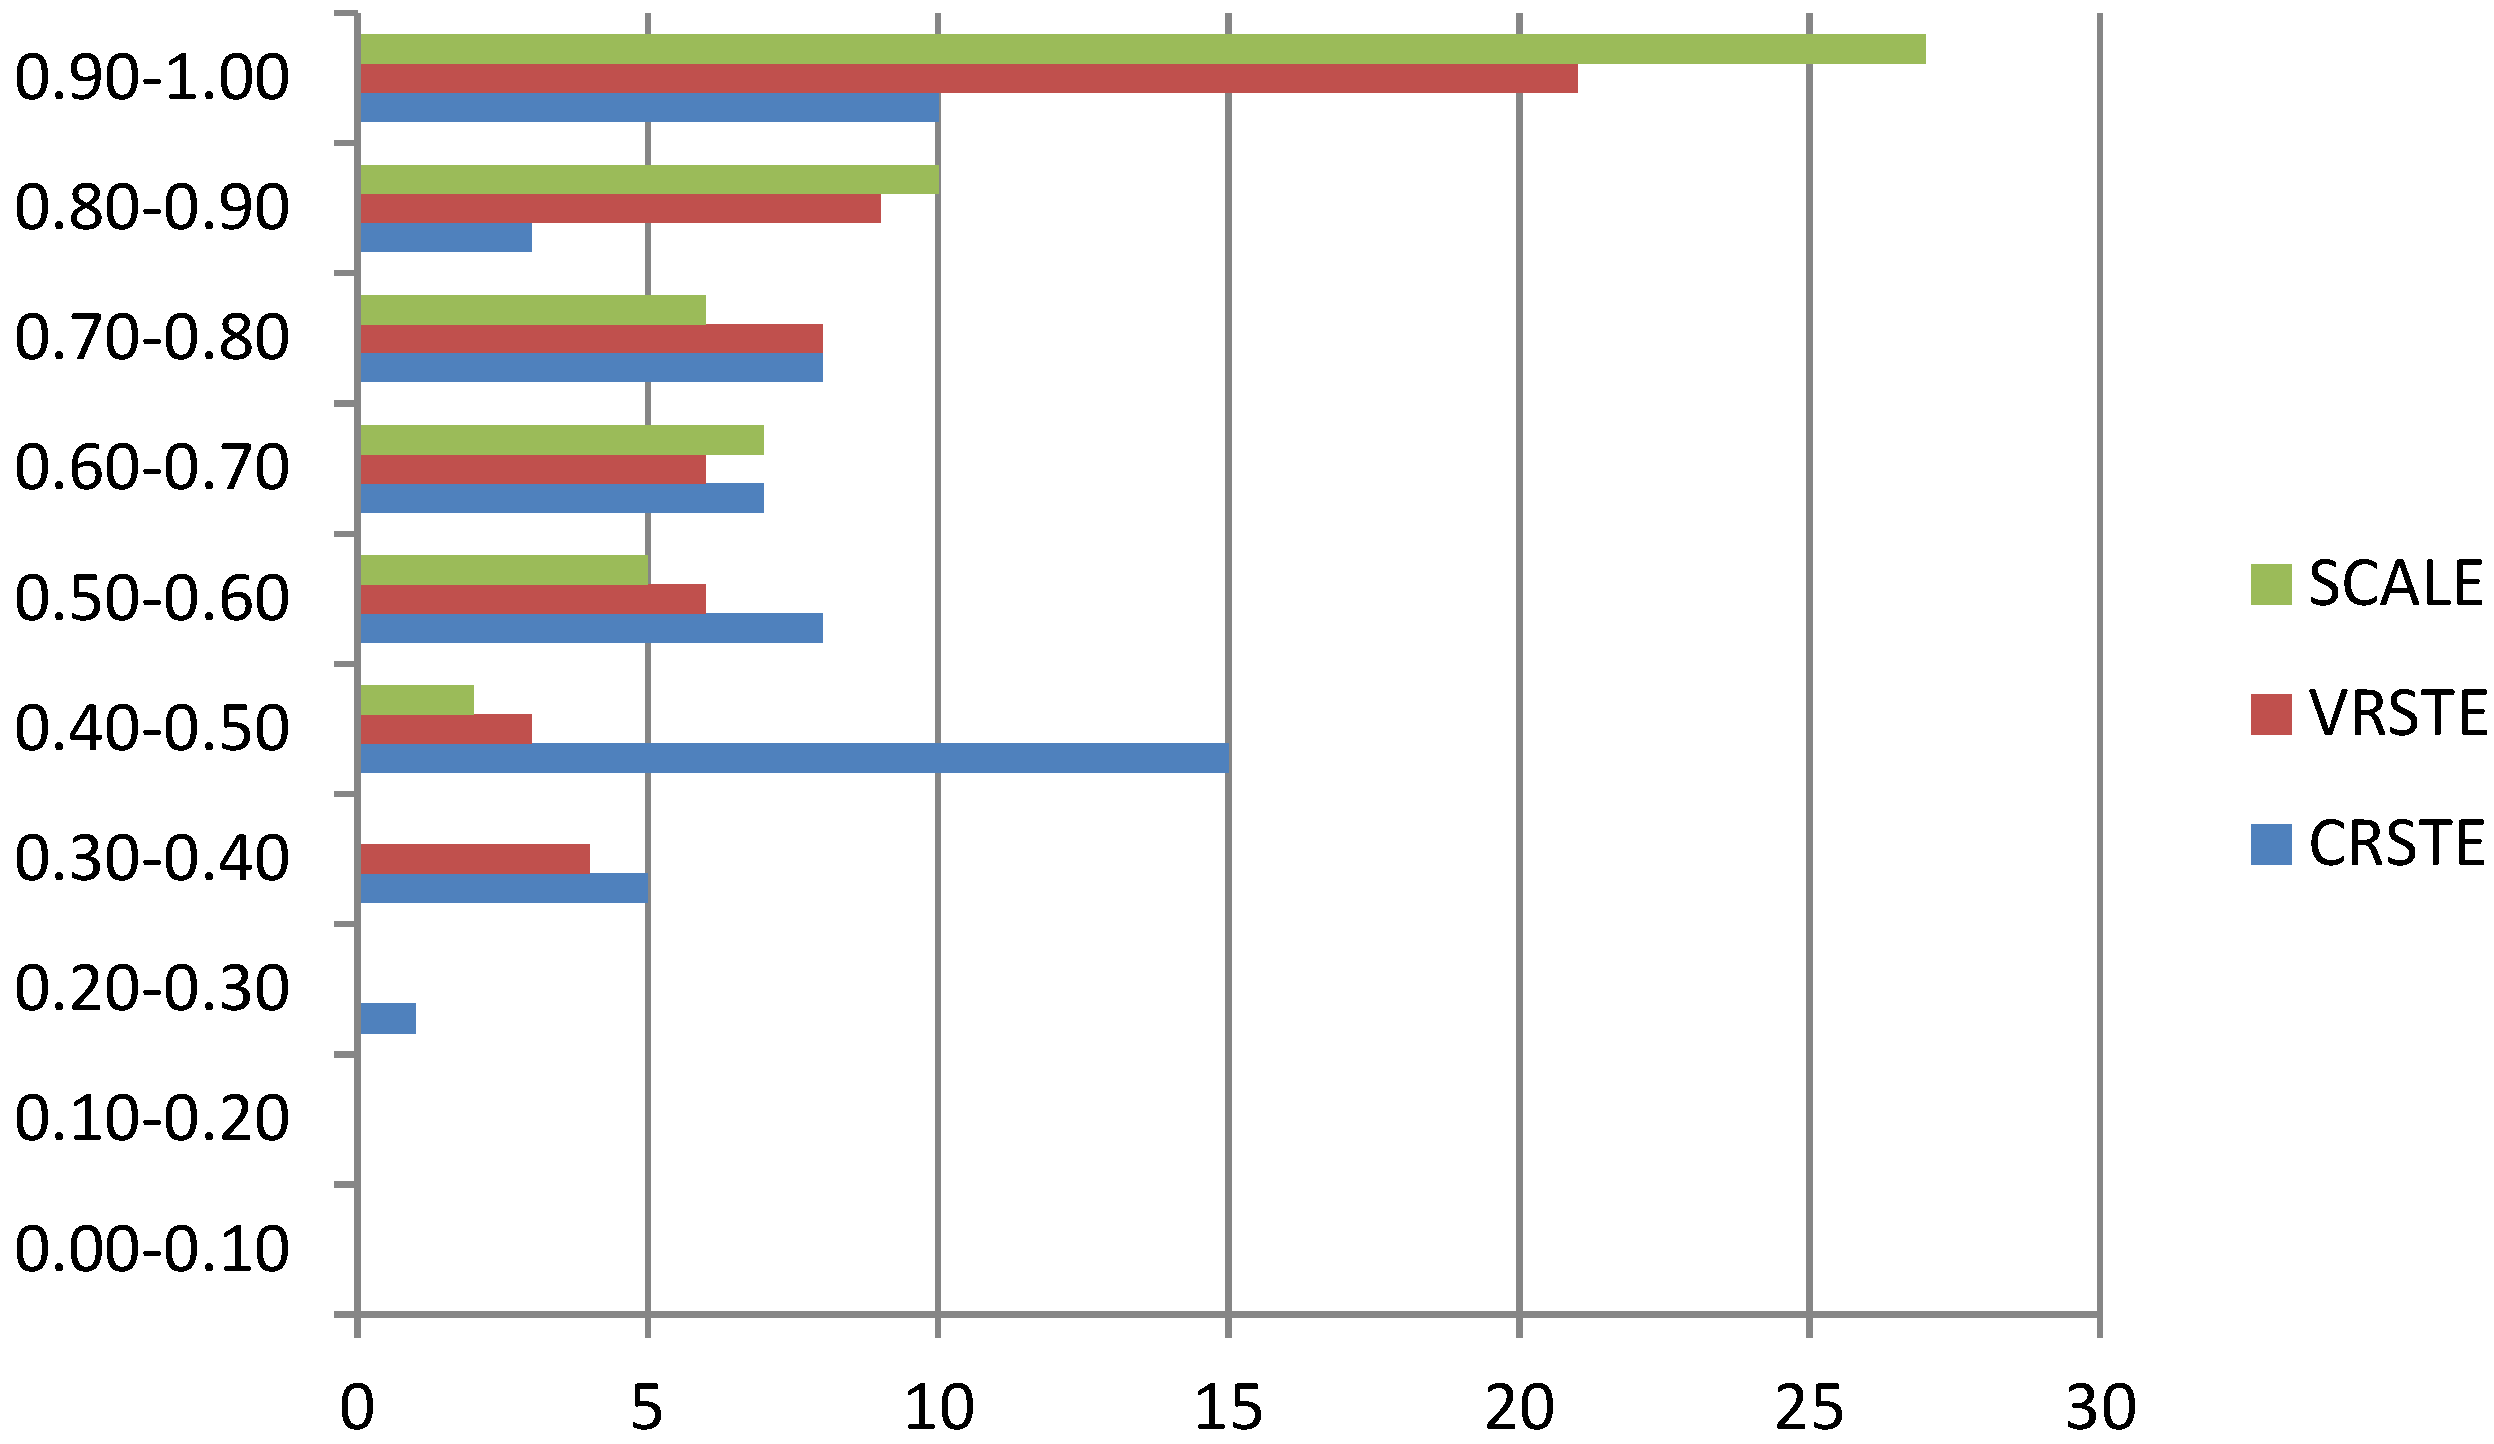
Wastewater utilities have the worst performance (CRSTE 0.36; VRSTE 0.48; and SE: 0.78) as shown by
Figure 2. In this sector, DMUs could reduce consumption of inputs by at least 64% (100%–36%) without any output decrease. Only 13% of firms operate near the VRS frontier, while the majority have a score between 0.20 and 0.40. These low scores of pure technical efficiency are only partially compensated by SE: The distance between the VRS and CRS frontiers (as measured by SE) is not so great, so that 35% of the observed DMUs operate at a potentially optimal scale.
Figure 2.
Efficiency distribution of Danish wastewater utilities.
Figure 2.
Efficiency distribution of Danish wastewater utilities.
These findings require further investigation to explain their real determinants. Thus we compared the CRSTE, VRSTE, and SE scores for clusters of utilities according to size, investment diversification and density. Using the Tobit regression model we then inferred the impact of these three variables on efficiency scores.
Table 4 shows the average global efficiency, pure technical efficiency and scale efficiency scores for clusters of the water sector: Differences between scores are not so great.
Table 4.
Data Envelopment Analysis (DEA) scores and differences across clusters in water sector.
Table 4.
Data Envelopment Analysis (DEA) scores and differences across clusters in water sector.
| Clusters Observed | CRSTE | VRSTE | SE |
|---|
| Size | | | |
| Large | 0.646 | 0.797 | 0.825 |
| Medium | 0.664 | 0.767 | 0.868 |
| Small | 0.612 | 0.746 | 0.829 |
| Bartlett’s test | 0.669 | 0.670 | 0.212 |
| Diversification | | | |
| Water & Wastewater | 0.600 | 0.80 | 0.765 |
| Water | 0.650 | 0.75 | 0.878 |
| Two sample t-test | 0.350 | 0.420 | 0.010 *** |
| Mann-Whitney test | 0.239 | 0.278 | 0.059 |
| Bartlett’s test | 0.444 | 0.382 | 0.008 *** |
| Density | | | |
| Very High Density | 0.592 | 0.745 | 0.806 |
| High Density | 0.687 | 0.821 | 0.844 |
| Low Density | 0.707 | 0.800 | 0.880 |
| Very Low Density | 0.564 | 0.704 | 0.827 |
| Bartlett’s test | 0.858 | 0.530 | 0.434 |
Large companies are most efficient in terms of technical pure efficiency (VRSTE), followed by medium and then small companies. In terms of SE, the ranking is partially reversed: Medium firms indicate the best organizational scale, followed by small and large firms. However, these differences are not statistically significant, since Bartlett’s test shows a p-value higher than 0.05. Regarding density, HD and LD clusters achieve a higher VRSTE and SE than VHD and VLD firms; but also in this case the differences are not significant. This evidence suggests a scarce impact of size and density on water utilities’ efficiency. This should be verified with the regression model, illustrated later.
Likewise investment diversification does not appear significant when its effects are measured in terms of global and technical pure efficiency. Quite clear and robust evidence is obtained only for SE, since two out of three tests show a p-value lower than 0.05. The mono-utility cluster obtains higher scores than the multi-utility cluster and seems to achieve a better scale of operations. In a robustness check, these results are compared to those of the regression model, as discussed later in this section.
Table 5 provides average DEA scores for clusters of the wastewater sector. In this case, unlike the water sector, the scores show larger differences. Size exerts a notable effect on two measures of efficiency: CRSTE and SE. Large companies are most efficient in terms of global efficiency, followed by medium and then small companies. Since CRSTE is given by the joint effect of VRSTE and SE, the leading performance of the large cluster is derived from its scale efficiency: Firms serving more than about 50,000 inhabitants are closer to their optimal scale than others: This allows efficiency improvements. In addition, investment diversification appears to have a significant effect on efficiency. The multi-utility cluster obtains higher scores than the mono-utility cluster when CRSTE is measured. Technical pure efficiency and scale efficiency are higher for multi-utility, but not significantly. Using a regression function, we ran a robustness check on these results to verify the presence of economies of scope.
Table 5.
DEA scores and differences across clusters in wastewater sector.
Table 5.
DEA scores and differences across clusters in wastewater sector.
| Clusters Observed | CRSTE | VRSTE | SE |
|---|
| Size |
| Large | 0.392 | 0.436 | 0.920 |
| Medium | 0.365 | 0.486 | 0.749 |
| Small | 0.279 | 0.470 | 0.672 |
| Bartlett’s test | 0.001 *** | 0.924 | 0.002 *** |
| Diversification |
| Water & Wastewater | 0.423 | 0.515 | 0.826 |
| Wastewater | 0.309 | 0.445 | 0.751 |
| Two sample t-test | 0.032 ** | 0.304 | 0.181 |
| Mann-Whitney test | 0.019 ** | 0.196 | 0.165 |
| Bartlett’s test | 0.068 | 0.941 | 0.514 |
| Density |
| Very high density | 0.609 | 0.473 | 0.832 |
| High density | 0.285 | 0.359 | 0.839 |
| Low density | 0.286 | 0.479 | 0.630 |
| Very low density | 0.246 | 0.337 | 0.804 |
| Bartlett’s test | 0.000 *** | 0.047 ** | 0.973 |
Finally, population density per kilometre of sewer offers clear evidence: Utilities operating in VHD regions are more efficient by CRESTE and VRSTE. That is, economies of density help reduce costs for purchasing, combining, and consuming input.
To confirm these results of the preliminary tests, we ran a regression model.
Table 6 and
Table 7 show the estimators of each function and its related
p-value for the water and wastewater sectors.
Table 6.
Regression analysis in water sector.
Table 6.
Regression analysis in water sector.
| Models Adopted | CRSTE | p > t | VRSTE | p > t | SE | p > t |
|---|
| Tobit Regression | | | | | | |
| Size | 0.009 | 0.845 | 0.076 | 0.391 | −0.032 | 0.412 |
| Water &Wastewater | −0.063 | 0.448 | 0.096 | 0.349 | −0.108 | 0.075 * |
| Density | 0.243 | 0.602 | −0.013 | 0.983 | 0.151 | 0.656 |
| Pseudo R2 | 0.056 | | 0.048 | | −0.297 | |
| Reduced Model (3) | | | | | | |
| Size | 0.000 | 0.968 | 0.000 | 0.377 | −0.000 | 0.332 |
| Density | 0.0001 | 0.760 | 0.0001 | 0.843 | −0.000 | 0.985 |
| Pseudo R2 | 0.006 | | 0.022 | | −0.05 | |
| Reduced Model (4) | | | | | | |
| Size | 0.000 | 0.816 | 0.000 | 0.471 | −0.000 | 0.603 |
| Water &Wastewater | −0.056 | 0.425 | 0.096 | 0.284 | −0.104 | 0.034 ** |
| Pseudo R2 | 0.041 | | 0.048 | | −0.287 | |
Table 7.
Regression analysis in wastewater sector.
Table 7.
Regression analysis in wastewater sector.
| Tobit Regression | CRSTE | p > t | VRSTE | p > t | SE | p > t |
|---|
| Size | −0.047 | 0.145 | −0.271 | 0.001 *** | 0.237 | 0.002 *** |
| Water &Wastewater | 0.091 | 0.079 * | −0.007 | 0.874 | 0.061 | 0.226 |
| Density | 1.17 | 0.003 *** | 3.29 | 0.000 *** | −0.165 | 0.267 |
| Pseudo R2 | −1.45 | | 1.59 | | −0.81 | |
Results for the water sector are not statistically significant. We can therefore argue that the environmental and operational variables observed do not influence water firms’ efficiency. Thus, small firms serving few customers in wide and not densely populated areas, such as the northern areas of the country, achieve the same efficiency score as large companies operating in densely inhabited cities. This result is consistent with Anwandter and Ozuna [
42], who did not find any density effects on the efficiency of Mexican water utilities.
Furthermore, firms that provide both water and wastewater services do not achieve any cost economies compared with those that distribute only drinkable water. On the basis of VRSTE and CRSTE, economies or diseconomies of scope do not arise; by contrast, on the basis of SE, there are some potential benefits for water utilities compared to water and wastewater firms, but these benefits have no impact on firm global efficiency.
With regard to the wastewater sector, the regression model confirms four out of five results from prior tests. Large firms have an optimal scale but their performance is worse than the sample average for purchasing, combining, and consuming inputs to transport and treat a cubic meter of wastewater (VRSTE). This is confirmed by the negative estimator for SIZE when VRSTE is regressed: The high significance shows diseconomies of scale for pure technical efficiency in the wastewater sector. This evidence contrasts with research demonstrating economies of scale in water and/or wastewater sectors, at least to a certain threshold [
22,
30,
69,
70,
71,
72]. For Italy, Romano and Guerrini [
24] found that firms serving more than 50,000 customers achieve better performance than those serving a smaller population. However, no such evidence was found for Denmark, probably because of its smaller firms. Compared with Italy, Danish water and wastewater utilities serve on average 52,000–62,000 customers, respectively, while Italian utilities serve on average more than 400,000 inhabitants [
3]. In summary, a growth strategy might be beneficial for Danish utilities, but their small size makes it impossible for us to observe the likely benefits of adopting this strategy.
Economies of scope seem to boost the performance of utilities operating in the wastewater business, with the regression model confirming the results from prior tests. This evidence is in line with the literature, which demonstrates the presence of economies of scope, and specifically with Fraquelli and Giandrone [
73], which demonstrates that significant cost savings are associated with vertically integrated structures of water supply and wastewater collection and treatment.
Finally, the statistical analysis confirms the results of prior tests involving customer density; wastewater utilities that operate in VHD areas achieve high pure technical and global efficiencies. In line with previous literature that considered various countries [
6,
16,
45,
67,
69,
72,
74,
75], we find that economies of density also characterize the Danish water industry, but only when the wastewater sector is studied.
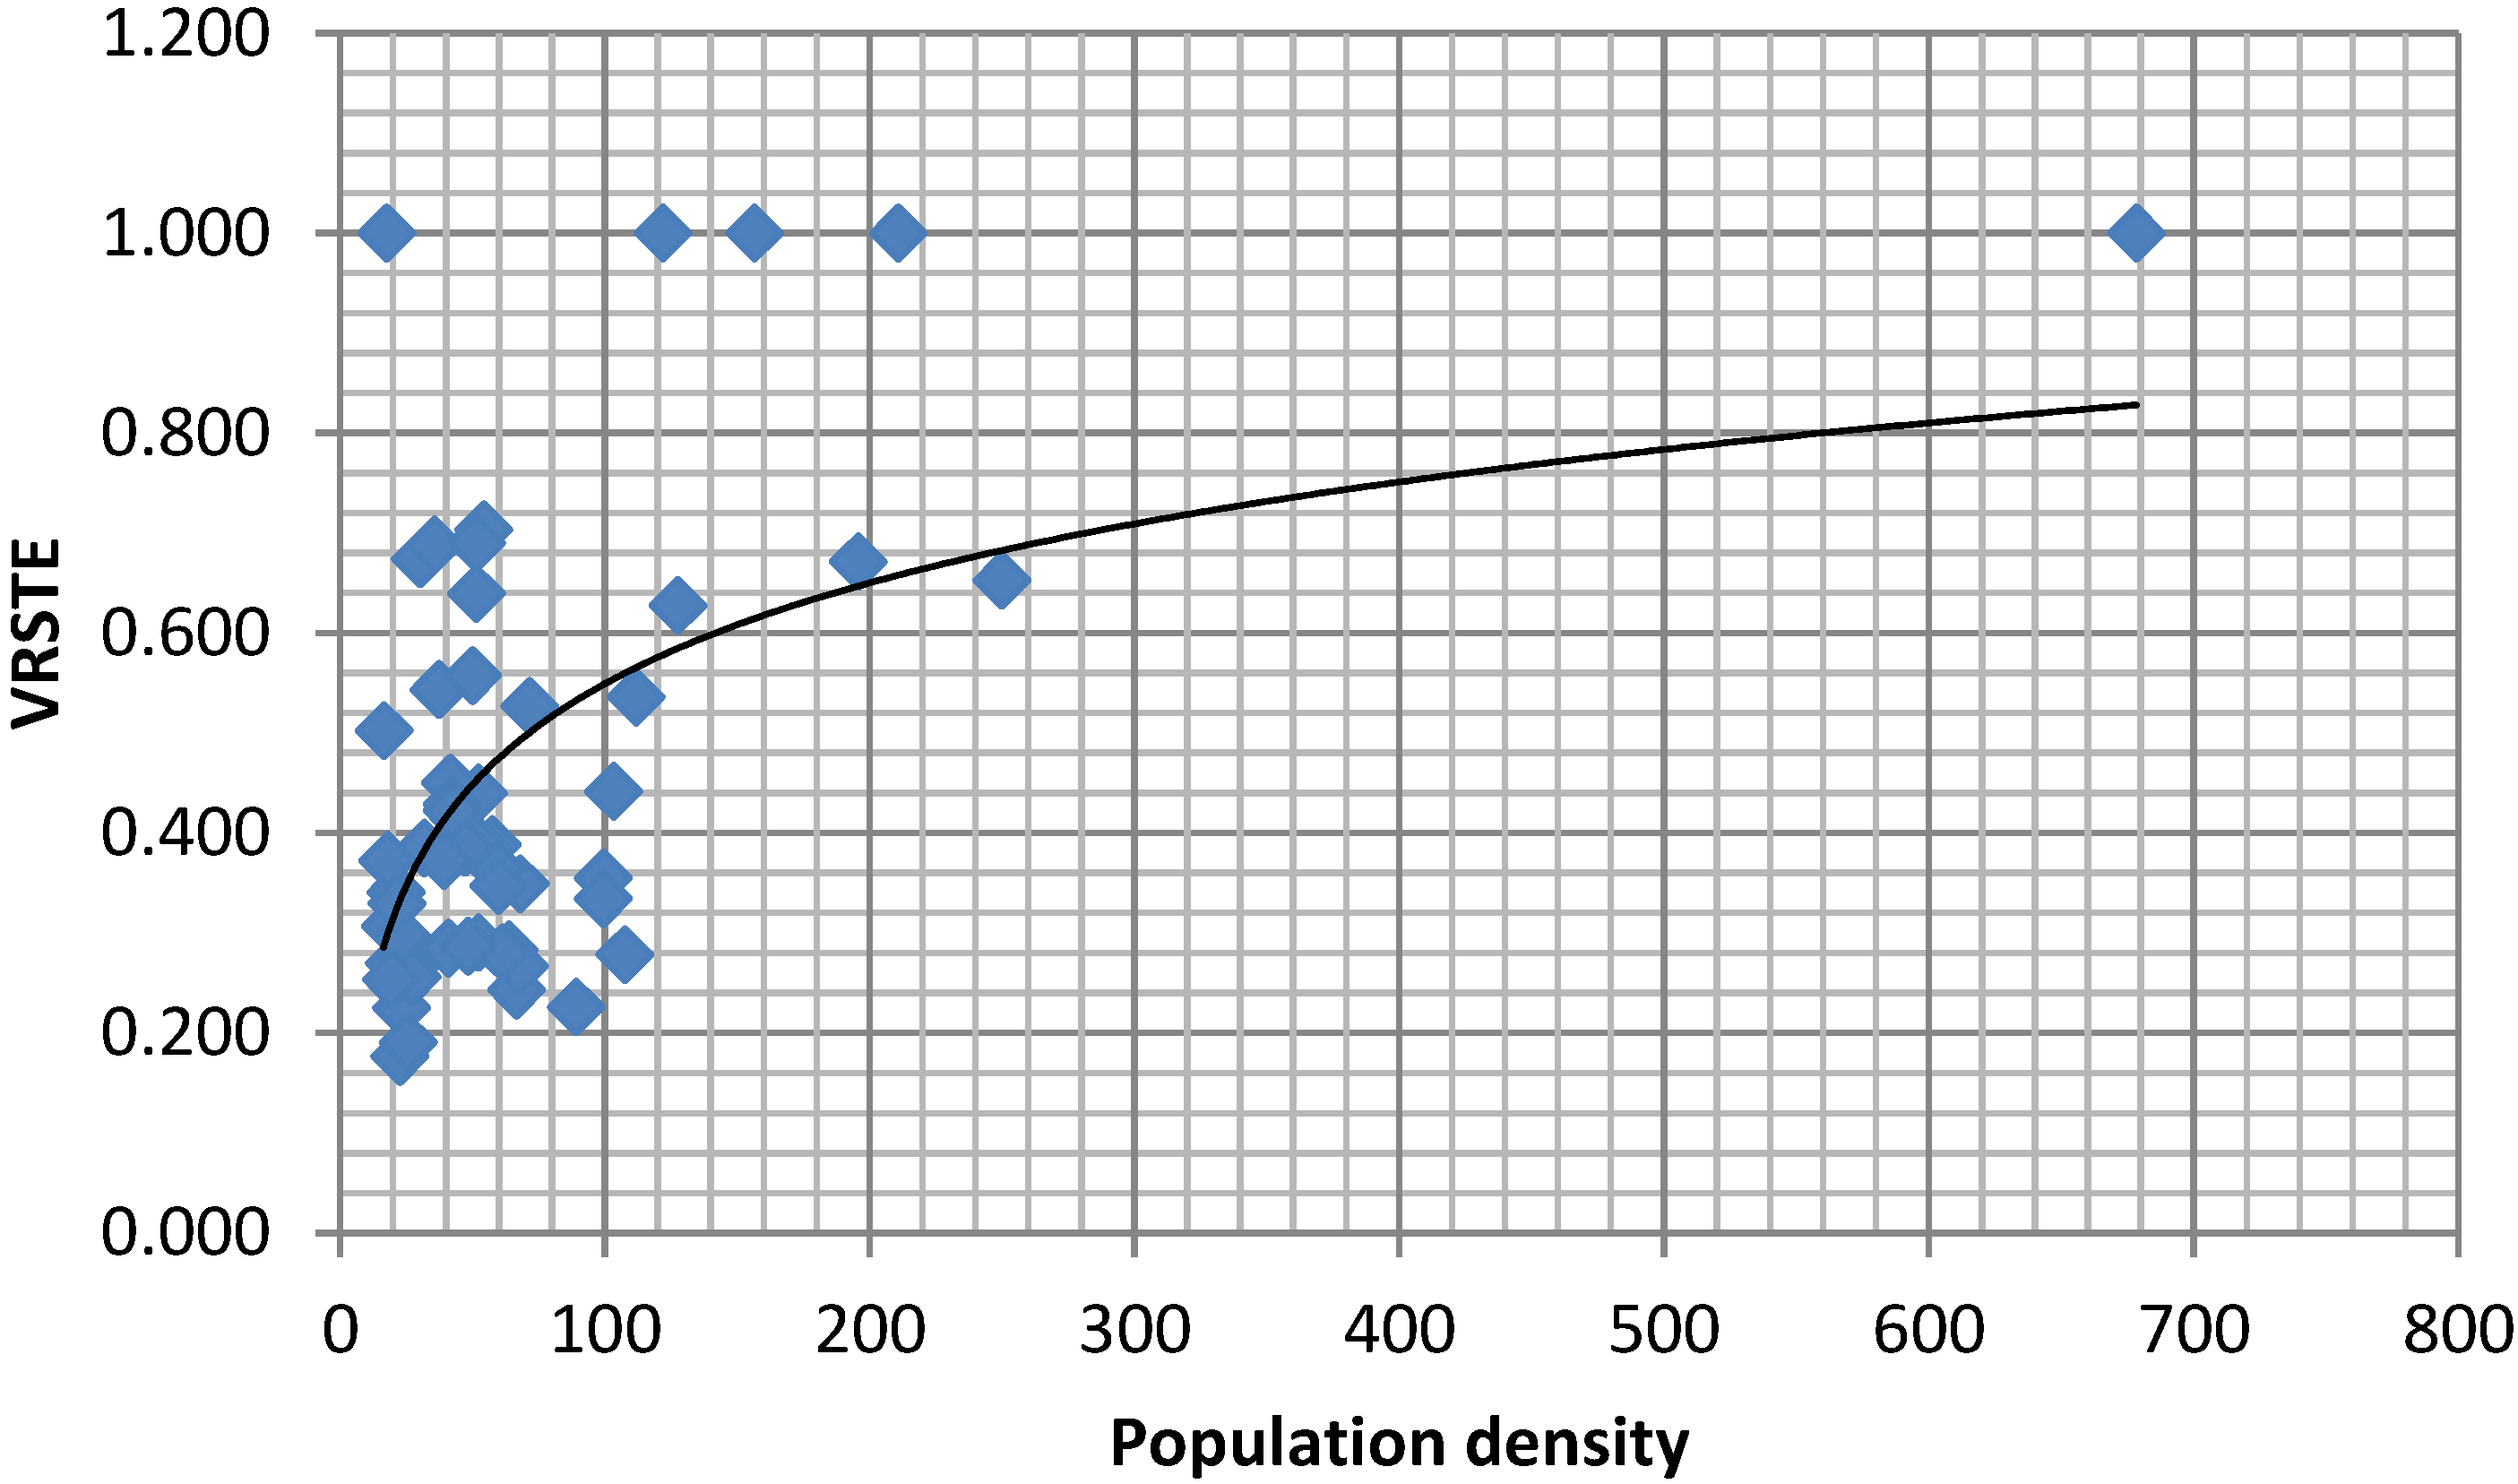
Figure 3 shows the relationship between population density and VRSTE. Severe diseconomies appear for DMUs that serve areas with less than 40–50 inhabitants per km of sewers; beyond this threshold, the efficiency progressively decreases.
Figure 3.
The relationship between population density and VRSTE.
Figure 3.
The relationship between population density and VRSTE.
6. Conclusions
This study addressed the performance of water utilities with the aim of contributing to ongoing debate about the most efficient way to organize and manage such firms. We measured performance of Danish water utilities by combined DEA and regression analysis. Data on water and wastewater sectors was collected separately in order to investigate the effects of operational and environmental variables in each sector.
The analyses highlighted significant differences in efficiency across firms involved in wastewater treatment grouped by operational scale, investment diversification, and customer density; no such evidence emerged in the case of firms managing water services. Firms that served more than 100 inhabitants per km of sewers (those in the VHD cluster) achieved the best global efficiency and showed good capacity to purchase, combine, and consume inputs in treating a cubic meter of wastewater. Nevertheless, approximately 47% of firms operated under the critical threshold of 40–50 inhabitants per km of sewer and achieved low performance. This evidence suggests that mini treatment plants serving small groups of houses in sparsely populated areas could be incentivized instead of providing wastewater transportation and treatment services, thus reducing operating costs.
Since the policy of most Danish municipalities to keep water and wastewater services separate penalizes performance, integration of the two services should be promoted through information campaigns and incentives for utilities that do not integrate vertically.
Finally, utility size exerts opposite effects on two efficiency scores (SE and VRSTE) that neutralize each other when global efficiency is considered. Large firms achieve optimal structure, while pure technical efficiency decreases when the scale of operations expands. This implies that extending the area served by wastewater utilities (such as by covering new areas or merging with other companies) does not necessarily yield cost savings.
Further studies over a longer period are required to confirm these results. Other technical factors that could affect firms’ performance should also be monitored, including information on investments, frequency of burst pipes, mains and sewer replacement rates, water losses, and water sources.


