
Determination of Algae and Macrophyte Species Distribution in Three Wastewater Stabilization Ponds Using Metagenomics Analysis

Abstract
:1. Introduction
2. Materials and Methods (or Experimental)
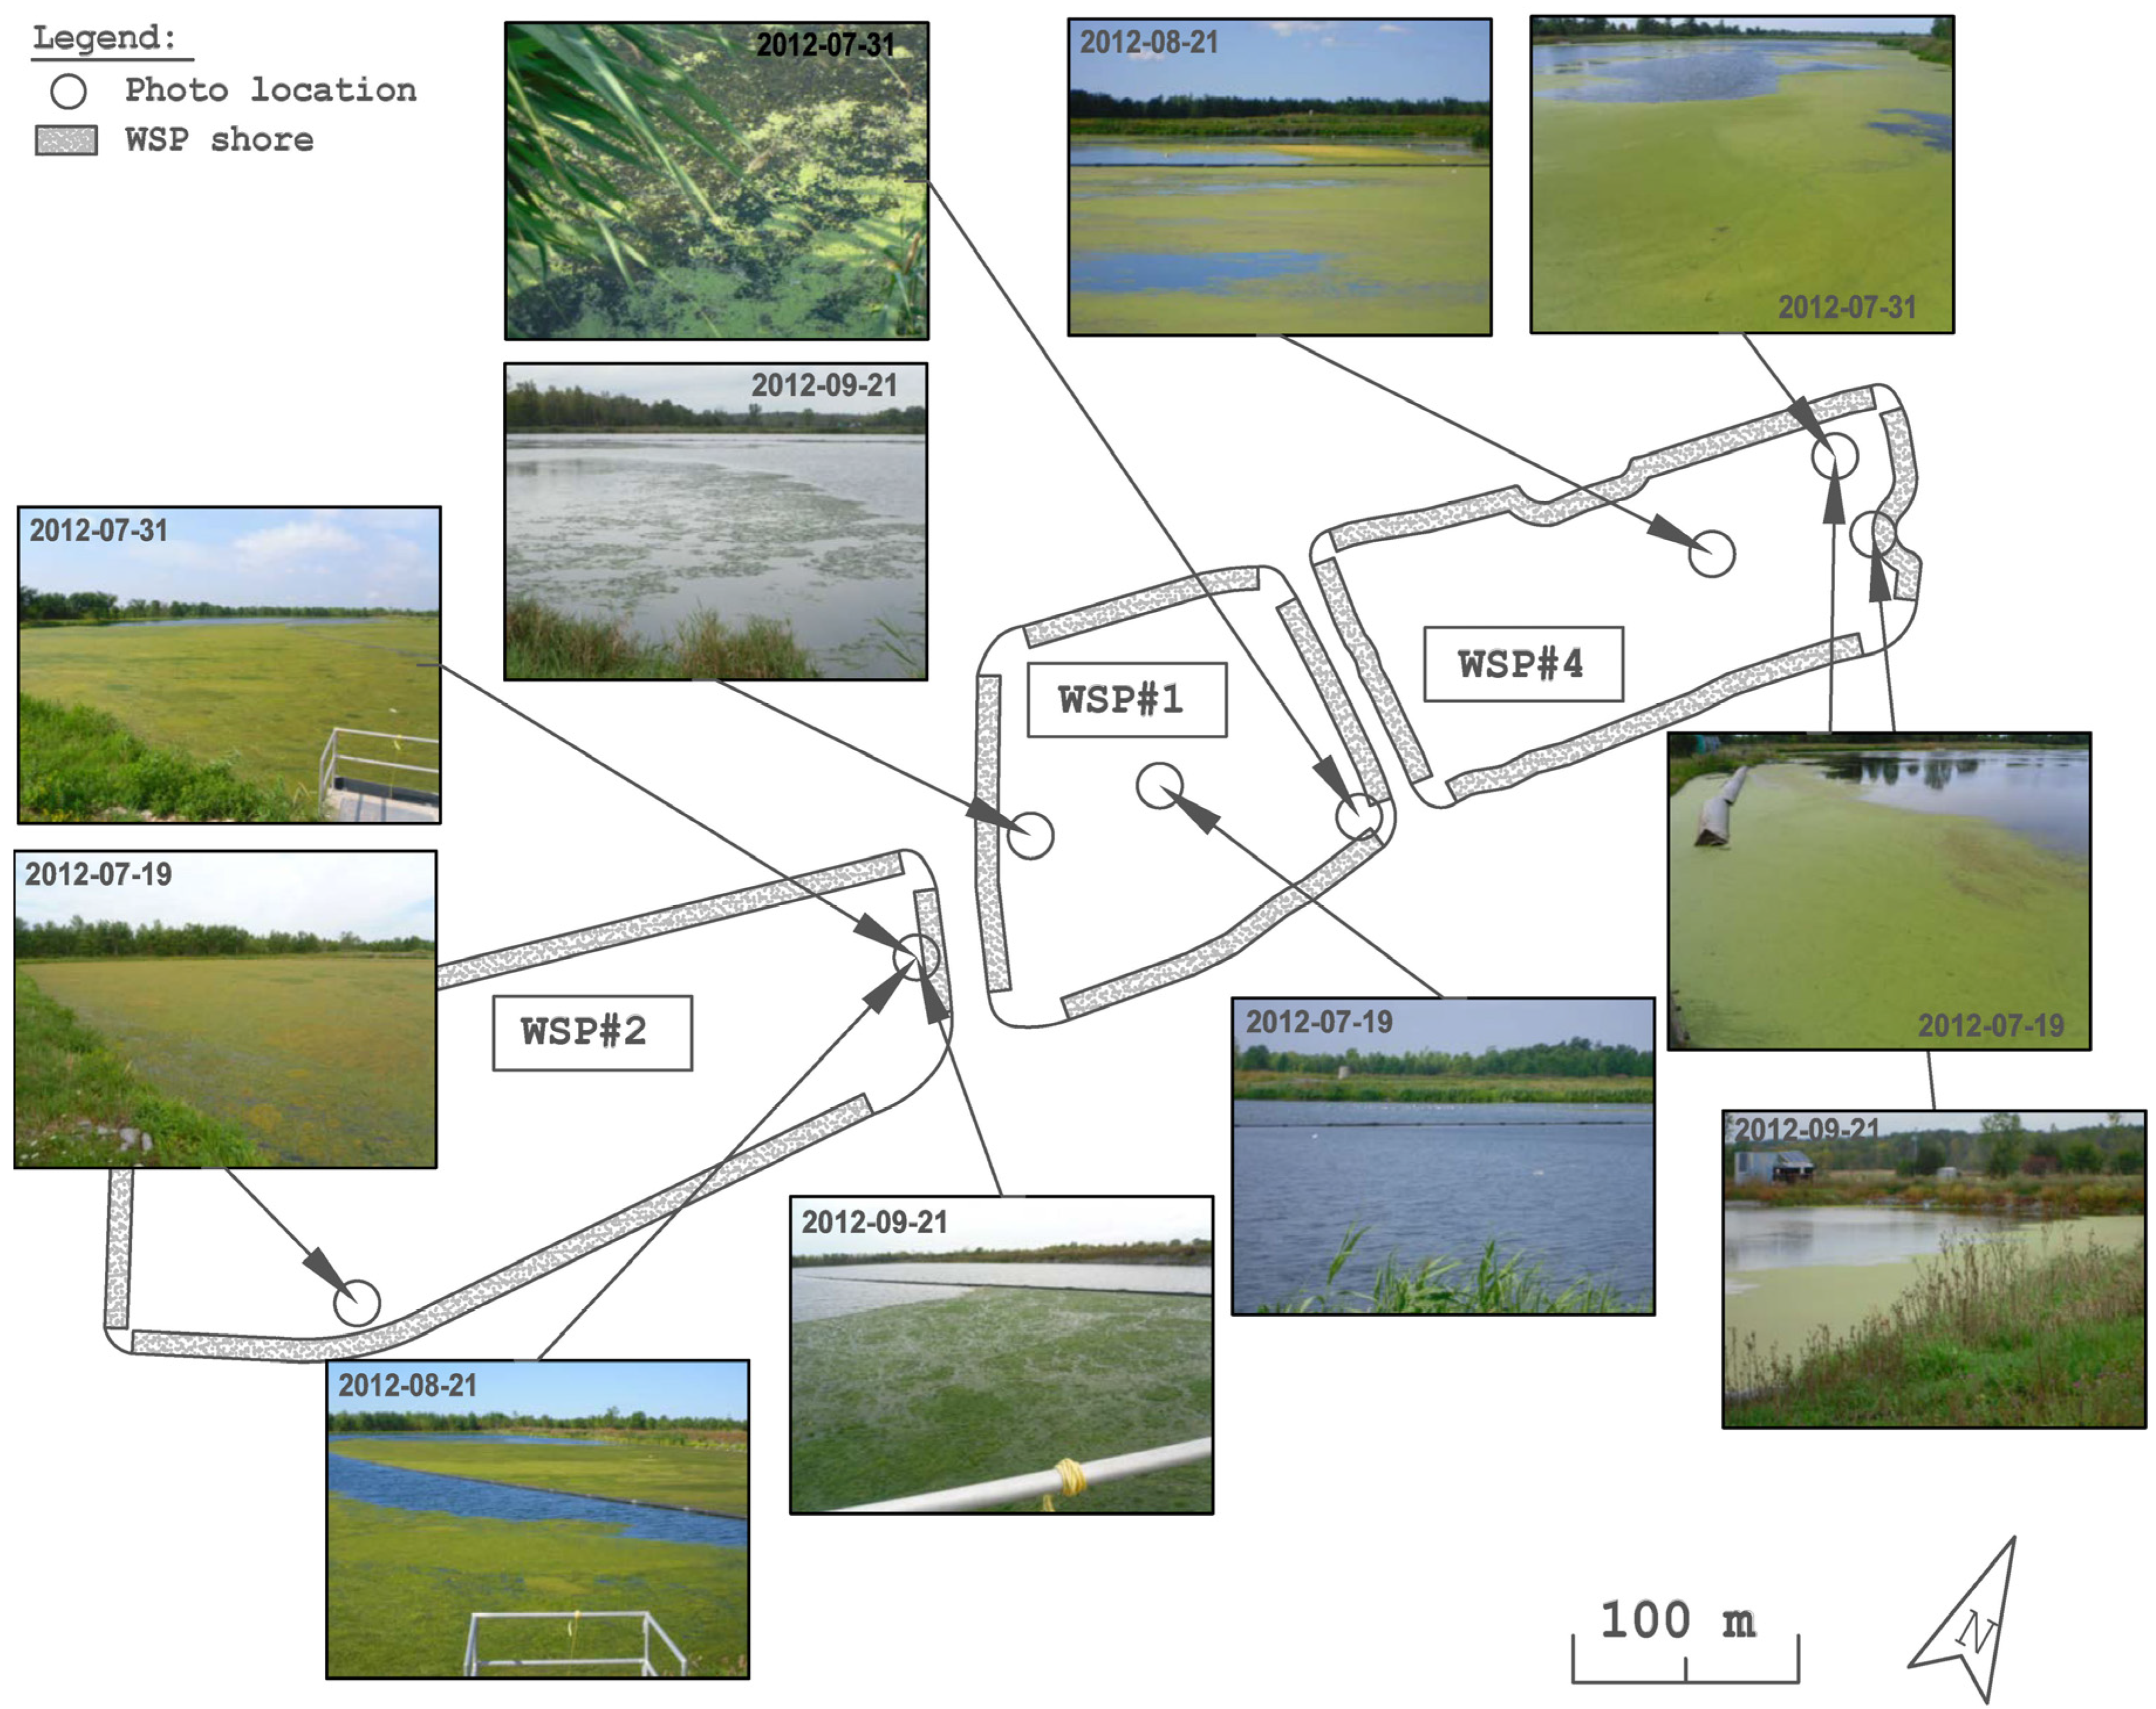
2.1. System Overview

| WSP | Surface Area (m2) | Volume (m3) | Depth (m) |
|---|---|---|---|
| 2 | 48,600 | 78,246 | 1.61 |
| 1 | 28,200 | 40,044 | 1.42 |
| 4 | 31,200 | 36,504 | 1.17 |
| Total | 108,000 | 154,794 | 4.2 |
2.2. Field Sampling and Chemical Analysis
| Primer | Sequence |
|---|---|
| Forward—A18s-P47 (barcodes 1–10) | 5'-TCTCAGGCTCCCTCTCCGGA-3' |
| Reverse—A18s-P73 | 5'-AATCAGTTATAGTTTATTTGRTGGTACC-3' |
| Temperature | Time Period | Cycles |
|---|---|---|
| 94 °C | 5 min | 1 |
| 94 °C | 30 s | 15–26 |
| 55 °C | 30 s | 15–26 |
| 72 °C | 30 s | 15–26 |
| 72 °C | 5 min | 1 |
| 4 °C | To end of PCR | 1 |
2.3. Water Chemistry
2.4. Statistical Analysis
3. Results
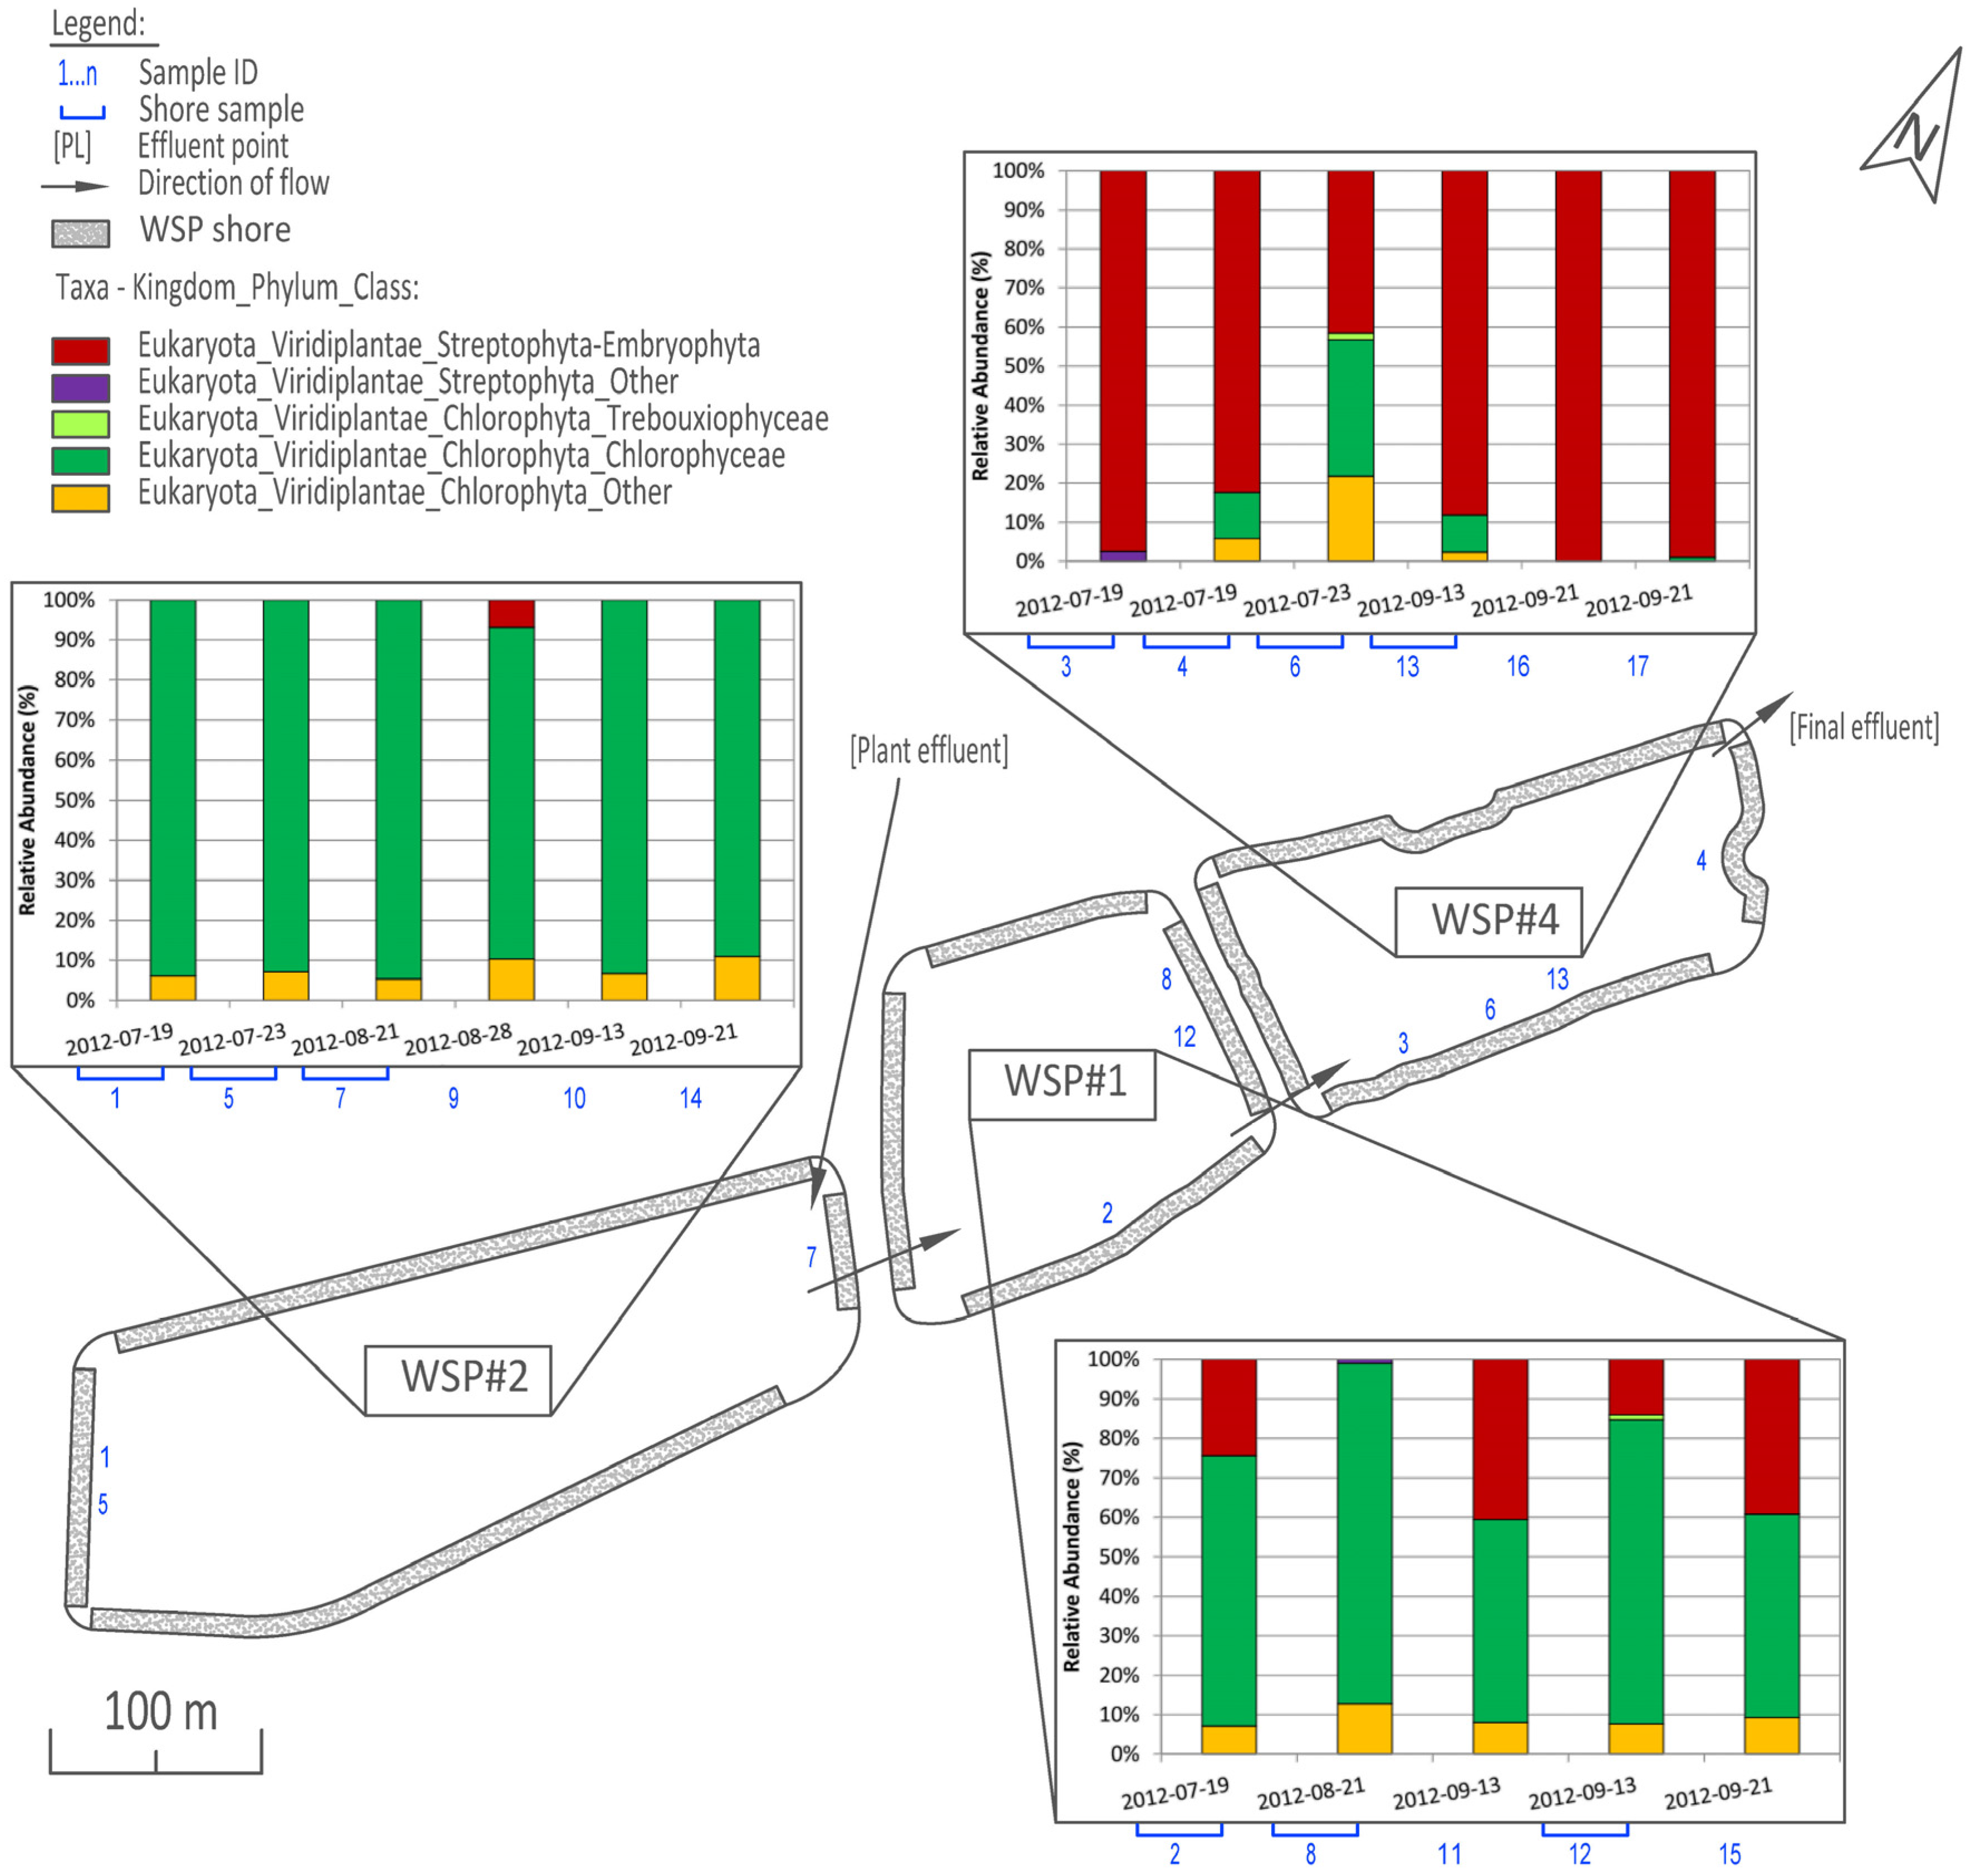
3.1. Distribution and Abundance
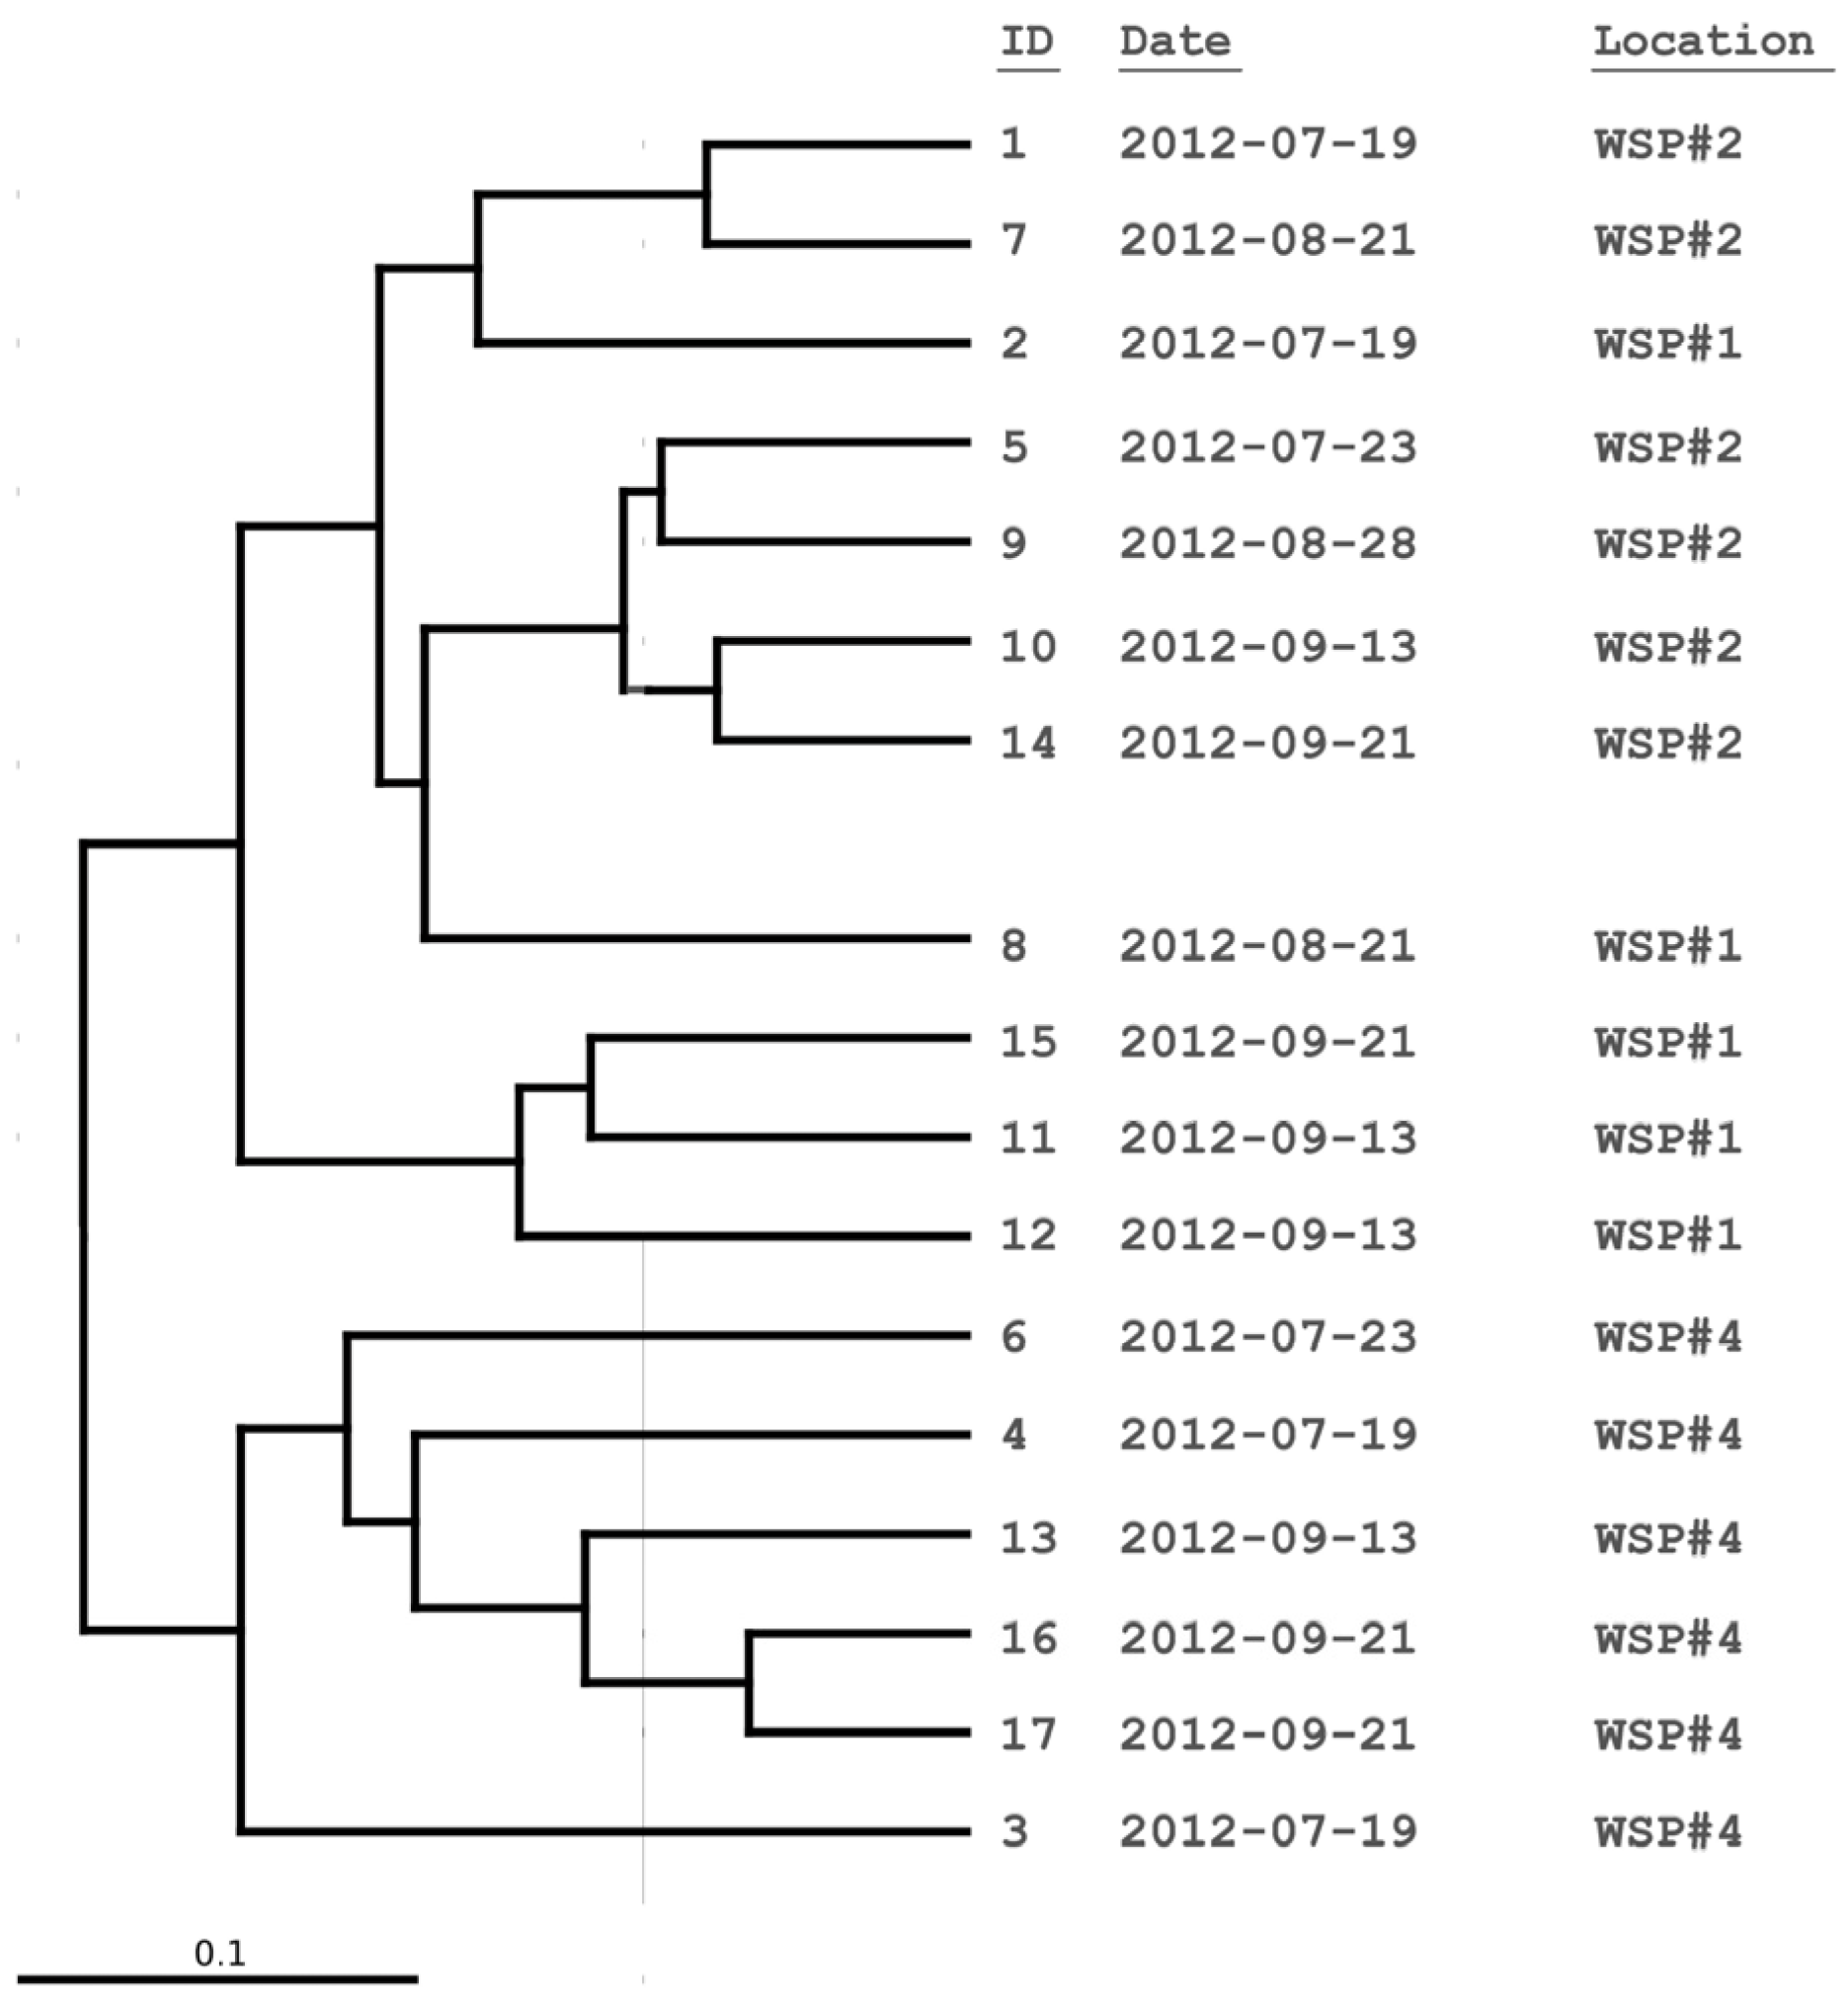
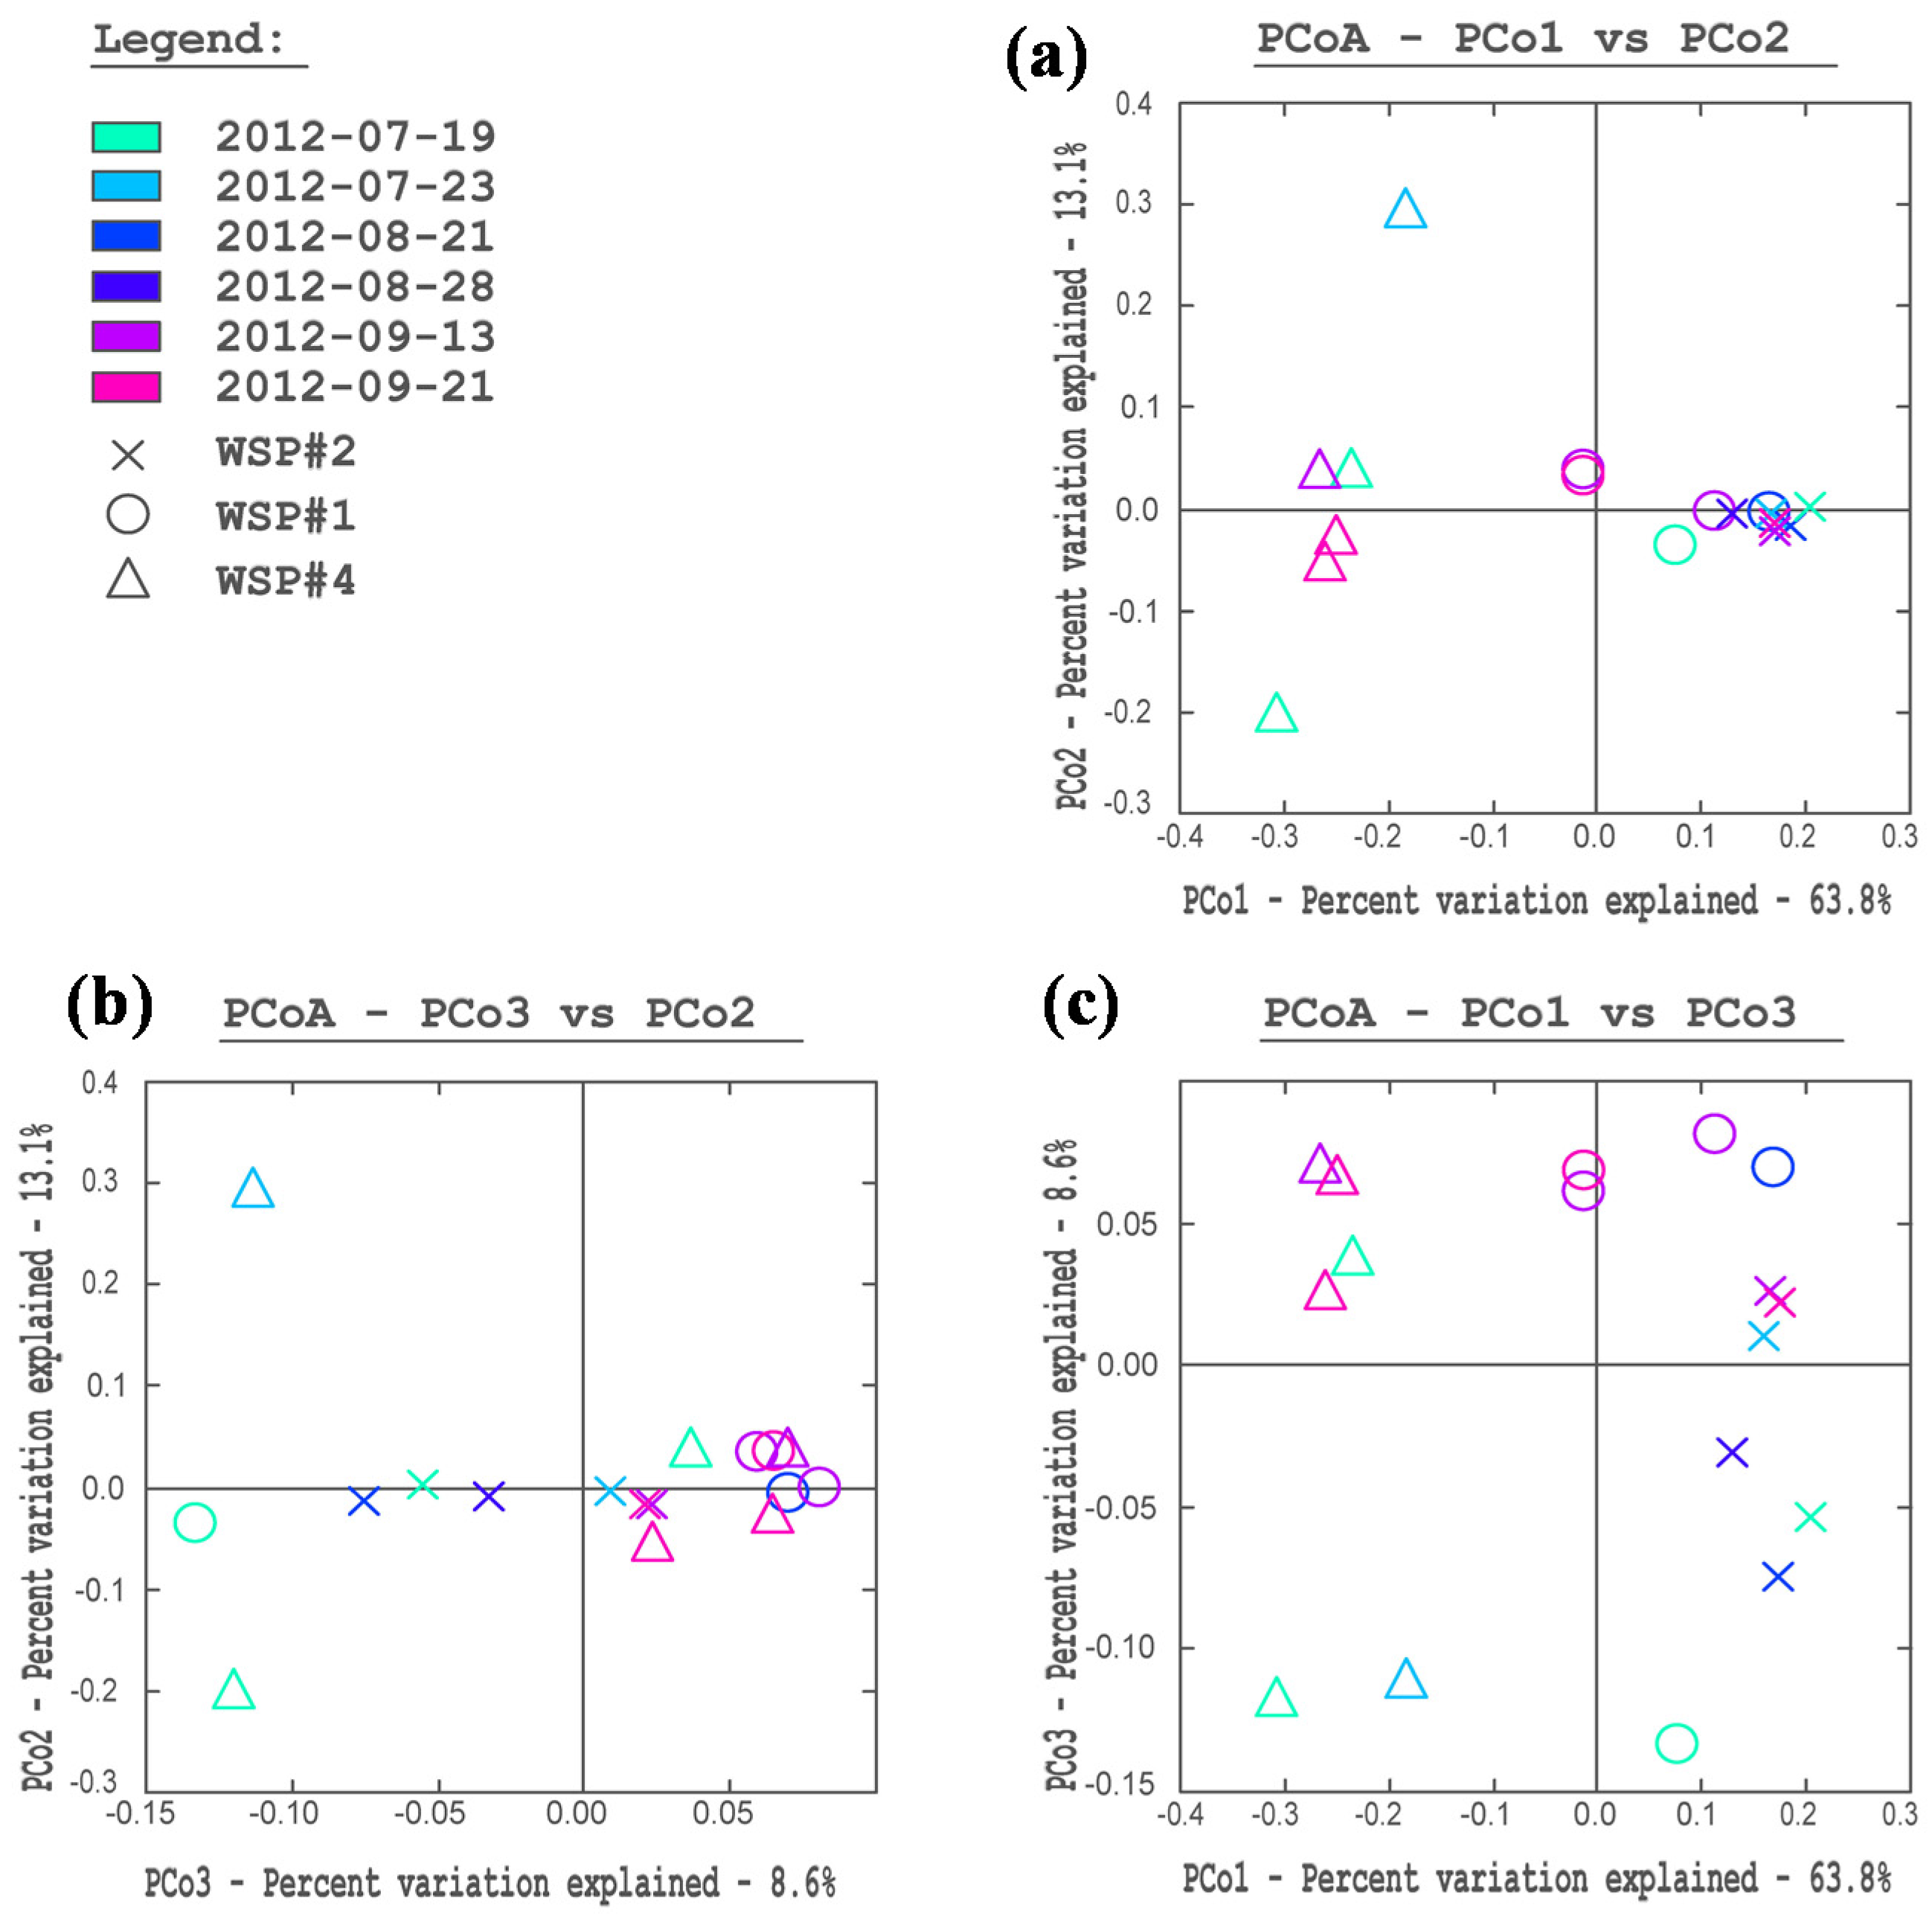
3.2. Cluster and PCoA Analysis of Samples

3.3. Water Chemistry Conditions and Monod Growth Model
| Parameter | Average Values | Overall Percent Change | |||
|---|---|---|---|---|---|
| PL | WSP#2 | WSP#1 | WSP#4 | ||
| Chlorophyll-a | 2.1 ± 0.56 | 2.4 ± 1.4 | 5.6 ± 7.5 | 4.8 ± 3.5 | 132% |
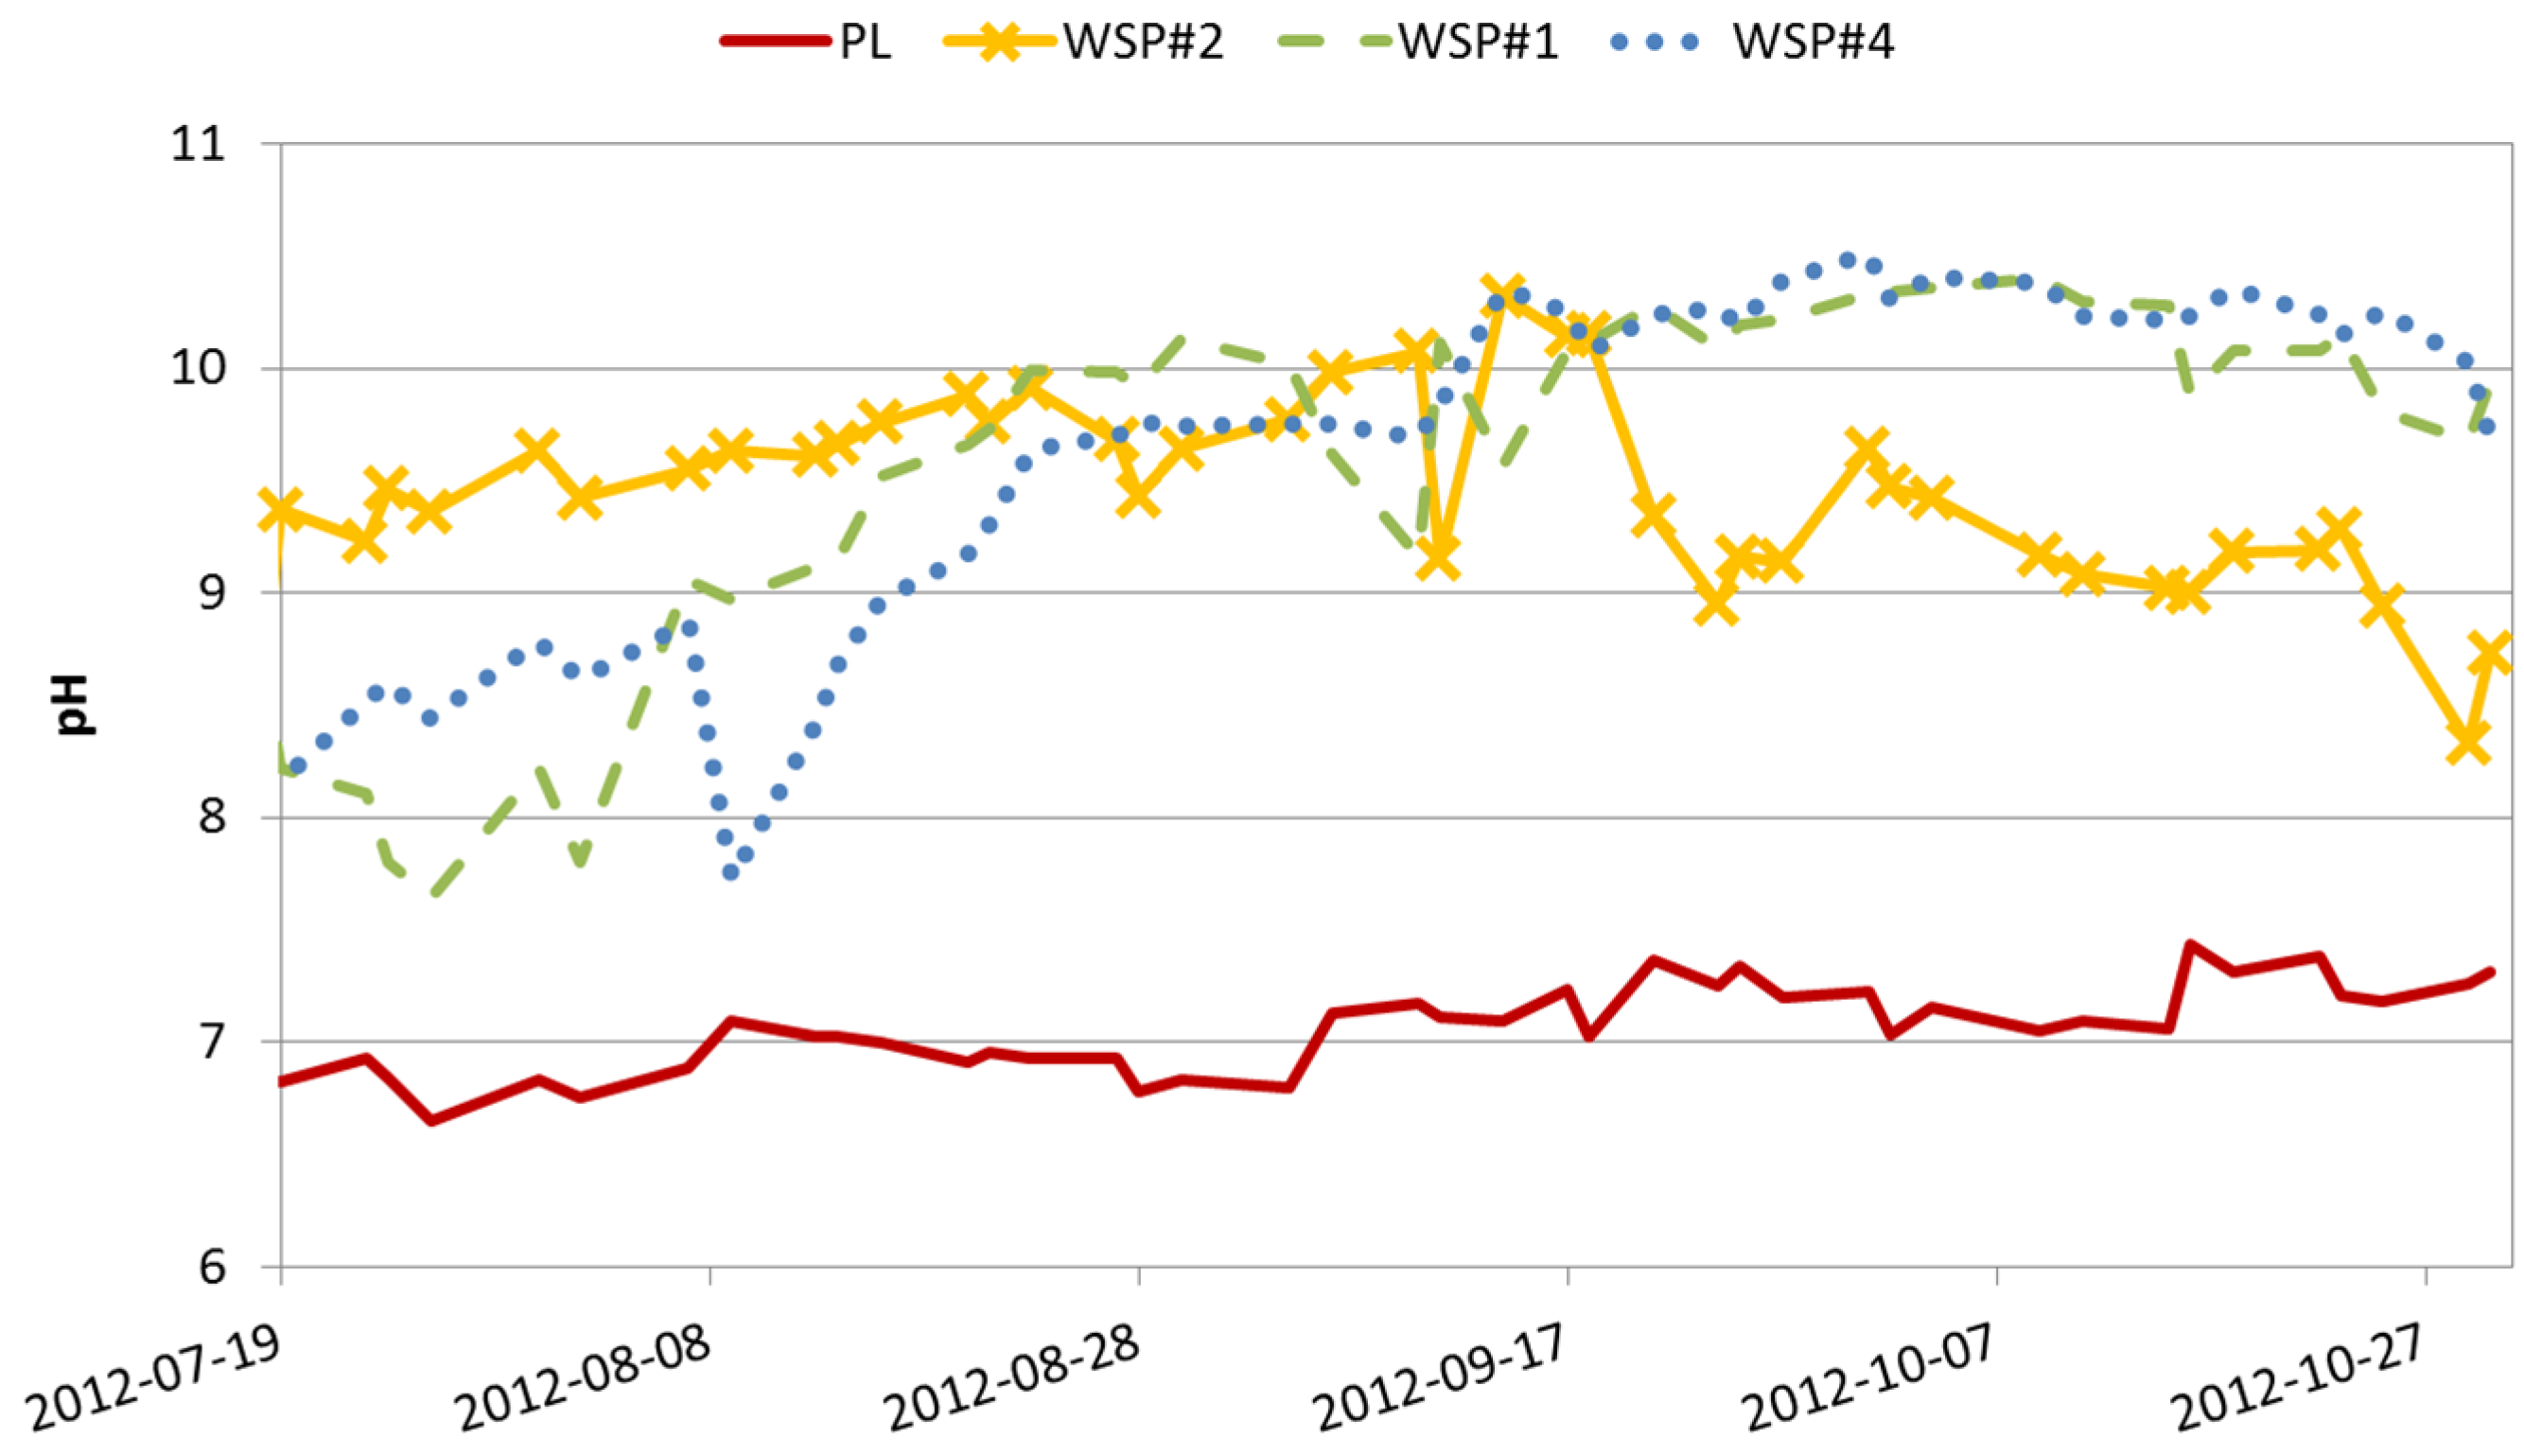
| pH | 7 ± 0.18 | 9.5 ± 0.46 | 9.4 ± 0.78 | 9.6 ± 0.7 | 37% |
| Temperature | 19 ± 2.1 | 21 ± 4.9 | 21 ± 5.3 | 21 ± 4.9 | 7% |
| Dissolved oxygen | 3.6 ± 1.3 | 9.2 ± 3.8 | 7.4 ± 3.7 | 7 ± 3.5 | 97% |
| Alkalinity | 96 ± 31 | 120 ± 23 | 120 ± 14 | 120 ± 17 | 30% |
| Conductivity | 660 ± 53 | 600 ± 41 | 600 ± 43 | 580 ± 79 | −12% |
| Oxidation Reduction Potential | 180 ± 63 | 120 ± 86 | 120 ± 76 | 67 ± 120 | −62% |
| Total Suspended Solids | 11 ± 11 | 1.3 ± 1.2 | 3.2 ± 3 | 1.9 ± 1.7 | −83% |
| Carbonaceous Biochemical Oxygen Demand | 5.3 ± 3.6 | 2.2 ± 0.36 | 2.6 ± 0.82 | 3 ± 0.79 | −44% |
| Chemical Oxygen Demand | 20 ± 13 | 18 ± 6.1 | 24 ± 9.8 | 24 ± 8.3 | 23% |
| Total Nitrogen | 23 ± 3.7 | 6.4 ± 1.1 | 3.5 ± 1.2 | 2.1 ± 0.38 | −91% |
| Ammonia | 0.047 ± 0.065 | 0.19 ± 0.15 | 0.27 ± 0.37 | 0.16 ± 0.21 | 230% |
| Unionized Ammonia | 0.005 ± 0 | 0.078 ± 0.056 | 0.072 ± 0.088 | 0.049 ± 0.05 | 877% |
| Nitrate | 21 ± 3.6 | 4.9 ± 2.1 | 1.9 ± 1.5 | 0.5 ± 0.53 | −98% |
| Nitrite | 0.14 ± 0.12 | 0.88 ± 0.26 | 0.24 ± 0.18 | 0.13 ± 0.062 | −6% |
| Organic Nitrogen | 1.9 ± 2.3 | 1.1 ± 0.36 | 1.4 ± 0.48 | 1.3 ± 0.33 | −32% |
| Total Phosphorus | 1 ± 0.49 | 0.4 ± 0.22 | 0.36 ± 0.18 | 0.38 ± 0.2 | −64% |
| Orthophosphate | 2.4 ± 1.1 | 2 ± 1.5 | 1.3 ± 0.91 | 1.3 ± 1.4 | −44% |
3.4. Correlations to Water Chemistry Parameters
| Effluent Parameter | Chlorophyta_Chlorophyceae | Streptophyta_Embryophyta | ||||||
|---|---|---|---|---|---|---|---|---|
| All WSP | WSP#2 | WSP#1 | WSP#4 | All WSP | WSP#2 | WSP#1 | WSP#4 | |
| Orthophosphate | 0.78 | −0.49 | 0.67 | 0.48 | −0.84 | 0.65 | −0.67 | −0.29 |
| Organic nitrogen | −0.27 | −0.37 | 0.56 | 0.63 | 0.16 | 0.65 | −0.56 | −0.88 |
| Carbonaceous biochemical oxygen demand | 0.38 | 0.65 | 0.67 | 0.39 | −0.43 | −0.20 | −0.67 | −0.15 |
| Nitrate | 0.61 | 0.46 | −0.46 | −0.48 | −0.54 | 0.13 | 0.46 | 0.29 |
| Dissolved oxygen | 0.16 | −0.09 | −0.67 | −0.63 | −0.07 | −0.65 | 0.67 | 0.88 |
| Total nitrogen | 0.57 | 0.14 | −0.46 | 0.20 | −0.53 | 0.39 | 0.46 | −0.52 |
| Total phosphorus | 0.28 | −0.26 | 0.46 | 0.30 | −0.38 | 0.13 | −0.46 | −0.65 |
| Nitrite | 0.42 | −0.26 | −0.46 | −0.42 | −0.39 | 0.13 | 0.46 | 0.24 |
| Nitrogen/Phosphorus Ratio | 0.13 | 0.31 | −0.56 | −0.63 | 0.04 | −0.13 | 0.56 | 0.88 |
| Chlorophyll-a | −0.19 | 0.71 | 0.05 | 0.30 | 0.14 | −0.65 | −0.05 | −0.65 |
| Chemical oxygen demand | 0.05 | 0.66 | 0.05 | 0.63 | −0.08 | −0.39 | −0.05 | −0.88 |
| Unionized ammonia | 0.21 | 0.20 | −0.22 | 0.09 | −0.23 | −0.65 | 0.22 | −0.35 |
| pH | 0.02 | −0.60 | −0.45 | −0.30 | 0.01 | −0.13 | 0.45 | 0.65 |
| Ammonia | 0.09 | 0.09 | −0.36 | 0.30 | −0.11 | 0.13 | 0.36 | −0.65 |
4. Discussion
5. Conclusions
Acknowledgments
Author Contributions
Conflicts of Interest
References
- Guiry, M.D. How many algae species are there? J. Phycol. 2012, 48, 1057–1063. [Google Scholar] [CrossRef]
- Natural History Museum. About Algae: The Phyla—Natural History Museum of the UK. Available online: http://www.nhm.ac.uk/research-curation/scientific-resources/biodiversity/uk-biodiversity/algaevision/about-algae/index.html (accessed on 12 June 2015).
- Smith, V.H.; Joye, S.B.; Howarth, R.W. Eutrophication of freshwater and marine ecosystems. Limnol. Oceanogr. 2006, 51, 351–355. [Google Scholar] [CrossRef]
- Ratchford, I.A.J.; Fallowfield, H.J. The effect of light:dark cycles of medium frequency on photosynthesis by Chlorella vulgaris and the implications for waste stabilisation pond design and performance. Water Sci. Technol. 2003, 48, 69–74. [Google Scholar] [PubMed]
- Steinmann, C.R.; Weinhart, S.; Melzer, A. A combined system of lagoon and constructed wetland for an effective wastewater treatment. Water Res. 2003, 37, 2035–2042. [Google Scholar] [CrossRef]
- Zimmo, O.R.; van der Steen, N.P.; Gijzen, H.J. Effect of organic surface load on process performance of pilot-scale algae and duckweed-based waste stabilization ponds. J. Environ. Eng. ASCE 2005, 131, 587–594. [Google Scholar] [CrossRef]
- Amengual-Morro, C.; Moyà Niell, G.; Martínez-Taberner, A. Phytoplankton as bioindicator for waste stabilization ponds. J. Environ. Manag. 2012, 95, S71–S76. [Google Scholar] [CrossRef] [PubMed]
- Kayombo, S.; Mbwette, T.S.A.; Katima, J.H.Y.; Ladegaard, N.; Jorgensen, S.E. Waste Stabilization Ponds and Constructed Wetlands Design Manual; United Nations Environment Programme: Osaka, Japan, 2005; Available online: http://www.unep.or.jp/Ietc/WS/publications.asp (accessed on 18 January 2011).
- Barsanti, L.; Gualtieri, P. Algae: Anatomy, Biochemistry, and Biotechnology; CRC Press: Boca Raton, FL, USA, 2006. [Google Scholar]
- Shammas, N.K.; Wang, L.K.; Wu, Z. Waste stabilization ponds and WSPs. In Biological Treatment Processes, Handbook of Environmental Engineering; Humana Press: Totowa, NJ, USA, 2009; Volume 8, pp. 315–370. [Google Scholar]
- Veeresh, M.; Veeresh, A.V.; Huddar, B.; Hosetti, B.B. Dynamics of industrial waste stabilization pond treatment processes. Environ. Monit. Assess. 2010, 169, 55–65. [Google Scholar] [CrossRef] [PubMed]
- Amherstview Water Pollution Control Plant—Operating Manual; CH2M Gore and Storrie Limited: Toronto, ON, Canada, 1997.
- QIAGEN. DNeasy Plant Mini Kit. Available online: http://www.qiagen.com/products/catalog/sample-technologies/dna-sample-technologies/genomic-dna/dneasy-plant-mini-kit (accessed on 12 October 2013).
- Sherwood, A.R.; Presting, G.G. Universal primers amplify a 23s rDNA plastid marker in eukaryotic algae and cyanobacteria. J. Phycol. 2007, 43, 605–608. [Google Scholar] [CrossRef]
- Stiller, J.W.; McClanahan, A.N.A. Phyto-Specific 16S rDNA PCR primers for recovering algal and plant sequences from mixed samples. Mol. Ecol. Notes 2005, 5, 1–3. [Google Scholar] [CrossRef]
- Cuvelier, M.L.; Allen, A.E.; Monier, A.; McCrow, J.P.; Messié, M.; Tringe, S.G.; Woyke, T.; Welsh, R.M.; Ishoey, T.; Lee, J.-H.; et al. Targeted metagenomics and ecology of globally important uncultured eukaryotic phytoplankton. Proc. Natl. Acad. Sci. USA 2010, 107, 14679–14684. [Google Scholar] [CrossRef] [PubMed]
- Ghai, R.; Hernandez, C.M.; Picazo, A.; Mizuno, C.M.; Ininbergs, K.; Díez, B.; Valas, R.; DuPont, C.L.; McMahon, K.D.; Camacho, A.; et al. Metagenomes of mediterranean coastal lagoons. Sci. Rep. 2012, 2, 490–502. [Google Scholar] [CrossRef] [PubMed]
- Kim, K.M.; Park, J.H.; Bhattacharya, D.; Yoon, H.S. Applications of next-generation sequencing to unravelling the evolutionary history of algae. Int. J. Syst. Evol. Microbiol. 2014, 64, 333–345. [Google Scholar] [CrossRef] [PubMed]
- Somboonna, N.; Wilantho, A.; Assawamakin, A.; Monanunsap, S.; Tangphatsornruang, S.; Sangsrakru, D.; Tongsima, S. Structural and functional diversity of free-living microorganisms in reef surface, Kra island, Thailand. BMC Genomics 2014, 15, 607–620. [Google Scholar] [CrossRef] [PubMed]
- Worden, A.Z.; Janouskovec, J.; McRose, D.; Engman, A.; Welsh, R.M.; Malfatti, S.; Tringe, S.G.; Keeling, P.J. Global distribution of a wild alga revealed by targeted metagenomics. Curr. Biol. 2012, 2, R675–R677. [Google Scholar] [CrossRef] [PubMed]
- Life Technologies. Ion PGM Template OT2 200 Kit. Available online: http://www.lifetechnologies.com/order/catalog/product/4480974 (accessed on 12 October 2013).
- Life Technologies. 2013. Available online: http://www.lifetechnologies.com/order/catalog/product/4474004 (accessed on 12 October 2013).
- American Public Health Association (APHA). Standard Methods for the Examination of Water and Wastewater; APHA: New York, NY, USA, 2005. [Google Scholar]
- QIIME. 2013. Available online: http://qiime.org/ (accessed on 13 October 2013).
- Lozupone, C.; Knight, R. UniFrac: A new phylogenetic method for comparing microbial communities. Appl. Environ. Microbiol. 2005, 71, 8228–8235. [Google Scholar] [CrossRef] [PubMed]
- Lozupone, C.; Lladser, M.E.; Knights, D.; Stombaugh, J.; Knight, R. UniFrac: An effective distance metric for microbial community comparison. Int. Soc. Microb. Ecol. J. 2011, 5, 169–172. [Google Scholar] [CrossRef] [PubMed]
- Fielding, A. MDS or Principal Components Analysis; Manchester Metropolitan University: Manchester, UK, 2013; Available online: http://www.alanfielding.co.uk/multivar/pco.htm (accessed on 13 October 2013).
- Simpson, M.G. Plant Systematics; Elsevier/Academic Press: Amsterdam, The Netherlands, 2006. [Google Scholar]
- Integrated Taxonomic Information System (ITIS). Myrophyllum. Available online: http://www.itis.gov/servlet/SingleRpt/SingleRpt?search_topic=TSN&search_value=27034 (accessed on 4 June 2013).
- Integrated Taxonomic Information System (ITIS). Lemna. Available online: http://www.itis.gov/servlet/SingleRpt/SingleRpt?search_topic=TSN&search_value=42588 (accessed on 4 June 2013).
- Integrated Taxonomic Information System (ITIS). Potamogeton. Available online: http://www.itis.gov/servlet/SingleRpt/SingleRpt?search_topic=TSN&search_value=39005 (accessed on 4 June 2013).
- Landesman, L.P.C.; Fedler, C.B.; Konikoff, M. Modeling duckweed growth in wastewater treatment systems. Livest. Res. Rural Dev. 2005, 17, 61. [Google Scholar]
- Sterner, R.W.; Grover, J.P. Algal growth in warm temperate reservoirs: Kinetic examination of nitrogen, temperature, light, and other nutrients. Water Res. 1998, 32, 3539–3548. [Google Scholar] [CrossRef]
- Kayombo, S.; Mbwette, T.S.A.; Katima, J.H.Y.; Jorgensen, S.E. Effects of substrate concentrations on the growth of heterotrophic bacteria and algae in secondary facultative ponds. Water Res. 2003, 37, 2937–2943. [Google Scholar] [CrossRef]
- Mesplé, F.; Casellas, C.; Troussellier, M.; Bontoux, J. Modelling orthophosphate evolution in a high rate algal pond. Ecol. Model. 1996, 89, 13–21. [Google Scholar] [CrossRef]
- Tchobanoglous, G.; Burton, F.L.; Stensel, H.D. Wastewater Engineering: Treatment and Reuse; McGraw-Hill: Dubuque, IA, USA, 2003. [Google Scholar]
- Urgun-Demirtas, M.; Sattayatewa, C.; Pagilla, K.R. Bioavailability of dissolved organic nitrogen in treated effluents. Water Environ. Res. 2008, 80, 397–406. [Google Scholar] [CrossRef] [PubMed]
- Wallace, J.; Champagne, P.; Hall, G. Multivariate Statistical Analysis of Water Chemistry Dynamics in Three Facultative Wastewater Stabilization Ponds with Algae Blooms and pH Fluctuations. Master’s Thesis, Queen’s University, Kingston, ON, Canada, 27 October 2013. [Google Scholar]
- Govindjee, R. What is Photosynthesis? University of Illinois at Urbana-Champaign: Urbana, IL, USA. Available online: http://www.life.illinois.edu/govindjee/whatisit.htm (accessed 11 June 2013).
- Leng, R.A. Duckweed: A Tiny Aquatic Plant with Enormous Potential for Agriculture and Environment; United Nations Food and Agriculture Organization: Rome, Italy, 2003; Available online: http://www.fao.org/ag/againfo/resources/documents/DW/Dw2.htm (accessed on 11 June 2013).
- Tan, R. Duckweed: Mangrove and wetland wildlife at Sungei Buloh Natural Park. Available online: http://www.naturia.per.sg/buloh/plants/duckweed.htm (accessed on 11 June 2013).
- Bristow, J.M.; Whitcombe, M. The Role of roots in the nutrition of aquatic vascular plants. Am. J. Bot. 1971, 58, 8–13. [Google Scholar] [CrossRef]
- Madsen, T.V.; Cedergreen, N. Sources of nutrients to rooted submerged macrophytes growing in a nutrient-rich stream. Freshw. Biol. 2002, 47, 283–291. [Google Scholar] [CrossRef]
- Barko, J.W.; Gunnison, D.; Carpenter, S.R. Sediment interactions with submersed macrophyte growth and community dynamics. Aquat. Bot. 1991, 41, 41–65. [Google Scholar] [CrossRef]
- Keffala, C.; Harerimana, C.; Vasel, J.-L. A review of the sustainable value and disposal techniques, wastewater stabilisation ponds sludge characteristics and accumulation. Environ. Monit. Assess. 2013, 185, 45–58. [Google Scholar] [CrossRef] [PubMed]
- Kesaano, J. Sustainable Management of Duckweed Biomass Grown for Nutrient Control in Municipal Wastewaters. Master’s Thesis, Utah State University, Logan, UT, USA, 2011. Available online: http://digitalcommons.usu.edu/cgi/viewcontent.cgi?article=1875&context=etd (accessed on 18 June 2013). [Google Scholar]
- United Nations Food and Agriculture Organization (FAO). Manual on the Production and Use of Live Food for Aquaculture; Lavens, P., Sorgeloos, P., Eds.; FAO: Rome, Italy, 1996; Available online: http://www.fao.org/docrep/003/w3732e/w3732e00.htm#Contents (accessed on 18 June 2013).
- Bergstrom, C.M.; Patel, S. Effects of pH on Algal Abundance: A Model of Bay Harbor, Michigan; University of Michigan: Ann Arbor, MI, USA, 2007; Available online: http://deepblue.lib.umich.edu/bitstream/handle/2027.42/57443/Bergstrom_McKeel_Patel_2007.pdf?sequence=1 (accessed on 18 June 2013).
- Crites, R.W.; Tchobanoglous, G. Small and Decentralized Wastewater Management Systems; WCB/McGraw-Hill: Boston, MA, USA, 1998. [Google Scholar]
- Zang, C.; Huang, S.; Wu, M.; Du, S.; Scholz, M.; Gao, F.; Lin, C.; Guo, Y.; Dong, Y. Comparison of relationships between pH, dissolved oxygen and chlorophyll a for aquaculture and non-aquaculture waters. Water Air Soil Pollut. 2011, 219, 157–174. [Google Scholar] [CrossRef]
- Zimmo, O.R.; Al Saed, R.; Gijzen, H. Comparison between algae-based and duckweed-based wastewater treatment: Differences in environmental conditions and nitrogen transformations. Water Sci. Technol. 2000, 42, 215–222. [Google Scholar]
- Wallace, J.; Champagne, P.; Hall, G. Time-Series relationships between chlorophyll-a, dissolved oxygen, and pH in three facultative wastewater stabilization ponds. Water 2015. under review. [Google Scholar]
- Gschlößl, T.; Steinmann, C.; Schleypen, P.; Melzer, A. Constructed wetlands for effluent polishing of lagoons. Water Res. 1998, 32, 2639–2645. [Google Scholar] [CrossRef]
- Mayes, W.M.; Aumonier, J.; Jarvis, A.P. Preliminary evaluation of a constructed wetland for treating extremely alkaline (pH 12) steel slag drainage. Water Sci. Technol. 2009, 59, 2253–2263. [Google Scholar] [CrossRef] [PubMed]
- Mayes, W.M.; Batty, L.C.; Younger, P.L.; Jarvis, A.P.; Kõiv, M.; Vohla, C.; Mander, U. Wetland treatment at extremes of pH: A review. Sci. Total Environ. 2009, 407, 3944–3957. [Google Scholar] [CrossRef] [PubMed]
- Tsalkatidou, M.; Gratziou, M.; Kotsovinos, N. Combined stabilization ponds-constructed wetland system. Desalination 2009, 248, 988–997. [Google Scholar] [CrossRef]
- Vymazal, J.; Greenway, M.; Tonderski, K.; Brix, H.; Mander, Ü. Constructed wetlands for wastewater treatment. In Wetlands and Natural Resources Management, Ecological Studies; Springer: Berlin/Heidelberg, Germany, 2006; pp. 69–96. [Google Scholar]
- Zhu, F.; Massana, R.; Not, F.; Marie, D.; Vaulot, D. Mapping of picoeucaryotes in marine ecosystems with quantitative PCR of the 18S rRNA gene. FEMS Microbiol. Ecol. 2005, 52, 79–92. [Google Scholar] [CrossRef] [PubMed]
- Gong, J.; Dong, J.; Liu, X.; Massana, R. Extremely high copy numbers and polymorphisms of the rDNA operon estimated from single cell analysis of oligotrich and peritrich ciliates. Protist 2013, 164, 369–379. [Google Scholar] [CrossRef] [PubMed]
© 2015 by the authors; licensee MDPI, Basel, Switzerland. This article is an open access article distributed under the terms and conditions of the Creative Commons Attribution license (http://creativecommons.org/licenses/by/4.0/).
Share and Cite
Wallace, J.; Champagne, P.; Hall, G.; Yin, Z.; Liu, X. Determination of Algae and Macrophyte Species Distribution in Three Wastewater Stabilization Ponds Using Metagenomics Analysis. Water 2015, 7, 3225-3242. https://doi.org/10.3390/w7073225
Wallace J, Champagne P, Hall G, Yin Z, Liu X. Determination of Algae and Macrophyte Species Distribution in Three Wastewater Stabilization Ponds Using Metagenomics Analysis. Water. 2015; 7(7):3225-3242. https://doi.org/10.3390/w7073225
Chicago/Turabian StyleWallace, Jack, Pascale Champagne, Geof Hall, Zhaochu Yin, and Xudong Liu. 2015. "Determination of Algae and Macrophyte Species Distribution in Three Wastewater Stabilization Ponds Using Metagenomics Analysis" Water 7, no. 7: 3225-3242. https://doi.org/10.3390/w7073225