
River Flows in the Ebro Basin: A Century of Evolution, 1913–2013

Department of Economic Analysis, Faculty of Economics and Business Studies, University of Zaragoza, Gran Vía 2, Zaragoza 50005, Spain
*
Author to whom correspondence should be addressed.
Water 2015, 7(6), 3072-3082; https://doi.org/10.3390/w7063072
Submission received: 20 April 2015
/
Revised: 1 June 2015
/
Accepted: 9 June 2015
/
Published: 19 June 2015
(This article belongs to the Special Issue Recent Advances in Riverflow Research)
Abstract
:The water forecast is a major uncertainty in the design of strategies to cope with potential restrictions and ensure the availability of water, even during extreme events such as drought. In this context, our study aimed to present and analyze an updated broad temporal and geographical overview of the evolution of river flows for the most important river in Spain, the Ebro river, from 1913 to 2013. Our main findings indicate a decreasing trend in water resources from 1913 to the present, and a significant level of volatility that reveals a striking irregularity, with asymmetric cycles and dry years. These findings question the current irrigation policies and together with a need to rethink their implementation should drive further research.
1. Introduction
One of the greatest challenges recognized worldwide is the increasing pressure on water resources caused by changes in climate and human activities [1]. This has had an impact on river deltas across the globe, with significant changes during the last century, primarily due to human-induced global effects [2]. The Mediterranean region is known to be one area that is most vulnerable to climatic and anthropogenic change, and thus is one of the world’s hot-spots for water-use conflicts [3]. The Ebro River basin (85,530 km2, with a length of 928 km), located in Northeastern Spain, is highly representative of this issue, with its combination of limited and unequally-distributed water resources and increasing water demands. For this reason, the Ebro system has been widely studied, from multiple points of view (hydrology, economy, society) and has been used as a case study in numerous works to forecast future scenarios of water management ([3,4], among many others). Specifically, since the first half of the 20th century, irrigation has been important in the Ebro basin—the first area of Spain to establish large-scale irrigation projects [5]—and the construction of several dams along the course of the river has reduced the sediment load to the river mouth by more than 95% [6]. Xing et al. [7] finds that human activity significantly influenced suspended sediment flux. Sánchez-Chóliz and Sarasa [8] identified a downward trend in water resources in the region in the last decades, and more interestingly, the spontaneous growth of vegetation at the headwaters of rivers was found in this region after agricultural abandonment to be a key role, by several researches [9,10,11,12]; both trends contribute to reductions in water availability. Moreover, these issues, together with other forms of urban and industrial water consumption, consume large amounts of water resulting in a reduction of water discharge, and affecting social and ecological systems. For these reasons, the study of the evolution of river flows in the Ebro basin over a long period of time is a key call in motivating research into the further development of prevention and compensation policies, as well as to forecast future scenarios to solve the existing environmental and social conflicts.
The primary aim of our study is to present and analyze a wide-ranging temporal and geographical overview of the evolution of river flows in the Ebro basin, over the course of a century, with the objective of providing data that will facilitate production of a water forecast. The present study has evolved from prior work showing the decline and the irregularity of water availability in a small area covering 127,000 hectares, localized within the Ebro river basin, from 2001 to 2010 [8]. As a novelty, given prior works that show historical records in Spain begun by 1940 ([10,13], among many others), our research presents updated information about river flows in the Ebro basin from the beginning of the 20th century, including the Civil War period, up to 2013. The length of this time period is also a necessary condition to reveal possible long cyclical patterns.
This work contributes information on the evolution of river flows as a way of providing insight into two research topics: first, the trend in river flows from 1913 to the present is decreasing and has been worrying over the last 20 years, and, second, significant volatility is observable, revealing great irregularity (asymmetric cycles and dry years). These observations may shed light on the discussion of the part played by climate change in the evolution of water resources, vis-à-vis cyclical evolutions as well as on the design of strategies of water and land management.
2. Material and Methods
The database required to estimate the evolution of the available water resources in the Ebro basin, from 1913 to 2013, is an update of the data presented in [14], which confirms two essential issues that have motivated further development of prevention and compensation policies, namely, the decline and the irregularity of water availability.
The hydrologic time series used are based on data provided by the Water Authority, the Ebro Hydrological Council (CHE in its Spanish acronym) [15]. Specifically, the annual series “Water flows in Tortosa and Water flows plus water consumption in Tortosa” are taken as the basis for our purpose, as well as the “Water flows in Zaragoza” annual series, which provides a guide for the period between 1935 and 1951, which is not available in the Water flows in Tortosa series. The latter allow us to solve the major problem of uncertainty and weakness in the water data available for the period of the Spanish Civil War and its aftermath. The series presented in Table 1 consists of data collection at flow gauging stations number 11 (Zaragoza), 24 (Segre in Lleida) and 27 (Tortosa), which are found in the section on historical data (Some isolated cells have been completed with the average value for the month (previous and following year, and/or the previous and following month)). In the case of the “Water flows in Tortosa” series, we apply the criteria described in [16] for certain missing years (particularly from 1940 to 1951):
Water flows in Tortosa = 1.1 × Water flows in Zaragoza + 2.1 × Water flows in Segre in Lleida.
To obtain the “Water flows in Tortosa” series for the period from 1935 to 1940, covering the years of the Spanish Civil War, we considered only the information available in “Water flows in Zaragoza”, to which we applied the average difference between “Water flows in Zaragoza” and “Water flows in Tortosa” for the periods 1930–1935 and 1940–1945, for which complete information exists in both series. Data for the period 2008–2010 were obtained from the Yearbook of Water flows [17], also provided by the CHE, and the latest data for the period 2010–2013 were obtained from the Automatic Ebro Basin Hydrological Information System (SAIH in its Spanish acronym) [18].

| Period | Zaragoza | Tortosa | Period | Zaragoza | Tortosa | Period | Zaragoza | Tortosa |
|---|---|---|---|---|---|---|---|---|
| 1913–1914 | 5872 | 20,568 | 1947–1948 | 5255 | 10,521 | 1981–1982 | 5520 | 7458 |
| 1914–1915 | 1948–1949 | 1982–1983 | 9297 | 13,931 | ||||
| 1915–1916 | 1949–1950 | 5930 | 9791 | 1983–1984 | 6935 | 9839 | ||
| 1916–1917 | 1950–1951 | 9579 | 16,873 | 1984–1985 | 7886 | 9171 | ||
| 1917–1918 | 4716 | 14,562 | 1951–1952 | 7510 | 17,946 | 1985–1986 | 5253 | 6922 |
| 1918–1919 | 8925 | 22,565 | 1952–1953 | 7030 | 16,982 | 1986–1987 | 4874 | 6995 |
| 1919–1920 | 5538 | 20,748 | 1953–1954 | 9986 | 16,018 | 1987–1988 | ||
| 1920–1921 | 4178 | 15,618 | 1954–1955 | 4515 | 8607 | 1988–1989 | 2852 | 10,442 |
| 1921–1922 | 5075 | 17,071 | 1955–1956 | 7818 | 15,816 | 1989–1990 | ||
| 1922–1923 | 4438 | 14,858 | 1956–1957 | 4474 | 8270 | 1990–1991 | 5904 | 9448 |
| 1923–1924 | 5416 | 16,017 | 1957–1958 | 5701 | 9056 | 1991–1992 | 5103 | 6042 |
| 1924–1925 | 3907 | 12,398 | 1958–1959 | 5870 | 14,256 | 1992–1993 | 6949 | 10,433 |
| 1925–1926 | 4804 | 16,778 | 1959–1960 | 1993–1994 | 5952 | 8745 | ||
| 1926–1927 | 5525 | 19,491 | 1960–1961 | 1994–1995 | 4741 | 7900 | ||
| 1927–1928 | 8877 | 19,439 | 1961–1962 | 1995–1996 | 4861 | 10,223 | ||
| 1928–1929 | 5608 | 10,792 | 1962–1963 | 8385 | 17,658 | 1996–1997 | 7373 | 13,122 |
| 1929–1930 | 13,417 | 21,876 | 1963–1964 | 6315 | 15,194 | 1997–1998 | 5870 | 10,227 |
| 1930–1931 | 13,441 | 19,177 | 1964–1965 | 7103 | 10,786 | 1998–1999 | 5325 | 6340 |
| 1931–1932 | 7801 | 14,178 | 1965–1966 | 10,186 | 18,817 | 1999–2000 | 4539 | 6987 |
| 1932–1933 | 8370 | 14,383 | 1966–1967 | 8508 | 13,884 | 2000–2001 | 7445 | 12,661 |
| 1933–1934 | 10,073 | 13,923 | 1967–1968 | 9966 | 15,552 | 2001–2002 | ||
| 1934–1935 | 9006 | 15,034 | 1968–1969 | 8103 | 17,558 | 2002–2003 | 8706 | 12,161 |
| 1935–1936 | 1969–1970 | 9718 | 14,438 | 2003–2004 | 8189 | 14,007 | ||
| 1936–1937 | 7513 | 13,895 | 1970–1971 | 7346 | 14,359 | 2004–2005 | 5383 | 6699 |
| 1937–1938 | 9665 | 17,876 | 1971–1972 | 10,050 | 19,333 | 2005–2006 | 4908 | 6011 |
| 1938–1939 | 11,674 | 21,592 | 1972–1973 | 7326 | 12,781 | 2006–2007 | 6988 | 7895 |
| 1939–1940 | 8183 | 15,135 | 1973–1974 | 5746 | 11,826 | 2007–2008 | 5625 | 7048 |
| 1940–1941 | 12,534 | 21,871 | 1974–1975 | 8803 | 13,709 | 2008–2009 | 7596 | 10,265 |
| 1941–1942 | 5958 | 12,527 | 1975–1976 | 6069 | 8419 | 2009–2010 | 6601 | 9540 |
| 1942–1943 | 4901 | 11,653 | 1976–1977 | 8761 | 15,476 | 2010–2011 | 4360 | 6574 |
| 1943–1944 | 3845 | 10,578 | 1977–1978 | 12,016 | 17,761 | 2011–2012 | ||
| 1944–1945 | 6324 | 9519 | 1978–1979 | 10,541 | 16,840 | 2012–2013 | ||
| 1945–1946 | 5405 | 11,863 | 1979–1980 | 8966 | 10,041 | |||
| 1946–1947 | 6904 | 13,008 | 1980–1981 | 8579 | 9444 |
Note: Source: Own work.
3. Results
A close observation of the previous data shown in Table 1 leads us to observe some remarkable facts: a decreasing trend in water availability showing that three of the four driest years (in red and boxed) were found in the last 20 years; a great irregularity accompanied the five major peaks (in blue and boxed) with large flows that revealed a long cycle of around 50 years and shorter cycles of around 25 years; and worst of all, these dry years were registered in shorter and frequent cycles. These results bring to the Table the need of management strategies to mitigate and reduce these effects.
We present now three important explanations obtained from an analysis of the data. First, the water resources evolution in the Ebro river basin showed in Table 1 increased with estimation of the consumption. From this, we can approximate the accurate level of water resources at the flow gauging stations, and observe the current situation of the basin, without considering the influence of human activities. Second, the water resources evolution is adjusted to study the possibility of cyclical evolution. Third, the evolution of irrigated agriculture in the area is shown because of its importance for the comparative availability of water resources.
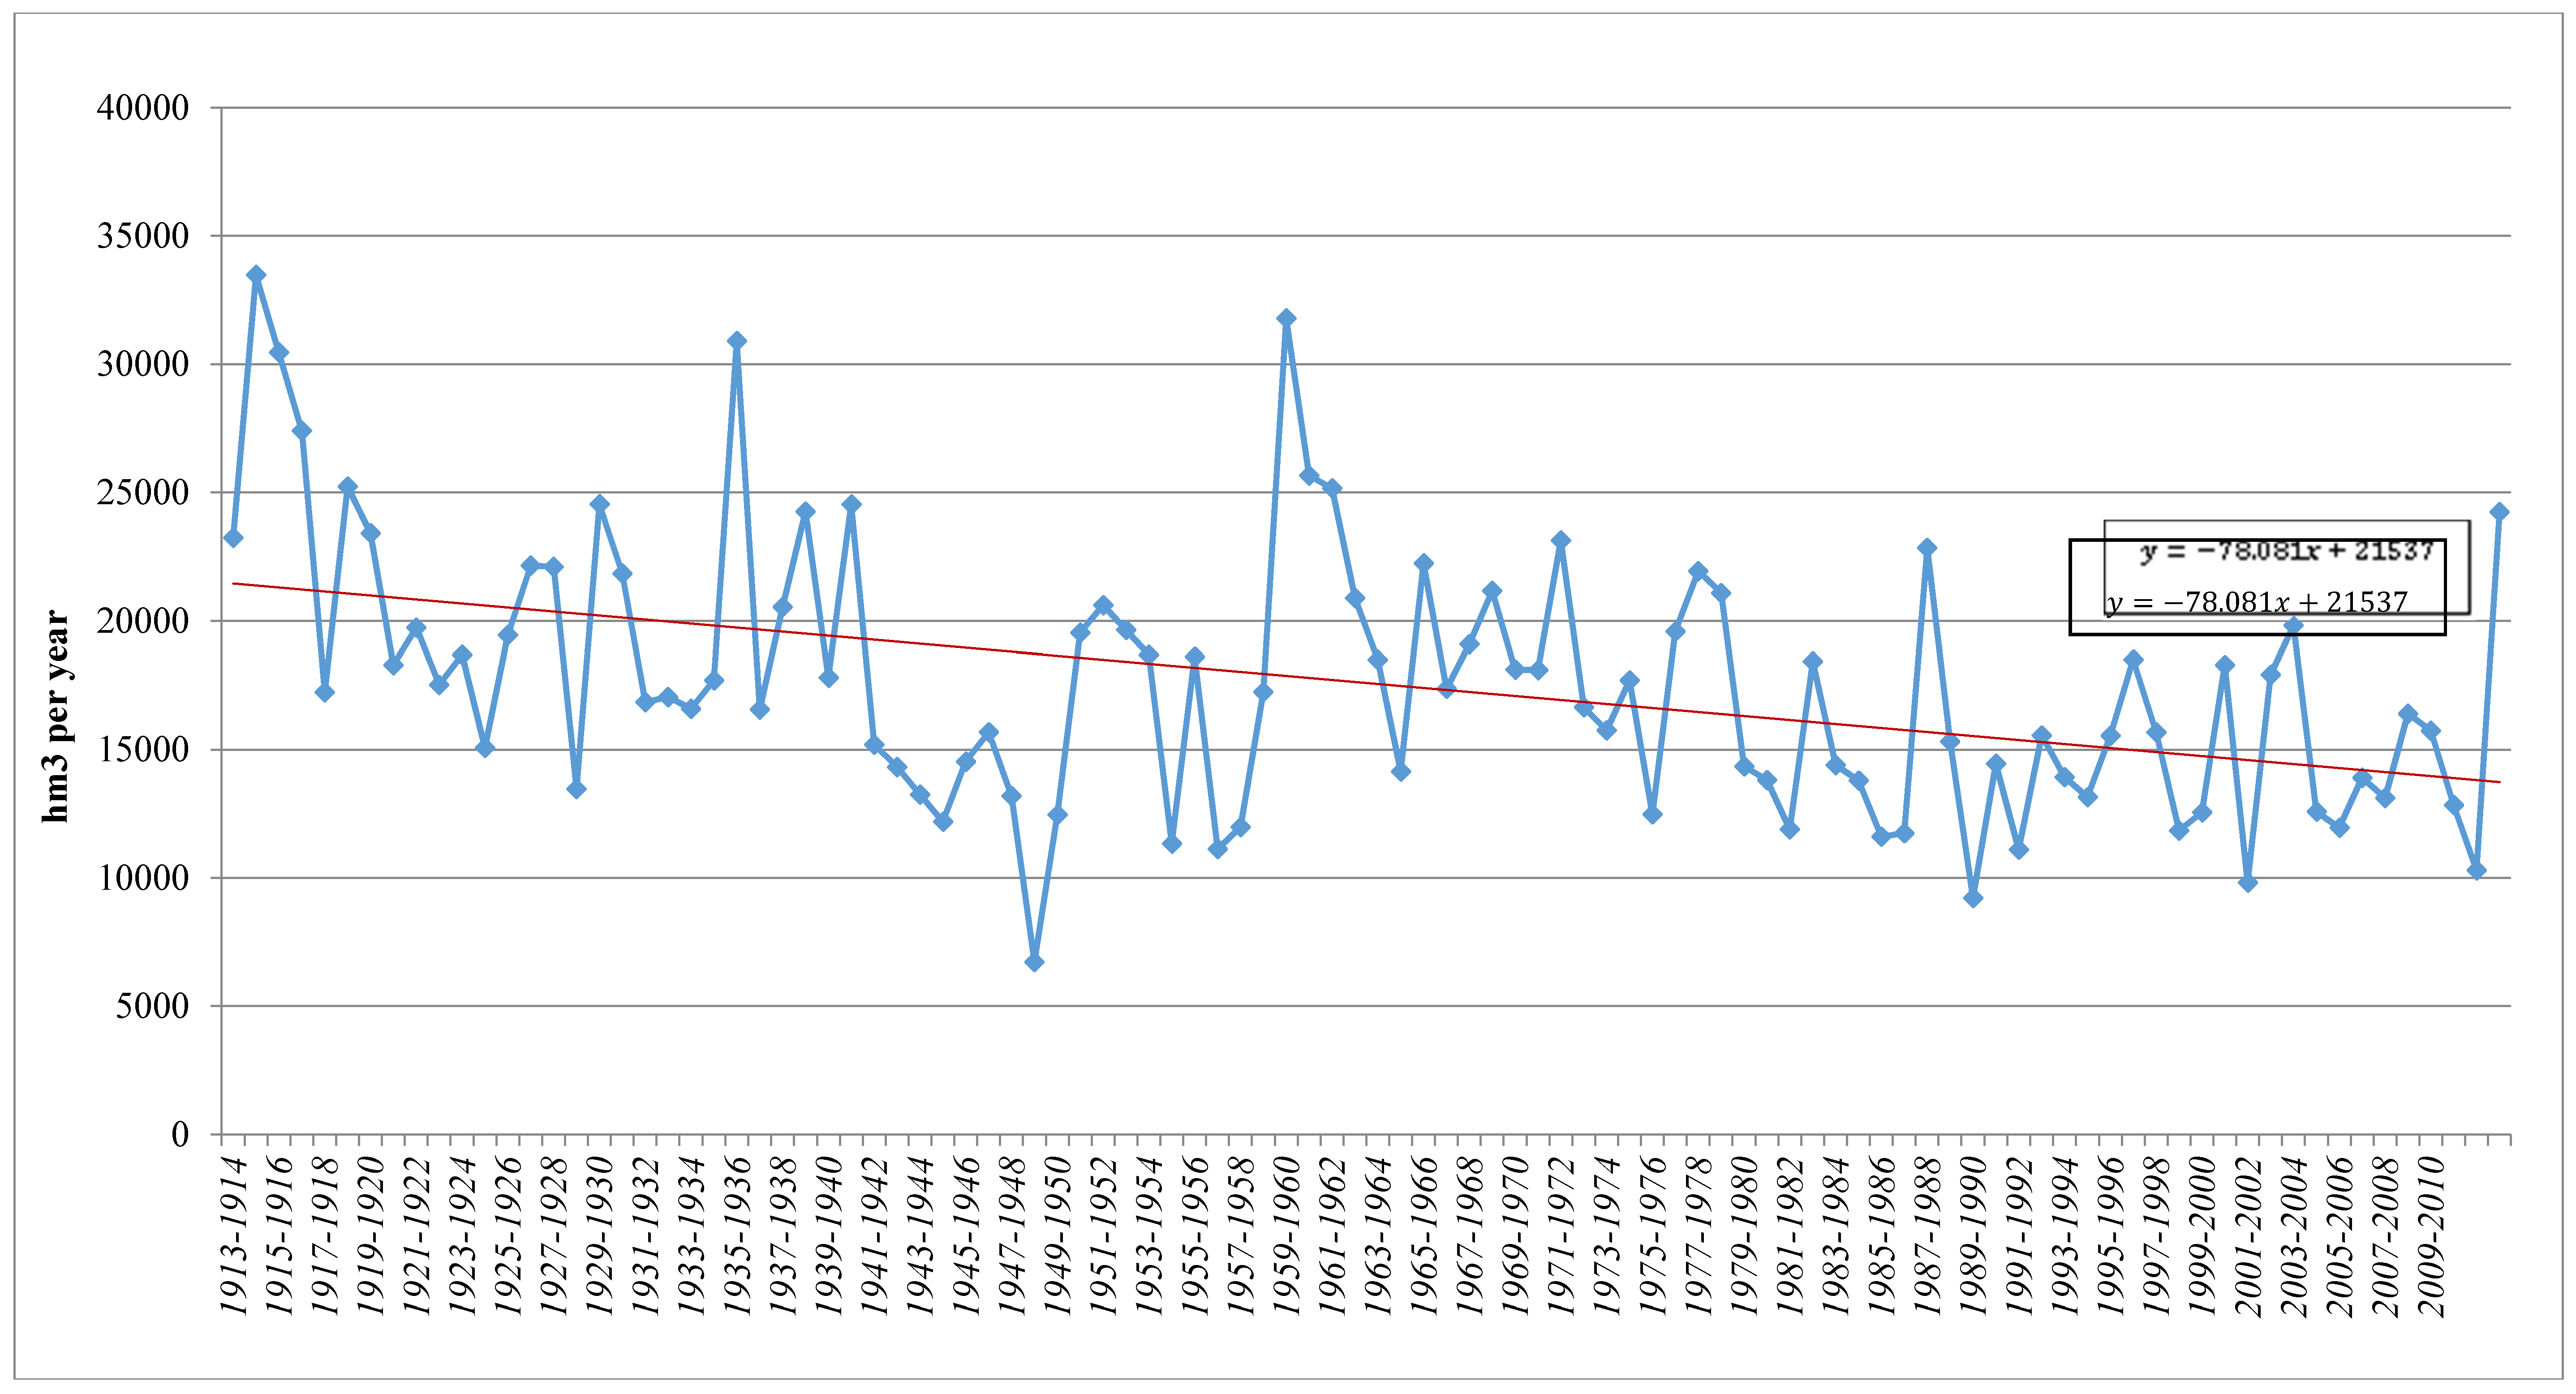
The Water flows in Tortosa and Water flows plus water consumption in Tortosa series are shown in Figure 1 and Figure 2 respectively. The Water flows plus water consumption in the Tortosa series was obtained from Water flows in Tortosa and the consumption increase in the basin, following [14]. As the annual consumption was almost constant until 1953–1954, we estimated it at 2666 hm3 per year and we increased the water consumption over these years by that figure. Similarly, we increased the water consumption from 1954 to 1955 by 2666 hm3, plus a cumulative increase of 63 hm3 per year, for the sake of simplicity.
Figure 1 and Figure 2 show a clear declining trend in the water supply, higher in Figure 1 due to consumption produced by human activities. Five peaks are observable in the periods 1914–1915, 1935–1936, 1959–1960, 1987–1988, and 2012–2013, allowing for a reasonable conjecture of four separate cycles. The time unit in these periods is the hydrological year which, in Spain, runs from 1 October to 30 September of the following year. In Figure 3, we adjusted each cycle by a function, thus:
Figure 1.
Water flows in Tortosa (hm3 per year) 1913–2013. Note: For example, x for 1943–1944 is equal to1943–1913, 1913 being the first year. Source: Own elaboration.
Figure 1.
Water flows in Tortosa (hm3 per year) 1913–2013. Note: For example, x for 1943–1944 is equal to1943–1913, 1913 being the first year. Source: Own elaboration.
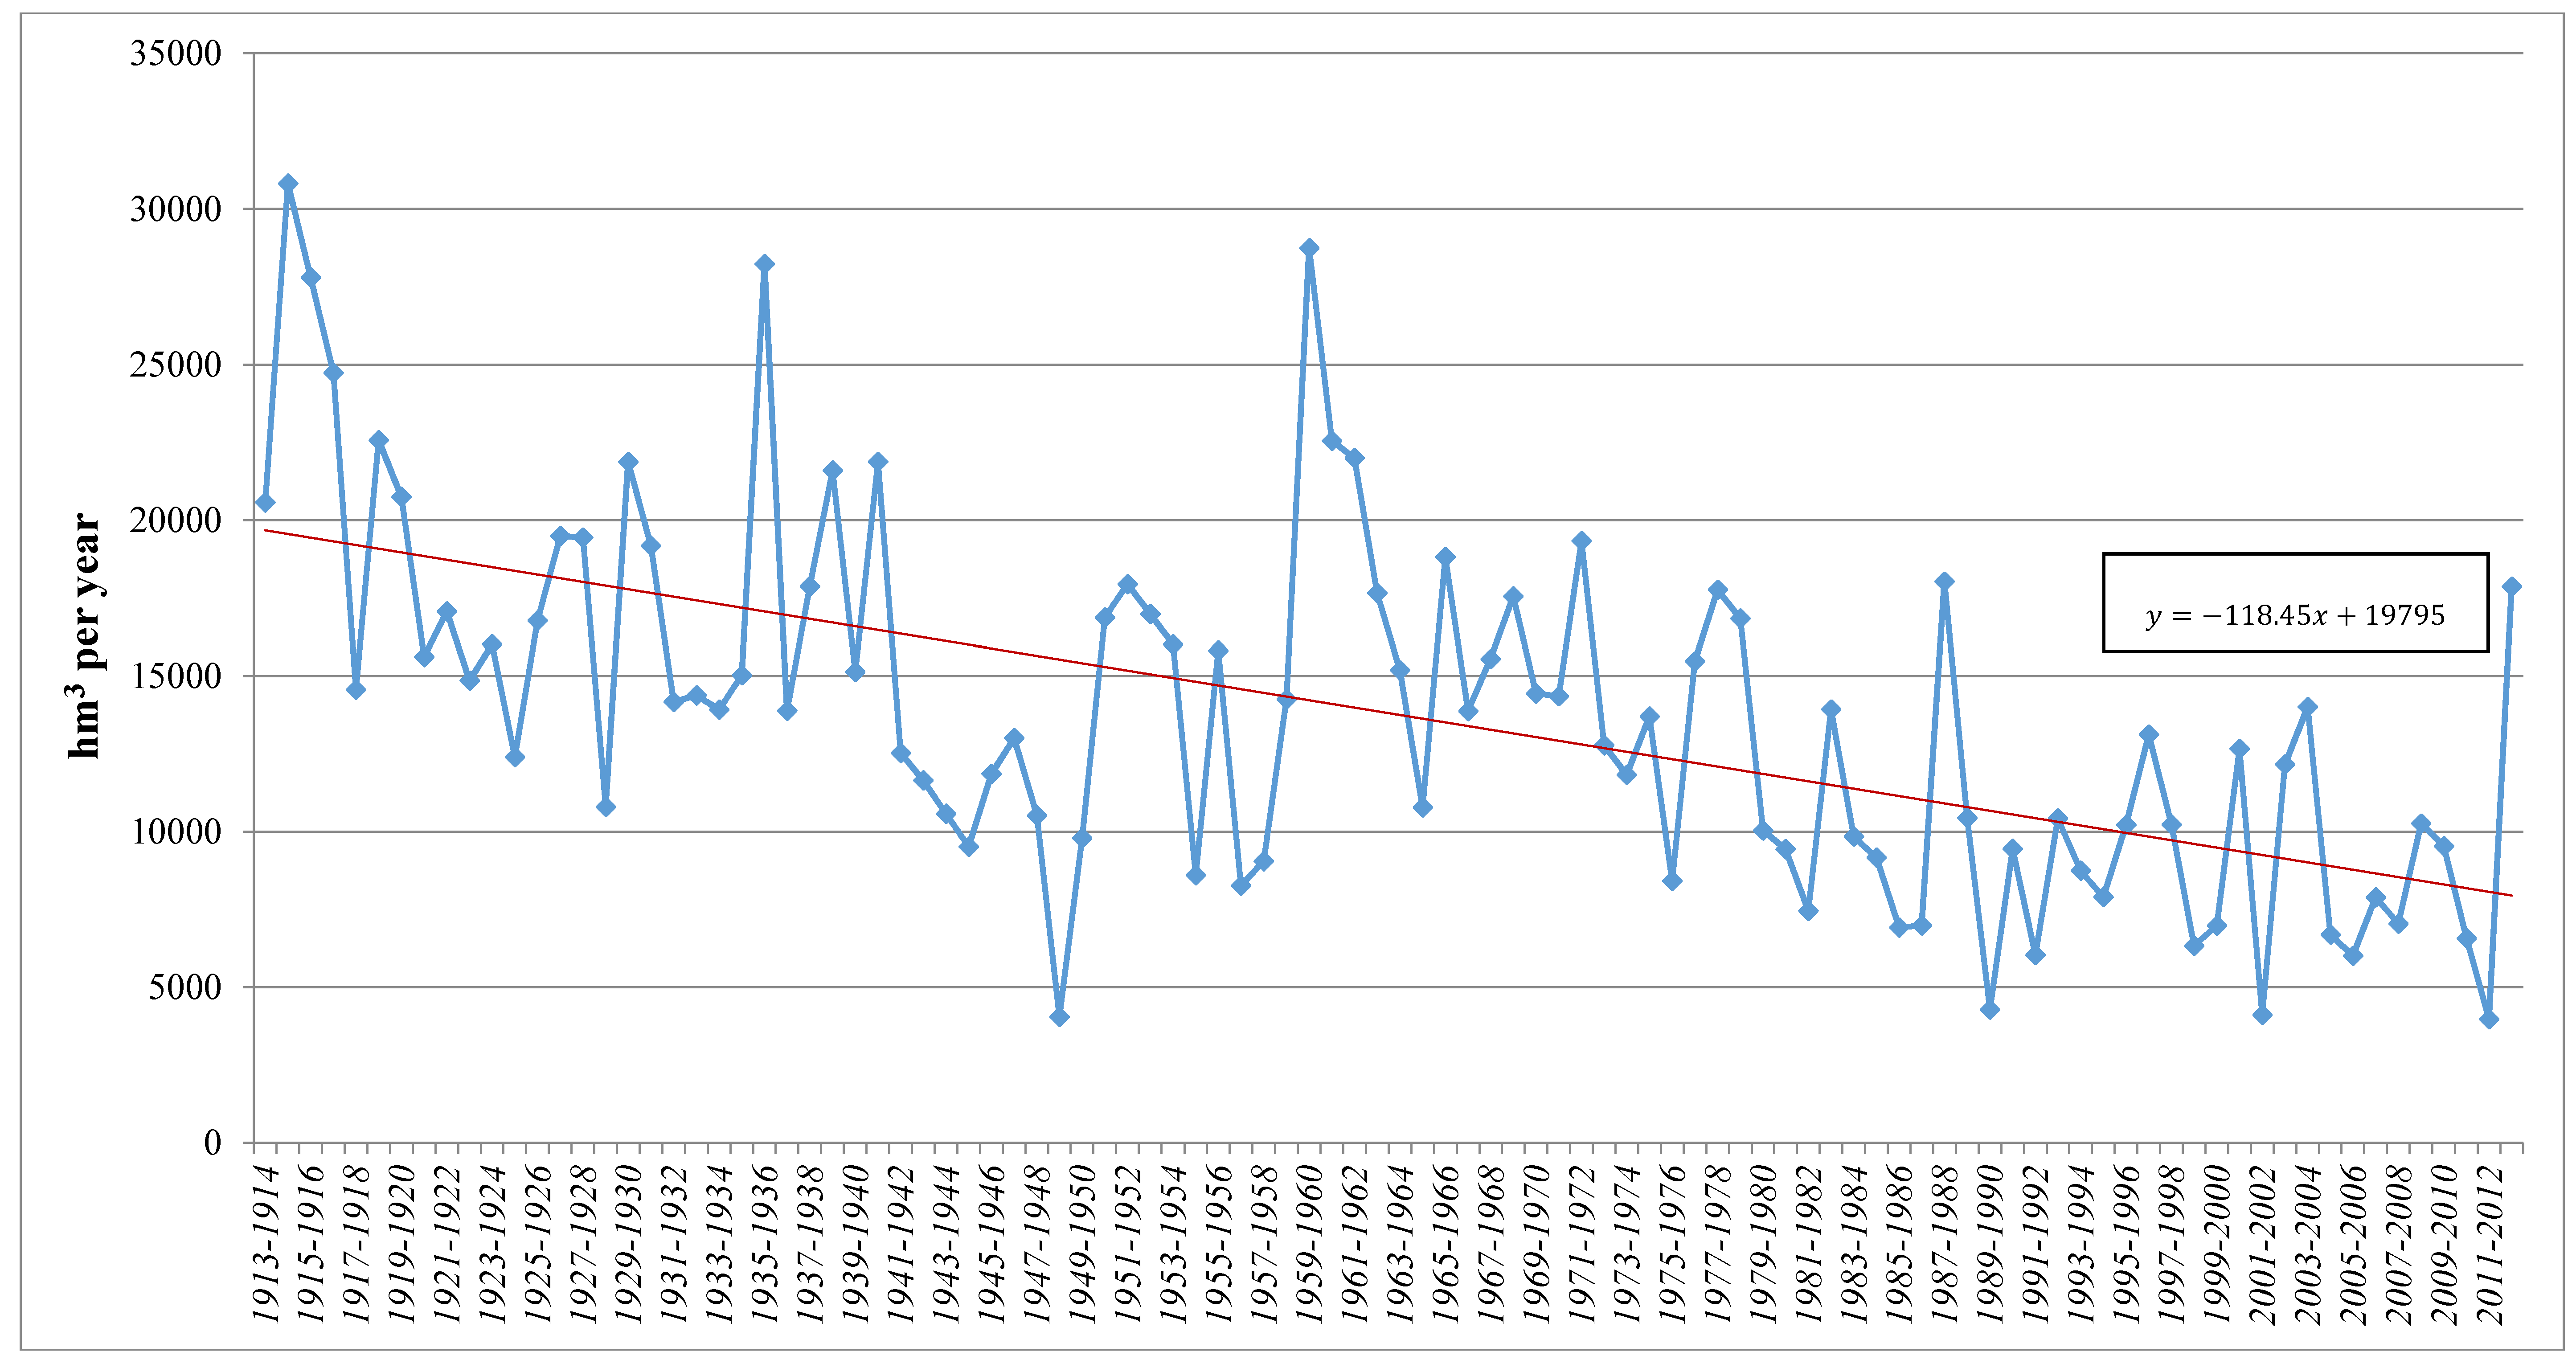
Figure 2.
Water flows plus water consumption in Tortosa (hm3 per year) 1913–2013. Note: x is obtained as in Figure 1. Source: Own elaboration.
Figure 2.
Water flows plus water consumption in Tortosa (hm3 per year) 1913–2013. Note: x is obtained as in Figure 1. Source: Own elaboration.

Figure 3.
Water flows in Tortosa (hm3 per year) 1913–2013 with trends and cycles. Source: Own elaboration. See also Supplementary Online Material of [4]. Note: x is obtained as in Figure 1 using for each cycle its initial year.
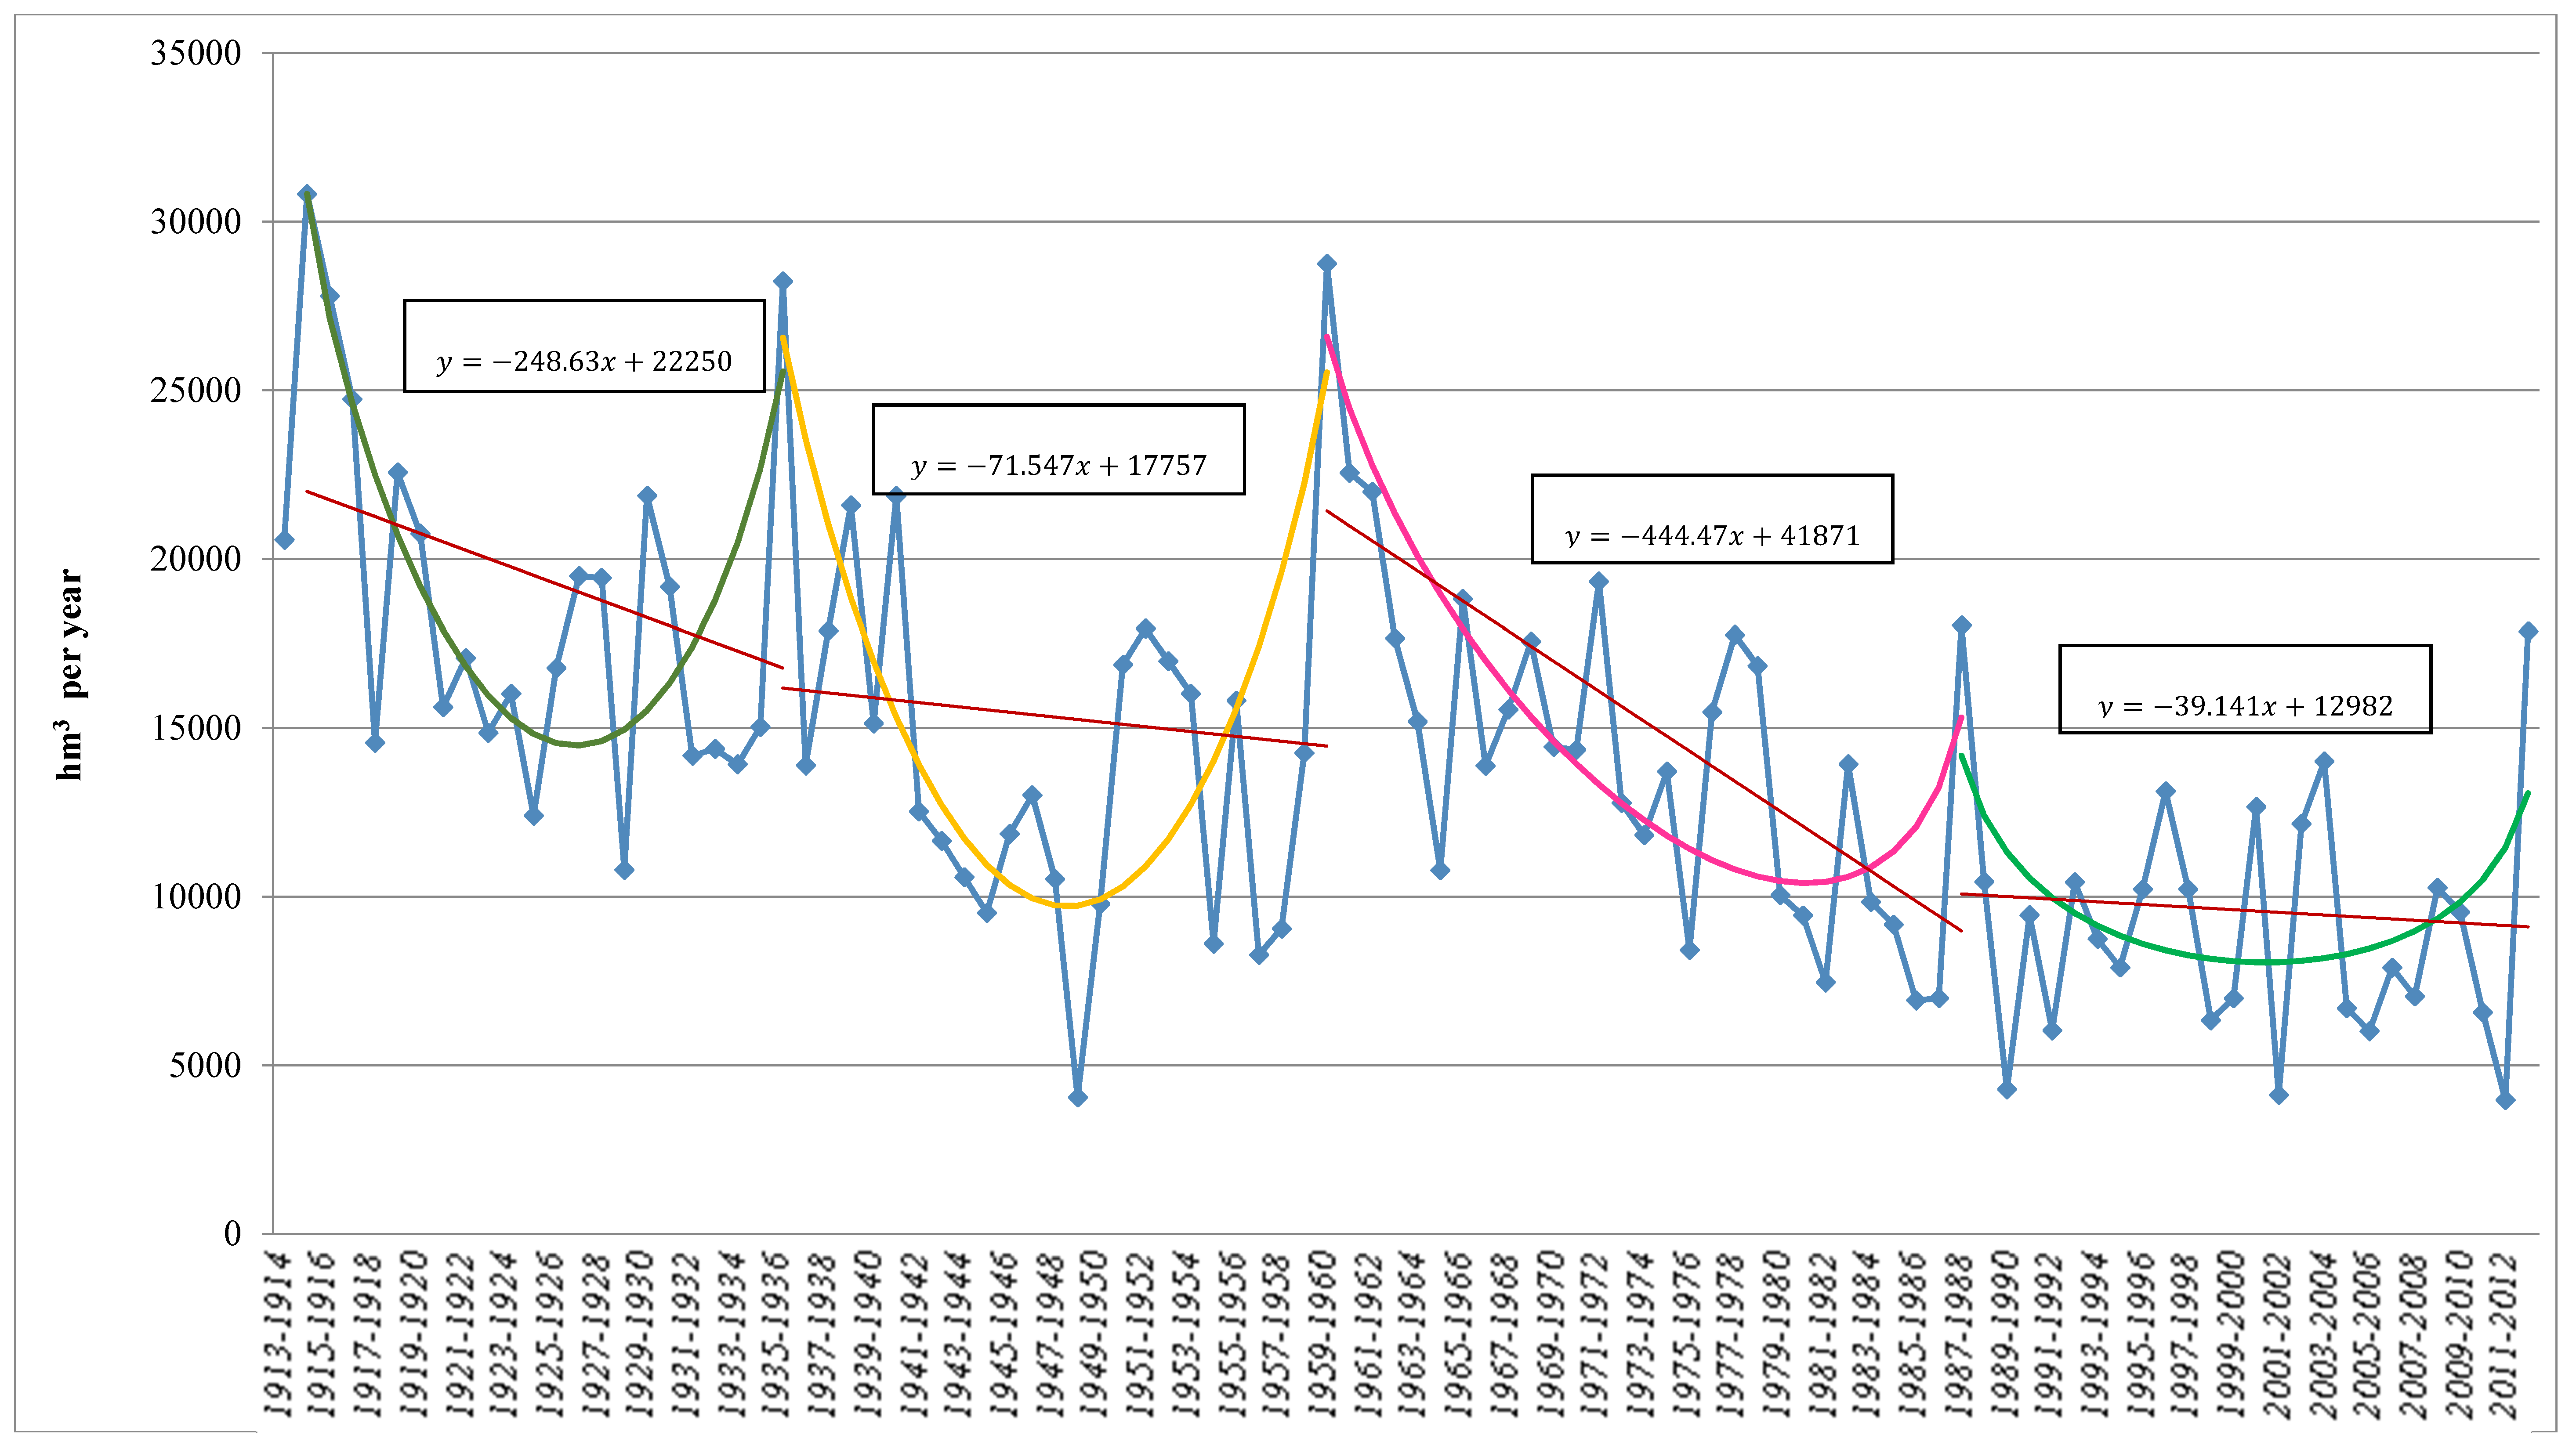
This allows us to observe that the first cycle runs until 1935–1936, peaking in 1914–1915, and displaying a convex curvature and a decreasing trend. The second cycle runs from 1935–1936 until 1959–1960 and includes the lowest value for the period, from 1948–1949. Again, the curvature is convex. The third cycle extends from 1959–1960 to 1987–1988, again displaying convex curvature and a sharply declining trend. The fourth cycle runs until 2012–2013, also with a convex curvature but the trend is slightly doward. All of them confirm the declining flow trend.
To sum up, we have two main conclusions. First, the trend in water resources from 1913 to the present is decreasing and worryingly so over the last 20 years. Second, significant volatility is observable, revealing a striking irregularity (with asymmetric cycles and dry years).
Observation of the irrigated area (see Table 2), meanwhile, points to several key factors. First, the irrigated area of the Ebro basin around 1916 was almost one third of the total irrigated area in Spain, but the proportion declined slowly over the course of the 20th century. Second, this area was two thirds greater in the 1990s than in 1916. The fall in the relative proportion of irrigated land of the Ebro basin, relative to the total for Spain, is one result of the early implementation of water and irrigation policies in this region, which was then (relatively) neglected to focus on other areas (see [19] for details). Finally, continuing growth in the area of irrigated land after 1956 is still significant, although it has slowed continuously since the mid-1960s. Specifically, this growth is notable in Huesca province as well as in Navarra, Zaragoza, and Lerida provinces, which still showed a slow growth in 1991–1995, except in Lerida. These regions produce the essential development of irrigated agriculture in the Ebro basin. Then, their agrarian activities as well as the agri-food industry have the main responsibility for the pressure on water resources in the Ebro basin.
| Region | 1916 | 1951–1955 | 1956–1960 | 1961–1965 | 1966–1970 | 1971–1975 | 1976–1980 | 1981–1985 | 1986–1990 | 1991–1995 |
|---|---|---|---|---|---|---|---|---|---|---|
| Álava | 0.4 | 2.8 | 2.8 | 2.9 | 2.5 | 2.3 | 1.9 | 1.4 | 5.8 | 6.8 |
| Navarra | 34.4 | 66.8 | 66.2 | |||||||
| La Rioja | 36.3 | 40.5 | 39.8 | 40.5 | 43 | 46.6 | 47.4 | 47.6 | 47.1 | 44.4 |
| Huesca | 63.1 | 84.7 | 86.1 | |||||||
| Teruel | 39.7 | 32.8 | 32.3 | 32.7 | 34.1 | 36.5 | 35.8 | 36.3 | 35.6 | 35 |
| Zaragoza | 115.7 | 128.4 | 128.6 | |||||||
| Lerida | 116.9 | 138.4 | 139.5 | |||||||
| Tarragona | 34.6 | 44.2 | 43.7 | 51.5 | 57.6 | 53.9 | 55.6 | 59.2 | 65.2 | 67.2 |
| Ebro basin | 441.1 | 538.6 | 539 | 581.1 | 629.1 | 654 | 672.7 | 687.9 | 711.4 | 729.4 |
| Approximated average growth | 2.50 | 0.08 | 4.98 | 3.74 | 3.04 | 4.70 | 3.60 | |||
| Total Spain | 1366.4 | 1656.3 | 1770.6 | 1957.9 | 2175.3 | 2532.1 | 2739.5 | 2939.5 | 3132.7 | 3188.7 |
| % of Spain | 32.3 | 32.5 | 30.4 | 29.7 | 28.9 | 25.8 | 24.6 | 23.4 | 22.7 | 22.9 |
Note: Source: [19].
4. Conclusions and Remarks
The increasing pressure on water resources affects society (human activities), the economy (agriculture, industry, ecosystem services), and the environment. These impacts also provoke social and environmental conflicts among agents. Water policies, therefore, seek strategies focused on smoothing and reducing the impacts of water constraints.
For this purpose, observing the past evolution of river flows is a key way to provide information for political and technical decision-makers, and to fuel debate about the present and future uses of water. Thus, our main objective has been to analyze the river flows of the Ebro basin from 1913–2013, which has allowed us to shed light on the study of river flows from the beginning of the 20th century, as well as to provide a better forecast for water management.
Our main findings in this study are a decreasing trend in water resources from 1913 to the present and significant volatility, revealing a striking irregularity with asymmetric cycles and dry years, thus requiring further research. In addition, we have observed worrying falls in recent years, which correspond to the transformation processes of the Spanish economy and thus with the abandonment of the countryside. This fact is also intensified by climate change. Meanwhile, the long-cycle trend is not clear although long cycles of around fifty years could take place. Again further research in this area should be carried out before tackling any simulation.
The link between land changes and water availability is becoming increasingly important. Current plans in the basin have been focused on increasing the irrigated area. However, recent studies in this area point out the increasing relevance of consolidating the current irrigated area through alternative technological improvements in this region to avoid the abandonment of land [4]. Besides, these improvements are parallel to an increasing energy demand for irrigation. This dilemma has to be addressed as any decision has implications for water availability. In line with our findings, additional water resources will not be available in this region. This involves a low security of water supplies. Moreover, large energy costs and large modernization investments that have been carried out in recent years require to be recovered. Given this situation, it would be reasonable not to increase the irrigated area and consolidate and extend the current modernization processes to ensure the viability of existing farms without additional environmental pressures. However, future research to assess the interdependence of water, energy, and land through hydrological and economic evaluations would be of great value to design strategies to mitigate the effects of climate change.
To conclude, the design of strategies to cope with water restrictions and ensure the availability of water should consider these observable findings. This work also serves to encourage further development of prevention and compensation policies, as well as to forecast future scenarios to solve existing environmental and social conflicts such as the failure of expectations of farmers.
Acknowledgments
We would like to thank anonymous reviewers for useful comments. The authors would also like to express their gratitude for funding received from the Spanish Ministry of Science and Innovation project (ECO2010-14929, AP2010-3729, and ECO2013-41353-P).
Conflicts of Interest
The authors declare no conflict of interest.
References
- United Nations Educational, Scientific, and Cultural Organization (UNESCO). Water in a changing world. In The United Nations World Water Development, Report 3; UNESCO Publishing and Earthscan: Paris, France; London, UK, 2009; p. 318. [Google Scholar]
- Vörösmarty, C.J.; Syvitski, J.; Day, J.; de Sherbinin, A.; Giosan, L.; Paola, C. Battling to save the world’s river deltas. Bull. At. Sci. 2009, 65, 31–43. [Google Scholar] [CrossRef]
- Milano, M.; Ruelland, D.; Dezetter, A.; Fabre, J.; Ardoin-Bardin, S.; Servat, E. Modeling the current and future capacity of water resources to meet water demands in the Ebro basin. J. Hydrol. 2013, 500, 114–126. [Google Scholar] [CrossRef]
- Philip, J.M.; Sánchez-Chóliz, J.; Sarasa, C. Technological change in irrigated agriculture in a semi-arid region of Spain. Water Resour. Res. 2014, 50, 9221–9235. [Google Scholar] [CrossRef]
- Pinilla, V. The development of irrigated agriculture in twentieth-century Spain: A case study of the Ebro basin. Agric. Hist. Rev. 2006, 54, 122–141. [Google Scholar]
- Palanques, A.; Plana, F.; Maldonado, A. Recent influence of man on the Ebro margin sedimentation system, northwestern Mediterranean Sea. Mar. Geol. 1990, 95, 247–263. [Google Scholar] [CrossRef]
- Xing, F.; Kettner, A.J.; Ashton, A.; Giosan, L.; Ibáñez, C.; Kaplan, J.O. Fluvial response to climate variations and anthropogenic perturbations for the Ebro River, Spain in the last 4000 years. Sci. Total Environ. 2014, 473–474, 20–31. [Google Scholar] [CrossRef] [PubMed]
- Sánchez-Chóliz, J.; Sarasa, C. Water resources analysis in Riegos del Alto Aragón (Huesca) in the first decade of the 21st century. Econ. Agrar. Recur. Nat. 2013, 13, 95–122. [Google Scholar]
- Bielsa, J.; Cazcarro, I.; Sancho, Y. Integration of hydrological and economic approaches to water and land management in Mediterranean climates: An initial case study in agriculture. Span. J. Agric. Res. 2011, 9, 1076–1088. [Google Scholar] [CrossRef] [Green Version]
- Gallart, F.; Llorens, P. Water resources and environmental change in Spain. A key issue for sustainable integrated catchment management. In Environmental Change and Water Sustainability; García Ruíz, J.M., Jones, J.A.A., Arnaez, J., Eds.; IPE-CSIC: Zaragoza, Spain, 2002; pp. 11–20. [Google Scholar]
- Beguería, S.; López-Moreno, J.I.; Lorente, A.; Seeger, M.; García-Ruíz, J.M. Assessing the effect of climate oscillations and land-use changes on streamflow in the Central Spanish Pyrenees. Ambio 2003, 32, 283–286. [Google Scholar] [PubMed]
- López-Moreno, J.I.; García-Ruiz, J.M.; Beniston, M. Environmental Change and water management in the Pyrenees. Facts and future perspectives for Mediterranean mountains. Glob. Planet. Chang. 2008, 66, 300–312. [Google Scholar] [CrossRef]
- López-Moreno, J.I.; Vicente-Serrano, S.M.; Moran-Tejada, E.; Zabalza, J.; Lorenzo-Lacruz, J.; García-Ruiz, J.M. Impact of climate evolution and land use changes on water yield in the ebro basin. Hydrol. Earth Syst. Sci. 2011, 15, 311–322. [Google Scholar] [CrossRef] [Green Version]
- Sánchez-Chóliz, J. Los Recursos Hídricos del Ebro y el Plan Hidrológico Nacional; Universidad de Zaragoza: Zaragoza, Spain, 2005. [Google Scholar]
- Confederación Hidrográfica del Ebro (CHE). Flow records at gauging stations, 1913–2007. In Historical Data; CHE: Zaragoza, Spain, 2013. [Google Scholar]
- Ministerio de Medio Ambiente (MMA). National Hydrological Plan 2000, Hydraulics Analysis; MMA: Madrid, Spain, 2000. [Google Scholar]
- Confederación Hidrográfica del Ebro (CHE). Gauging Yearbook, 2008–2010; CHE: Zaragoza, Spain, 2008. [Google Scholar]
- Confederación Hidrográfica del Ebro (CHE). Automatic Hydrological Information System, 2011–2013; CHE: Zaragoza, Spain, 2013. [Google Scholar]
- Pinilla, V. Gestión y Usos del Agua en la Cuenca del Ebro en el Siglo XX; Prensas Universitarias de Zaragoza: Zaragoza, Spain, 2008. [Google Scholar]
© 2015 by the authors; licensee MDPI, Basel, Switzerland. This article is an open access article distributed under the terms and conditions of the Creative Commons Attribution license (http://creativecommons.org/licenses/by/4.0/).
Share and Cite
MDPI and ACS Style
Sánchez-Chóliz, J.; Sarasa, C. River Flows in the Ebro Basin: A Century of Evolution, 1913–2013. Water 2015, 7, 3072-3082. https://doi.org/10.3390/w7063072
AMA Style
Sánchez-Chóliz J, Sarasa C. River Flows in the Ebro Basin: A Century of Evolution, 1913–2013. Water. 2015; 7(6):3072-3082. https://doi.org/10.3390/w7063072
Chicago/Turabian StyleSánchez-Chóliz, Julio, and Cristina Sarasa. 2015. "River Flows in the Ebro Basin: A Century of Evolution, 1913–2013" Water 7, no. 6: 3072-3082. https://doi.org/10.3390/w7063072