
CO2 Reduction Potential of Water Saving in Vietnam

1
ESG Promotion Department, TOTO Ltd., 2-1-1, Nakashima, Kokurakita-ku, Kitakyushu City 802-8601, Japan
2
Department of Environmental Science, International College of Arts and Science, Fukuoka Women's University, 1-1-1, Kasumigaoka, Higashi-ku, Fykuoka City 813-8529, Japan
3
Water and Lifestyle Research Laboratory, 31-3, Munakata, Fukuoka 811-4141, Japan
*
Author to whom correspondence should be addressed.
Water 2015, 7(5), 2516-2526; https://doi.org/10.3390/w7052516
Submission received: 2 February 2015
/
Accepted: 14 May 2015
/
Published: 22 May 2015
Abstract
:In a previous study, we showed that widespread adoption of water-saving equipment had the potential to reduce CO2 emissions by 1% in Japan. The usage of already diffused equipment was used as an evaluation baseline. This was an evaluation model of developed countries. In order to evaluate the potential benefits of water-saving in developing countries, it is necessary to set the baseline, as cities in developing countries are expected to have the necessary infrastructure in place in the near future. In this paper, the potential for reducing CO2 emissions by water saving in Vietnam was evaluated. Based on the development of water infrastructure, and envisioning a society in which the latest high-efficiency flush toilet bowls and showers installed in Hanoi and Ho Chi Minh City are used in all Vietnamese houses as a near future baseline, we evaluated the potential reduction when a water-saving project is implemented. Under these conditions, an 8.8% reduction in CO2 emissions in Vietnam would be achieved by the widespread adoption of water-saving equipment. Following the recognition of the large environmental contribution potential of water saving, a water-saving project has been planned for implementation in Vietnam in the near future.
1. Introduction
In developing countries, it is expected that rapid economic expansion will result in the mass consumption of energy and resources. The transition of developing countries’ growth from mass-consumption to sustainable green growth is an urgent issue facing the world. With respect to energy issues, the framework of a smart city that enables utilization of renewable energies is gaining popularity as a solution for sustainable development, not only in developed countries, but also in developing countries.
Regarding water issues, urbanization and the construction of water infrastructures in developing countries will cause global water consumption to increase 1.8-fold, and act as a brake on the sustainable development of the Earth [1]. Table 1 shows the rate of sustainable access to basic sanitation and domestic water consumption per capita, and it can be seen that the rate of sustainable access to basic sanitation, which means the development of water infrastructure, significantly increases domestic water consumption [2]. Such an increase in domestic water use causes a further increase in energy consumption as the waterworks and sewer systems are operated. The population of urban areas is growing quickly, such as in Vietnam and Indonesia, has reached a global majority. Control of water demand at the time of the construction of waterworks and sewer systems in these areas is important not only for the preservation of water resources, but also for energy security.

Table 1.
Relationship between rate of continuous use of sanitary facility and domestic water consumption.
| Rate of Sustainable Access to Basic Sanitation | Population in 2007 (million) | Typical Countries | Domestic Water Usage (L/capita/day) |
|---|---|---|---|
| 100% | 685.3 | Japan | 442 |
| USA | |||
| Canada | |||
| Less than 100% More than 30% | 4061.2 | Indonesia | 132 |
| Vietnam | |||
| Mexico | |||
| Less than 30% | 1471.0 | India | 114 |
| Cambodia | |||
| Nepal |
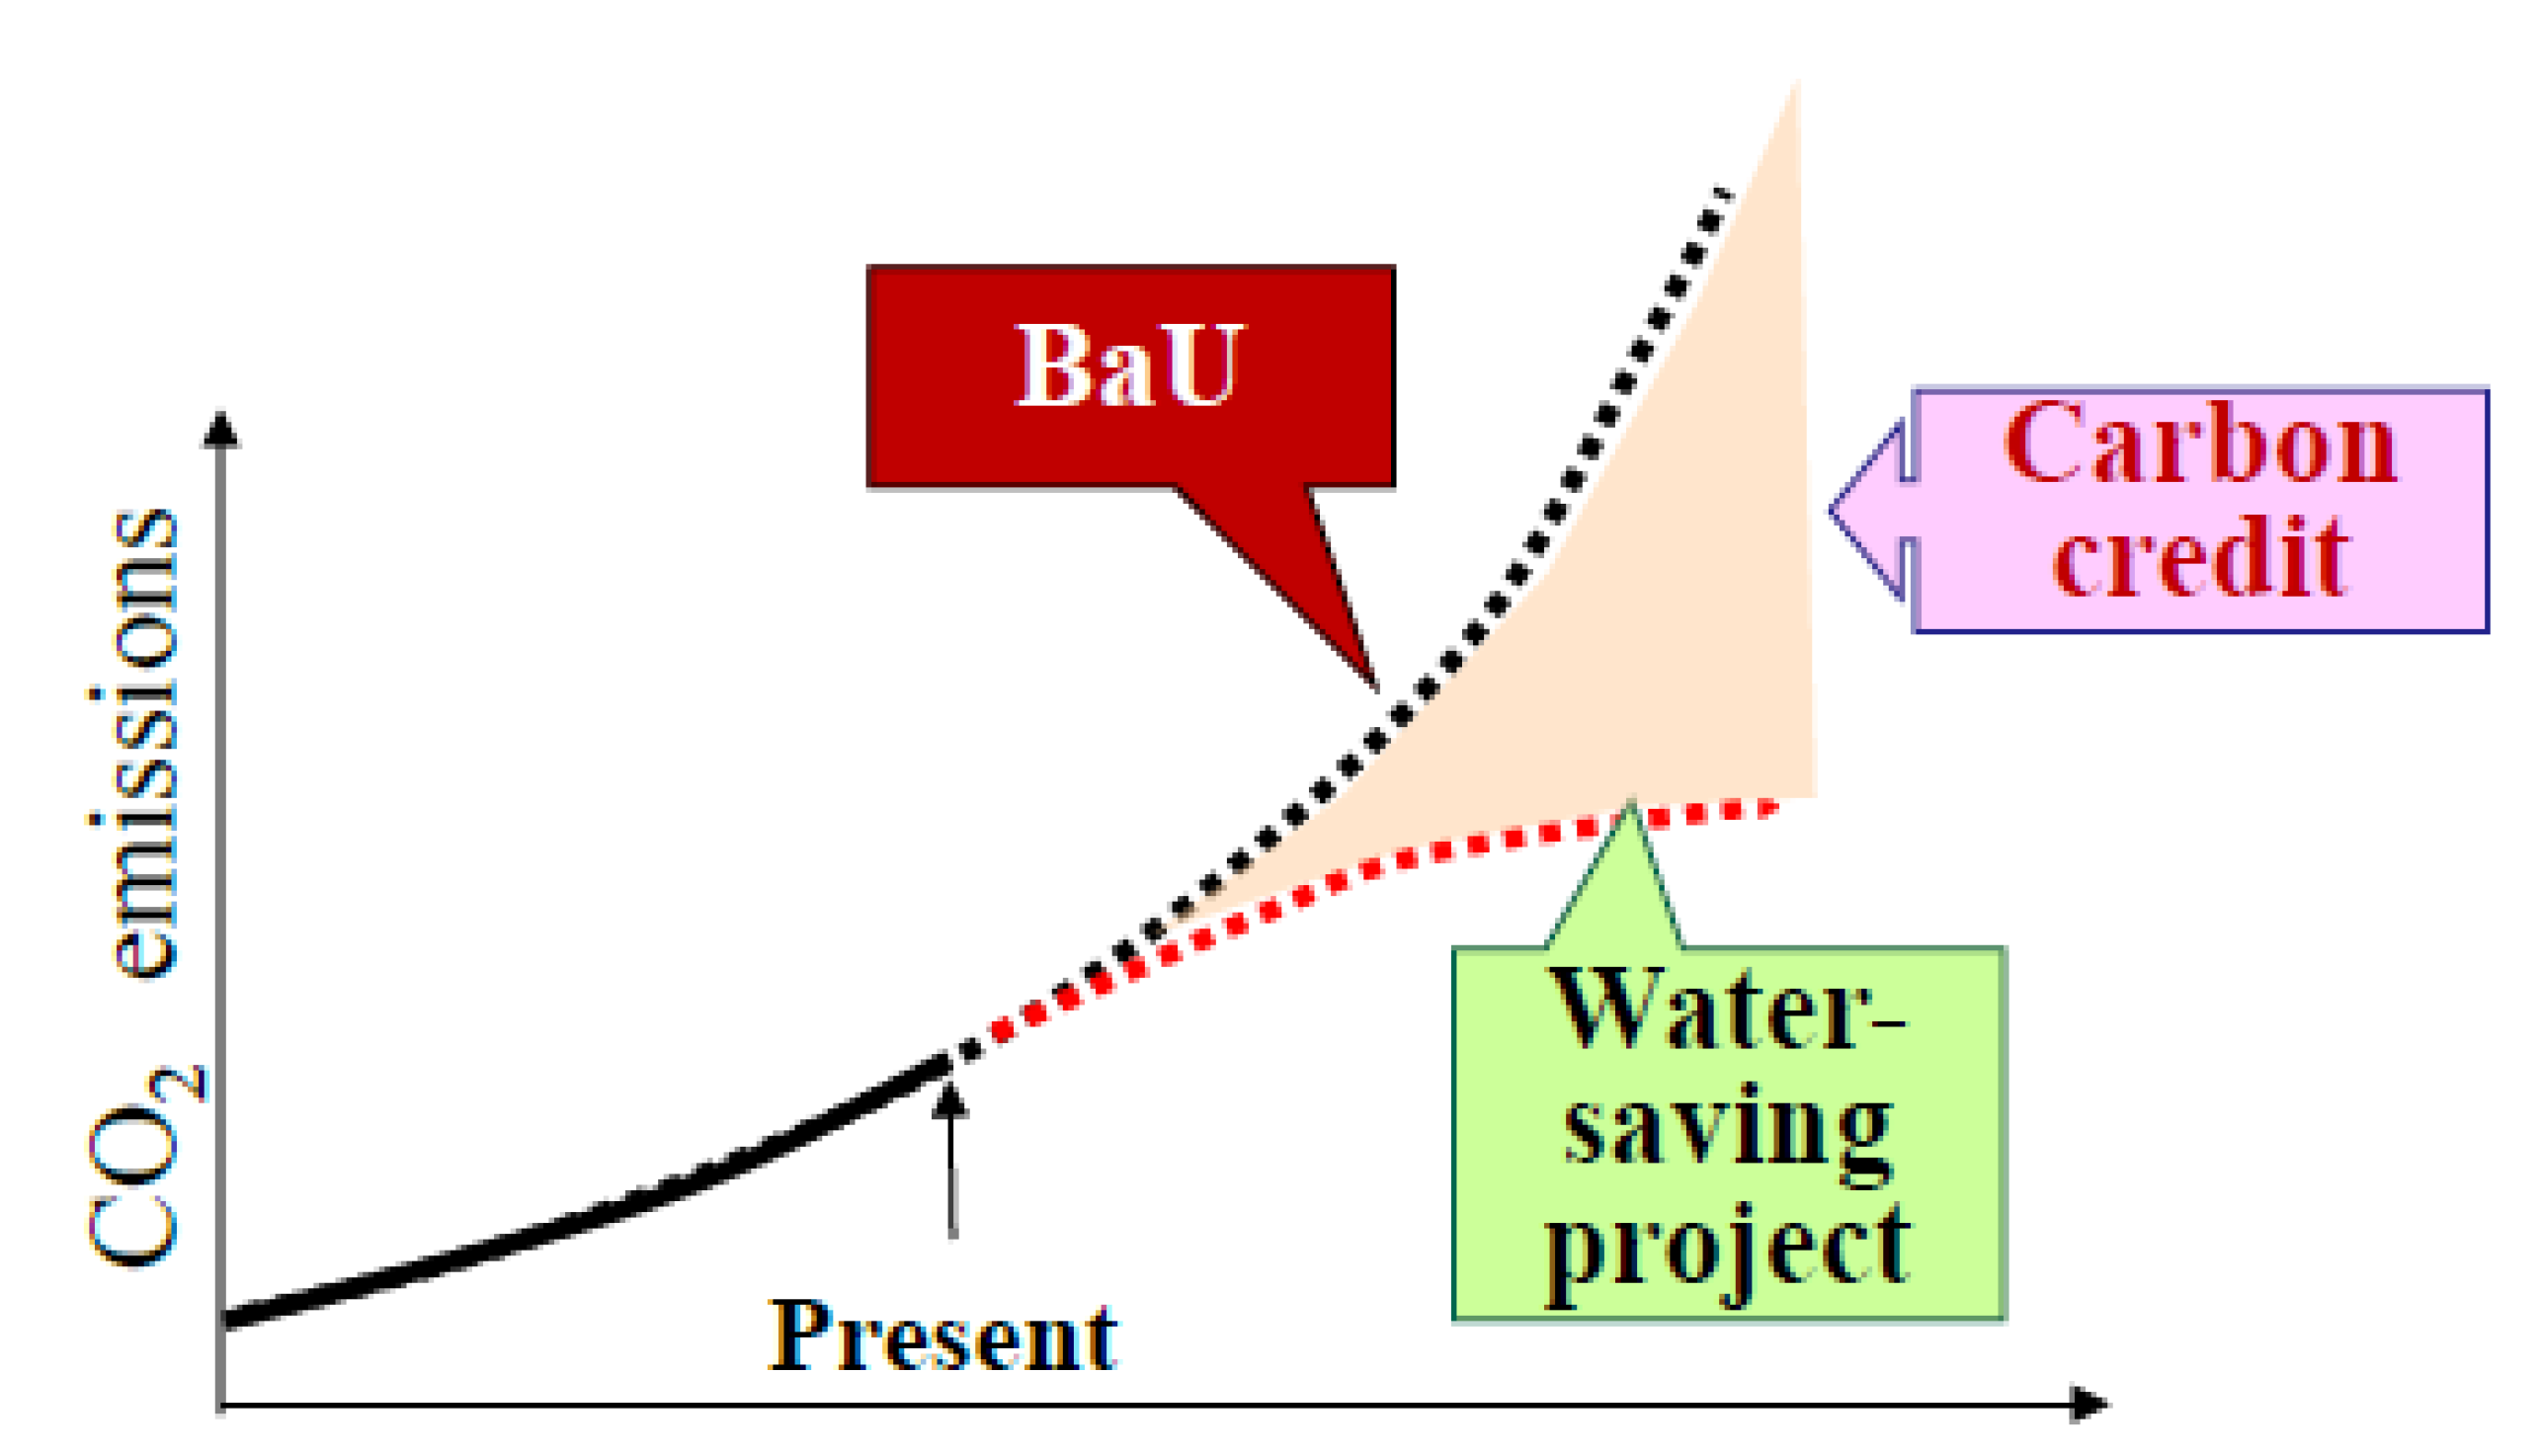
It should be noted that the authors have revealed in previous studies that the use of water is closely related to energy consumption, and that water saving contributes to energy saving and a 1% reduction in CO2 emission in Japan [3]. As a result, water saving is now employed as one of the energy security political measures the Japanese government has adopted against global warming. In addition, water saving is incorporated into a project to support the shift to a low carbon Asia conducted by the Japanese government [4]. This low carbon goal by the Japanese government for developing countries is being pursued through a bilateral offset credit scheme called the Joint Crediting Mechanism (formerly the Bilateral Offset Credit Mechanism). This scheme reduces CO2 emissions by developing countries using funds and technology provided by Japan, and treats that reduction as part of Japan’s global environmental contribution. The details of the scheme were described in a previous paper [5]. This research was performed as a part of a Joint Crediting Mechanism feasibility study project conducted by the Japanese government that evaluated CO2 reduction potential through the introduction of water-saving showerheads and toilet bowls in Vietnam. In the crediting scheme, the credit amount is evaluated as the difference between emissions following implementation of a low-carbon project and a near-future baseline. A conceptual diagram is shown in Figure 1. The near-future baseline (the Business as Usual or BaU line) is a forecast that assumes that the current new high-efficiency equipment in Vietnam is commonly used in all Vietnamese houses. The CO2 reduction potential in Vietnam was evaluated in the same manner of the crediting scheme.
Figure 1.
Conceptual diagram of water-saving project evaluation in developing countries. BaU: Business as usual.
Figure 1.
Conceptual diagram of water-saving project evaluation in developing countries. BaU: Business as usual.
2. Survey Method
To determine the BaU line, the data for Hanoi and Ho Chi Minh Cities were extracted as a model of the city to be generalized in Vietnam in the near future.
The evaluation formulae are shown in Equations (1) and (2). RIi is the reduced CO2 emission amount. efi is the CO2 emission factor of water. Δqi is the reduced water amount. pbi, ppi and ni are the equipment performances of BaU and the project, and the equipment usage number, respectively.
RIi = ∑( efi × ⊿qi )
⊿qi = ( pbi – ppi) × ni
In this survey, with the cooperation of the Vietnamese Ministry of Construction and the Energy Conservation Center, treated water volume and energy consumption data were collected by visiting waterworks and sewage facilities in Hanoi and Ho Chi Minh Cities, and we calculated the energy consumption rates and CO2 emission factors of the facilities in the same manner, as shown in a previous paper [6].
The equipment usage number: ni was ascertained by a questionnaire survey of 100 residents in each of the cities of Hanoi (n = 383) and Ho Chi Minh Cities (n = 387), with 10 residents of each group of 100 residents being interviewed. At this time, the performance of their water use equipment was ascertained by conducting measurements at each of the 10 residences. Photographs of existing toilet bowls and showerheads and three-dimensional measurement data of toilet tanks, attached to the 100 questionnaires, were also used to determine performance. Data logging flow meters (logging interval of 0.5 s) were installed in shower flow lines at 5 of the 10 residencies of interviewed survey participants to measure showering time. In addition, wattmeters were installed to measure the monthly energy consumptions of water pumps. The energy consumption rates of pumps were calculated by the energy consumption data collected and the values of the water meters of waterworks companies. To ascertain the shower flow rate, all interviewed residents’ showerheads and hose sets were brought back to Japan and measured to determine the optimal flow rate [7]. Furthermore, stores selling toilet bowls and showers were visited, and the performance of equipment on the market and the behavior of users with respect to purchasing criteria were researched to estimate equipment performance in the near future: pbi.
3. Results and Discussion
3.1. Current Status and Problems of Water Infrastructure in Vietnam
Urbanization has advanced rapidly in Vietnam, and four of its cities have populations of more than one million. In those cities, although waterworks are developing, sewage systems are less developed [8]. Overall, infrastructure development is not keeping pace with the expansion of cities, and there are many regions where a 24-h water supply does not exist. Also, due to the high rate of water leakage, the pressure in waterworks is set to a low value. Therefore, as shown in Figure 2, it was found that residents were installing water tanks to secure a ready supply of domestic water.
Figure 2.
Example of water supply system in a Vietnamese house.

The energy required for waterworks and sewer systems in Vietnam was analyzed by setting boundaries equivalent to the analysis of the system in Japan [3,6]. It was evaluated as energy consumption per unit of water, and calculated by dividing the total sum of energy consumption in all water supply and sewage facilities in Hanoi and Ho Chi Minh Cities by the total amount of treated water (see Table 2). Rapid sand filtering is employed in waterworks, and the activated sludge method is employed in the sewage systems. The system configurations are not much different from those in Japan, and the energy consumption rate of water is within the range of the rate distribution of all facilities in Japan and, therefore, the calculated result was determined as appropriate.
| Process | Energy Consumption Rate of Water (MJ/m3) |
|---|---|
| Waterworks system | 1.44 |
| Sewer system | 1.05 |
| Water supply system in a house | 1.99 |
3.2. Characteristics of Residents and Current and Future Situation Regarding Water Use Equipment
To study the potential of environmental load reduction by introducing water-saving toilets and showers, the performance of equipment used and the behavior of equipment use were surveyed in two cities: Ho Chi Minh City, where there are only dry and rainy seasons; and Hanoi City, where there are four seasons. There are about 21 million people in Vietnam, and 99% of them live in detached houses, only 230,000 (4% of residents in city areas) people live in collective housing, such as apartments in the inner city area [10]. Accordingly, detached houses were selected as the research target. Figure 3 and Figure 4 show an example of water-related equipment in one of the houses we visited. Many residences in Hanoi and Ho Chi Minh City are like the one shown in the photograph: the building structure has a narrow frontage, great depth, and three floors. All surveyed residences had a toilet and shower room on each floor. According to the interview results, most Vietnamese families in large cities have two wage earners, and grandparents often live in the house to support in child-raising. As each generation uses one floor, it is typical for them to install a toilet/shower room on each floor. The average household size is 4.1 persons/household in Ho Chi Minh City, and considering that young, single people are coming into the large city, it appears that the average household size is large [11].
Figure 3.
Outside view of the residence visited in Ho Chi Minh City, Vietnam.
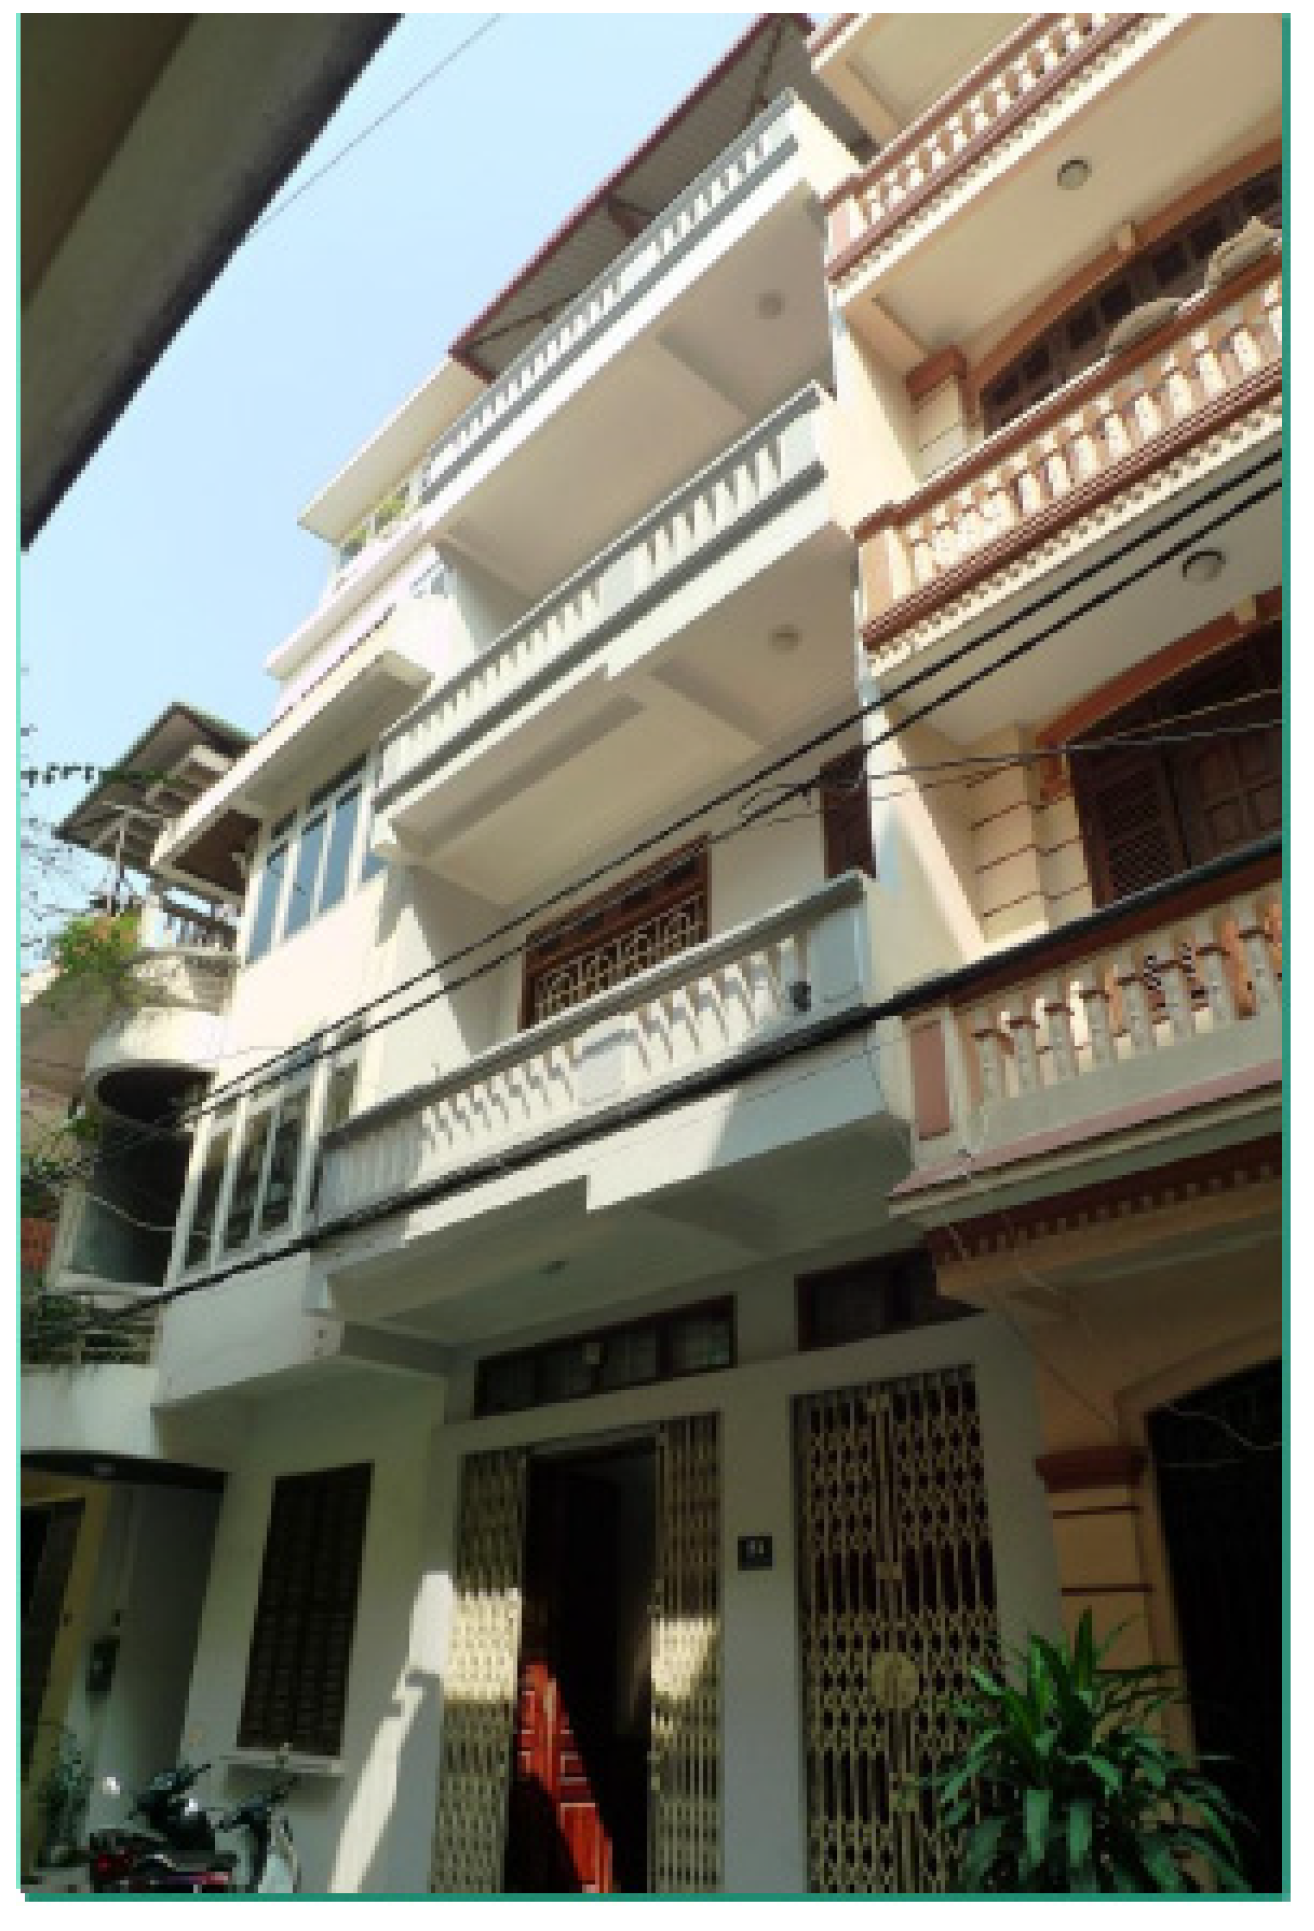
Figure 4.
Photograph of a washroom in the residence.

All the toilets surveyed were Western-style, flushing toilets. All the residences had showers. Table 3 and Table 4 show the average performance of the toilets and the result of elimination behavior. The details for the calculation were shown in the previous paper [12]. The results of preliminary survey and modeling of Japan and China are included. Although the daily number of times of using the toilet was similar in Japan, China, and Vietnam, which is 7–8 times per day, there was a slight difference in the number of times using and flushing the toilet at home. The number of times the toilet was used in the house was extracted from the 24-h data, using the house stay rate data in Figure 5. Vietnamese family members stay home longer than family members do in Japan, as many company employees go home for lunch, and schools have a double system of morning/afternoon (see Figure 5), and this is reflected in household toilet usage. Regarding toilet equipment performance, the amount of water in a flush is much less than the average toilet in Japan. It is thought that this is because many Vietnamese households use a bidet-type water nozzle for post-excretion cleaning purposes instead of using toilet paper. Thus, the waste volume in a toilet and the required flushing water in Vietnam are smaller than those of Japan. People do not dispose of toilet paper in toilets in China, either.
| Toileting Behavior | Vietnam | Japan [13] | China [14] | |
|---|---|---|---|---|
| Number of eliminations | Excrement | 1.1 | 1.1 | 1.3 |
| Urine | 6.1 | 5.4 | 6.7 | |
| Total | 7.2 | 6.5 | 8.0 | |
| Number of toilet flushes at home | Full flush | 2.1 | 2.1 | 1.8 |
| Half flush | 4.8 | 2.6 | 4.3 | |
| Total | 6.9 | 4.7 | 6.1 | |
| Typical Toilet Bowl | Equipment Commonly Used | Water-Saving Equipment | ||
|---|---|---|---|---|
| Vietnam | Japan | China | ||
| Appearance |  |  |  |  |
| Performance [L/flush] | ||||
| Full flush | 6.0 | 13.0 (One mode) | 5.0 | 3.8–4.8 |
| Half flush | 5.0 | 3.5 | 3.0–3.6 | |
Figure 5.
Time spent at home in Vietnam by occupation (weekdays).
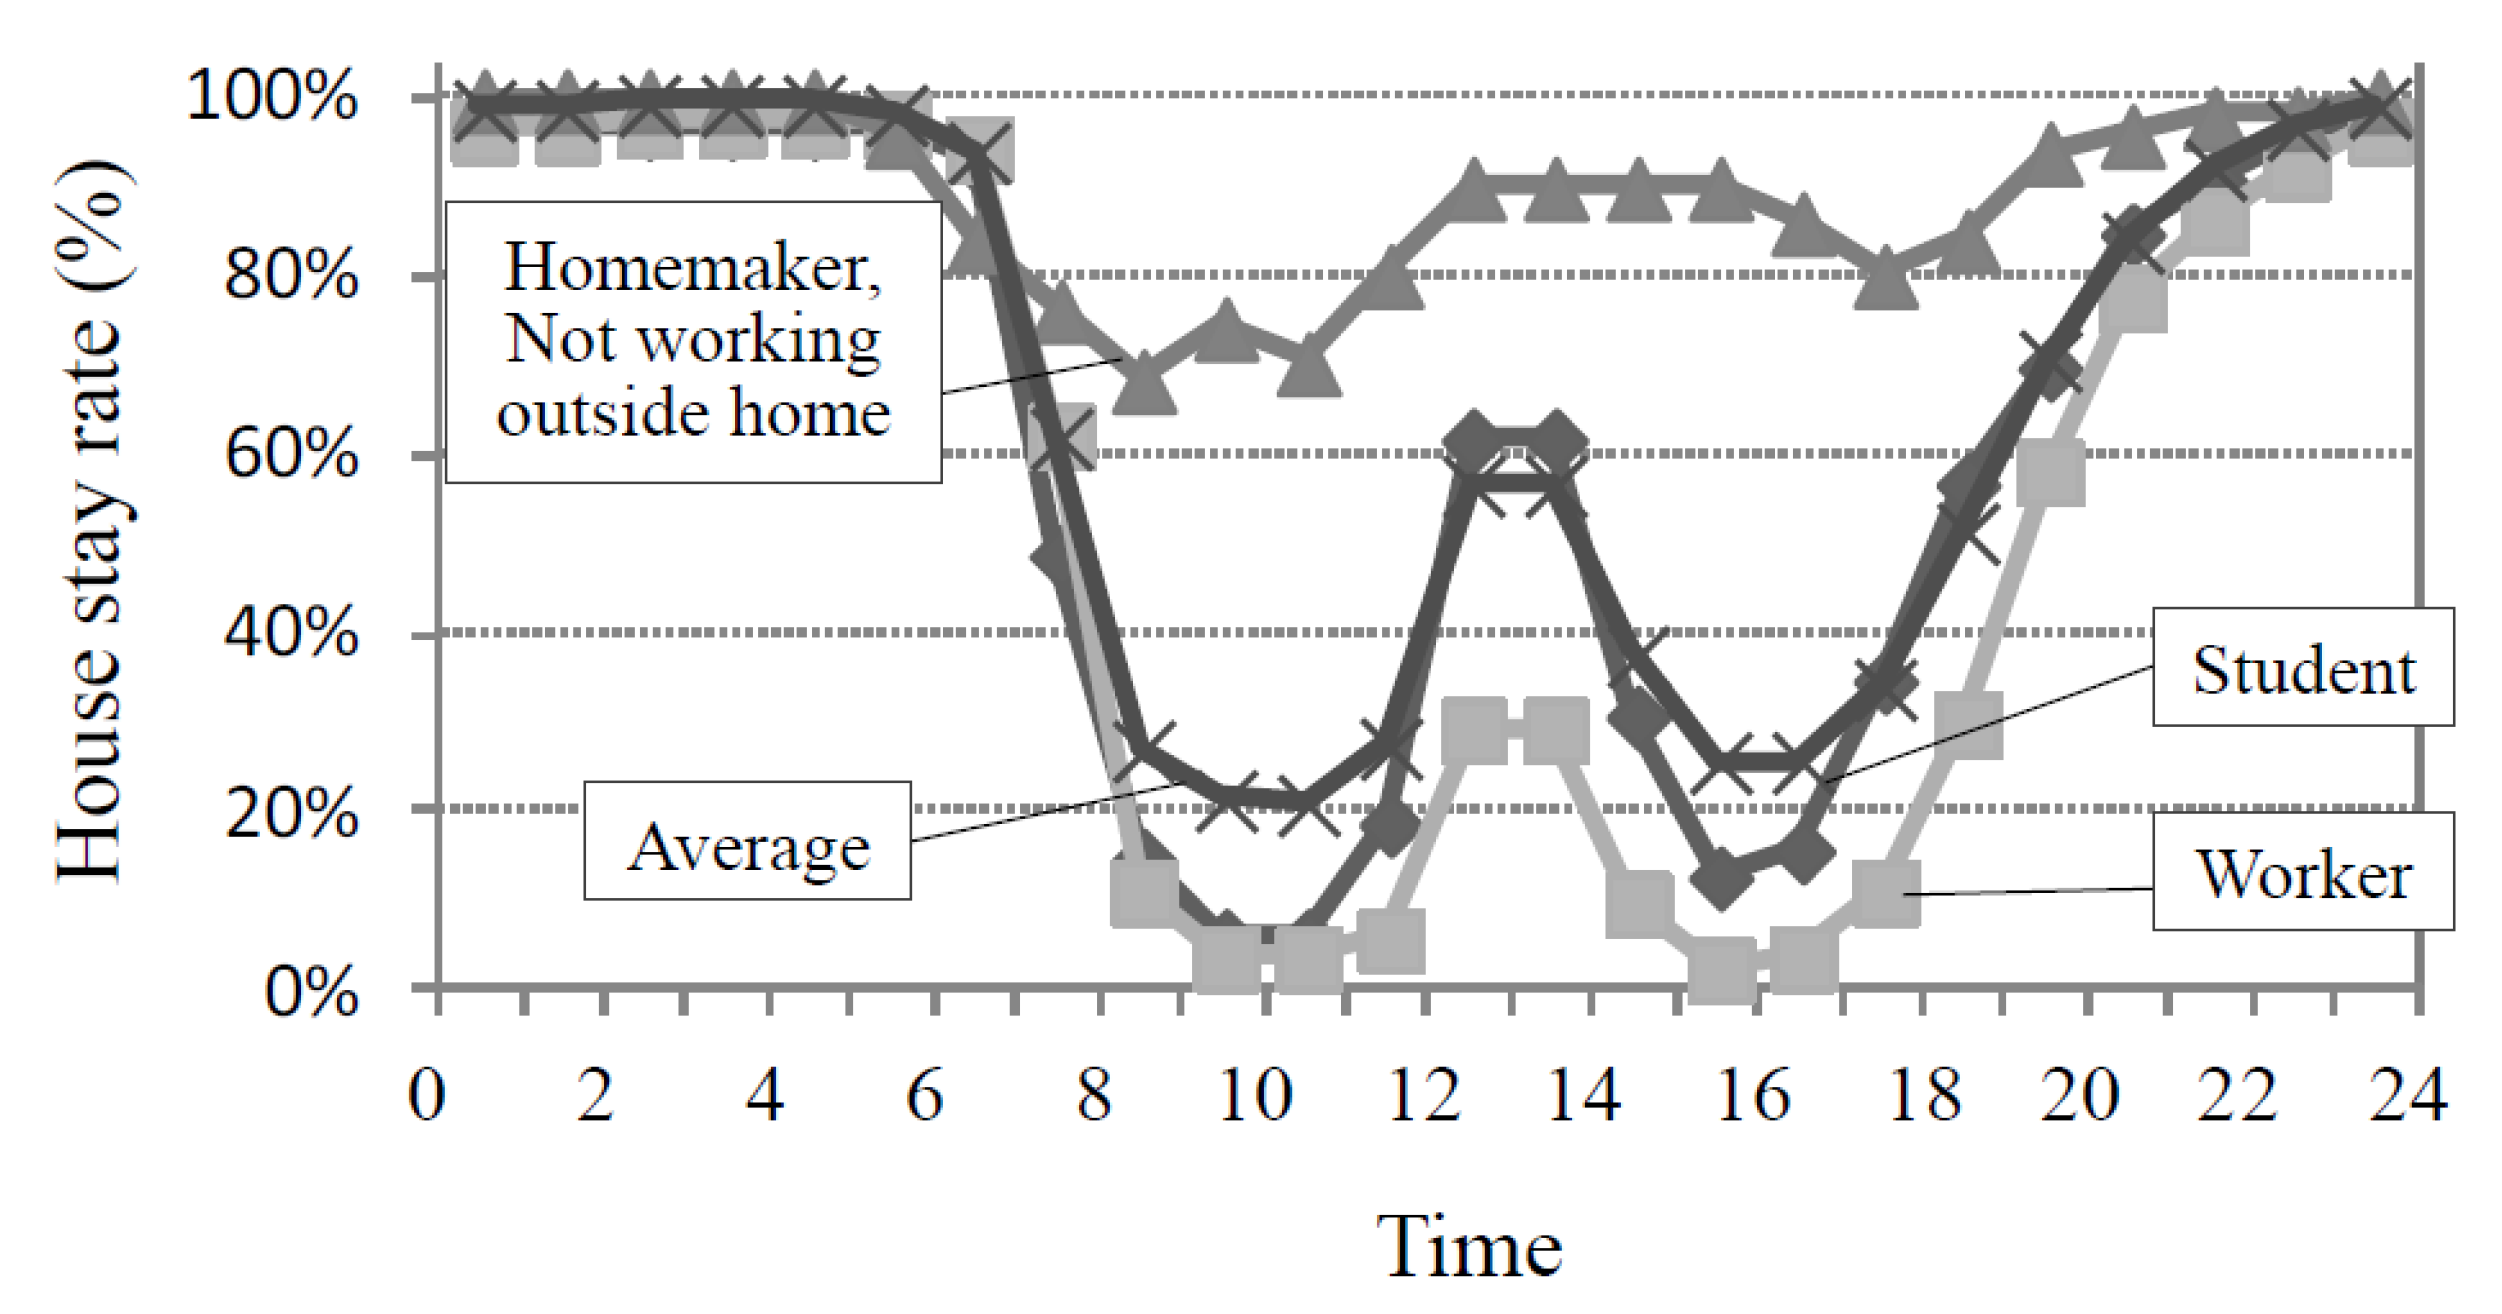
Table 5 shows the flow rates of the showerhead being used, and Table 6 shows the number of times and length of time using the shower. Showering behavior was affected by latitude and thus the number of showers taken in the tropical city of Ho Chi Minh City was higher than in Hanoi. The water heater ownership rate was 90% in Hanoi and 68% in Ho Chi Minh City, based on surveyed residents and it was learned that taking a hot shower has become fairly popular for many families. The most common type of water heater varies between the north and south. Instantaneous electric water heaters were common in Ho Chi Minh City, while hot-water storage electric heaters were common in Hanoi City. The heaters are shown in Table 7. According to distributors, storage heaters are selected in Hanoi because the tap water temperature is low in Hanoi City during winter and thus instantaneous heaters do not have the capability to warm water to a suitable temperature.
| Typical Showerhead | Equipment Commonly Used | Water-Saving Equipment | ||
|---|---|---|---|---|
| Vietnam | Japan | China | ||
| Appearance |  |  |  |  |
| Performance [L/min] * | 10.0 | 8.5 | 10.0 | 6.5 |
Note: * as an optimal flow rate.
| Showering Behavior | Hanoi City | Ho Chi Minh City |
|---|---|---|
| Number of showers per week | 6.8 | 7.9 |
| Shower duration time (min.) | 10.1 | 7.6 |
| Shower temperature (°C) | 36.3 | |
| Item | Instantaneous Electric Water Heater | Storage Electric Water Heater |
|---|---|---|
| Appearance |  |  |
| Power consumption (W) | 4500 | 2500 |
| Max. supply temperature (°C) | 40 | 60 |
| Storage capacity (L) | 0 | 10–30 |
Also, based on interviews about shower use during the survey in Ho Chi Minh City, most respondents said that they could not return to taking cold showers once having started taking hot showers. It is easy to assume that, with future economic growth in Vietnam, water heaters for showers will become even more popular in the near future.
3.3. CO2 Reduction Potential of Water Saving
The potential for reducing CO2 emissions by popularizing water-saving equipment was evaluated. First, the CO2 emission factor of water was determined based on the data for energy consumption rate, shown in Table 2, and CO2 emission factors of used energies, such as electricity. The calculated result is shown in Table 8.
| Process | Emission Factor (kg-CO2/m3) |
|---|---|
| Waterworks system | 0.23 |
| Sewer system | 0.16 |
| Water supply system in a house | 0.32 |
Note: CO2 emission factor of electricity: 0.576 kg-CO2/kw·h.
The performance of water-saving toilets and showers to be introduced to Vietnam is shown in Table 5 and Table 6. Although development of the water infrastructure is insufficient currently, in the future, it is expected that development of the water infrastructure will advance rapidly with the support of Official Development Assistance from Japan and other countries. It is also assumed that an improvement in living standards will rapidly increase energy consumption resulting from hot water supply for showers and so on. Accordingly, assuming a near-future society where water infrastructures have developed and hot showers are common, the potential for reducing CO2 emissions by water saving was calculated. Table 9 shows the results, along with the CO2 reduction potential by water saving, as calculated for Japan and China.
| Item | Vietnam | Japan | China |
|---|---|---|---|
| Energy consumption rate of water (kWh/m3) | 0.66 | 0.85 | 1.32 |
| CO2 emission factor of electricity (kg-CO2/kWh) | 0.58 | 0.41 | 0.84 |
| CO2 emission factor of water (kg-CO2/m3) | 0.39 | 0.44 | 1.11 |
| CO2 reduction potential by water saving (% ratio to whole emission) | 8.8 | 1.0 | 1.8 |
Research that relates to city water consumption and energy has been carried out in advanced nations [3,15,16,17]. This research was influenced by the examination of water saving in cities where the waterworks and sewerage systems were already developed. According to these results, the widespread adoption of water-saving equipment has the potential to reduce CO2 emissions by 1% in Japan and Taiwan. Contribution of water saving in Vietnam was estimated to reduce CO2 emissions by 8%. Since the energy consumption of Vietnam is still small, this greatly influences the contribution of water saving.
The Vietnam National Green Growth Strategy was announced in September 2012, and actions against global warming are being promoted. It is possible that the popularization of water-saving equipment will become a policy that contributes to green growth.
4. Conclusions
So as to actively contribute to the fight against global warming, the Japanese government is using a joint crediting mechanism and promoting projects to leapfrog development in cities in developing countries so that they become low-carbon societies. As a water-infrastructure version of the green growth scenario to create low-carbon cities in developing countries conducted by the Japanese government, the authors evaluated the CO2 reduction potential by the formation of a water-saving society. It appears that the formation of a water-saving society would prove effective in mitigating against the future increase in CO2 emissions brought about by urbanization in Vietnam. When this idea is broadly accepted, and each developed country exercises its expertise in supporting developing countries, it is expected that the urban environment will become more environmentally friendly in many areas, and the reduction of carbon emissions will be accelerated.
Acknowledgments
This survey was conducted in Vietnam as a part of the “Global Warming Mitigation Technology Promotion Project (FY2012)” of the Ministry of Economy, Trade and Industry of Japan, and as a part of the “Project to Support the Large-Scale Formation of Joint Crediting Mechanism Programs to Realize Low Carbon Societies in Asia (FY2013)” of the Ministry of the Environment of Japan.
Author Contributions
The survey and analysis in this study were carried out by Takayuki Otani and Kanako Toyosada under the direction and supervision of Yasutoshi Shimizu. The first draft of the manuscript was prepared by Takayuki Otani, and later versions were revised and edited extensively by Yasutoshi Shimizu before publication. All authors discussed the results and commented on the manuscript at all stages.
Conflicts of Interest
The authors declare no conflict of interest
References
- Ministry of Land, Infrastructure, Transport and Tourism of Japan, Water resources in Japan. Available online: http://www.mlit.go.jp/tochimizushigen/mizsei/water_resources/contents/current_state2.html (accessed on 31 December 2014).
- Black, M.; King, J.; Lacey, C. The Atlas of Water; University of California Press: California, CA, USA, 2009. [Google Scholar]
- Yasutoshi, S.; Kanako, T.; Kiyoshi, N. Prediction of CO2 emissions associated with residential plumbing equipment. J. Soc. Heat. Air-Cond. Sanit. Eng. Jpn. 2010, 163, 11–18. (In Japanese) [Google Scholar]
- Yasutoshi, S.; Kanako, T.; Mari, Y.; Kyosuke, S. Creation of carbon credits by water saving. Water 2012, 4, 533–544. [Google Scholar] [CrossRef]
- Yasutoshi, S.; Satoshi, D.; Kanako, T. CO2 emission factor for rainwater and reclaimed water used in buildings in Japan. Water 2013, 5, 394–404. [Google Scholar] [CrossRef]
- Yasutoshi, S.; Satoshi, D.; Kanako, T. CO2 emission factor of water in Japan. Water 2012, 4, 759–769. [Google Scholar] [CrossRef]
- Japan Valve Manufacturers’ Association: Monitoring Test Method of Showers for Bathing (Hot Water Saving B). Available online: http://www.j-valve.or.jp/suisen/setsuyu/setsuyu-monitor.pdf (accessed on 31 December 2014).
- Ministry of Environment of Japan, Water Environmental Business in Asia. Available online: http://www.env.go.jp/water/coop/asia_businessdownload/s_moe.pdf (accessed on 31 December 2014). (In Japanese)
- JETRO, Electricity Survey Report in Vietnam. Available online: http://www.jetro.go.jp/ext_images/jfile/report/07001271/vietnamelectricity2013-2.pdf (accessed on 31 December 2014). (In Japanese)
- General Statistics Office of Vietnam, Statistical Information. Available online: http://www.gso.gov.vn/default_en.aspx?tabid=491 (accessed on 31 December 2014).
- JETRO, BPO Business Potential Survey Report in Vietnam (in Japanese). Available online: http://www.jetro.go.jp/jfile/report/07000780/vnm_bop.pdf#search='%E3%83%9B%E3%83%BC%E3%83%81%E3%83%9F%E3%83%B3%E5%B8%82+%E5%B9%B3%E5%9D%87%E5%AE%B6%E6%97%8F%E4%BA%BA%E6%95%B0' (accessed on 31 December 2014). (In Japanese)
- Study on the Modeling of Toilet Usage and Bathing Habits in Vietnam. Available online: http://www.shasej.org/ (accessed on 21 May 2015). (In Japanese)
- Kanako, T.; Yasutoshi, S.; Akihiko, I.; Kyosuke, S. Quantification of environmental impact reduction effect resulting from use of water-saving toilet bowls. J. Soc. Heat. Air-Cond. Sanit. Eng. Apr. 2013, 193, 1–8. (In Japanese) [Google Scholar]
- Kanako, T.; Yasutoshi, S.; Satoshi, D.; Mari, Y.; Kyosuke, S. Evaluation of the potential of CO2 emission reduction achieved by using water-efficient housing equipment in Dalian, China. In Proceedings of the 38th International Symposium CIB W062 on Water Supply and Drainage for Buildings, Edinburgh, Scotland, UK, 27–30 August 2012; pp. 587–598.
- Cheng, C.L.; Liao, W.J.; Liu, Y.C.; Tseng, Y.C.; Chen, H.J. Evaluation model of CO2 emission for saving water strategy. In Proceedings of the 38th International Symposium CIB W062 on Water Supply and Drainage for Buildings, Edinburgh, Scotland, UK, 27–30 August 2012; pp. 537–548.
- Wong, L.T.; Cheung, C.T.; Mui, K.W. Energy efficiency benchmarks of example roof-tank water supply system for high-rse low-cost housings in Hong Kong. In Proceedings of the 38th International Symposium CIB W062 on Water Supply and Drainage for Buildings, Nagano, Japan, 17–19 September 2013; pp. 349–359.
- Matos, C.; Briga-Sá, A.; Pereira, S.; Silva-Afonso, A. Water and energy consumption in urban and rural households. In Proceedings of the 38th International Symposium CIB W062 on Water Supply and Drainage for Buildings, Nagano, Japan, 17–19 September 2013; pp. 209–221.
© 2015 by the authors; licensee MDPI, Basel, Switzerland. This article is an open access article distributed under the terms and conditions of the Creative Commons Attribution license (http://creativecommons.org/licenses/by/4.0/).
Share and Cite
MDPI and ACS Style
Otani, T.; Toyosada, K.; Shimizu, Y. CO2 Reduction Potential of Water Saving in Vietnam. Water 2015, 7, 2516-2526. https://doi.org/10.3390/w7052516
AMA Style
Otani T, Toyosada K, Shimizu Y. CO2 Reduction Potential of Water Saving in Vietnam. Water. 2015; 7(5):2516-2526. https://doi.org/10.3390/w7052516
Chicago/Turabian StyleOtani, Takayuki, Kanako Toyosada, and Yasutoshi Shimizu. 2015. "CO2 Reduction Potential of Water Saving in Vietnam" Water 7, no. 5: 2516-2526. https://doi.org/10.3390/w7052516