Technical Note

Preliminary Toxicological Evaluation of the River Danube Using in Vitro Bioassays

1
Institute of Hygiene, Microbiology and Environmental Medicine, Medical University Graz, Graz 8010, Austria
2
Division Water Hygiene, Institute for Hygiene and Applied Immunology, Medical University of Vienna, Vienna 1090, Austria
3
Interuniversity Cooperation Centre for Water and Health, Vienna, Austria
4
Institute of Chemical Engineering, Research Group Environmental Microbiology and Molecular Ecology, Vienna University of Technology, Vienna 1090, Austria
*
Author to whom correspondence should be addressed.
Water 2015, 7(5), 1959-1968; https://doi.org/10.3390/w7051959
Submission received: 13 February 2015 / Revised: 20 April 2015 / Accepted: 23 April 2015 / Published: 30 April 2015
(This article belongs to the Special Issue Water Quality Control and Management)

Abstract

:
The Joint Danube Survey 3, carried out in 2013 was the world’s biggest river research expedition of its kind. The course of the second largest river of Europe passes large cities like Vienna, Budapest and Belgrade and is fed from many tributaries like Inn, Thisza, Drava, Prut, Siret and Argeș. During the 6 weeks of shipping the 2375 km downstream the River Danube from Germany to the Black Sea an enormous number of water samples were analyzed and collected. A wide spectrum of scientific disciplines cooperated in analyzing the River Danube waters. For toxicological analysis, water samples were collected on the left, in the middle, and on the right side of the river at 68 JDS3 sampling points and frozen until the end of the Danube survey. All samples were analyzed with two in vitro bioassays tests (umuC and MTS). Testing umuC without S9 activation and MTS test did not show positive signals. But umuC investigations of the water samples came up with toxic signals on two stretches, when activated with S9 enzymes. The override of the limiting value of the umuC investigation with prior S9 activation started downstream Vienna (Austria) and was prolonged until Dunaföldvar (Hungary). This stretch of the River Danube passes a region that is highly industrialized, intensively used for agricultural purposes and also highly populated (Vienna, Bratislava and Budapest). The elevated values may indicate these influences.

1. Introduction

The 2872 km long River Danube, the second longest river in Europa, passes ten countries until it flows into the Black Sea forming a large river delta. The drainage basin is around 817,000 km2 large, including the waste waters of this mostly densely populated area. The course of the river passes large cities like Vienna, Budapest and Belgrade and is fed from many tributaries like Inn, Tisza, Drava, Sava, Pruth, Siret and Argeș.
The Joint Danube Survey 3 (JDS3) 2013 was the world’s biggest river research expedition of its kind [1]. Until now the JDS has been carried out three times every six years. Between 13 August and 26 September, samples were taken along a 2563 km stretch of the River Danube starting in Böfinger Halde (Germany, river 2581 km) to the Danube Delta (river 18 km). Besides collecting water samples and directly surveying the microbiological status, many other river relevant parameters from water, sediment and suspended solids were evaluated by laboratories all across Europe: e.g., hydromorphology, basic chemistry, biological key elements like fish, macrozoobenthos, phytobentos, phytoplankton, macrophytes, etc.
One aspect of the investigation was the primary evaluation of the toxicological burden over the whole river course. In order to provide a first toxicological investigation and status assessment of the River Danube, two widely used, easily applicable toxicological tests were applied for all JDS3 samples (umuC and MTS). These tests have been used for the investigation of surface waters by other groups [2,3,4,5,6] and have been additionally established and used for the investigation of the River Mur in Styria, Austria [7]. The investigation of the water samples with these protocols is very reliable in terms of unspecific screening for toxic signals in surface or waste water samples [4,5,6]. These tests need only a small amount of the test liquid and can react on high numbers of mutagenic and cytotoxic substances and are therefore suitable for looking for unknown hazardous substances originating from all sources [3,8,9]. Compared with other investigations carried out during the JDS3, the results of the toxicity survey may lead to a new discussion on the methodology in the search for toxic substances and to new insights into the toxicological burden of the Danube.

2. Materials and Methods

2.1. Water Samples

Samples were taken all over the River Danube course at 68 positions (Figure 1). At a sampling point (SP) samples were always taken from the left side (L), in the middle (M) and from the right side (R) (resulting in 171 samples) of the River Danube, with the exception of the tributary samples that were mostly collected only once in the middle (11) (Table 1).
Figure 1. Overview of the Joint Danube Survey 3 (JDS3) sampling points along the river Danube. The map was taken with kind permission of the ICPDR.
Water 07 01959 g001
Subsamples of 50 mL from the sample bottle taken for the microbiological investigations (surface water collected 0.3 m under the river surface) were filled into sterile non-toxic 50-mL plastic vials and immediately stored at −20 °C until analysis in the home laboratory. Before being used in the experiments, the samples, were thawed on ice, vortexed and filtrated to eliminate bacteria via 0.45 µm syringe filter (TPP, Techno Plastic Products, Switzerland). Freezing of the samples might alter the composition and amount of toxic compounds in the sample. Although studies of Armishaw et al. showed for pesticide spiked material no alteration over 168 days of freezer storage, this cannot be predicted for hundreds of toxic substances in surface water [10]. The stability of the JDS3 water samples stored at 4 °C was also investigated on three exemplary samples during the study and showed that most substances were relatively stable over a period of 173 days [1]. The small sample volume, the storage at −20 °C and the possibility to test a large sample number was a requirement for the screening investigation.
Table 1. List of the JDS3 sampling points (SP), the orange highlighted sampling points were only collected midstream.
SPName of SPRiver kmSPName of SPRiver km
JDS1Böfinger Halde2581JDS35Tisa1215
JDS2Kelheim, gauging station2415JDS36DS Tisa/US Sava (Belegis)1200
JDS3Geisling power plant2354JDS37Sava1170
JDS4Deggendorf2285JDS38Upstream Pancevo1159
JDS5Mühlau2258JDS39DownstreamPancevo1151
JDS6Jochenstein2204JDS40Upstream Vel. Morava1107
JDS7US dam Abwinden-Asten2120JDS41Velika Morava1103
JDS8Oberloiben2008JDS42DS Velika Morava1097
JDS9Klosterneuburg1942JDS43Banatska Palanka1071
JDS10Wildungsmauer1895JDS44IGR Golubac/Koronin1040
JDS11US Morava (Hainburg)1881JDS45IGR Tekija/Orsova954
JDS12Morava1880JDS46Vrbica/Simijan926
JDS13Bratislava1869JDS47Upstream Timok849
JDS14Gabcikovo reservoir1852JDS48Timok845
JDS15Medvedov/Medve1806JDS49Pristol/Novo Salo834
JDS16Moson Danube1794JDS50Downstream Kozloduy685
JDS17Klizska Nema1790JDS51Iskar637
JDS18Vah1766JDS52Downstream Olt602
JDS19Iza/Szony1761JDS53Downstream Zimnicea/Svistov550
JDS20Szob1707JDS54Jantra537
JDS21US Budapest - Megyeri Bridge1660JDS55Downstream Jantra532
JDS22DS Budapest—M01632JDS56Russenski Lom498
JDS23Rackeve-Soroksar arm-end1586JDS57Downstream Ruse488
JDS24Dunaföldvar1560JDS58Arges432
JDS25Paks1533JDS59Downstream Arges429
JDS26Baja1481JDS60Chiciu/Silistra378
JDS27Hercegszanto1434JDS61Giurgeni235
JDS28US Drava1384JDS62Braila167
JDS29Drava1379JDS63Siret154
JDS30DS Drava (Erdut/Bogojevo)1367JDS64Prut135
JDS31Ilok/Backa Palanka1300JDS65Reni130
JDS32US Novi Sad1262JDS66Vilova/Kilia Arm18
JDS33DS Novi Sad1252JDS67Sulina Arm26
JDS34US Tisa (Stari Slankamen)1216JDS68St.Gheorge Arm104

2.2. Toxicity Assay: umuC

An SOS/umuC assay was carried out to search for mutagenicity. The assay was carried out according to Reifferschied et al., following the modifications of the ISO 13829 standard [11]. The umuC assay was conducted with or without S9 enzymatic activation (Trinova Biochem, Gießen, Germany). Filtrated water samples as described above were applied to the test without pH correction as the pH values were between 8.0 and 8.5 over the whole stretch of the Danube River [1]. Tests were carried out in 96 well plates (TPP, Techno Plastic Products, Trasadingen, Switzerland). The absorbance at 600 nm and 420 nm was measured with a Zenyth 3100 Multimode Detector (Beckman Coulter, Austria). All experiments were carried out in triplicates and mean and standard error of the mean (SEM) were calculated. According to the ISO 13829 the growth rate (G) was calculated with Equation (1).
G= OD600sampleOD600blank OD600controlOD600blank
A growth reduction of 25% compared to the growth control was considered to be a cytotoxic water sample. The induction rate (IR) was calculated with Equation (2):
IR= 1 G  × A420sampleA420blank A420controlA420blank
According to ISO 13829 an induction rate of ≥1.5 was taken as a signal for mutagenic potency in the water samples.

2.3. Cytotoxicity Assay: MTS

For determination of cytotoxic potential of the water samples a MTS test (Promega, Mannheim, Germany) was carried out. The test is based on the yellow salt [3-(4,5-dimethylthiazol-2-yl)-5-(3-carboxymethoxyphenyl)-2-(4-sulfophenyl)-2H-tetrazolium, inner salt; MTS] which is converted into the blue/violet water insoluble salt formazan. The conversion into formazan is mediated by dehydrogenases of intact mitochondria and therefore provides insight into cell viability. HepG2 (DSMZ ACC 180) cells were used for cytotoxicity assays. HepG2 cells are capable of phase one liver enzymatic reaction and are highly sensitive against polycyclic aromatic hydrocarbons and genotoxic effects can be seen after challenging with carcinogenic mycotoxins. These cells also react positively to Arsenic and carcinogenic metals like Cadmium [12]. Cells were cultivated in Dulbecco’s Modified Eagle Medium (DMEM, Promega, Vienna, Austria) with 10% fetal bovine sera (FBS, Promega, Austria) and 100 U/mL penicillin/streptomycin (Sigma Aldrich, Vienna, Austria) at 37 °C and 5% CO2. Passages 3 to 6 were taken for the experiments. Cell number was titrated to find out the best ratio between cell number and maximum signal response. A cell number of 1 × 10⁴ cells/well was found to be ideal. For the cytotoxic analysis, cells were freshly seeded into 96 well plates (Thermo Scientific, Vienna, Austria) and allowed to attach for 4 h. After that, 40% of the medium was replaced by filtrated water samples and incubated for 20 h at 37 °C and 5% CO2. After the incubation, 20 µL of the Dye Solution was added. The plates were incubated for up to 4 h at 37 °C in a humidified, 5% CO2 atmosphere. The absorbance at 492 nm was measured with a Zenyth 3100 Multimode Detector (Beckman Coulter, Vienna, Austria). Deionized water served as control. Experiments were carried out in triplicates. Viability (VC) of the cells incubated with deionized water was taken 100% and the viability of the river samples was put into relation to them and calculated with Equation (3).
VC=  100 × Abs492 Water Sample Abs492 Control Sample
A reduction of the viability to 70% compared to the test sample was taken as a cytotoxic response [3].

3. Results and Discussion

All samples of the JDS3 sampling points were investigated for a toxic signal with the umuC test and the MTS. Experiments were carried out in triplicates and means and standard deviations are given as line and error bars in the figures.

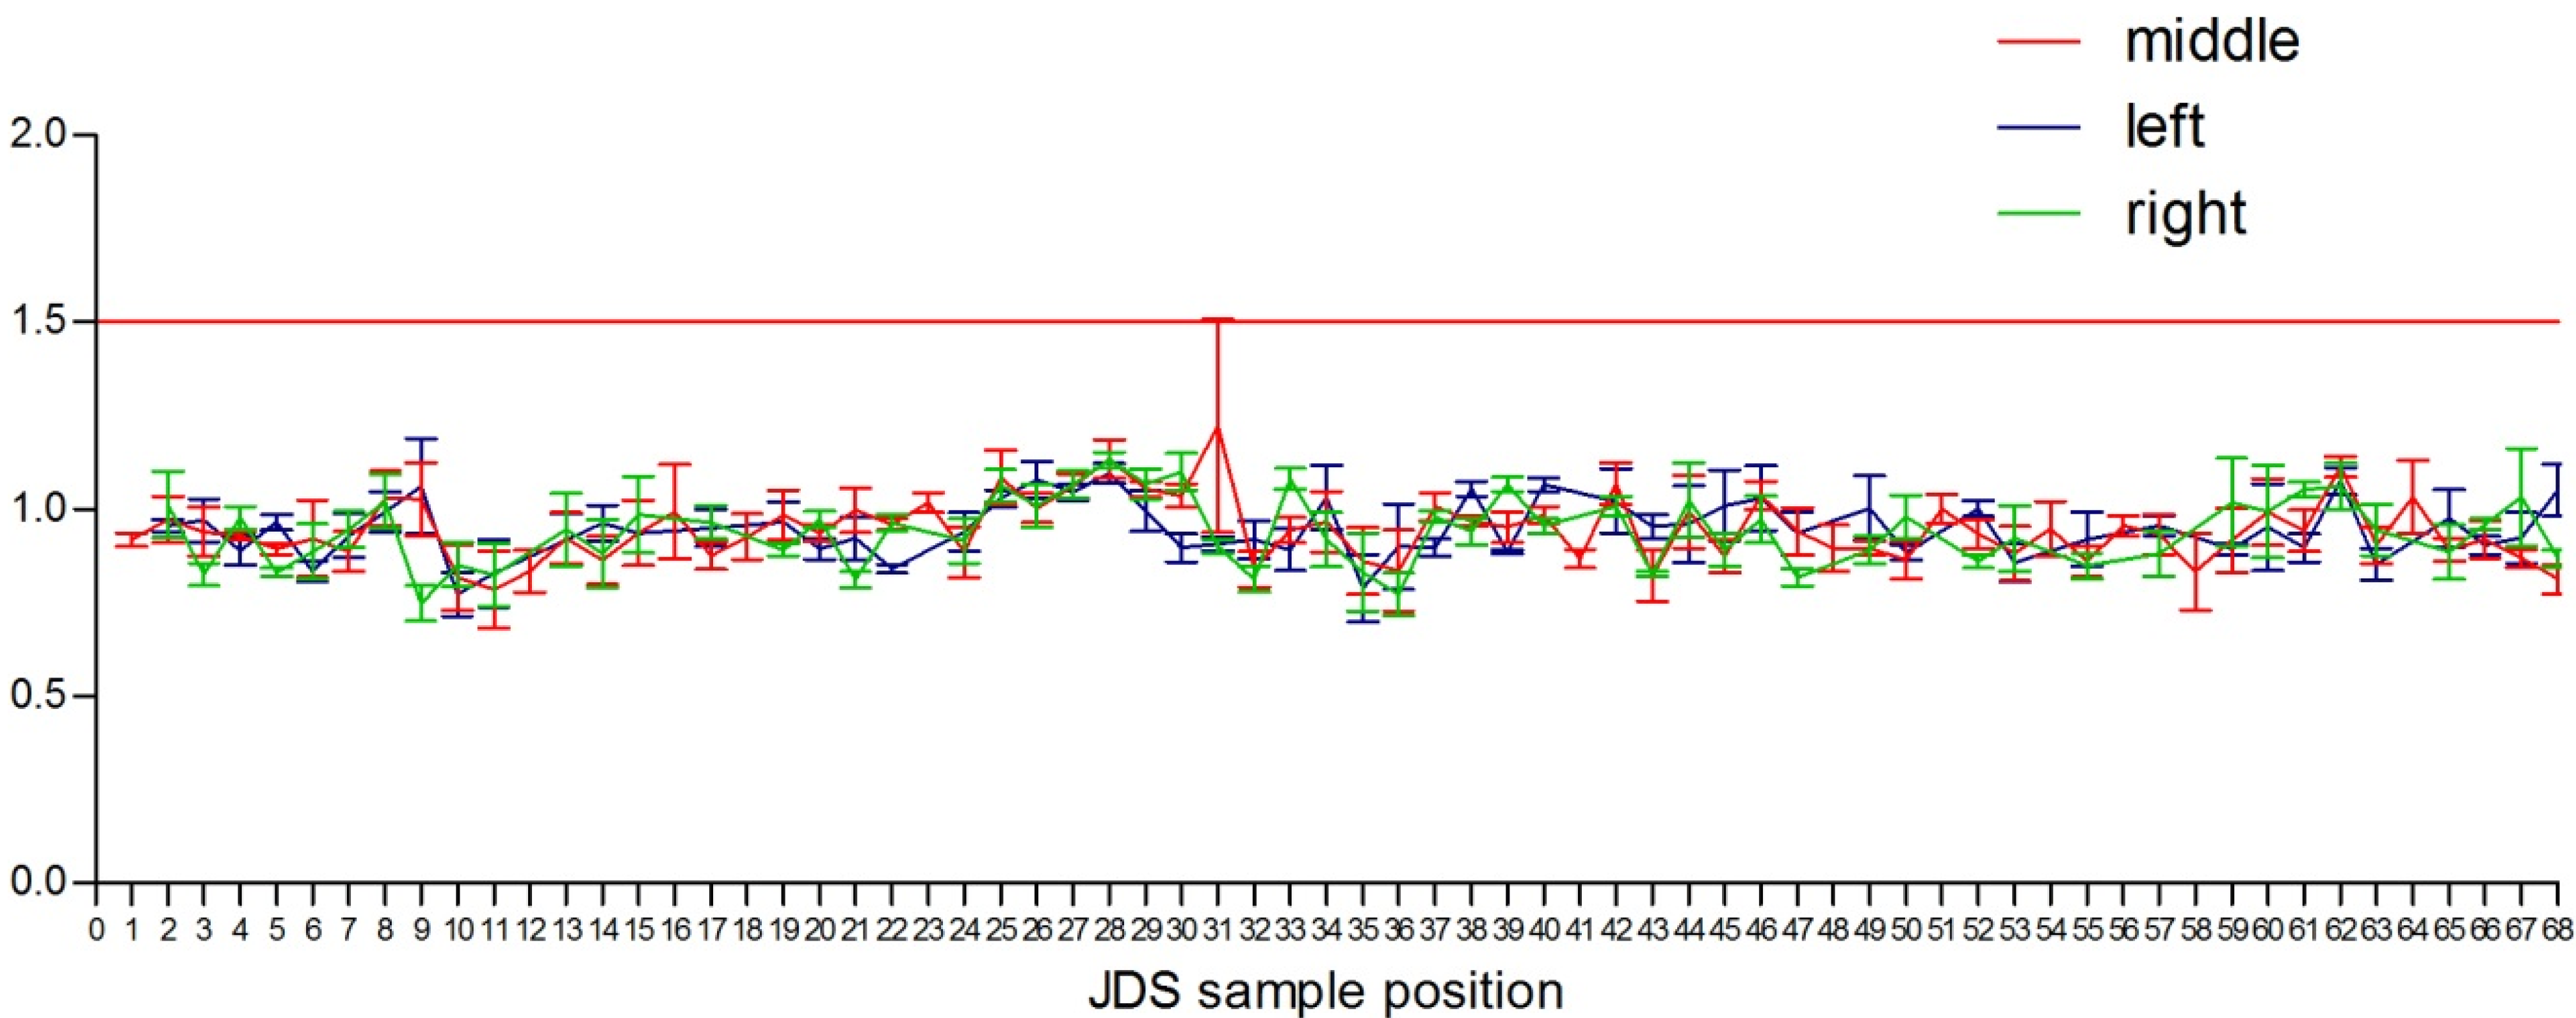
3.1. UmuC Results without Enzymatic S9 Activation

The umuC investigation of the River Danube Samples without S9 activation did not show any raised values (Figure 2). The only exception was one value of the triplicates at sample position JDS31 M that was elevated to 1.79. But because the two other midstream values were 0.95 and 0.92, this high single value of 1.79 has to be interpreted as an outlier. In addition, the mean value was below the limit value of 1.5. The results go also well with previous river studies, were the samples without S9 activation did not came up with a toxic signal [7]. Evaluation of growth of the umuC Salmonella as requested in ISO 13829 did also not show any inhibition.
Figure 2. Results from umuC testing of the River Danube without enzymatic activation. The red line at 1.5 represents the limit value according to ISO 13829.
Water 07 01959 g002

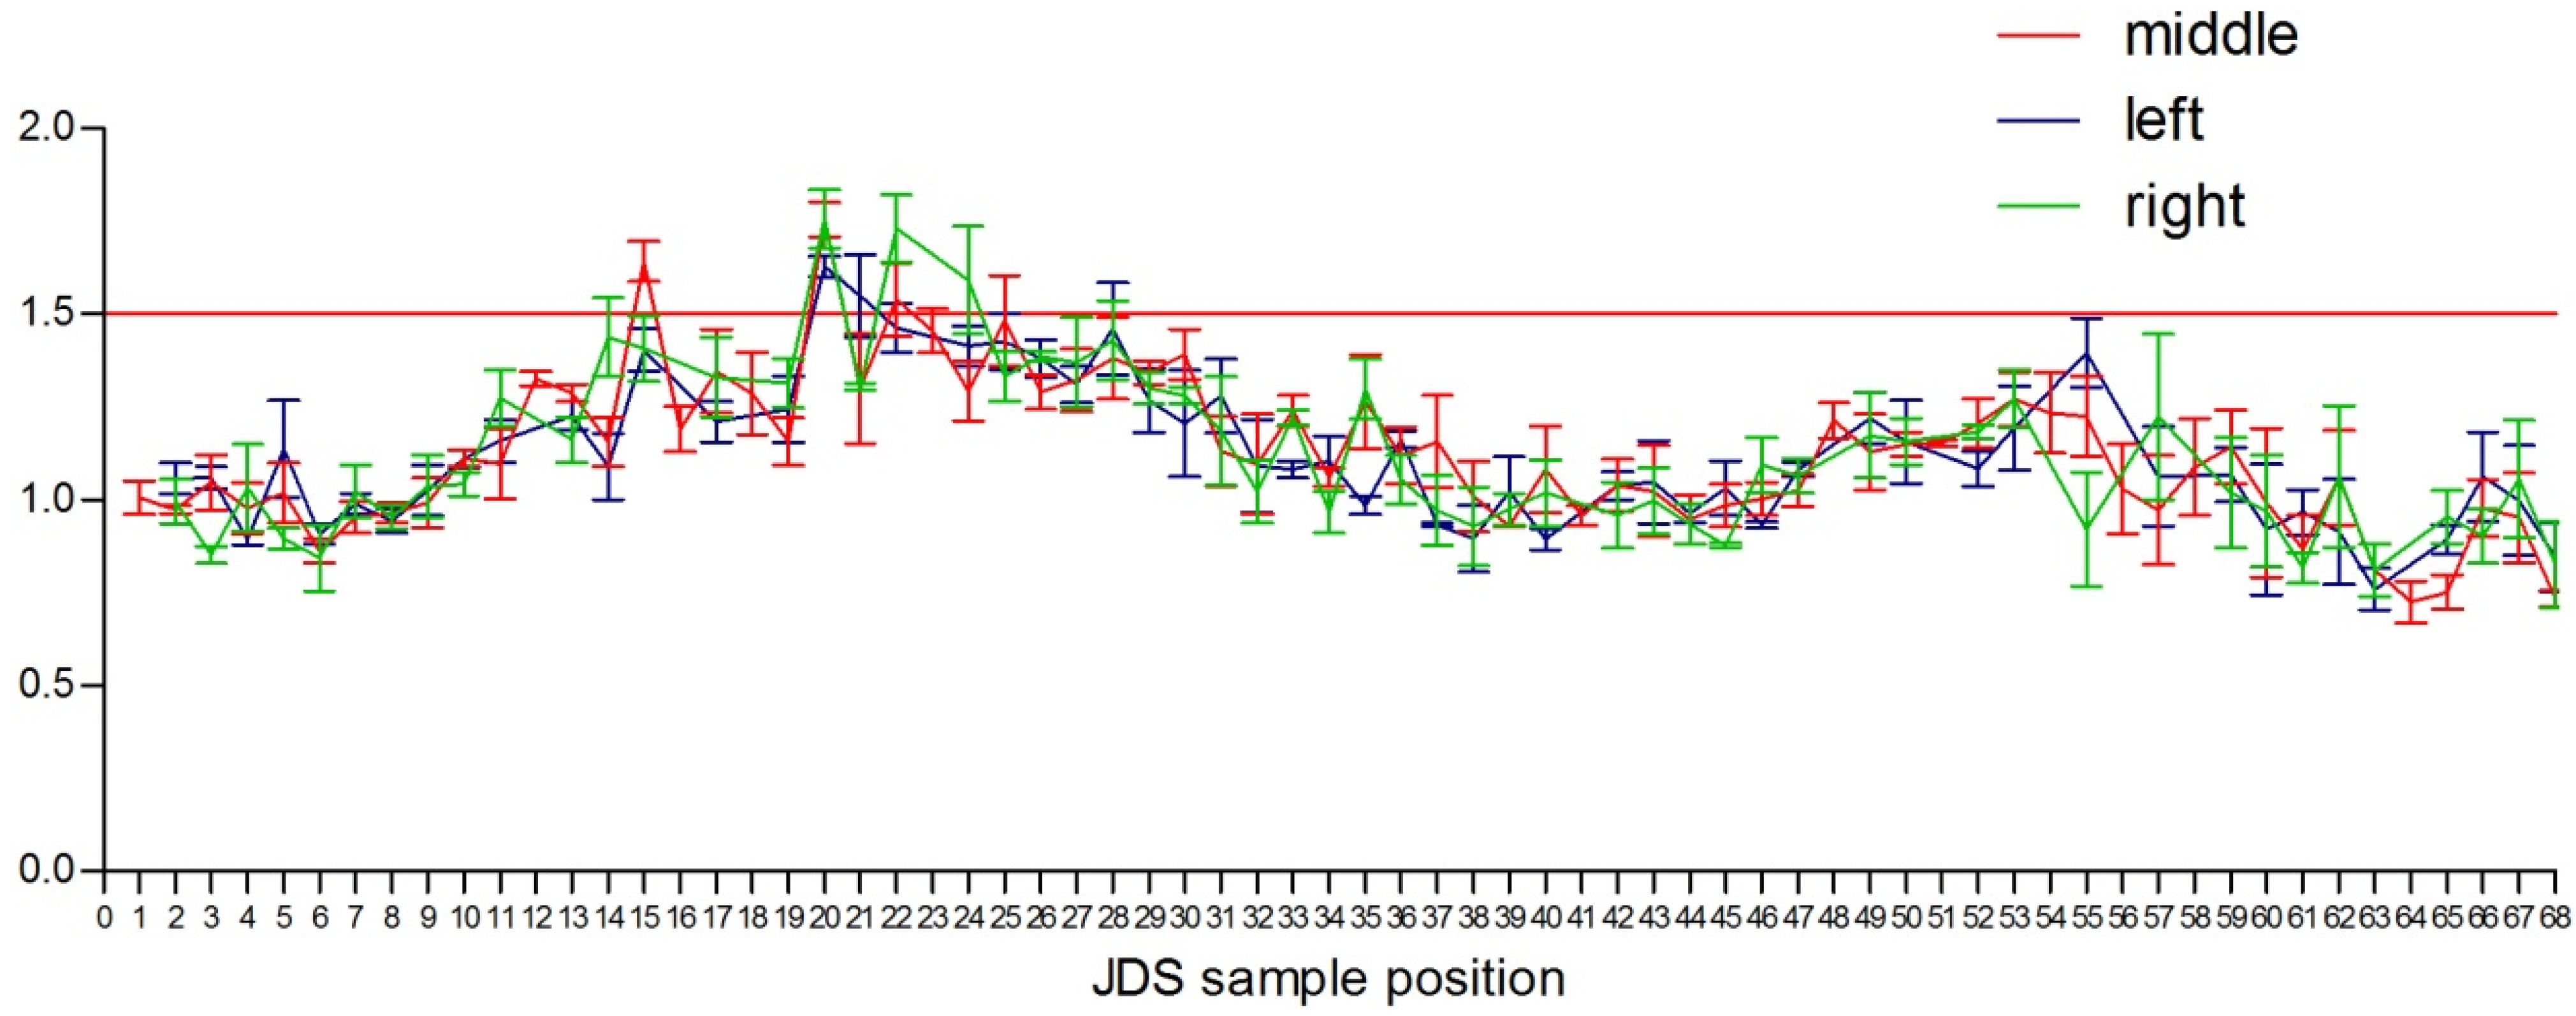
3.2. UmuC Results with Enzymatic S9 Activation
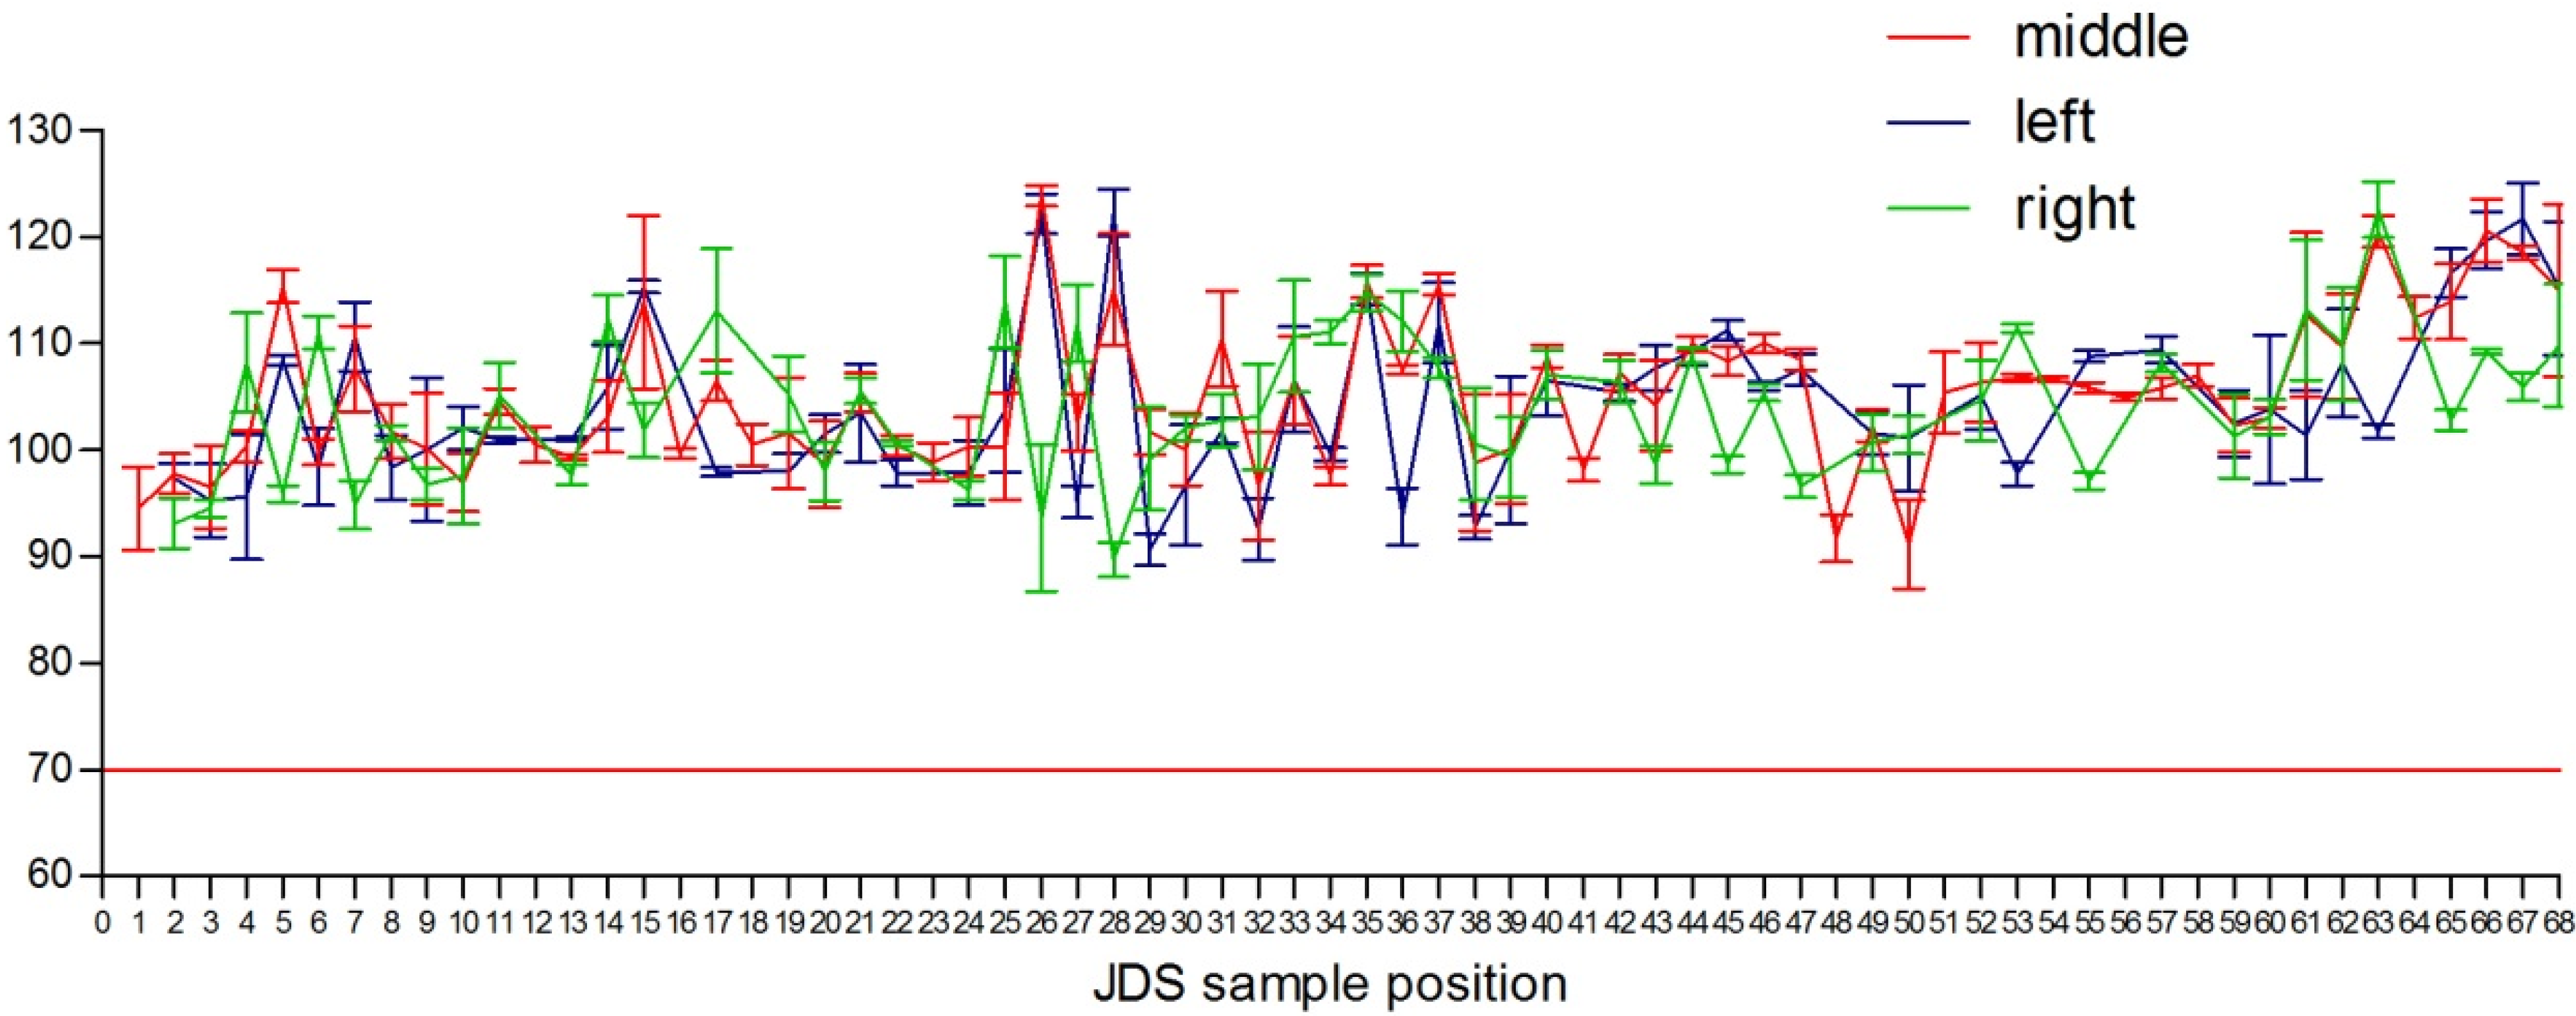
Investigation of the River Danube samples with enzymatic S9 activation showed exceedance of the limit value of 1.5 and elevated values before and after a few JDS sampling points (Figure 3). The values of all investigated sampling points had little standard deviations and were thus considered reliable. Values started to rise from JDS13 (Bratislava, SVK, river 1869 km) on until JDS28 (upstream Drava, HR, river 1632 km). The limiting value was exceeded at JDS15 (Medvedov, SVK, river 1806 km), JDS20 (Szob, HU, river 1707 km), JDS22 (downstream Budapest, HU, river 1632 km), JDS23 (Rackeve-Soroksar branch, HU, river 1586 km), JDS24 (Dunarföldvar, HU, river 1560 km) and JDS25 (Paks, HU, river 1533 km). Elevated values were also observed at JDS55 L (downstream Jantra, RO, river 532 km) but stayed below the limit of 1.5.
Figure 3. Results from umuC testing of the river Danube with enzymatic activation. The red line at 1.5 represents the limit value. Values at JDS15 M, JDS20 L,M,R, JDS21 L, and JDS22 R, clearly override the limit value. Values are also increased before and after JDS55 but do not exceed the limiting value. Growth of Salmonella is impaired beginning at JDS60 but does not fall below 75% compared to the growth control.
Water 07 01959 g003
When elevated values were observed, they were mostly elevated at all three horizontal sampling point (e.g., JDS 20 left, middle and right). This leads to the conclusion, that the toxic signal has come from a point upstream as it has to be spread all over the whole width of the river. The definite source of the toxic signals is difficult to find, as the umuC is sensitive for at least 400 chemicals tested by Reifferscheid et al. [13]. One group of toxicants that need prior S9 activation and are known to be pollutant in surface waters are polychlorinated biphenyls (PCBs) [14,15] although they were found at very low levels in the River Danube [1].The possible sources are the large municipal waste water treatment plants, the outfall of large factories in these areas, and the agricultural land use of the watershed area for these sites.
The reduced growth rate from JDS60 to JDS68 triggered the values to around 0.80 to 0.85 which is close to the cytotoxic limit value according to ISO 13829 (Materials and Methods 2.2). The growth rate dropped by around 15%–20% which might be a reference for cytotoxicity in this stretch of the River Danube, but there was no parallel growth reduction found in the MTS test with eukaryotic cells (see below).

3.3. MTS Testing

For all investigated samples the MTS test did not show any toxic signals (Figure 4) and there were no differences all over the River Danube stretch. Although HepG2 liver cells are capable of phase one enzymatic liver modification and suitable for primary investigation [16] there was no detectable reduction of the cell viability. The values of the River Danube samples tend to be even a little bit elevated (10%–20%) compared to the control (deionized water), as they were only filtrated and contain still their natural salt concentration. The filtrated Danube water was osmotically better for the cells than the control and this must be the reason for the slightly elevated values. The MTS test did not lead to positive results with the applied cell line. Extending the tests to other cell lines (e.g., epithelial cell lines like IEC-18, fibroblastic cell lines like BALB/c 3T3 [17,18,19]) could bring further insights.
Figure 4. Values of the MTS results of the River Danube sampling points (x-axis). The y-axis represents percentage of viability compared to the control (deionized water, was set as 100%). The red line at 70% represents the limit value for an inhibition of growth caused by a toxic compound or a combination of compounds.
Water 07 01959 g004

4. Conclusions

The examination of the JDS 3 River Danube samples provided a primary toxicological evaluation of the Danube and its major tributaries. The dense mesh of samples offered a unique chance for an assessment of this large transnational river system. Our data suggest that the Danube water in the river stretch between JDS13 and JDS 28 with elevated umuC values after S9 activation may carry a mutagenic burden. A direct comparison to the prior Danube surveys is not possible because toxicology was not investigated during JDS1 and only for sediment samples during JDS2. Further analysis at a high temporal resolution is needed to proof that our findings are consistent over time.

Acknowledgments

The Joint Danube Survey was organized by the International Commission for the Protection of the Danube River (ICPDR). The study was supported by the Austrian Science Fund (FWF), project nr P25817-B22. We further thank Georg Reischer, Stefan Jakwerth and Stoimir Kolarevic for their help in sampling.

Author Contributions

Clemens Kittinger and Gernot Zarfel had the original idea for the study and with Andreas H. Farnleitner and Andrea J. Grisold carried out the design. Rita Baumert, Bettina Folli, Michaela Lipp and Astrid Liebmann carried out the laboratory work. Clemens Kittinger was responsible for data cleaning. Clemens Kittinger and Alexander Kirschner drafted the manuscript, which was revised by all authors. All authors read and approved the final manuscript.

Conflicts of Interest

The authors declare to have no conflicts of interests and no financial relationships that might lead to a conflict of interests.

References

  1. JDS 3. In Joint Danube Survey 3. A Comprehensive Analysis of Danube Water Quality; ICPDR—International Commission for the Protection of the Danube River: Vienna, Austria, 2015.
  2. Leusch, F.D.; Khan, S.J.; Gagnon, M.M.; Quayle, P.; Trinh, T.; Coleman, H.; Rawson, C.; Chapman, H.F.; Blair, P.; Nice, H.; et al. Assessment of Wastewater and Recycled Water Quality: A Comparison of Lines of Evidence from in Vitro, in Vivo and Chemical Analyses. Water Res. 2014, 50, 420–431. [Google Scholar] [CrossRef]
  3. Zegura, B.; Heath, E.; Cernosa, A.; Filipic, M. Combination of in Vitro Bioassays for the Determination of Cytotoxic and Genotoxic Potential of Wastewater, Surface Water and Drinking Water Samples. Chemosphere 2009, 75, 1453–1460. [Google Scholar] [CrossRef]
  4. Giuliani, F.; Koller, T.; Wurgler, F.E.; Widmer, R.M. Detection of Genotoxic Activity in Native Hospital Waste Water by the umuC Test. Mutat. Res. 1996, 368, 49–57. [Google Scholar] [CrossRef]
  5. Hamer, B.; Bihari, N.; Reifferscheid, G.; Zahn, R.K.; Muller, W.E.; Batel, R. Evaluation of the SOS/umu-Test Post-Treatment Assay for the Detection of Genotoxic Activities of Pure Compounds and Complex Environmental Mixtures. Mutat. Res. 2000, 466, 161–171. [Google Scholar] [CrossRef]
  6. Dizer, H.; Wittekindt, E.; Fischer, B.; Hansen, P.D. The Cytotoxic and Genotoxic Potential of Surface Water and Wastewater Effluents as Determined by Bioluminescence, Umu-Assays and Selected Biomarkers. Chemosphere 2002, 46, 225–233. [Google Scholar] [CrossRef]
  7. Kittinger, C.; Marth, E.; Reinthaler, F.F.; Zarfel, G.; Pichler-Semmelrock, F.; Mascher, W.; Mascher, G.; Mascher, F. Water Quality Assessment of a Central European River—Does the Directive 2000/60/EC Cover all the Needs for a Comprehensive Classification? Sci. Total Environ. 2013, 447, 424–429. [Google Scholar] [CrossRef]
  8. Hernando, M.D.; Heath, E.; Petrovic, M.; Barcelo, D. Trace-Level Determination of Pharmaceutical Residues by LC-MS/MS in Natural and Treated Waters. A Pilot-Survey Study. Anal. Bioanal Chem. 2006, 385, 985–991. [Google Scholar] [CrossRef]
  9. Macova, M.; Toze, S.; Hodgers, L.; Mueller, J.F.; Bartkow, M.; Escher, B.I. Bioanalytical Tools for the Evaluation of Organic Micropollutants during Sewage Treatment, Water Recycling and Drinking Water Generation. Water Res. 2011, 45, 4238–4247. [Google Scholar]
  10. Armishaw, P.; Millar, R. A Natural Matrix (Pureed Tomato) Candidate Reference Material Containing Residue Concentrations of Pesticide Chemicals. Fresenius J. Anal. Chem. 2001, 370, 291–296. [Google Scholar] [CrossRef]
  11. Reifferscheid, G.; Heil, J.; Oda, Y.; Zahn, R.K. A Microplate Version of the SOS/umu-Test for Rapid Detection of Genotoxins and Genotoxic Potentials of Environmental Samples. Mutat. Res. 1991, 253, 215–222. [Google Scholar] [CrossRef]
  12. Knasmuller, S.; Mersch-Sundermann, V.; Kevekordes, S.; Darroudi, F.; Huber, W.W.; Hoelzl, C.; Bichler, J.; Majer, B.J. Use of Human-Derived Liver Cell Lines for the Detection of Environmental and Dietary Genotoxicants; Current State of Knowledge. Toxicology 2004, 198, 315–328. [Google Scholar] [CrossRef]
  13. Reifferscheid, G.; Heil, J. Validation of the SOS/umu Test using Test Results of 486 Chemicals and Comparison with the Ames Test and Carcinogenicity Data. Mutat. Res. 1996, 369, 129–145. [Google Scholar] [CrossRef]
  14. Flint, S.; Markle, T.; Thompson, S.; Wallace, E. Bisphenol A Exposure, Effects, and Policy: A Wildlife Perspective. J. Environ. Manag. 2012, 104, 19–34. [Google Scholar] [CrossRef]
  15. Haarstad, K.; Bavor, H.J.; Maehlum, T. Organic and Metallic Pollutants in Water Treatment and Natural Wetlands: A Review. Water Sci. Technol. 2012, 65, 76–99. [Google Scholar] [CrossRef]
  16. Baderna, D.; Colombo, A.; Romeo, M.; Cambria, F.; Teoldi, F.; Lodi, M.; Diomede, L.; Benfenati, E. Soil Quality in the Lomellina Area using in Vitro Models and Ecotoxicological Assays. Environ. Res. 2014, 133, 220–231. [Google Scholar] [CrossRef]
  17. Walum, E.; Hedander, J.; Garberg, P. Research Perspectives for Pre-Screening Alternatives to Animal Experimentation: On the Relevance of Cytotoxicity Measurements, Barrier Passage Determinations and High Throughput Screening in Vitro to Select Potentially Hazardous Compounds in Large Sets of Chemicals. Toxicol. Appl. Pharmacol. 2005, 207, 393–397. [Google Scholar] [CrossRef]
  18. Baderna, D.; Colombo, A.; Amodei, G.; Cantu, S.; Teoldi, F.; Cambria, F.; Rotella, G.; Natolino, F.; Lodi, M.; Benfenati, E. Chemical-Based Risk Assessment and in Vitro Models of Human Health Effects Induced by Organic Pollutants in Soils from the Olona Valley. Sci. Total Environ. 2013, 463–464, 790–801. [Google Scholar] [CrossRef]
  19. Kallweit, A.R.; Baird, C.H.; Stutzman, D.K.; Wischmeyer, P.E. Glutamine Prevents Apoptosis in Intestinal Epithelial Cells and Induces Differential Protective Pathways in Heat and Oxidant Injury Models. JPEN J. Parenter. Enteral Nutr. 2012, 36, 551–555. [Google Scholar] [CrossRef]

