
Multifractal Detrended Fluctuation Analysis of Streamflow in the Yellow River Basin, China


Abstract
:1. Introduction
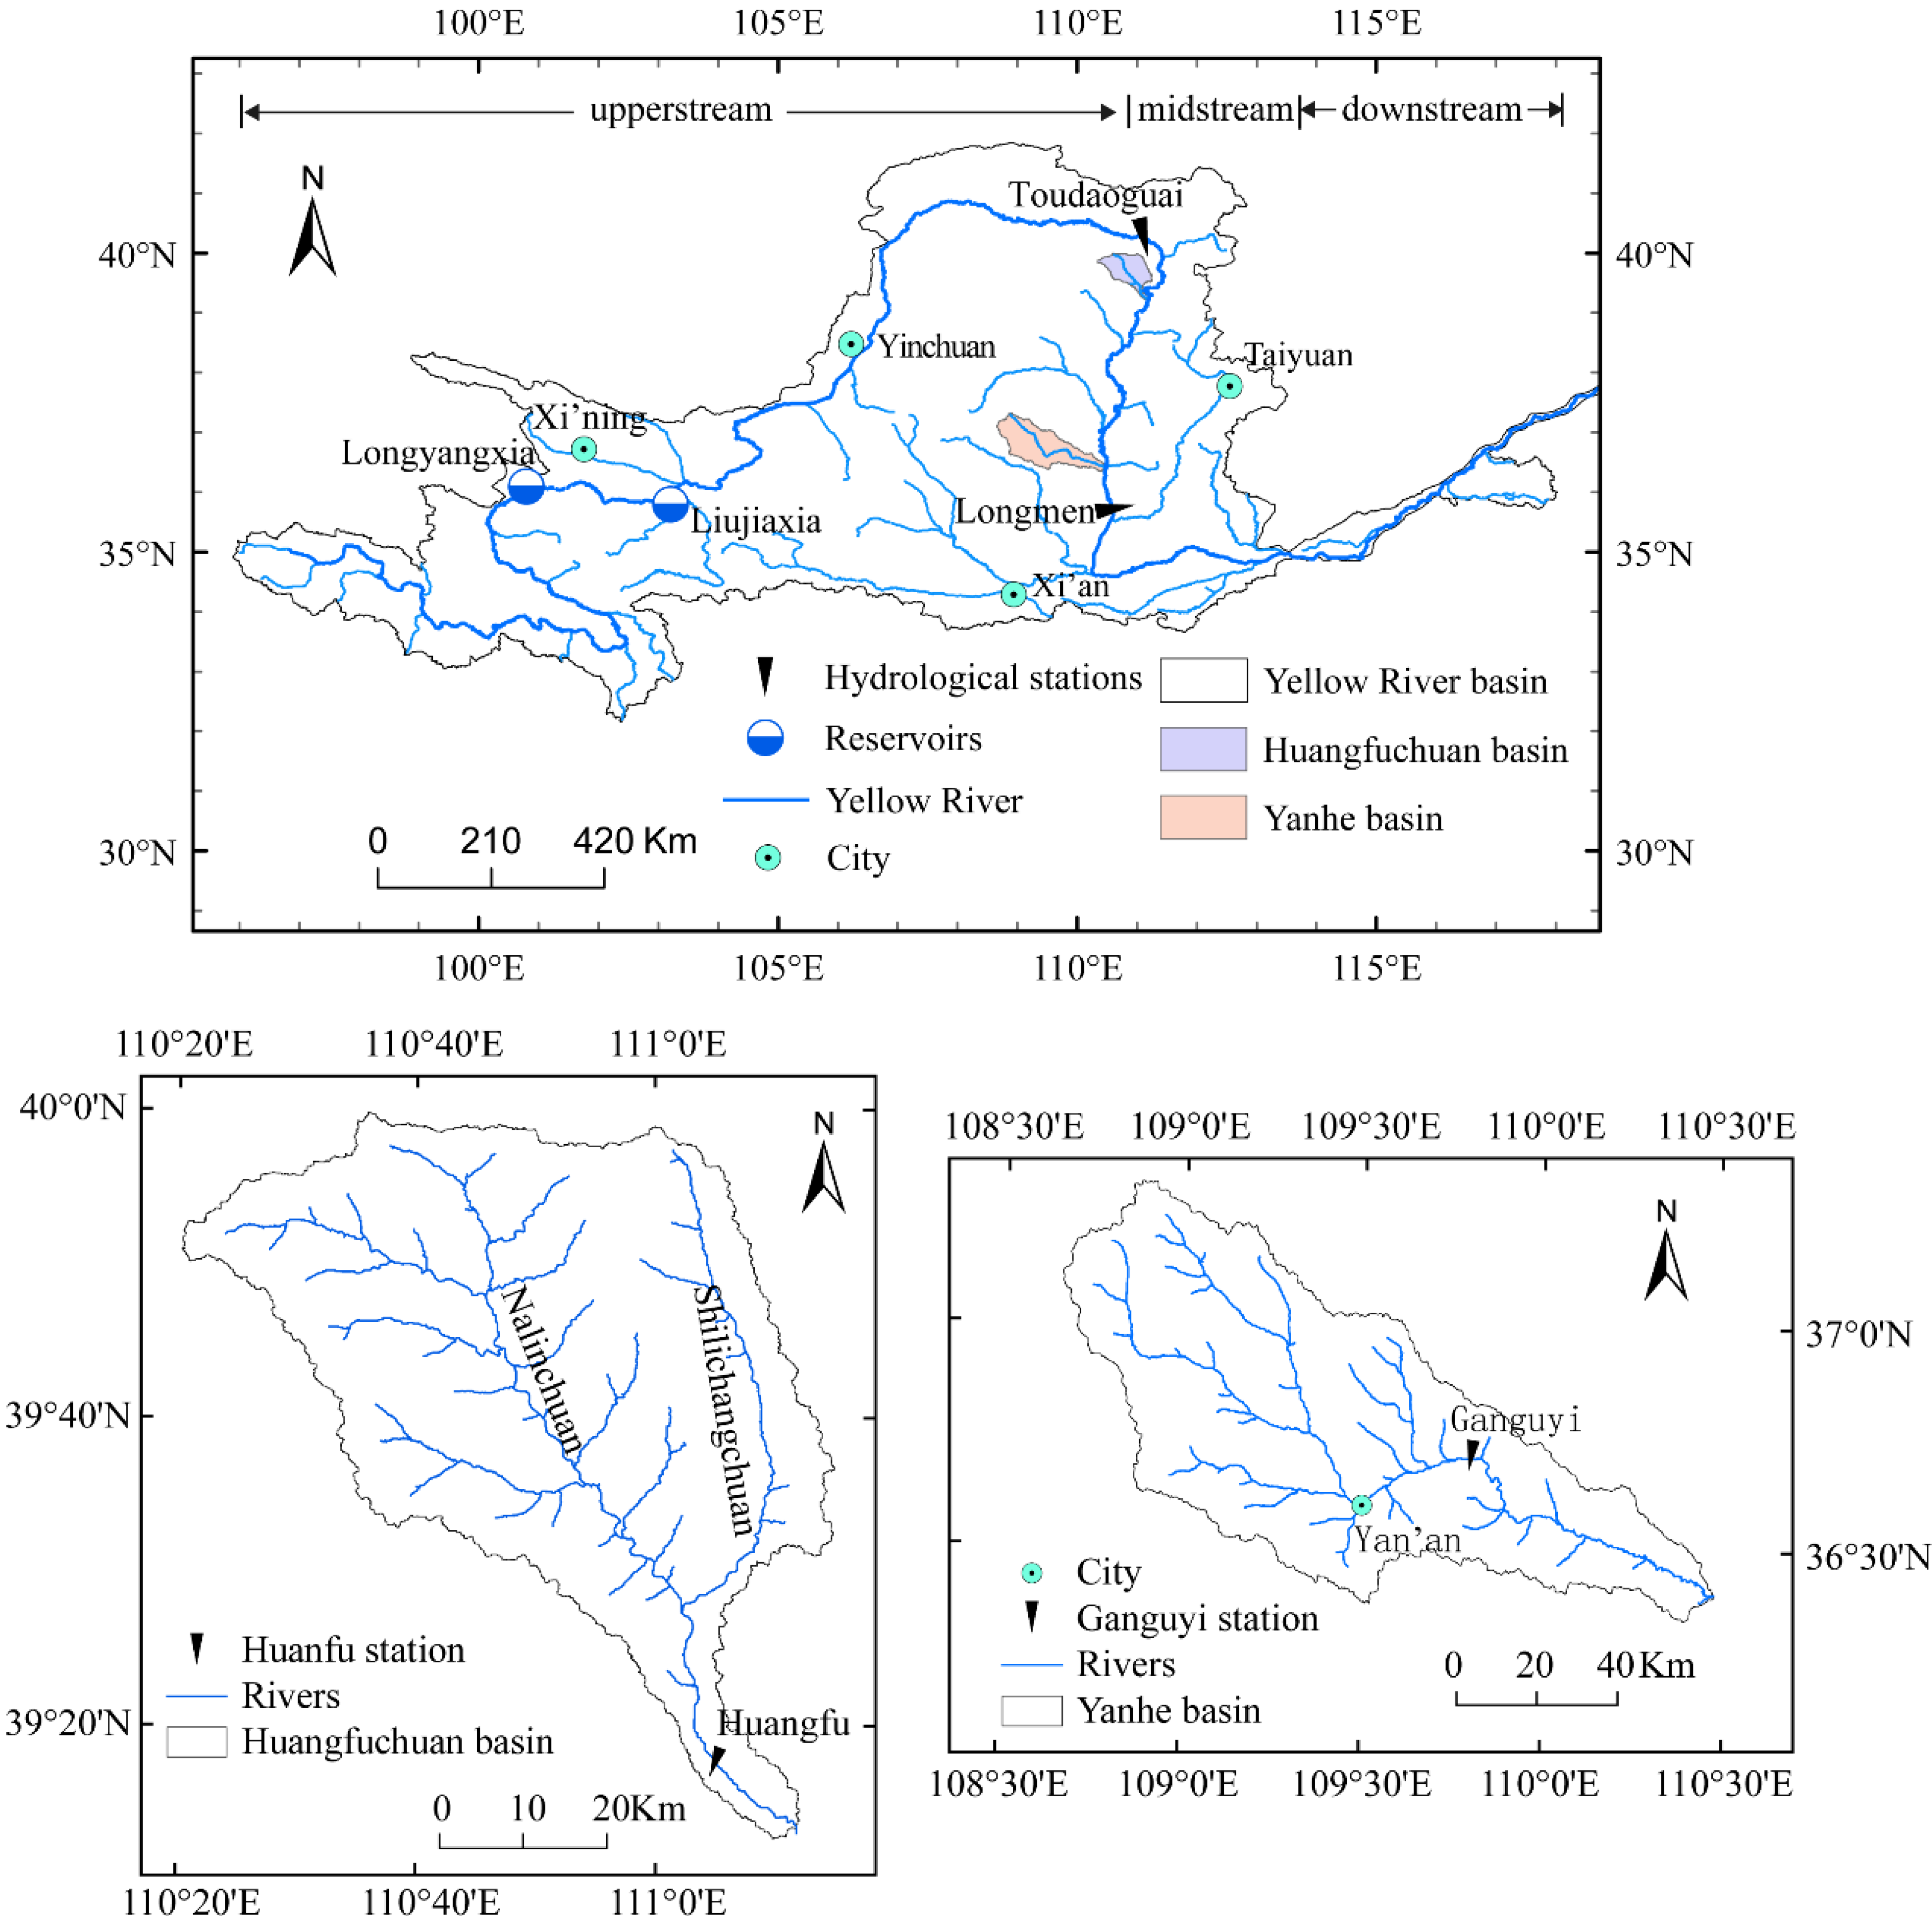
2. Study Area
3. Data and Method
3.1. Data

| River | Station | Area (km2) | Series Length | Time Interval | Annual Streamflow (108 m3) |
|---|---|---|---|---|---|
| Yellow River | Toudaoguai | 367,898 | January 1919–December 2009 | Monthly | 228.01 |
| Yellow River | Longmen | 497,552 | January 1919–December 2009 | Monthly | 285.69 |
| Huangfuchuan | Huangfu | 3,175 | 1 January 1960–31 December 2009 | Daily | 1.20 |
| Yanhe | Ganguyi | 5,891 | 1 January 1960–31 December 2009 | Daily | 1.97 |
3.2. Method
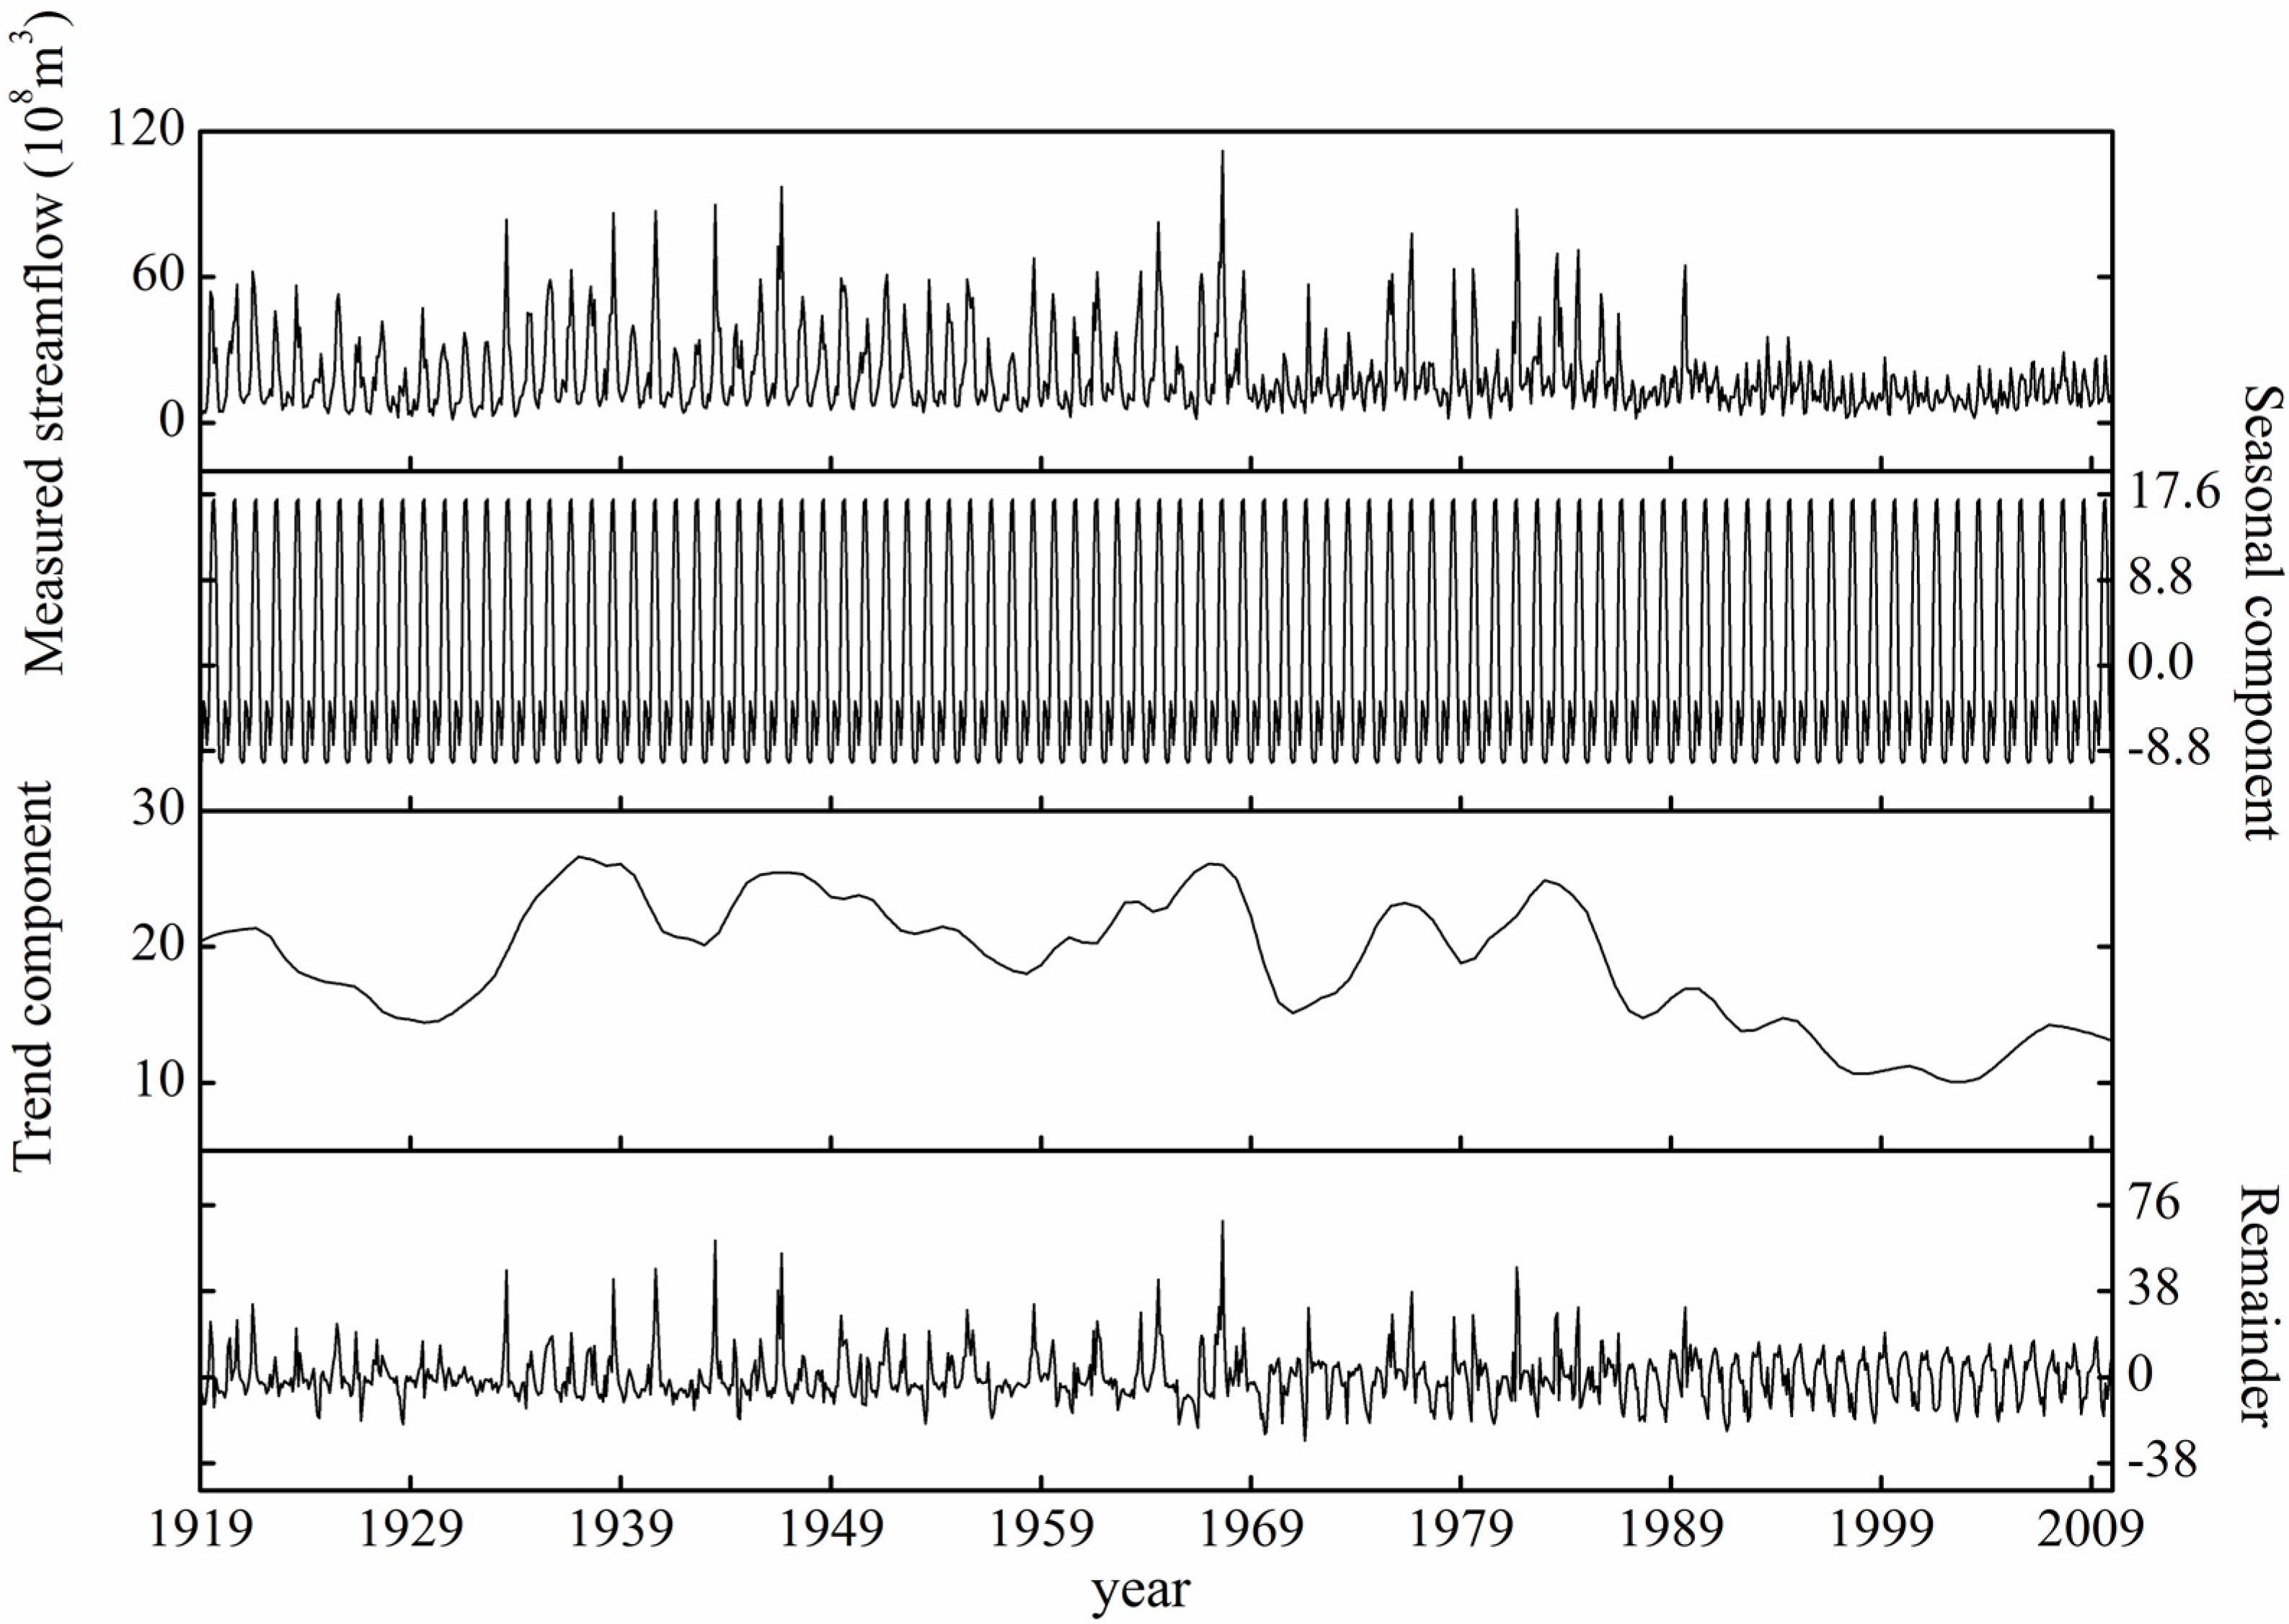
3.2.1. Seasonal Trend Decomposition Based on Locally Weighted Regression
3.2.2. Multifractal Detrended Fluctuation Analysis
4. Results
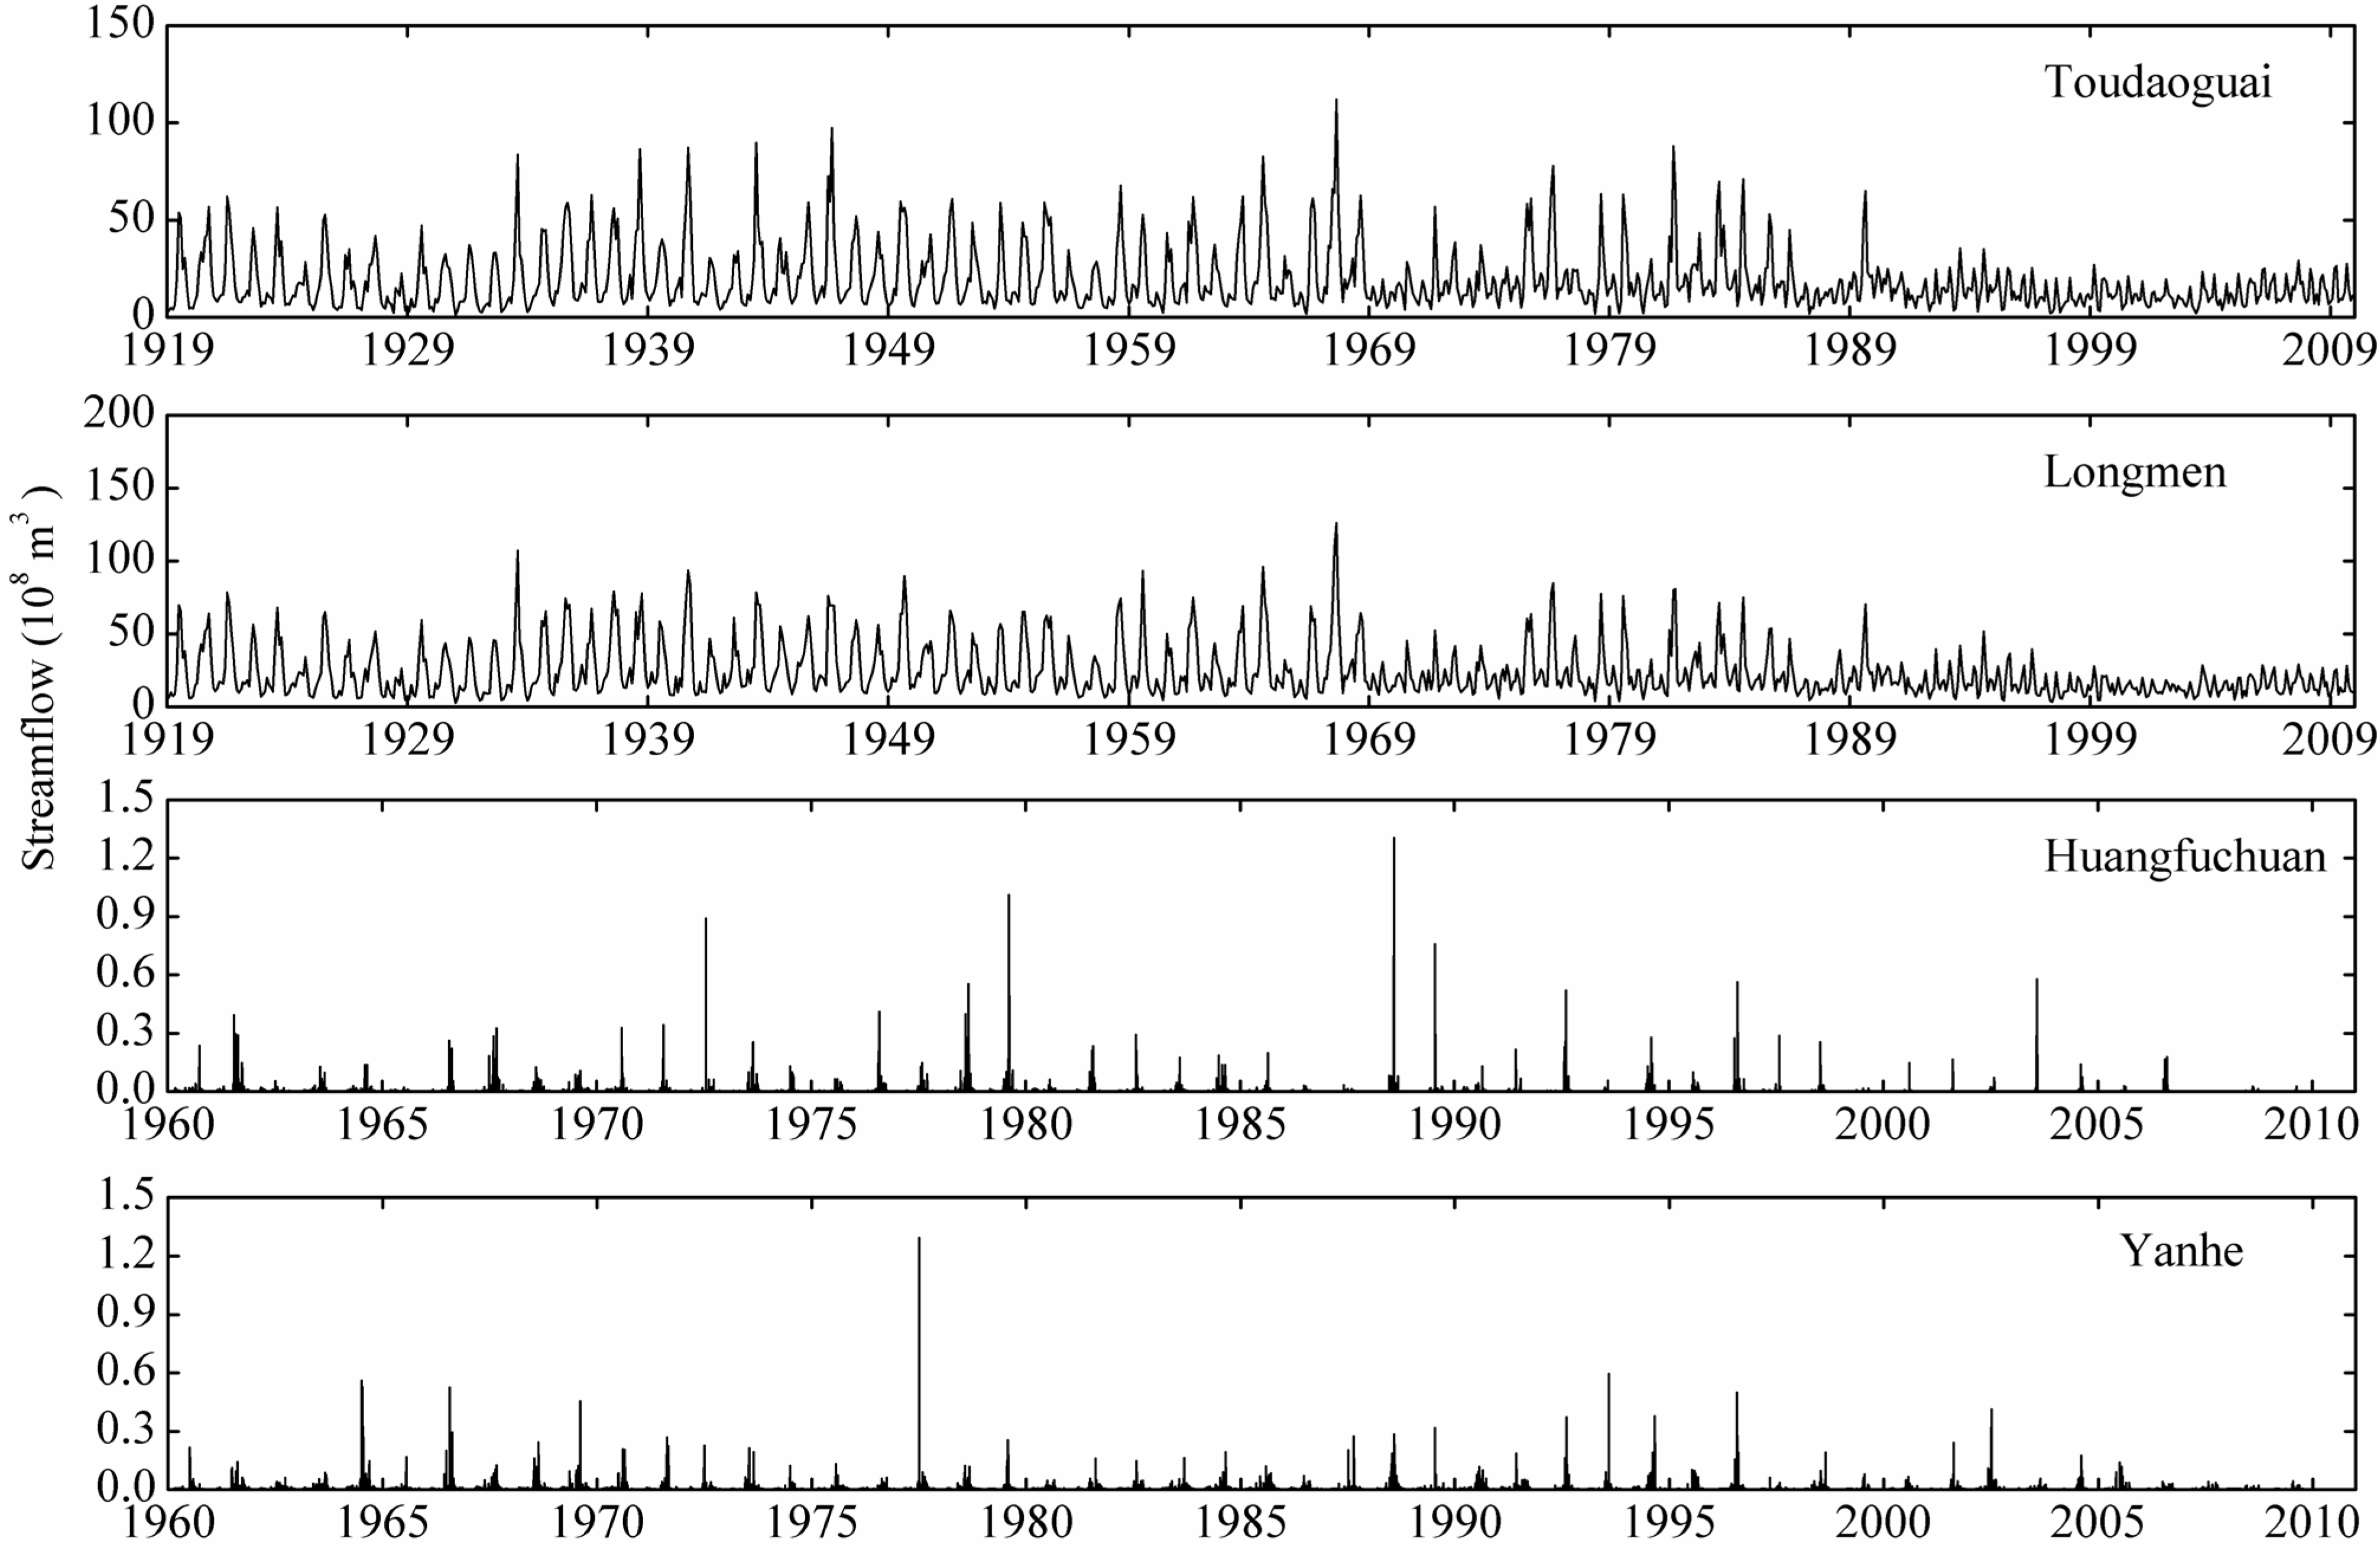
4.1. Statistical Characteristics

| Hydrological Station | Mean (108 m3) | Max (108 m3) | Min (108 m3) | Standard Deviation | Skewness | Kurtosis |
|---|---|---|---|---|---|---|
| Toudaoguai | 18.9 | 112.0 | 1.31 | 15.3 | 1.92 | 4.37 |
| Longmen | 23.6 | 126.1 | 2.81 | 17.7 | 1.76 | 3.33 |
| Ganguyi | 0.005 | 1.296 | 0 | 0.019 | 26.5 | 1246.7 |
| Huangfu | 0.003 | 1.305 | 0 | 0.024 | 26.9 | 1036.2 |
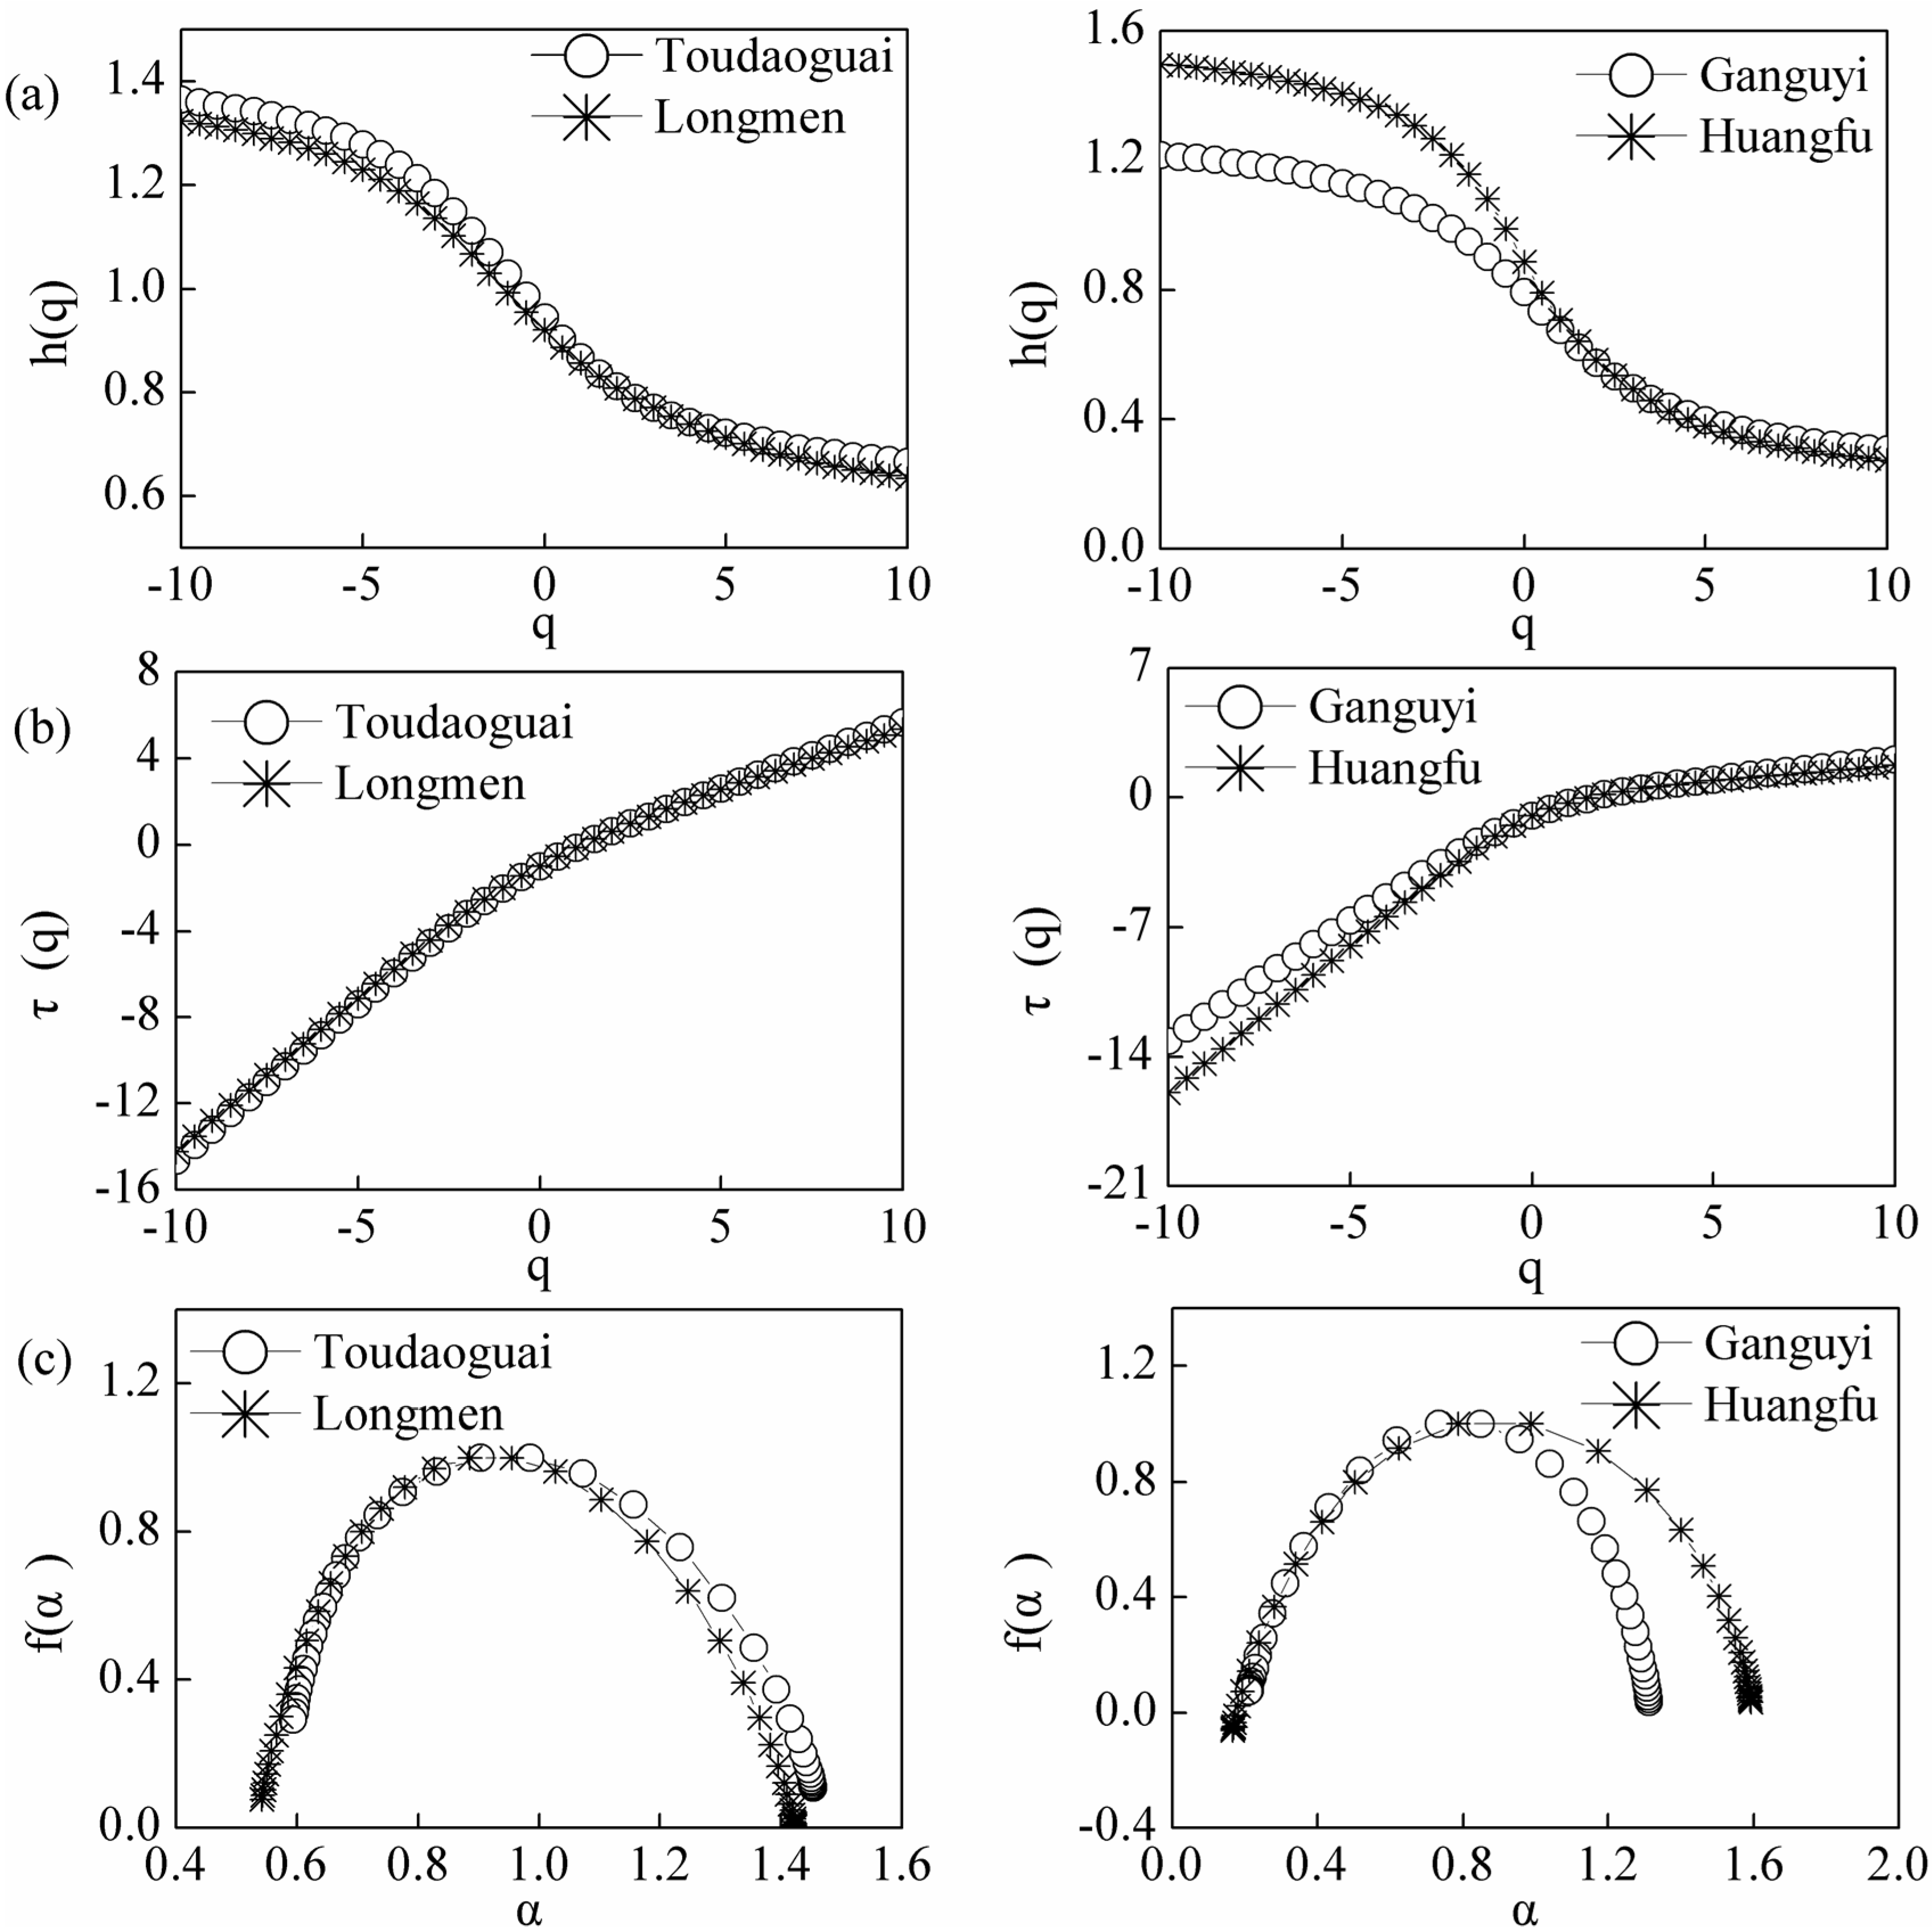
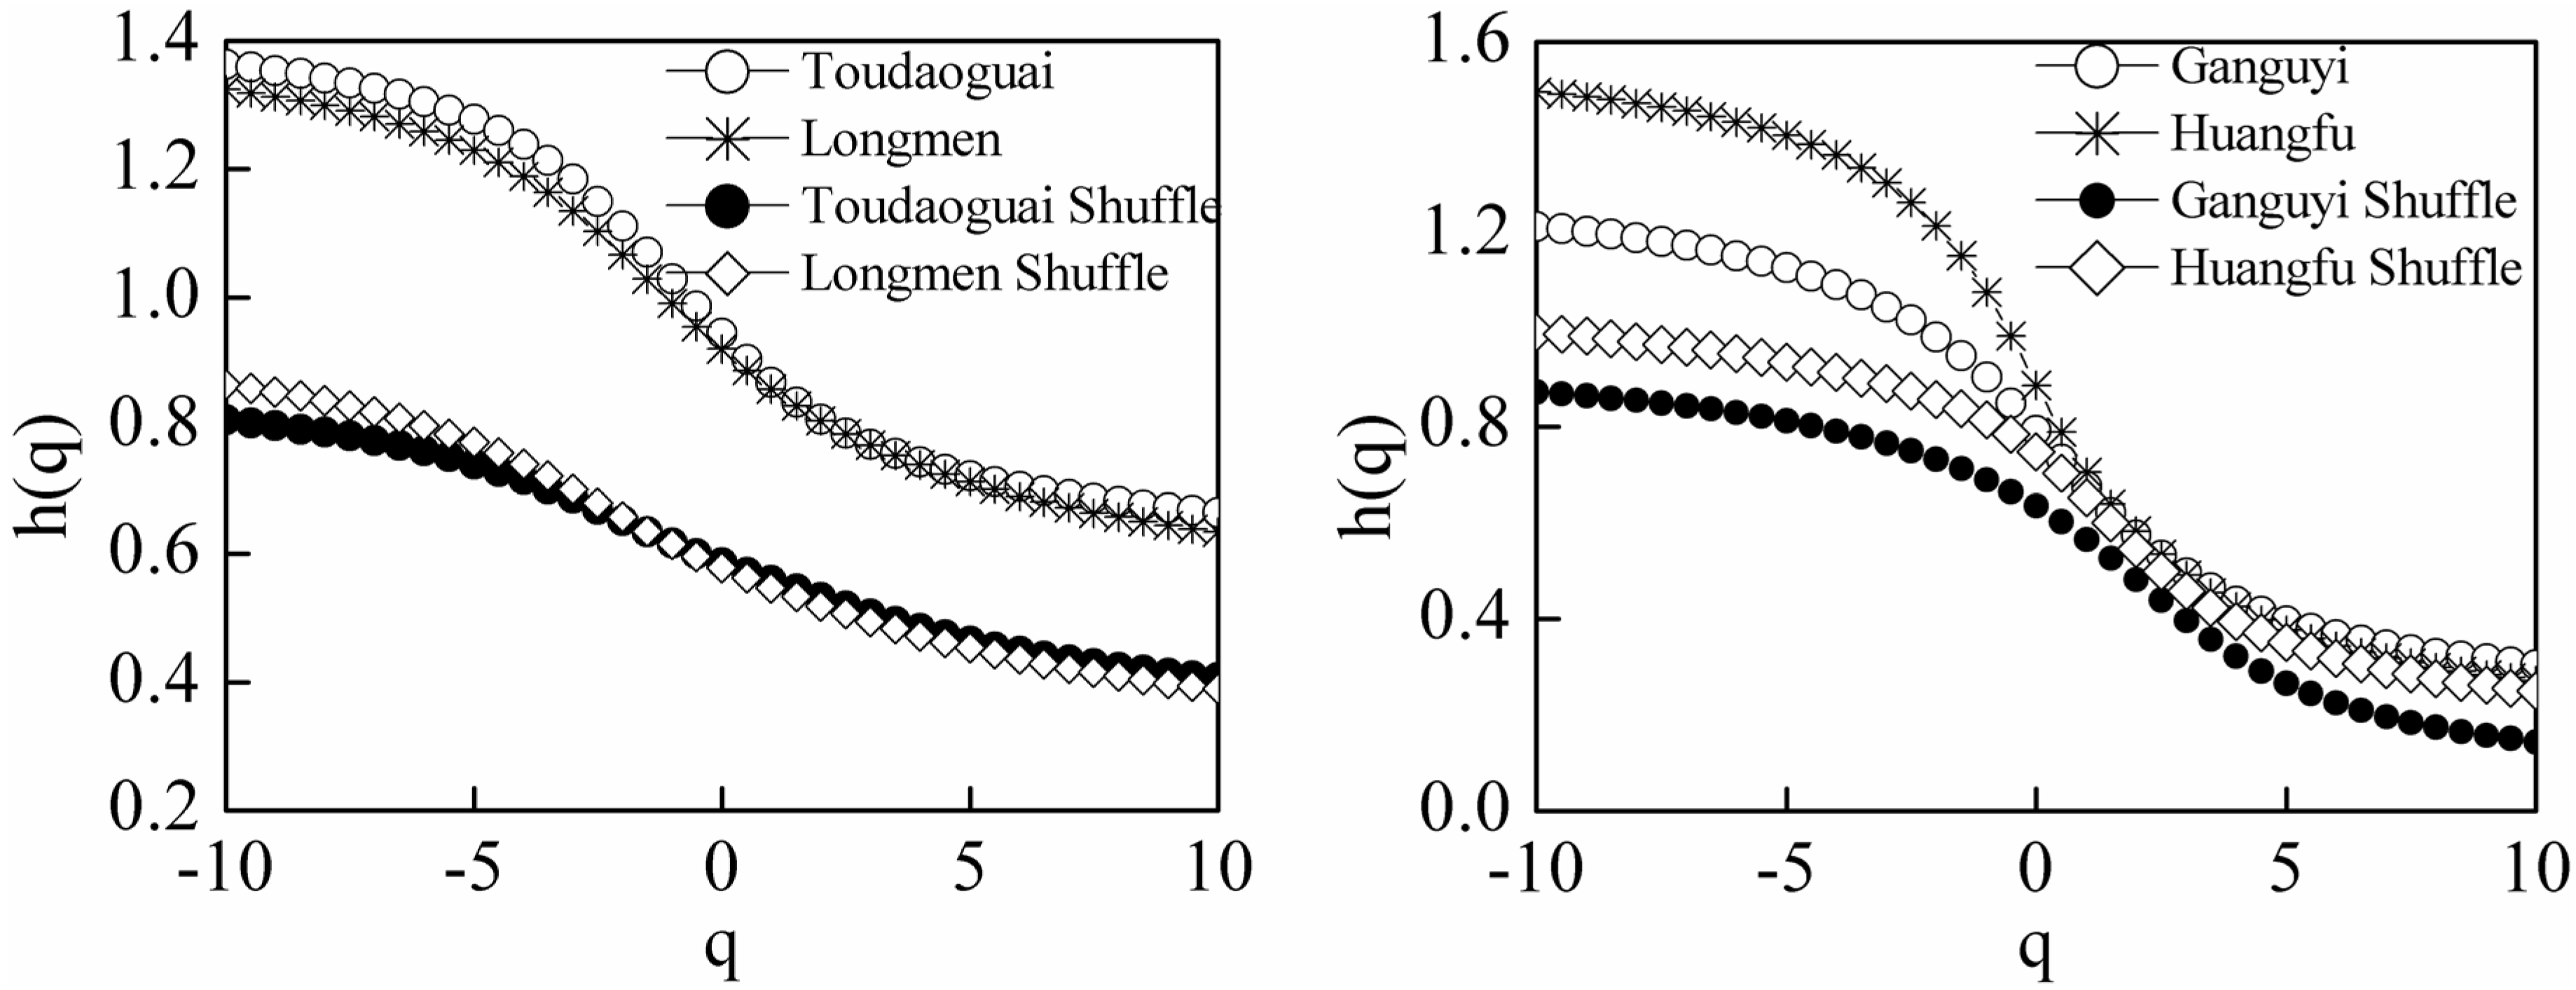
4.2. Multifractal Detrended Fluctuation Analysis


| Study Area | Slopes | |
|---|---|---|
| −10 < q < 0 | 0 < q < 10 | |
| Toudaoguai | 1.4070 | 0.6501 |
| Longmen | 1.3361 | 0.6191 |
| Ganguyi | 1.2538 | 0.2738 |
| Huangfu | 1.5456 | 0.2358 |
5. Discussion

6. Conclusions
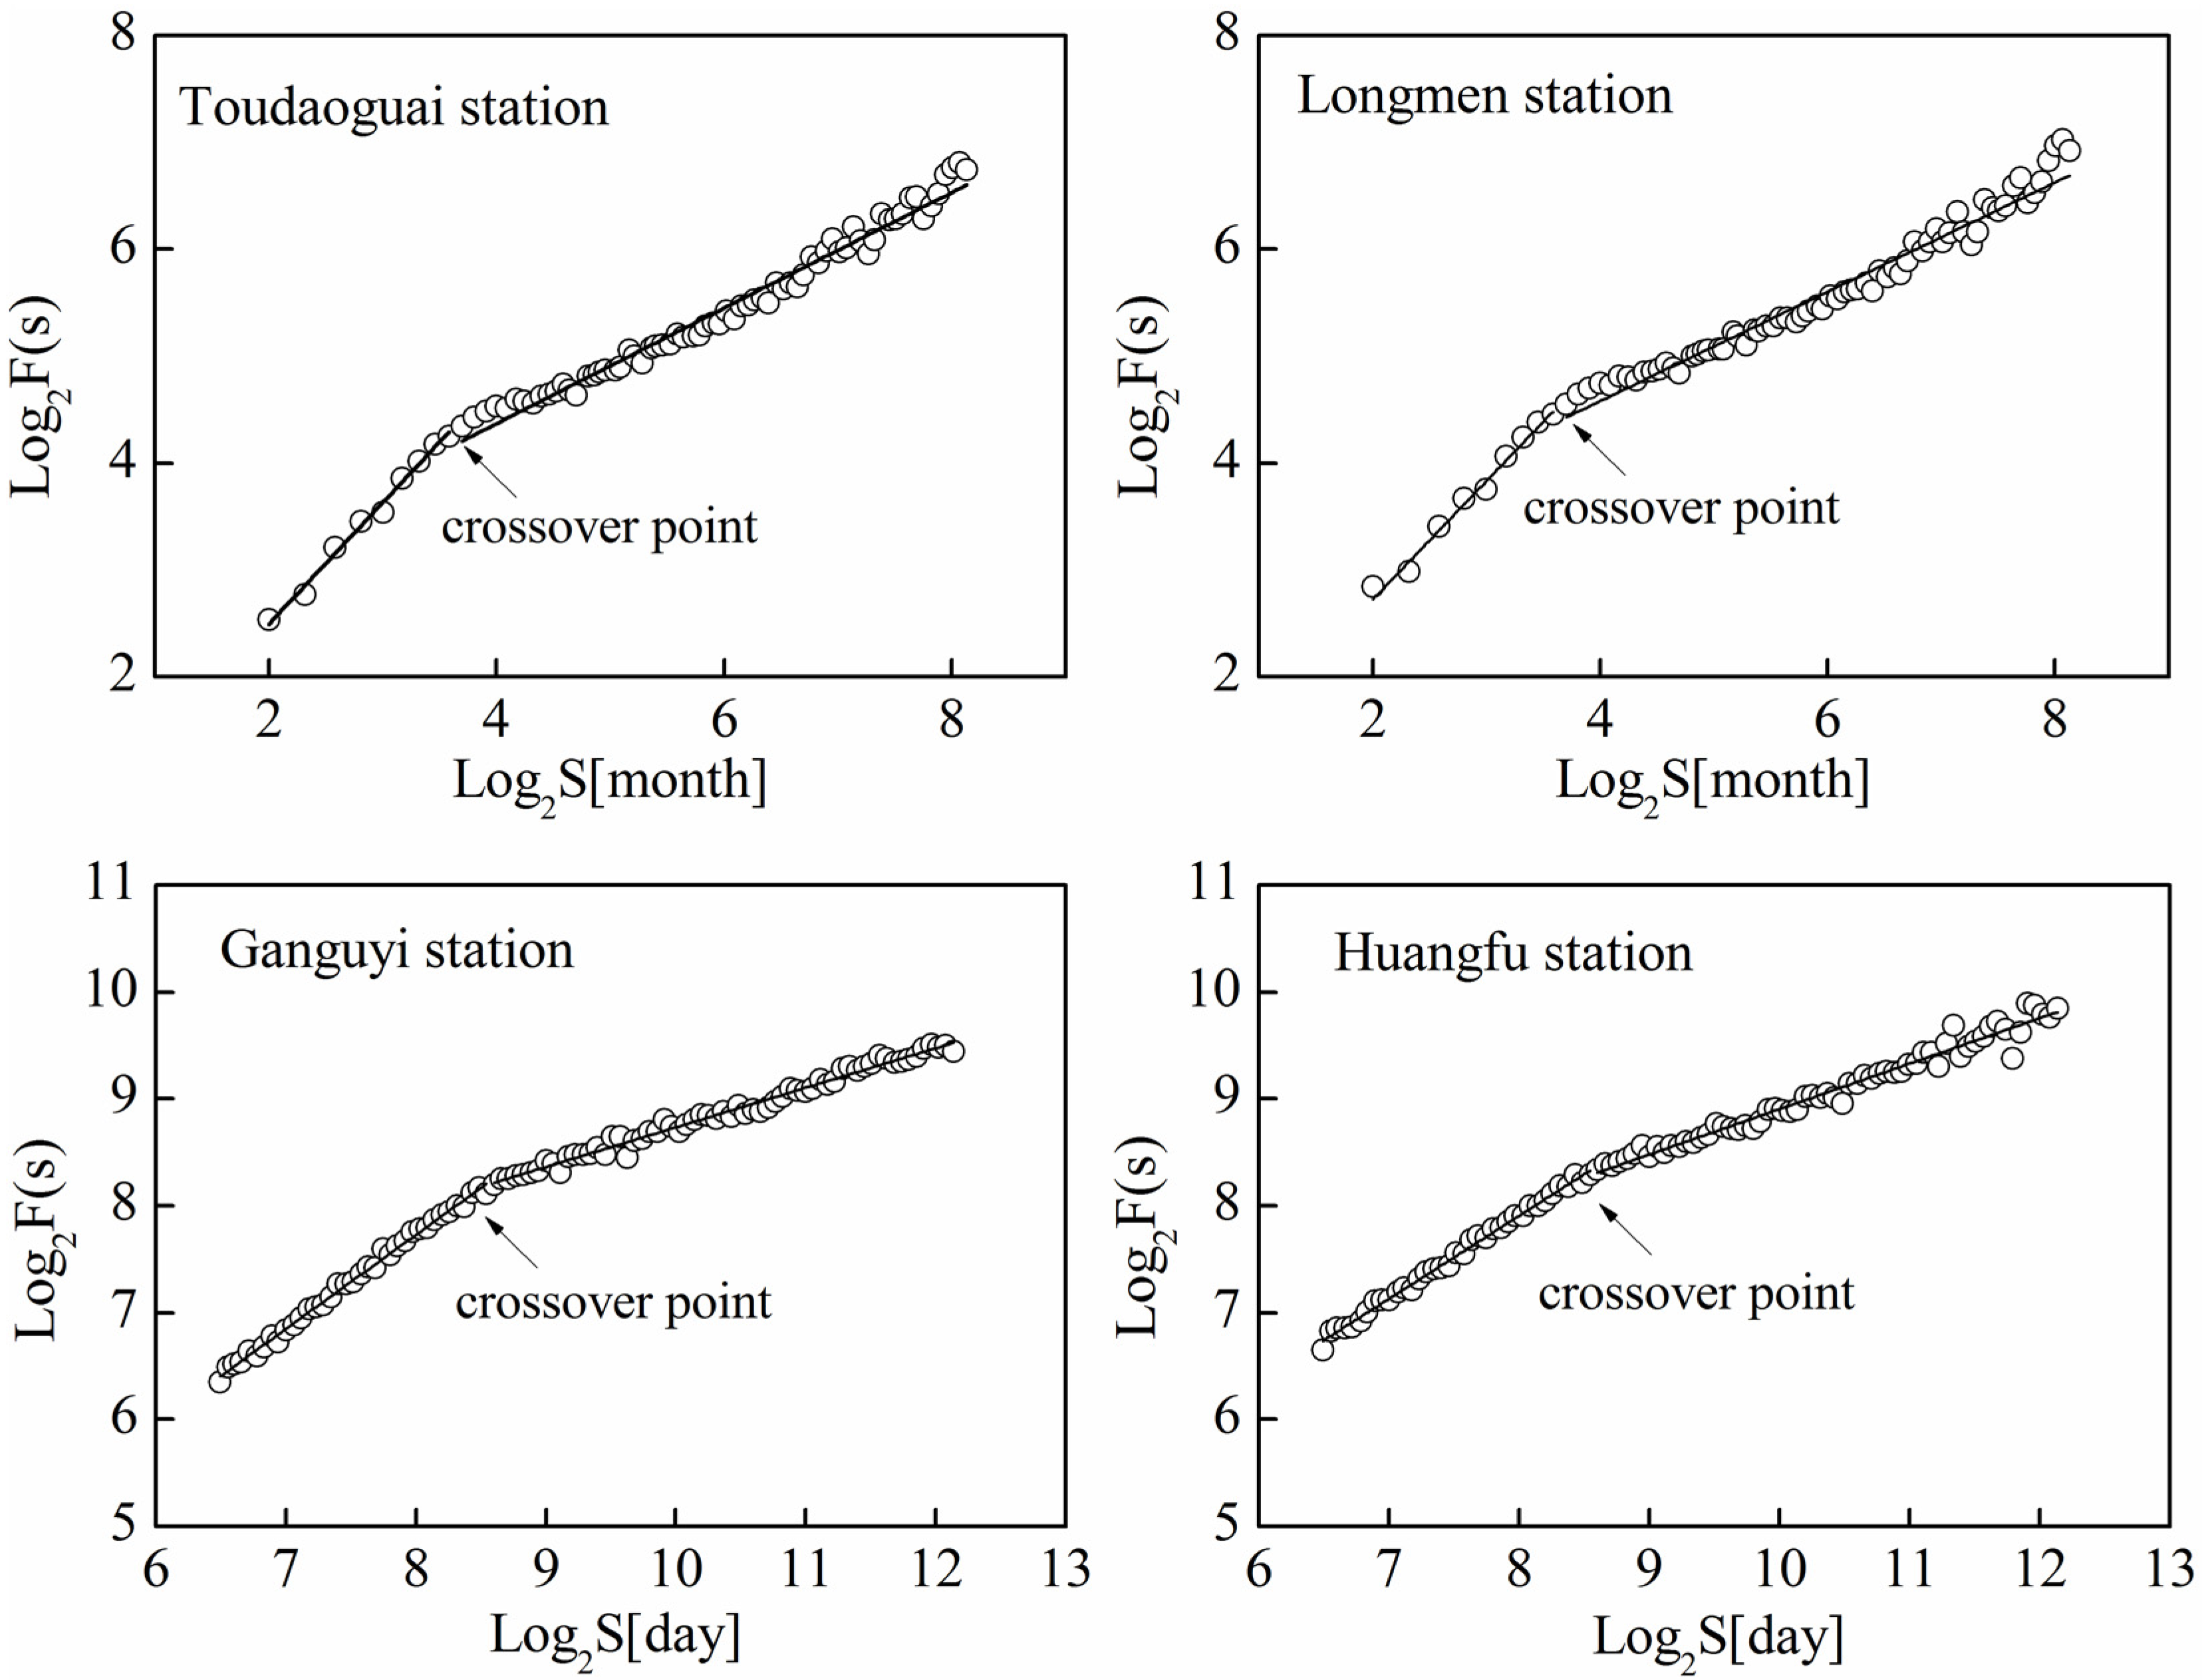
- (1)
- One crossover point can be found for the four log−log plots of Fq(s) versus s in the streamflow series. The crossover point occurred in approximately 12 months at the Toudaoguai and Longmen stations, and in approximately 372 days at Ganguyi and Huangfu station, which is attributed to a one-year periodicity of streamflow.
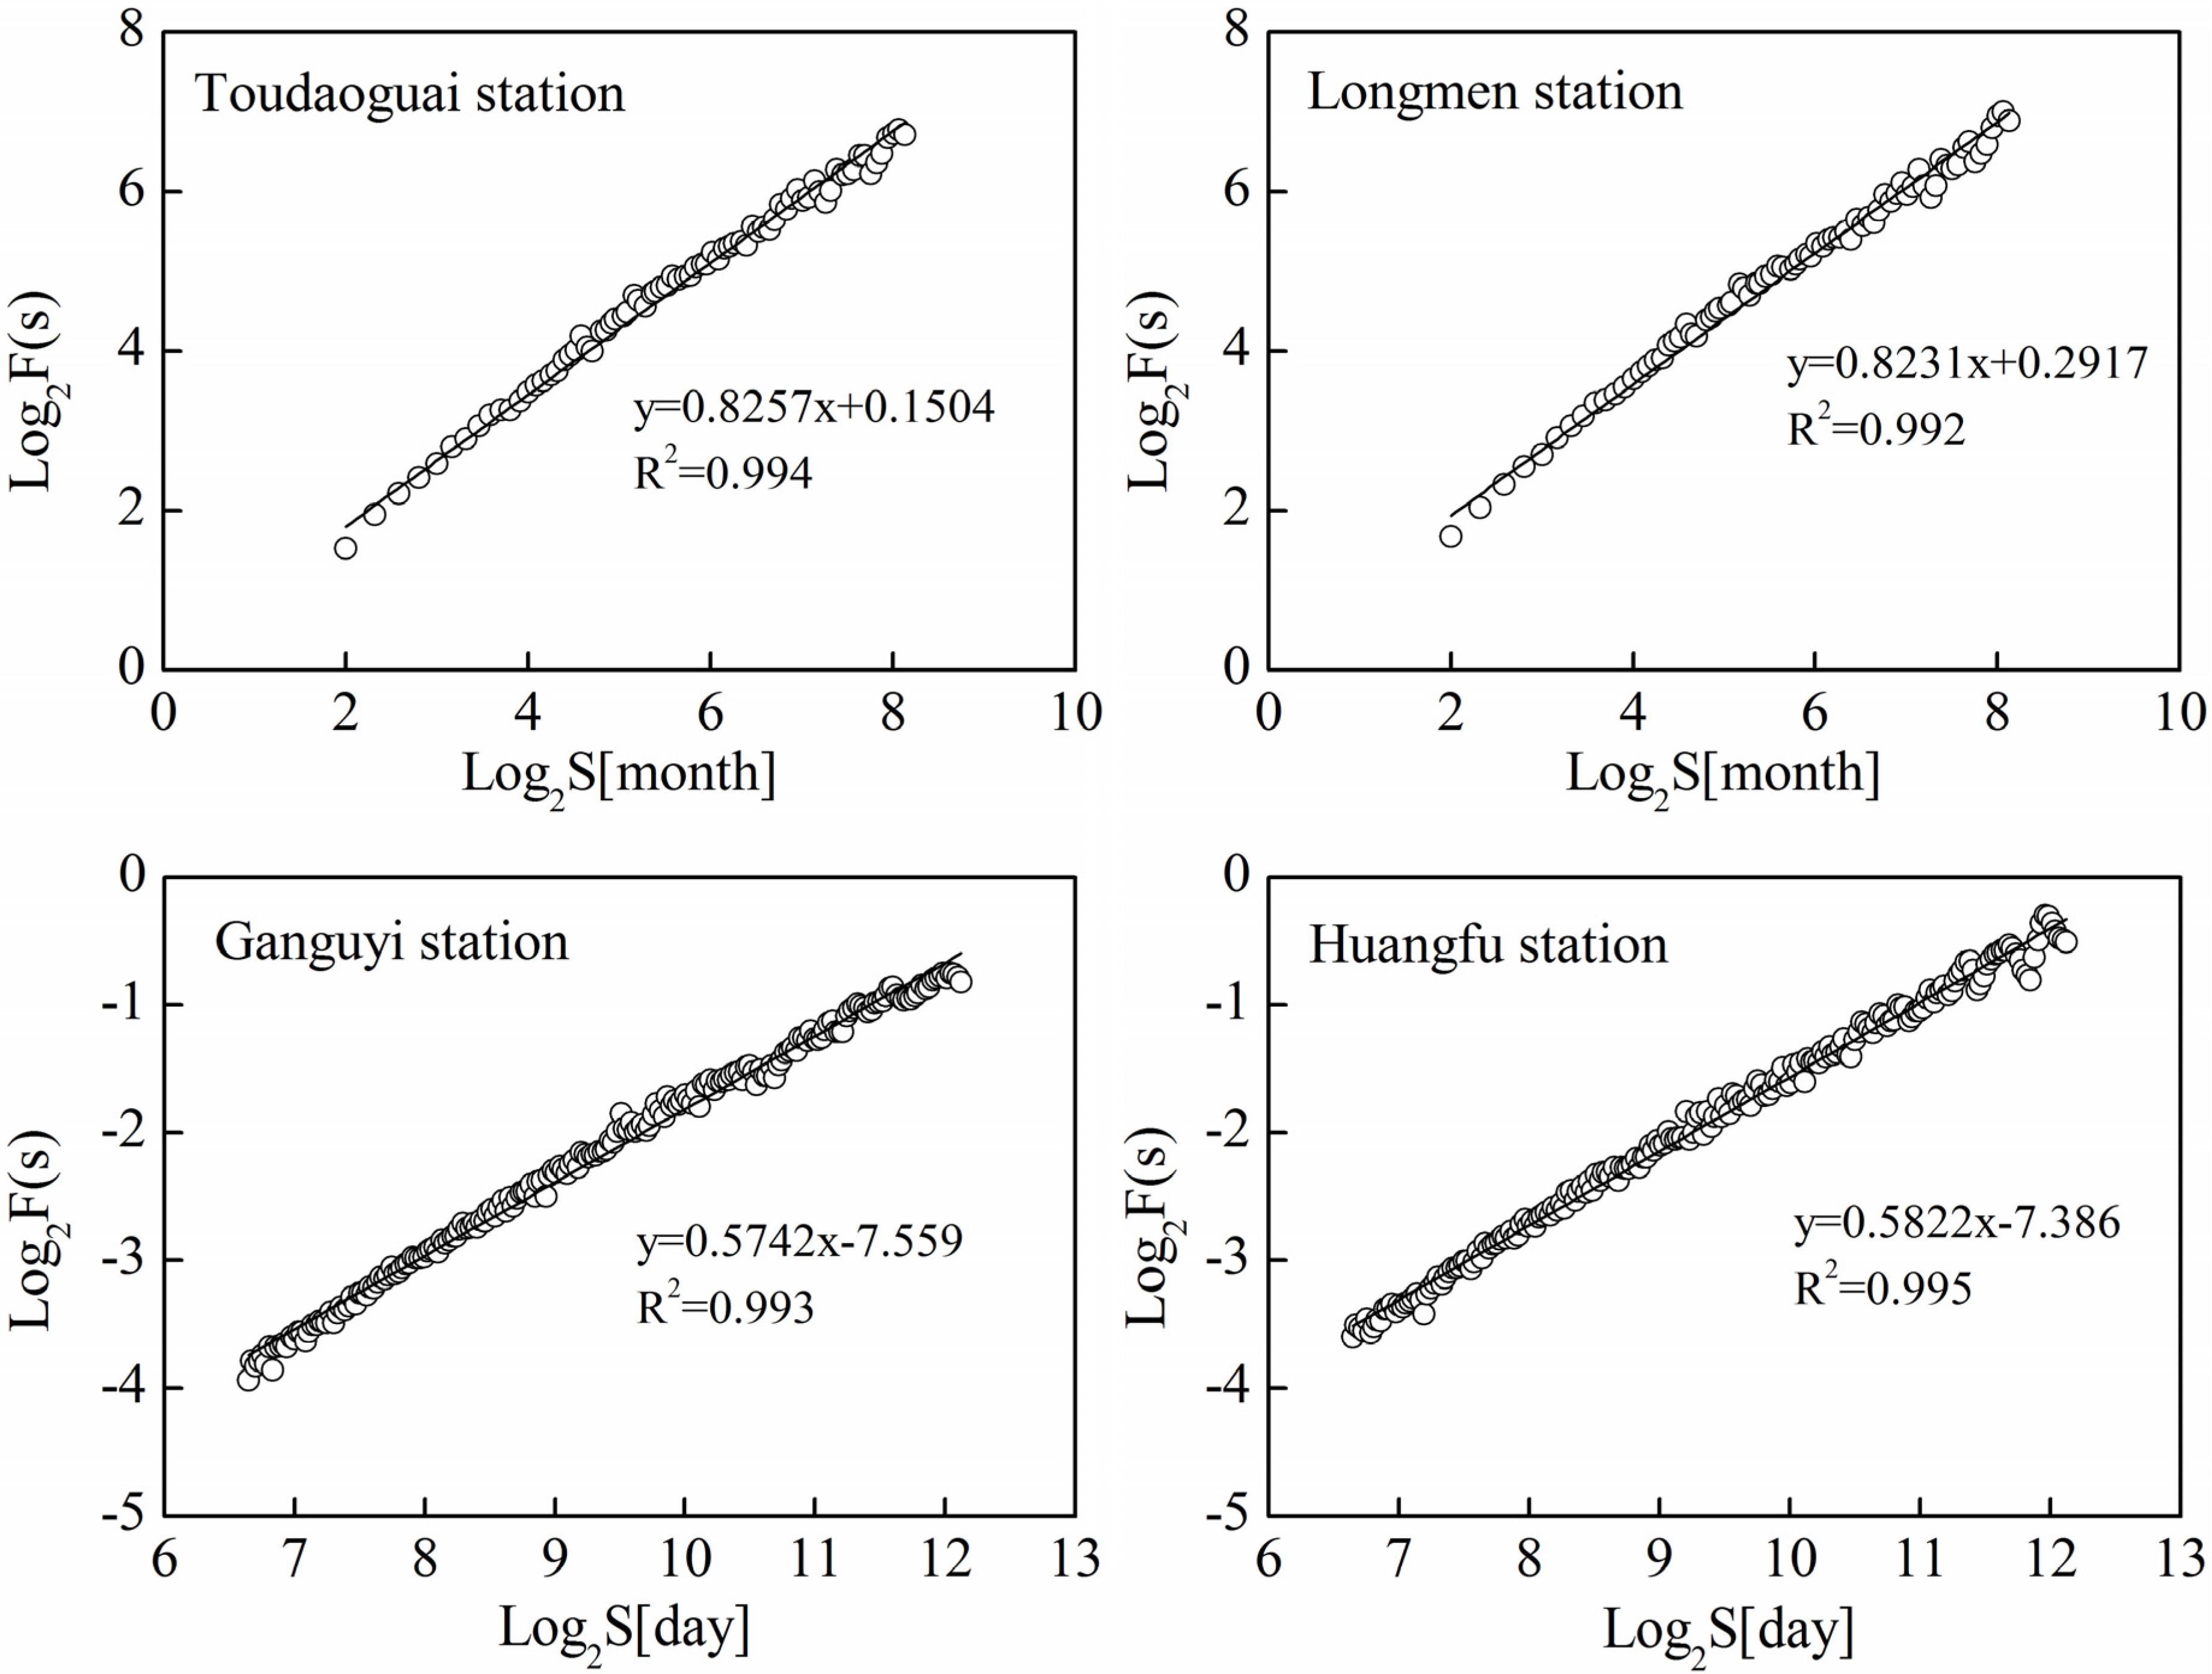
- (2)
- The scaling properties of the decomposed streamflow series at the four stations showed long-range correlations. This may imply universal scaling properties within Yellow River basin.
- (3)
- The q dependence of h(q) and τ(q) indicated that streamflow time series have multifractal behavior, which is due to the correlation properties, as well as to the PDF of the hydrological series. Comparing with Yanhe, streamflow time series at Huangfuchuan have a multifractal structure that is sensitive to large magnitudes of local fluctuations. Different precipitation−geomorphological types−runoff relationships at Yanhe and Huangfuchuan watershed may be the major effect factors inducing different multifractal behaviors.
Acknowledgments
Author Contributions
Conflicts of Interest
References
- Labat, D.; Goddéris, Y.; Probst, J.L.; Guyot, J.L. Evidence for global runoff increase related to climate warming. Adv. Water Resour. 2004, 27, 631–642. [Google Scholar] [CrossRef] [Green Version]
- Zhao, G.J.; Hörmann, G.; Fohrer, N.; Zhang, Z.X.; Zhai, J.Q. Streamflow trends and climate variability impacts in poyang lake basin, china. Water Resour. Manag. 2010, 24, 689–706. [Google Scholar] [CrossRef]
- Mu, X.M.; Zhang, L.; McVicar, T.R.; Chille, B.; Gau, P. Analysis of the impact of conservation measures on stream flow regime in catchments of the loess plateau, china. Hydrol. Process. 2007, 21, 2124–2134. [Google Scholar] [CrossRef]
- Baker, T.J.; Miller, S.N. Using the soil and water assessment tool (SWAT) to assess land use impact on water resources in an east african watershed. J. Hydrol. 2013, 486, 100–111. [Google Scholar] [CrossRef]
- Hurst, H.E. Long-term storage capacity of reservoirs. Trans. Am. Soc. Civil Eng. 1951, 116, 770–808. [Google Scholar]
- Feder, J. Fractals; Plenum Press: New York, NY, USA, 1988. [Google Scholar]
- Tessier, Y.; Lovejoy, S.; Hubert, P.; Schertzer, D.; Pecknold, S. Multifractal analysis and modeling of rainfall and river flows and scaling, causal transfer functions. J. Geophys. Res. Atmos. 1996, 101, 26427–26440. [Google Scholar] [CrossRef]
- Blender, R.; Fraedrich, K. Long-term memory of the hydrological cycle and river runoffs in china in a high-resolution climate model. Int. J. Climatol. 2006, 26, 1547–1565. [Google Scholar] [CrossRef]
- Koscielny-Bunde, E.; Kantelhardt, J.W.; Braun, P.; Bunde, A.; Havlin, S. Long-term persistence and multifractality of river runoff records: Detrended fluctuation studies. J. Hydrol. 2006, 322, 120–137. [Google Scholar] [CrossRef]
- Hajian, S.; Movahed, M.S. Multifractal detrended cross-correlation analysis of sunspot numbers and river flow fluctuations. Phys. A Stat. Mech. Appl. 2010, 389, 4942–4957. [Google Scholar] [CrossRef]
- Zhou, Y.; Zhang, Q.; Singh, V.P. Fractal-based evaluation of the effect of water reservoirs on hydrological processes: The dams in the yangtze river as a case study. Stoch. Environ. Res. Risk Assess. 2014, 28, 263–279. [Google Scholar] [CrossRef]
- Gulich, D.; Zunino, L. A criterion for the determination of optimal scaling ranges in DFA and MF-DFA. Phys. A Stat. Mech. Appl. 2014, 397, 17–30. [Google Scholar] [CrossRef]
- Peng, C.K.; Buldyrev, S.V.; Havlin, S.; Simons, M.; Stanley, H.E.; Goldberger, A.L. Mosaic organization of DNA nucleotides. Phys. Rev. E 1994, 49, 1685–1689. [Google Scholar] [CrossRef]
- Labat, D.; Masbou, J.; Beaulieu, E.; Mangin, A. Scaling behavior of the fluctuations in stream flow at the outlet of karstic watersheds, france. J. Hydrol. 2011, 410, 162–168. [Google Scholar] [CrossRef]
- Hirpa, F.A.; Gebremichael, M.; Over, T.M. River flow fluctuation analysis: Effect of watershed area. Water Resour. Res. 2010, 46. [Google Scholar] [CrossRef]
- Kantelhardt, J.W.; Zschiegner, S.A.; Koscielny-Bunde, E.; Havlin, S.; Bunde, A.; Stanley, H.E. Multifractal detrended fluctuation analysis of nonstationary time series. Phys. A Stat. Mech. Appl. 2002, 316, 87–114. [Google Scholar] [CrossRef]
- Kantelhardt, J.; Koscielny-Bunde, E.; Rybski, D.; Braun, P.; Bunde, A.; Havlin, S. Long-term persistence and multifractality of precipitation and river runoff records. J. Geophys. Res. 2006, 111. [Google Scholar] [CrossRef]
- Zhang, Q.; Xu, C.Y.; Yu, Z.G.; Liu, C.L.; Chen, Y.D. Multifractal analysis of streamflow records of the east river basin (pearl river), china. Phys. A Stat. Mech. Appl. 2009, 388, 927–934. [Google Scholar] [CrossRef]
- Rego, C.; Frota, H.; Gusmão, M. Multifractality of brazilian rivers. J. Hydrol. 2013, 495, 208–215. [Google Scholar] [CrossRef]
- Rybski, D.; Bunde, A.; Havlin, S.; Kantelhardt, J.W.; Koscielny-Bunde, E. Detrended fluctuation studies of long-term persistence and multifractality of precipitation and river runoff records. In In Extremis; Springer: Berlin, Germany, 2011; pp. 216–248. [Google Scholar]
- Nagarajan, R.; Kavasseri, R.G. Minimizing the effect of trends on detrended fluctuation analysis of long-range correlated noise. Phys. A Stat. Mech. Appl. 2005, 354, 182–198. [Google Scholar] [CrossRef]
- Gao, P.; Mu, X.M.; Wang, F.; Li, R. Changes in streamflow and sediment discharge and the response to human activities in the middle reaches of the yellow river. Hydrol. Earth Syst. Sci. 2011, 15, 1–10. [Google Scholar] [CrossRef] [Green Version]
- Zhao, G.J.; Mu, X.M.; Strehmel, A.; Tian, P. Temporal variation of streamflow, sediment load and their relationship in the yellow river basin, China. PLoS ONE 2014, 9. [Google Scholar] [CrossRef] [PubMed]
- Shiau, J.T.; Feng, S.; Nadarajah, S. Assessment of hydrological droughts for the yellow river, china, using copulas. Hydrol. Process. 2007, 21, 2157–2163. [Google Scholar] [CrossRef]
- Wang, F.; Zhao, G.; Mu, X.; Gao, P.; Sun, W. Regime shift identification of runoff and sediment loads in the yellow river basin, china. Water 2014, 6, 3012–3032. [Google Scholar] [CrossRef]
- Tian, P.; Zhao, G.J.; Mu, X.M.; Wang, F.; Gao, P.; Mi, Z.J. Check dam identification using multisource data and their effects on streamflow and sediment load in a chinese loess plateau catchment. J. Appl. Remote Sens. 2013, 7. [Google Scholar] [CrossRef]
- Cleveland, R.B.; Cleveland, W.S.; McRae, J.E.; Terpenning, I. Stl: A seasonal-trend decomposition procedure based on loess. J. Off. Stat. 1990, 6, 3–73. [Google Scholar]
- Movahed, M.S.; Jafari, G.; Ghasemi, F.; Rahvar, S.; Tabar, M.R.R. Multifractal detrended fluctuation analysis of sunspot time series. J. Stat. Mech. Theory Exp. 2006, 2006. [Google Scholar] [CrossRef]
- Zhang, Q.; Xu, C.Y.; Chen, Y.D.; Yu, Z.G. Multifractal detrended fluctuation analysis of streamflow series of the Yangtze river basin, china. Hydrol. Process. 2008, 22, 4997–5003. [Google Scholar] [CrossRef]
- Bunde, A.; Bogachev, M.I.; Lennartz, S. Precipitation and river flow: Long-term memory and predictability of extreme events. Geophys. Monogr. Ser. 2012, 196, 139–152. [Google Scholar]
- Livina, V.N.; Ashkenazy, Y.; Bunde, A.; Havlin, S. Seasonality effects on nonlinear properties of hydrometeorological records. In In Extremis; Springer: Berlin, Germany, 2011; pp. 266–284. [Google Scholar]
- Kerkhoven, E.; Gan, T. Unconditional uncertainties of historical and simulated river flows subjected to climate change. J. Hydrol. 2011, 396, 113–127. [Google Scholar] [CrossRef]
- Livina, V.; Kizner, Z.; Braun, P.; Molnar, T.; Bunde, A.; Havlin, S. Temporal scaling comparison of real hydrological data and model runoff records. J. Hydrol. 2007, 336, 186–198. [Google Scholar] [CrossRef]
- Zhang, Y.; Ge, E. Temporal scaling behavior of sea-level change in hong kong—Multifractal temporally weighted detrended fluctuation analysis. Glob. Planet. Chang. 2013, 100, 362–370. [Google Scholar] [CrossRef]
- Biswas, A.; Zeleke, T.; Si, B.C. Multifractal detrended fluctuation analysis in examining scaling properties of the spatial patterns of soil water storage. Nonlinear Process. Geophys. 2012, 19, 227–238. [Google Scholar] [CrossRef]
- Ihlen, E.A. Introduction to multifractal detrended fluctuation analysis in matlab. Front. Physiol. 2012, 3. [Google Scholar] [CrossRef]
- Özger, M.; Mishra, A.K.; Singh, V.P. Seasonal and spatial variations in the scaling and correlation structure of streamflow data. Hydrol. Process. 2013, 27, 1681–1690. [Google Scholar] [CrossRef]
- Li, E.H.; Mu, X.M.; Zhao, G.J.; Gao, P.; Shao, H.B. Variation of runoff and precipitation in the hekou-longmen region of the yellow river based on elasticity analysis. Sci. World J. 2014, 2014. [Google Scholar] [CrossRef]
- Yang, T.; Zhang, Q.; Chen, Y.D.; Tao, X.; Xu, C.Y.; Chen, X. A spatial assessment of hydrologic alteration caused by dam construction in the middle and lower yellow river, china. Hydrol. Process. 2008, 22, 3829–3843. [Google Scholar] [CrossRef]
- Peng, C.K.; Havlin, S.; Stanley, H.E.; Goldberger, A.L. Quantification of scaling exponents and crossover phenomena in nonstationary heartbeat time series. Chaos Interdiscip. J. Nonlinear Sci. 1995, 5, 82–87. [Google Scholar] [CrossRef]
- Zhou, J.; Liang, Z.; Liu, Y.; Guo, H.; He, D.; Zhao, L. Six-decade temporal change and seasonal decomposition of climate variables in lake dianchi watershed (china): Stable trend or abrupt shift? Theor. Appl. Climatol. 2015, 119, 181–191. [Google Scholar] [CrossRef]
- Obertegger, U.; Manca, M. Response of rotifer functional groups to changing trophic state and crustacean community. J. Limnol. 2011, 70, 231–238. [Google Scholar] [CrossRef]
- Lee, H.; Levine, M.; Guptill-Yoran, C.; Johnson, A.; Kamecke, P.; Moore, G. Regional and temporal variations of leptospira seropositivity in dogs in the united states, 2000–2010. J. Vet. Intern. Med. 2014, 28, 779–788. [Google Scholar] [CrossRef] [PubMed]
© 2015 by the authors; licensee MDPI, Basel, Switzerland. This article is an open access article distributed under the terms and conditions of the Creative Commons Attribution license (http://creativecommons.org/licenses/by/4.0/).
Share and Cite
Li, E.; Mu, X.; Zhao, G.; Gao, P. Multifractal Detrended Fluctuation Analysis of Streamflow in the Yellow River Basin, China. Water 2015, 7, 1670-1686. https://doi.org/10.3390/w7041670
Li E, Mu X, Zhao G, Gao P. Multifractal Detrended Fluctuation Analysis of Streamflow in the Yellow River Basin, China. Water. 2015; 7(4):1670-1686. https://doi.org/10.3390/w7041670
Chicago/Turabian StyleLi, Erhui, Xingmin Mu, Guangju Zhao, and Peng Gao. 2015. "Multifractal Detrended Fluctuation Analysis of Streamflow in the Yellow River Basin, China" Water 7, no. 4: 1670-1686. https://doi.org/10.3390/w7041670