
Evaluating the Sources and Fate of Nitrate in the Alluvial Aquifers in the Shijiazhuang Rural and Suburban Area, China: Hydrochemical and Multi-Isotopic Approaches


Abstract
:1. Introduction
2. Materials and Methods
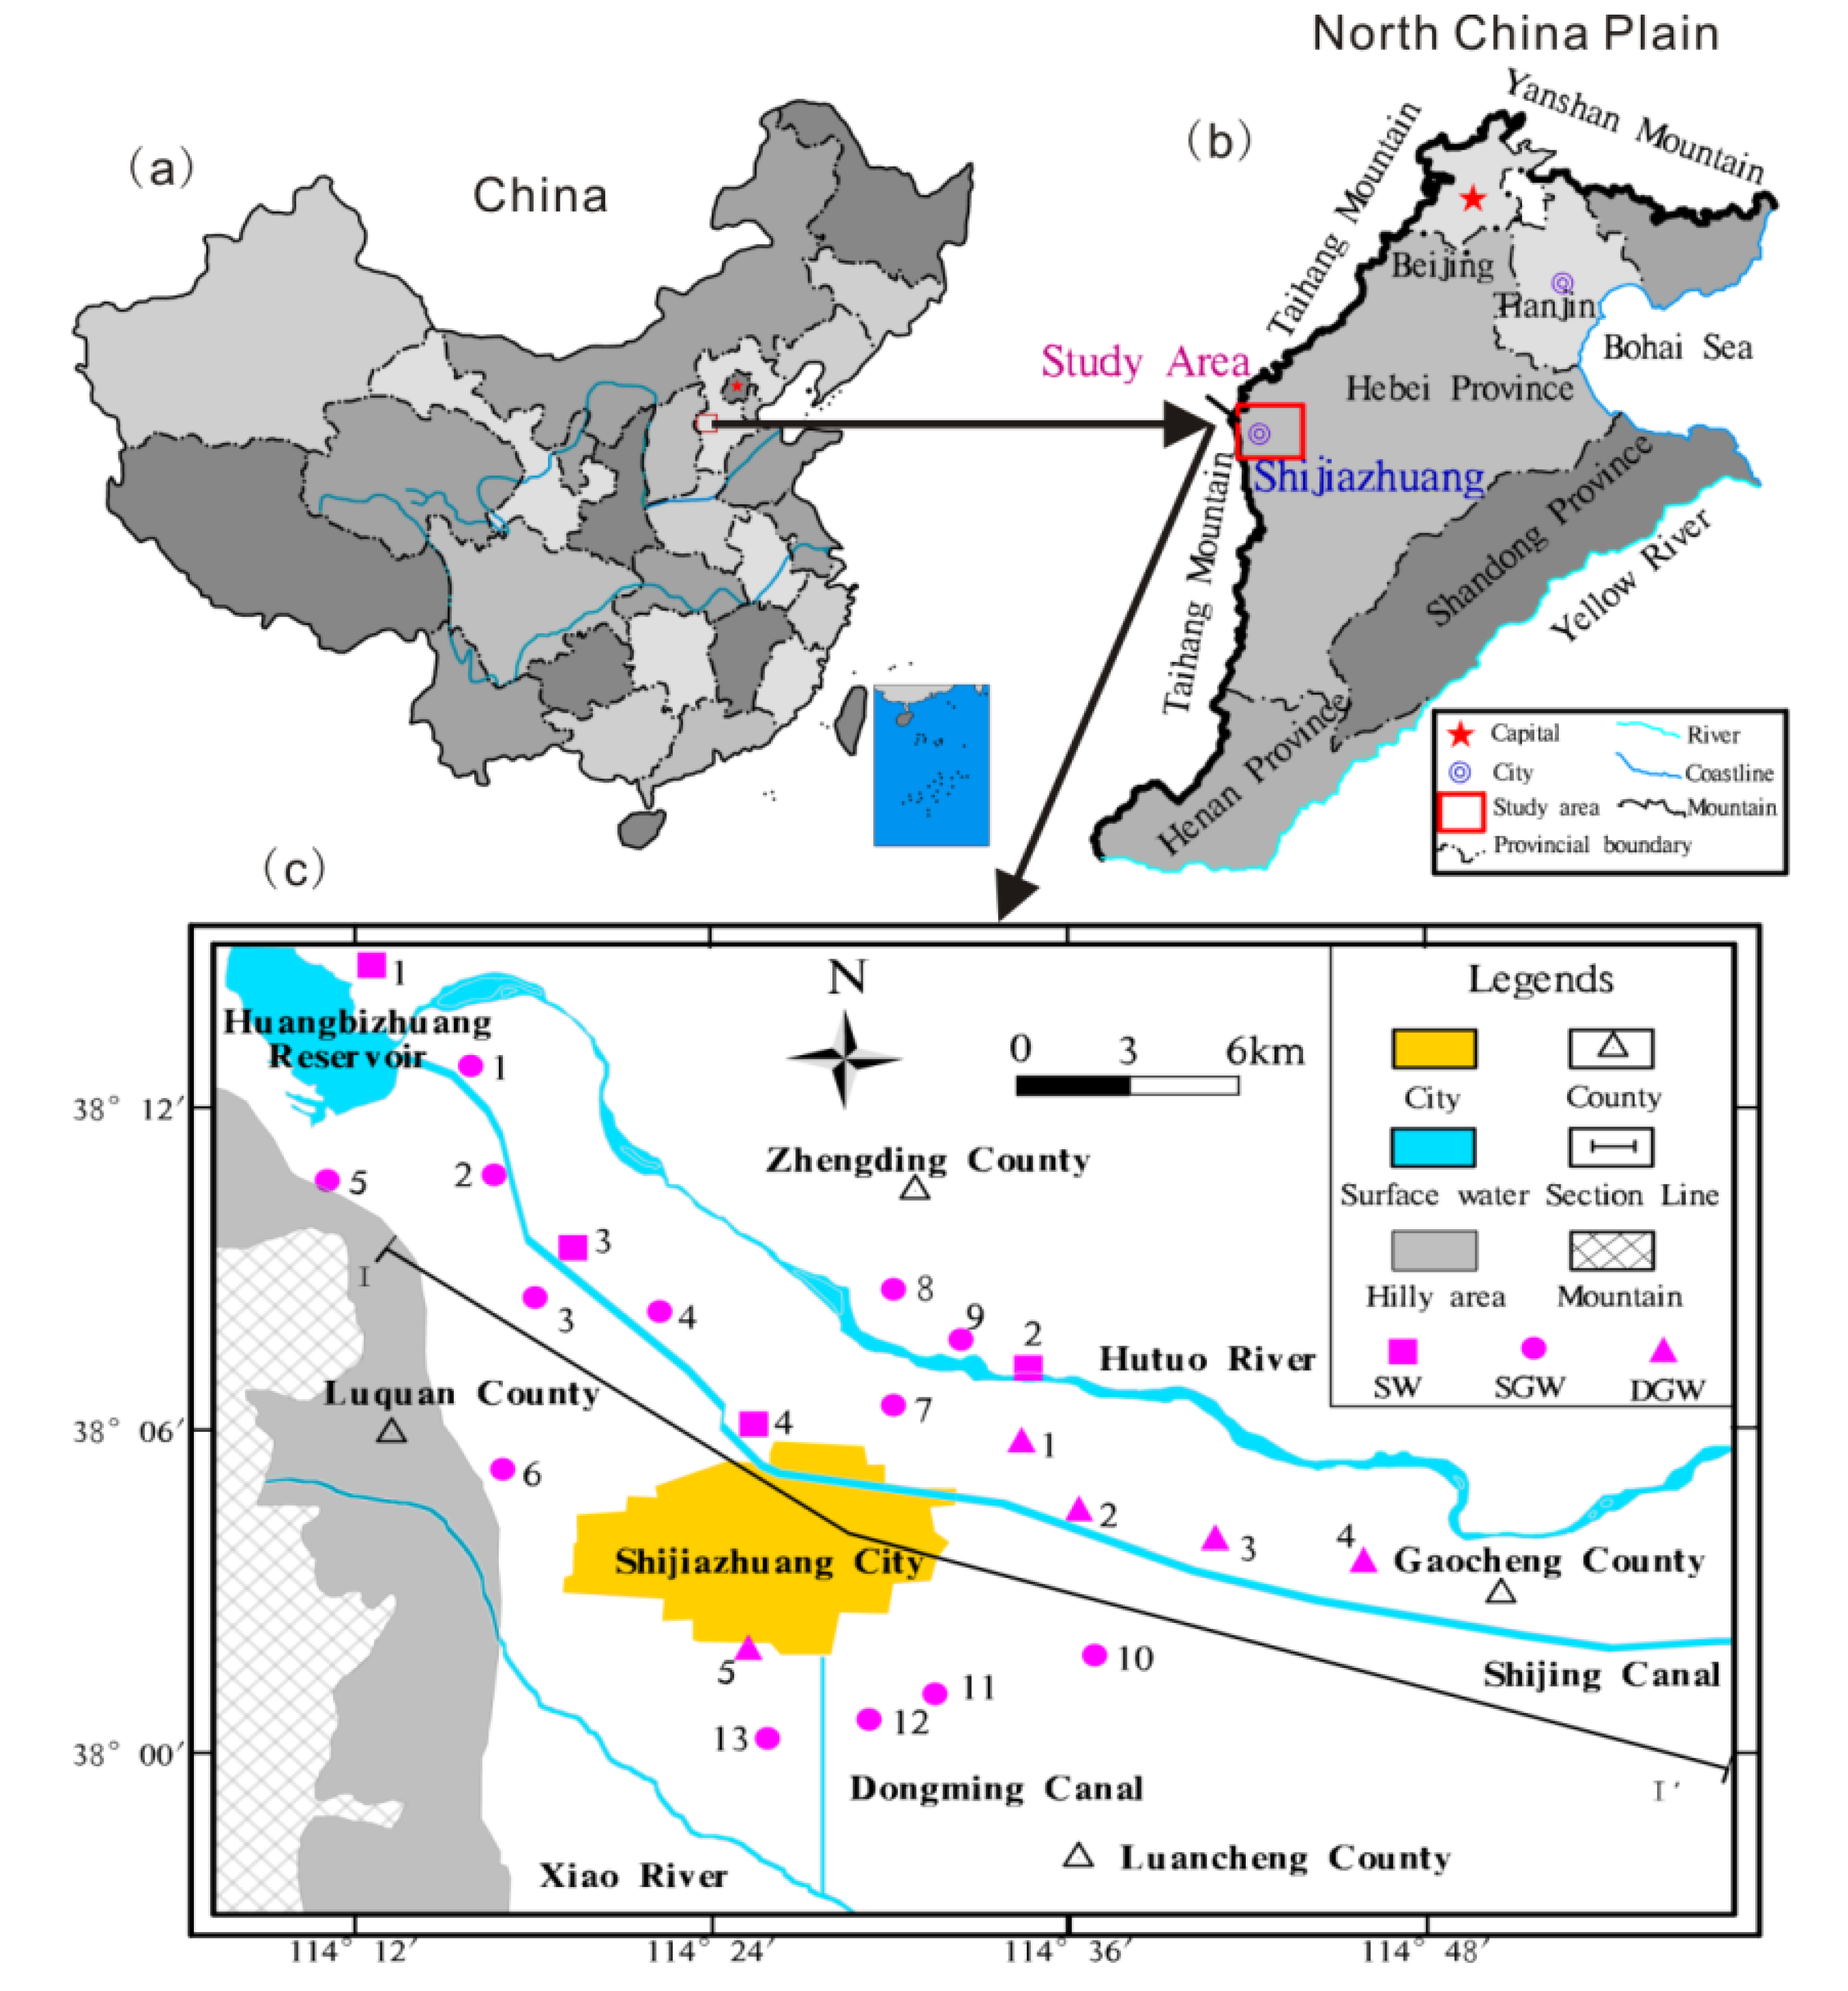
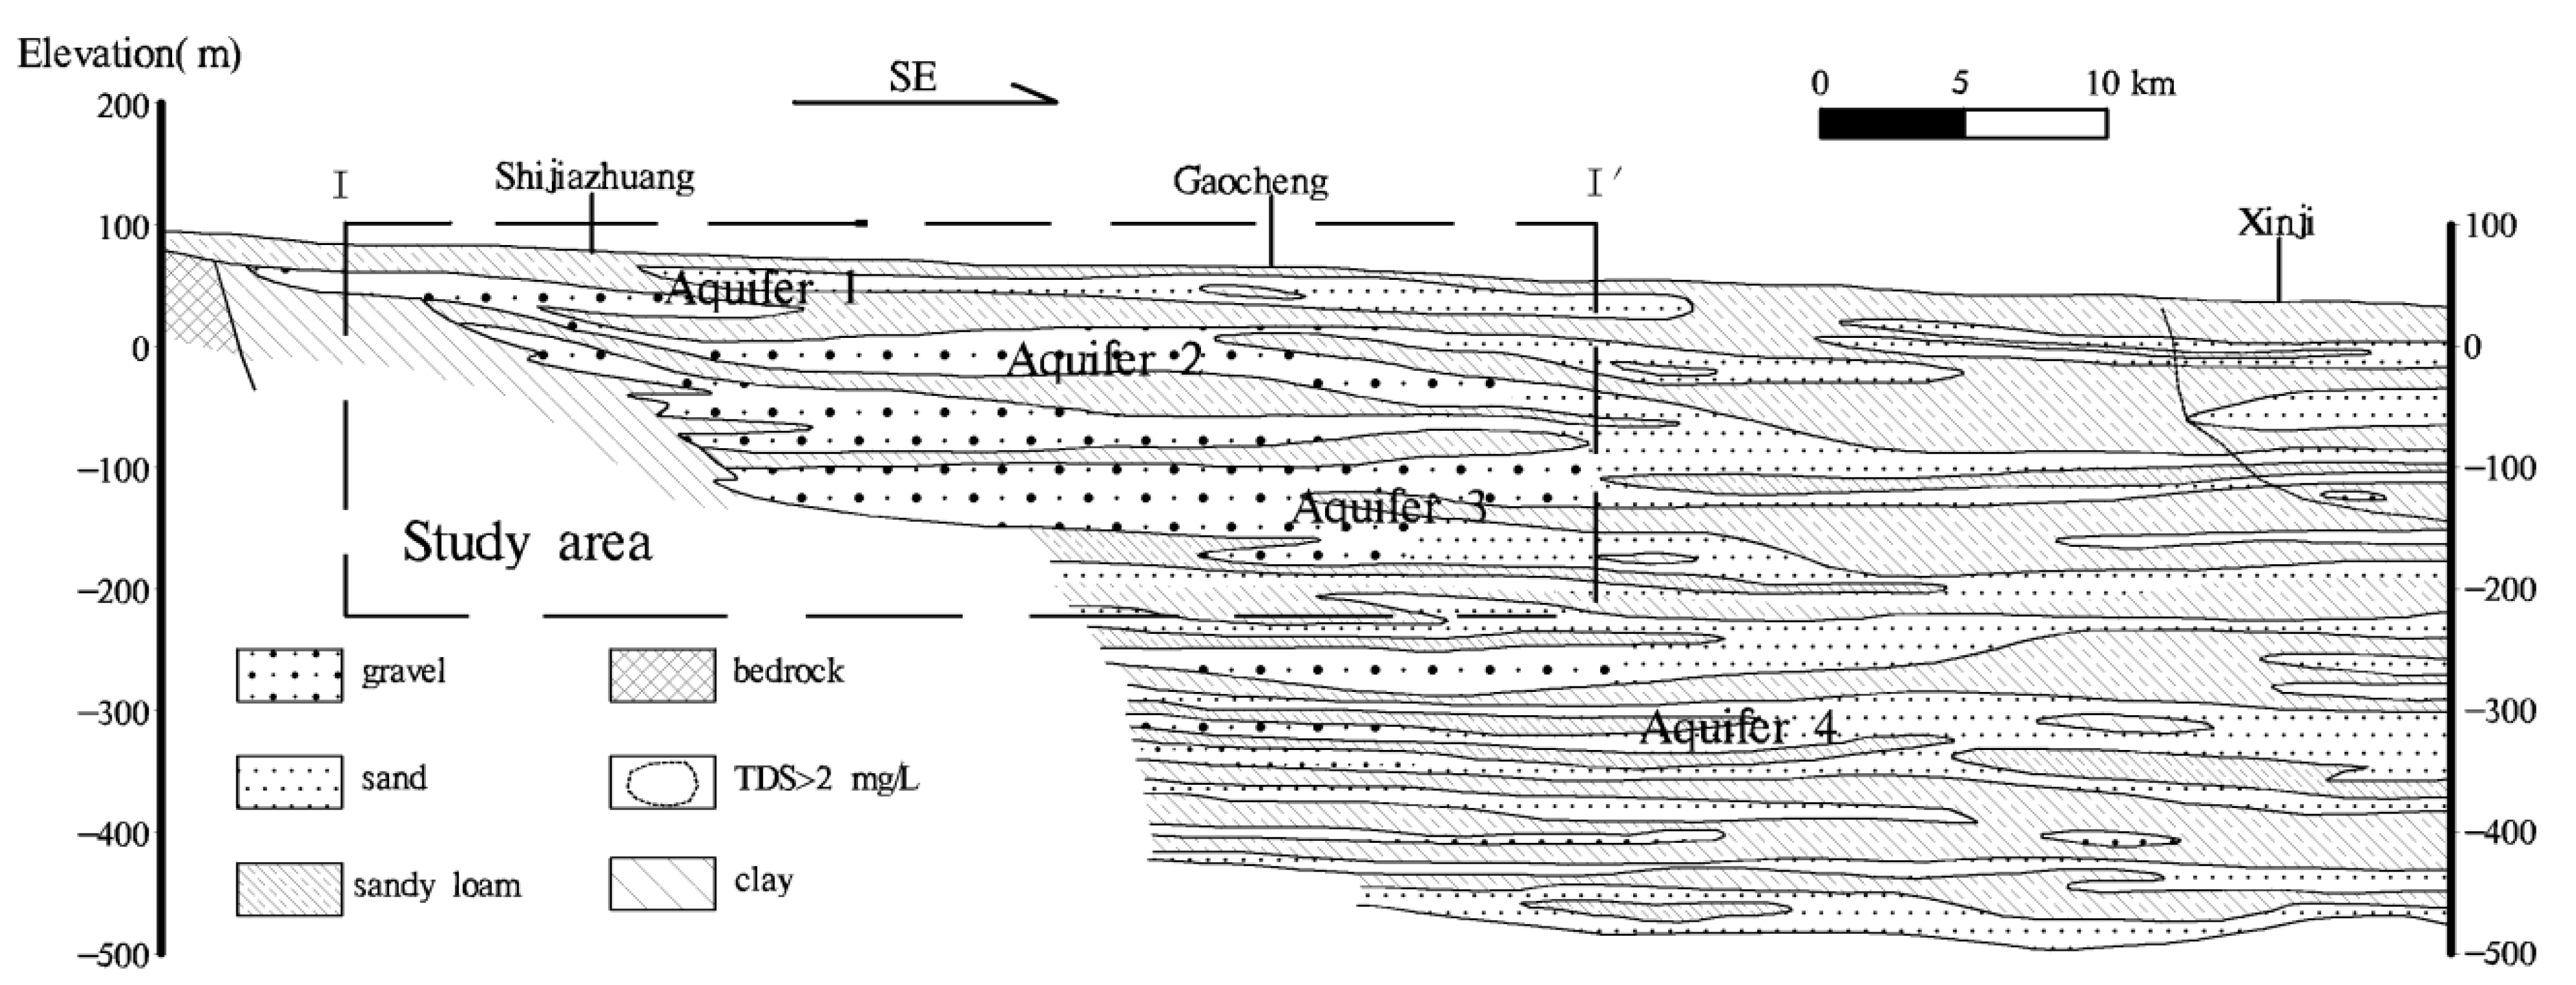
2.1. Description of the Study Area

2.2. Sampling and Analytical Methods
3. Results
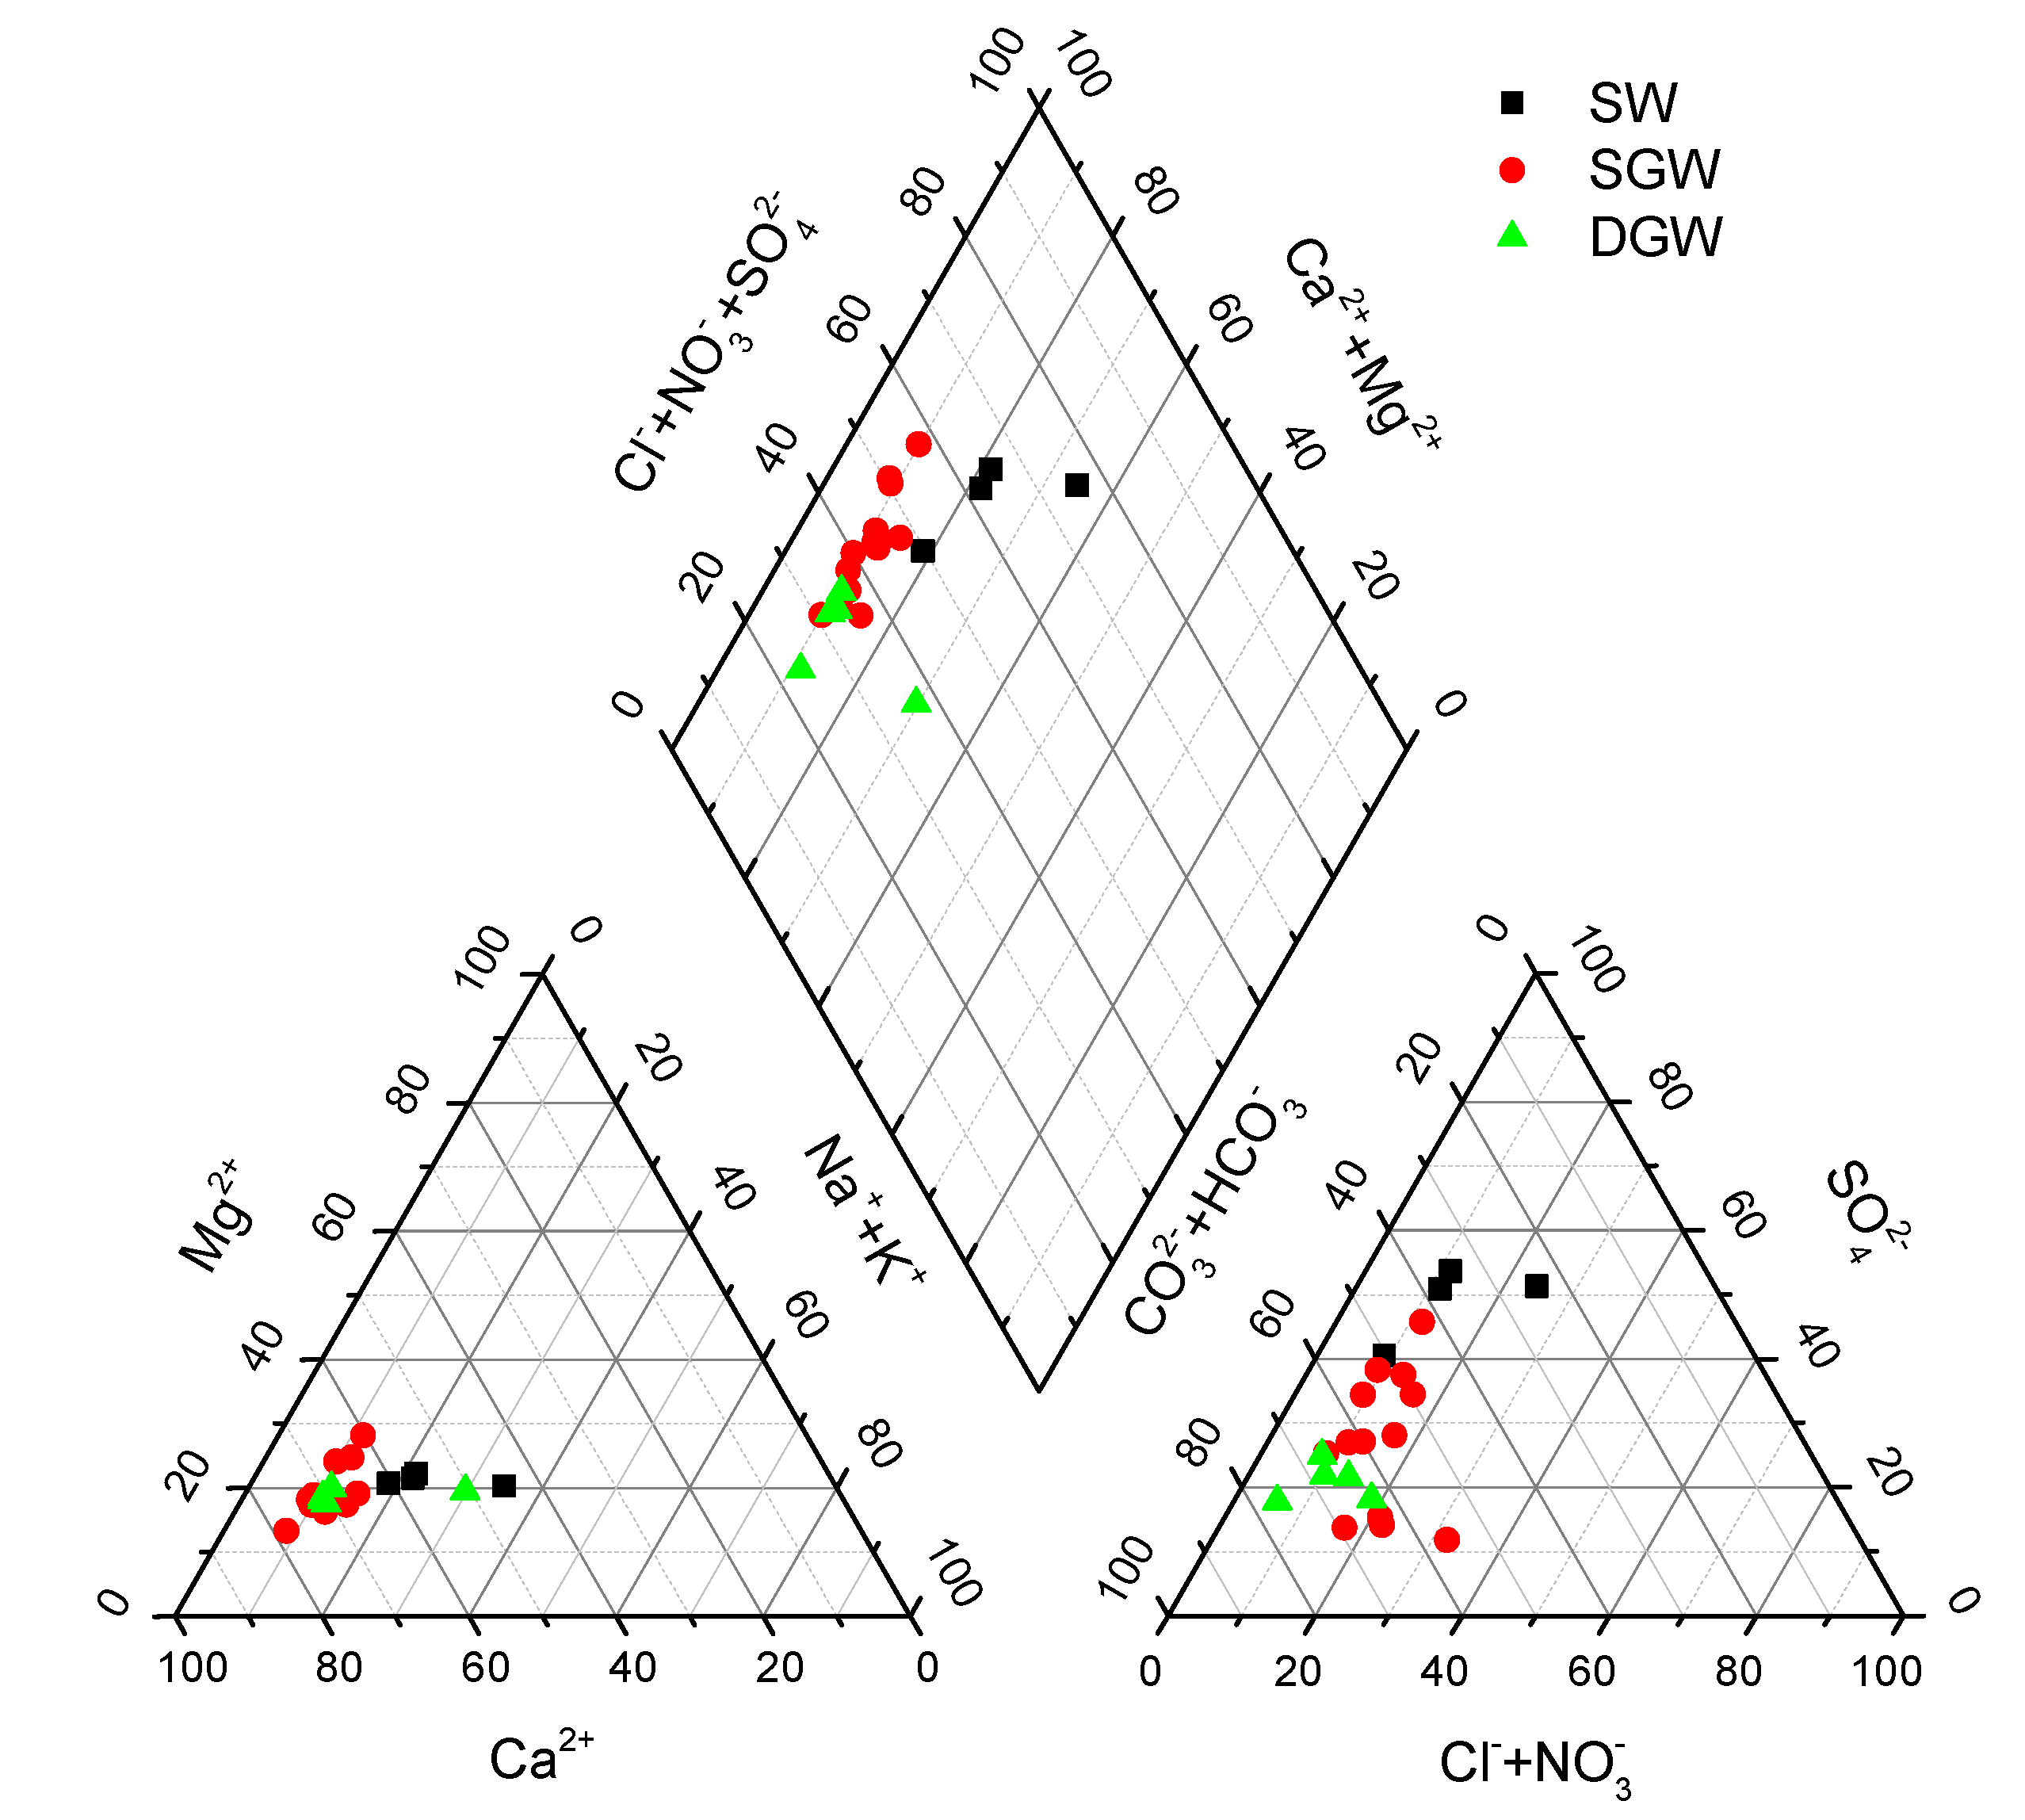
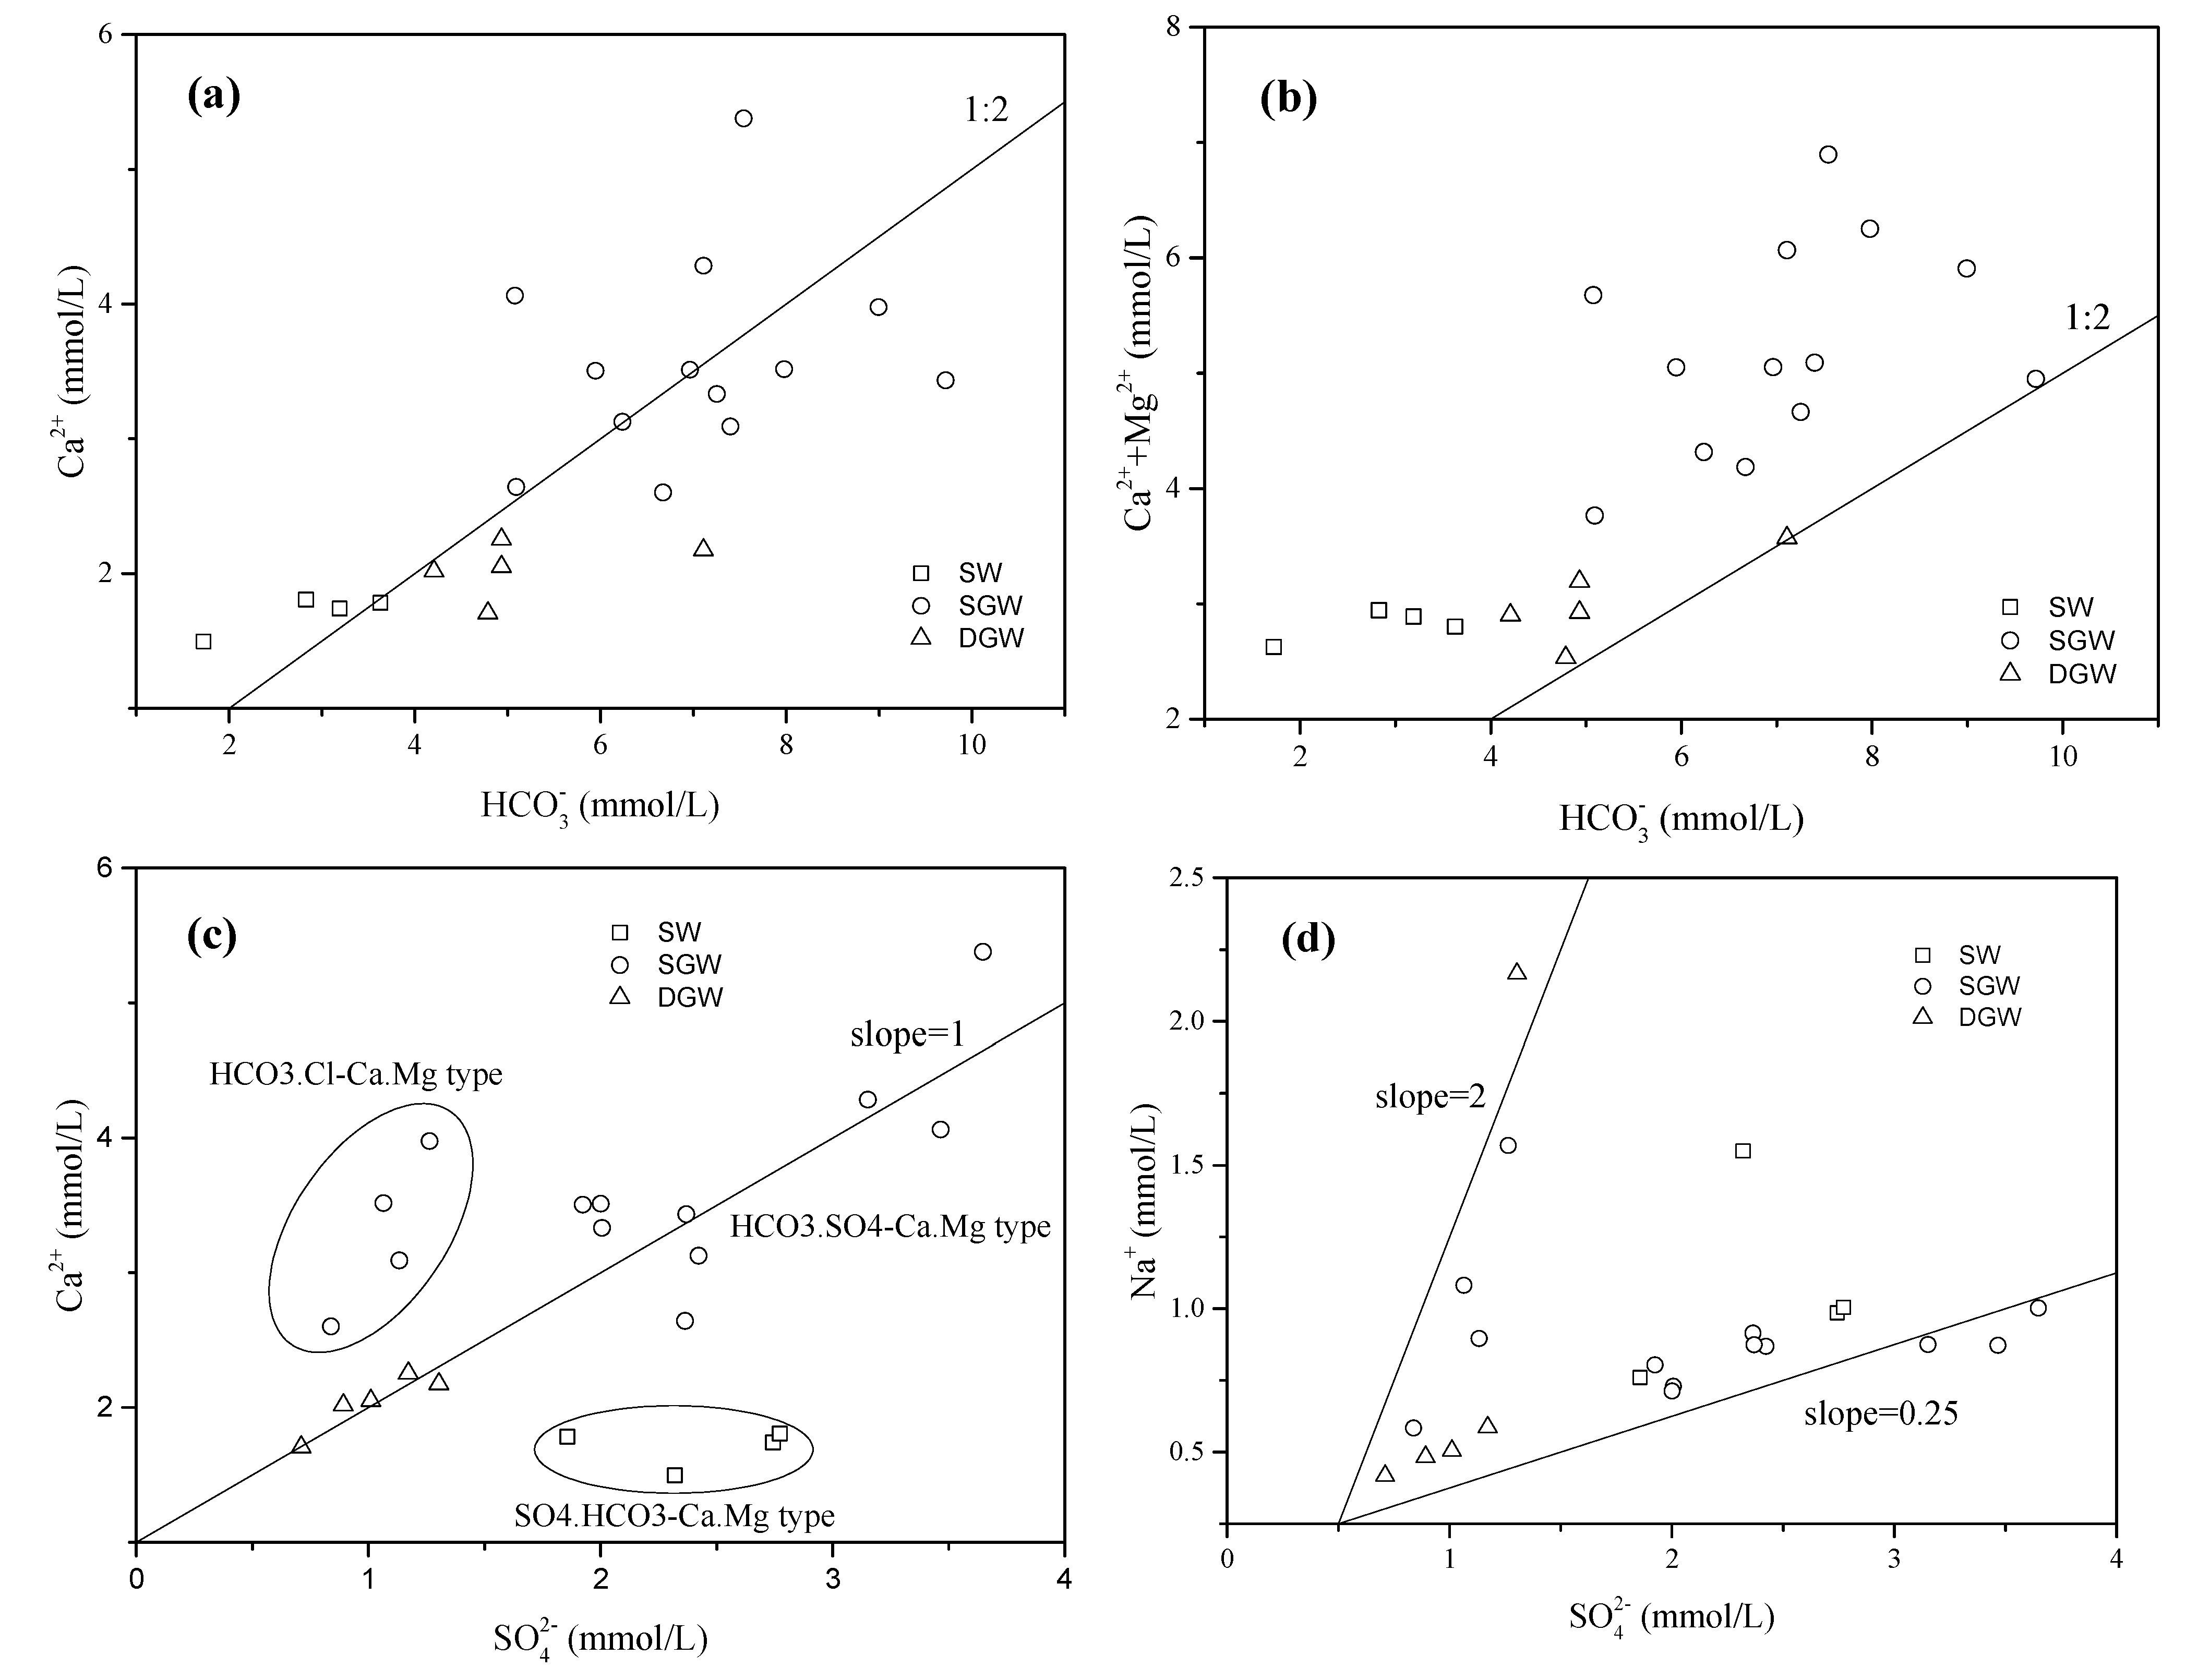
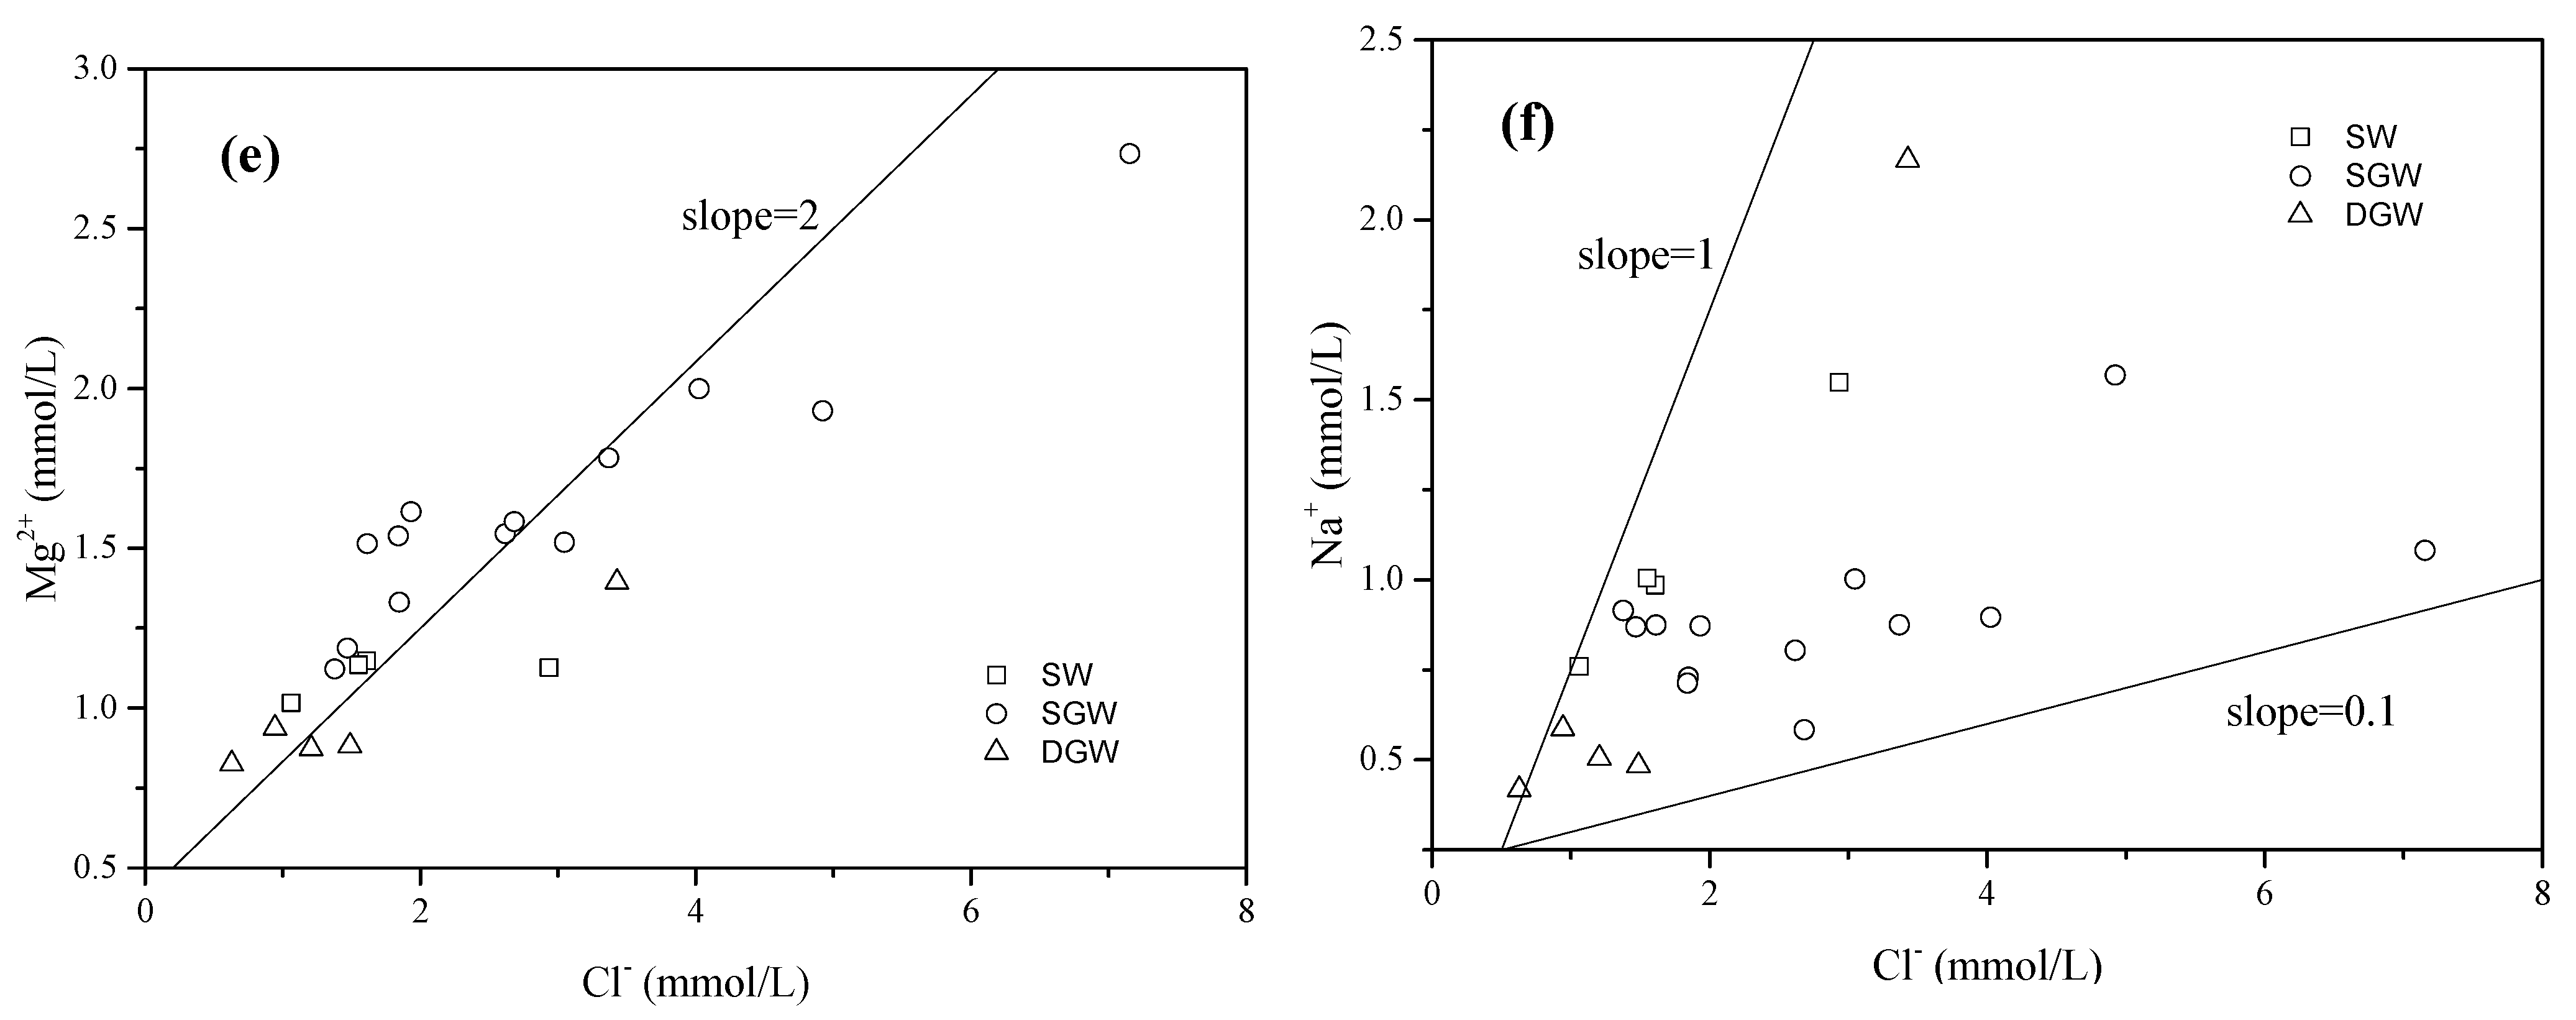
3.1. Chemical Composition

| Sample | Site Description | Depth (m) | T (°C) | pH | EC (μS/cm) | DOC (mg C/L) | DO | K+ | Na+ | Ca2+ | Mg2+ | Cl− | Chemical Type | |||
|---|---|---|---|---|---|---|---|---|---|---|---|---|---|---|---|---|
| (mg/L) | ||||||||||||||||
| Surface Water | ||||||||||||||||
| SW1 | HBZ Reserior | – | 18 | 8.4 | 689 | 4.1 | 4.7 | 4.3 | 22.7 | 69.6 | 27.6 | 57.2 | 263.3 | 2.6 | 194.7 | SO4-HCO3-Ca-Mg |
| SW2 | Hutuo River | – | 19 | 9.2 | 715 | 22.1 | 2.3 | 10.4 | 35.6 | 59.9 | 27.0 | 104.2 | 222.7 | 2.1 | 105.3 | SO4-HCO3-Ca-Mg |
| SW3 | Shijin Canal | – | 22 | 8.5 | 717 | 6.3 | 4.8 | 4.4 | 23.1 | 72.3 | 27.3 | 55.1 | 266.1 | 2.6 | 172.5 | SO4-HCO3-Ca-Mg |
| SW4 | Shijin Canal | – | 26 | 8.1 | 577 | 14.2 | n.d. | 4.6 | 17.5 | 71.4 | 24.4 | 37.6 | 178.2 | 2.3 | 221.2 | HCO3-SO4-Ca-Mg |
| Shallow Groundwater | ||||||||||||||||
| SGW1 | Yancun | 34 | 24 | 7.6 | 906 | 4.2 | 2.6 | 1.6 | 20.0 | 125.1 | 28.5 | 52.2 | 232.6 | 10.7 | 380.5 | HCO3-SO4-Ca-Mg |
| SGW2 | Baichigan | 40 | 20 | 7.4 | 928 | 3.9 | 2.5 | 1.8 | 16.8 | 133.3 | 31.9 | 65.6 | 192.6 | 13.3 | 442.4 | HCO3-SO4-Ca-Mg |
| SGW3 | Dahe | 40 | 19 | 7.2 | 1179 | 4.7 | 2.9 | 1.4 | 20.1 | 171.4 | 42.8 | 119.5 | 302.5 | 21.4 | 433.6 | HCO3-SO4-Ca-Mg |
| SGW4 | Houdubei | 45 | 26 | 7.6 | 808 | 4.6 | n.d. | 1.8 | 21.0 | 105.7 | 26.9 | 48.9 | 227.0 | 6.5 | 310.6 | HCO3-SO4-Ca-Mg |
| SGW5 | Shiqiyu | 60 | 17 | 7.3 | 970 | 20.2 | 2.2 | 1.9 | 20.1 | 162.5 | 38.7 | 68.6 | 332.7 | 16.2 | 309.7 | SO4-HCO3-Ca-Mg |
| SGW6 | Taitou | 15 | 16 | 7.1 | 1199 | 10.2 | 2.2 | 0.5 | 23.0 | 215.1 | 36.5 | 108.2 | 350.2 | 15.6 | 460.1 | HCO3-SO4-Ca-Mg |
| SGW7 | Beigaoying | 60 | 21 | 7.2 | 1005 | 4.8 | 2.0 | 2.2 | 16.4 | 140.5 | 36.9 | 65.3 | 192.1 | 26.2 | 424.7 | HCO3-SO4-Ca-Mg |
| SGW8 | Xiguan | 50 | 23 | 7.4 | 986 | 5.7 | 3.1 | 3.2 | 20.1 | 137.4 | 36.3 | 57.3 | 227.5 | 22.3 | 592.8 | HCO3-SO4-Ca-Mg |
| SGW9 | Taipingcun | 60 | 22 | 7.6 | 920 | 9.6 | 2.5 | 2.9 | 18.5 | 140.2 | 37.1 | 92.9 | 184.7 | 17.3 | 362.8 | HCO3-SO4-Ca-Mg |
| SGW10 | Bafang | 60 | 19 | 7.4 | 795 | 5.3 | 1.8 | 2.3 | 13.4 | 104.1 | 38.0 | 95.2 | 80.5 | 5.7 | 407.0 | HCO3-Cl-Ca-Mg |
| SGW11 | Dongxuying | 60 | 24 | 7.3 | 1007 | 9.9 | 1.1 | 2.2 | 20.6 | 123.7 | 48.0 | 142.9 | 108.8 | 7.7 | 451.2 | HCO3-Cl-Ca-Mg |
| SGW12 | Shaojiazhuang | 40 | 17 | 7.1 | 1189 | 15.8 | 2.8 | 2.0 | 24.9 | 140.7 | 65.6 | 254.0 | 102.2 | 23.2 | 486.6 | HCO3-Cl-Ca-Mg |
| SGW13 | Gaoqianbeijie | 60 | 17 | 7.0 | 1188 | 4.8 | 1.2 | 1.1 | 36.1 | 159.1 | 46.3 | 174.7 | 121.3 | 15.1 | 548.6 | HCO3-Cl-Ca-Mg |
| Deep Groundwater | ||||||||||||||||
| DGW1 | Xizhaotong | 100 | 23 | 7.9 | 589 | 3.9 | 2.5 | 1.5 | 13.5 | 90.2 | 22.5 | 33.5 | 112.5 | 4.8 | 300.8 | HCO3-SO4-Ca-Mg |
| DGW2 | Wujiaying | 100 | 17 | 7.6 | 537 | 4.3 | 1.5 | 1.2 | 11.6 | 82.1 | 21.0 | 42.8 | 97.0 | 3.1 | 300.8 | HCO3-SO4-Ca-Mg |
| DGW3 | Liangcun | 125 | 18 | 7.7 | 507 | 3.1 | 1.8 | 1.3 | 11.1 | 80.8 | 21.2 | 52.8 | 85.6 | 1.8 | 256.6 | HCO3-SO4-Ca-Mg |
| DGW4 | Nandun | 150 | 20 | 7.8 | 464 | 3.3 | 2.0 | 1.7 | 9.6 | 68.3 | 19.8 | 22.3 | 68.2 | 0.5 | 292.0 | HCO3-SO4-Ca-Mg |
| DGW5 | Tatan | 180 | 20 | 7.5 | 994 | 5.5 | 2.6 | 1.2 | 49.8 | 87.0 | 33.5 | 121.7 | 125.1 | 5.9 | 433.6 | HCO3-SO4-Ca-Mg |
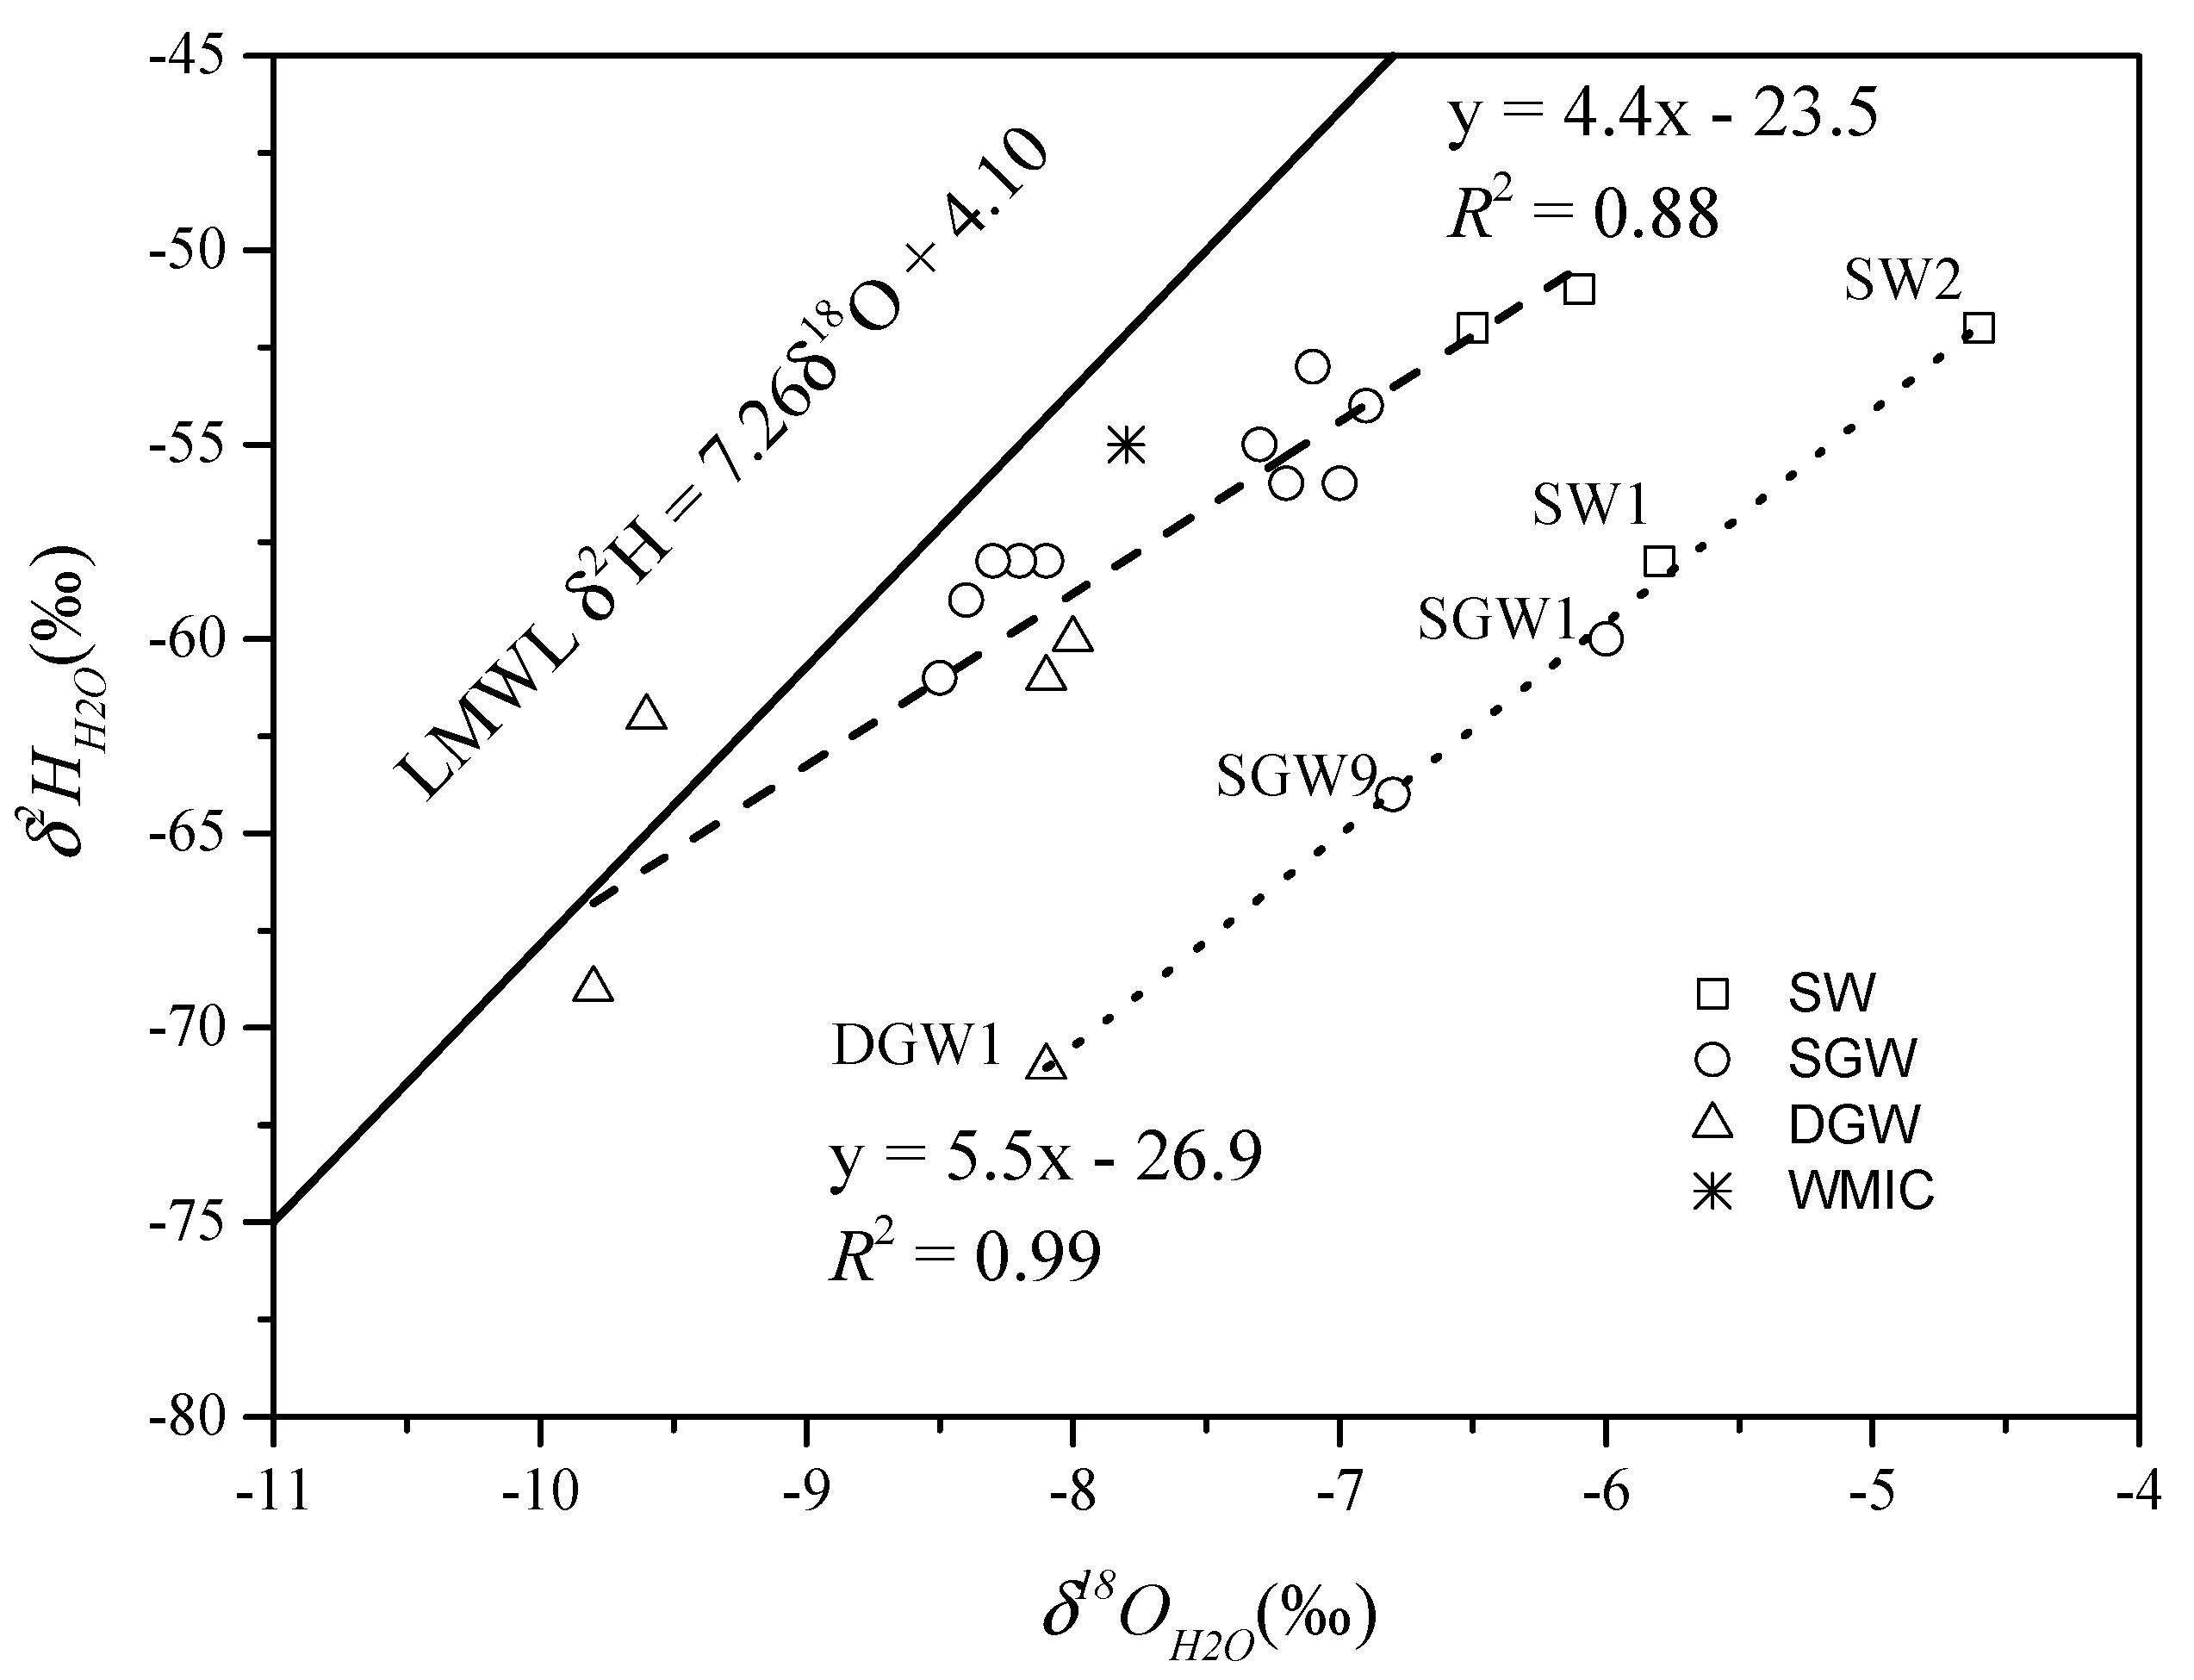
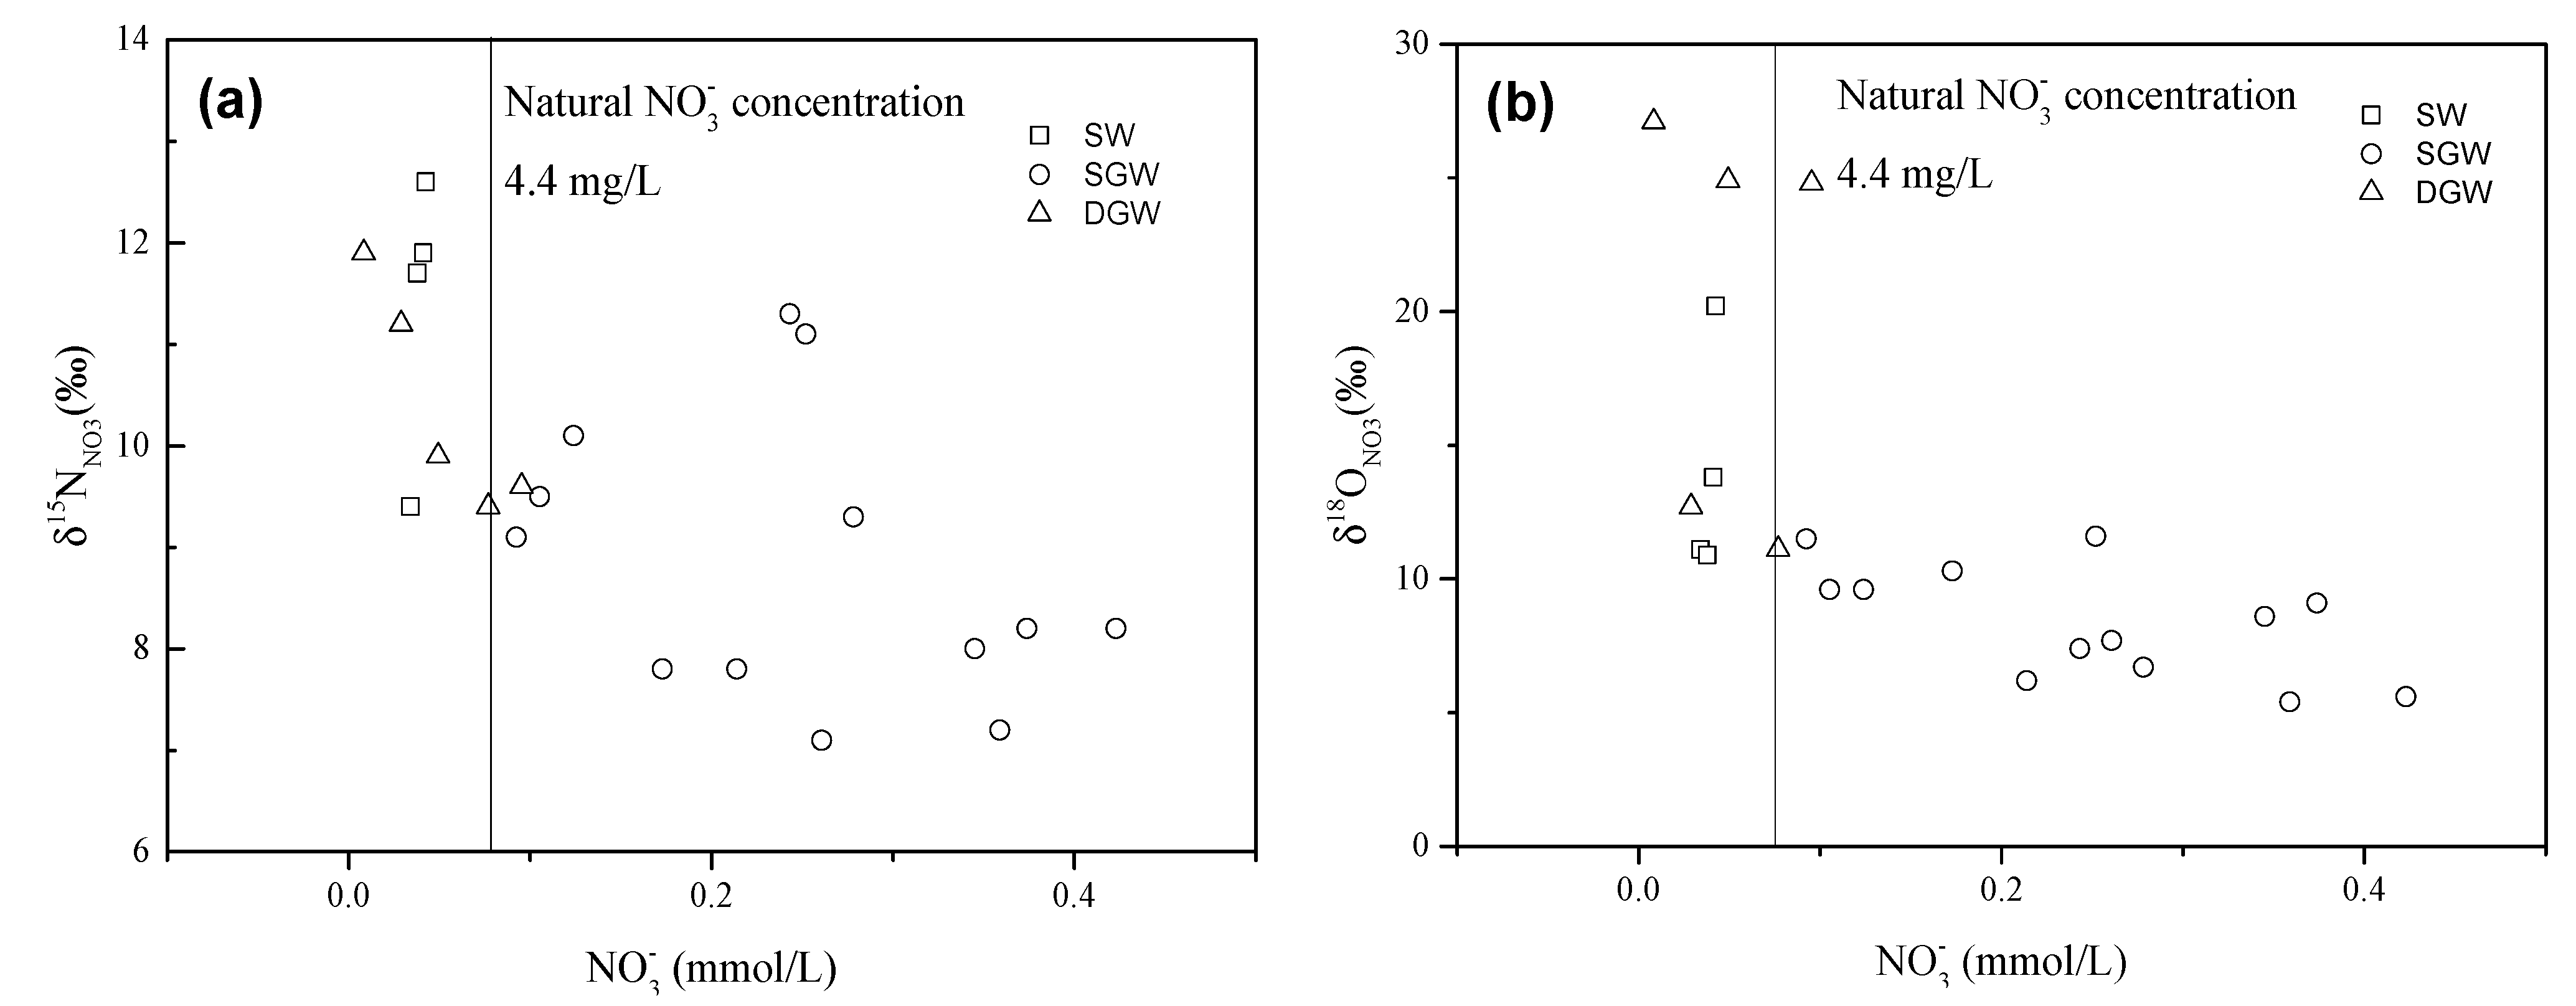
3.2. Isotope Data
| Sample | Site Description | δ15NNO3 (‰) | δ18ONO3 (‰) | δ13CDOC (‰) | δ2HH2O (‰) | δ18OH2O (‰) | d-excess (‰) |
|---|---|---|---|---|---|---|---|
| Surface Water | |||||||
| SW1 | HBZ Reserior | 12.6 | 20.2 | −31.7 | −58 | −5.8 | −11.6 |
| SW2 | Hutuo River | 9.4 | 11.1 | −26.6 | −52 | −4.6 | −15.2 |
| SW3 | Shijin Canal | 11.9 | 13.8 | −31.2 | −52 | −6.5 | 0 |
| SW4 | Shijin Canal | 11.7 | 10.9 | −24.7 | −51 | −6.1 | −2.2 |
| Shallow Groundwater | |||||||
| SGW1 | Yancun | 7.8 | 10.3 | −32.2 | −60 | −6.0 | −12 |
| SGW2 | Baichigan | 7.8 | 6.2 | −32.4 | −56 | −7.0 | 0 |
| SGW3 | Dahe | 8.0 | 8.6 | −32.2 | −53 | −7.1 | 3.8 |
| SGW4 | Houdubei | 9.5 | 9.6 | −30.9 | −54 | −6.9 | 1.2 |
| SGW5 | Shiqiyu | 7.1 | 7.7 | −32.3 | −61 | −8.5 | 7 |
| SGW6 | Taitou | 11.1 | 11.6 | −25.5 | −56 | −7.2 | 1.6 |
| SGW7 | Beigaoying | 8.2 | 5.6 | −28.1 | −56 | −7.0 | 0 |
| SGW8 | Xiguan | 7.2 | 5.4 | −27.3 | −55 | −7.3 | 3.4 |
| SGW9 | Taipingcun | 9.3 | 6.7 | −26.1 | −64 | −6.8 | −9.6 |
| SGW10 | Bafang | 9.1 | 11.5 | −30.6 | −58 | −8.1 | 6.8 |
| SGW11 | Dongxuying | 10.1 | 9.6 | −28.6 | −58 | −8.2 | 7.6 |
| SGW12 | Shaojiazhuang | 8.2 | 9.1 | −31.7 | −58 | −8.3 | 8.4 |
| SGW13 | Gaoqianbeijie | 11.3 | 7.4 | −25.9 | −59 | −8.4 | 8.2 |
| Deep Groundwater | |||||||
| DGW1 | Xizhaotong | 9.4 | 24.8 | −25.8 | −60 | −8.0 | 4 |
| DGW2 | Wujiaying | 9.9 | 24.9 | −27.1 | −62 | −9.6 | 14.8 |
| DGW3 | Liangcun | 11.2 | 12.7 | −25.9 | −61 | −8.1 | 3.8 |
| DGW4 | Nandun | 11.9 | 27.1 | −25.7 | −71 | −8.1 | −6.2 |
| DGW5 | Tatan | 9.6 | 11.1 | −26.1 | −69 | −9.8 | 9.4 |
4. Discussion
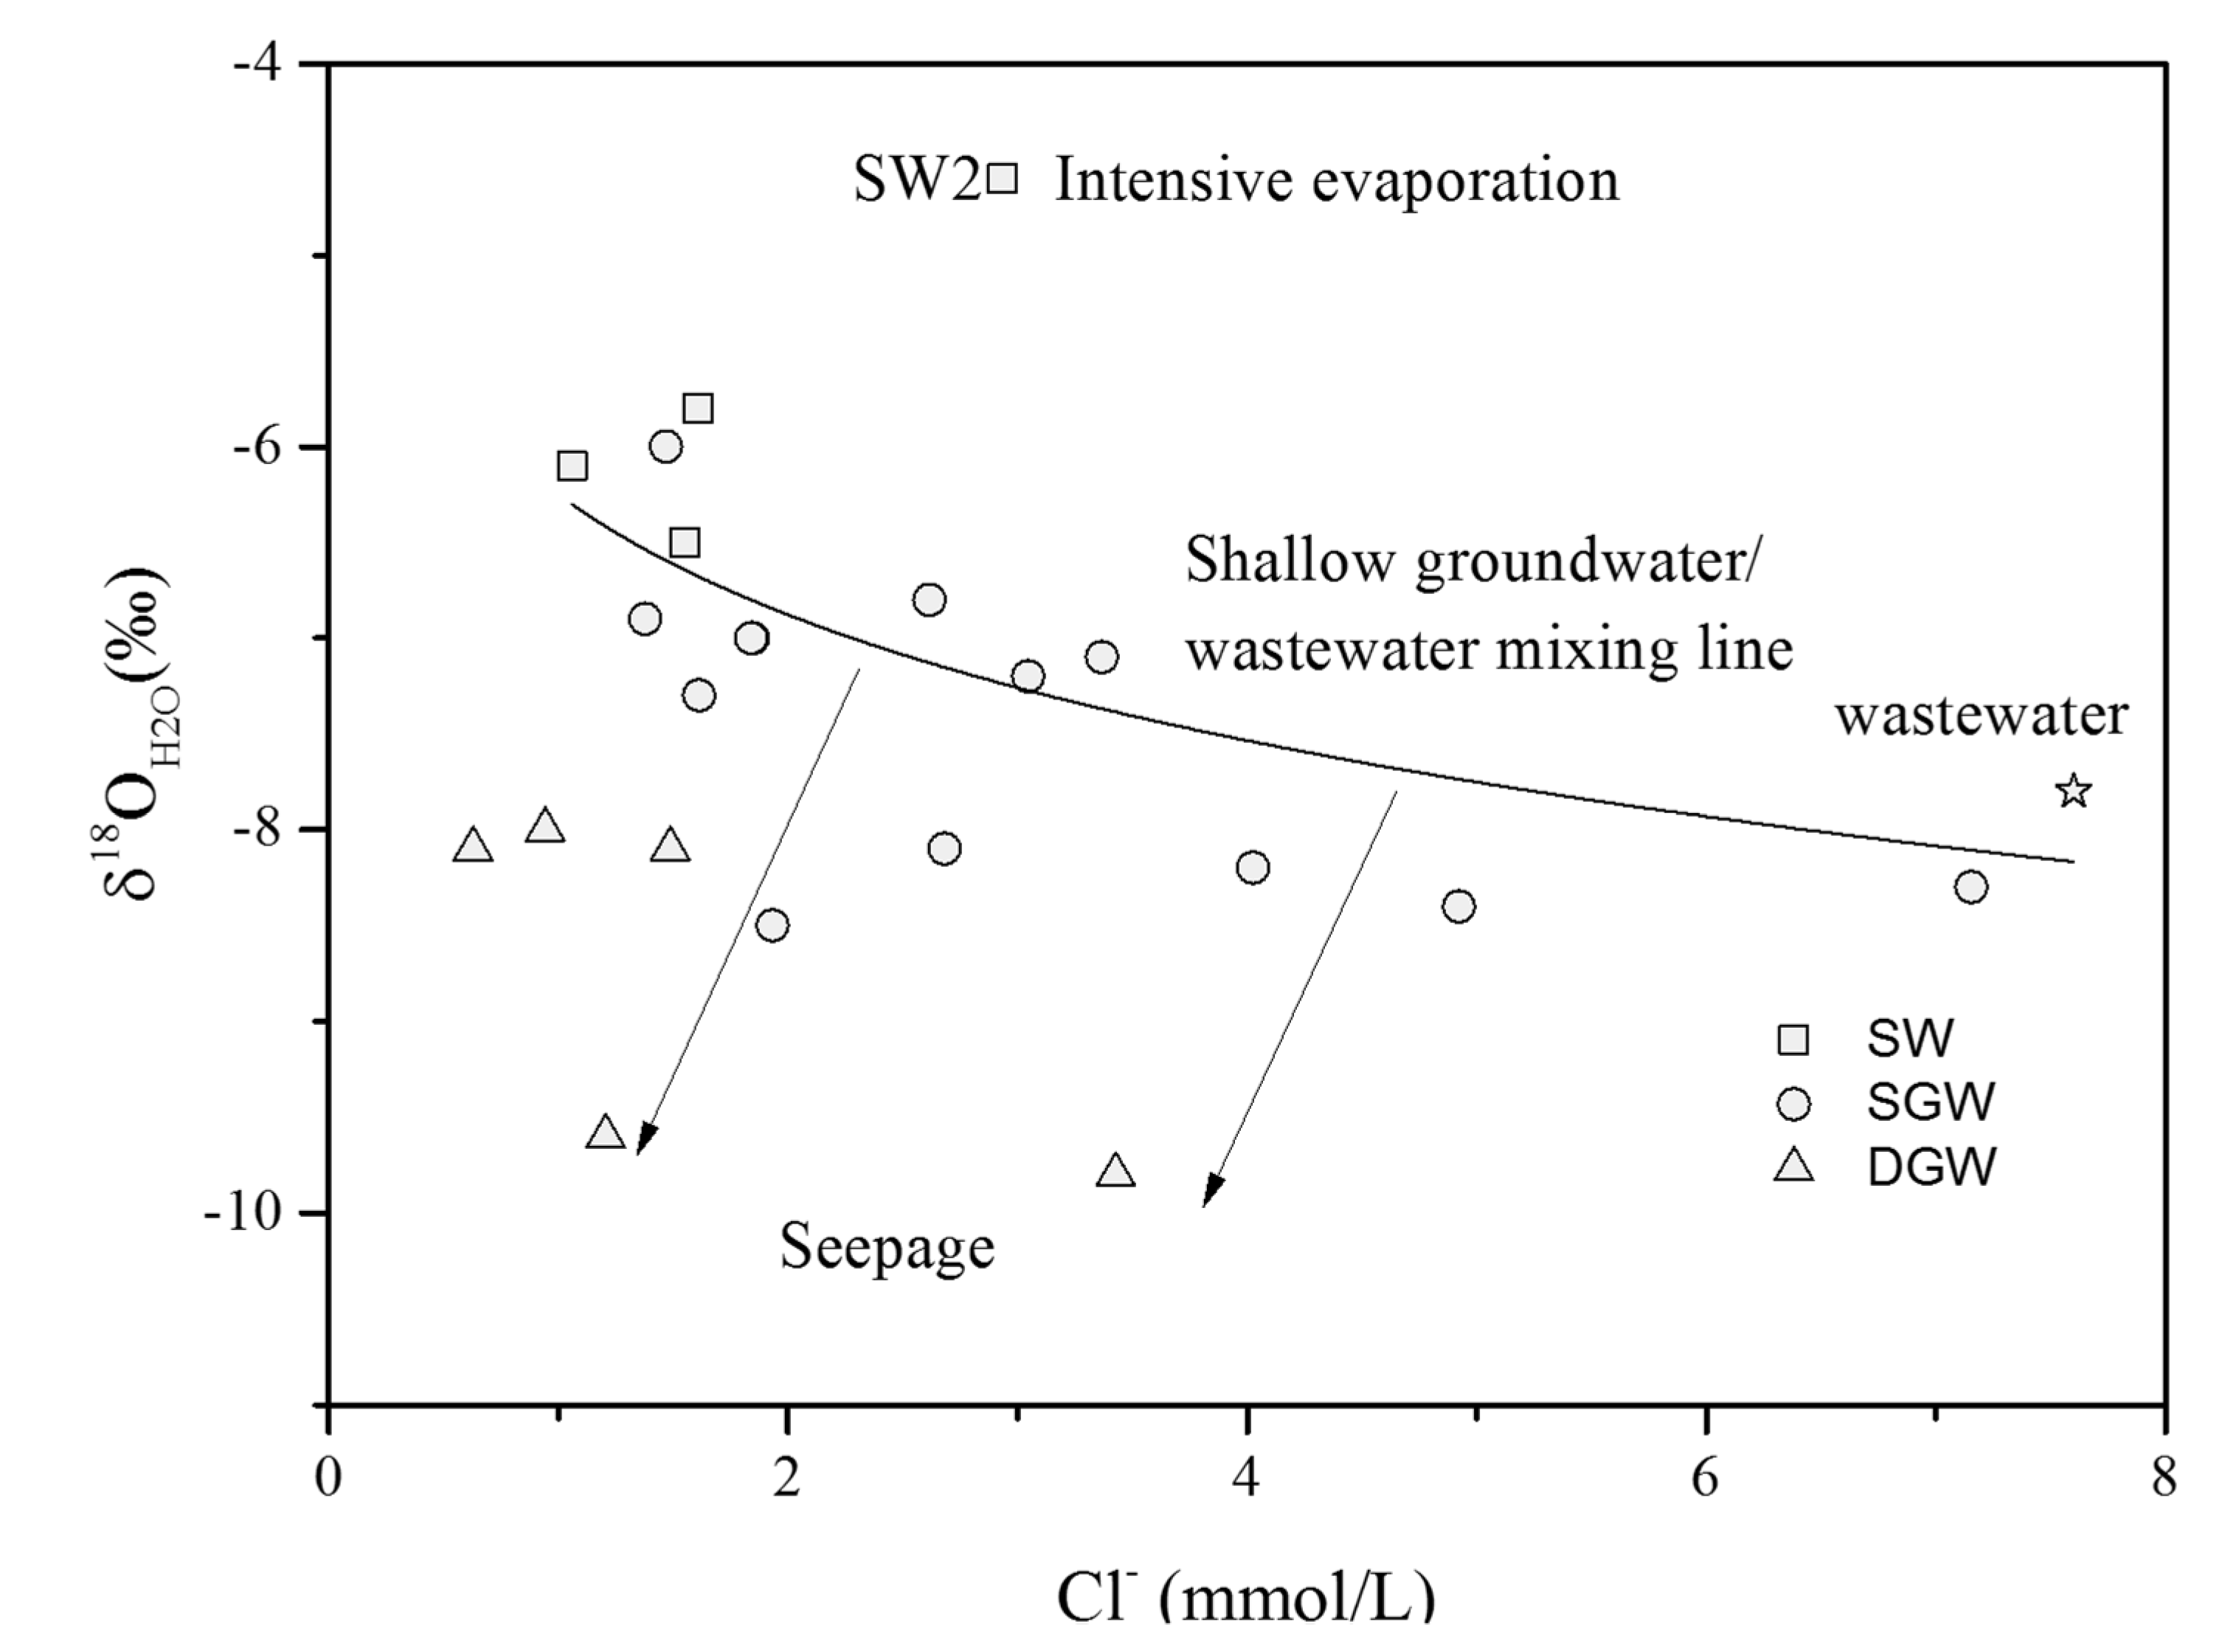
4.1. Hydrochemical Characteristics of Water


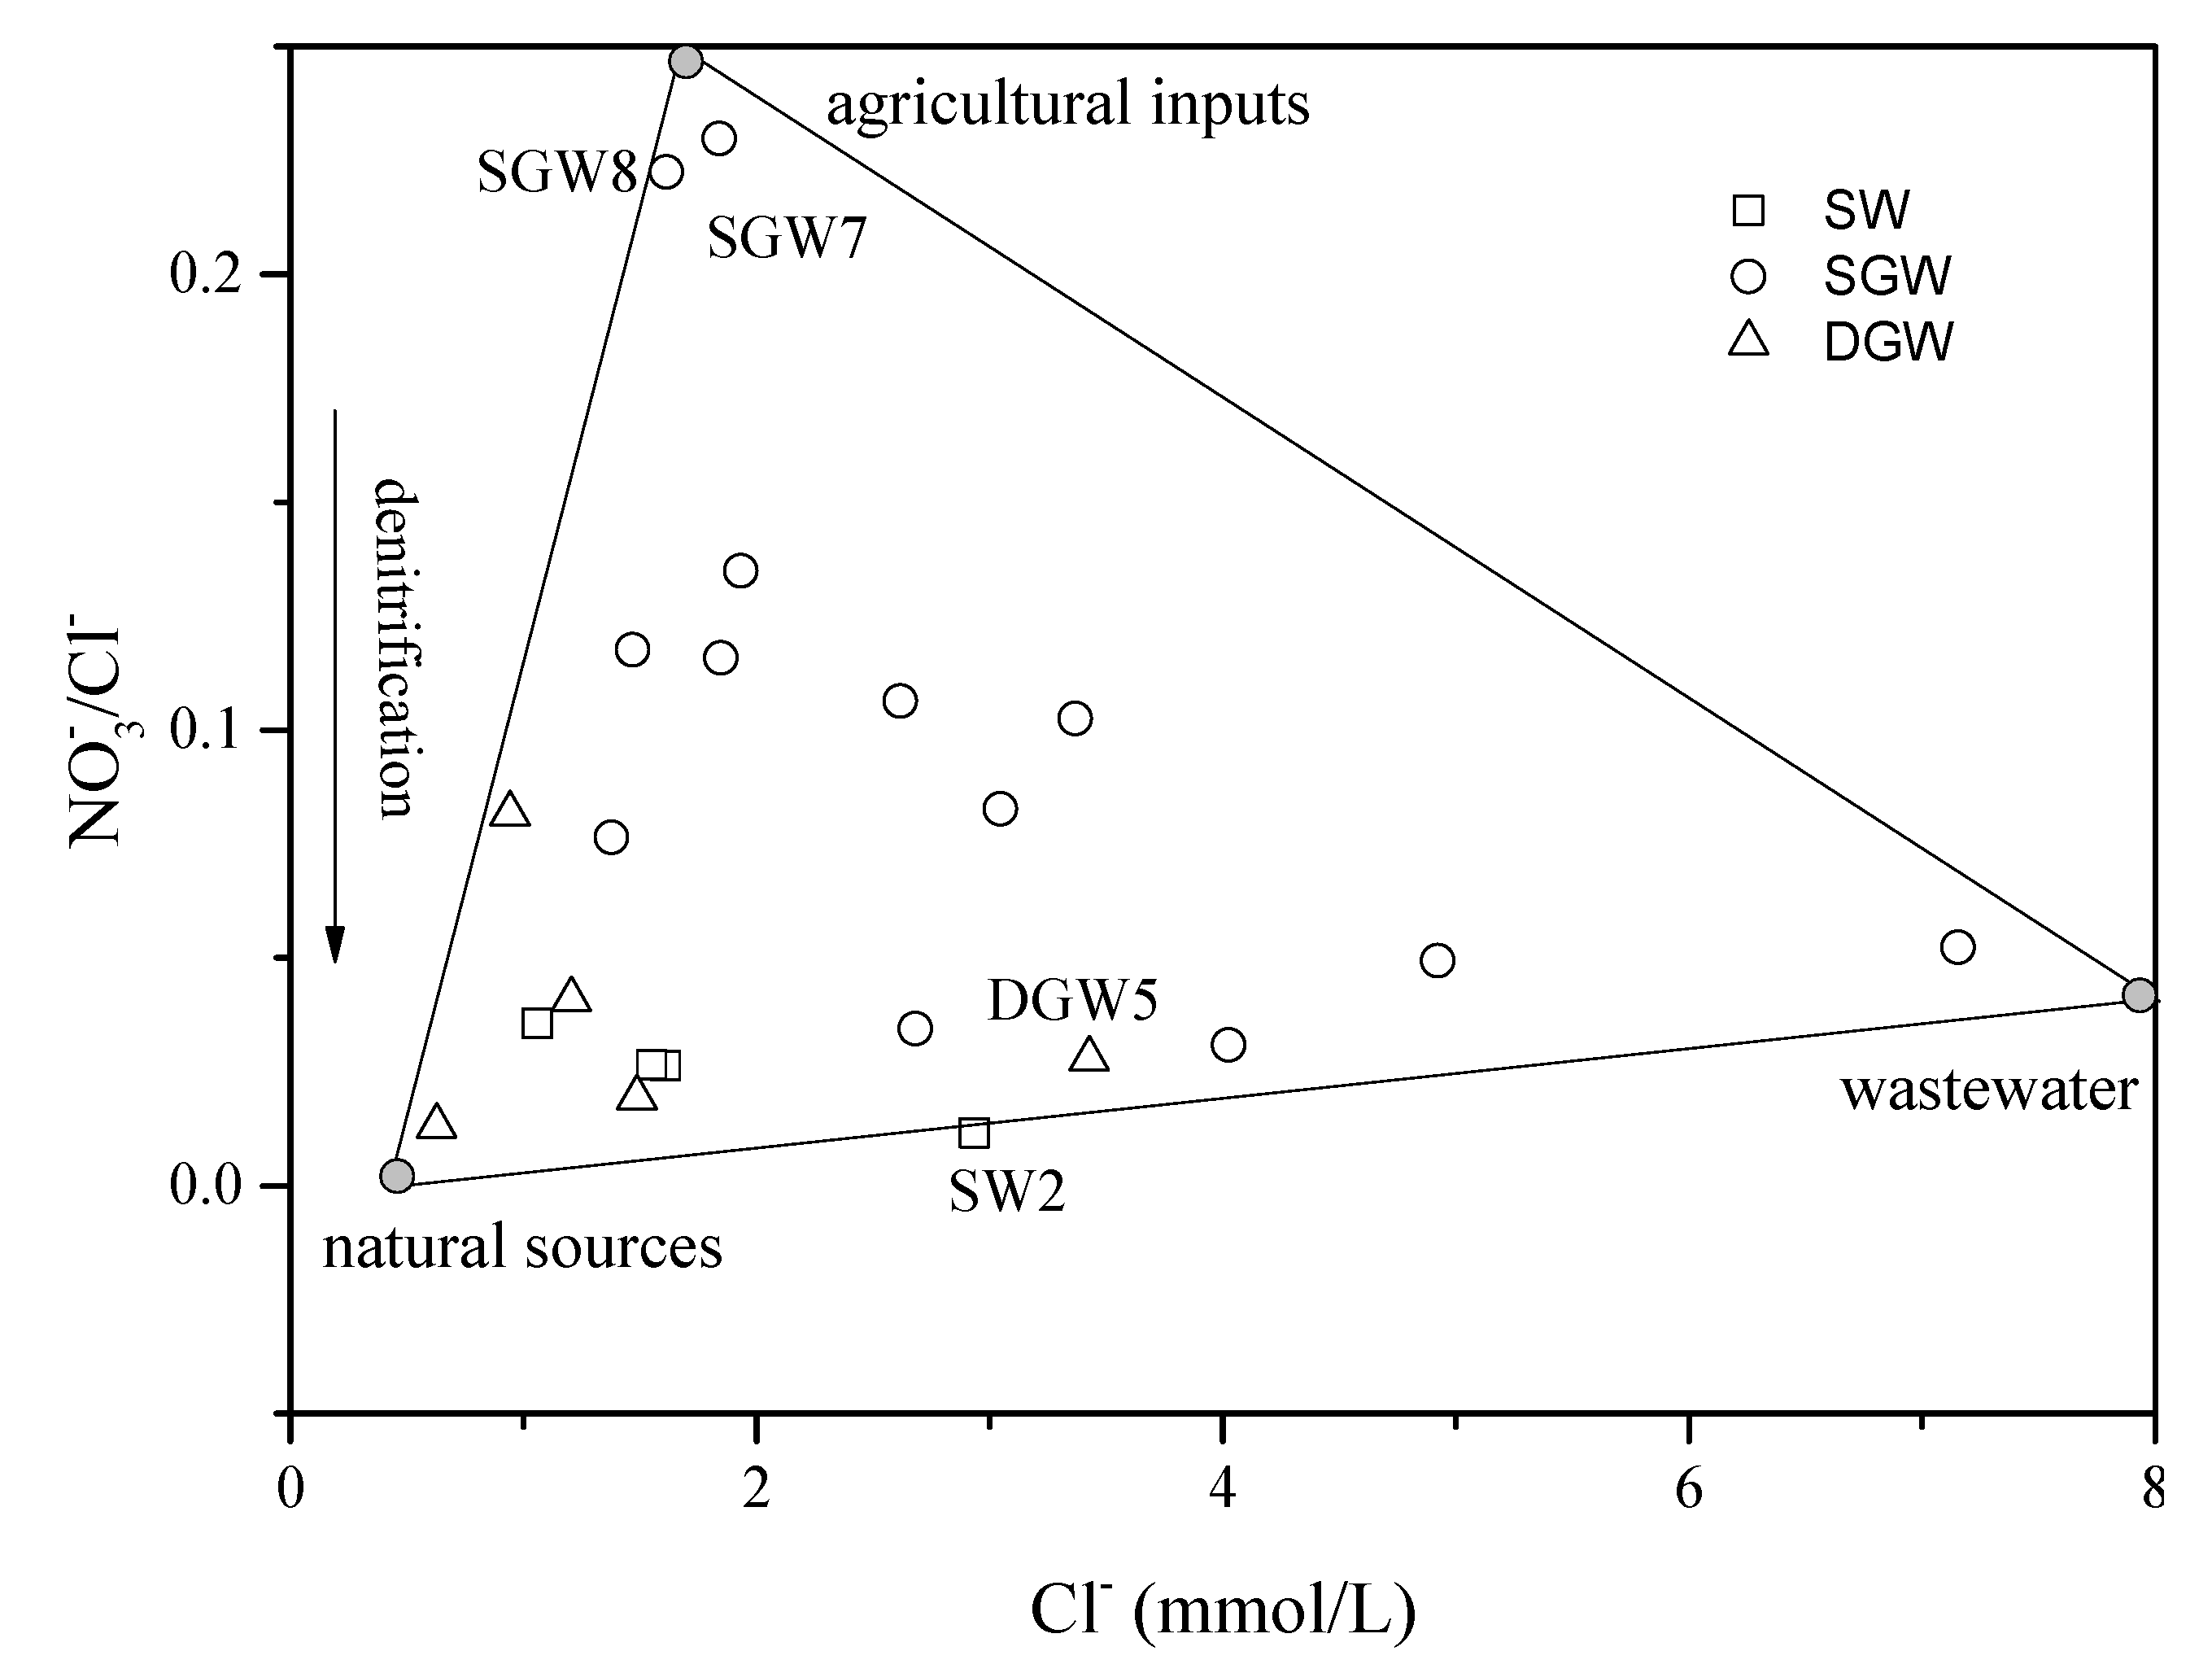
4.2. Source and Behavior of Nitrate
4.2.1. Evidence of Denitrification
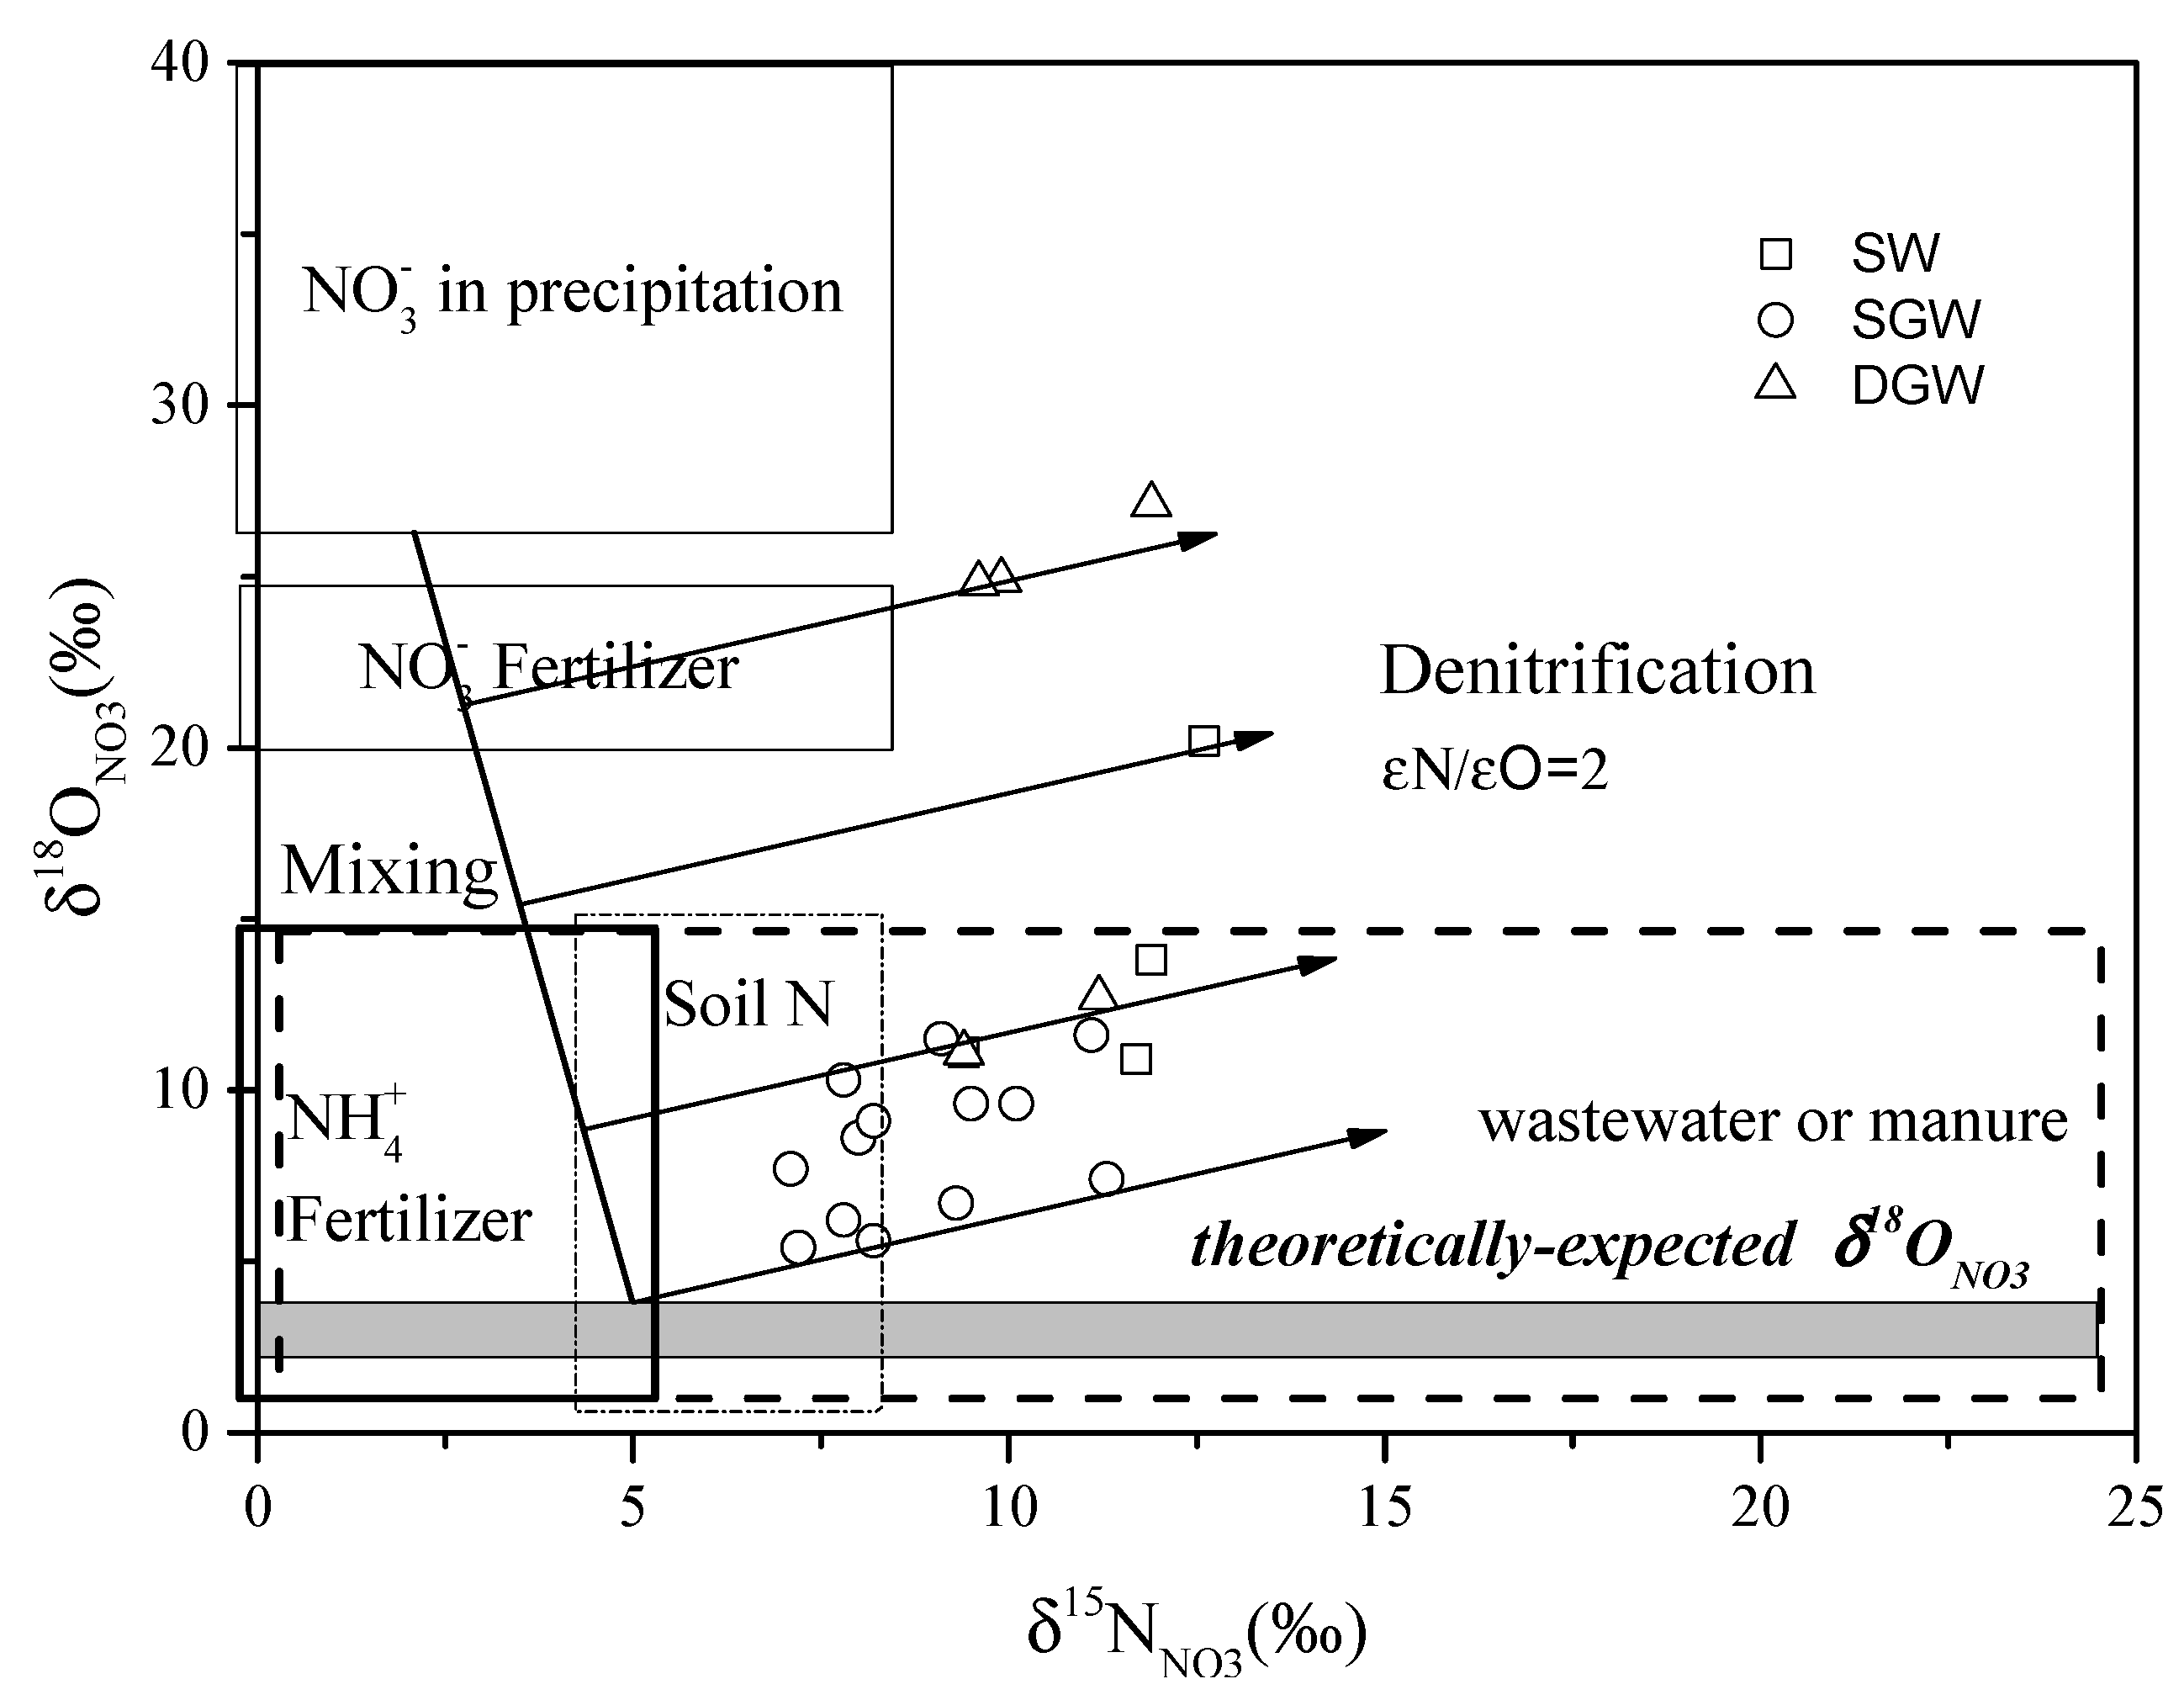


4.2.2. Sources of in Groundwater
5. Conclusions
Acknowledgments
Author Contributions
Conflicts of Interest
References
- Zhang, Z.; Shen, Z.; Xue, Y.; Ren, F.; Shi, D.; Yin, Z.; Zhong, Z.; Sun, X. Evolution of Groundwater Environment in North China Plain; Geological Publishing House: Beijing, China, 2000. [Google Scholar]
- Zhang, Z.; Fei, Y.; Chen, Z.; Zonggu, Z.; Xie, Z.; Wang, Y. Investigation and Evaluation of Groundwater Sustainable Utilization in North China Plain; Geological Publishing House: Beijing, China, 2009. [Google Scholar]
- Kendall, C.; Aravena, R. Nitrate isotopes in groundwater systems. In Environmental Tracers in Subsurface Hydrology; Springer: New York, NY, USA, 2000; pp. 261–297. [Google Scholar]
- Xue, D.; Botte, J.; de Baets, B.; Accoe, F.; Nestler, A.; Taylor, P.; van Cleemput, O.; Berglund, M.; Boeckx, P. Present limitations and future prospects of stable isotope methods for nitrate source identification in surface- and groundwater. Water Res. 2009, 43, 1159–1170. [Google Scholar] [CrossRef] [PubMed]
- Fenech, C.; Rock, L.; Nolan, K.; Tobin, J.; Morrissey, A. The potential for a suite of isotope and chemical markers to differentiate sources of nitrate contamination: A review. Water Res. 2012, 46, 2023–2041. [Google Scholar] [CrossRef] [PubMed]
- Chen, J.Y.; Tang, C.Y.; Yu, J.J. Use of 18O, 2H and 15N to identify nitrate contamination of groundwater in a wastewater irrigated field near the city of Shijiazhuang, China. J. Hydrol. 2006, 326, 367–378. [Google Scholar] [CrossRef]
- Liu, J.; Chen, Z.Y. Using stable isotope to trace the sources of nitrate in groundwater in Shijiazhuang. Chin. J. Environ. Sci. 2009, 30, 1602–1607. [Google Scholar]
- Zhang, C.Y.; Zhang, S.; Ma, L.N.; Yin, M. Nitrogen isotope tracing of sources of nitrate contamination in groundwater from wastewater irrigated area. Earth Sci. 2012, 37, 350–356. [Google Scholar]
- Kendall, C.; MacDonnell, J.J. Isotope Tracers in Catchment Hydrology; Access Online via Elsevier: Amsterdam, Noord-Holland, The Netherlands, 1998. [Google Scholar]
- Rivett, M.O.; Buss, S.R.; Morgan, P.; Smith, J.W.; Bemment, C.D. Nitrate attenuation in groundwater: A review of biogeochemical controlling processes. Water Res. 2008, 42, 4215–4232. [Google Scholar] [CrossRef] [PubMed]
- Choi, W.J.; Lee, S.M.; Ro, H.M. Evaluation of contamination sources of groundwater using nitrogen isotope data: A review. Geosci. J. 2003, 7, 81–87. [Google Scholar] [CrossRef]
- Choi, W.-J.; Han, G.-H.; Lee, S.-M.; Lee, G.-T.; Yoon, K.-S.; Choi, S.-M.; Ro, H.-M. Impact of land-use types on nitrate concentration and δ15N in unconfined groundwater in rural areas of Korea. Agric. Ecosyst. Environ. 2007, 120, 259–268. [Google Scholar] [CrossRef]
- Widory, D.; Kloppmann, W.; Chery, L.; Bonnin, J.; Rochdi, H.; Guinamant, J.L. Nitrate in groundwater: An isotopic multi-tracer approach. J. Contam. Hydrol. 2004, 72, 165–188. [Google Scholar] [CrossRef] [PubMed]
- Mongelli, G.; Paternoster, M.; Sinisi, R. Assessing nitrate origin in a volcanic aquifer using a dual isotope approach. Int. J. Environ. Sci. Technol. 2013, 10, 1149–1156. [Google Scholar] [CrossRef]
- Thurman, E.M. Organic Geochemistry of Natural Waters; Springer: Dordrecht, The Netherlands, 1985; Volume 2. [Google Scholar]
- Hartland, A.; Fenwick, G.D.; Bury, S.J. Tracing sewage-derived organic matter into a shallow groundwater food web using stable isotope and fluorescence signatures. Mar. Freshwater Res. 2011, 62, 119–129. [Google Scholar]
- Starr, R.C.; Gillham, R.W. Denitrification and organic carbon availability in two aquifers. Ground Water 1993, 31, 934–947. [Google Scholar] [CrossRef]
- Nishikawa, T.; District, H.D.W. Evaluation of the Source and Transport of High Nitrate Concentrations in Ground Water, Warren Subbasin, California; US Department of the Interior, US Geological Survey: Sacramento, CA, USA, 2003. [Google Scholar]
- Cannavo, P.; Richaume, A.; Lafolie, F. Fate of nitrogen and carbon in the vadose zone: In situ and laboratory measurements of seasonal variations in aerobic respiratory and denitrifying activities. Soil Biol. Biochem. 2004, 36, 463–478. [Google Scholar] [CrossRef]
- Fukada, T.; Hiscock, K.M.; Dennis, P.F.; Grischek, T. A dual isotope approach to identify denitrification in groundwater at a river-bank infiltration site. Water Res. 2003, 37, 3070–3078. [Google Scholar] [CrossRef] [PubMed]
- Aravena, R.; Robertson, W.D. Use of multiple isotope tracers to evaluate denitrification in ground water: Study of nitrate from a large—Flux septic system plume. Ground Water 1998, 36, 975–982. [Google Scholar] [CrossRef]
- Pabich, W.J.; Valiela, I.; Hemond, H.F. Relationship between DOC concentration and vadose zone thickness and depth below water table in groundwater of Cape Cod, USA. Biogeochemistry 2001, 55, 247–268. [Google Scholar] [CrossRef]
- Desimone, L.A.; Howes, B.L. Nitrogen transport and transformations in a shallow aquifer receiving wastewater discharge: A mass balance approach. Water Resour. Res. 1998, 34, 271–285. [Google Scholar] [CrossRef]
- Rivett, M.O.; Smith, J.W.N.; Buss, S.R.; Morgan, P. Nitrate occurrence and attenuation in the major aquifers of England and Wales. Q. J. Eng. Geol. Hydrogeol. 2007, 40, 335–352. [Google Scholar] [CrossRef]
- Kortelainen, N.M.; Karhu, J.A. Tracing the decomposition of dissolved organic carbon in artificial groundwater recharge using carbon isotope ratios. Appl. Geochem. 2006, 21, 547–562. [Google Scholar] [CrossRef]
- Mohammadzadeh, H.; Clark, I. Bioattenuation in groundwater impacted by landfill leachate traced with δ13C. Ground Water 2011, 49, 880–890. [Google Scholar] [CrossRef] [PubMed]
- Van Breukelen, B.M.; Roling, W.F.M.; Groen, J.; Griffioen, J.; van Verseveld, H.W. Biogeochemistry and isotope geochemistry of a landfill leachate plume. J. Contam. Hydrol. 2003, 65, 245–268. [Google Scholar] [CrossRef] [PubMed]
- Mengis, M.; Schiff, S.L.; Harris, M.; English, M.C.; Aravena, R.; Elgood, R.J.; MacLean, A. Multiple geochemical and isotopic approaches for assessing ground water elimination in a riparian zone. Ground Water 1999, 37, 448–457. [Google Scholar] [CrossRef]
- Widory, D.; Petelet-Giraud, E.; Negrel, P.; Ladouche, B. Tracking the sources of nitrate in groundwater using coupled nitrogen and boron isotopes: A synthesis. Environ. Sci. Technol. 2005, 39, 539–548. [Google Scholar] [CrossRef] [PubMed]
- Liu, C.Q.; Li, S.L.; Lang, Y.C.; Xiao, H.Y. Using δ15N and δ18O values to identify nitrate sources in Karst ground water, Guiyang, southwest China. Environ. Sci. Technol. 2006, 40, 6928–6933. [Google Scholar] [CrossRef] [PubMed]
- Chen, W.H. Groundwater in Hebei; Seismological Press: Beijing, China, 1999. [Google Scholar]
- Lu, Y.T.; Tang, C.Y.; Chen, J.Y.; Song, X.F.; Li, F.D.; Sakura, Y. Spatial characteristics of water quality, stable isotopes and tritium associated with groundwater flow in the hutuo river alluvial fan plain of the north China plain. Hydrogeol. J. 2008, 16, 1003–1015. [Google Scholar] [CrossRef]
- Wu, C.; Xu, Q.H.; Ma, Y.H.; Zhang, X.Q. Palaeochannels on the north China plain: Palaeoriver geomorphology. Geomorphology 1996, 18, 37–45. [Google Scholar] [CrossRef]
- Chen, Z.Y.; Nie, Z.L.; Zhang, Z.J.; Qi, J.X.; Nan, Y.J. Isotopes and sustainability of ground water resources, north China plain. Ground Water 2005, 43, 485–493. [Google Scholar] [CrossRef] [PubMed]
- Yang, Y.; Watanabe, M.; Sakura, Y.; Changyuan, T.; Hayashi, S. Groundwater-table and recharge changes in the piedmont region of Taihang mountain in gaocheng city and its relation to agricultural water use. WaterSA 2004, 28, 171–178. [Google Scholar]
- Li, W. Research of Environment Evolution of Groundwater in Shijiazhuang. Master’s Thesis, Shijiazhuang University of Economics, Shijiazhuang, China, June 2009. [Google Scholar]
- Liu, C.M.; Yu, J.J.; Kendy, E. Groundwater exploitation and its impact on the environment in the north China plain. Water Int. 2001, 26, 265–272. [Google Scholar] [CrossRef]
- Chen, J.Y.; Tang, C.Y.; Shen, Y.J.; Sakura, Y.; Kondoh, A.; Shimada, J. Use of water balance calculation and tritium to examine the dropdown of groundwater table in the piedmont of the north China plain (NCP). Environ. Geol. 2003, 44, 564–571. [Google Scholar] [CrossRef]
- Liu, J.; Zheng, C.; Zheng, L.; Lei, Y. Ground water sustainability: Methodology and application to the north China plain. Ground Water 2008, 46, 897–909. [Google Scholar] [PubMed]
- Liu, Y.D.; Gan, Y.Q.; Yu, T.T.; Liu, C.F.; Zhou, A.G. Online simultaneous determination of δD and δ18O in microliter water samples by thermal conversion/elemental analysis isotope ratio mass spectrometry. China Rock Min. Anal. 2010, 29, 643–647. [Google Scholar]
- Silva, S.; Kendall, C.; Wilkison, D.; Ziegler, A.; Chang, C.; Avanzino, R. A new method for collection of nitrate from fresh water and the analysis of nitrogen and oxygen isotope ratios. J. Hydrol. 2000, 228, 22–36. [Google Scholar] [CrossRef]
- Gandhi, H.; Wiegner, T.N.; Ostrom, P.H.; Kaplan, L.A.; Ostrom, N.E. Isotopic (13C) analysis of dissolved organic carbon in stream water using an elemental analyzer coupled to a stable isotope ratio mass spectrometer. Rapid Commun. Mass Spectrom. 2004, 18, 903–906. [Google Scholar] [CrossRef] [PubMed]
- Appelo, C.A.J.; Postma, D. Geochemistry, Groundwater and Pollution; CRC Press: Leiden, The Netherlands, 2005. [Google Scholar]
- Dejwakh, N.R.; Meixner, T.; Michalski, G.; McIntosh, J. Using 17O to investigate nitrate sources and sinks in a semi-arid groundwater system. Environ. Sci. Technol. 2012, 46, 745–751. [Google Scholar] [CrossRef] [PubMed]
- Jia, G.; Yu, X.; Fan, D.; Zheng, J. Study on hydrogen and oxygen stable isotopes in precipitation in both sides along Taihang mountain. Yellow River 2011, 7, 34–36. [Google Scholar]
- Böttcher, J.K.; Strebel, O.; Voerkelius, S.; Schmidt, H.L. Using isotope fractionation of nitrate-nitrogen and nitrate-oxygen for evaluation of microbial denitrification in a sandy aquifer. J. Hydrol. 1990, 114, 413–424. [Google Scholar] [CrossRef]
- Wassenaar, L.I. Evaluation of the origin and fate of nitrate in the abbotsford aquifer using the isotopes of 15N and 18O in . Appl. Geochem. 1995, 10, 391–405. [Google Scholar] [CrossRef]
- Heaton, T. Isotopic studies of nitrogen pollution in the hydrosphere and atmosphere: A review. Chem. Geol. 1986, 59, 87–102. [Google Scholar] [CrossRef]
- Vitoria, L.; Soler, A.; Canals, A.; Otero, N. Environmental isotopes (N, S, C, O, D) to determine natural attenuation processes in nitrate contaminated waters: Example of Osona (NE Spain). Appl. Geochem. 2008, 23, 3597–3611. [Google Scholar] [CrossRef]
- Otero, N.; Torrento, C.; Soler, A.; Mencio, A.; Mas-Pla, J. Monitoring groundwater nitrate attenuation in a regional system coupling hydrogeology with multi-isotopic methods: The case of Plana de Vic (Osona, Spain). Agric. Ecosyst. Environ. 2009, 133, 103–113. [Google Scholar] [CrossRef]
- Senbayram, M.; Dixon, L.; Goulding, K.W.; Bol, R. Long—Term influence of manure and mineral nitrogen applications on plant and soil 15N and 13C values from the Broadbalk Wheat Experiment. Rapid. Commun. Mass Spectrom. 2008, 22, 1735–1740. [Google Scholar] [CrossRef] [PubMed]
- Beller, H.R.; Madrid, V.; Hudson, G.B.; McNab, W.W.; Carlsen, T. Biogeochemistry and natural attenuation of nitrate in groundwater at an explosives test facility. Appl. Geochem. 2004, 19, 1483–1494. [Google Scholar] [CrossRef]
- Johannsen, A.; Dähnke, K.; Emeis, K. Isotopic composition of nitrate in five German rivers discharging into the North Sea. Org. Geochem. 2008, 39, 1678–1689. [Google Scholar] [CrossRef]
- Battaglin, W.A.; Kendall, C.; Chang, C.C.; Silva, S.R.; Campbell, D. Chemical and isotopic evidence of nitrogen transformation in the mississippi river, 1997–98. Hydrol. Process 2001, 15, 1285–1300. [Google Scholar] [CrossRef]
- Albertin, A.R.; Sickman, J.O.; Pinowska, A.; Stevenson, R.J. Identification of nitrogen sources and transformations within Karst springs using isotope tracers of nitrogen. Biogeochemistry 2012, 108, 219–232. [Google Scholar] [CrossRef]
- Baker, M.A.; Vervier, P. Hydrological variability, organic matter supply and denitrification in the Garonne river ecosystem. Freshw. Biol. 2004, 49, 181–190. [Google Scholar] [CrossRef]
- Kendall, C.; Campbell, D.H.; Burns, D.A.; Shanley, J.B.; Silva, S.R.; Chang, C.C. Tracing sources of nitrate in snowmelt runoff using the oxygen and nitrogen isotopic compositions of nitrate. In International Symposium on Biogeochemistry of Seasonally Snow-Covered Catchments, Boulder, CO, USA, 1–14 July 1995; Tonnessen, K.A., Williams, M.W., Tranter, M., Eds.; International Association of Hydrological Sciences: Wallingford, UK; Volume 228, pp. 339–347.
- Andersson, K.K.; Hooper, A.B. O2 and H2O are each the source of one o in produced from NH3 by Nireosomonas 15N-NMR evidence. FEBS Lett. 1983, 164, 236–240. [Google Scholar] [CrossRef]
- Snider, D.M.; Spoelstra, J.; Schiff, S.L.; Venkiteswaran, J.J. Stable oxygen isotope ratios of nitrate produced from nitrification: 18O-Labeled water incubations of agricultural and temperate forest soils. Environ. Sci. Technol. 2010, 44, 5358–5364. [Google Scholar] [CrossRef] [PubMed]
- Li, Z.H.; Wang, D.S. Impact of human activities on nitrate concentration in the shallow groundwater. Site Invest. Sci. Technol. 1999, 1, 37–41. [Google Scholar]
© 2015 by the authors; licensee MDPI, Basel, Switzerland. This article is an open access article distributed under the terms and conditions of the Creative Commons Attribution license (http://creativecommons.org/licenses/by/4.0/).
Share and Cite
Zhang, Y.; Zhou, A.; Zhou, J.; Liu, C.; Cai, H.; Liu, Y.; Xu, W. Evaluating the Sources and Fate of Nitrate in the Alluvial Aquifers in the Shijiazhuang Rural and Suburban Area, China: Hydrochemical and Multi-Isotopic Approaches. Water 2015, 7, 1515-1537. https://doi.org/10.3390/w7041515
Zhang Y, Zhou A, Zhou J, Liu C, Cai H, Liu Y, Xu W. Evaluating the Sources and Fate of Nitrate in the Alluvial Aquifers in the Shijiazhuang Rural and Suburban Area, China: Hydrochemical and Multi-Isotopic Approaches. Water. 2015; 7(4):1515-1537. https://doi.org/10.3390/w7041515
Chicago/Turabian StyleZhang, Yanpeng, Aiguo Zhou, Jianwei Zhou, Cunfu Liu, Hesheng Cai, Yunde Liu, and Wen Xu. 2015. "Evaluating the Sources and Fate of Nitrate in the Alluvial Aquifers in the Shijiazhuang Rural and Suburban Area, China: Hydrochemical and Multi-Isotopic Approaches" Water 7, no. 4: 1515-1537. https://doi.org/10.3390/w7041515