
Rainwater Harvesting for Small-Holder Horticulture in Namibia: Design of Garden Variants and Assessment of Climate Change Impacts and Adaptation


Abstract
:1. Introduction
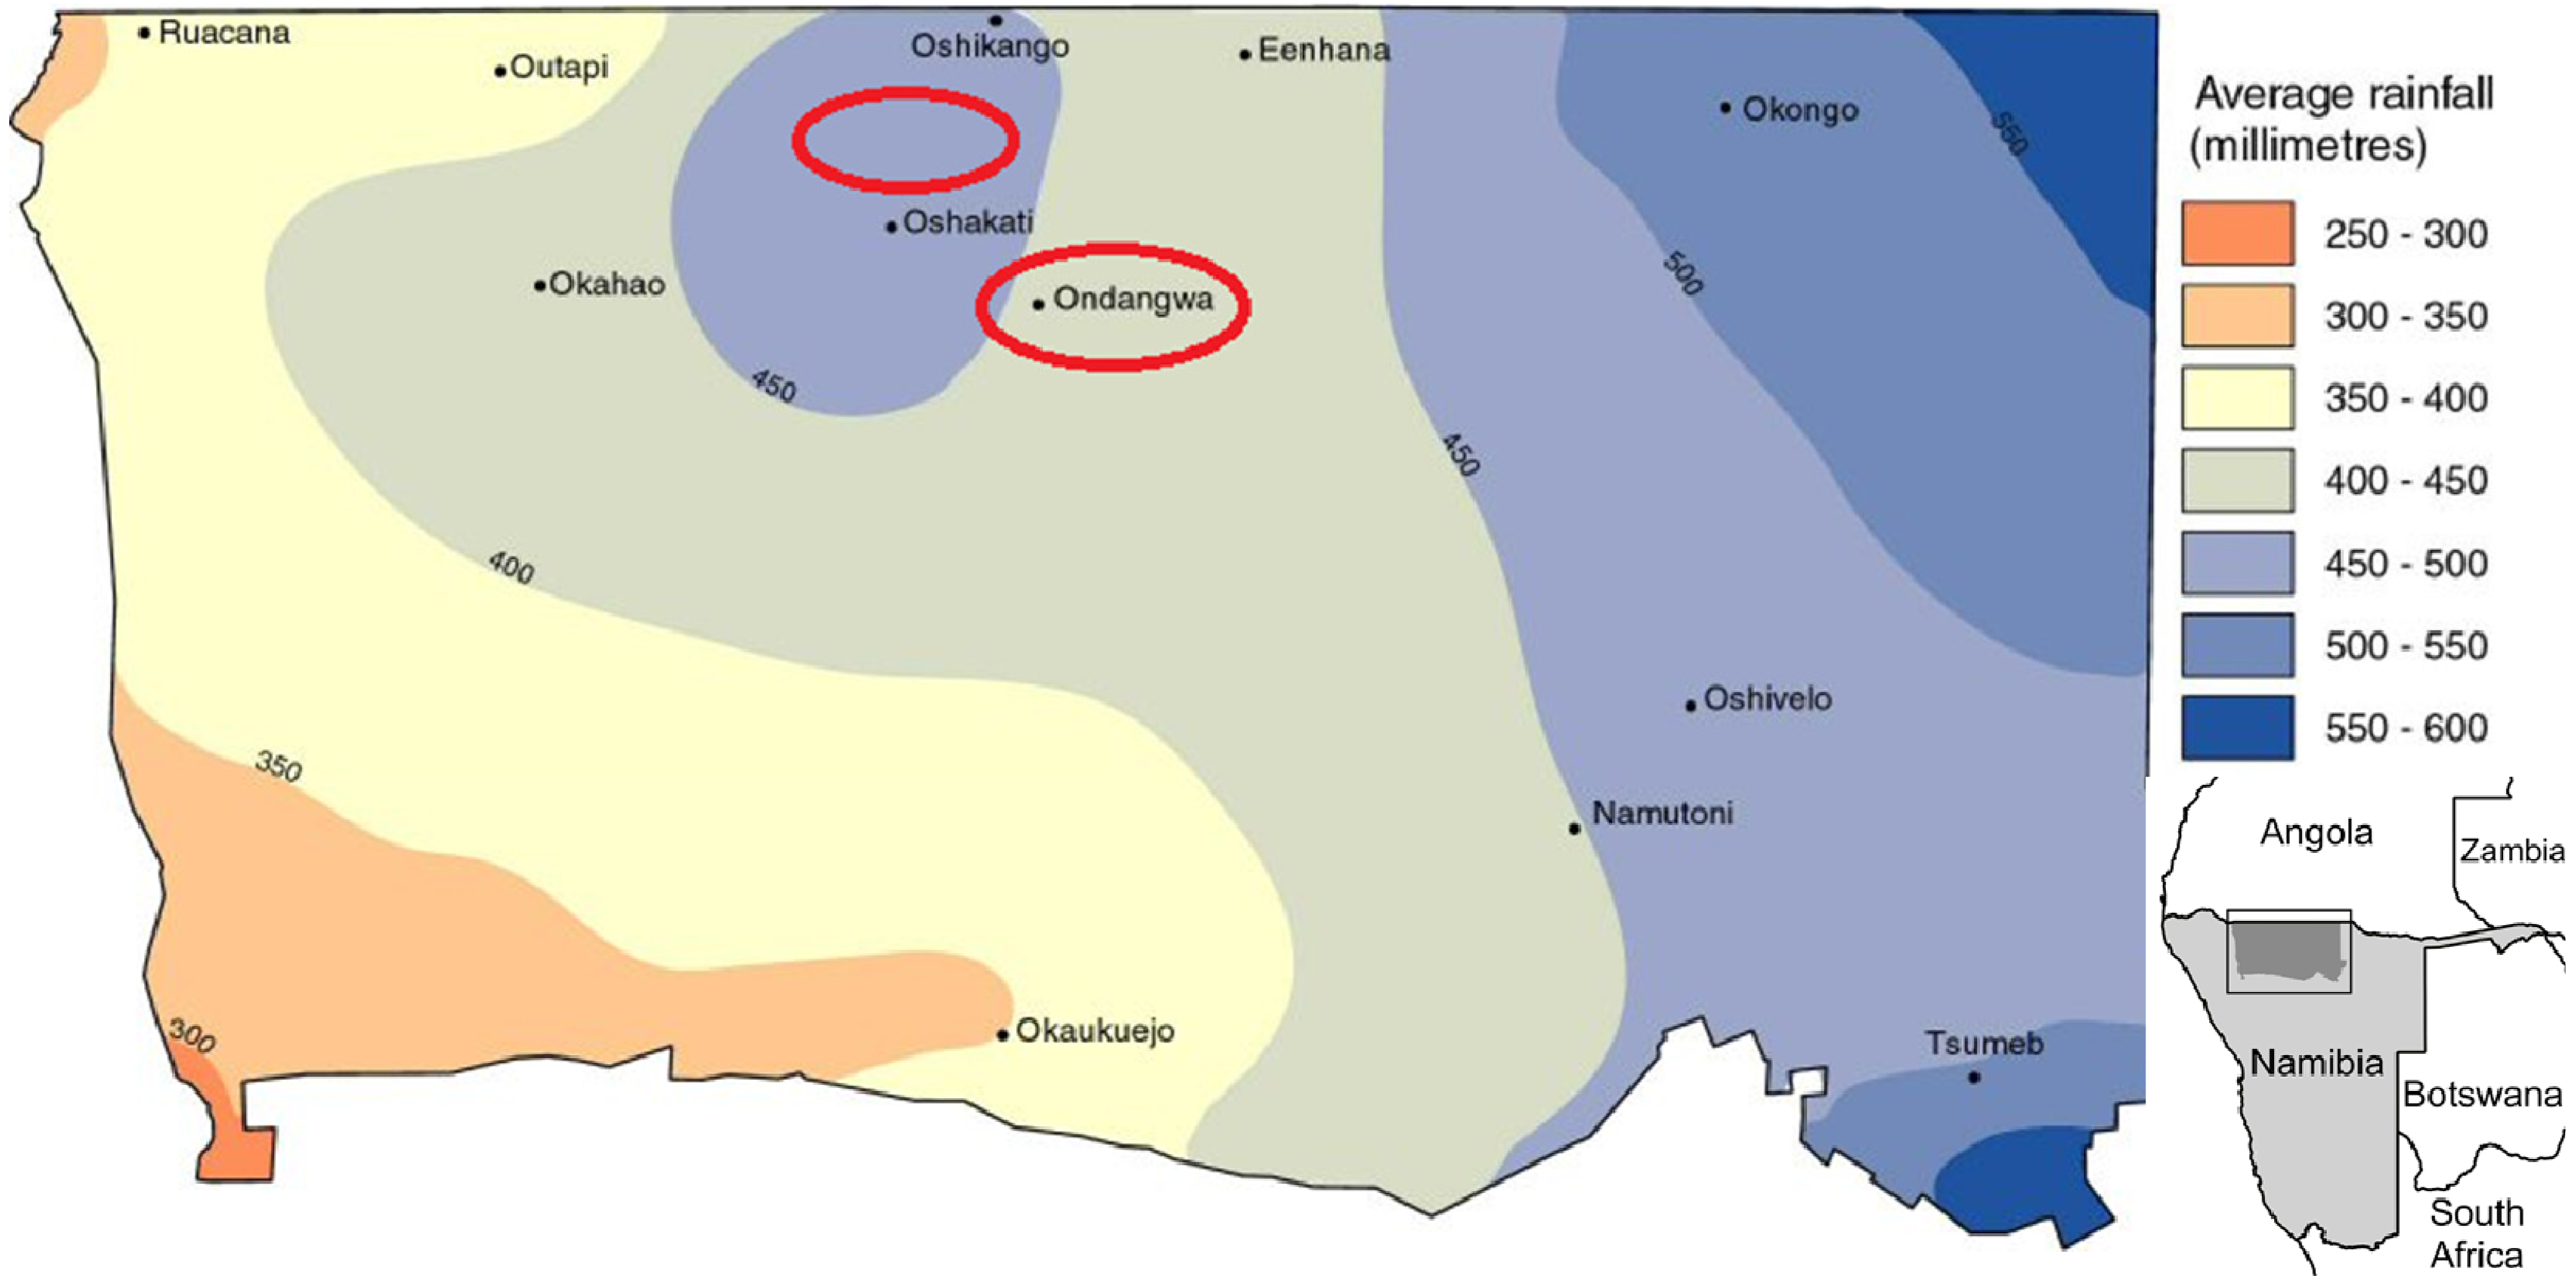
2. Study Area

3. Methods and Data
3.1. Overview of Methodology
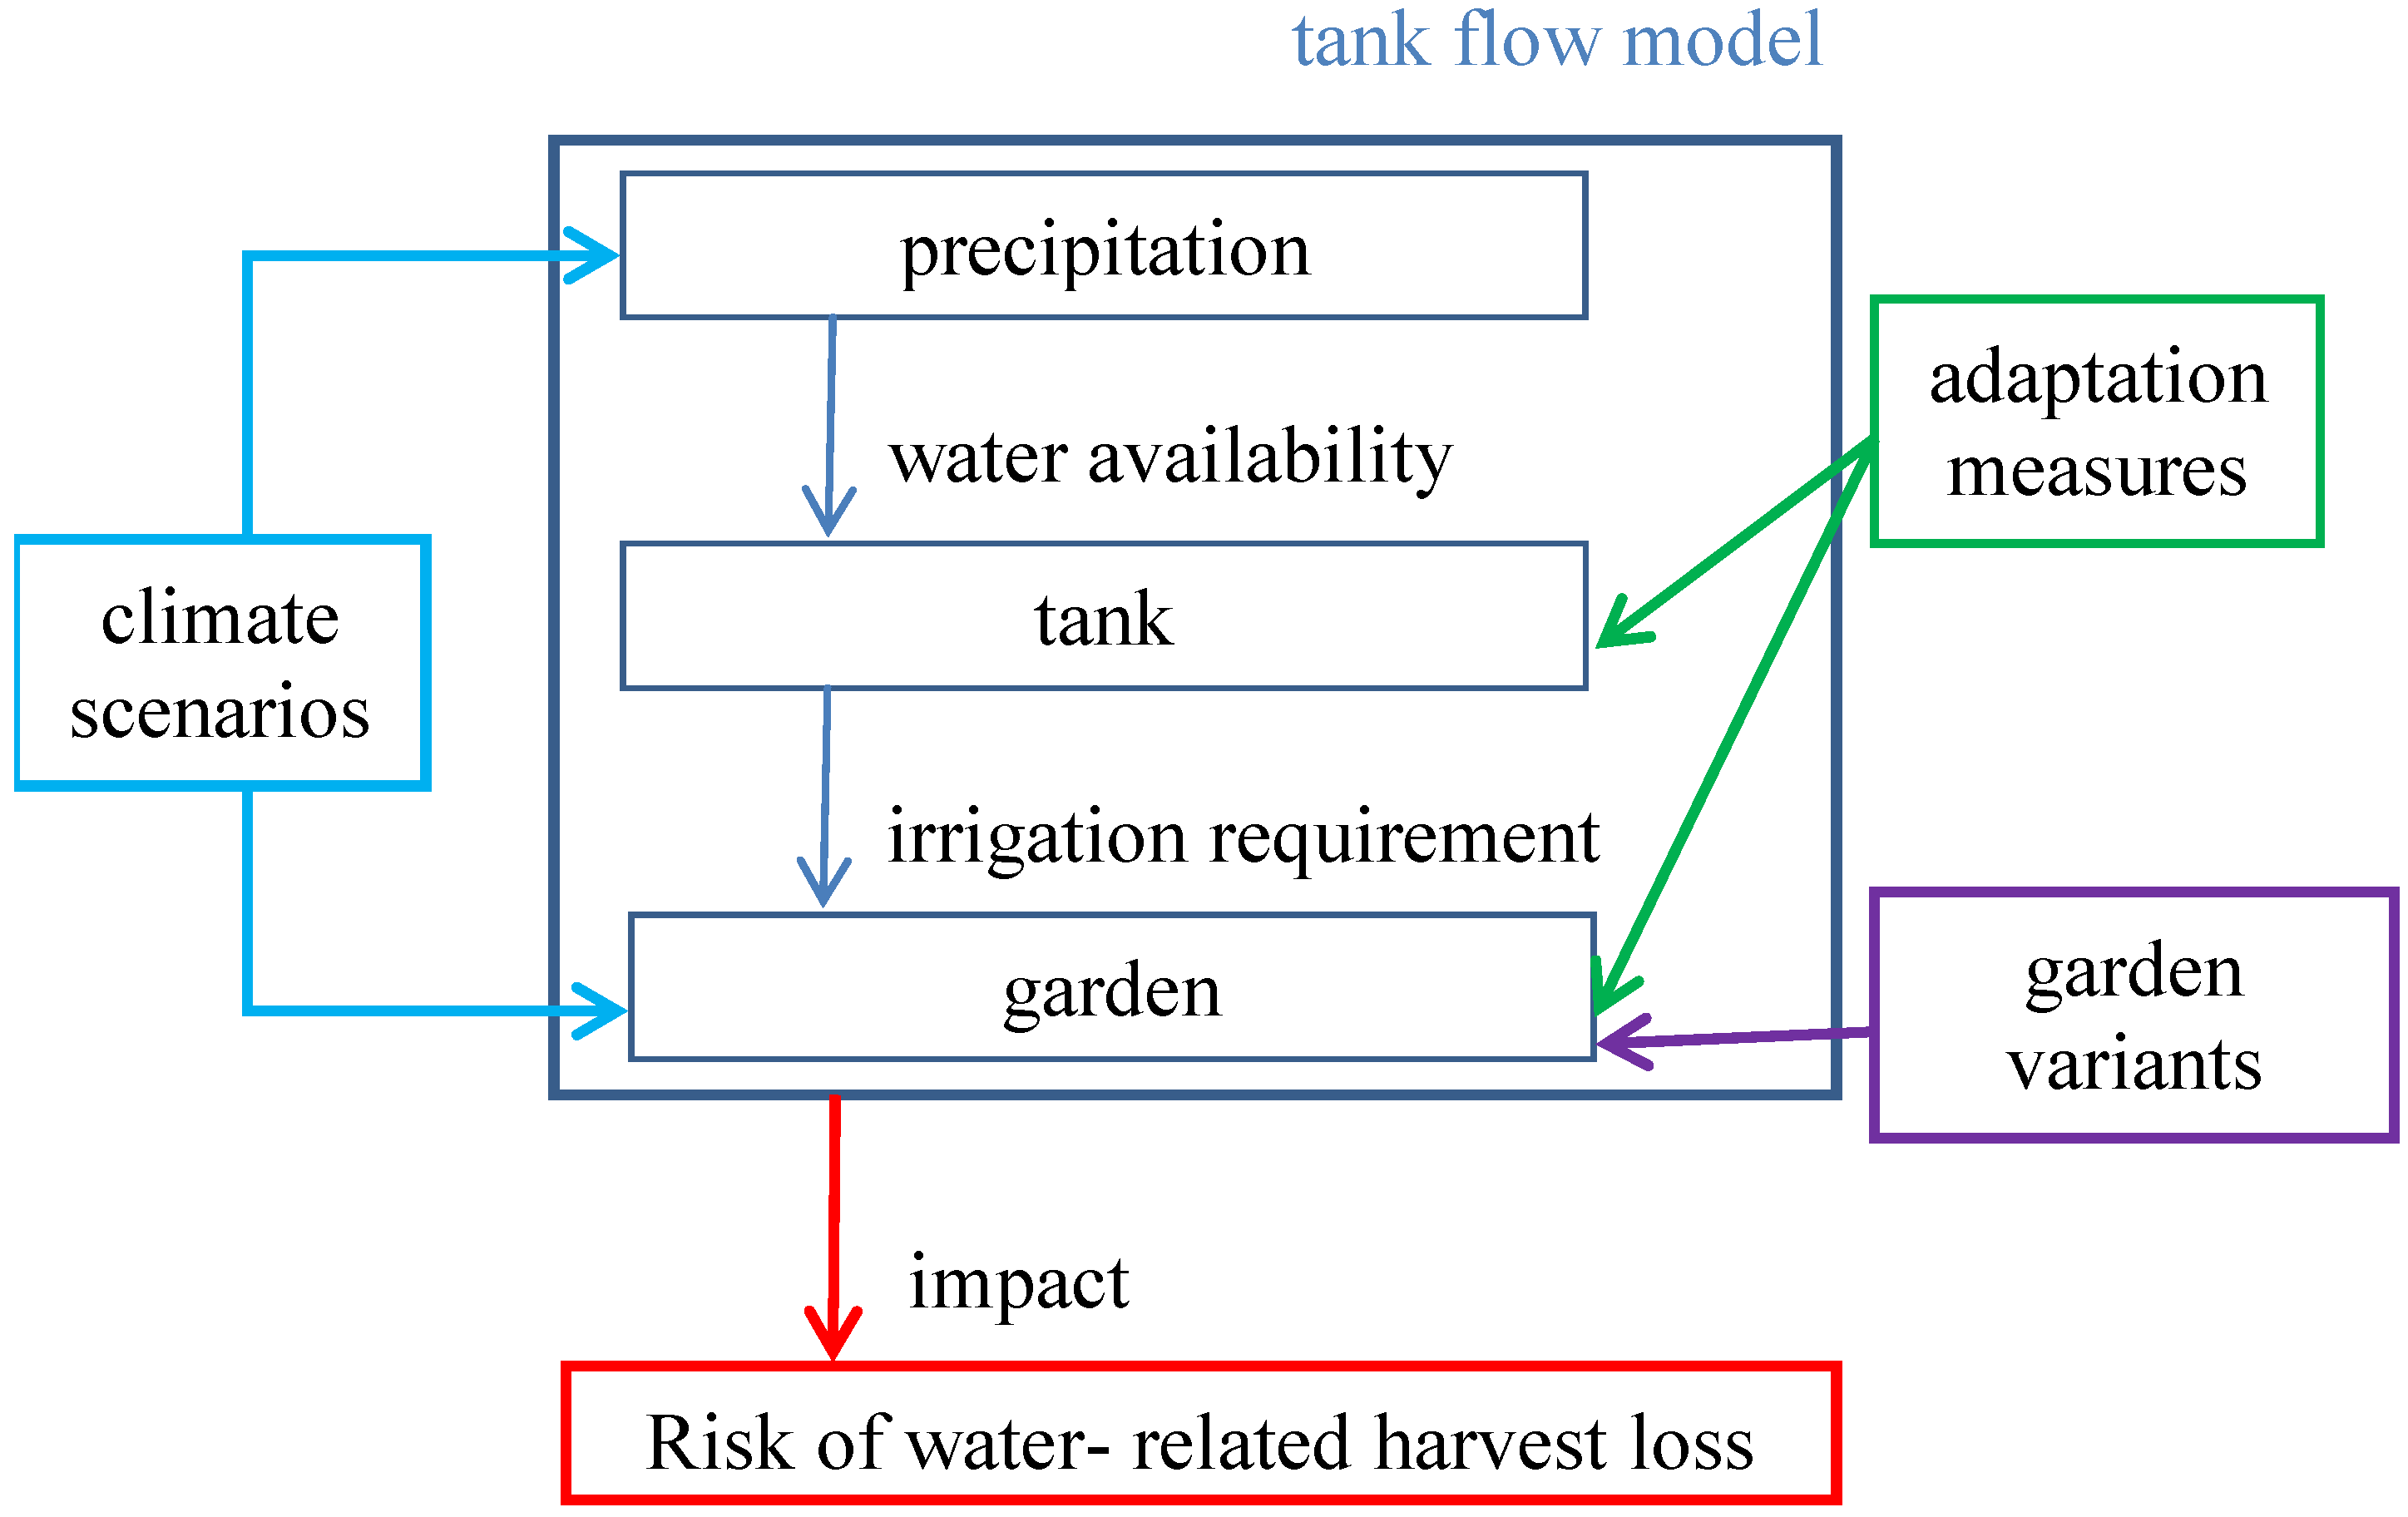
3.2. Modeling the Tank Balance
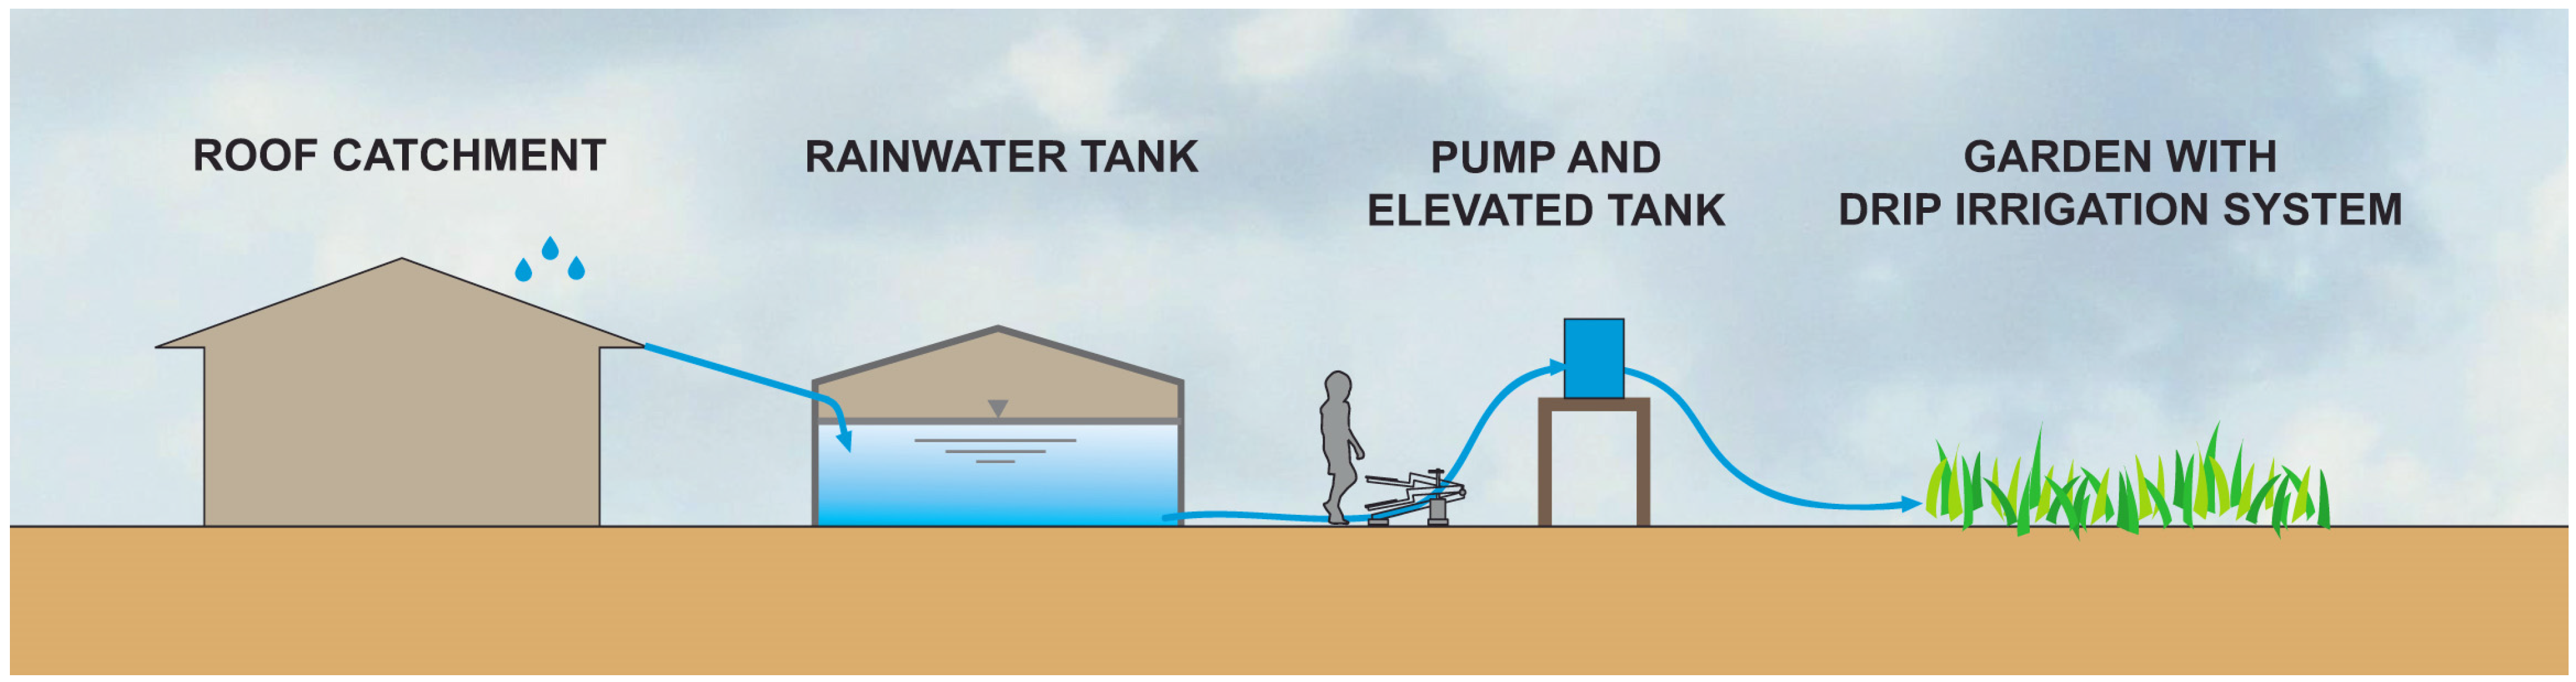
3.2.1. Modeling Tank Inflow
3.2.2. Modeling Tank Outflow
3.3. Climate Data and Scenarios

| Scenarios | Temperature (°C) | Precipitation (%) |
|---|---|---|
| Best future climate | minimum increase | maximum decrease |
| Medium future climate | median increase | median decrease |
| Worst future climate | maximum increase | minimum decrease |
4. Results and Discussion
4.1. Climate Analysis
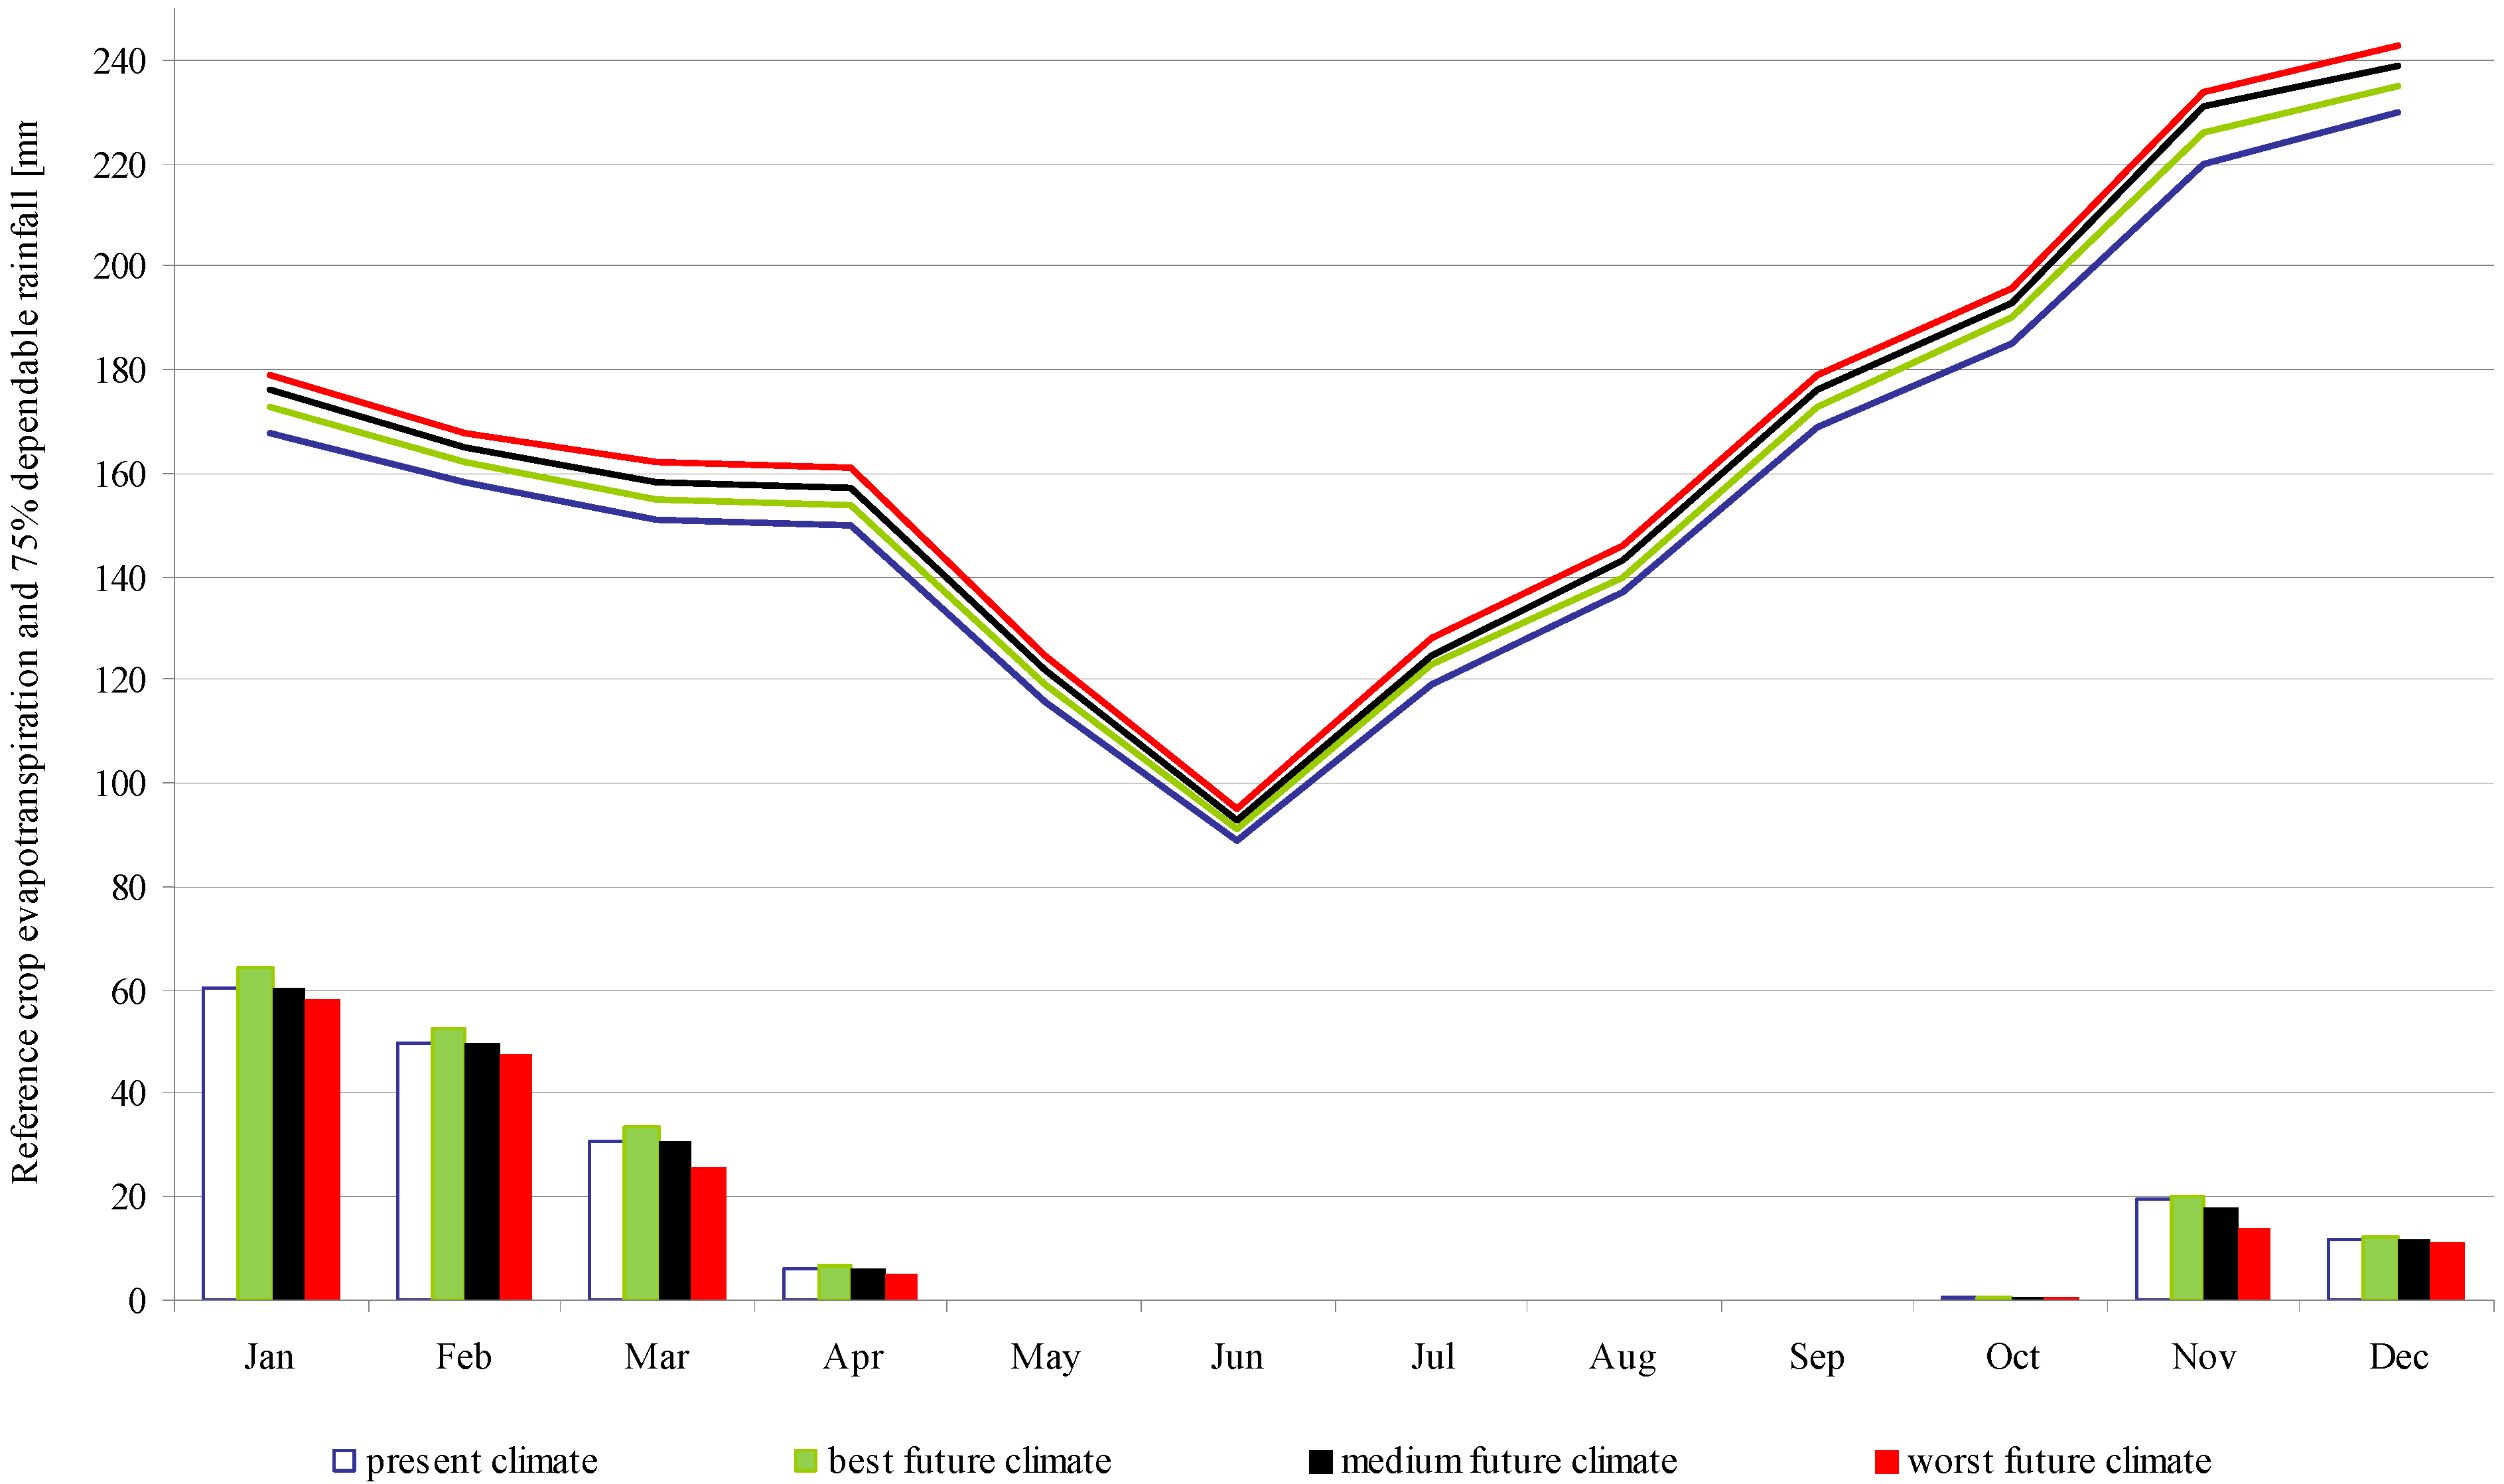
4.2. Scenarios of Future Precipitation, Temperature and Reference Crop Evapotranspiration
| Scenarios | Temperature Change (°C) for 2050 | Precipitation Change (%) for 2050 | ||||
|---|---|---|---|---|---|---|
| Minimum (Best Case) | Median (Medium Case) | Maximum (Worst Case) | Minimum (Worst Case) | Median (Medium Case) | Maximum (Best Case) | |
| December, January, February | +1.2 | +2.1 | +3.1 | −4 | 0 | +7 |
| March, April, May | +1.1 | +2.1 | +3.1 | −17 | 0 | +8 |
| June, July, August | +1.3 | +2.3 | +3.2 | −29 | −15.3 | −2 |
| September, October, November | +1.4 | +2.5 | +3.3 | −29 | −8.7 | +2 |
| Annual | +1.3 | +2.2 | +3.2 | −8 | −3 | +4 |

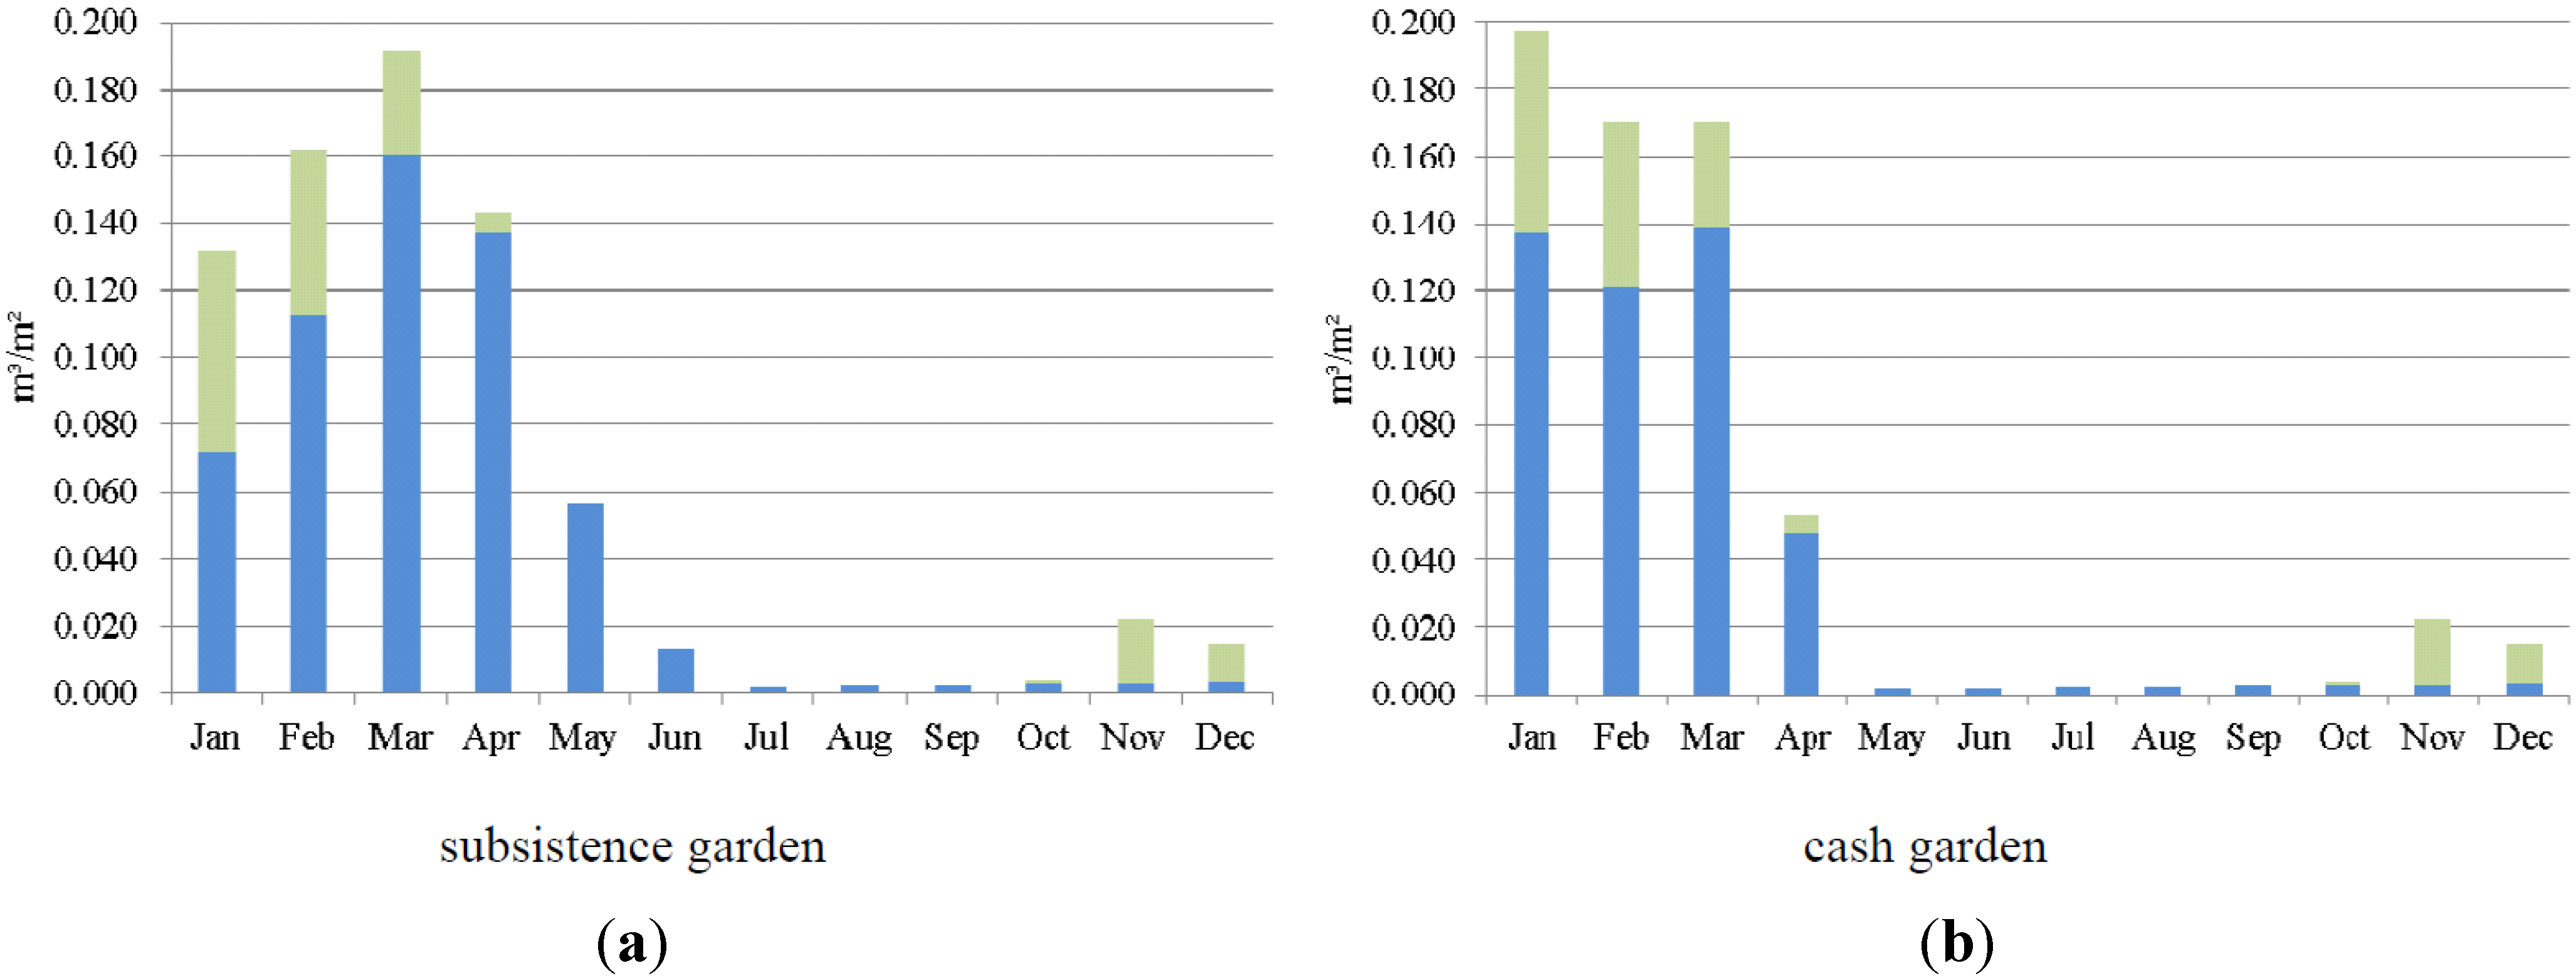
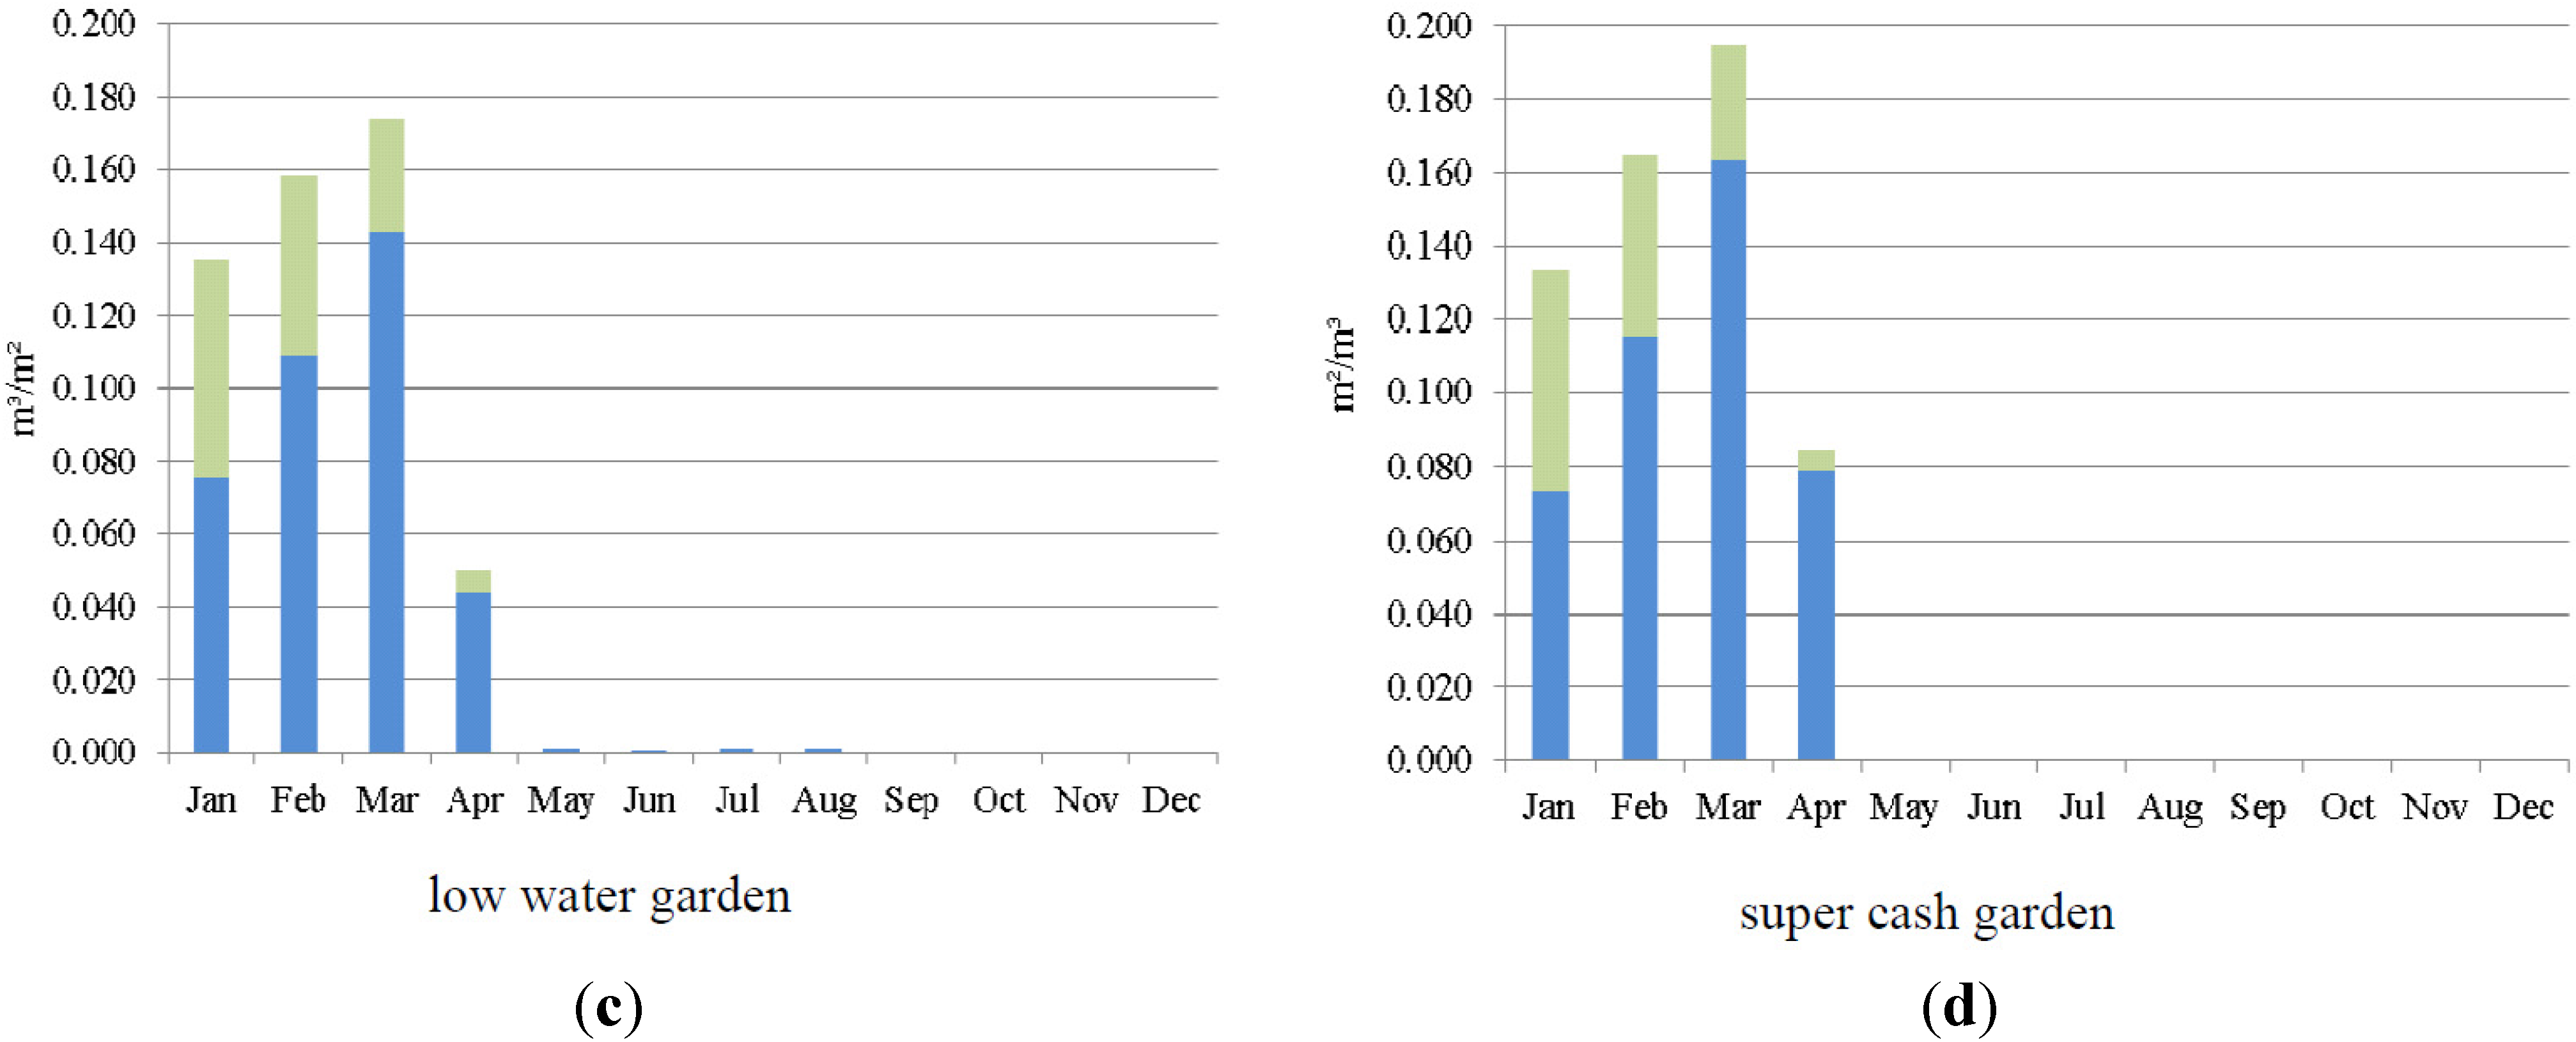
4.3. Garden Variants
| Garden variants | Subsistence | Cash | Low Water | Super Cash |
|---|---|---|---|---|
| Description | Aimed for household consumption, with high nutritional value of crops combining a healthy diet with saved expenses for food. | Maximizes revenue from market sale, crops combine high yields and market with low water requirements. | Most water efficient crops, market prices are not considered. | Maximizes revenues, by planting the crop that achieves the highest market price through a high yield and low water requirement. |
| Crops | water melon, cucumber, cabbage, pepper, tomato, potato, 1 orange tree | cucumber, lettuce, water melon, 1 mango tree | cucumber, water melon, lettuce, onions, zucchini, 1 avocado tree | cucumber |
| Growing period | 01 January–14 June | 01 January–15 April | 01 January–15 April | 01 January–15 April |
| fruit tree all year | fruit tree all year | fruit tree all year | - | |
| Garden area (m2) | 66 | 94 | 100 | 104 |
| Irrigation requirement (m3) | 37 | 39 | 37 | 45 |
| Irrigation requirement (m3/m2) | 0.557 | 0.402 | 0.372 | 0.431 |
| Crop production (kg/yr) | 338 | 370 | 369 | 416 |
| Revenue (€/yr) * | 65 | 105 | 84 | 206 |
| Water efficiency (kg/ m3) | 9.2 | 9.8 | 9.9 | 9.3 |
| Water productivity (€/m3) | 1.8 | 2.8 | 2.3 | 4.6 |


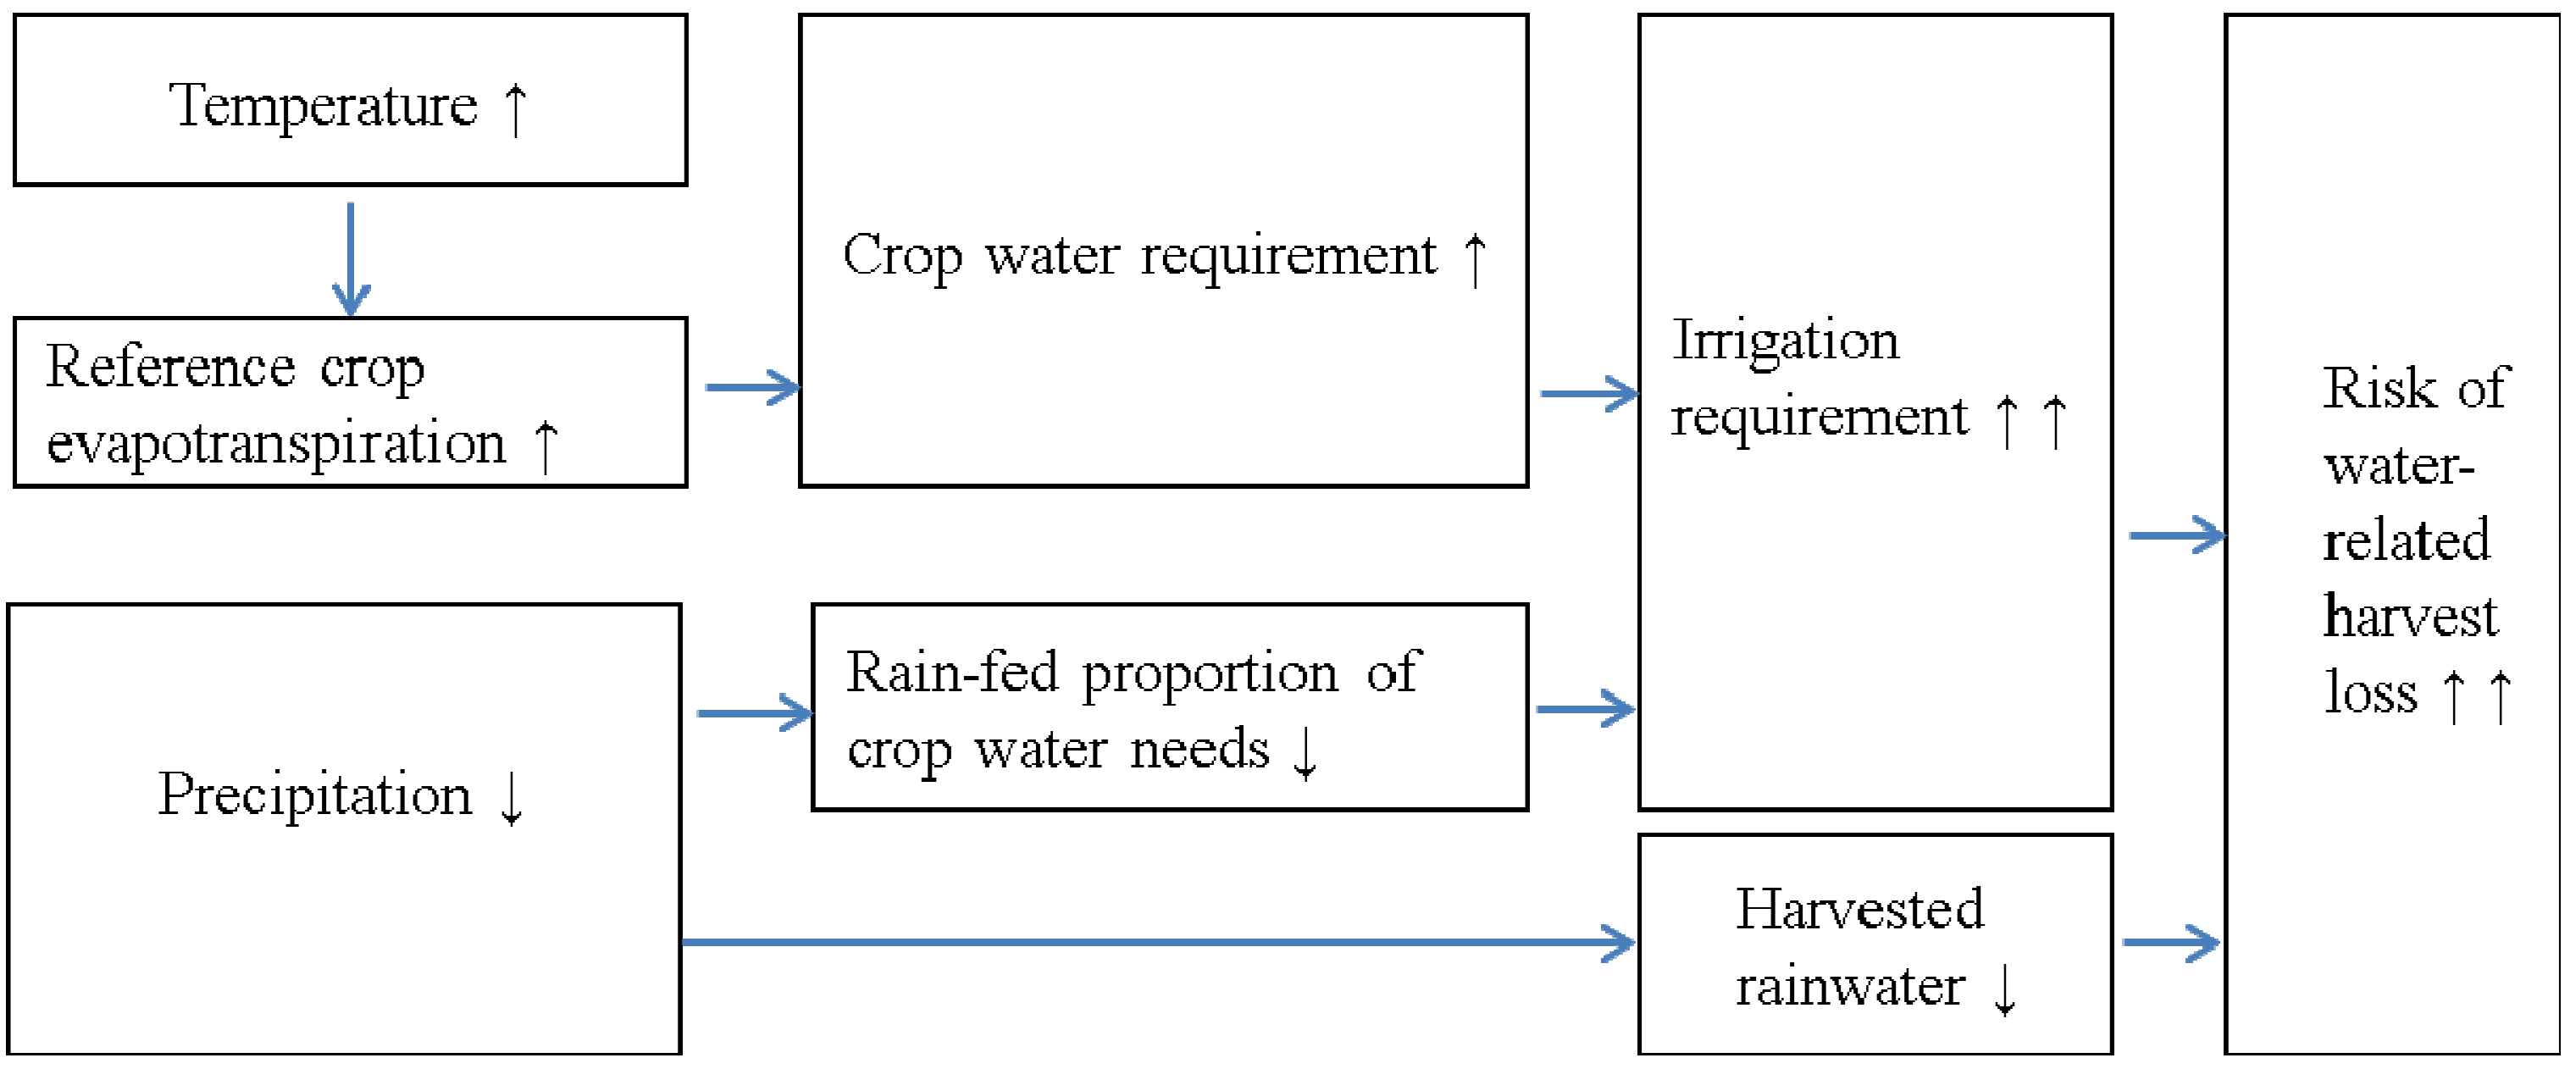
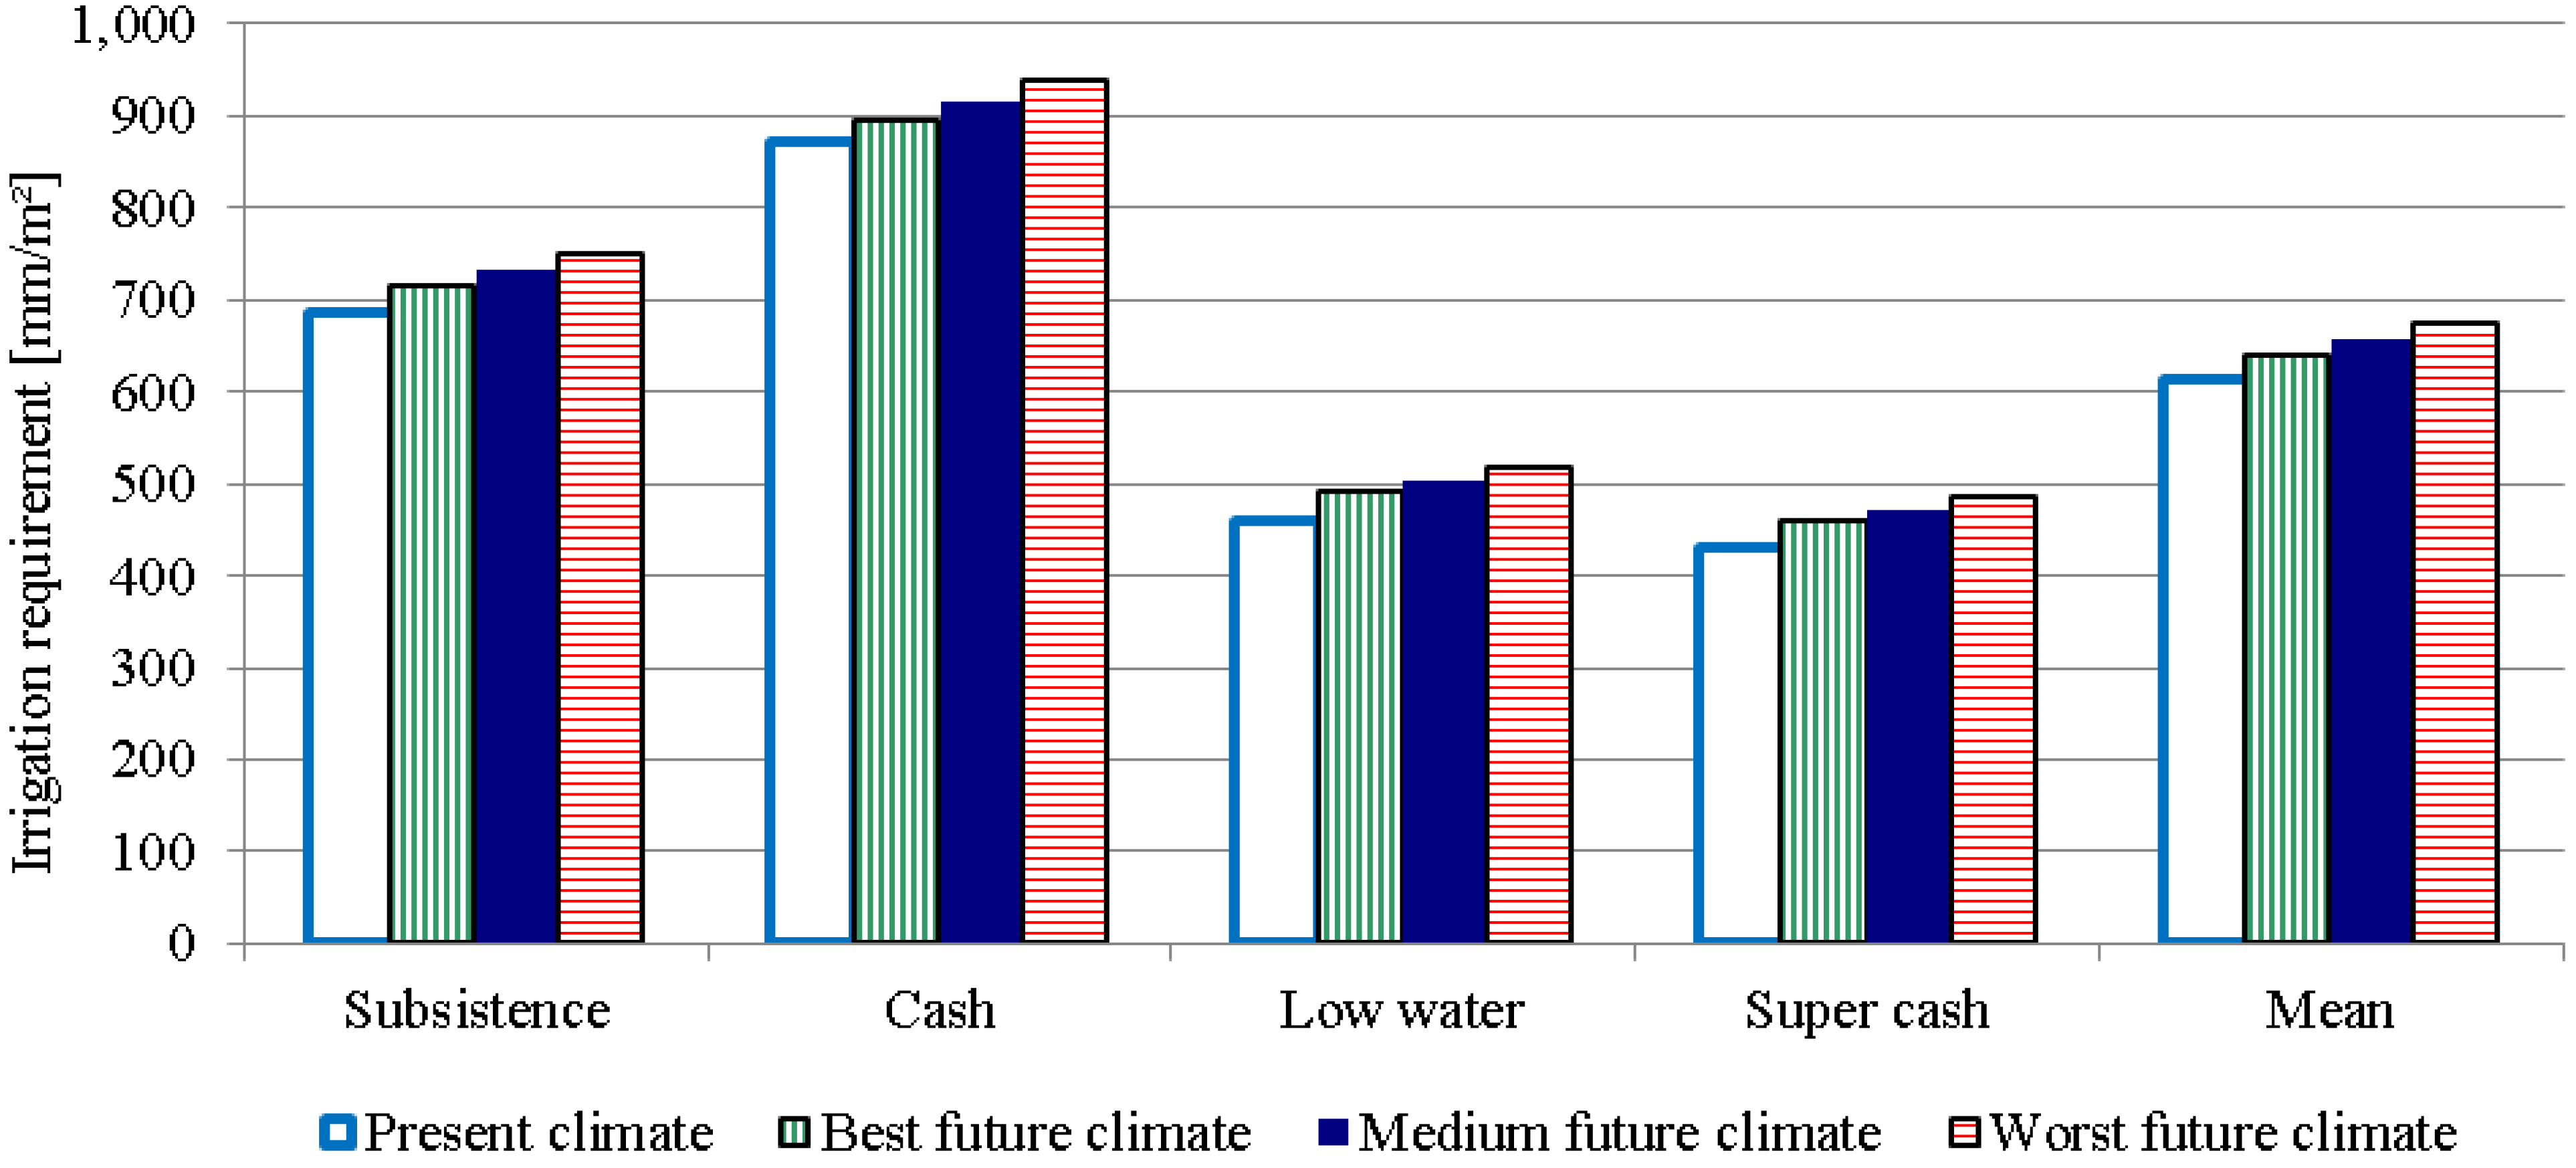
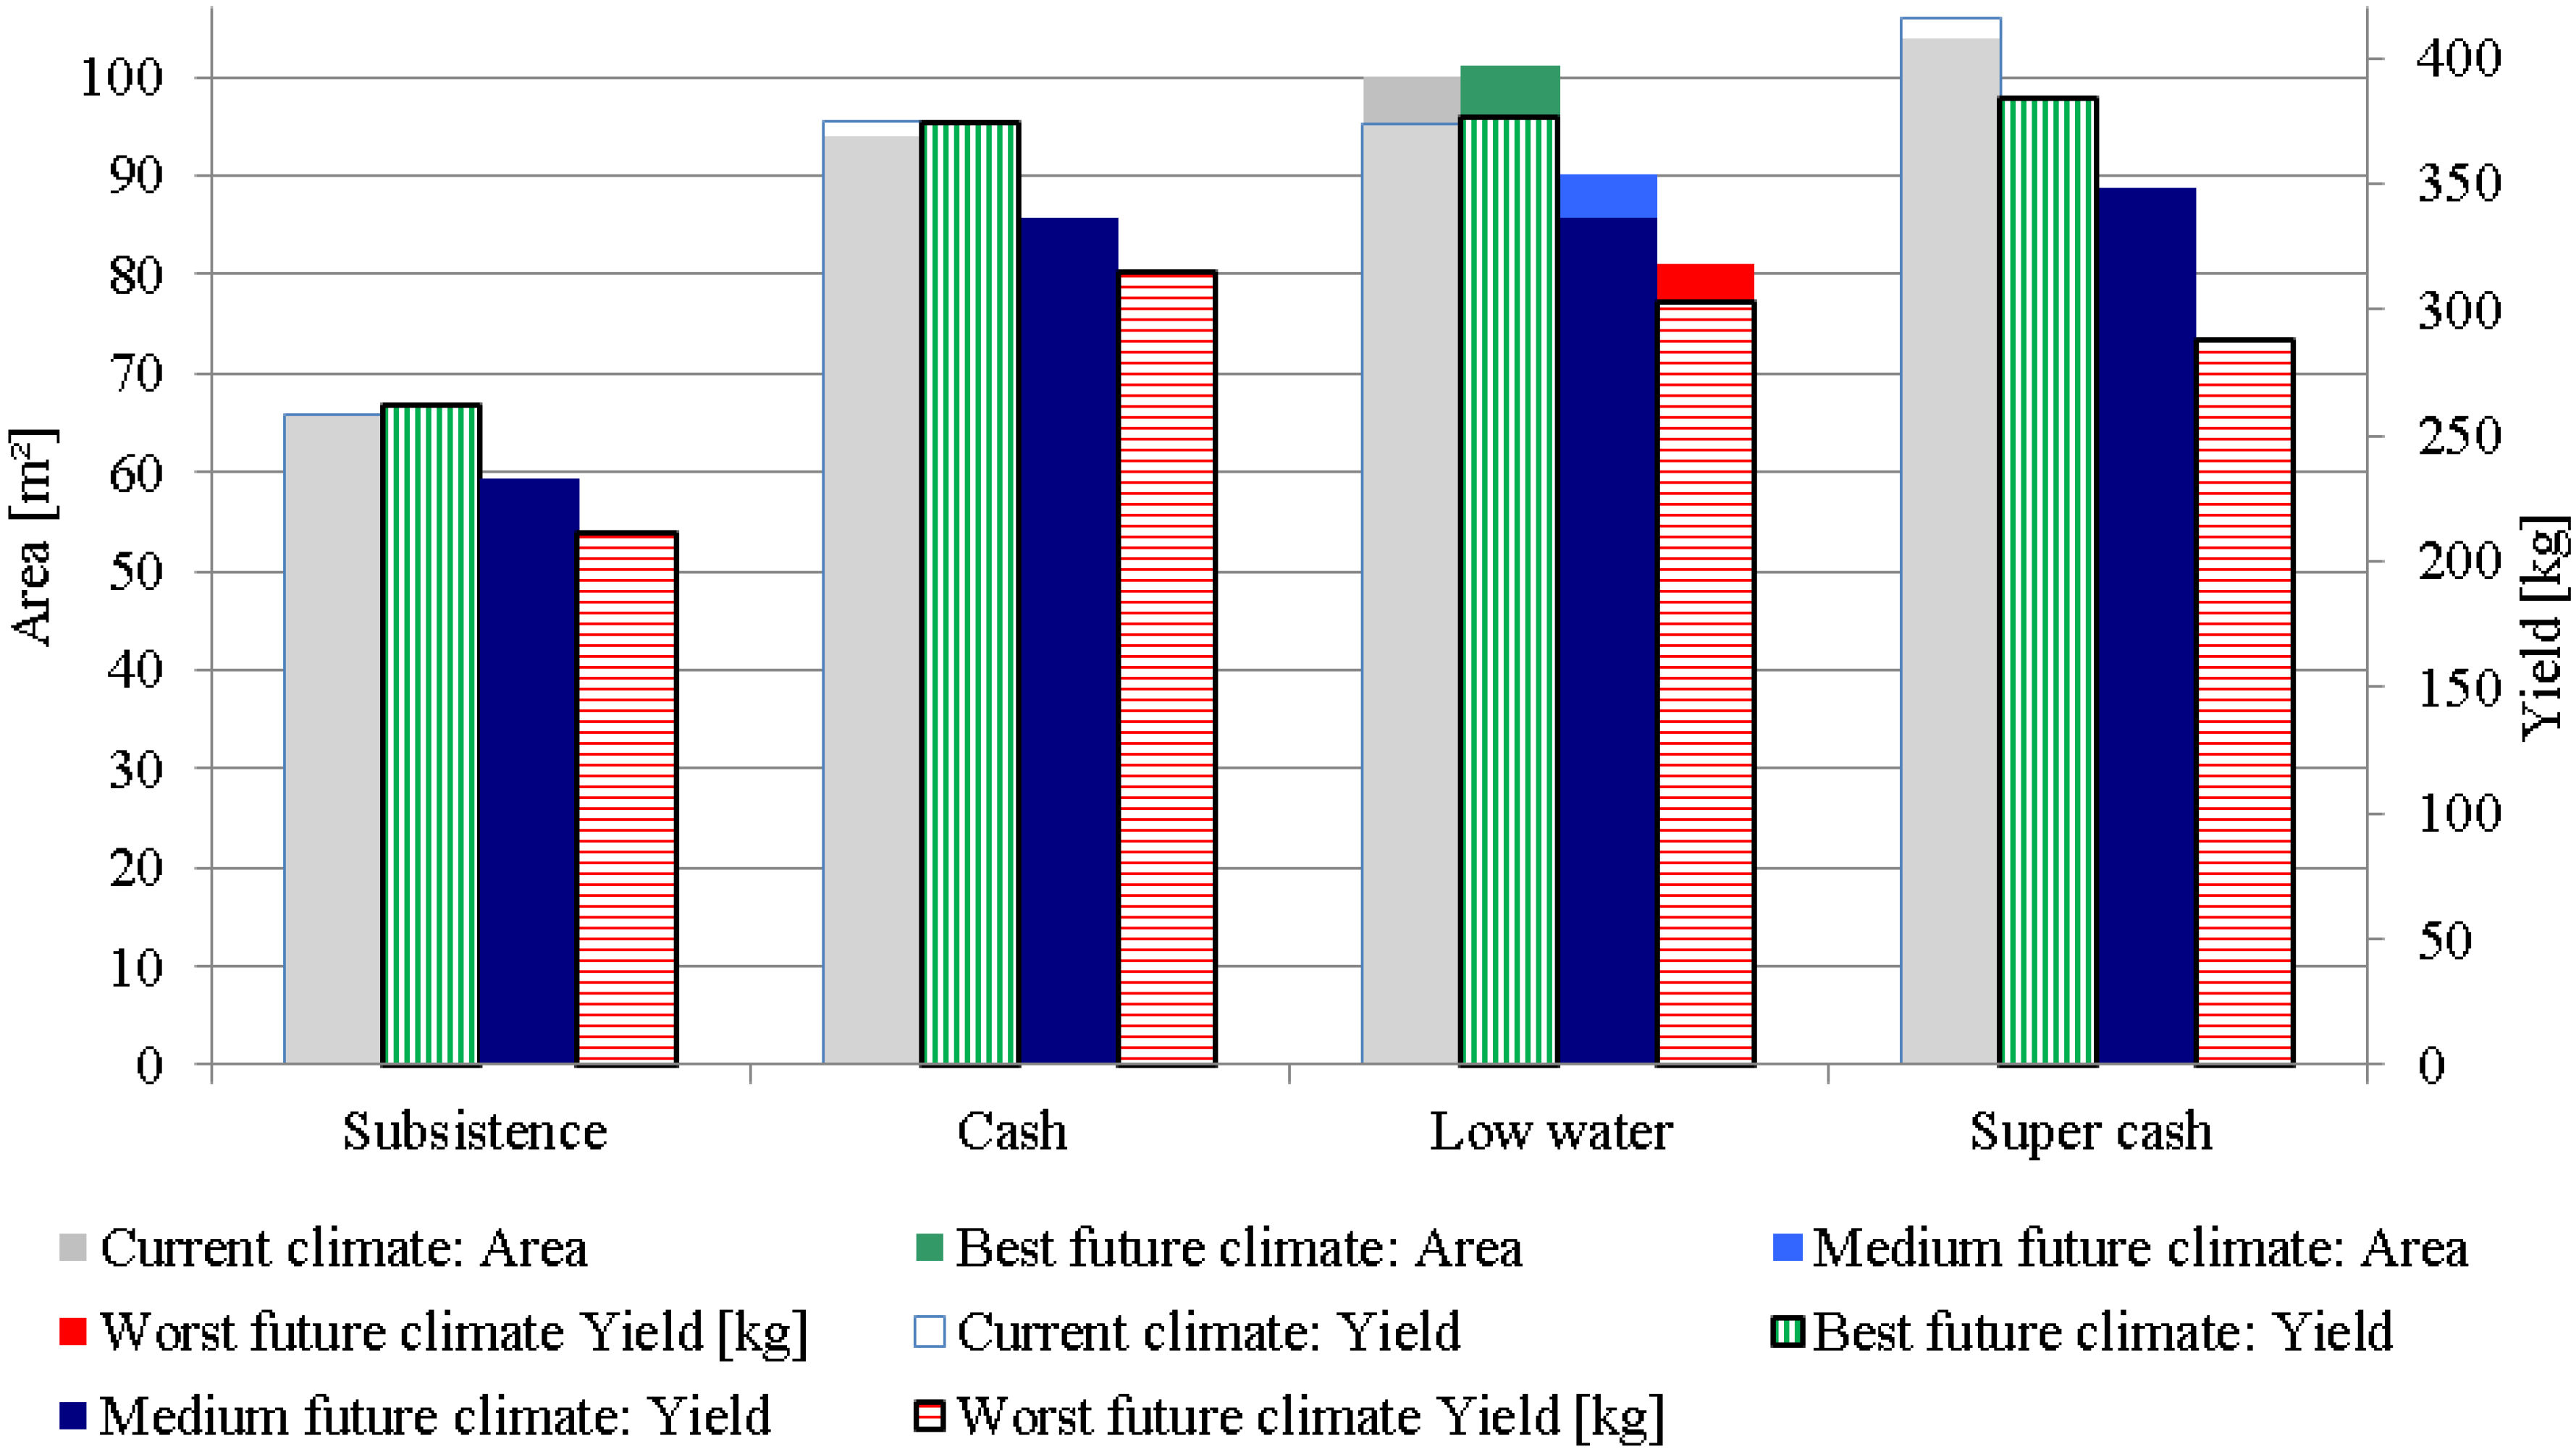
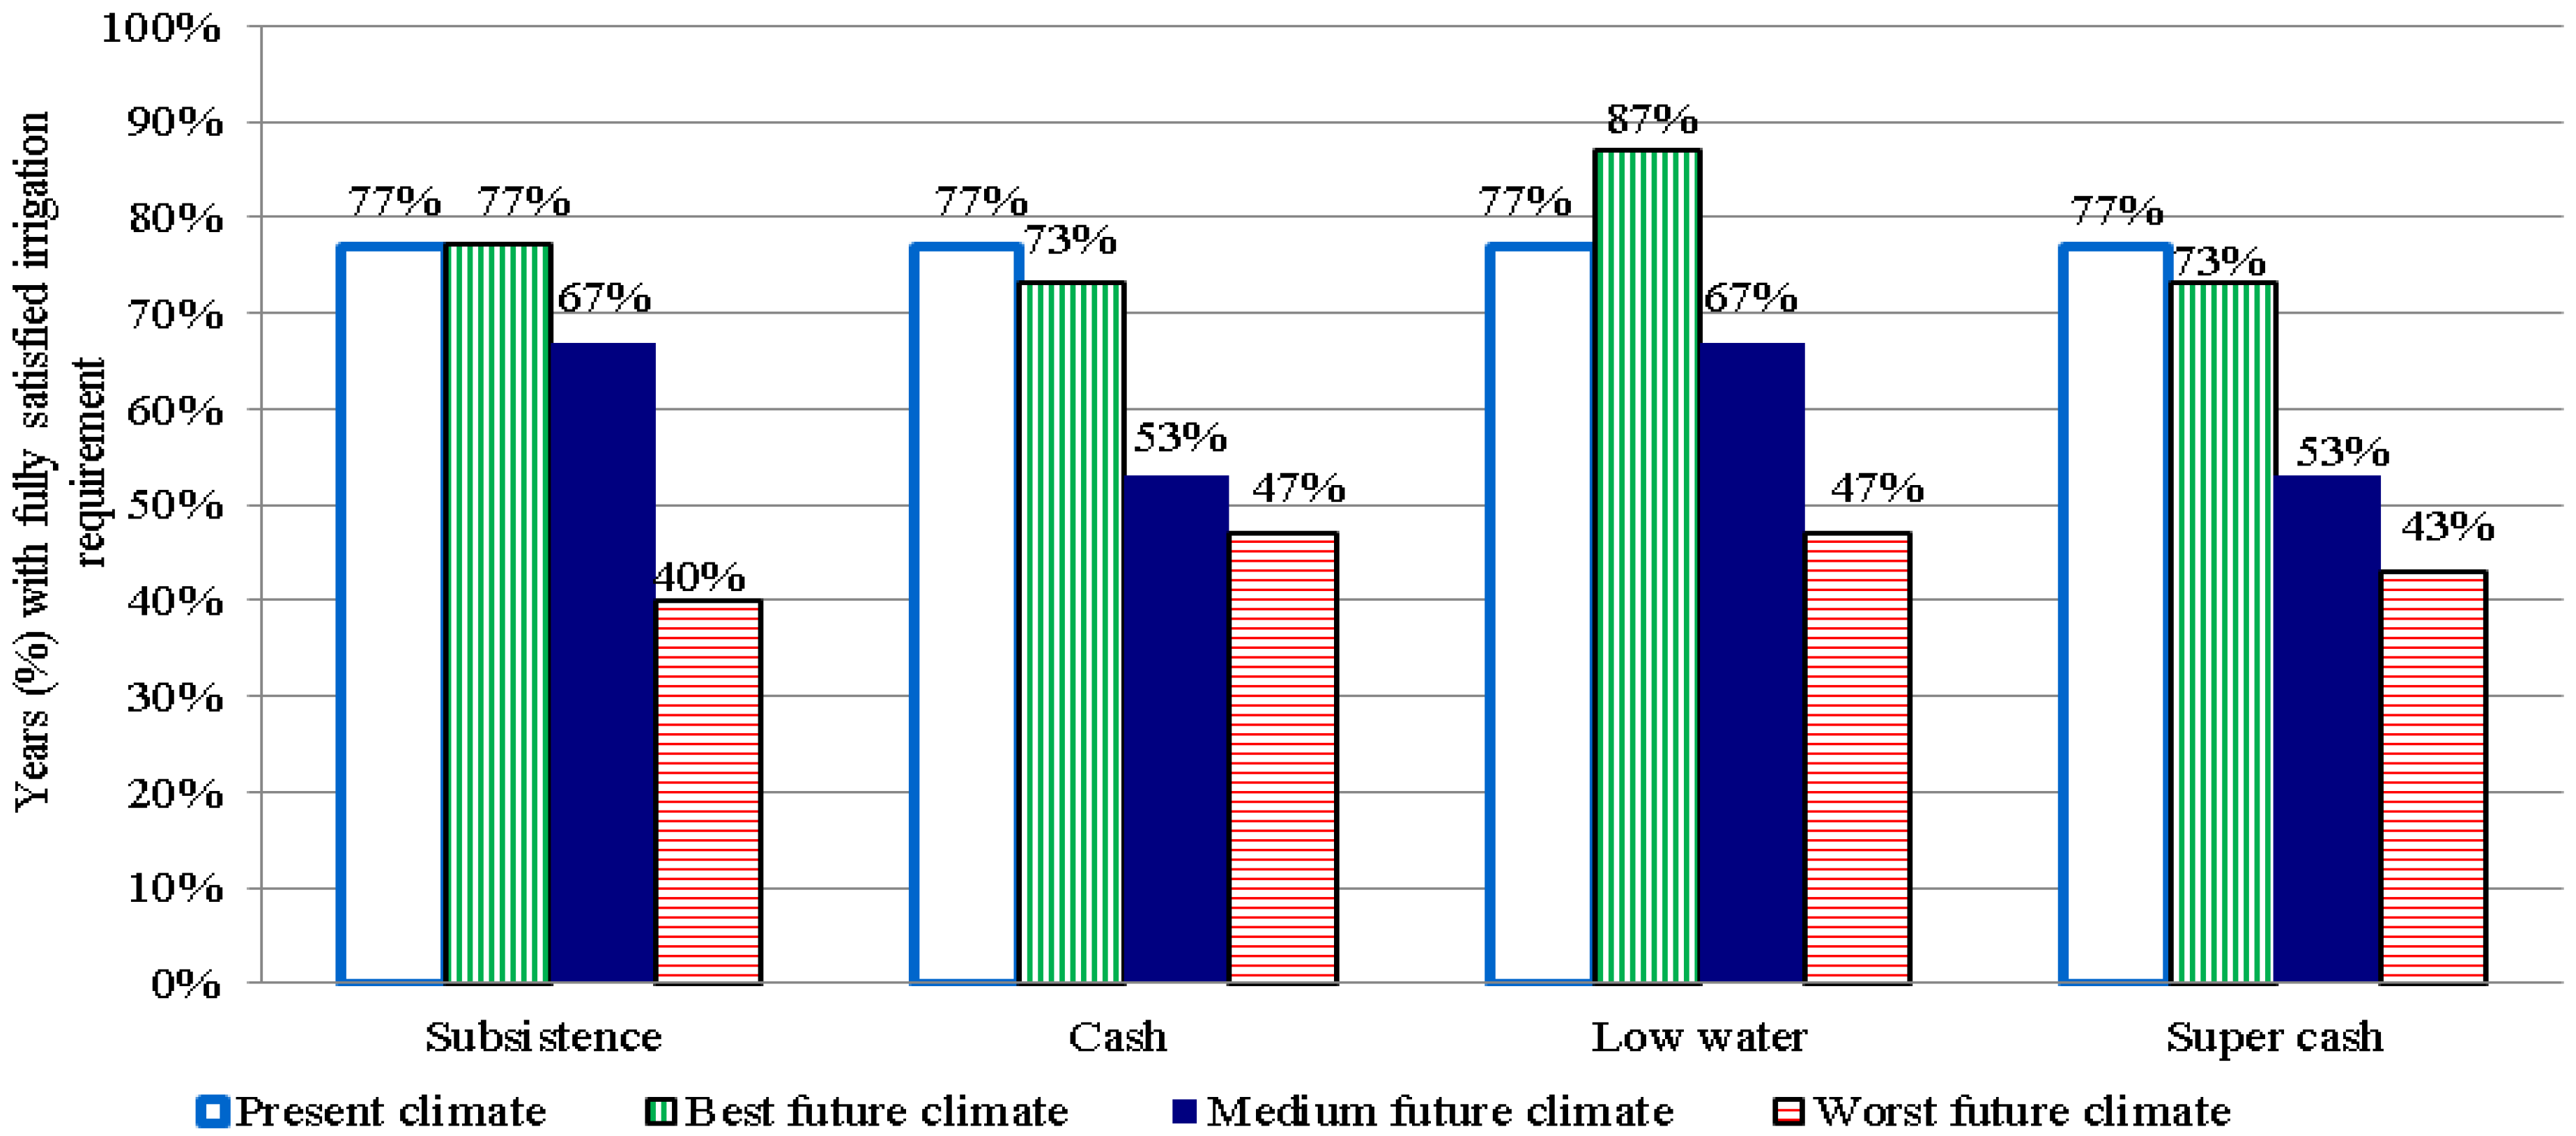
4.4. Analysis of Climate Change Impacts


4.5. Development of Adaptation Strategies to Climate Change
| Adaptation Measure | Effect | Complete Compensation of Worst Future Climate Scenario |
|---|---|---|
| Adaptation of garden area | Fully irrigate a smaller garden area | Yes. Disadvantage: Yield and revenue reduction. |
| Switch to garden variant with higher water efficiency | Rise in water efficiency of e.g., +8% when switching from the subsistence to the low water garden | Partly. Only possible for gardens with low water efficiency and by changing the strategic goal of a farmer. |
| Purchase of irrigation water from the grid | Garden can be continuously irrigated | Yes. |
| Adaptation of the roof catchment size | More rain can be harvested | Yes. With an extension of the roof by +10% (current: 100 m2 roof, 28.4 m3 harvested rainwater) 28.7 m3 can be harvested under the worst case climate scenario. Disadvantage: costs and practicability. |
| Observation of water quantity stored and early reaction in case water is not sufficient | Result was not significant | No. |
4.5.1. Adaptation of Garden Area

4.5.2. Switch to Garden Variant with Higher Water Efficiency
4.5.3. Purchase of Tap Water
4.5.4. Enlargement of Roof Size
4.5.5. Observation of Water Level and then Reduction of Garden Area
4.6. Applicability and Limitations of Results and Methodology
5. Conclusions
- (1)
- Two important factors influencing the yield that can be achieved with rainwater harvesting based gardening are the household’s decision regarding a certain garden variant and future climate conditions.
- (2)
- Except for the best-case climate scenario, climate change is projected to lead to considerable negative impacts on rainwater harvesting and gardening. The risk of water-related harvest losses would increase if garden sizes and, thus, revenues are not decreased.
- (3)
- This study demonstrated a methodology to quantify the effects of climate change on rainwater harvesting based gardening. The actual values resulted in the study may not be accurate due to the assumptions made for climate projections in this study and may be refined with further studies.
- (4)
- Viable measures to adapt rainwater harvesting and gardening to the prevailing climate situation in the future include an extension of the roof size, the purchase of additional tap water and a switch from low water efficient crops to high water efficient crops. When taking these measures, the negative impacts of climate change can be partly or completely compensated, however each tied to specific repercussions.
Acknowledgments
Author Contributions
Conflicts of Interest
References
- Climate Change 2007: Synthesis Report—Summary for Policymakers. Intergovernmental Panel on Climate Change Fourth Assessment Report, Contributions of Working Groups I, II, and III; IPCC: Geneva, Switzerland, 2007.
- International Water Management Institute (IWMI). Water for Food, Water for Life: A Comprehensive Assessment of Water Management in Agriculture; Earthscan: London, UK; Colombo, Sri Lanka, 2007; p. 40. [Google Scholar]
- Bates, B.C.; Kundzewicz, Z.W.; Wu, S.; Palutikof, J.P. Climate Change and Water; Intergovernmental Panel on Climate Change (IPCC Secretariat): Geneva, Switzerland, 2008; p. 210. [Google Scholar]
- Barron, J. Rainwater Harvesting: A Lifeline for Human Well-Being; United Nations Environment Programme (UNEP), Stockholm Environment Institute (SEI): Stockholm, Sweden, 2009; p. 80. [Google Scholar]
- Ishaku, H.T.; Rafee Majid, M.; Johar, F. Rainwater harvesting: An alternative to safe water supply in Nigerian rural communities. J. Water Resour. Manag. 2012, 26, 295–305. [Google Scholar] [CrossRef]
- Pachpute, J.S.; Tumbo, S.D.; Sally, H.; Mul, M.L. Sustainability of rainwater harvesting systems in rural catchment of sub-Saharan Africa. J. Water Resour. Manag. 2009, 23, 2815–2839. [Google Scholar] [CrossRef]
- Sturm, M.; Zimmermann, M.; Schütz, K.; Urban, W.; Hartung, H. Rainwater harvesting as an alternative water resource in rural sites in central northern Namibia. Phys. Chem. Earth A/B/C 2009, 34, 776–785. [Google Scholar] [CrossRef]
- Water is Life—Omeya ogo Omwenyo; CuveWaters Mid-Term Report; Institute for Social-Ecological Research (ISOE) GmbH: Frankfurt, Germany, 2013.
- Critchley, W.; Siegert, K.; Chapman, C. Water Harvesting: A Manual for the Design and Construction of Water Harvesting Schemes for Plant Production; Food and Agricultural Organization (FAO): Rome, Italy, 1991; Available online: http://www.fao.org/ag/magazine/0704sp4.htm (accessed on 6 February 2012).
- Christensen, J.H.; Hewitson, B.; Busuioc, A.; Chen, A.; Gao, X.; Held, I.; Jones, R.; Kolli, R.K.; Kwon, W.T.; Laprise, R.; et al. Regional climate projections. In Contribution of Working Group I to the Fourth Assessment Report of the Intergovernmental Panel on Climate Change. Supplementary Material. Regional Climate Projections; Solomon, S., Qin, D., Manning, M., Chen, Z., Marquis, M., Averyt, K.B., Tignor, M., Miller, H.L., Eds.; Cambridge University Press: Cambridge, UK; New York, NY, USA, 2007. [Google Scholar]
- Biazin, B.; Sterk, G.; Temesgen, M.; Abdulkedir, A.; Stroosnijder, L. Rainwater harvesting and management in rainfed agricultural systems in sub-Saharan Africa—A review. Phys. Chem. Earth 2012, 47–48, 139–151. [Google Scholar]
- Kahinda, M.; Taigbenu, A.E. Rainwater harvesting in South Africa: Challenges and opportunities. Phys. Chem. Earth A/B/C 2011, 36, 968–976. [Google Scholar] [CrossRef]
- Boelee, E.; Mekonnen, Y.; Poda, J.; McCartney, M.; Cecchi, P.; Kibret, S.; Hagos, F.; Laamrani, H. Options for water storage and rainwater harvesting to improve health and resilience against climate change in Africa. Reg. Environ. Chang. 2013, 13, 509–519. [Google Scholar] [CrossRef]
- Kahinda, M.; Taigbenu, A.E.; Boroto, R.J. Domestic rainwater harvesting as an adaptation measure to climate change in South Africa. Phys. Chem. Earth A/B/C 2010, 35, 742–751. [Google Scholar] [CrossRef]
- Lupia, F.; Pulighe, P. Water use and urban agriculture: Estimation and water saving scenarios for residential kitchen gardens. In Proceedings of the IRLA 2014, The Effects of Irrigation and Drainage on Rural and Urban Landscapes, Patras, Greece, 26–28 November 2014.
- Hajani, E.; Rahman, A. Reliability and cost analysis of a rainwater harvesting system in peri-urban regions of Greater Sydney, Australia. Water 2014, 6, 945–960. [Google Scholar] [CrossRef]
- Gould, J.; Nissen-Petersen, E. Rainwater Catchment SYSTEMS for Domestic Supply; Intermediate Technology Publications: Warwickshire, UK, 2006. [Google Scholar]
- Kluge, T.; Liehr, S.; Lux, A.; Moser, P.; Niemann, S.; Umaluf, N.; Urban, W. IWRM concept for the Cuvelai Basin in northern Namibia. Phys. Chem. Earth A/B/C 2008, 33, 48–55. [Google Scholar] [CrossRef]
- Heyns, P. The Namibian perspective on regional collaboration in the joint development of international water resources. Int. J. Water Resour. Dev. 1995, 11, 467–492. [Google Scholar] [CrossRef]
- Liehr, S. Driving forces and future development paths of central northern Namibia. In Exploring Sustainability Science: A Southern African Perspective; Burnes, M., Weaver, A., Eds.; African Sun Media (ASM): Stellenbosch, South Africa, 2008; pp. 431–467. [Google Scholar]
- Reid, H.; Sahlén, L.; MacGregor, J.; Stage, J. The Economic Impact of Climate Change in Namibia Impact of Climate Change in Namibia: How Climate Change Will Affect the Contribution of Namibia’s Natural Resources to Its Economy; Environmental Economics Programme: London, UK, 2007. [Google Scholar]
- Government of Namibia. Namibia Initial National Communication to the United Nations Framework Convention on Climate Change; Government of Namibia: Windhoek, Namibia, 2002.
- Jokisch, A.; Kariuki, I.; Woltersdorf, L.; Zimmermann, M.; Brenda, M.; Polak, M. Rainwater Harvesting for Micro-Scale Gardening within the Frame of Project CuveWaters Planning, Construction and Operation of Pilot Plants 2009–2011; Internal Working Paper: Technische Universität Darmstadt, Darmstadt, Germany, 2011. [Google Scholar]
- Zimmermann, M.; Jokisch, A.; Deffner, L.; Brenda, M.; Urban, W. Stakeholder participation and capacity development during the implementation of rainwater harvesting pilot plants in Central Northern Namibia. Water Sci. Technol. 2012, 12, 540–548. [Google Scholar]
- Woltersdorf, L.; Jokisch, A.; Kluge, T. Benefits of rainwater harvesting for gardening and implications for future policy in Namibia. Water Policy 2014, 16, 124–143. [Google Scholar] [CrossRef]
- Mendelsohn, J.; El Obeid, S.; Roberts, C. A Profile of North-Central Namibia; Environmental Profiles Project; Gamsberg Macmillan Publishers: Windhoek, Namibia, 2000. [Google Scholar]
- Lütkemeier, R. Map of Namibia with North-Central Namibia; Map Made with Natural Earth; Institute for Social-Ecological Research ISOE: Frankfurt, Germany, 2015. [Google Scholar]
- Savva, A.; Frenken, K. Crop Water Requirements and Irrigation Scheduling; Irrigation Manual Module 11; Food and Agricultural Organization (FAO): Rome, Italy, 2002. [Google Scholar]
- Brouwer, C.; Prins, K.; Heibloem, K. Irrigation Water Management: Irrigation Scheduling; Training manual no. 4; Food and Agricultural Organization (FAO): Rome, Italy, 1989. [Google Scholar]
- Provision of Weather Data Regarding Temperature, Precipitation, Wind Speed, and Humidity; Namibian Weather Bureau: Windhoek, Namibia, 2011.
- The World Bank. Climate portal of the World Bank. Climate Data Namibia. Available online: http://sdwebx.worldbank.org/climateportal/ (accessed on 2 October 2010).
- Nakicenovic, N.; Swart, R. IPCC Special Report Emission Scenarios: Summary for Policymakers. A Special Report of IPCC Working Group III; Cambridge University Press: Cambridge, UK; New York, NY, USA, 2000; p. 27. [Google Scholar]
- Irrigation Development in Namibia: Green Scheme and Horticulture Initiative for Namibia—Cost/Benefit Analysis; Price Waterhouse Coopers: Windhoek, Namibia, 2005.
- Nantanga, K.; Mazambani, C.; Kruger, B. Small Scale Irrigation and Aquaculture in Central Northern Namibia; Unpublished Technical Report; Desert Research Foundation of Namibia: Windhoek, Namibia, 2007. [Google Scholar]
- OANDA Corporation. Online Currency Converter. 2011. Available online: http://www.oanda.com/ (accessed on 31 October 2011).
- Fewkes, A.; Butler, D. Simulating the performance of rainwater collection systems using behavioural models. Build. Serv. Eng. Res. Technol. 2000, 21, 99–106. [Google Scholar] [CrossRef]
- Campisano, A.; Nie, L.; Li, P. Retention performance of domestic rain water harvesting tank under climate change conditions. Appl. Mech. Mater. 2013, 438–439, 451–458. [Google Scholar]
- Lash, D.; Ward, S.; Kershaw, T.; Butler, D.; Eames, M. Robust rainwater harvesting: Probabilistic tank sizing for climate change adaptation. J. Water Climate Chang. 2014, 5, 526–539. [Google Scholar] [CrossRef] [Green Version]
© 2015 by the authors; licensee MDPI, Basel, Switzerland. This article is an open access article distributed under the terms and conditions of the Creative Commons Attribution license (http://creativecommons.org/licenses/by/4.0/).
Share and Cite
Woltersdorf, L.; Liehr, S.; Döll, P. Rainwater Harvesting for Small-Holder Horticulture in Namibia: Design of Garden Variants and Assessment of Climate Change Impacts and Adaptation. Water 2015, 7, 1402-1421. https://doi.org/10.3390/w7041402
Woltersdorf L, Liehr S, Döll P. Rainwater Harvesting for Small-Holder Horticulture in Namibia: Design of Garden Variants and Assessment of Climate Change Impacts and Adaptation. Water. 2015; 7(4):1402-1421. https://doi.org/10.3390/w7041402
Chicago/Turabian StyleWoltersdorf, Laura, Stefan Liehr, and Petra Döll. 2015. "Rainwater Harvesting for Small-Holder Horticulture in Namibia: Design of Garden Variants and Assessment of Climate Change Impacts and Adaptation" Water 7, no. 4: 1402-1421. https://doi.org/10.3390/w7041402