
Behavior of a Fully-Looped Drainage Network and the Corresponding Dendritic Networks


Abstract
:1. Introduction
2. Methodology
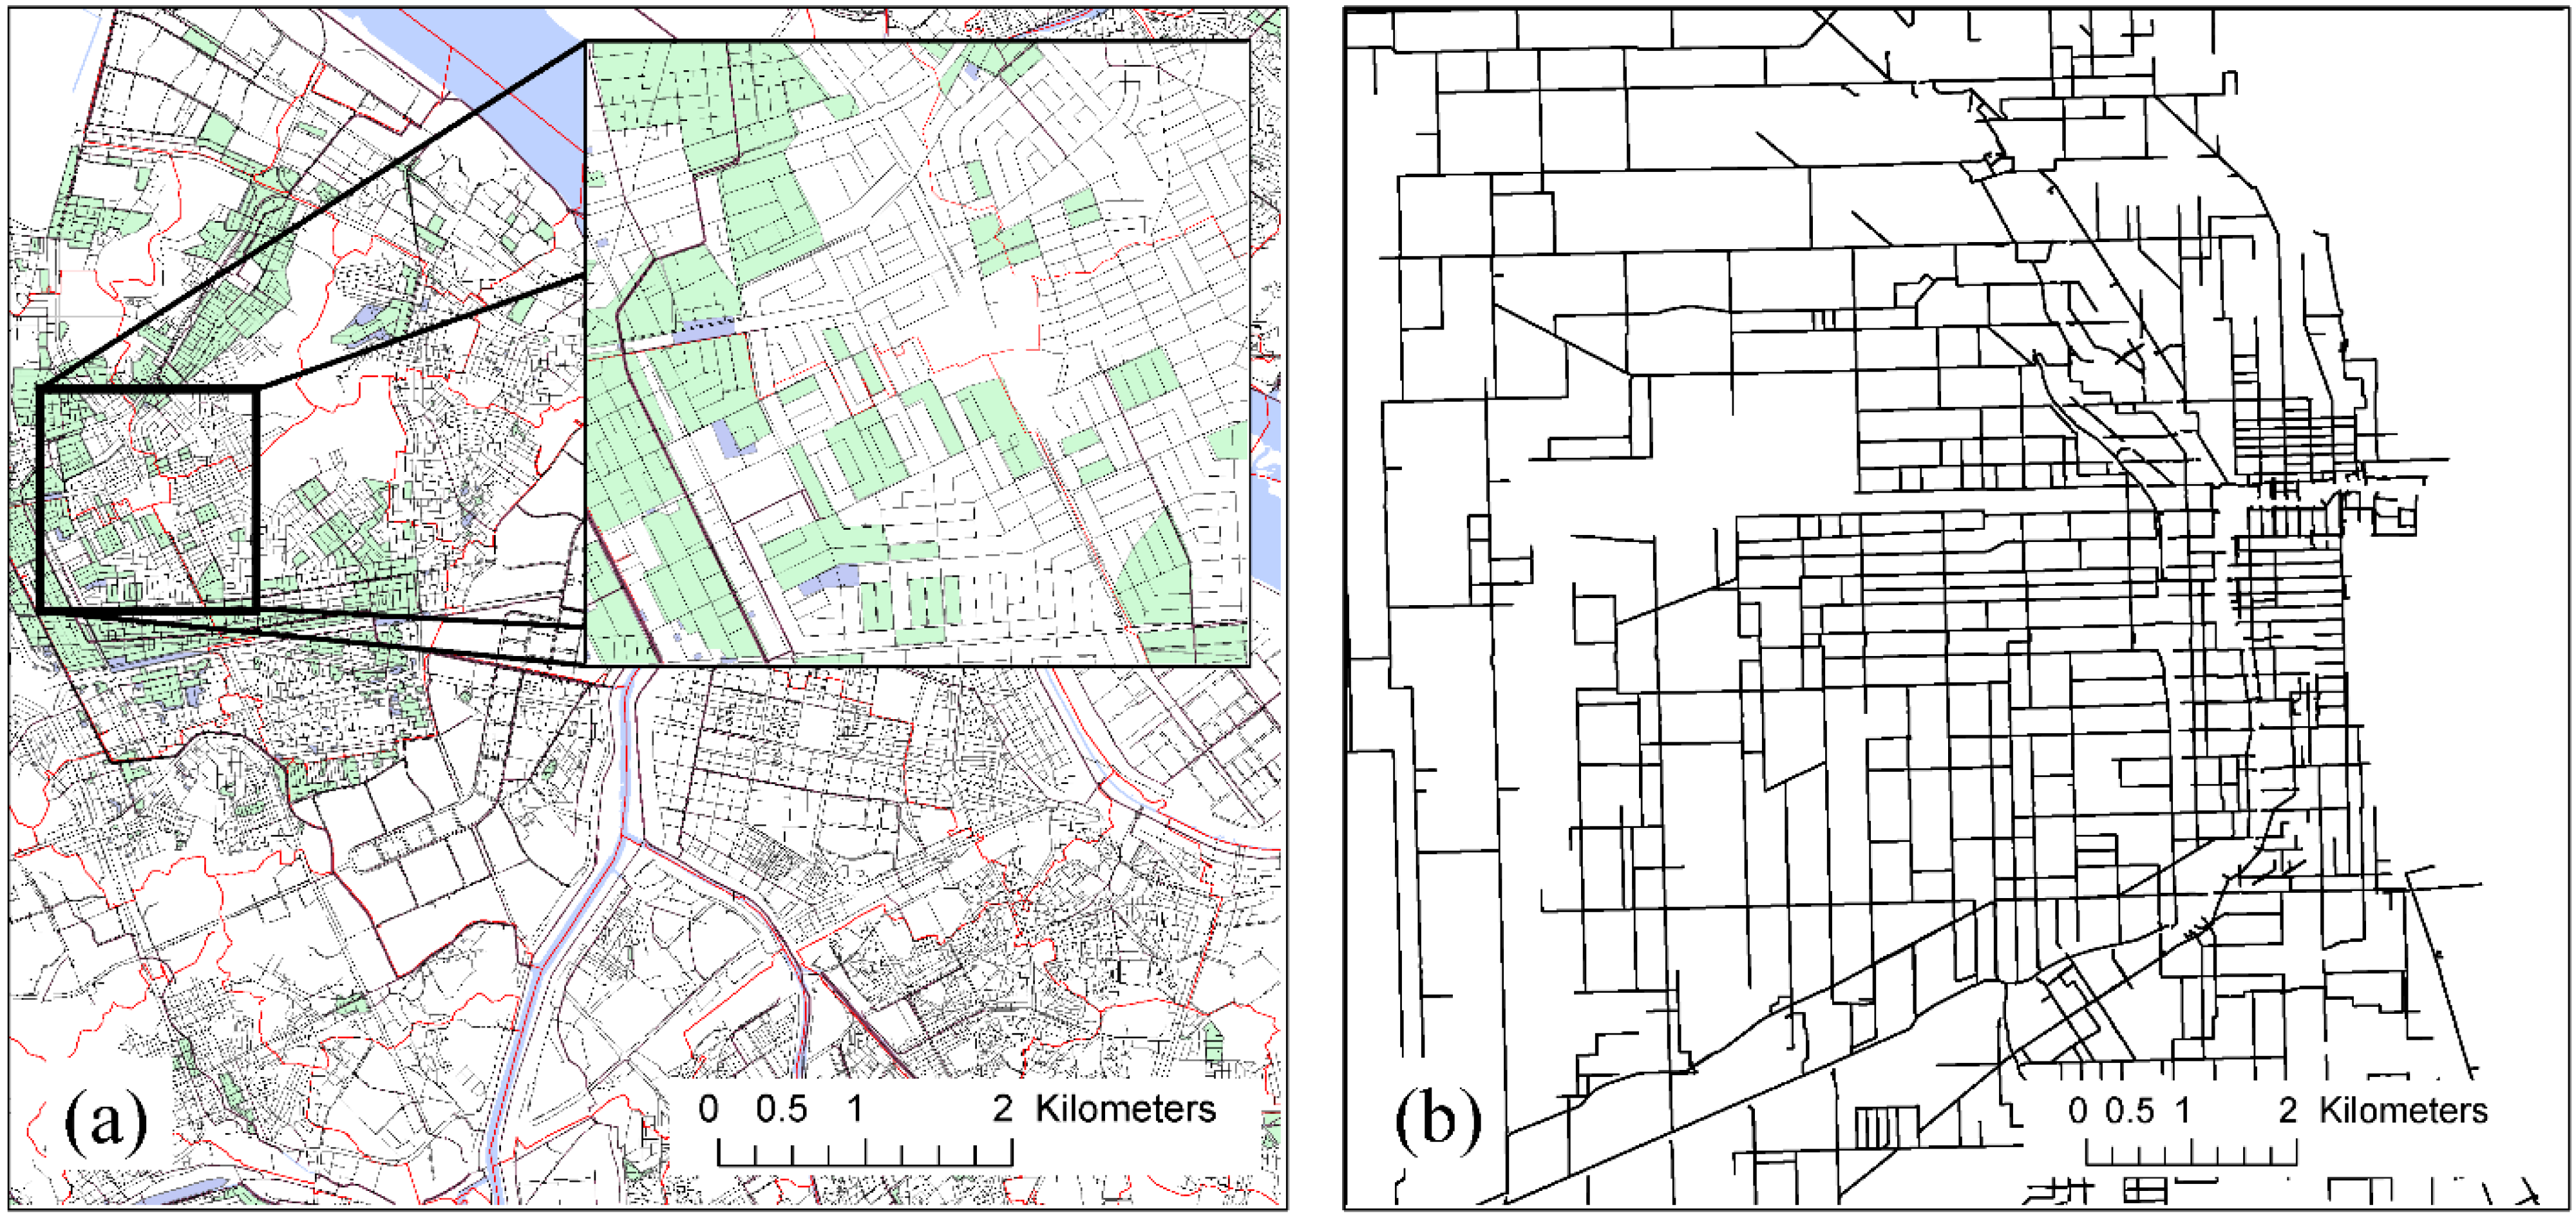
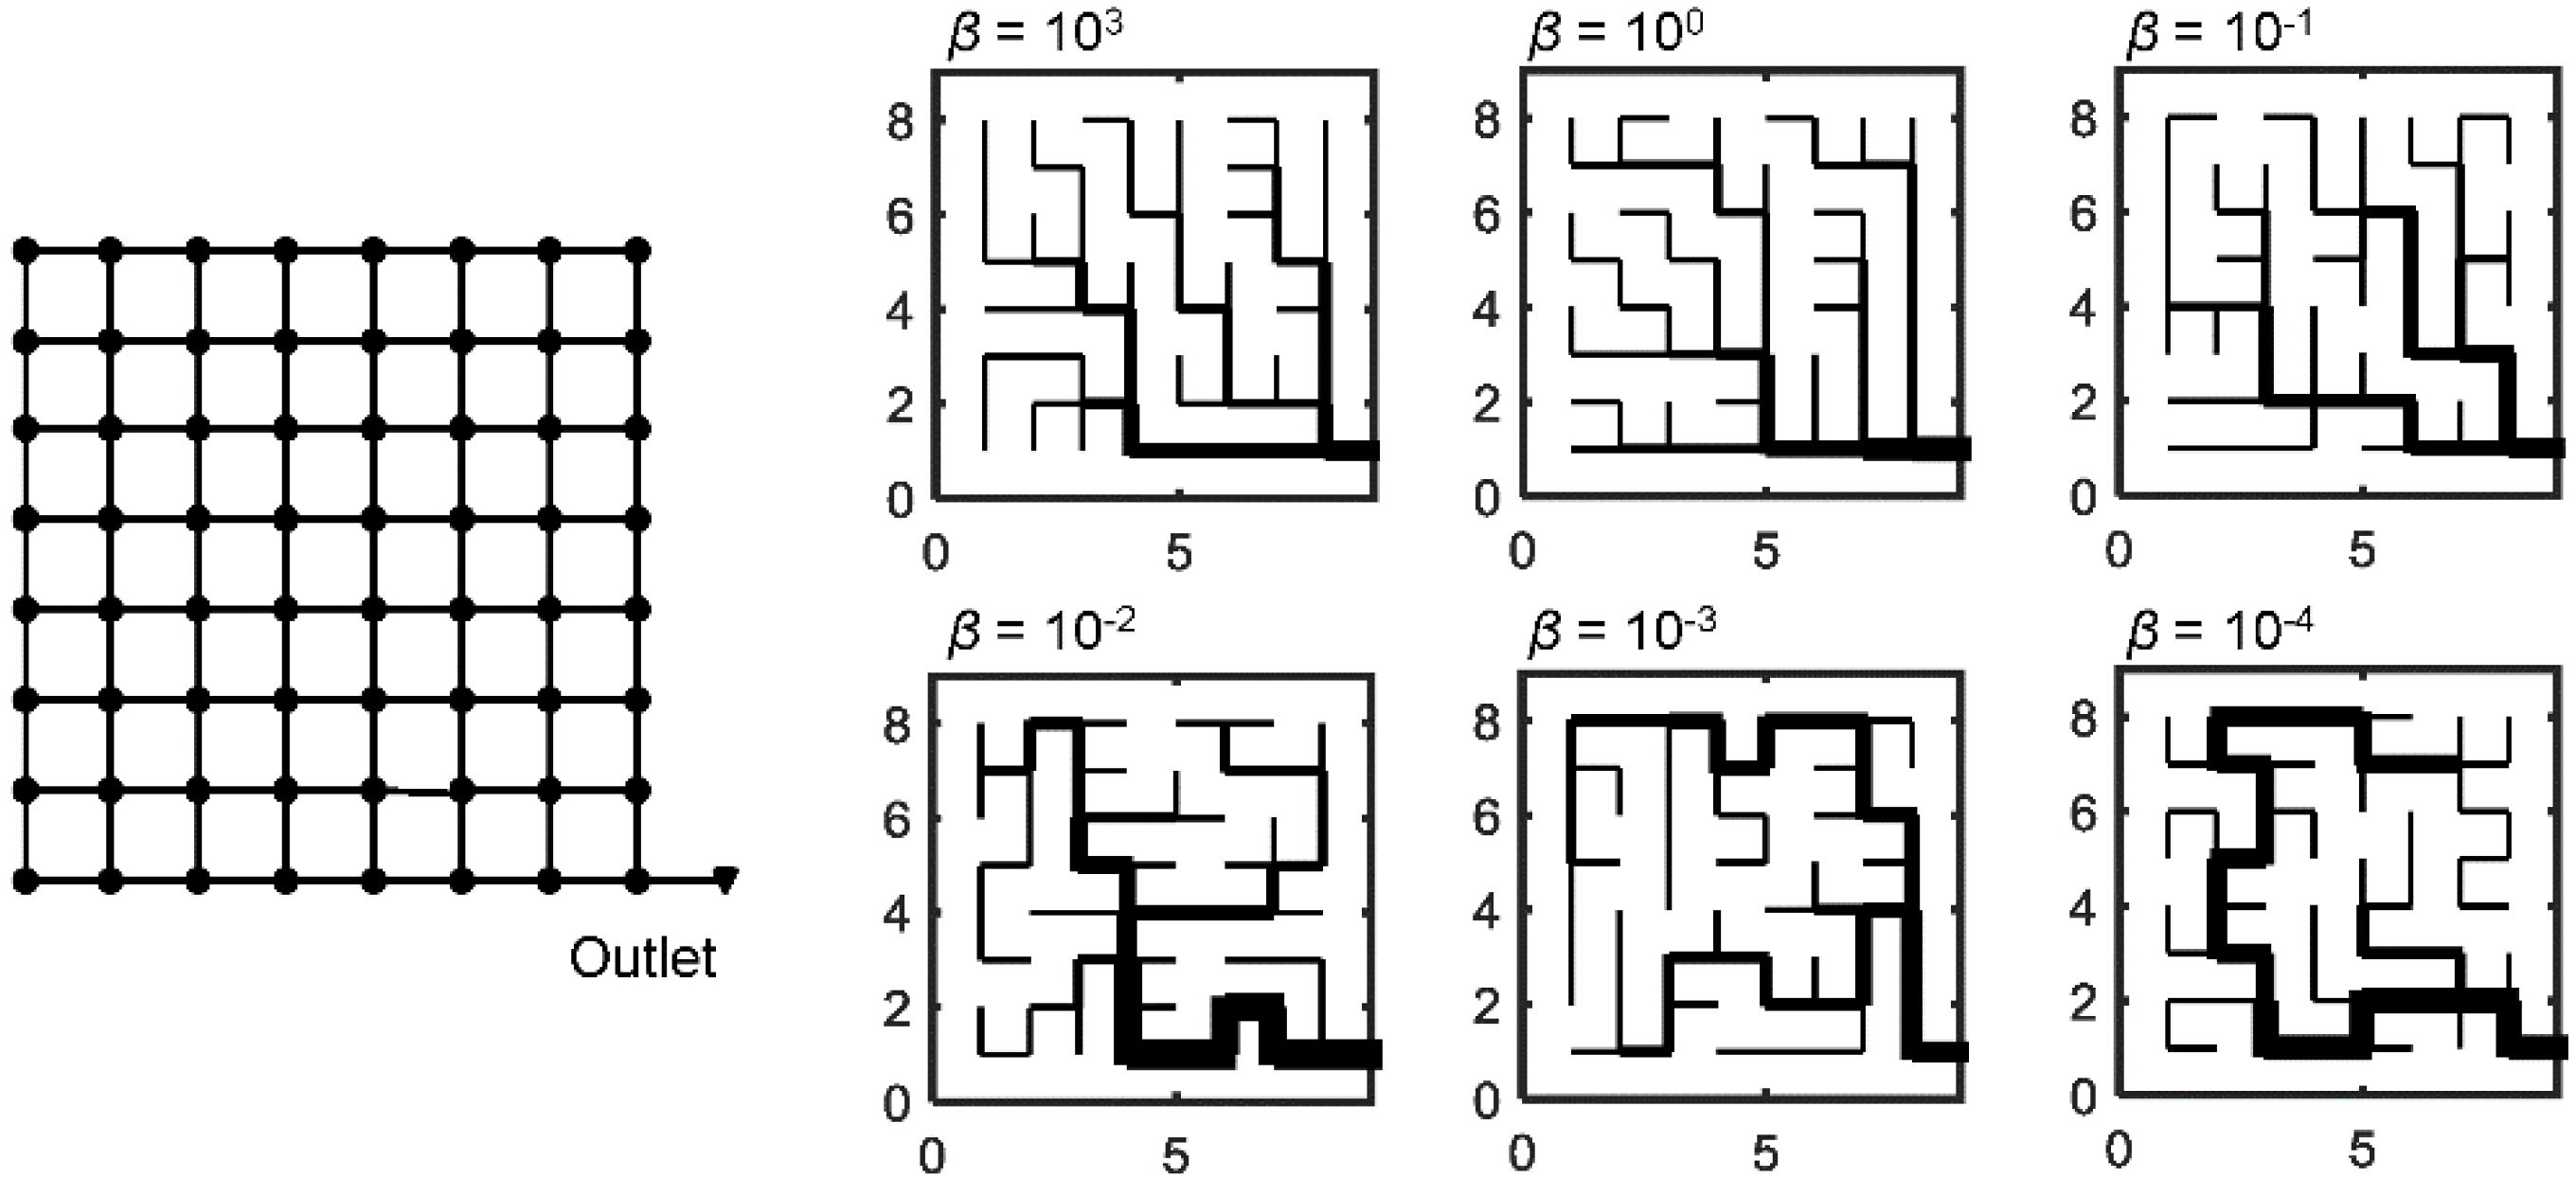
2.1. Synthetic Catchment and the Behavior of a Fully Looped Network
2.2. SWMM and Rainfall-Runoff Model Runs
3. Results and Discussion
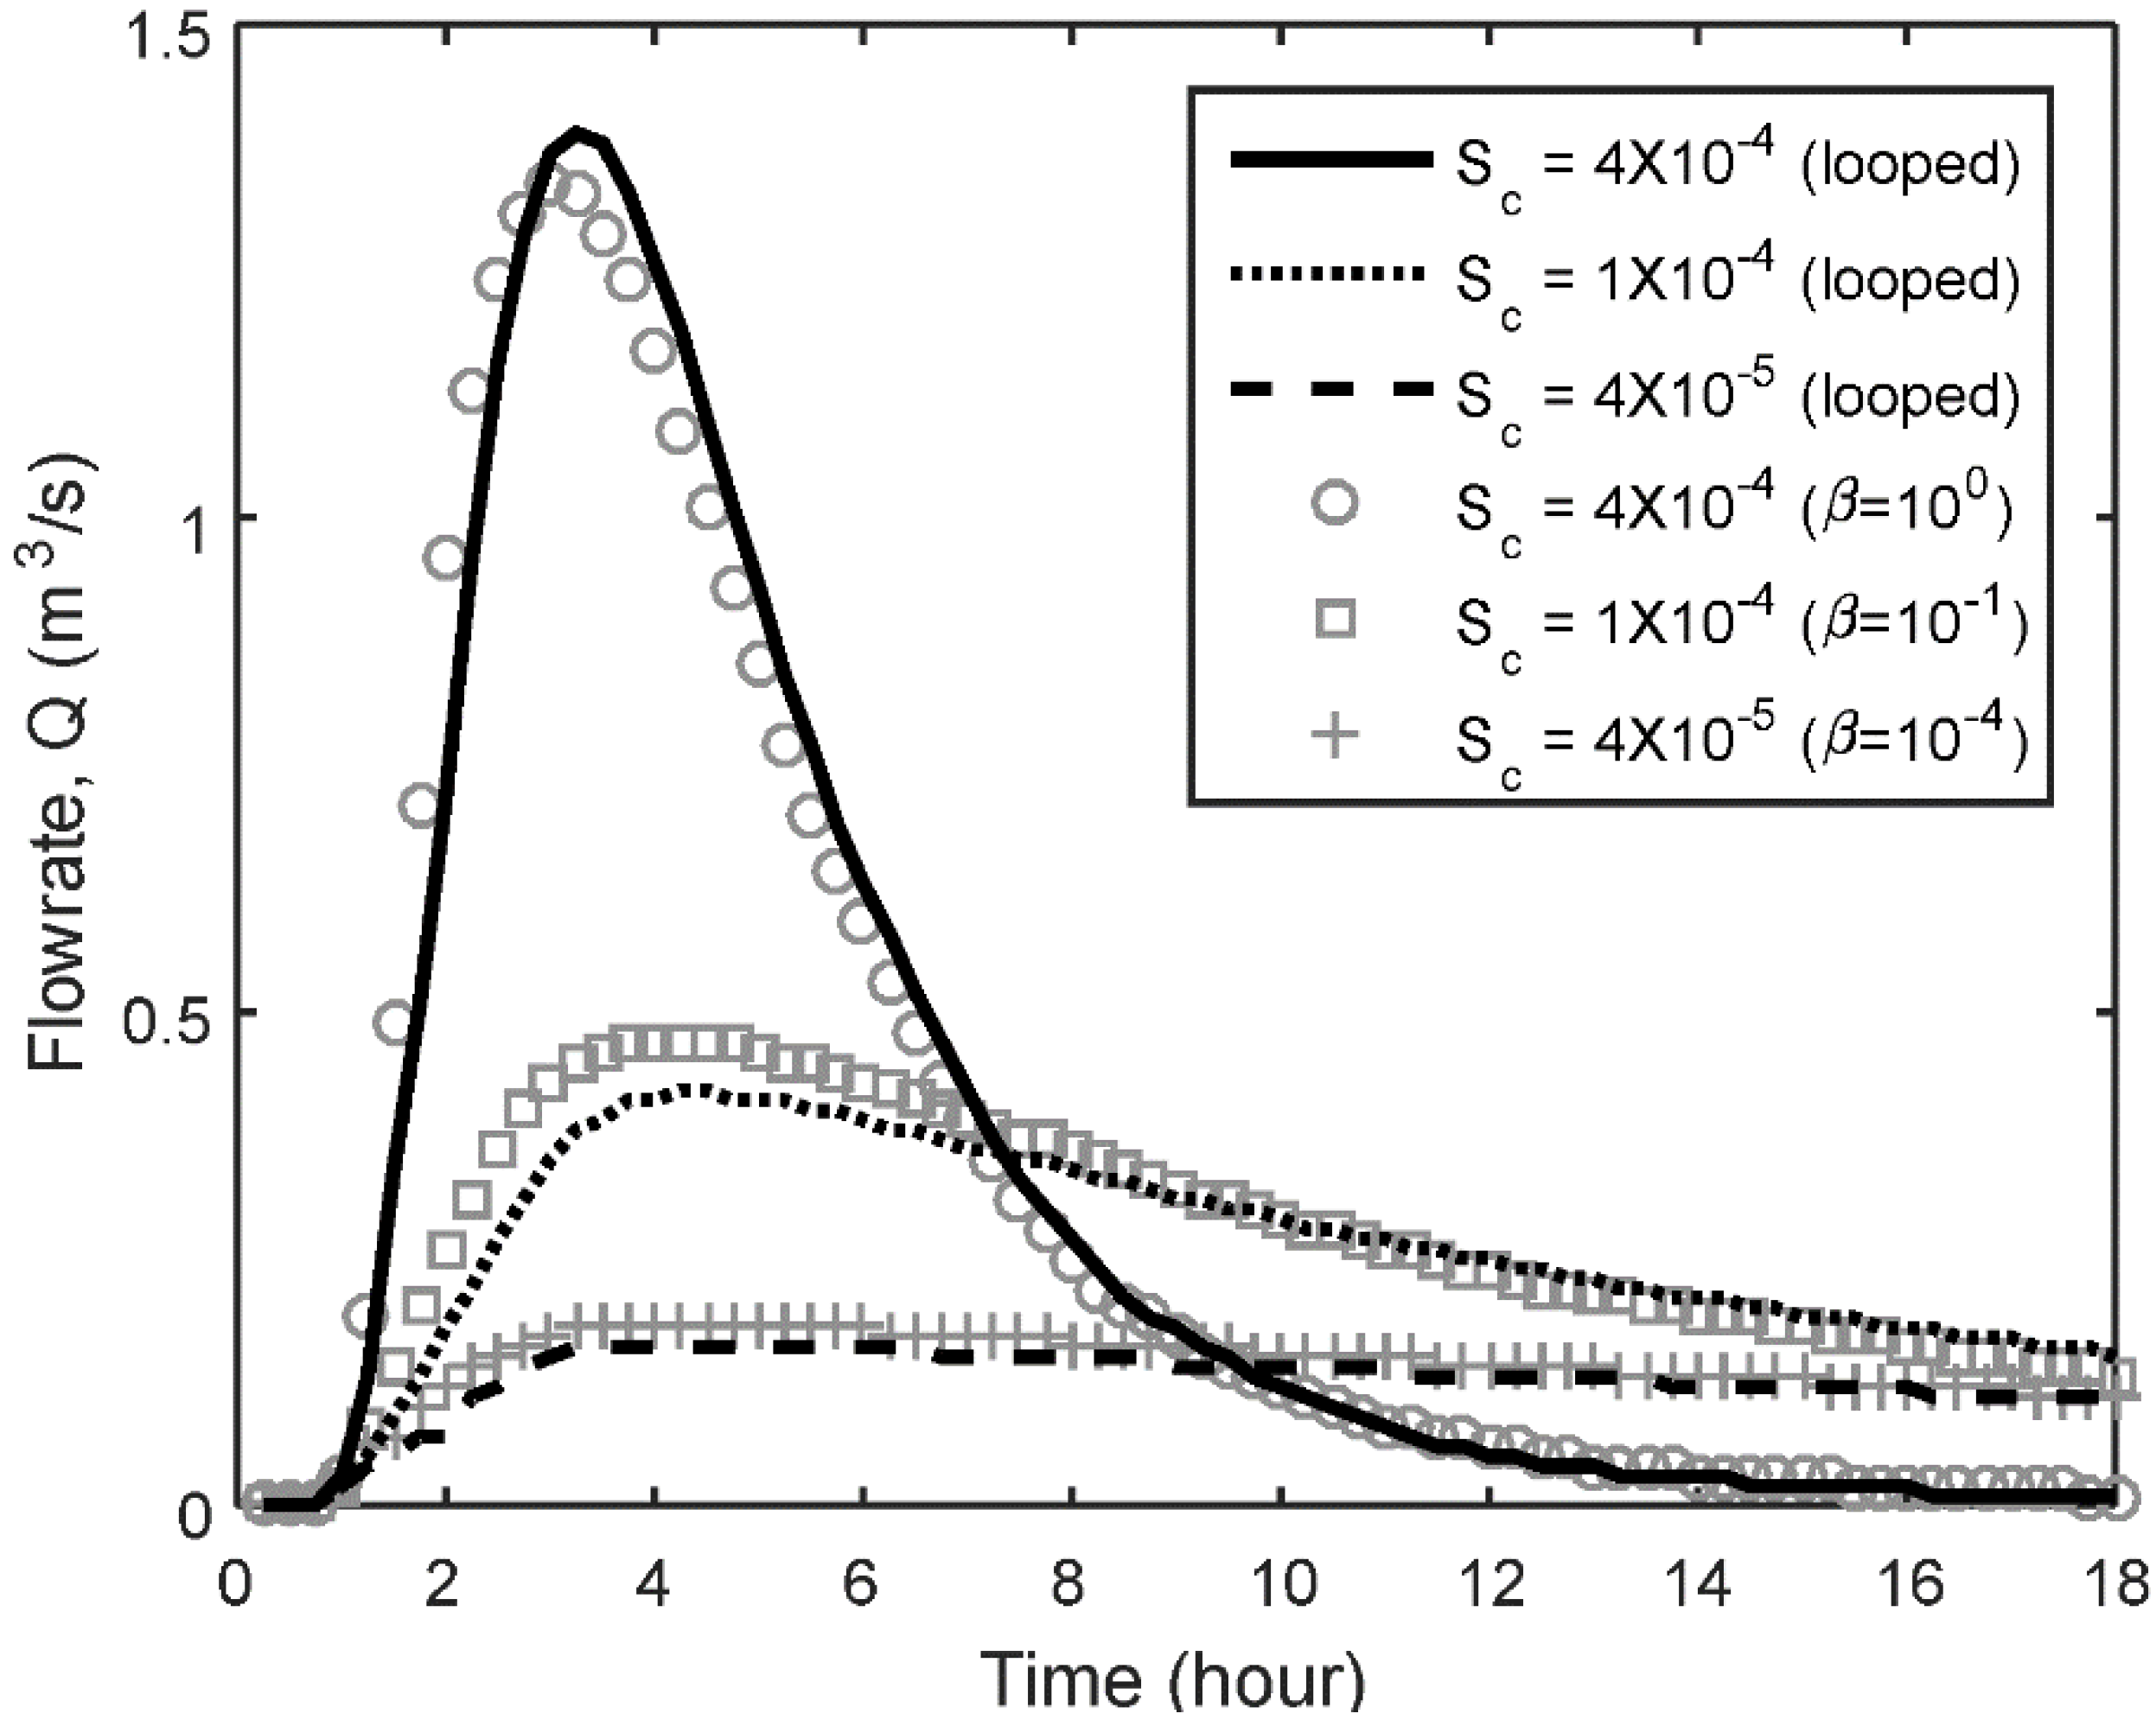
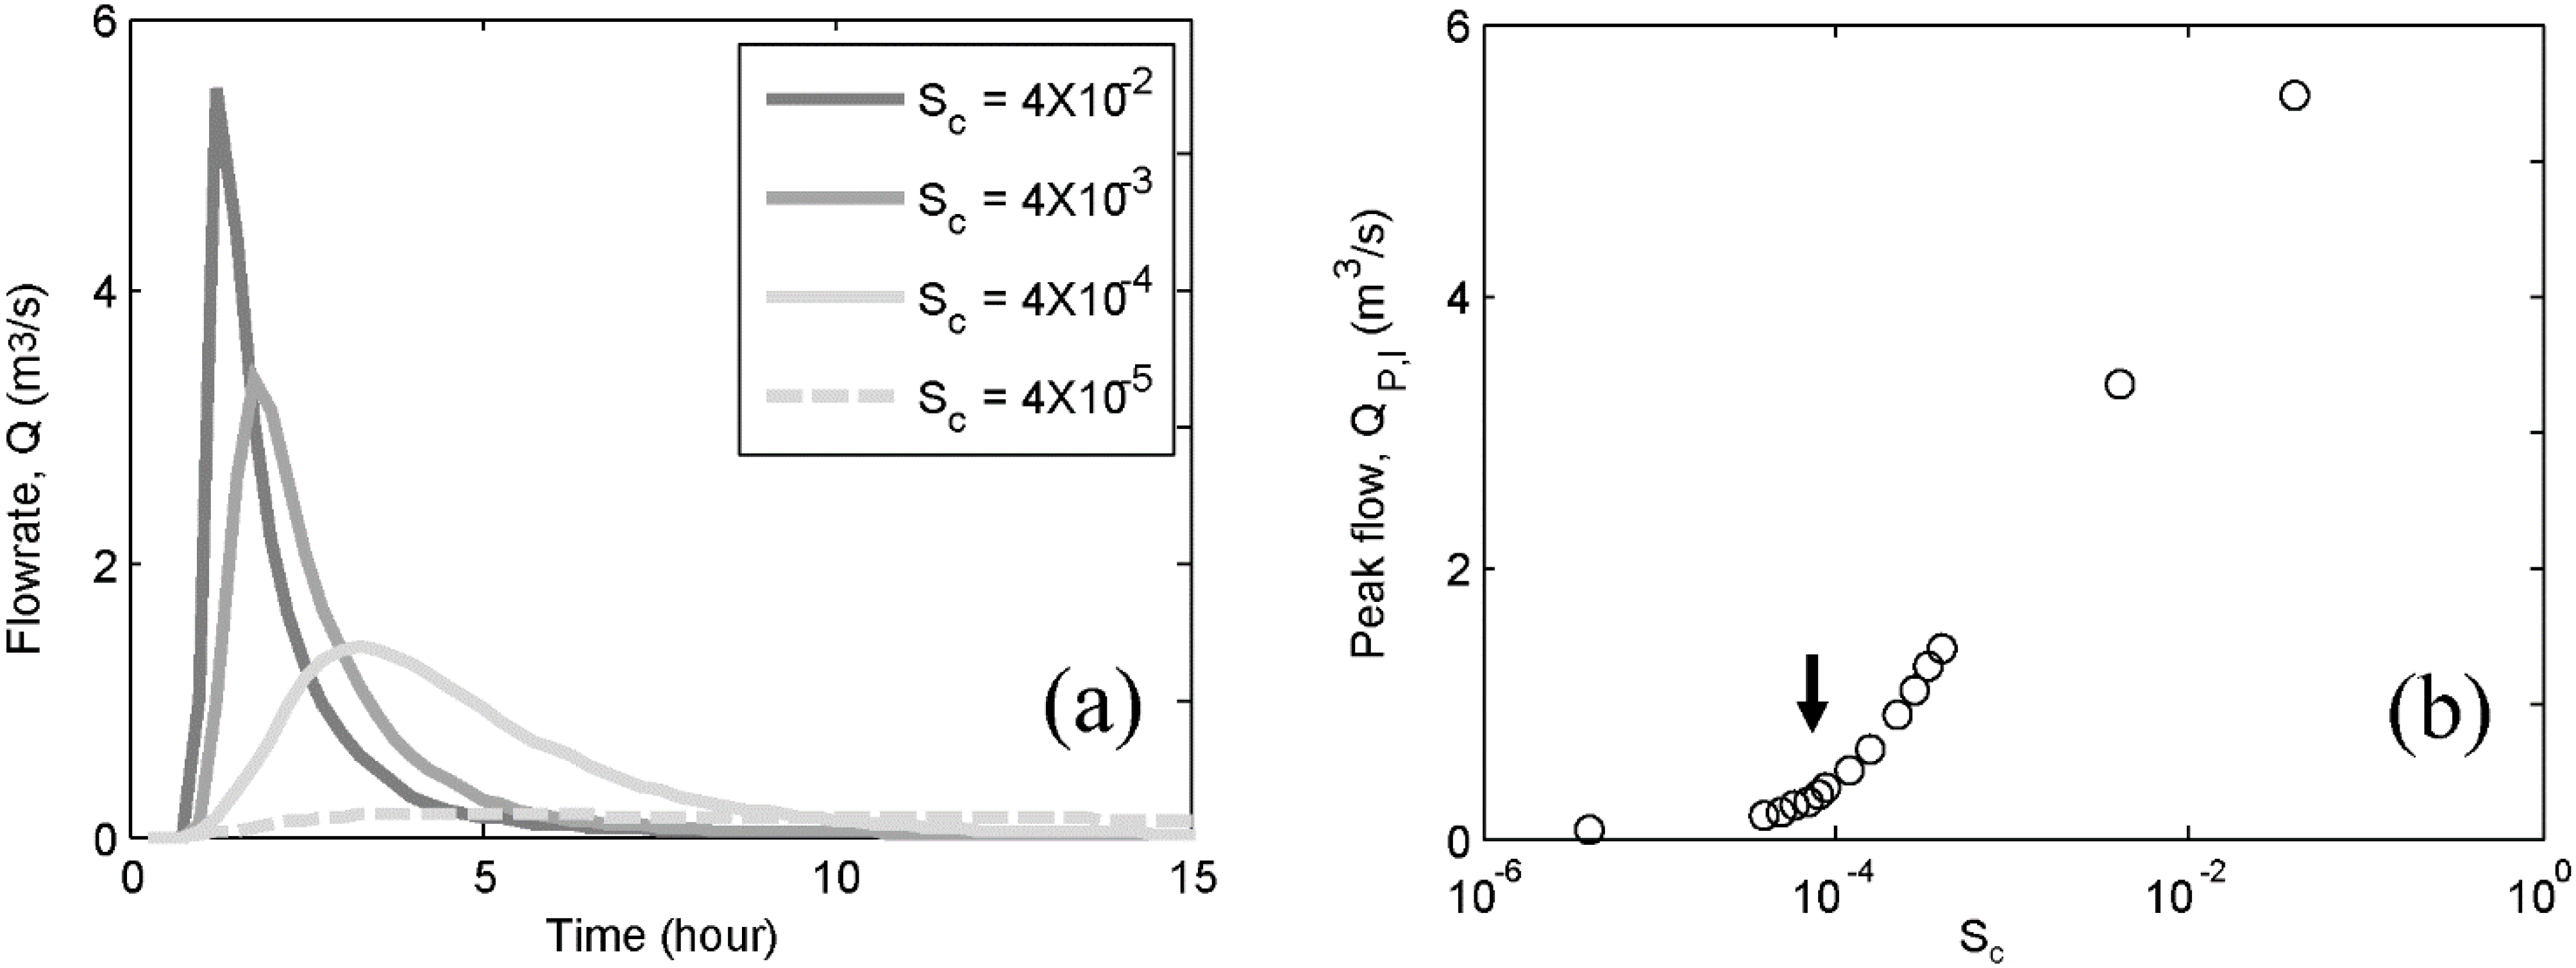
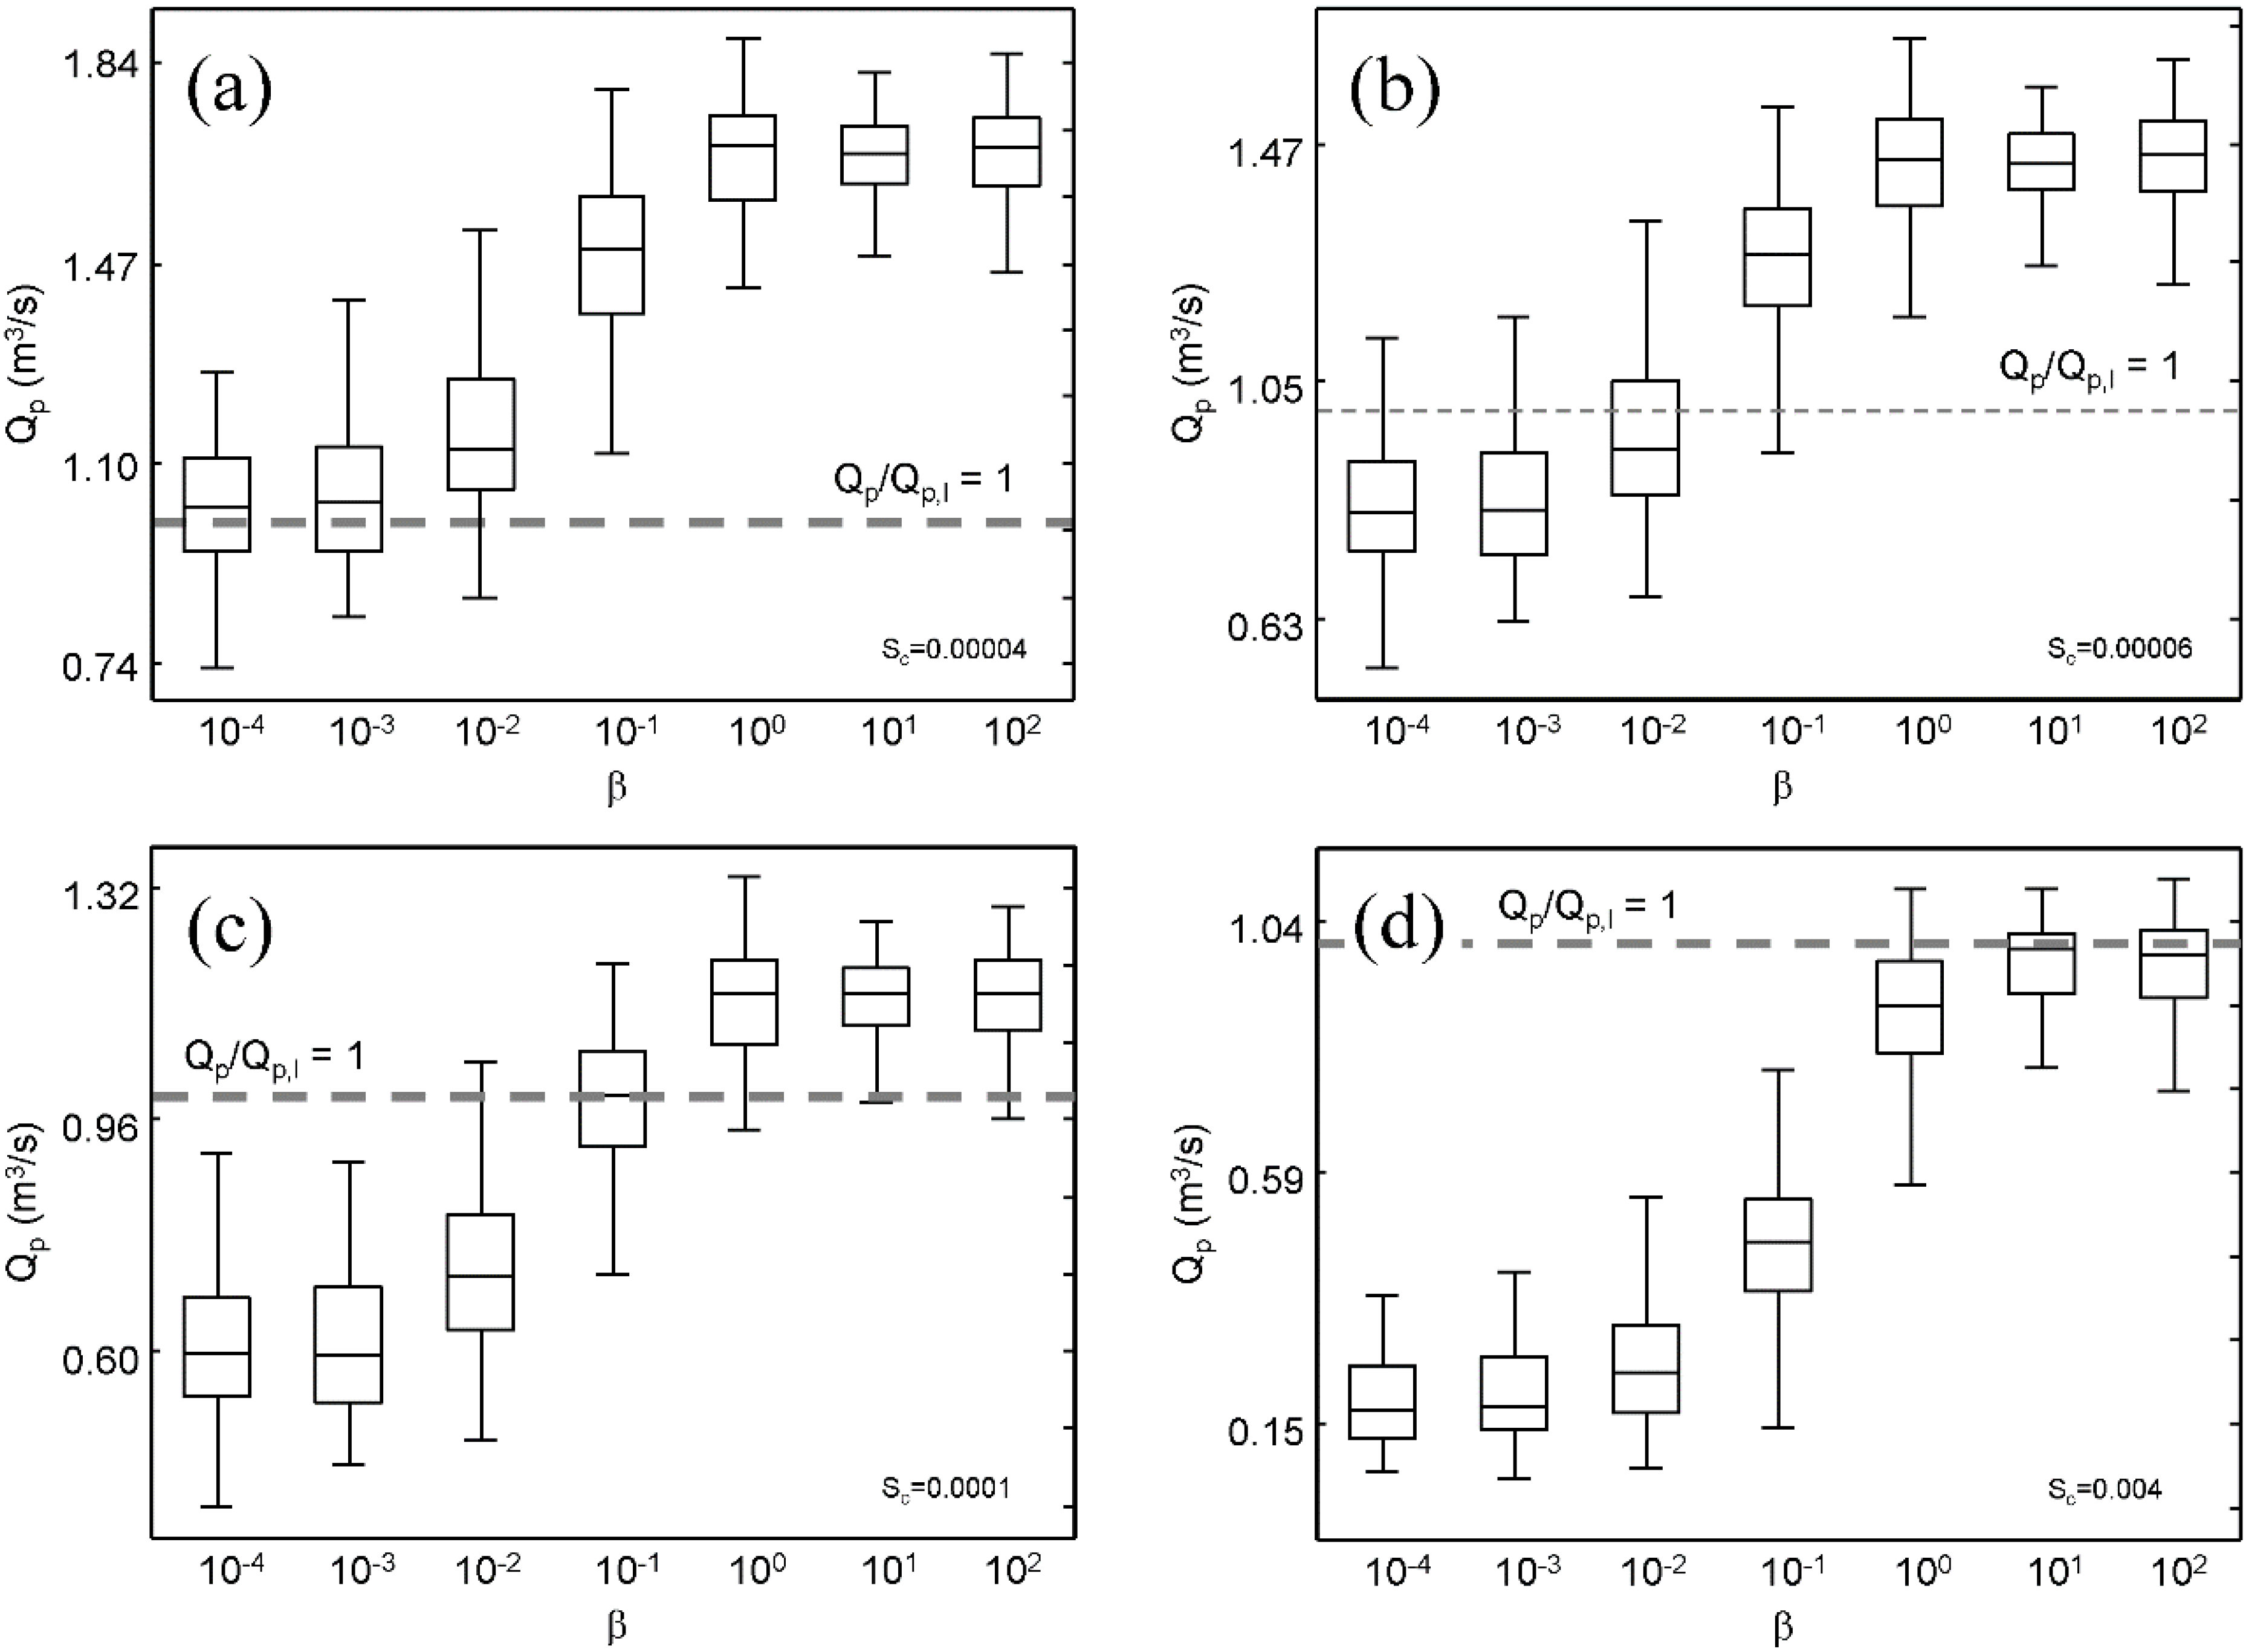
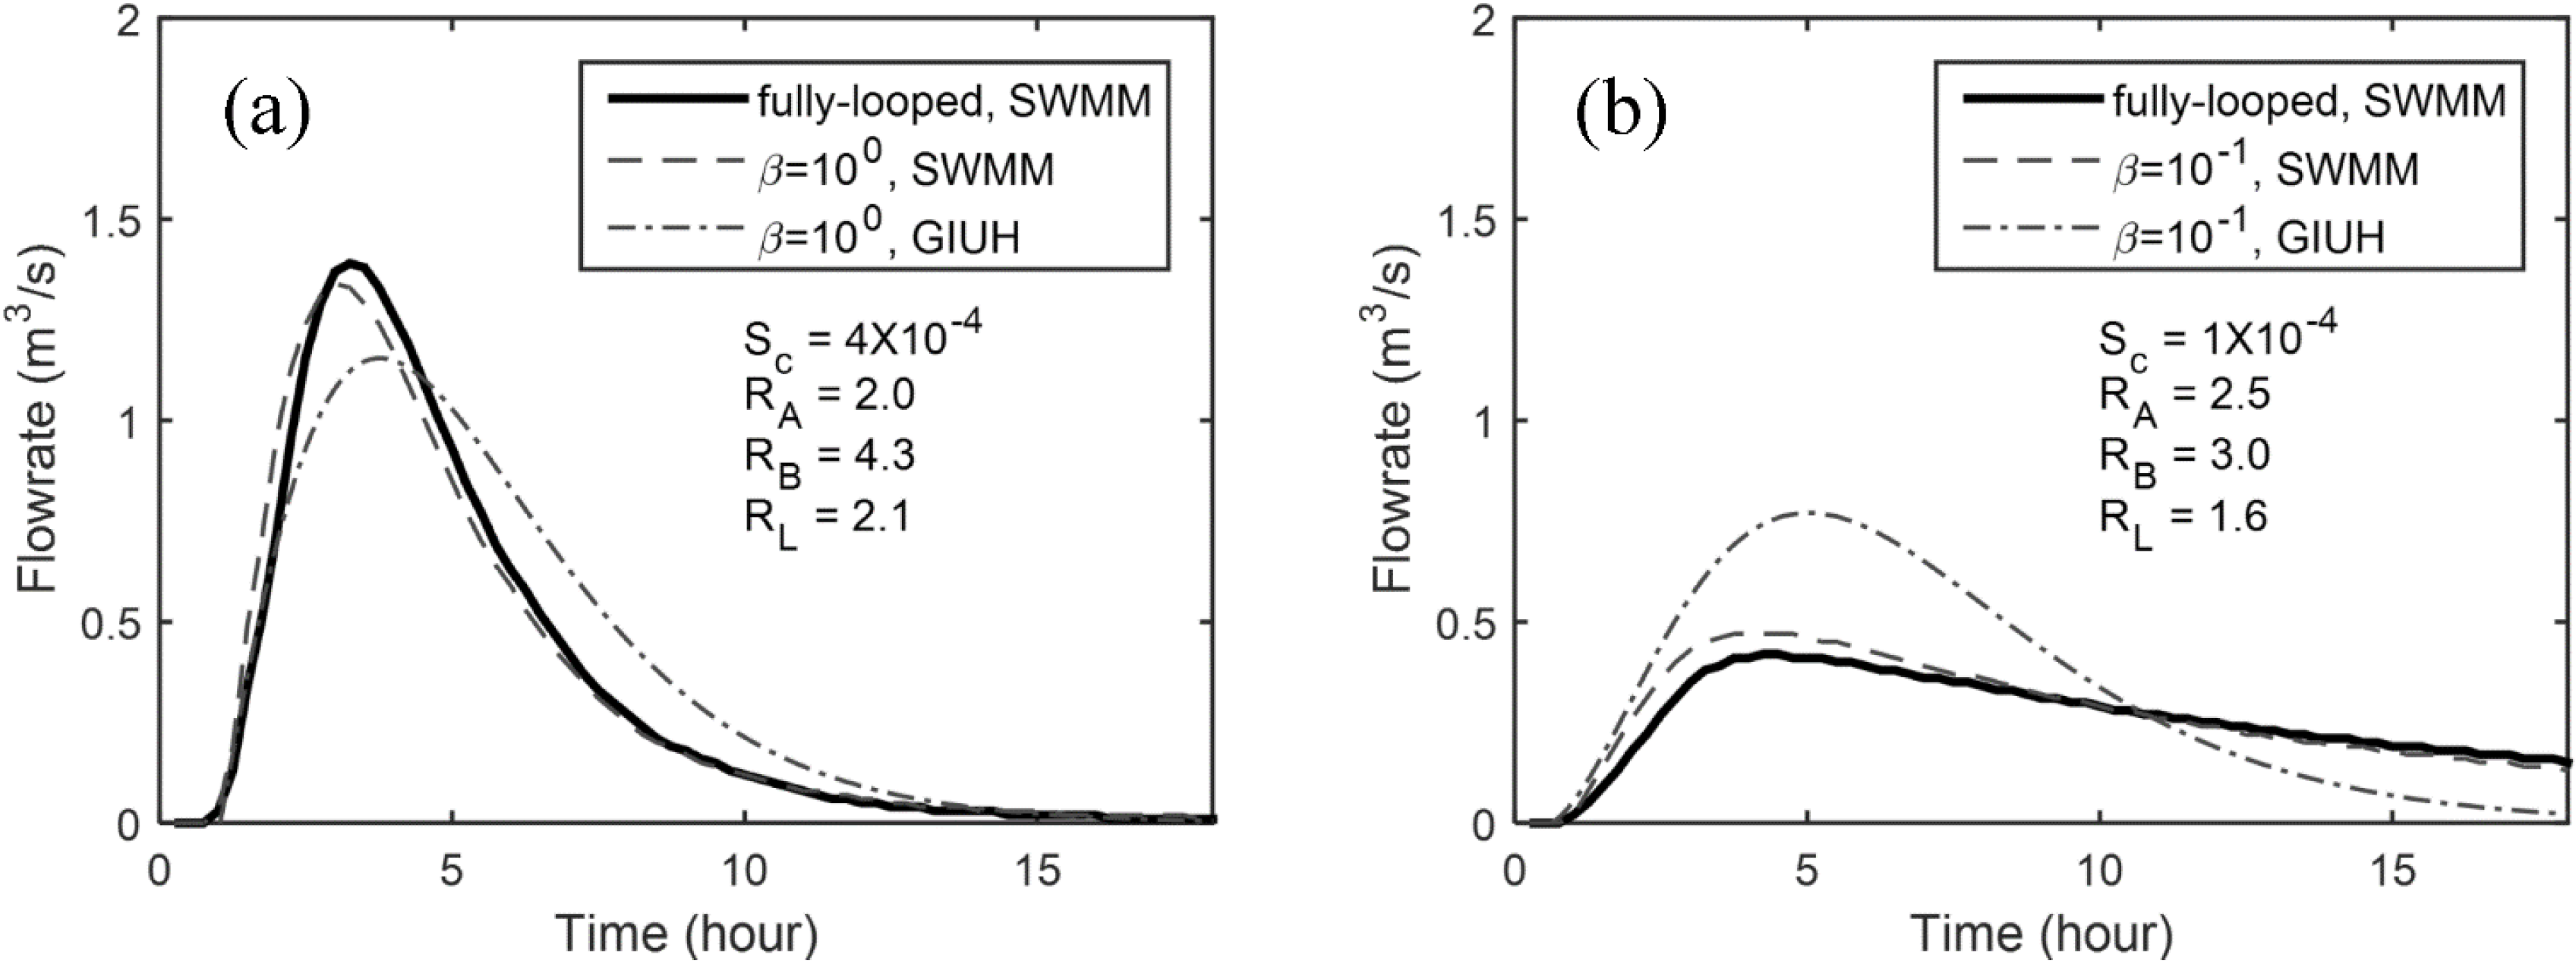
3.1. Behavior of the Fully Looped Drainage Network and a Corresponding Dendritic Network


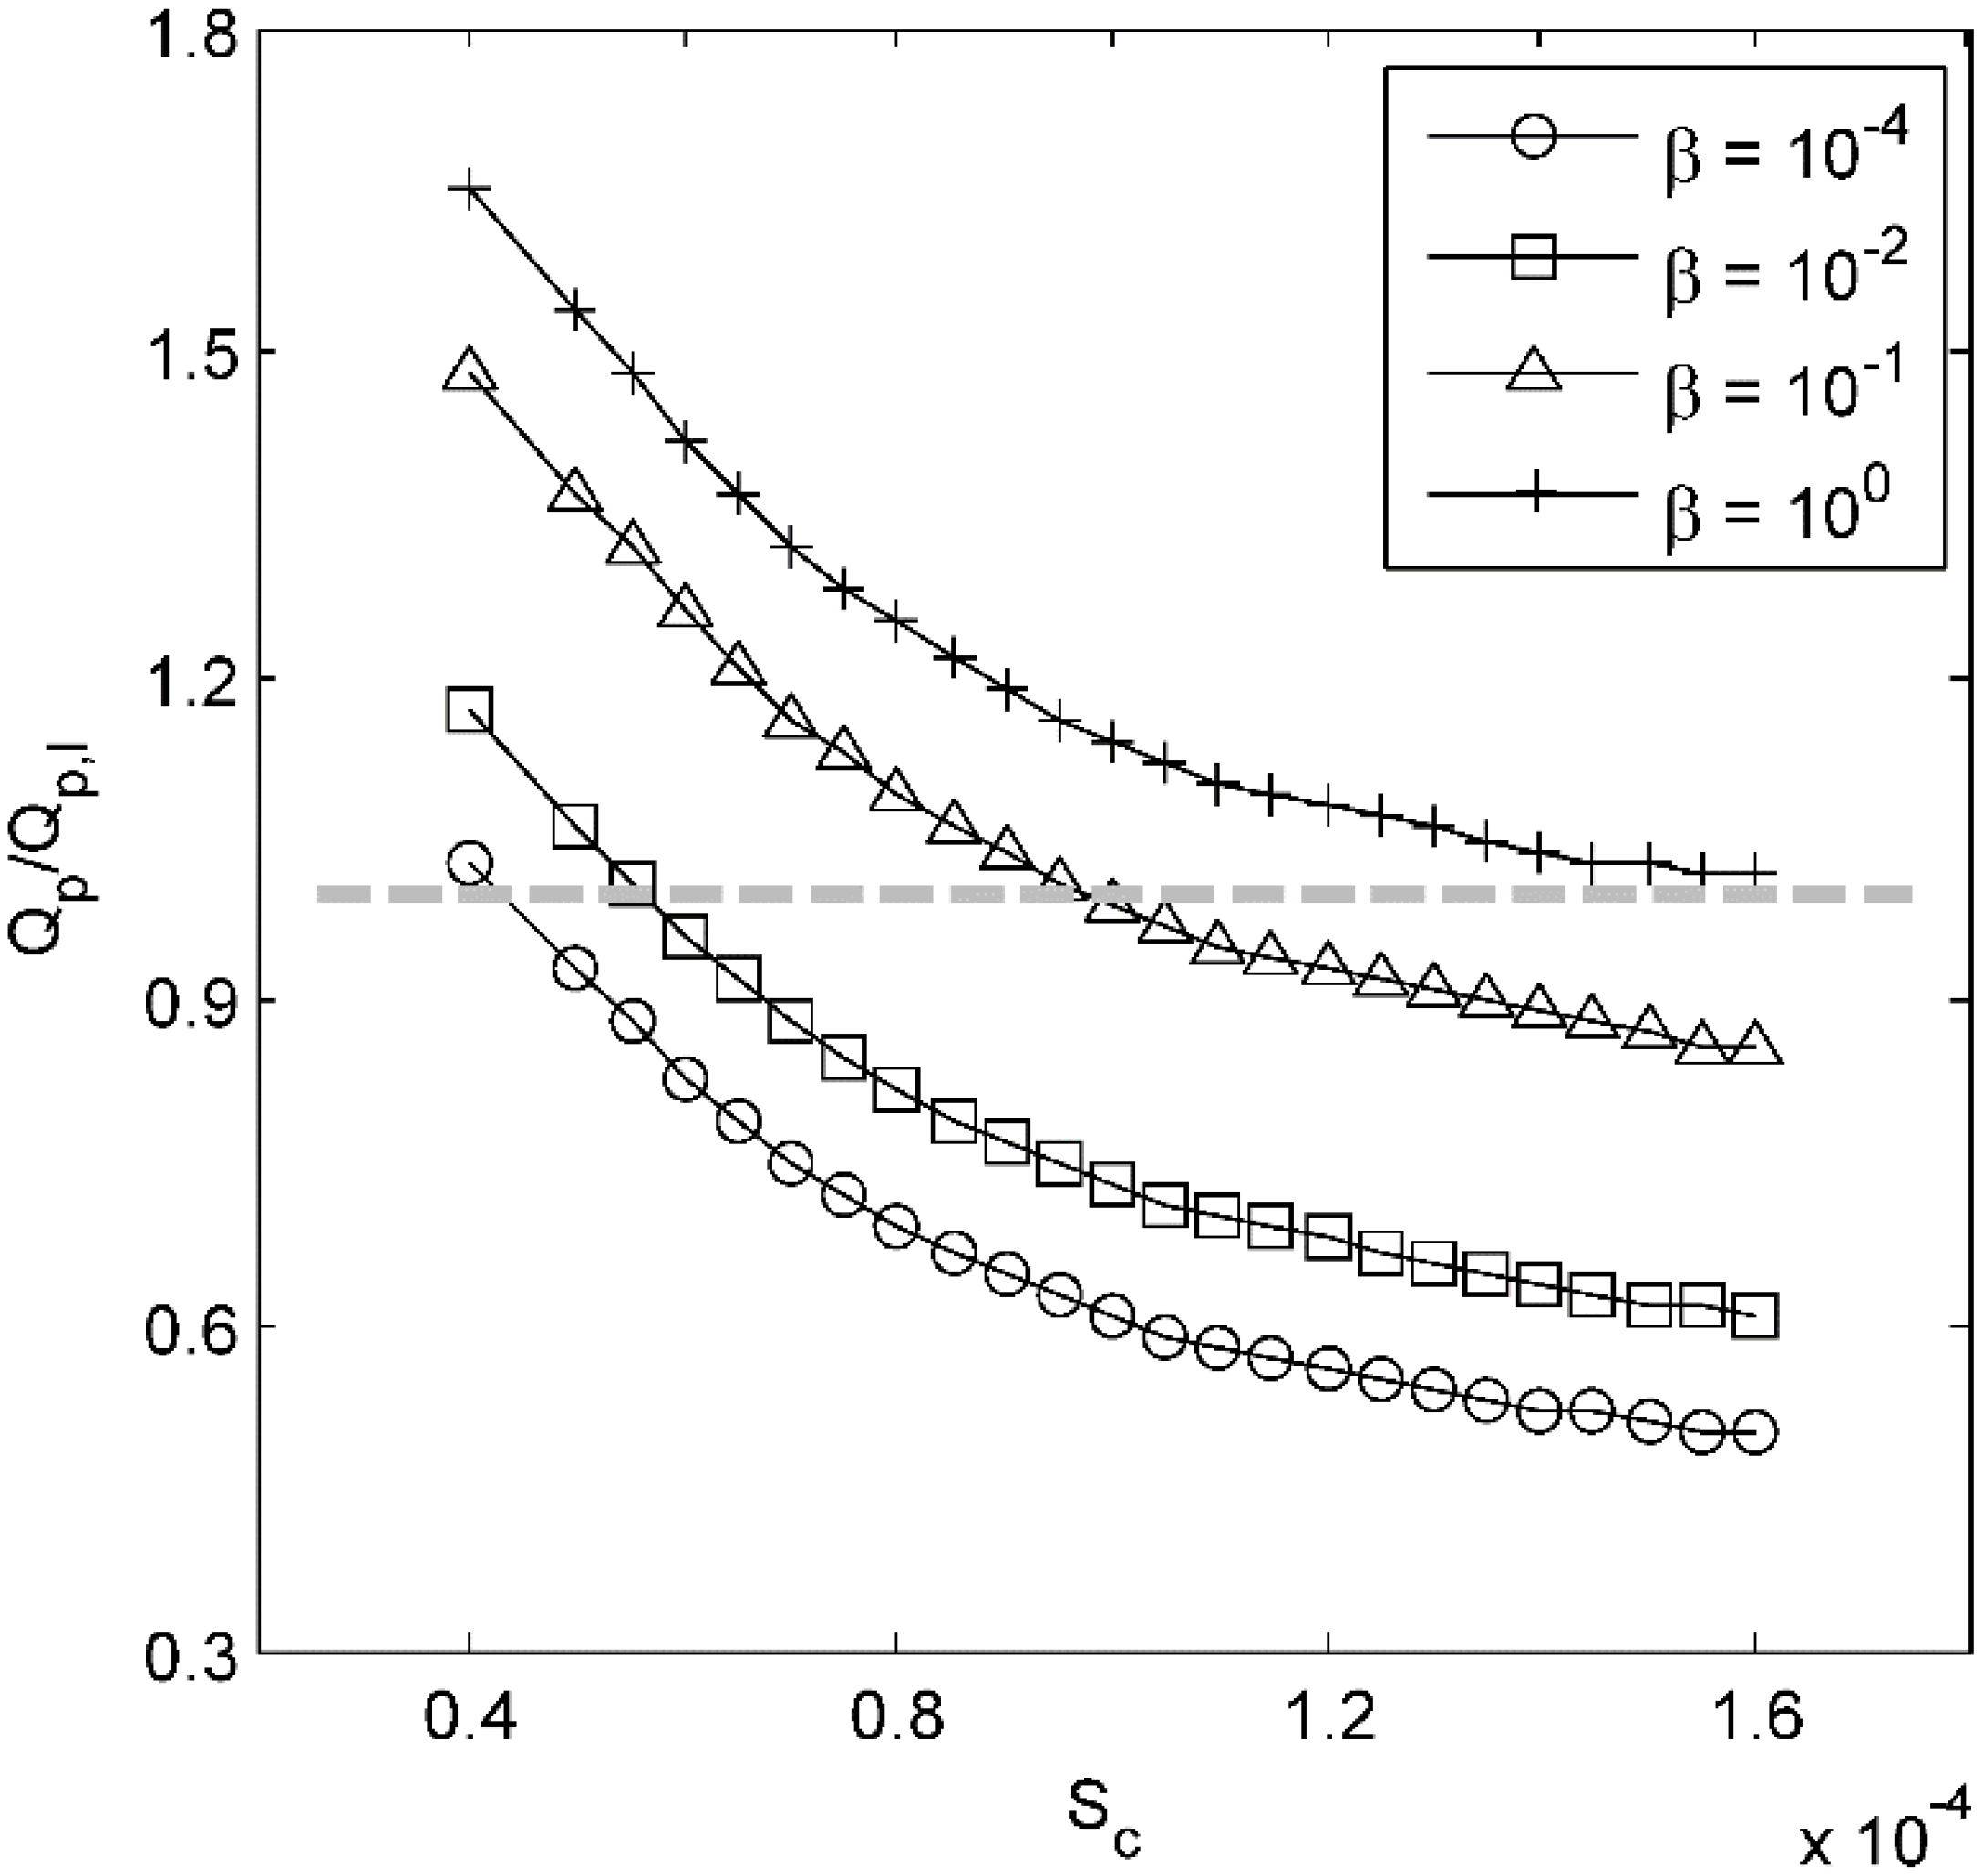
| Catchment Slope | Gibbs Model (β) | ||||||
|---|---|---|---|---|---|---|---|
| 10−4 | 10−3 | 10−2 | 10−1 | 100 | 101 | 102 | |
| 4.00 × 10⁻⁵ | 1.03 | 1.06 | 1.17 | 1.48 | 1.65 | 1.66 | 1.66 |
| 5.00 × 10⁻⁵ | 0.93 | 0.96 | 1.06 | 1.37 | 1.54 | 1.54 | 1.55 |
| 6.00 × 10⁻⁵ | 0.83 | 0.86 | 0.96 | 1.26 | 1.42 | 1.43 | 1.43 |
| 7.00 × 10⁻⁵ | 0.75 | 0.78 | 0.88 | 1.16 | 1.32 | 1.33 | 1.33 |
| 8.00 × 10⁻⁵ | 0.69 | 0.72 | 0.82 | 1.09 | 1.25 | 1.26 | 1.26 |
| 9.00 × 10⁻⁵ | 0.65 | 0.67 | 0.77 | 1.04 | 1.19 | 1.20 | 1.20 |
| 1.00 × 10⁻⁵ | 0.61 | 0.63 | 0.73 | 0.99 | 1.14 | 1.15 | 1.15 |
| 1.10 × 10⁻⁵ | 0.58 | 0.60 | 0.70 | 0.95 | 1.10 | 1.11 | 1.11 |
| 1.20 × 10⁻⁵ | 0.56 | 0.58 | 0.68 | 0.93 | 1.08 | 1.09 | 1.09 |
| 1.30 × 10⁻⁵ | 0.54 | 0.56 | 0.66 | 0.91 | 1.06 | 1.07 | 1.07 |
| 1.40 × 10⁻⁵ | 0.52 | 0.54 | 0.64 | 0.89 | 1.04 | 1.05 | 1.05 |
| 1.50 × 10⁻⁵ | 0.51 | 0.53 | 0.62 | 0.87 | 1.03 | 1.04 | 1.04 |
| 1.60 × 10⁻⁵ | 0.50 | 0.51 | 0.61 | 0.86 | 1.02 | 1.02 | 1.02 |

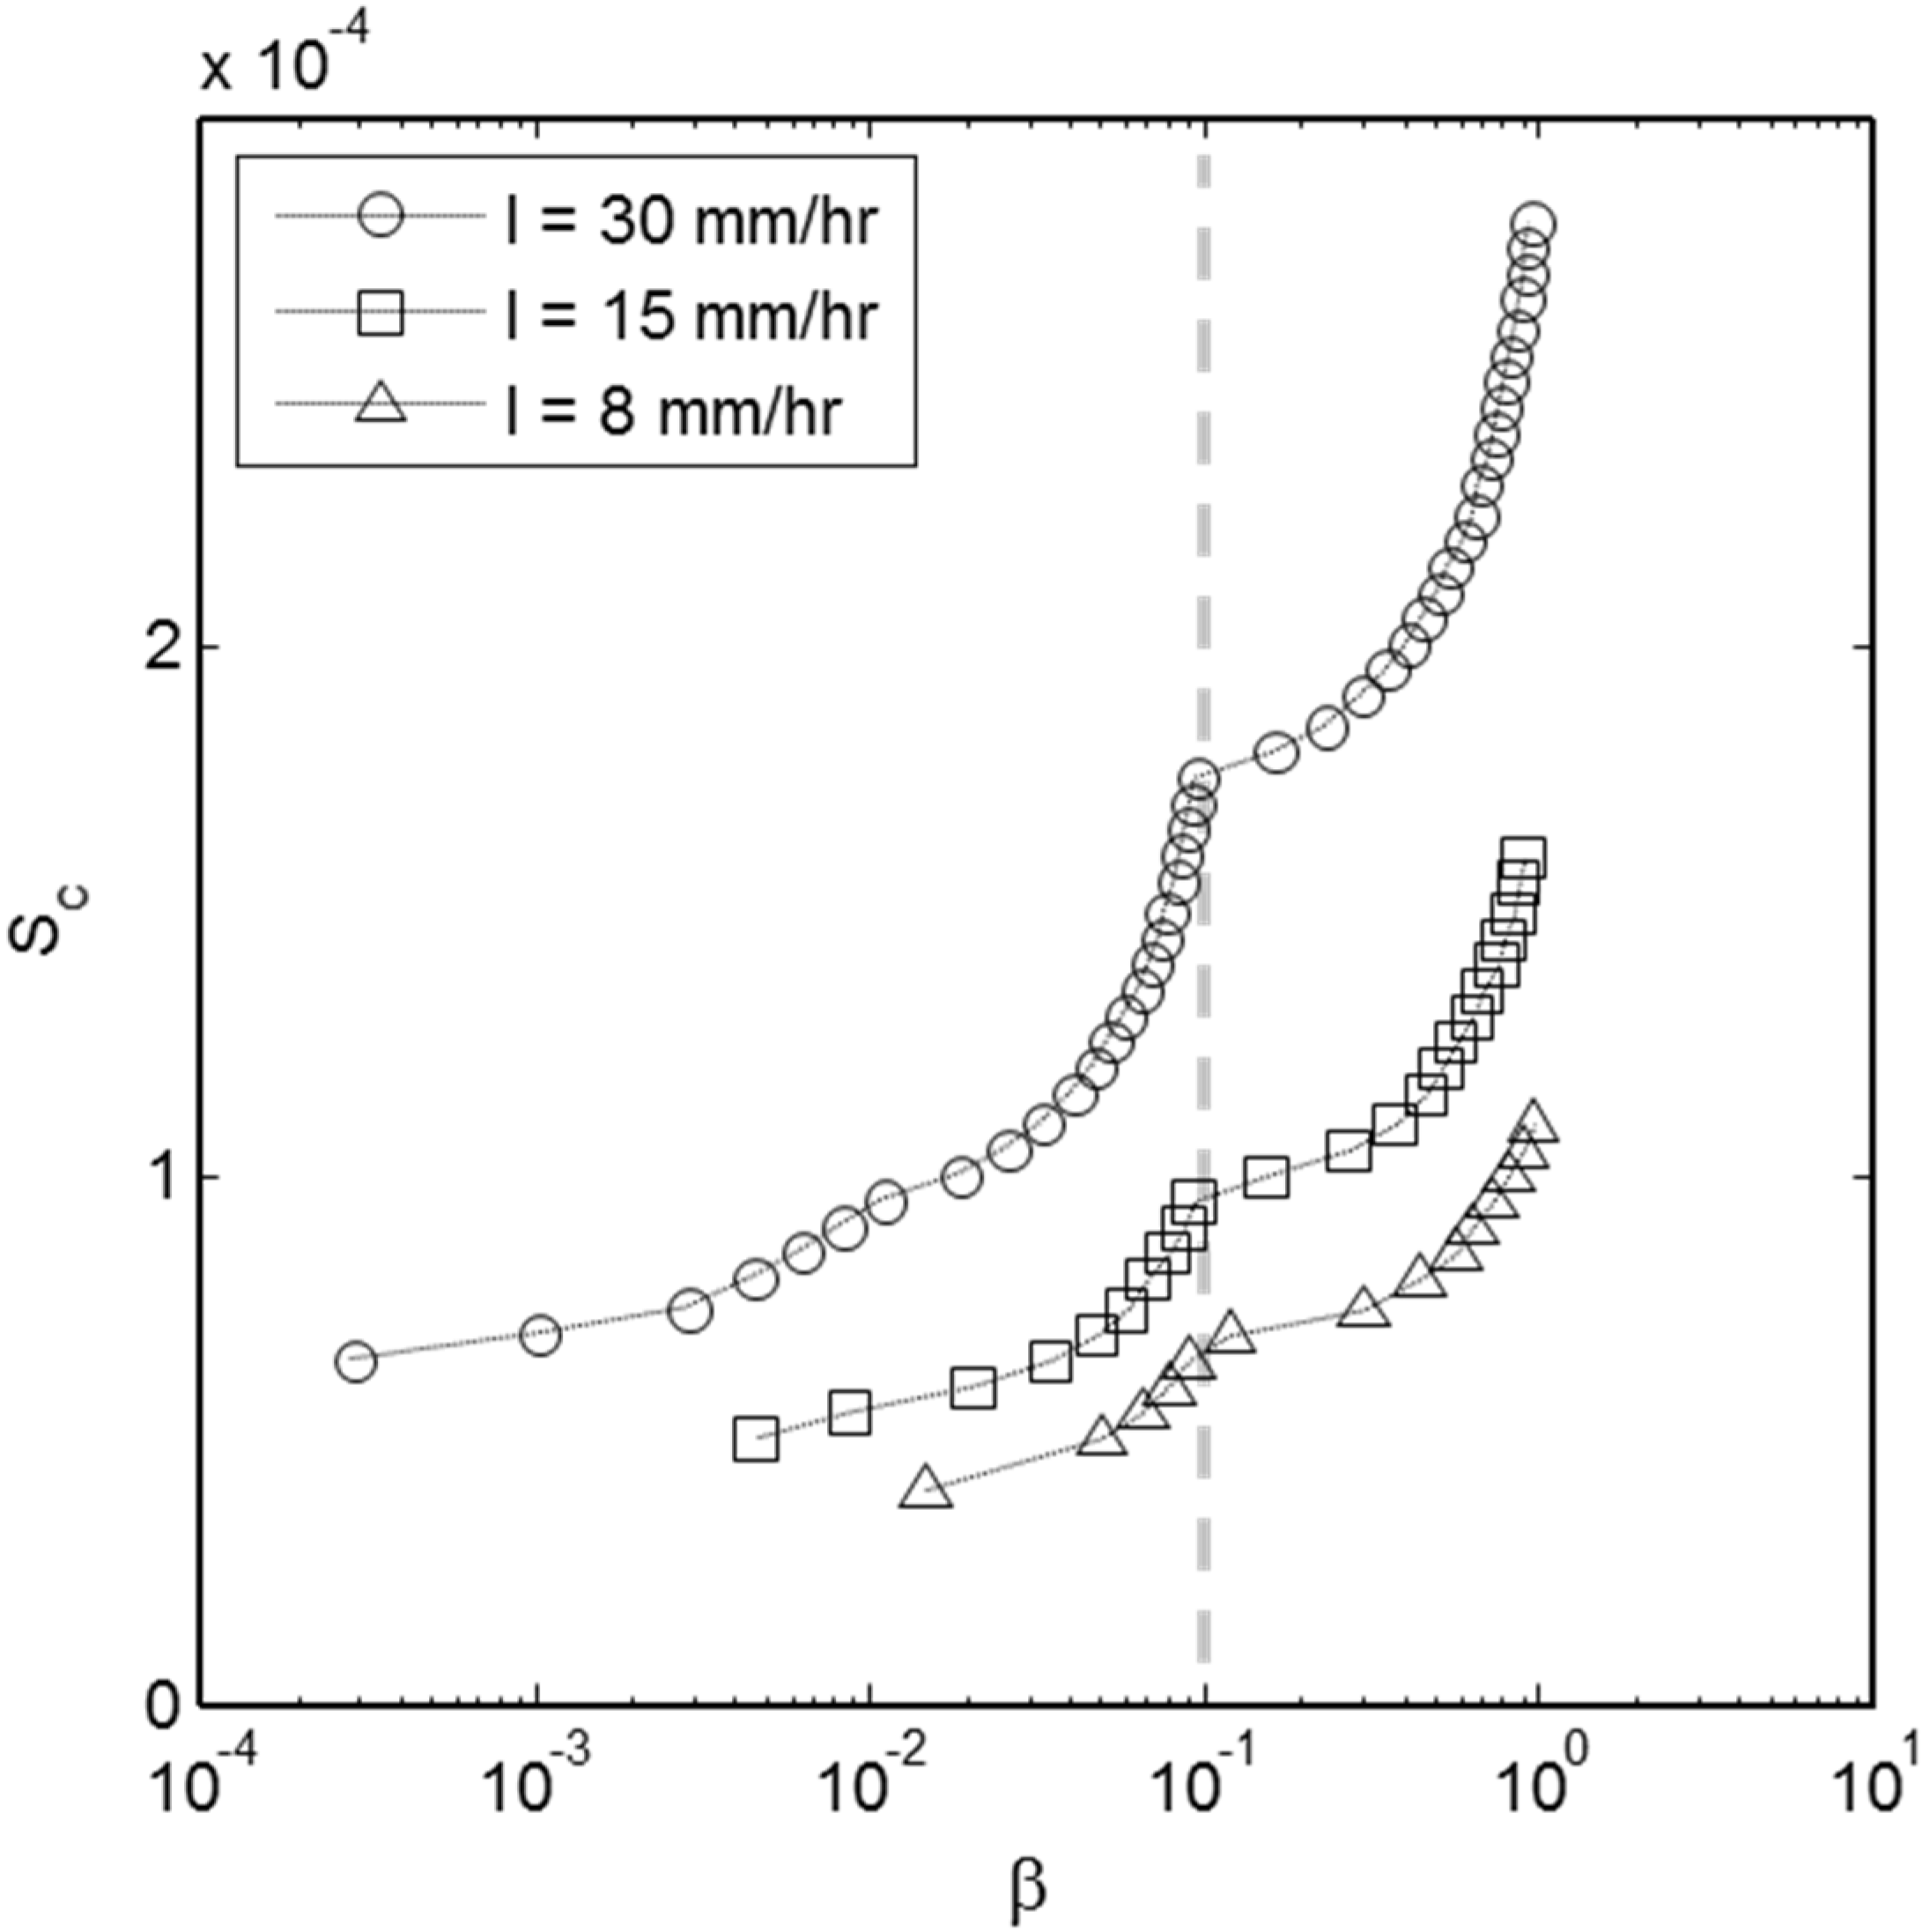
| Range | Equation | a | b | R2 |
|---|---|---|---|---|
| 10−4 < β <10−1 | Sc = a·exp(b·β) | 5.00 × 10⁻⁵ | 6.5356 | 0.991 |
| 10−1 < β < 101 | Sc = a·exp(b·β) | 9.00 × 10⁻⁵ | 0.6217 | 0.989 |

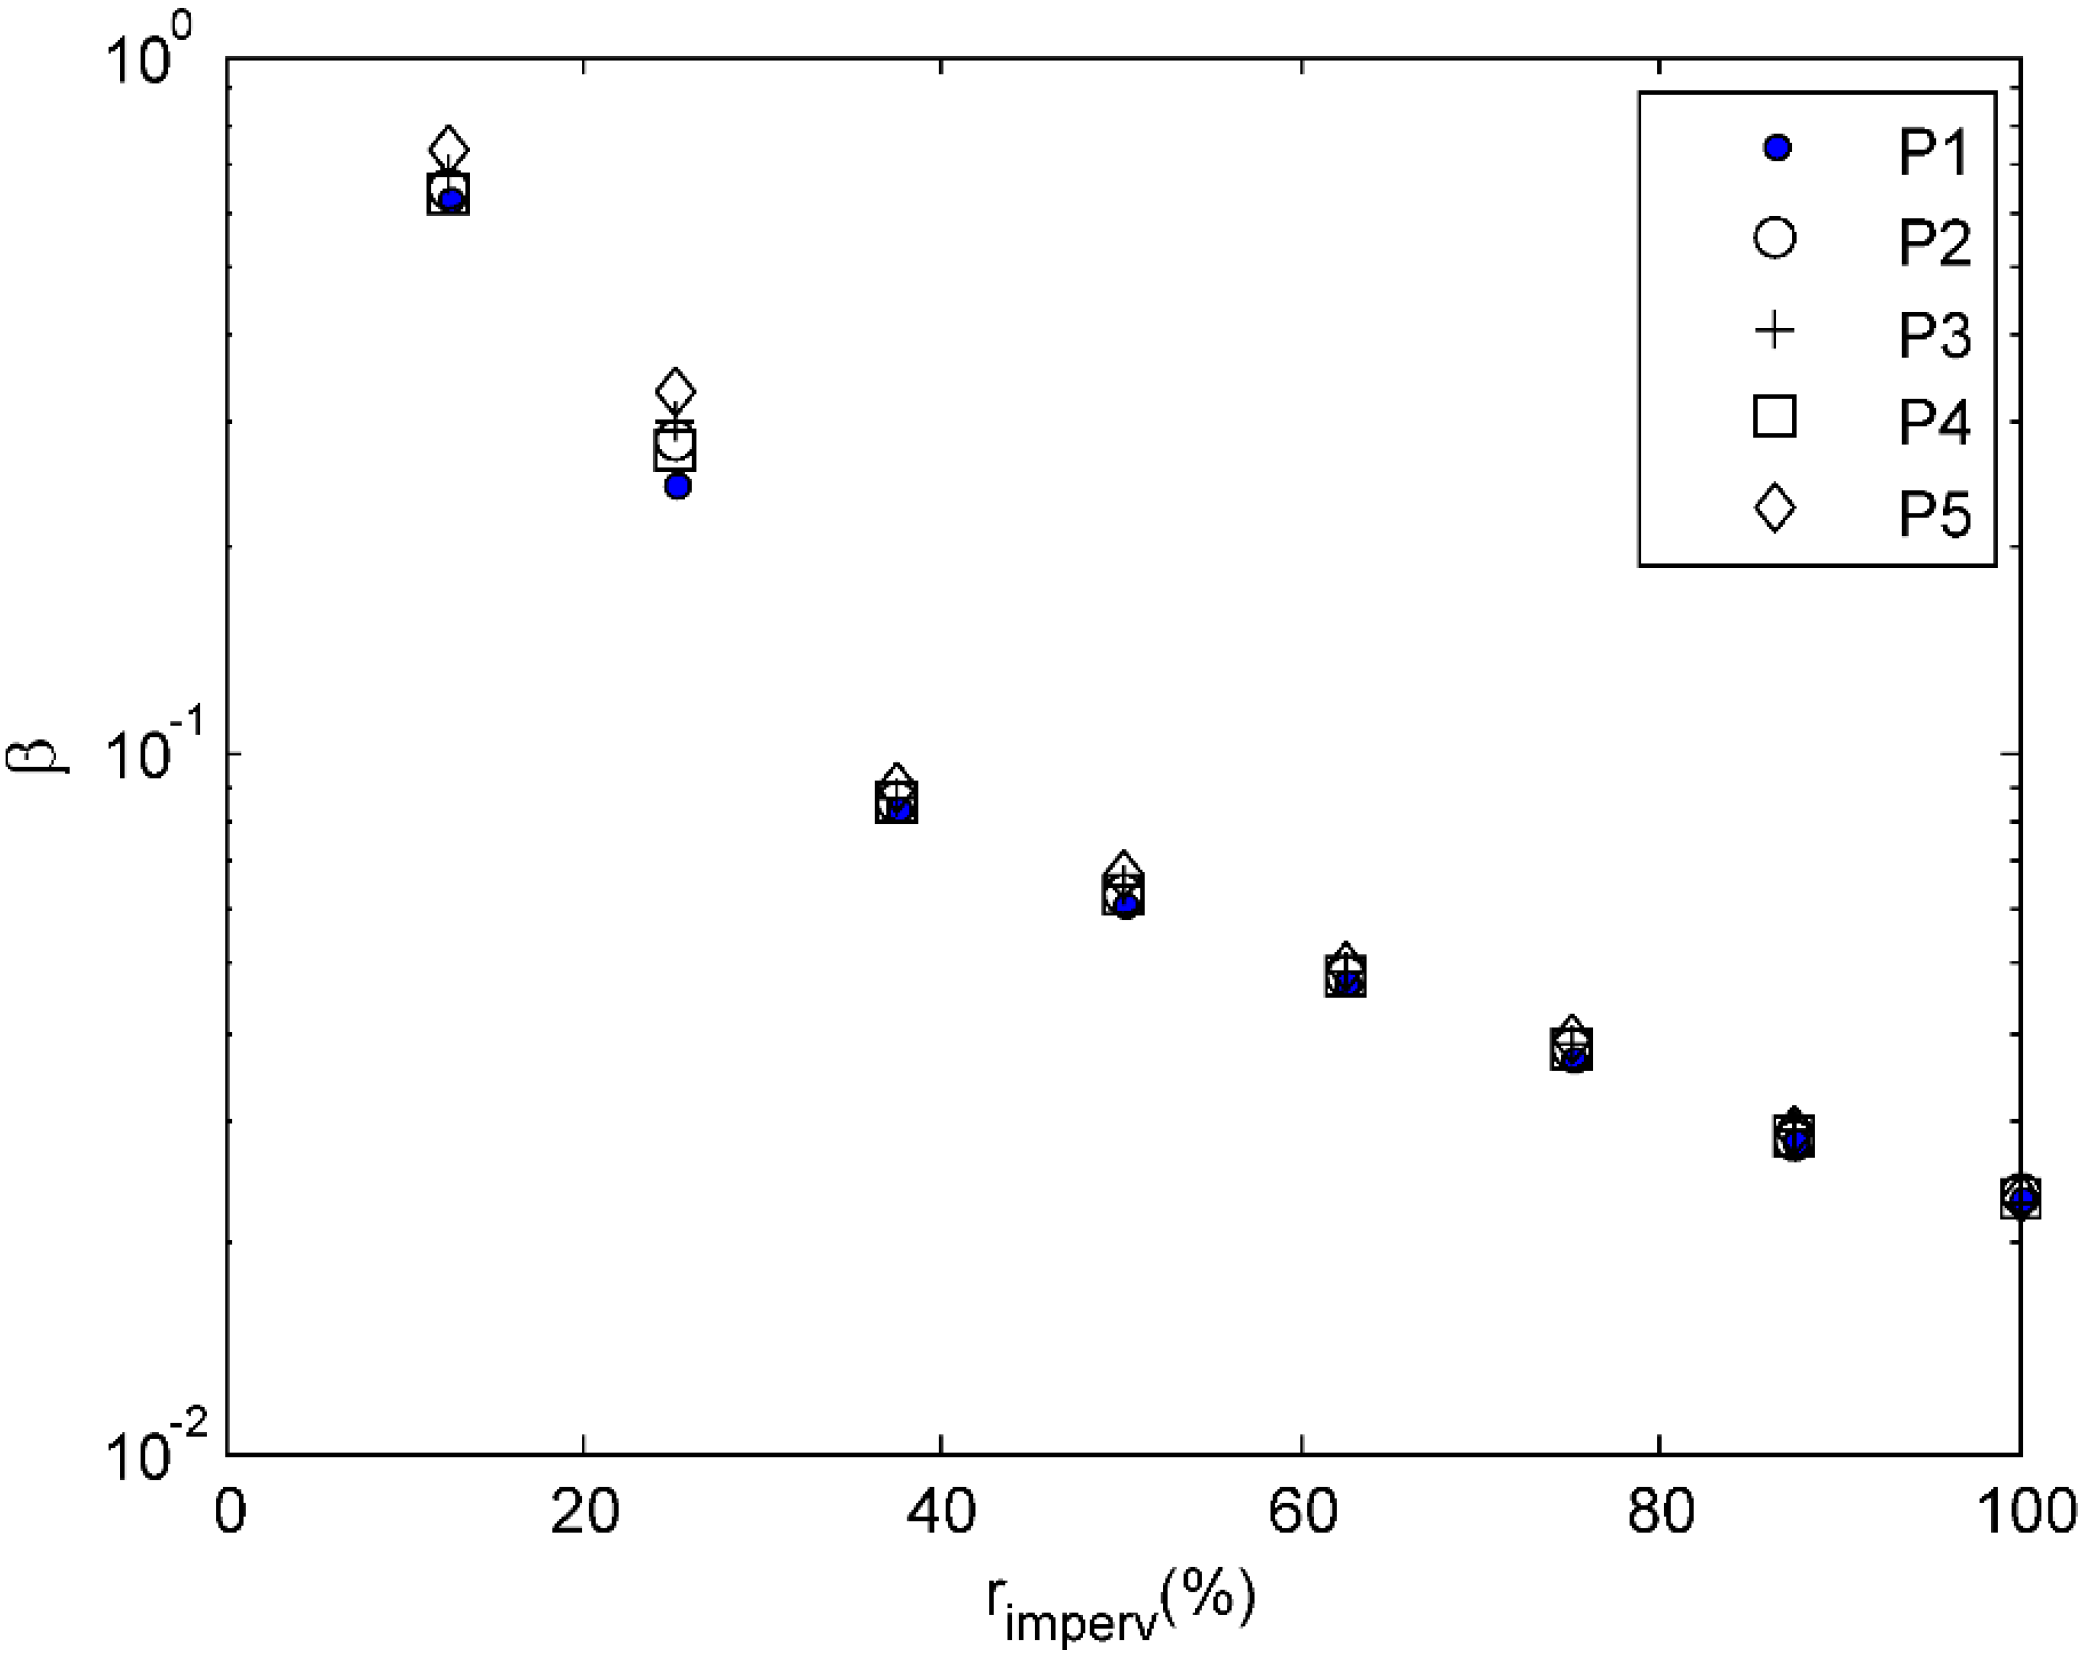
3.2. Effect of the Catchment Imperviousness Ratio and Rainfall Duration on the Equivalence
| Test Cases | Precipitation (mm) | |||||||||
|---|---|---|---|---|---|---|---|---|---|---|
| 0 min | 10 min | 20 min | 30 min | 40 min | 50 min | 60 min | 70 min | 80 min | 90 min | |
| P1 | - | - | - | - | 15 | - | - | - | - | - |
| P2 | - | - | - | 5 | 5 | 5 | - | - | - | - |
| P3 | - | 2.5 | 2.5 | 2.5 | 2.5 | 2.5 | 2.5 | - | - | - |
| P4 | 1.5 | 1.5 | 1.5 | 1.5 | 1.5 | 1.5 | 1.5 | 1.5 | 1.5 | 1.5 |
| P5 | - | - | - | 2.5 | 10 | 2.5 | - | - | - | - |

4. Conclusions
Acknowledgments
Author Contributions
Conflicts of Interest
References
- Yen, B.C.; Akan, A.O. Hydraulic design of urban drainage systems. In Hydraulic Design Handbook; Mays, L.W., Ed.; McGraw-Hill: New York, NY, USA, 1999. [Google Scholar]
- Cantone, J.P.; Schmidt, A.R.; Hollander, M.; Erickson, A.; Tang, Y.; Garcia, M.H. Application of the Illinois Urban Hydrologic Model (IUHM) to Selected Catchments in the Calumet Tunnel and Reservoir Plan System; Ven Te Chow Hydrosystems Lab, Department of Civil and Environmental Engineering, University of Illinois at Urbana-Champaign: Urbana, IL, USA, 2009; p. 94. [Google Scholar]
- Cantone, J.P. Improved Understanding and Prediction of the Hydrologic Response of Highly Urbanized Catchments through Development of the Illinois Urban Hydrologic Model (IUHM); University of Illinois at Urbana-Champaign: Urbana, IL, USA, 2010. [Google Scholar]
- Rodriguez-Iturbe, I.; Valdes, J.B. Geomorphologic structure of hydrologic response. Water Resour. Res. 1979, 15, 1409–1420. [Google Scholar]
- Gupta, V.K.; Waymire, E.; Wang, C.T. A representation of an instantaneous unit-hydrograph from geomorphology. Water Resour. Res. 1980, 16, 855–862. [Google Scholar] [CrossRef]
- Rodriguez, F.; Andrieu, H.; Creutin, J.D. Surface runoff in urban catchments: Morphological identification of unit hydrographs from urban databanks. J. Hydrol. 2003, 283, 146–168. [Google Scholar] [CrossRef]
- Rodriguez, F.; Cudennec, C.; Andrieu, H. Application of morphological approaches to determine unit hydrographs of urban catchments. Hydrol. Process. 2005, 19, 1021–1035. [Google Scholar] [CrossRef]
- Gironas, J.; Niemann, J.D.; Roesner, L.A.; Rodriguez, F.; Andrieu, H. A morpho-climatic instantaneous unit hydrograph model for urban catchments based on the kinematic wave approximation. J. Hydrol. 2009, 377, 317–334. [Google Scholar] [CrossRef]
- Cantone, J.; Schmidt, A. Improved understanding and prediction of the hydrologic response of highly urbanized catchments through development of the Illinois urban hydrologic model. Water Resour. Res. 2011, 47. [Google Scholar] [CrossRef]
- Strahler, A.N. Quantitative analysis of watershed geomorphology. EOS Trans. AGU 1957, 38, 913–920. [Google Scholar] [CrossRef]
- Bailly, J.S.; Levavasseur, F.; Lagacherie, P. A spatial stochastic algorithm to reconstruct artificial drainage networks from incomplete network delineations. Int. J. Appl. Earth Obs. 2011, 13, 853–862. [Google Scholar] [CrossRef] [Green Version]
- Pan, T.C.; Kao, J.J. GA-QP model to optimize sewer system design. J. Environ. Eng. ASCE 2009, 135, 17–24. [Google Scholar] [CrossRef]
- Moderl, M.; Sitzenfrei, R.; Fetz, T.; Fleischhacker, E.; Rauch, W. Systematic generation of virtual networks for water supply. Water Resour. Res. 2011, 47. [Google Scholar] [CrossRef]
- Haghighi, A. Loop-by-loop cutting algorithm to generate layouts for urban drainage systems. J. Water Resour. Plan. Manag. 2013, 139, 693–703. [Google Scholar] [CrossRef]
- Troutman, B.M.; Karlinger, M.R. Gibbs distribution on drainage networks. Water Resour. Res. 1992, 28, 563–577. [Google Scholar] [CrossRef]
- Kindermann, R.; Snell, J.L. Markov Random Fields and Their Applications; American Mathematical Society: Providence, RI, USA, 1980; pp. 1–142. [Google Scholar]
- Barndorff-Nielsen, O.E. Stochastic Methods in Hydrology: Rain, Landforms, and Floods; World Scientific: River Edge, NJ, USA, 1998; pp. 1–207. [Google Scholar]
- Scheidegger, A.E. On topology of river nets. Water Resour. Res. 1967, 3, 103–106. [Google Scholar] [CrossRef]
- Scheidegger, A.E. A stochastic model for drainage patterns into an intramontane trench. Int. Assoc. Sci. Hydrol. Bull. 1967, 12, 15–20. [Google Scholar] [CrossRef]
- Leopold, L.B.; Langbein, W.B. The concept of Entropy in Landscape Evolution; United States Government Printing Office: Washington, DC, USA, 1962; pp. 1–20. [Google Scholar]
- Karlinger, M.R.; Troutman, B.M. A random spatial network model based on elementary postulates. Water Resour. Res. 1989, 25, 793–798. [Google Scholar] [CrossRef]
- Seo, Y.; Schmidt, A.R. The effect of rainstorm movement on urban drainage network runoff hydrographs. Hydrol. Process. 2012, 26, 3830–3841. [Google Scholar] [CrossRef]
- Seo, Y.; Schmidt, A.R. Network configuration and hydrograph sensitivity to storm kinematics. Water Resour. Res. 2013, 49, 1812–1827. [Google Scholar] [CrossRef]
- Seo, Y.; Schmidt, A.R. Application of Gibbs’ model to urban drainage networks: A case study in southwestern Chicago, USA. Hydrol. Process. 2014, 28, 1148–1158. [Google Scholar] [CrossRef]
- Roesner, L.A.; Shubinski, R.P. Improved dynamic routing model for storm drainage system. In Urban Storm Water Hydraulics and Hydrology; Yen, B.C., Ed.; Water Resources Publications: Highland Ranch, CO, USA, 1982; pp. 164–173. [Google Scholar]
- Roesner, L.A.; Shubinski, R.P. Storm Water Management Model User’s Manual Version III. Addendum I EXTRAN; Municipal Environmental Research Laboratory: Cincinnati, OH, USA, 1984. [Google Scholar]
© 2015 by the authors; licensee MDPI, Basel, Switzerland. This article is an open access article distributed under the terms and conditions of the Creative Commons Attribution license (http://creativecommons.org/licenses/by/4.0/).
Share and Cite
Seo, Y.; Seo, Y.-H.; Kim, Y.-O. Behavior of a Fully-Looped Drainage Network and the Corresponding Dendritic Networks. Water 2015, 7, 1291-1305. https://doi.org/10.3390/w7031291
Seo Y, Seo Y-H, Kim Y-O. Behavior of a Fully-Looped Drainage Network and the Corresponding Dendritic Networks. Water. 2015; 7(3):1291-1305. https://doi.org/10.3390/w7031291
Chicago/Turabian StyleSeo, Yongwon, Young-Ho Seo, and Young-Oh Kim. 2015. "Behavior of a Fully-Looped Drainage Network and the Corresponding Dendritic Networks" Water 7, no. 3: 1291-1305. https://doi.org/10.3390/w7031291