
Robust Parameter Estimation Framework of a Rainfall-Runoff Model Using Pareto Optimum and Minimax Regret Approach


Abstract
:1. Introduction
2. Method
2.1. Framework
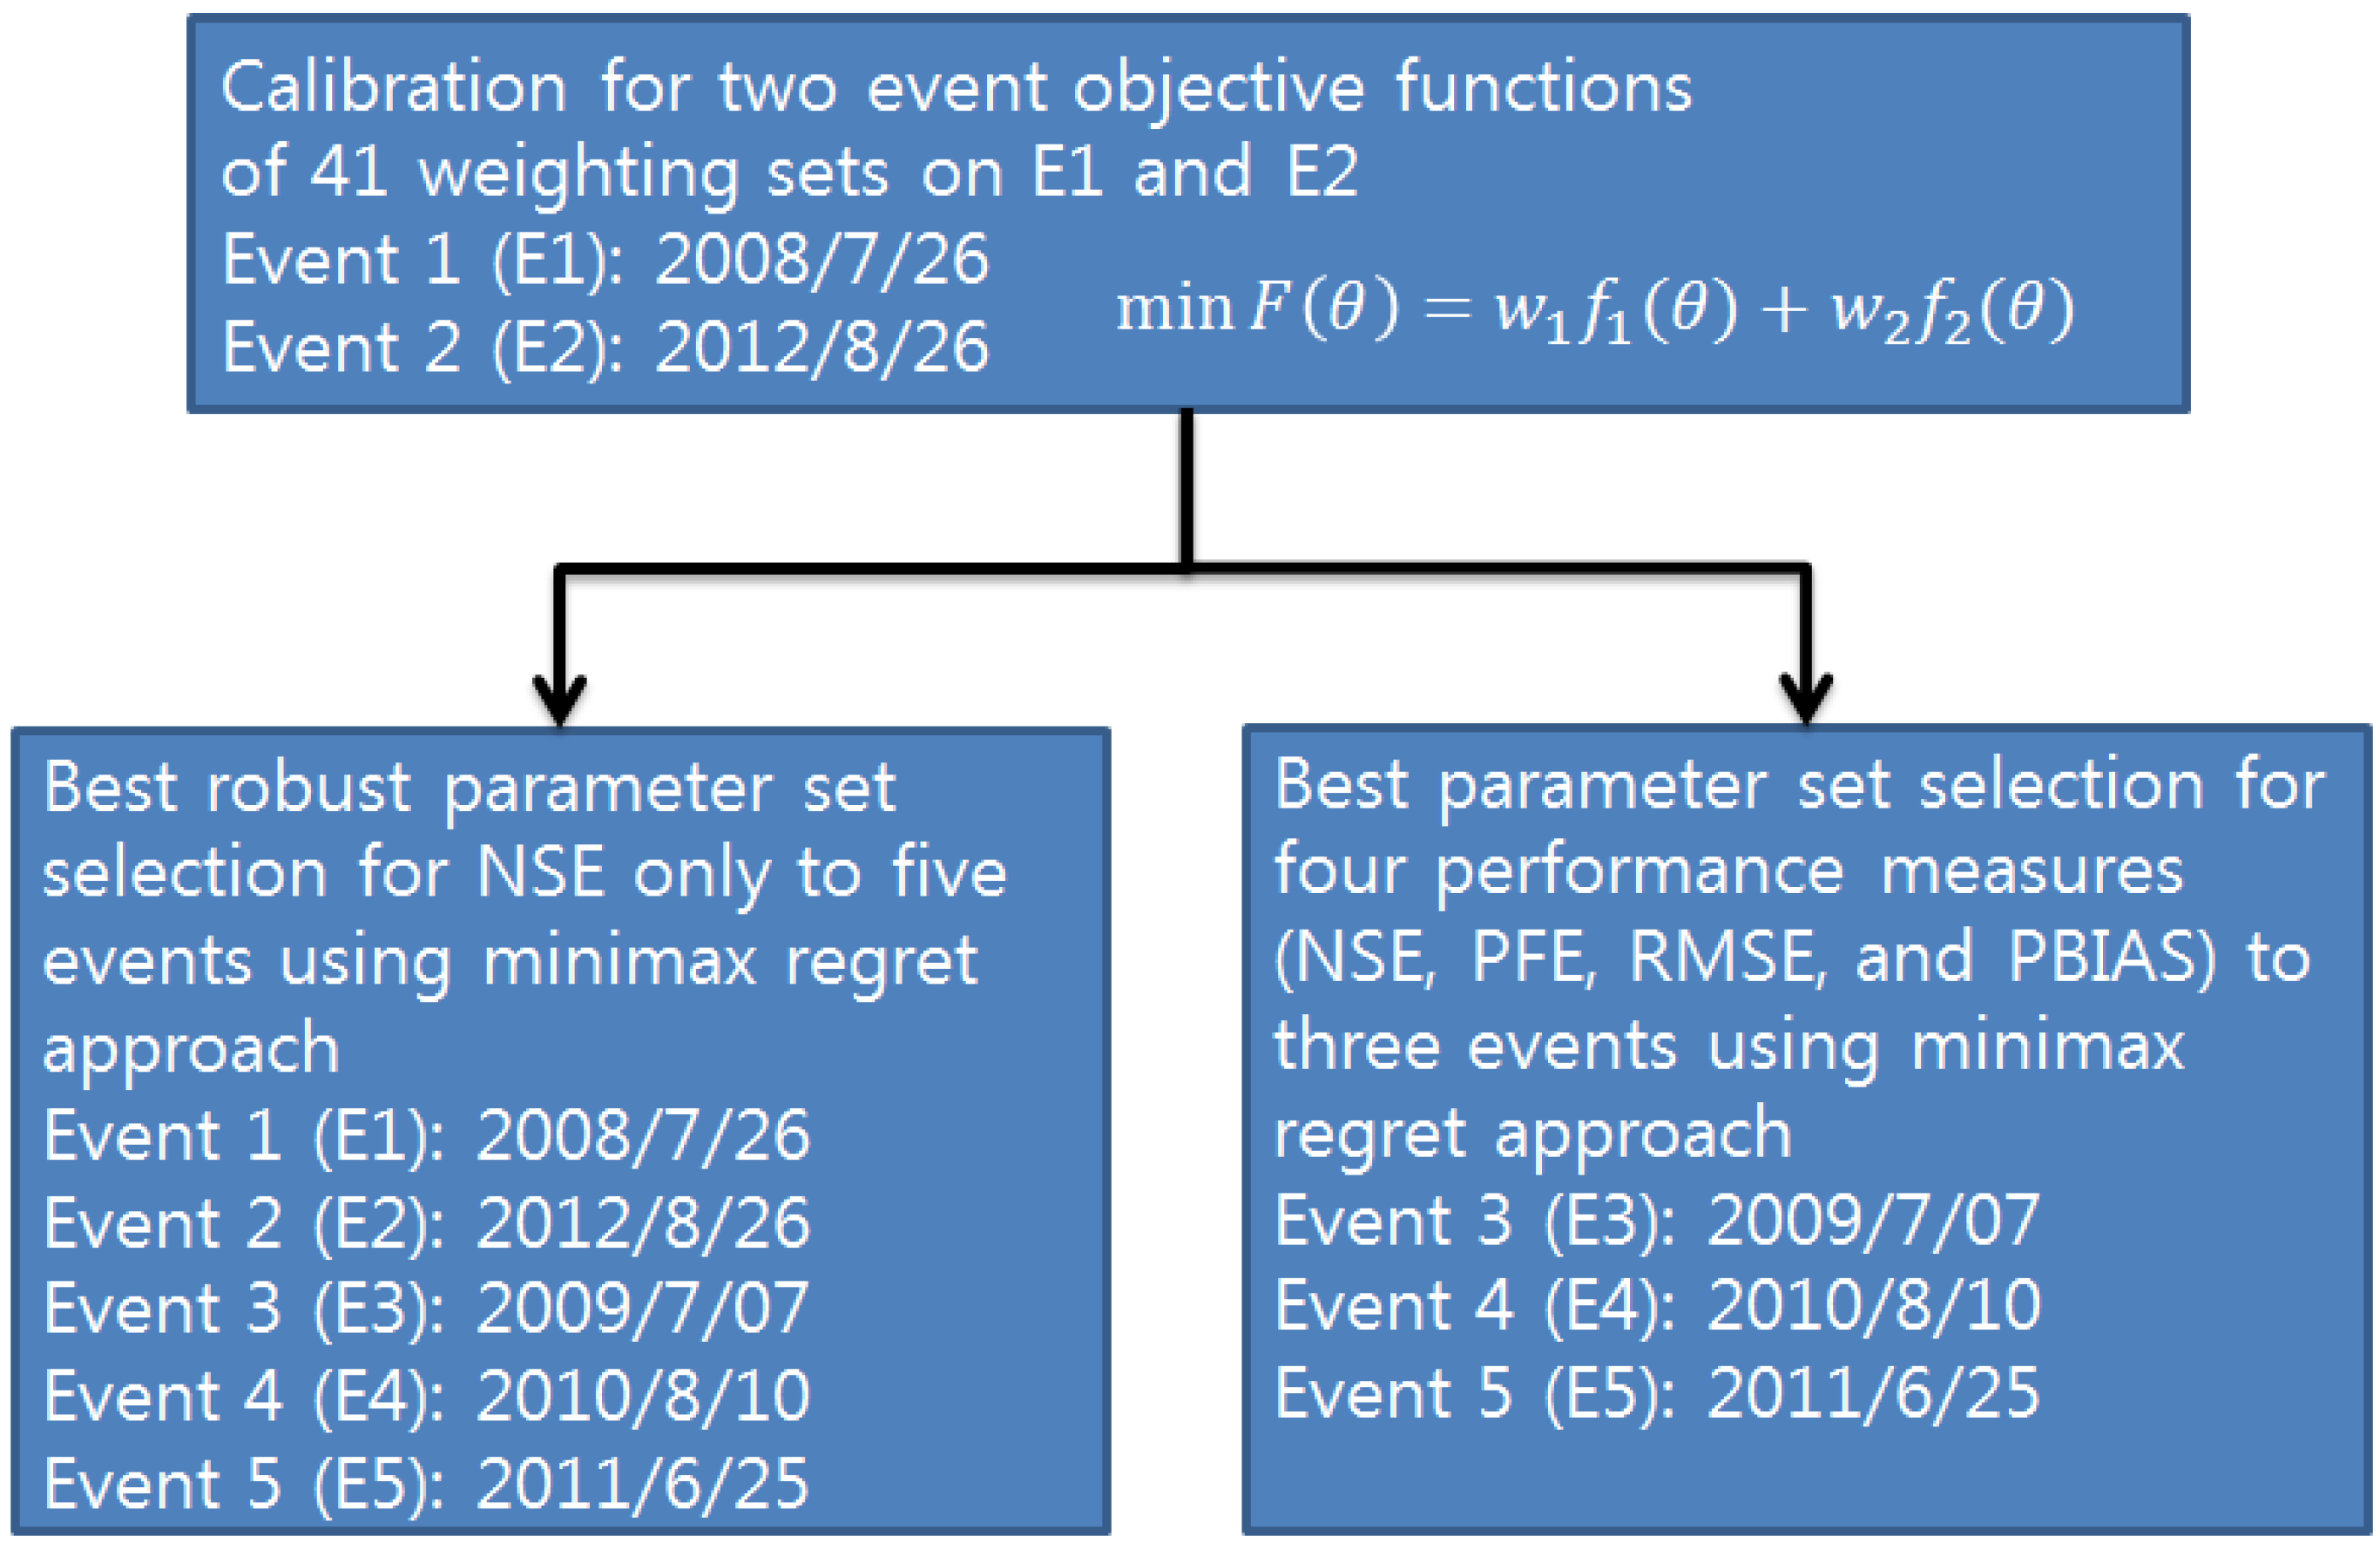
2.2. Multi-Event Objective Function
2.3. Minimax Regret Approach (MRA)
2.4. Standardization
2.5. SWMM Modeling
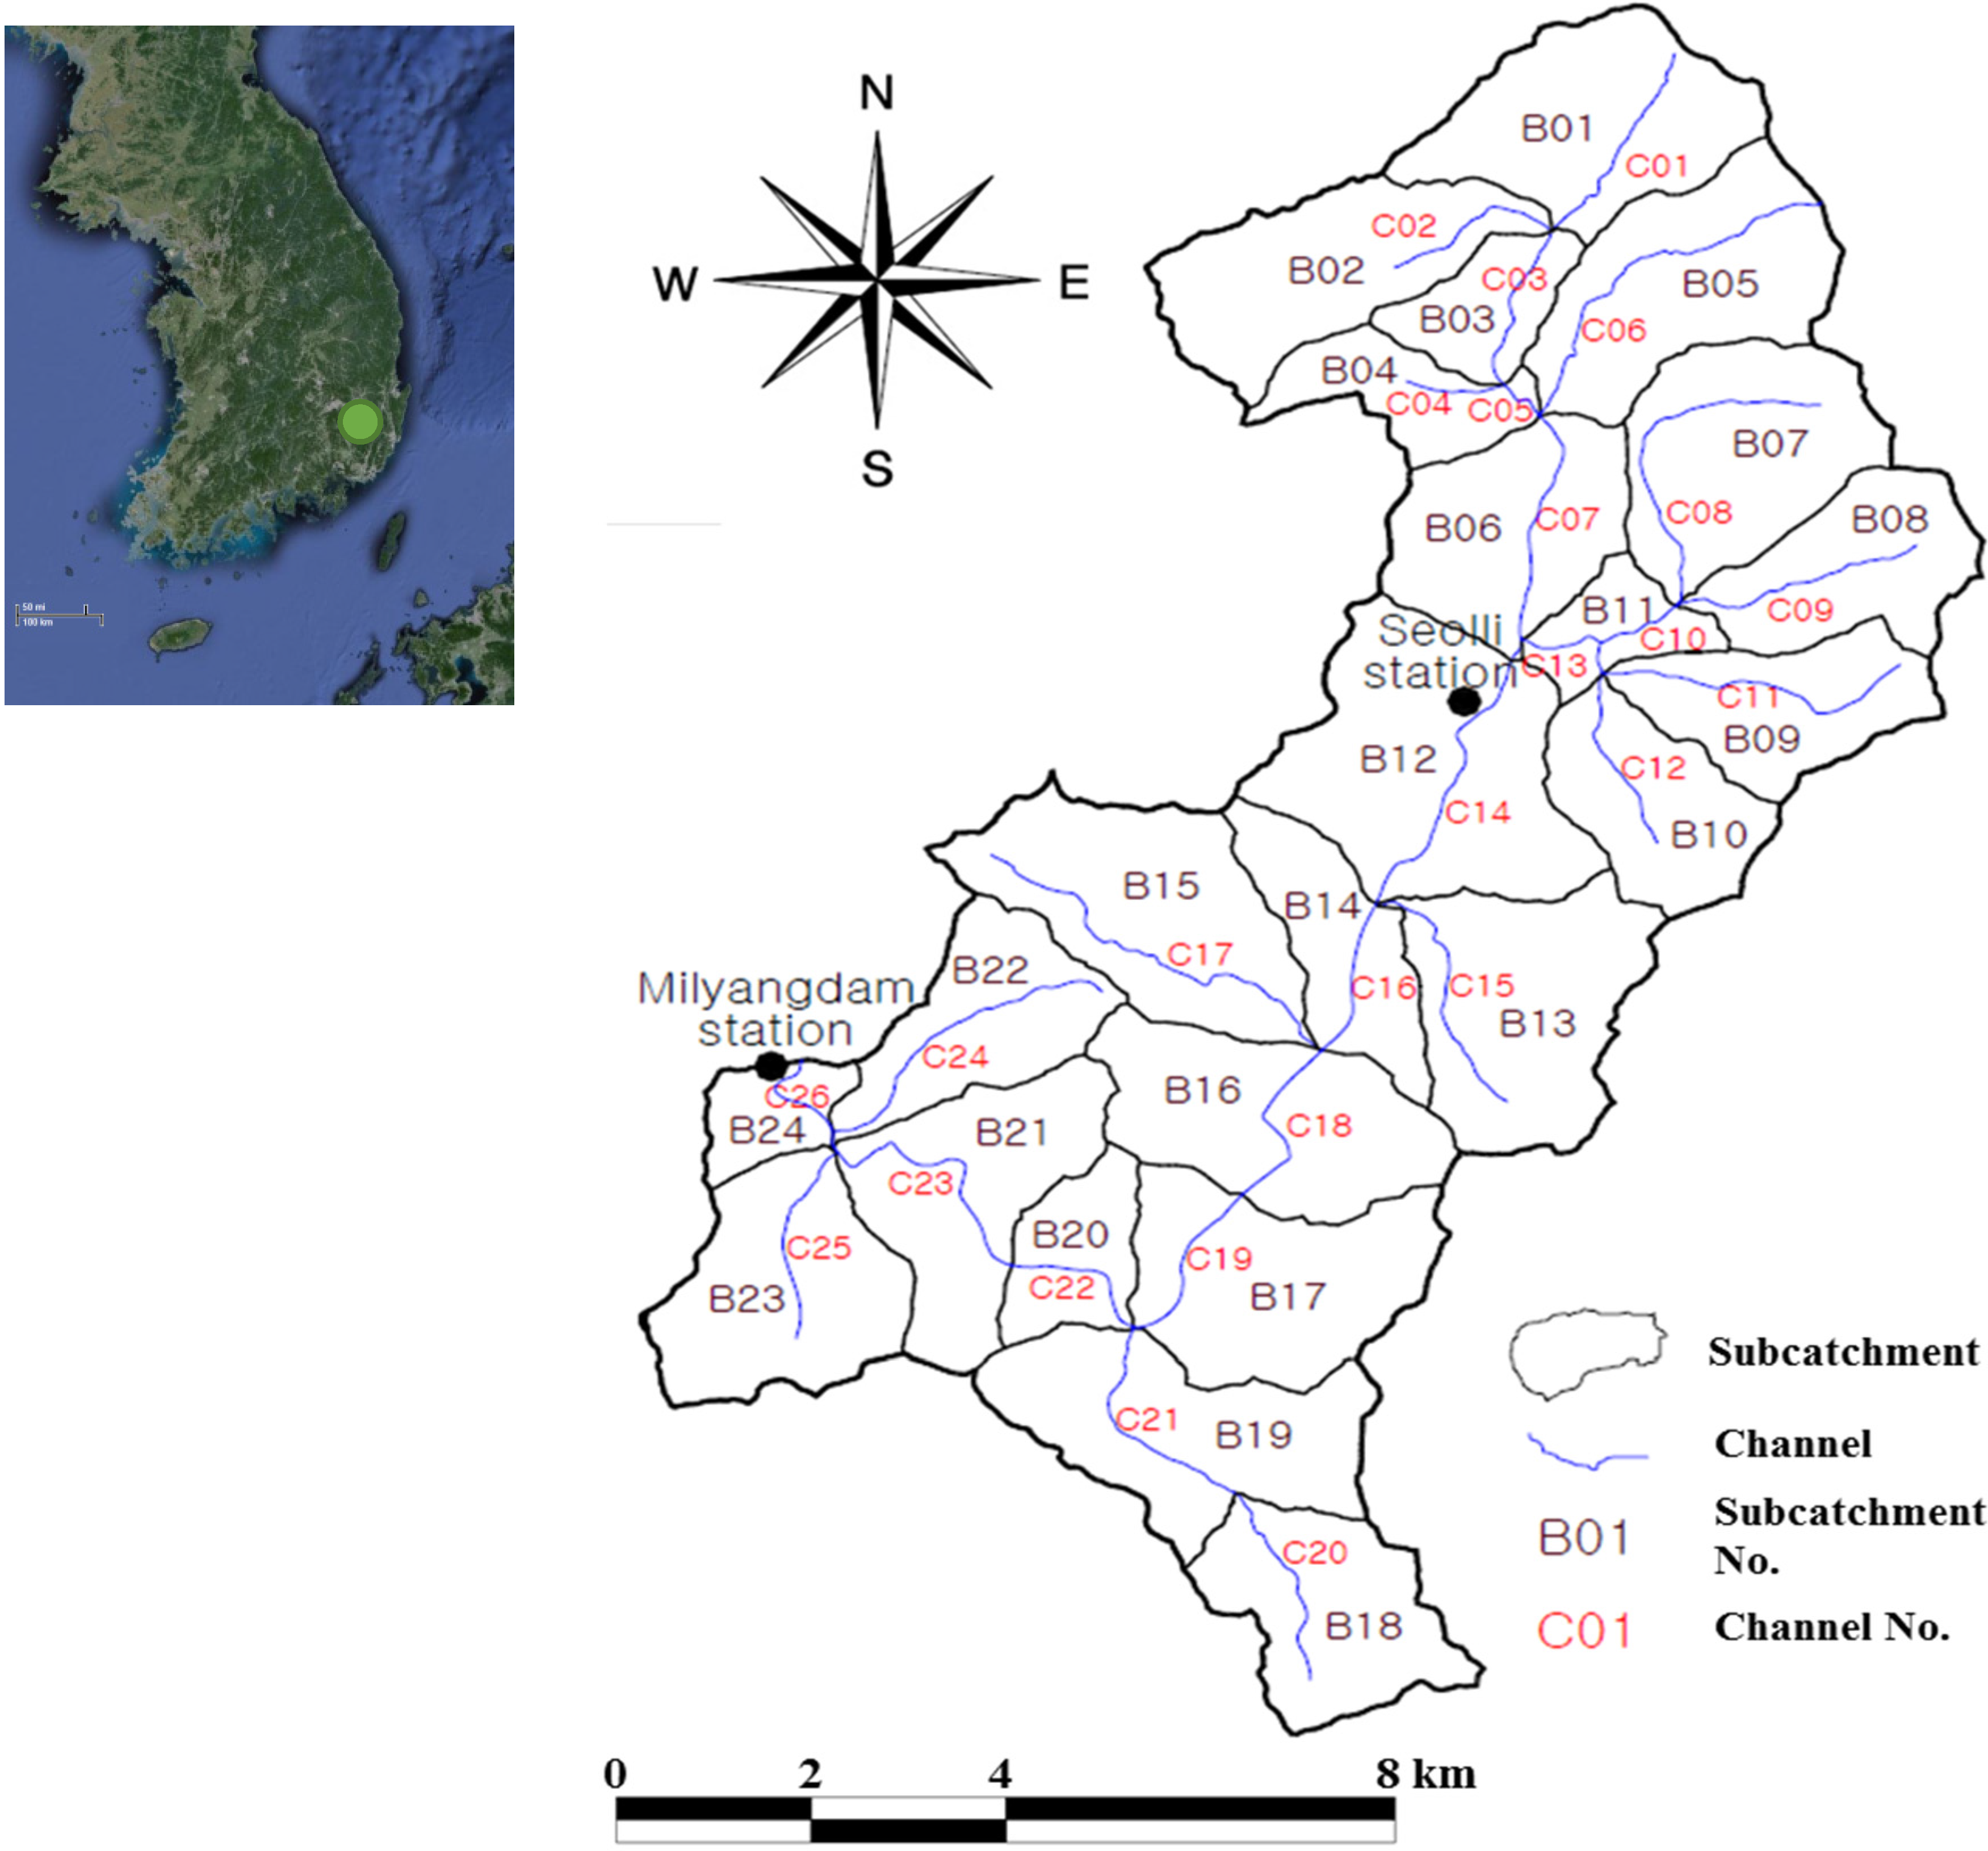
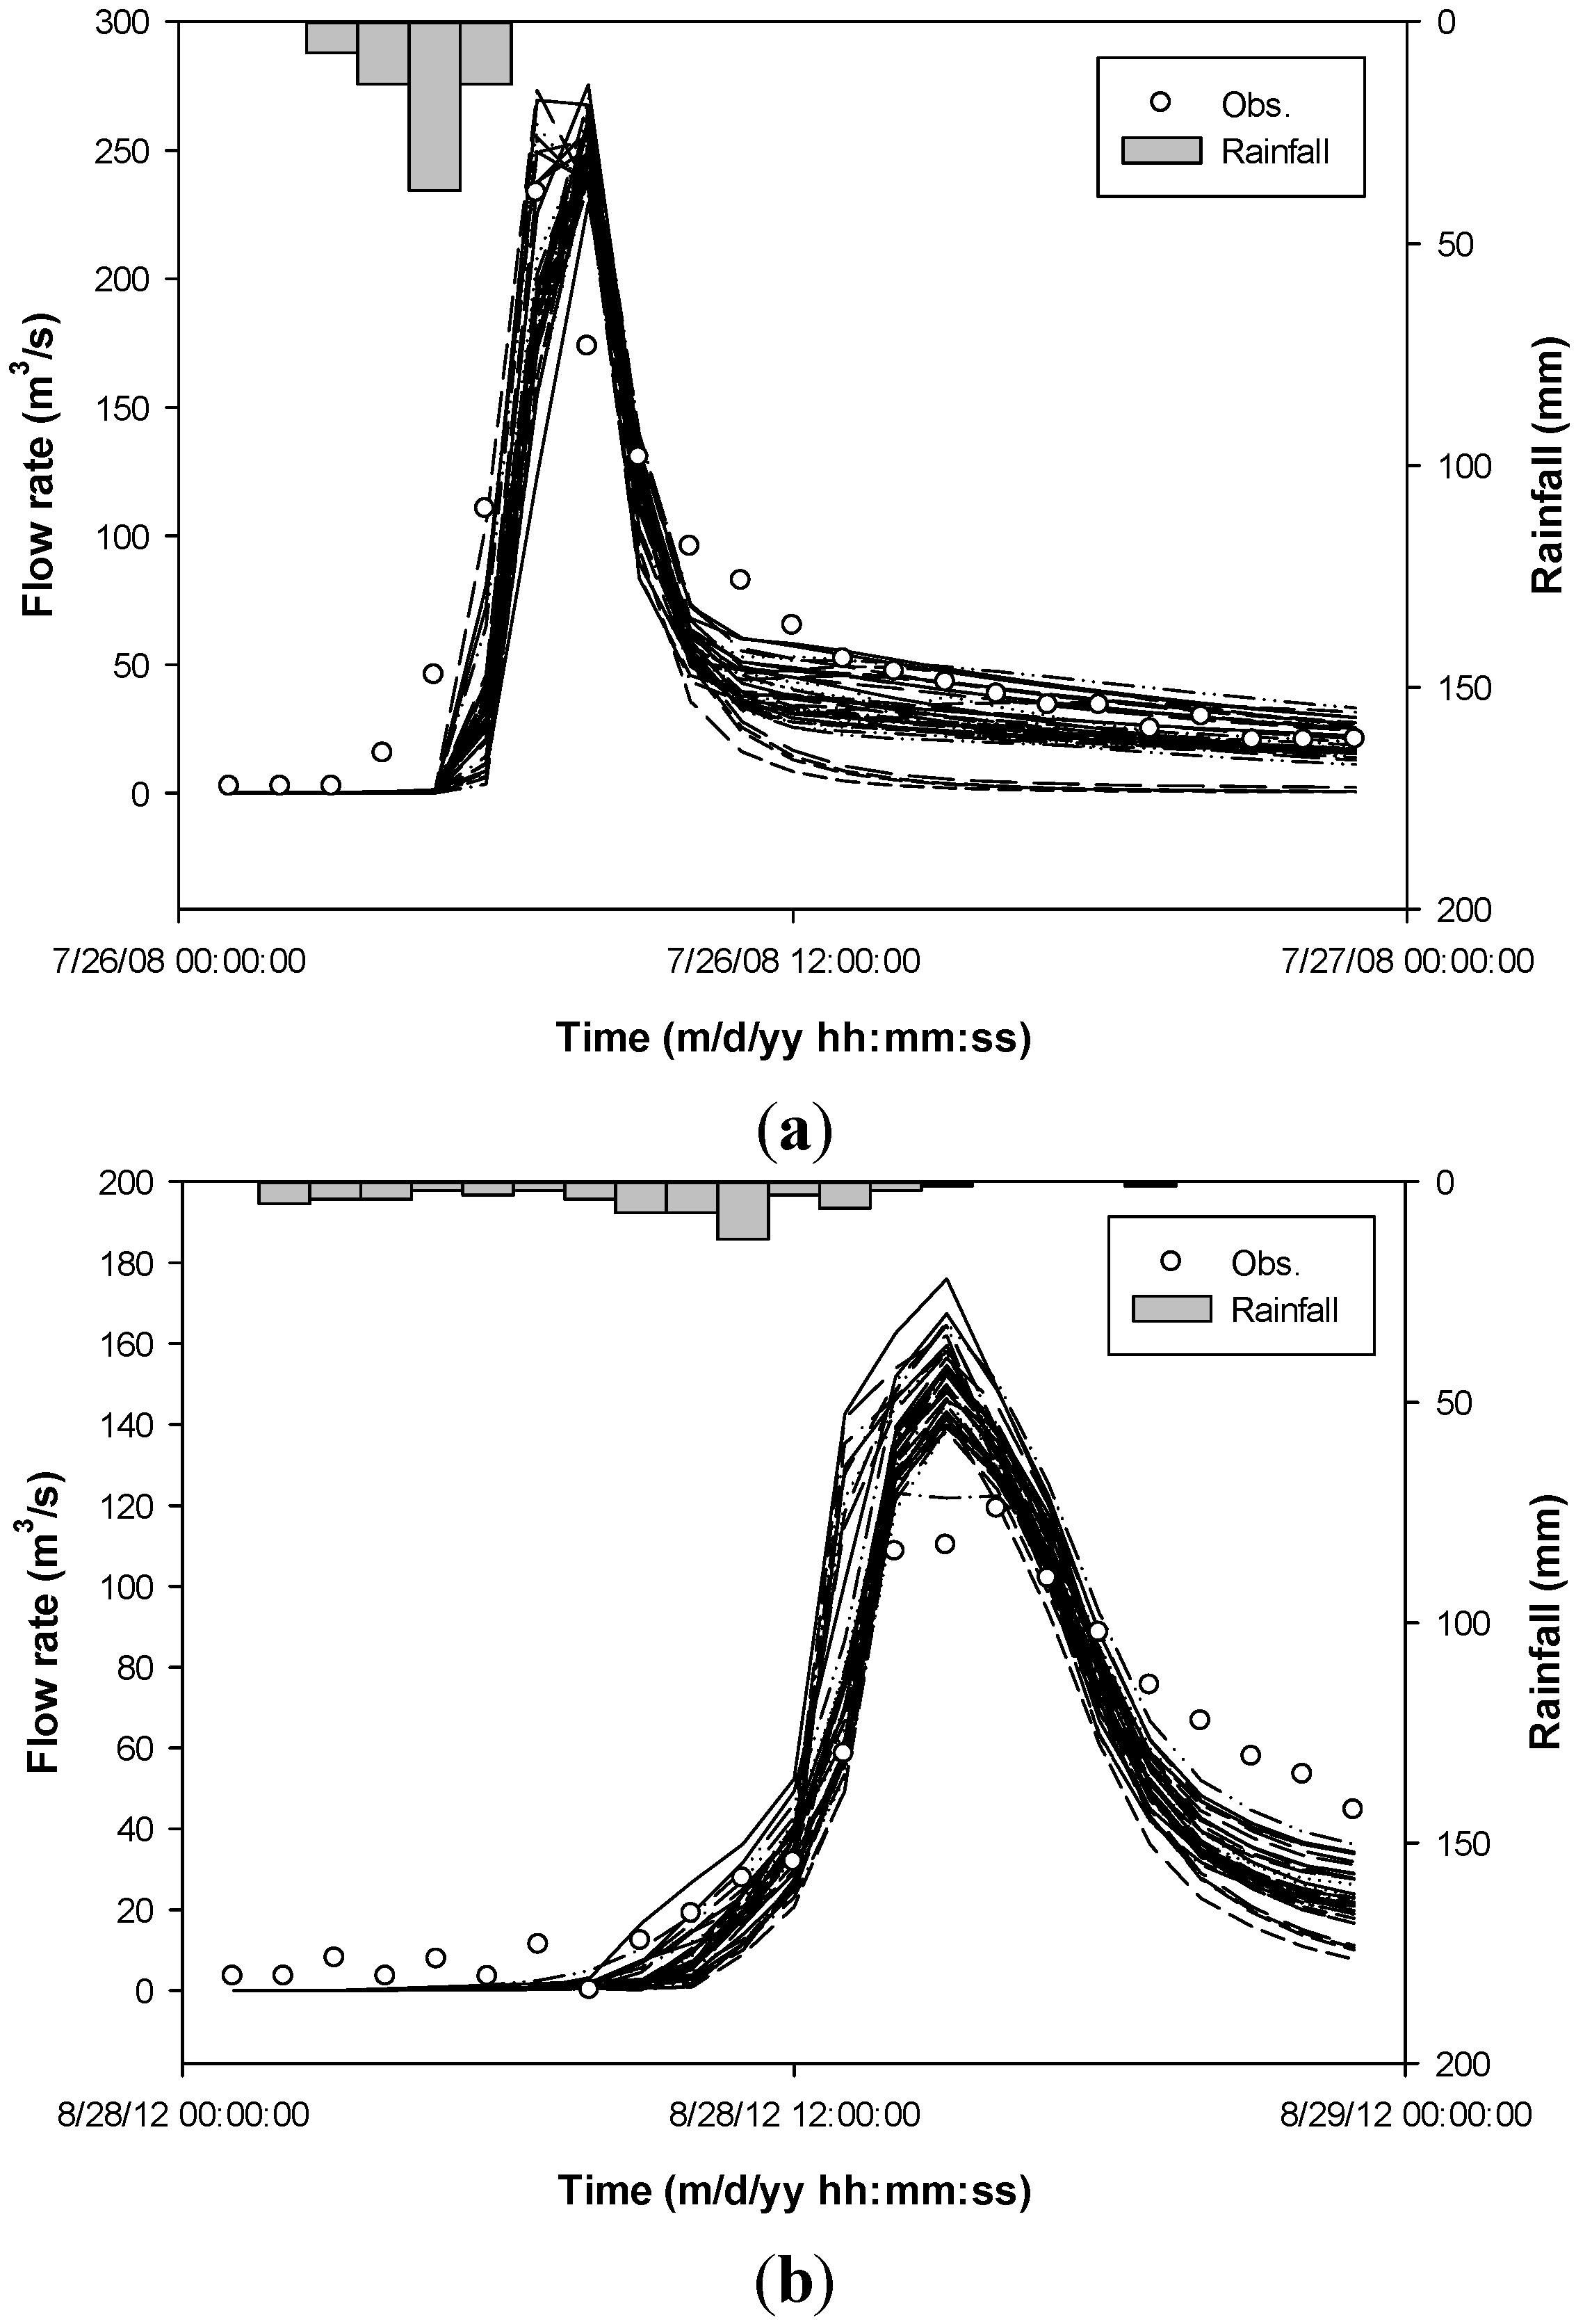
2.5.1. Study Watershed and Rainfall Events

| Events | Period (mm/dd/yyyy hh:mm) | Total Precipitation (mm) | Maximum Precipitation (mm/hr) | Peak Runoff (m3/s) | Peak Time (mm/dd/yyyy hh:mm) | |||
|---|---|---|---|---|---|---|---|---|
| Milyang Dam | Seolli | Milyang Dam | Seolli | |||||
| Pareto optimality | E1 20080726 | 07/26/2008 01:00 ~ 07/26/2008 23:00 | 73 | 105 | 24 | 21 | 233.3 | 07/26/2008 07:00 |
| E2 20120828 | 08/28/2012 01:00 ~ 08/28/2012 23:00 | 64 | 106 | 6 | 25 | 119.1 | 08/28/2012 16:00 | |
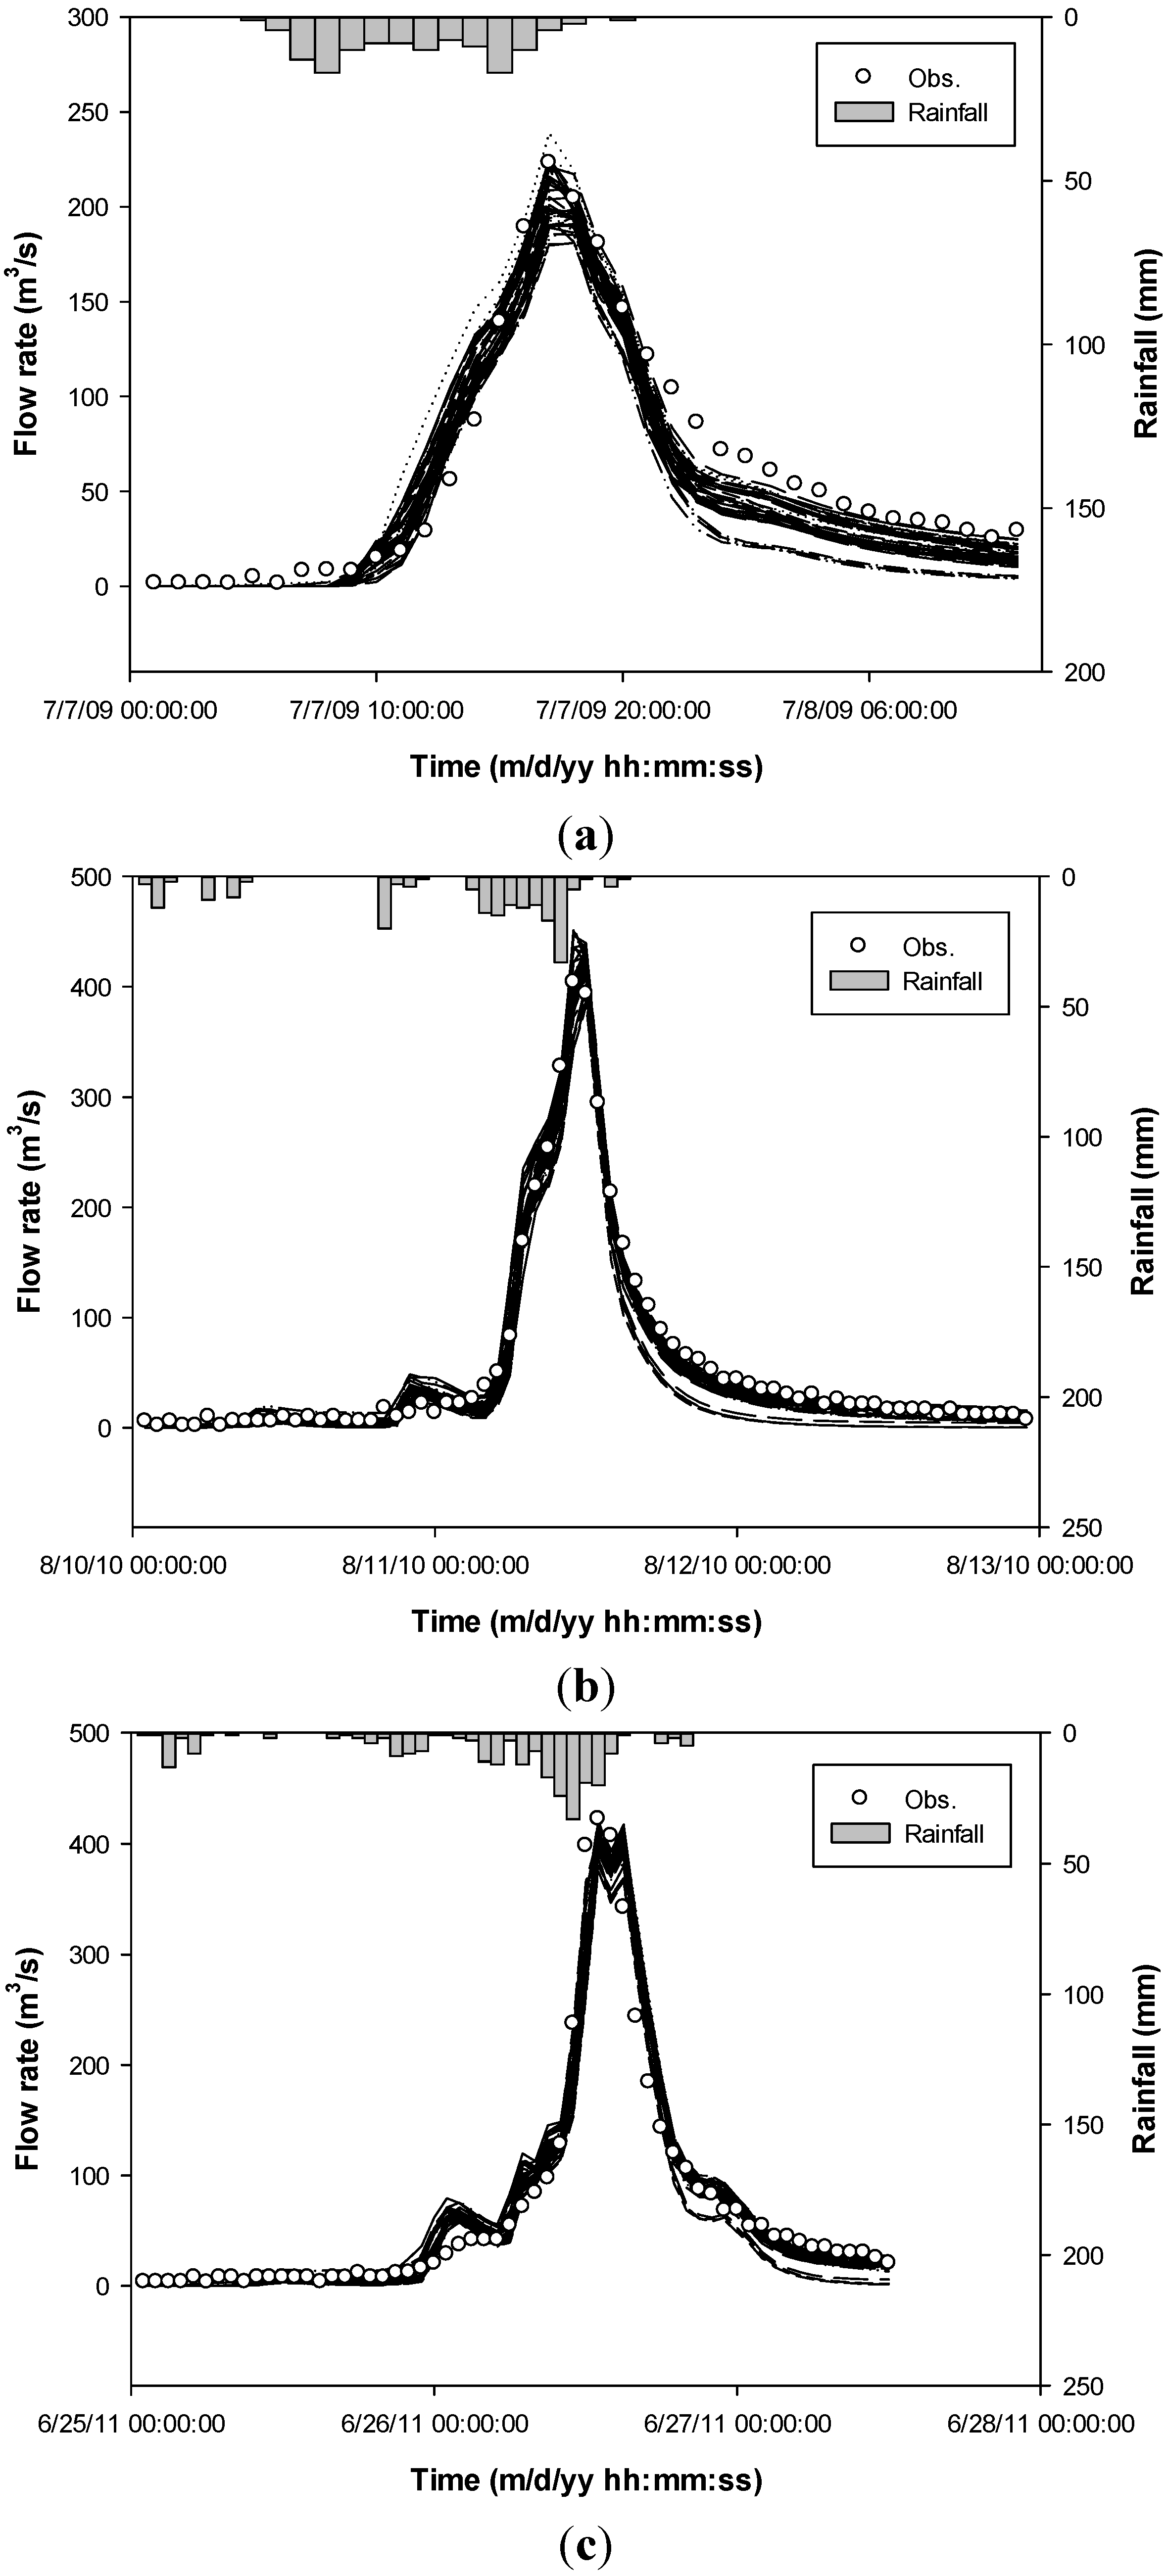
| Performance evaluation | E3 20090707 | 07/07/2009 01:00 ~ 07/08/2009 12:00 | 121 | 130 | 9 | 8 | 223.22 | 07/07/2009 17:00 |
| E4 20100810 | 08/10/2010 1:00 ~ 08/12/2010 23:00 | 194 | 194 | 33 | 26 | 406.4 | 08/10/2010 11:00 | |
| E5 20110625 | 06/25/2011 01:00 ~ 06/27/2011 12:00 | 169 | 249 | 8 | 12 | 422.4 | 06/26/2011 13:00 | |
2.5.2. Model Configuration
2.5.3. Model Optimization
| Class | Parameters | Description | Unit | Lower Bound | Upper Bound |
|---|---|---|---|---|---|
| Basin | Pcnt. Imperv | Percent of impervious area | % | 0.8*Obs. value | 1.2*Obs. value |
| Width | Characteristics width of the overland flow path | m | 0.8*Obs. value | 1.2*Obs. value | |
| N-Imperv | Manning’s n of impervious area | - | 0.01 | 0.016 | |
| N-Perv | Manning’s n of pervious area | - | 0.15 | 0.4 | |
| S-Imperv | Depth of depression storage on impervious area | mm | 1.6 | 3.8 | |
| S-Perv | Depth of depression storage on pervious area | mm | 3.8 | 6.4 | |
| Pct Zero | Percent of the impervious area with no depression storage | % | 10 | 30 | |
| CN | NRCS runoff curve coefficient | - | 0.8*Obs. value | 1.2*Obs. value | |
| Channel | Manning N | Manning’s roughness coefficient | - | 0.02 | 0.05 |
| Ground-water | Porosity | Porosity (volume of voids/total soil volume) | Fraction | 0.453 | 0.463 |
| Wilt Point | Wilting point (soil moisture content at which plants cannot survive) | Fraction | 0.085 | 0.116 | |
| Field Capac | Field capacity (soil moisture content after all free water has drained off) | Fraction | 0.19 | 0.232 | |
| Hyd Cond | Soil’s saturated hydraulic conductivity | mm/h | 3.3 | 10.92 | |
| Cond Slop | Average slope of log (conductivity) versus soil moisture deficit curve | - | 1 | 10 | |
| Tens Slop | Average slope of soil tension versus soil moisture deficit curve | mm | 1,000 | 5000 | |
| A1 | Groundwater flow coefficient | - | 0.0001 | 0.1 | |
| B1 | Groundwater flow exponent | - | 1 | 5 |
2.5.4. Performance Measures
3. Results and Discussions
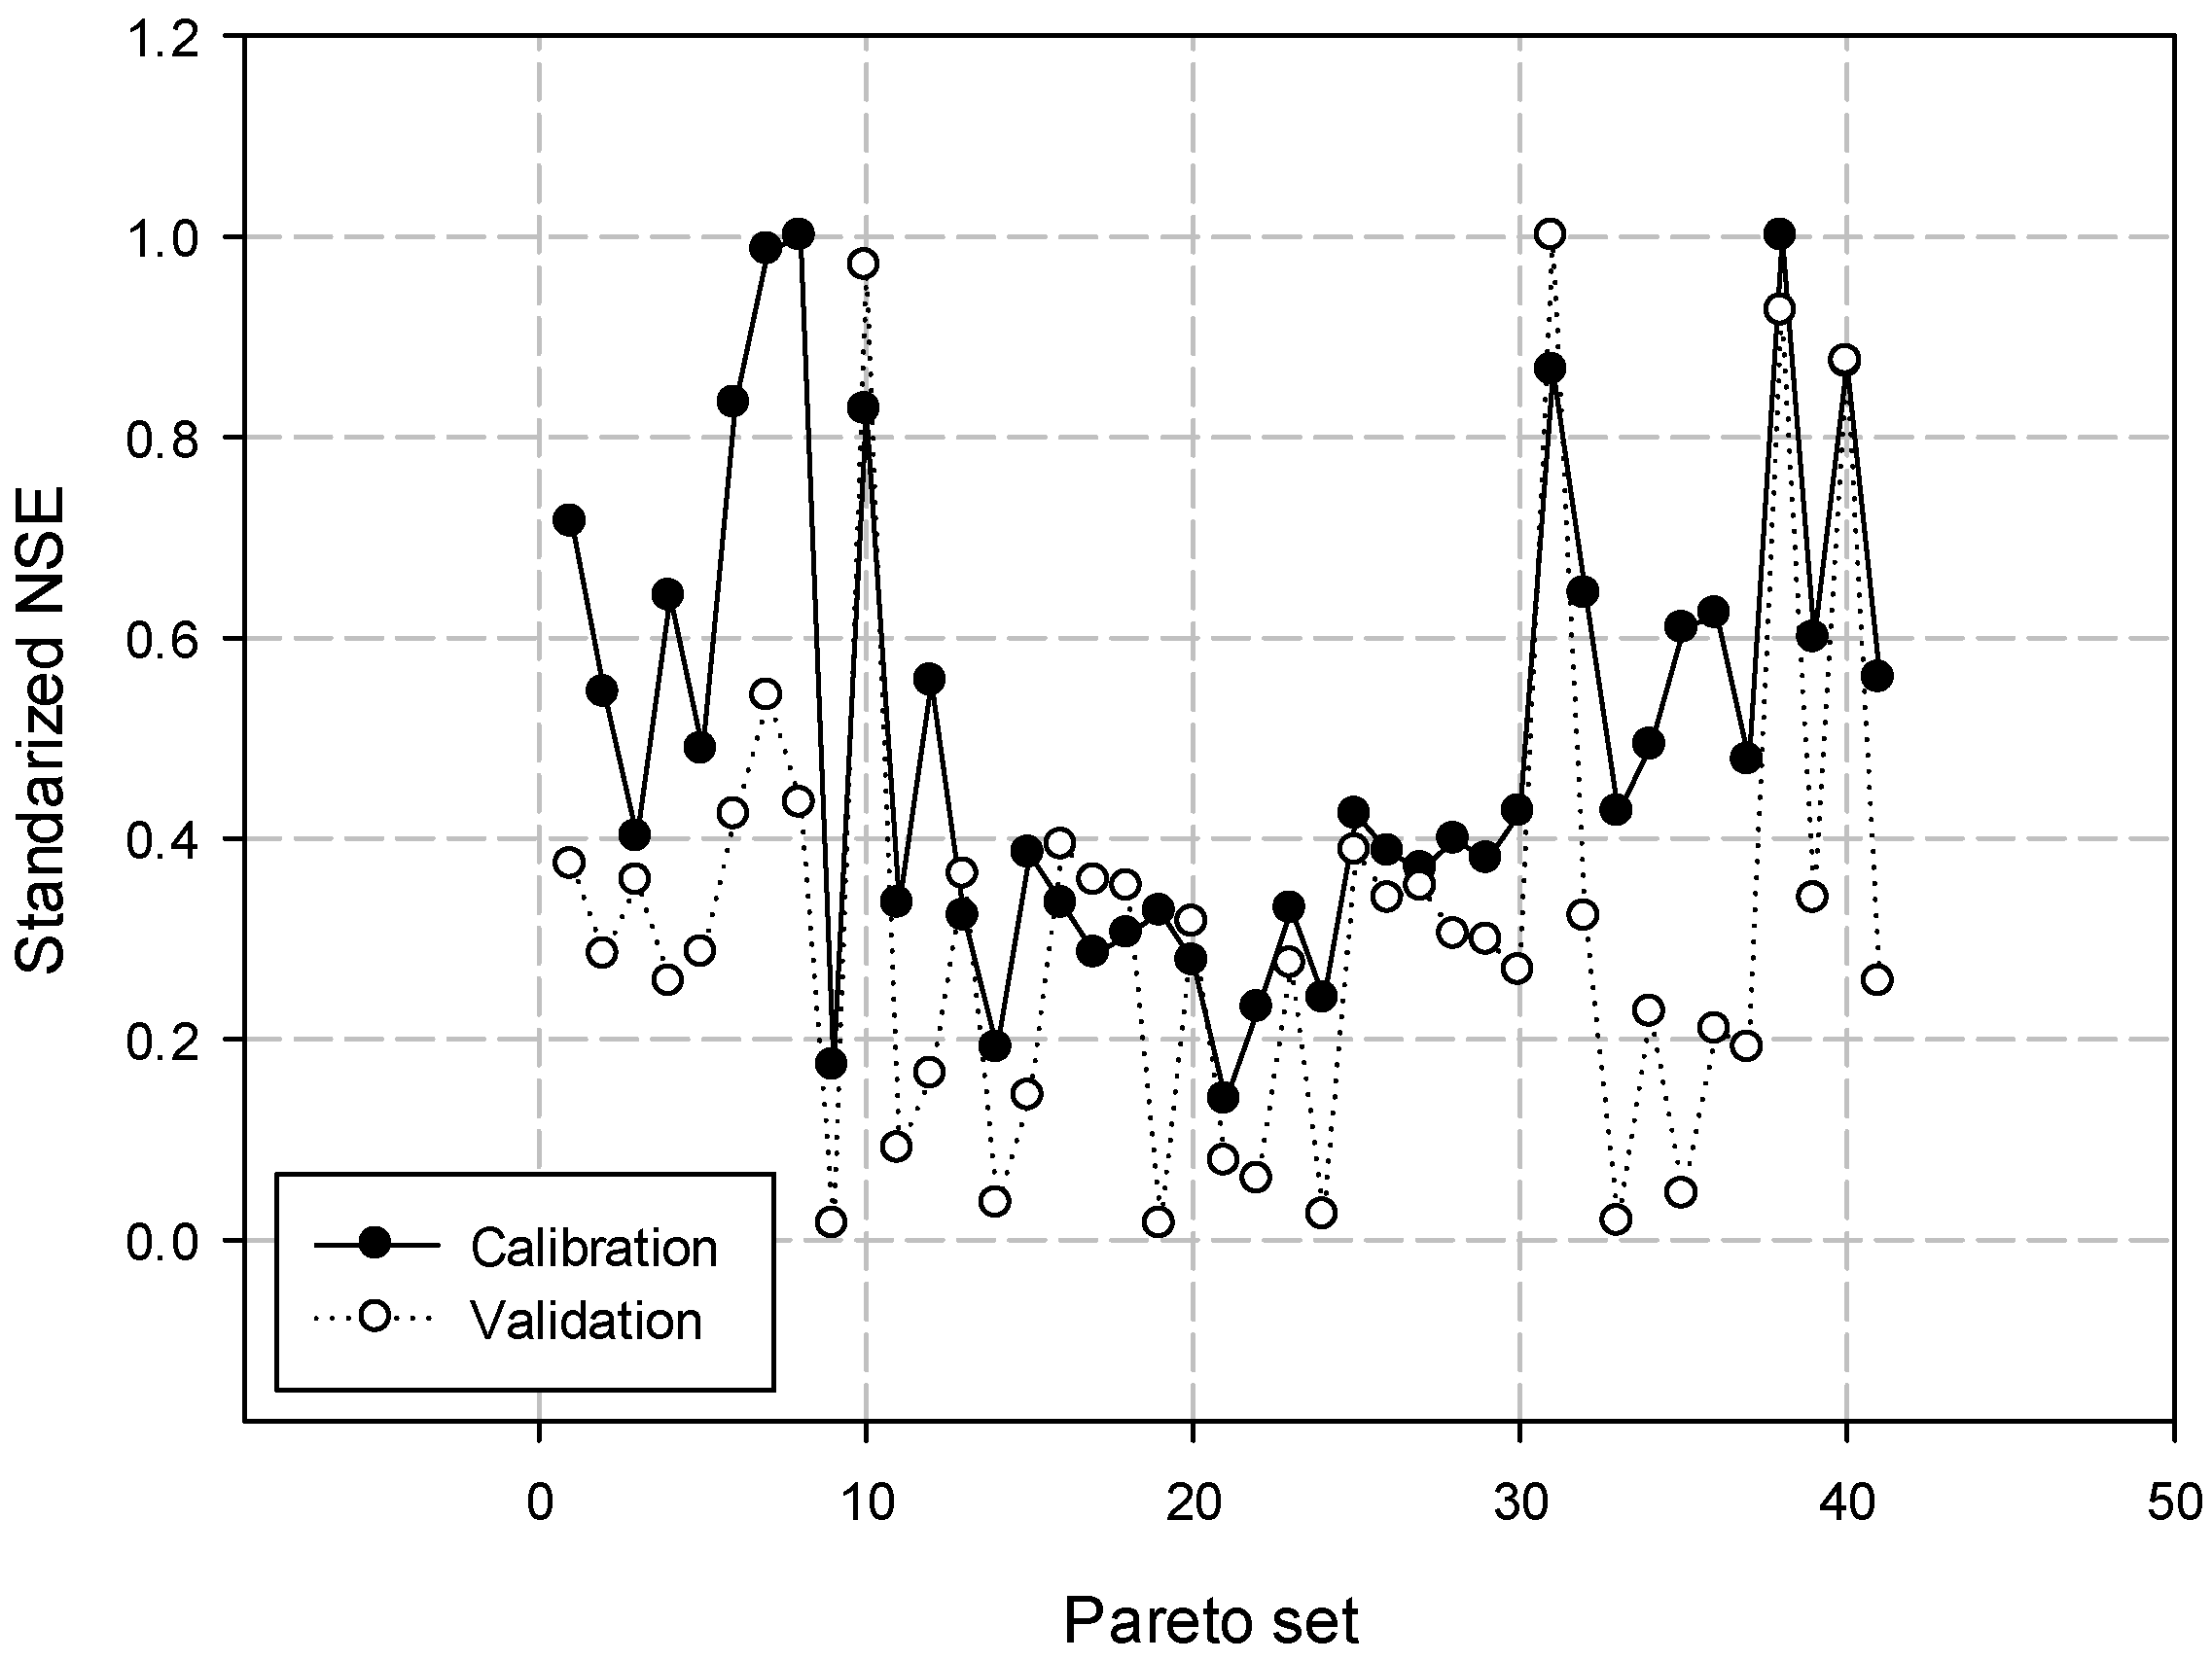
3.1. Calibration of ROPS Candidates
| # of Alt. | Weights | Calibration | Evaluation | Final Rank | |||
|---|---|---|---|---|---|---|---|
| E1 | E2 | Averaged Regret to Ideal NSEs | Rank | Averaged Regret to Ideal NSEs | Rank | ||
| 9 | 0.8 | 0.2 | 0.173 | 2 | 0.015 | 2 | 1 |
| 11 | 0.75 | 0.25 | 0.334 | 13 | 0.090 | 9 | 7 |
| 14 | 0.675 | 0.325 | 0.191 | 3 | 0.036 | 5 | 3 |
| 15 | 0.65 | 0.35 | 0.384 | 16 | 0.143 | 10 | 9 |
| 19 | 0.55 | 0.45 | 0.327 | 10 | 0.015 | 2 | 6 |
| 20 | 0.525 | 0.475 | 0.277 | 6 | 0.315 | 23 | 10 |
| 21 | 0.5 | 0.5 | 0.139 | 1 | 0.077 | 8 | 2 |
| 22 | 0.475 | 0.525 | 0.230 | 4 | 0.060 | 7 | 5 |
| 24 | 0.425 | 0.575 | 0.240 | 5 | 0.024 | 4 | 4 |
| 33 | 0.2 | 0.8 | 0.426 | 22 | 0.018 | 3 | 8 |
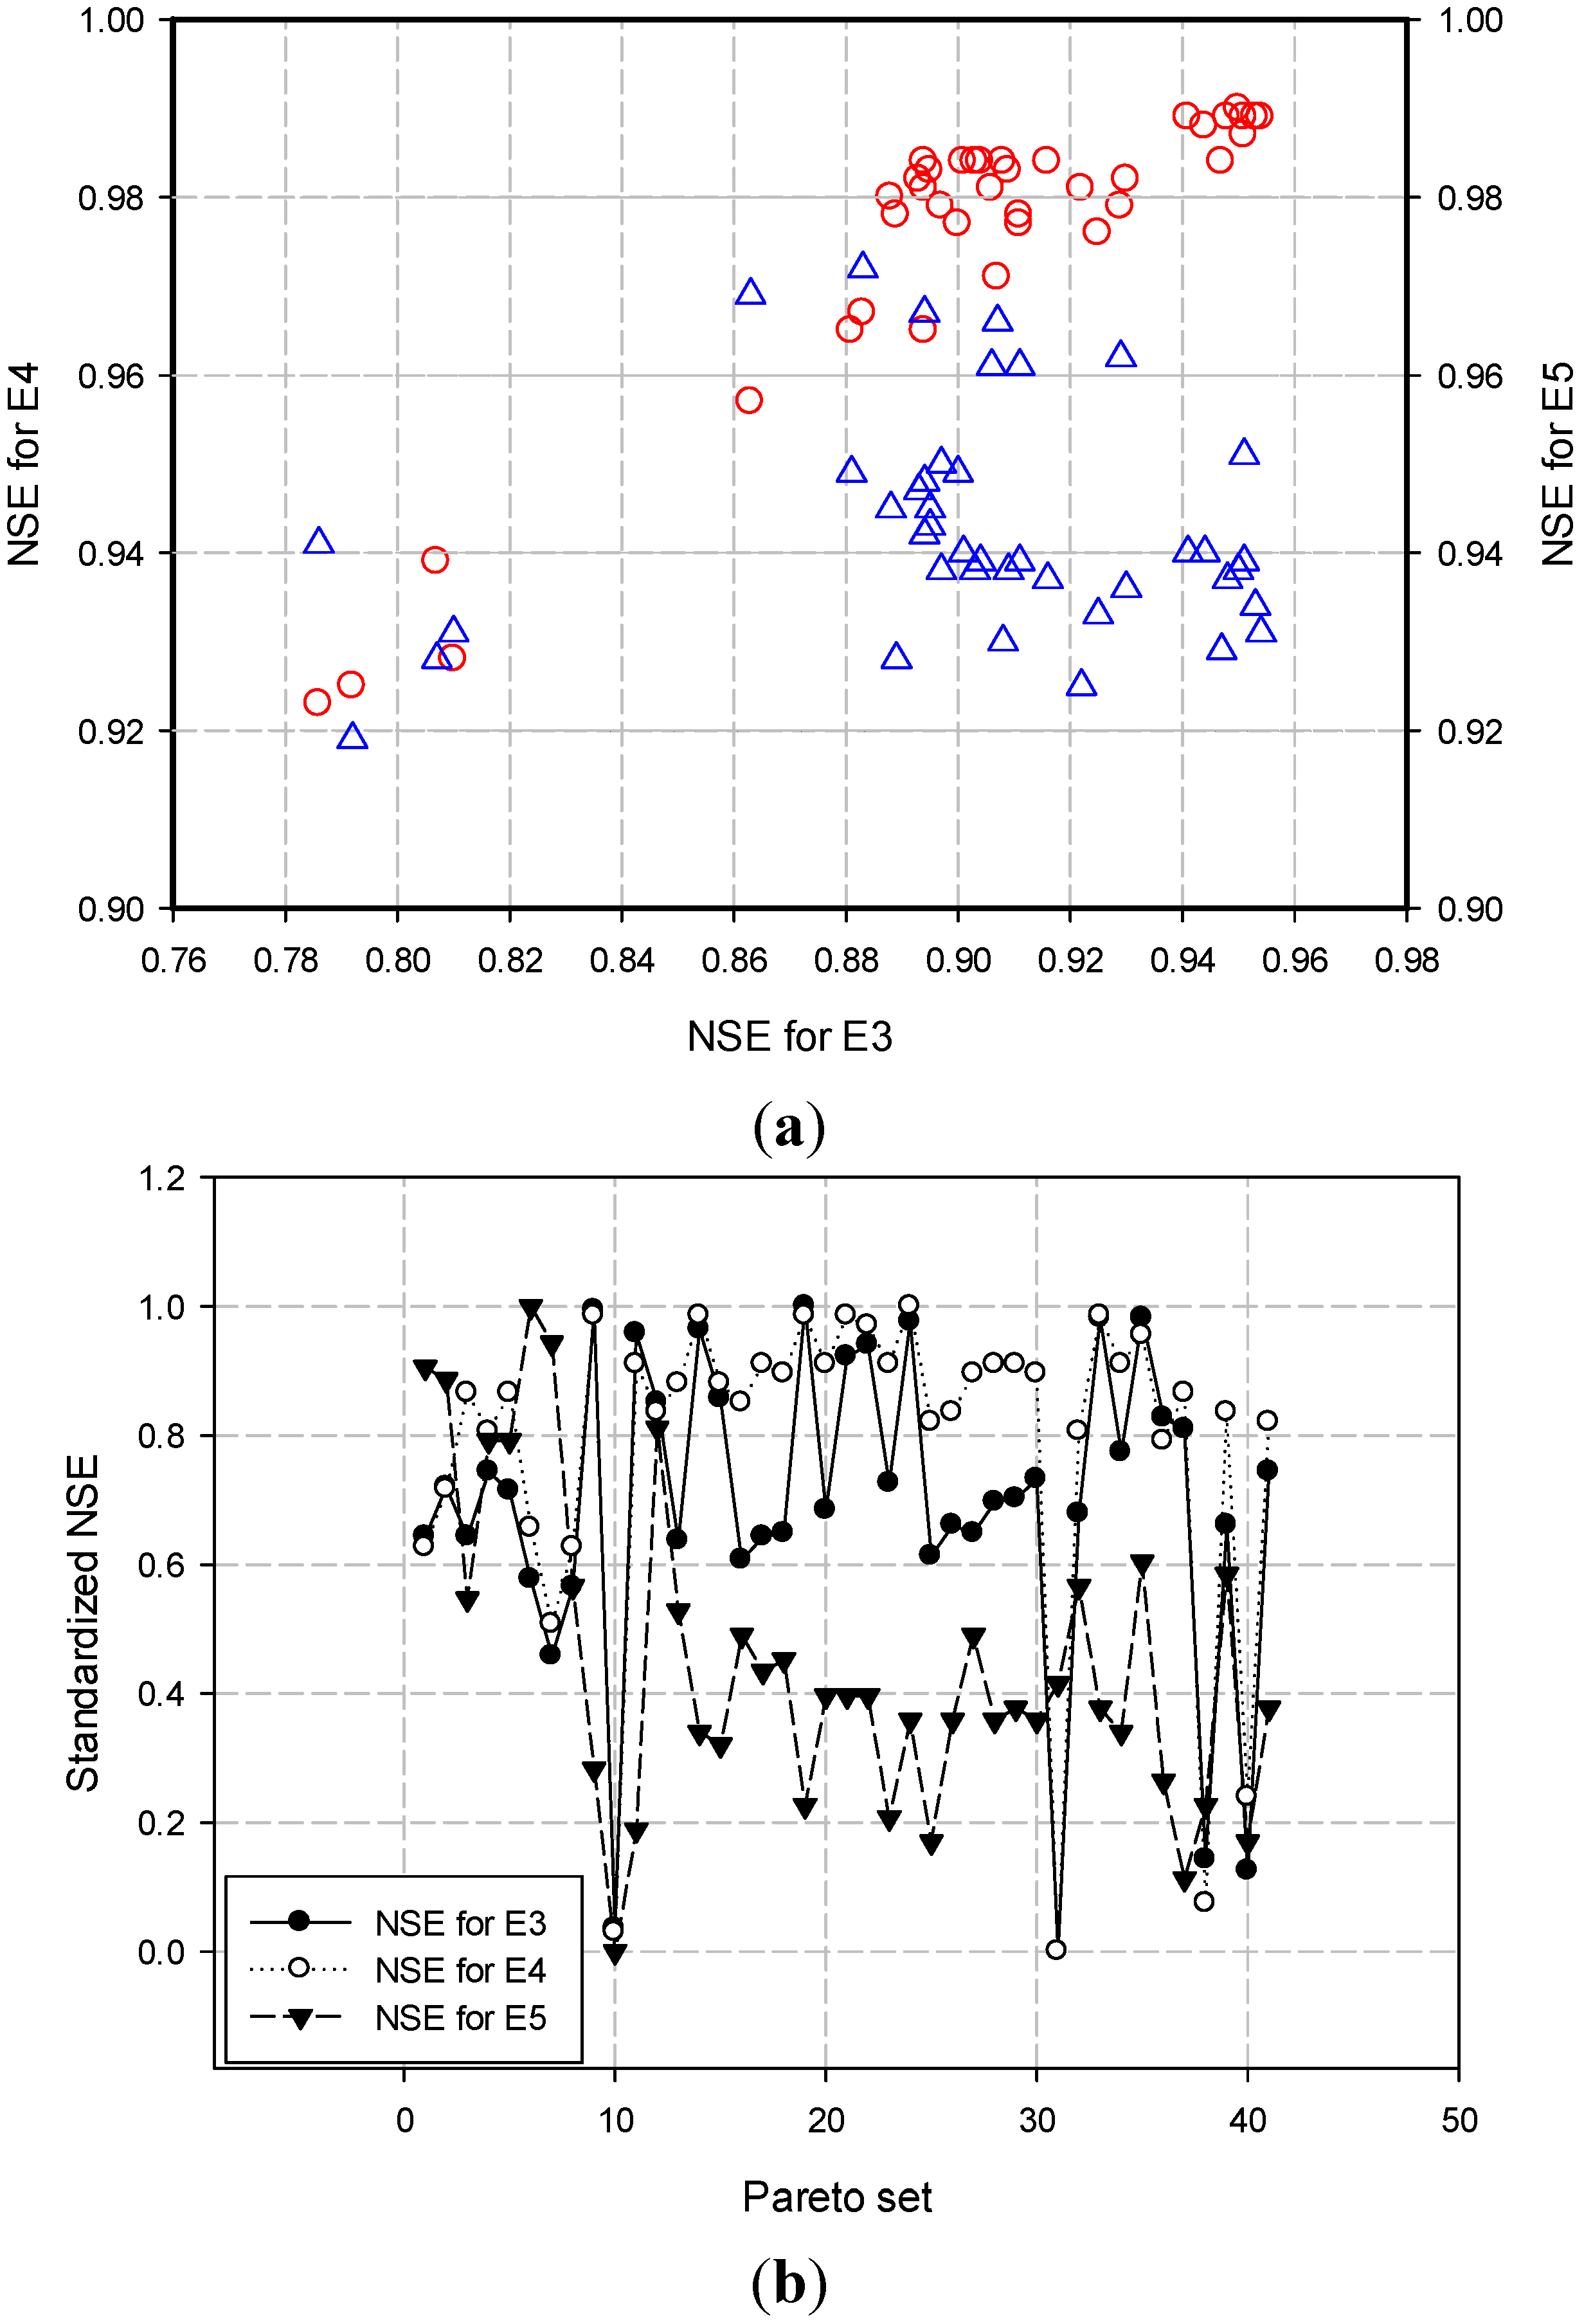
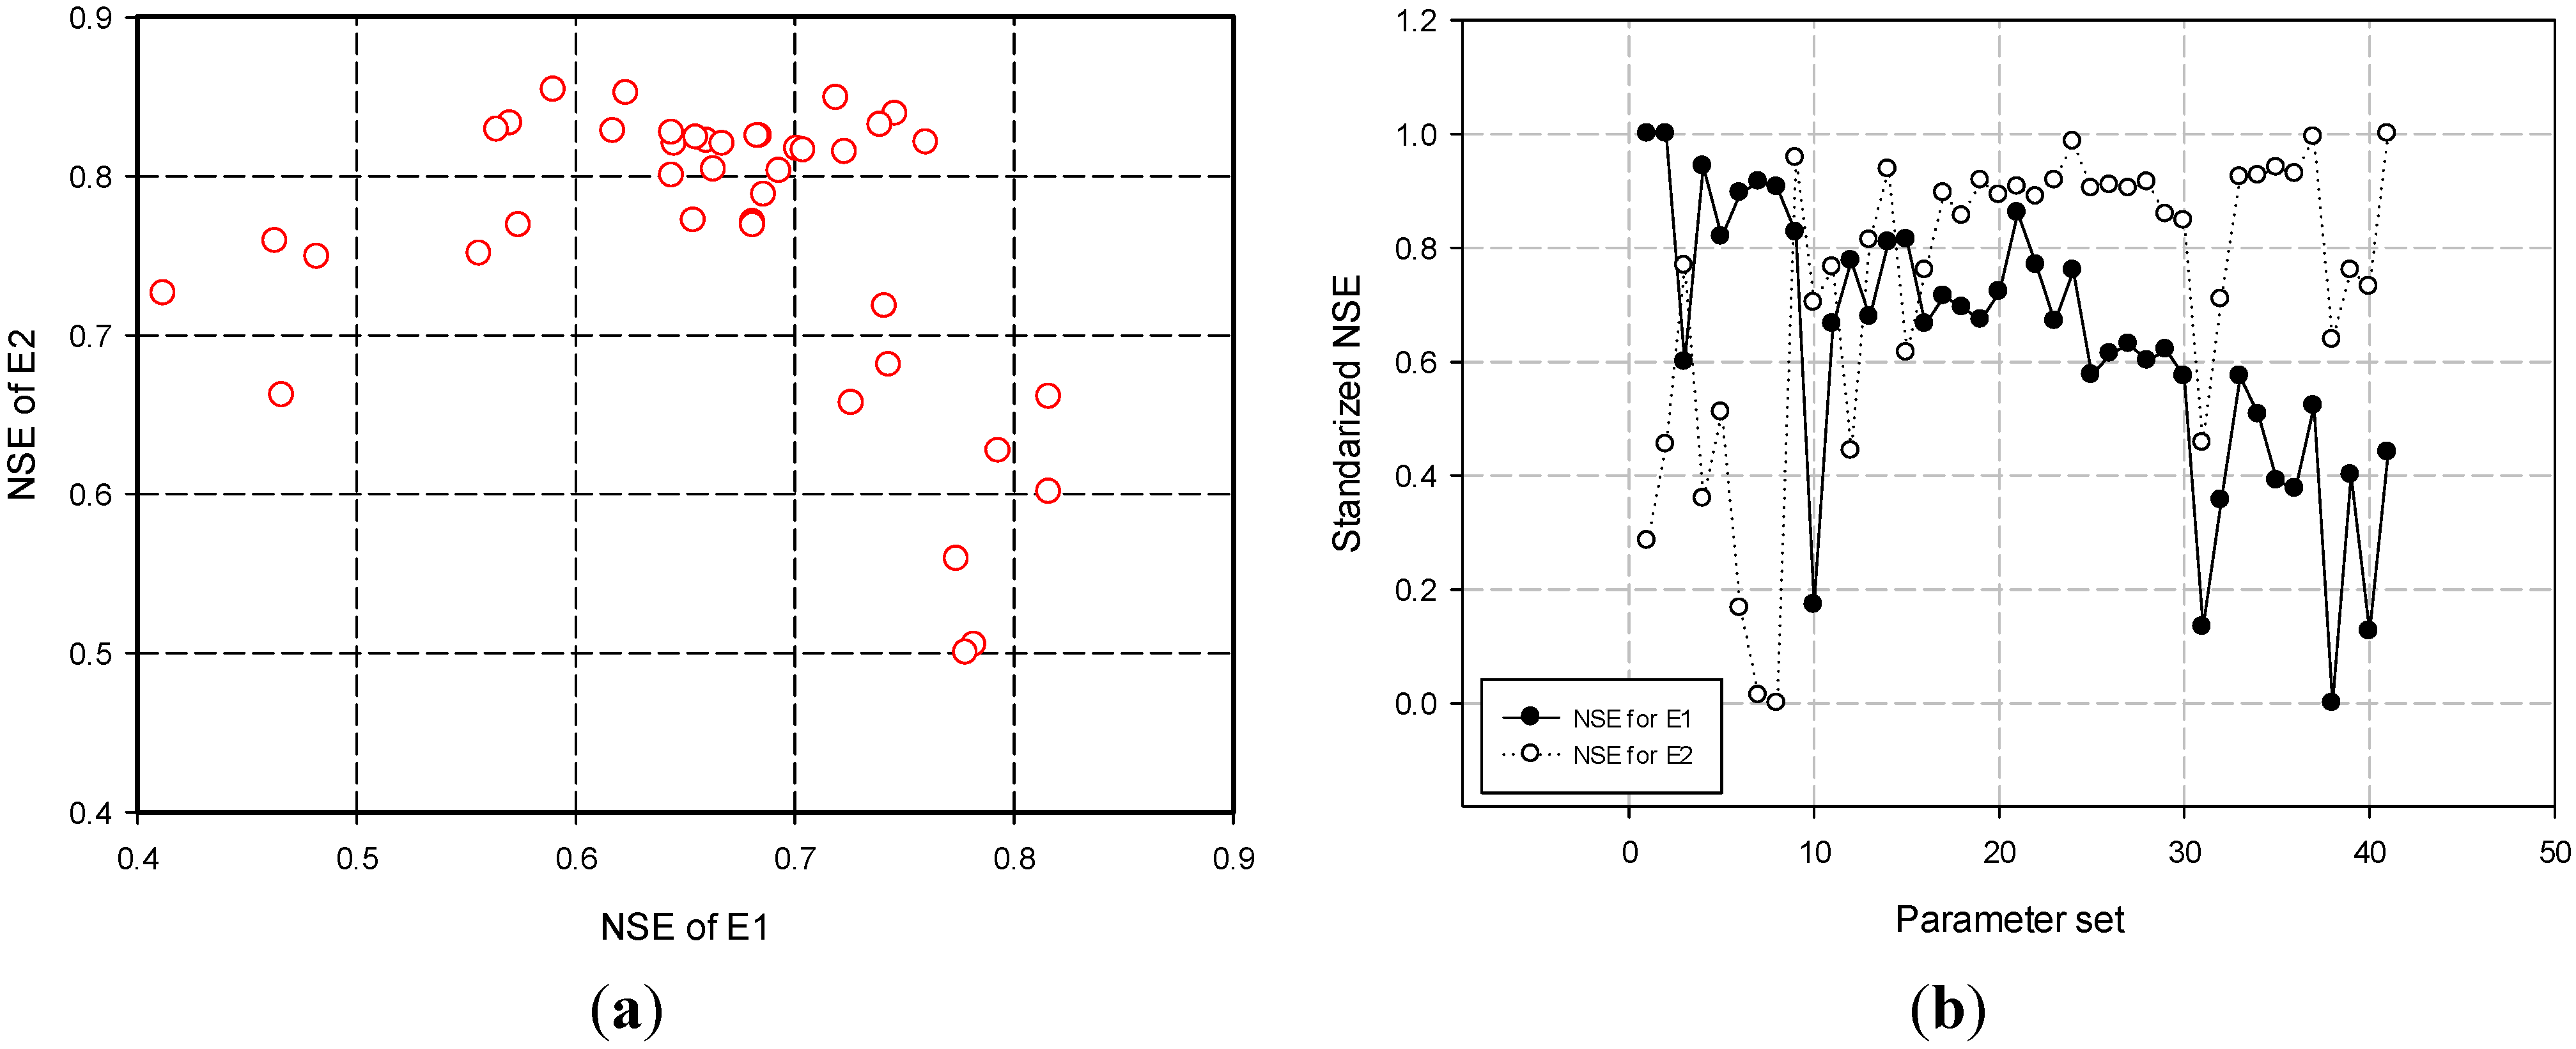
3.2. Selection of ROPS
3.2.1. NSE-Only with Both Calibration and Evaluation Sets


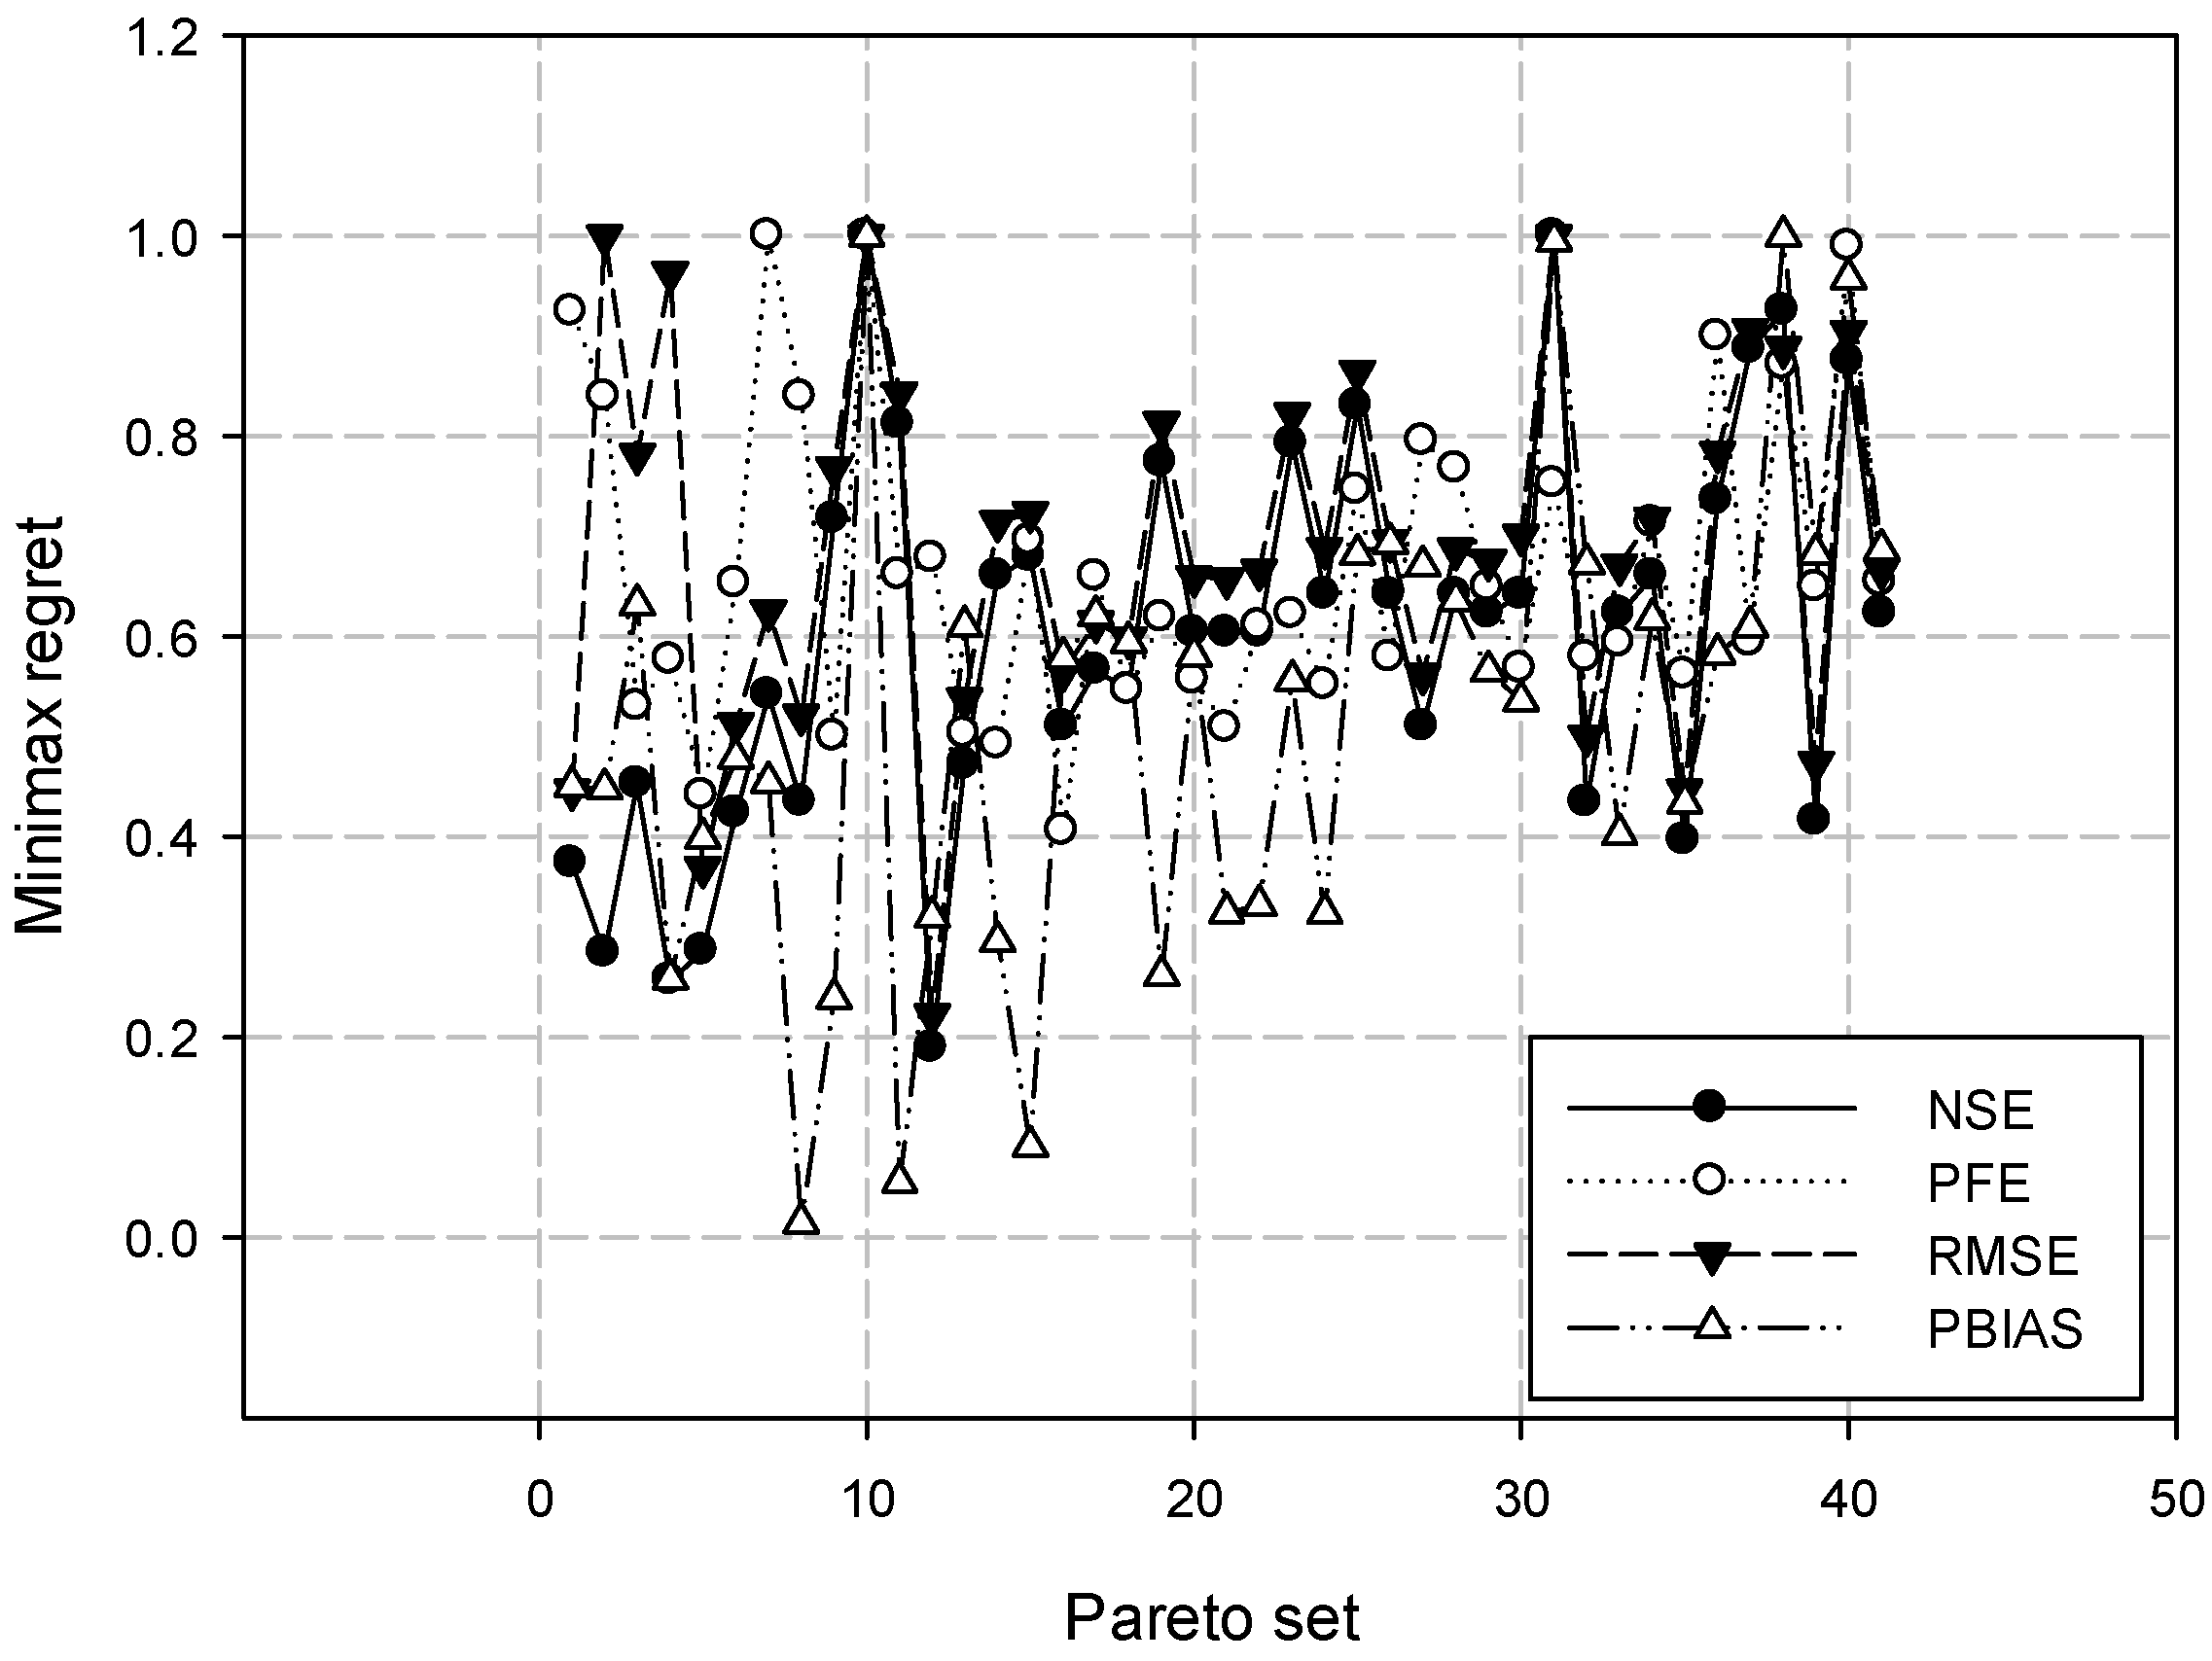
3.2.2. Multiple Performance Measures with Evaluation Set Only

| Performance Measures | NSE | PFE | RMSE | PBIAS |
|---|---|---|---|---|
| NSE | 1 | 0.2539 | 0.7243 | 0.2719 |
| PFE | -- | 1 | 0.2537 | 0.2940 |
| RMSE | -- | -- | 1 | 0.1522 |
| PBIAS | -- | -- | -- | 1 |
| Number of Parameter Set | Weights | Performance Measures | Average Ranking | Final Ranking | ||||
|---|---|---|---|---|---|---|---|---|
| E1 | E2 | NSE | PFE | RMSE | PBIAS | |||
| 5 | 0.900 | 0.100 | 4 | 2 | 2 | 12 | 5 | 1 |
| 35 | 0.150 | 0.875 | 6 | 11 | 4 | 14 | 8.75 | 2 |
| 12 | 0.725 | 0.275 | 1 | 27 | 1 | 8 | 9.25 | 3 |
| 16 | 0.625 | 0.375 | 13 | 1 | 11 | 22 | 11.75 | 4 |
| 21 | 0.500 | 0.500 | 18 | 6 | 15 | 10 | 12.25 | 5 |
| 8 | 0.825 | 0.175 | 10 | 34 | 8 | 1 | 13.25 | 6 |
| 13 | 0.700 | 0.300 | 12 | 5 | 9 | 27 | 13.25 | 6 |
| 6 | 0.875 | 0.125 | 8 | 23 | 7 | 18 | 14 | 8 |
| 4 | 0.925 | 0.075 | 2 | 13 | 38 | 5 | 14.5 | 9 |
| 18 | 0.575 | 0.425 | 16 | 8 | 12 | 25 | 15.25 | 10 |
4. Conclusions
Acknowledgments
Author Contributions
Conflicts of Interest
References
- Beven, K.J. Rainfall-Runoff Modeling: The Primer; John Wiley & Sons Press: New York, NY, USA, 2000. [Google Scholar]
- Khu, S.T.; Madsen, H. Multiobjective calibration with Pareto preference ordering: An application to rainfall-runoff model calibration. Water Resour. Res. 2005, 41. [Google Scholar] [CrossRef]
- Yapo, P.O.; Gupta, H.V.; Sorooshian, S. Multi-objective global optimization for hydrologic models. J. Hydrol. 1998, 204, 83–97. [Google Scholar] [CrossRef]
- Cheng, C.-T.; Ou, C.P.; Chau, K.W. Combining a fuzzy optimal model with a genetic algorithm to solve multi-objective rainfall-runoff model calibration. J. Hydrol. 2002, 268, 72–86. [Google Scholar] [CrossRef]
- Hejazi, M.; Cai, X.; Borah, D.K. Calibrating a watershed simulation model involving human interference: An application of multi-objective genetic algorithms. J. Hydroinf. 2008, 10, 97–111. [Google Scholar] [CrossRef]
- Khu, S.T.; Madsen, H.; di Pierro, F. Incorporating multiple observations for distributed hydrologic model calibration: An approach using a multi-objective evolutionary algorithm and clustering. Adv. Water Resour. 2008, 31, 1387–1398. [Google Scholar] [CrossRef]
- Gong, Y.; Shen, Z.; Liu, R.; Hong, Q.; Wu, X. A comparison of single- and multi-gauge based calibrations for hydrological modeling of the Upper Daning River watershed in China’s Three Gorges reservoir region. Hydrol. Res. 2012, 43, 822–832. [Google Scholar] [CrossRef]
- Madsen, H. Automatic calibration of a conceptual rainfall-runoff model using multiple objectives. J. Hydrol. 2000, 235, 276–288. [Google Scholar] [CrossRef]
- Li, X.; Weller, D.E.; Jordan, T.E. Watershed model calibration using multi-objective optimization and multi-site averaging. J. Hydrol. 2010, 380, 277–288. [Google Scholar] [CrossRef]
- Wang, W. Multi-site calibration, validation, and sensitivity analysis of the MIKE SHE model for a large watershed in Northern China. Hydrol. Earth Syst. Sci. 2012, 16, 4621–4632. [Google Scholar] [CrossRef]
- Saeidifarzad, B.; Nourani, V.; Aalami, M.T.; Chau, K.W. Multi-site calibration of linear reservoir based geomorphologic rainfall-runoff model. Water 2014, 6, 2690–2716. [Google Scholar] [CrossRef]
- Dayaratne, S.T.; Perera, B.J.C. Calibration of urban stormwater drainage models using hydrograph modeling. Urban Water J. 2004, 1, 283–297. [Google Scholar] [CrossRef] [Green Version]
- Di Pierro, F.; Khu, S.T.; Savic, D. From single-objective to multiple-objective multiple-rainfall events automatic calibration of urban storm water runoff models using genetic algorithms. Water Sci. Technol. 2006, 54, 57–64. [Google Scholar] [CrossRef] [PubMed]
- Gamerith, V.; Gruber, G.; Muschalla, D. Single- and Multievent Optimization in Combined Sewer Flow and Water Quality Model Calibration. J. Environ. Eng. 2011, 137, 551–558. [Google Scholar] [CrossRef]
- Shinma, T.A.; Reis, L.F.R. Incorporating multi-event and multi-site data in the calibration of SWMM. Proc. Eng. 2014, 79, 75–84. [Google Scholar] [CrossRef]
- Bardossy, A.; Sing, S.K. Robust estimation of hydrological model parameters. Hydrol. Earth Syst. Sci. 2008, 12, 1273–1283. [Google Scholar] [CrossRef]
- Guo, Y.; Baetz, B. Sizing of rainfall storage units for green building applications. J. Hydrol. Eng. 2007, 12, 197–205. [Google Scholar] [CrossRef]
- Chung, E.S.; Kim, Y. Development of fuzzy multi-criteria approach to prioritize locations of treated wastewater use considering climate change scenarios. J. Environ. Manag. 2014, 146, 505–516. [Google Scholar] [CrossRef]
- Kim, Y.; Chung, E.S. An index-based robust decision making framework for watershed management in a changing climate. Sci. Total Environ. 2014, 473–474, 88–102. [Google Scholar] [CrossRef] [PubMed]
- Kim, Y.; Chung, E.S.; Jun, S.M. Iterative framework for robust reclaimed wastewater allocation in a changing environment using multi-criteria decision making. Water Resour. Manag. 2015, 29, 295–311. [Google Scholar] [CrossRef]
- Hof, A.F.; van Vuuren, D.P.; den Elzen, M.G.J. A quantitative minimax regret approach to climate change: Does discounting still matter? Ecol. Econ. 2010, 70, 43–51. [Google Scholar] [CrossRef]
- Nash, J.E.; Sutcliffe, J.V. River flow forecasting through conceptual models: Part 1—A discussion of principles. J. Hydrol. 1970, 125, 221–241. [Google Scholar] [CrossRef]
- Huber, W.C.; Heaney, J.P.; Nix, S.J.; Dickonson, R.E.; Polman, D.J. Storm Water Management Model Model; User’s Manual, Version III; U.S. Environment Protection Agency: Cincinnati, OH, USA, 1982.
- Holland, J.H. Adaptation in Natural and Artificial Systems; University of Michigan Press: Ann Arbor, MI, USA, 1975. [Google Scholar]
- Goldberg, D.E. Genetic Algorithms in Search, Optimization and Machine Learning; Addison-Wesley: Boston, MA, USA, 1989. [Google Scholar]
- Gupta, H.V.; Sorooshian, S.; Yapo, P.O. Toward improved calibration of hydrologic models: Multiple and noncommensurable measures of information. Water Resour. Res. 1998, 34, 751–763. [Google Scholar] [CrossRef]
- Loulou, R.; Kanudia, A. Minimax regret strategies for greenhouse has abatement: Methodology and application. Oper. Res. Lett. 1999, 25, 219–230. [Google Scholar] [CrossRef]
- Chung, E.S.; Won, G.J.; Kim, Y.; Lee, H. Water resources vulnerability characteristics by district’s population size in a changing climate using subjective and objective weights. Sustainability 2014, 6, 6141–6157. [Google Scholar] [CrossRef]
- Jun, K.S.; Sung, J.Y.; Chung, E.S.; Lee, K.S. Development of spatial water resources vulnerability index considering climate change impacts. Sci. Total Environ. 2011, 409, 5228–5242. [Google Scholar] [CrossRef] [PubMed]
- Huber, W.C.; Dickinson, R.E. Storm Water Management Model, Version 4: User’s Manual. EPA/600/3–88/001a. U.S; Environmental Protection Agency: Athens, Greece, 1988. [Google Scholar]
- Afshar, M.H.; Afshar, A.; Marino, M.A.; Darbandi, A.A.S. Hydrograph-based storm sewer design optimization by genetic algorithm. Can. J. Civil Eng. 2006, 33, 319–325. [Google Scholar] [CrossRef]
- Kang, T.; Lee, S. Modification of the SCE-UA to include constraints by embedding an adaptive penalty function and application: Application approach. Water Resourc. Manag. 2014, 28, 2145–2159. [Google Scholar] [CrossRef]
© 2015 by the authors; licensee MDPI, Basel, Switzerland. This article is an open access article distributed under the terms and conditions of the Creative Commons Attribution license (http://creativecommons.org/licenses/by/4.0/).
Share and Cite
Kim, Y.; Chung, E.-S.; Won, K.; Gil, K. Robust Parameter Estimation Framework of a Rainfall-Runoff Model Using Pareto Optimum and Minimax Regret Approach. Water 2015, 7, 1246-1263. https://doi.org/10.3390/w7031246
Kim Y, Chung E-S, Won K, Gil K. Robust Parameter Estimation Framework of a Rainfall-Runoff Model Using Pareto Optimum and Minimax Regret Approach. Water. 2015; 7(3):1246-1263. https://doi.org/10.3390/w7031246
Chicago/Turabian StyleKim, Yeonjoo, Eun-Sung Chung, Kwangjae Won, and Kyungik Gil. 2015. "Robust Parameter Estimation Framework of a Rainfall-Runoff Model Using Pareto Optimum and Minimax Regret Approach" Water 7, no. 3: 1246-1263. https://doi.org/10.3390/w7031246