Article

Stable Isotopic Analysis on Water Utilization of Two Xerophytic Shrubs in a Revegetated Desert Area: Tengger Desert, China

1
Shapotou Desert Research and Experimental Station, Cold and Arid Regions Environmental and Engineering Research Institute, CAS, Lanzhou 730000, China
2
Key Laboratory of Stress Physiology and Ecology in Cold and Arid Regions Gansu Province, Lanzhou 730000, China
*
Author to whom correspondence should be addressed.
Water 2015, 7(3), 1030-1045; https://doi.org/10.3390/w7031030
Submission received: 4 December 2014 / Revised: 13 February 2015 / Accepted: 27 February 2015 / Published: 12 March 2015

Abstract

:
Stable isotope studies on stable isotope ratios of hydrogen and oxygen in water within plants provide new information on water sources and water use patterns under natural conditions. In this study, the sources of water uptake for two typical xerophytic shrubs, Caragana korshinskii and Artemisia ordosica, were determined at four different-aged revegetated sites (1956, 1964, 1981, and 1987) in the Tengger Desert, a revegetated desert area in China. Samples from precipitation, soil water at different soil layers, and xylem water from each species were collected in 2013. The proportion of plant water sources derived from different potential sources was determined using oxygen (δ18O) and hydrogen (δD) stable isotope analysis combined with a multiple-source linear mixing model. Results showed that the local meteoric water line (LMWL) at Shapotou was as follows: δD = 7.39δ18O + 3.91 (R2 = 0.93; n = 26). The vertical distribution of soil water content in older vegetation areas (1956a and 1964a) was much lower than that in relatively younger vegetation areas (1981a and 1987a). Mean soil water δD and δ18O values varied with depth, and the variation decreased as the age of the revegetated site increased. In general, C. korshinskii and A. ordosica mainly tapped water from the upper soil layer (10–100 cm) during the wet seasons. With increasing sand stabilization age, the proportion of water sources from shallow soil water decreased, whereas deep soil moisture utilization increased. During the dry season, C. korshinskii and A. ordosica showed evident hierarchical utilization of soil water in different soil layers. Small rainfall events did not significantly affect the water source of C. korshinskii and A. ordosica. However, large rainfall events not only complemented the deep soil moisture, but also recharged the shallow soil water after a few days, and the proportion of soil water source from deep soil layer increased from 2% ± 0.7% to 10% ± 1.4% for both plants.

1. Introduction

In arid desert areas, artificial vegetation restoration is considered as one of the most effective ways to combat desertification and land degradation [1,2]. Xerophytic shrubs, such as Caragana korshinskii Kom. and Artemisia ordosica Krasch, have been planted at the southeastern fringe of the Tengger Desert in Western China since 1956. The artificial vegetation construction has shown remarkable progress over the last 50 years and has effectively prevented further desertification and promoted local habitat restoration [3]. However, a number of problems have been observed in practice, such as a decline in groundwater and the death of sand-binding vegetation in some regions, thereby directly effecting the sustainability of the ecological restoration and the sand-binding efficiency of the vegetation [4]. The main reason for such problems was poor understanding of water requirements of the desert living plants [5]. Water is the key abiotic limiting factor in ecosystem-driven processes, and precipitation, as the sole source of soil water replenishment in the Tengger Desert, plays an important role in sustaining the desert ecosystem, determining the mass transfer process in the soil and vegetation ecosystem [4]. Thus, it is necessary to determine the water utilization sources of the revegetated xerophytic shrubs and their adaptation strategies [6,7].
Stable isotopes and their potential application for detecting various and complex ecosystem processes are gaining the interest of an increasing number of scientists [8,9,10]. Stable isotopes are powerful tools for detecting water movement along the soil plant–atmosphere continuum system [11,12]. It has been widely used in arid and semi-arid environments to assess plant water uptake patterns, water competition, and partitioning among plants [13,14,15,16]. For example, in Arizona and Utah, three dominant tree species were studied; Pinus edulis and Juniperus osteosperma used a large proportion of monsoon precipitation, whereas Quercus gambelii utilized only deep soil water even during the substantial summer precipitation [17]. Eucalyptus spp. used various combinations of groundwater, rainfall-derived shallow soil water, and stream water in Australia [18,19]. Trees along a perennial, montane stream in California absorbed water from upper soil layers early in the growing season, and then used groundwater primarily when the soil dries [20]. In western Arizona, Populus fremontii and Salix gooddingii used groundwater throughout the entire growing season at perennial and ephemeral streams, regardless of groundwater depth [21]. Moreover, in the semiarid Mu-Us desert, native Sabina vulgaris and introduced Salix matsudana trees use relatively deep soil water and groundwater, whereas the shrub A. ordosica utilize only shallow soil water [22]. However, in the Shapotou revegetated areas, precipitation was the sole source of water replenishment, and the water use strategy of the xerophytic shrubs was an important eco-hydrology mechanism underlying the maintenance of plant community stability [3,4]. Furthermore, the transpiration of A. ordosica was affected by precipitation at different time scales; precipitation at the hourly time scale was particularly interesting because a small amount of precipitation would increase the sap flow and the transpiration; however, sap flow and transpiration decrease when precipitation is high [5]. Therefore, soil water dynamics induced by precipitation possibly elicit a great effect on plant water use strategy [23]. Although previous studies addressed various components of tree water sources, questions still remain about the integrated effects of ecosystem succession and variations on the ability of revegetated shrubs to take up precipitation at revegetated sites of different ages during the growing season. Moreover, quantitative studies are also lacking. By analyzing the isotopic composition of soil water, rainfall, and xylem water, this study examined water sources and water utilization strategies of C. korshinskii and A. ordosica growing at four revegetated sites of different ages (established on 1956, 1964, 1981, and 1987) in the Tengger Desert, a revegetated desert area in China. The specific objectives of this study were to determine the sources of water uptake of the two xerophytic shrubs at different revegetated sites and to evaluate how precipitation affected plant water use patterns and water utilization strategies during the growing season. Our goal was to provide a scientific basis to understand plant water use mechanisms and to obtain new insights into the plant–soil water relationship of xerophytic shrubs in revegetated desert areas.

2. Materials and Methods

2.1. Study Site

The study was conducted at Shapotou Desert Research and Experimental Station of the Chinese Academy of Sciences, located in the Shapotou region at the southeastern margin of the Tengger Desert (37°32'N, 105°02'E). The climate at the site is characterized by abundant sunshine and low relative humidity. The average monthly relative humidity is at its minimum of 33% in April and at its maximum of 54.9% in August. The elevation of the area is 1330 m, and the mean annual precipitation is 188.2 mm. The mean annual temperature is 9.6 °C, and the evapotranspiration potential during the growing season (May to September) is 2300–2500 mm.
To ensure the smooth operation of the desert section of the Baotou–Lanzhou railway, a system involving sand-binding vegetation was established by the Chinese Academy of Sciences and other related departments starting from 1956. First, mechanical sand fences were installed at right angles to prevailing winds. Second, 1 m × 1 m straw sand barriers were erected in a checkerboard pattern behind the mechanical sand fences. Under non-irrigation conditions, xerophytic shrubs, dominated by C. korshinskii and A. ordosica, were planted at a spacing of 1 m × 2 m or 2 m × 3 m with a checkerboard of straw barriers as a protective screen. This ecological shelter was extended in 1964, 1981 and 1987. Finally, a 16-km-long protective system of vegetation was eventually established. Our research site, which was 500 m wide on the northern part and 200 m wide on the southern part of the railway, was a part of this protective system. Fifty years after the establishment of the vegetation, the environment in the area had improved, and the stabilized sand surface created conditions that support the colonization of many species. The mass propagation of psammophytes has also transformed the original moving sand into a complex man-made and natural desert vegetation landscape [2]. This ecological engineering project was viewed as a successful model of desertification control and ecological restoration along the transport line in the arid desert region of China.

2.2. Methods

2.2.1. Plant and Soil Samples

Three C. korshinskii plants and three A. ordosica plants in each revegetated site were tagged for isotopic analysis. Trees with average height and breast height diameter according to stand investigation were selected. Twig samples were collected once a month during the growing season on the following dates: 25 April 2013, 27 May 2013, 25 June 2013, 26 July 2013, 27 August 2013, 25 September 2013 and 25 October 2013. The twigs were cut from live branches of selected individuals (n = 3, for both C. korshinskii and the A. ordosica) consisting of 1–2 cm of stem material with a diameter of approximately 0.2–0.5 cm. These twig samples were obtained from randomized locations in each tree. The bark was immediately (less than 1 min) removed from the stem samples and stored in small vials sealed with Teflon-lined screw caps and parafilm. Plant samples were collected in the late morning hours (10 AM–12 PM) of each collection day and then taken to the laboratory within 10 min where the stem segments were frozen at −30 °C until water was extracted in the following days in the laboratory. Three individuals of each species were sampled for isotopic analysis, with three replicates per individual. Concurrent with plant tissue sampling, soil samples from each revegetated site were collected with a bucket auger at seven depths (5, 10, 20, 60, 100, 150 and 200 cm) from a borehole located beneath each of the three randomly selected mature C. korshinskii and the A. ordosica shrubs. Soil samples were divided into two parts, one part was used for isotopic analysis and the other part was used for gravimetric analysis of water content. The soil samples for stable isotope composition determination were sealed in vials with Teflon-lined screw caps and parafilm, soil water content was determined by drying samples at 105 °C for 24 h. Precipitation in 2013 was collected using a standard rain gauge, which was installed with a polyethylene bottle and a funnel to collect rainwater, at the Automatic Weather Station (AWS) of the Shapotou Station during the experimental period. A ping-pong ball was placed in the bottle to prevent evaporation.
We investigated the effects of a relatively small amount of rainfall (1.4 mm on 1 July 2013) and a large rainfall event (9.5 mm on 7 August 2013) on water uptake by C. korshinskii and A. ordosica plants. We collected the soil and the xylem samples on 1, 2 and 4 July 2013 and 7, 10 and 15 August 2013 after rainfall occurred during the growing season of 2013. The sampling method used was the same as that described above. After collection was completed, all of the samples for stable isotope analysis were immediately stored in a refrigerator and then transported to the laboratory.

2.2.2. Isotope Analysis

Plant and soil samples were frozen and then thawed overnight using a cryogenic vacuum distillation method before water was extracted [24]. The D and 18O contents of the stem, soil, precipitation and river water was measured using a Flash 2000 HTelemental analyzer (Thermo Scientific, Bremen, Germany) coupled to a Finnigan MAT253 isotope ratio mass spectrometer. 18O content was determined with the H2O–CO2 equilibration method [25], and D content was determined with the gaseous H2–H2O equilibration technique [26]. Overall analytical precision of the spectrometer was ± <0.2‰ for δ18O and ± <1‰ for δD. The 18O and D content of a water sample (δsample) was expressed in delta notation (&) relative to the V-SMOW standard (Vienna Standard Mean Ocean Water):
δ s a m p l e = [ R s a m p l e R V S N O W 1 ]
where R represents the ratio of heavy to light isotopes (18O/16O or D/H).
Plant water use from different soil depths was calculated using the Iso-Source mixing model (freely available at http://www.epa.gov/wed/pages/models.htm) [27]. This model provides the distribution of proportions of feasible sources in the presence of a high number of potential sources (maximum of 10 potential sources) and is based solely on isotopic mass balance constraints. All possible combinations of each source contribution (0%–100%) were examined in 2% increments. Combinations that corresponded to the observed stable isotopic signatures of the mixture within a tolerance of 0.1 were considered feasible solutions; frequency and range of potential source contributions were determined from these feasible solutions in accordance with the method described in detail by Phillips et al. (2005) [28]. We considered seven distinct water sources (5, 10, 20, 60, 100, 150 and 200 cm) and used both δD and δ18O data for model calculations.
The water source differences in different revegetated sites were compared by single factor analysis of variance (one-way ANOVA), and Tukey’s test was used for post hoc multiple comparisons. These analyses were conducted using SPSS 13 package (SPSS 13.0 Inc., Chicago, IL, USA). Graphic plotting was conducted with Origin 7.0 software (OriginLab Corporation, Northampton, MA, USA).

3. Result

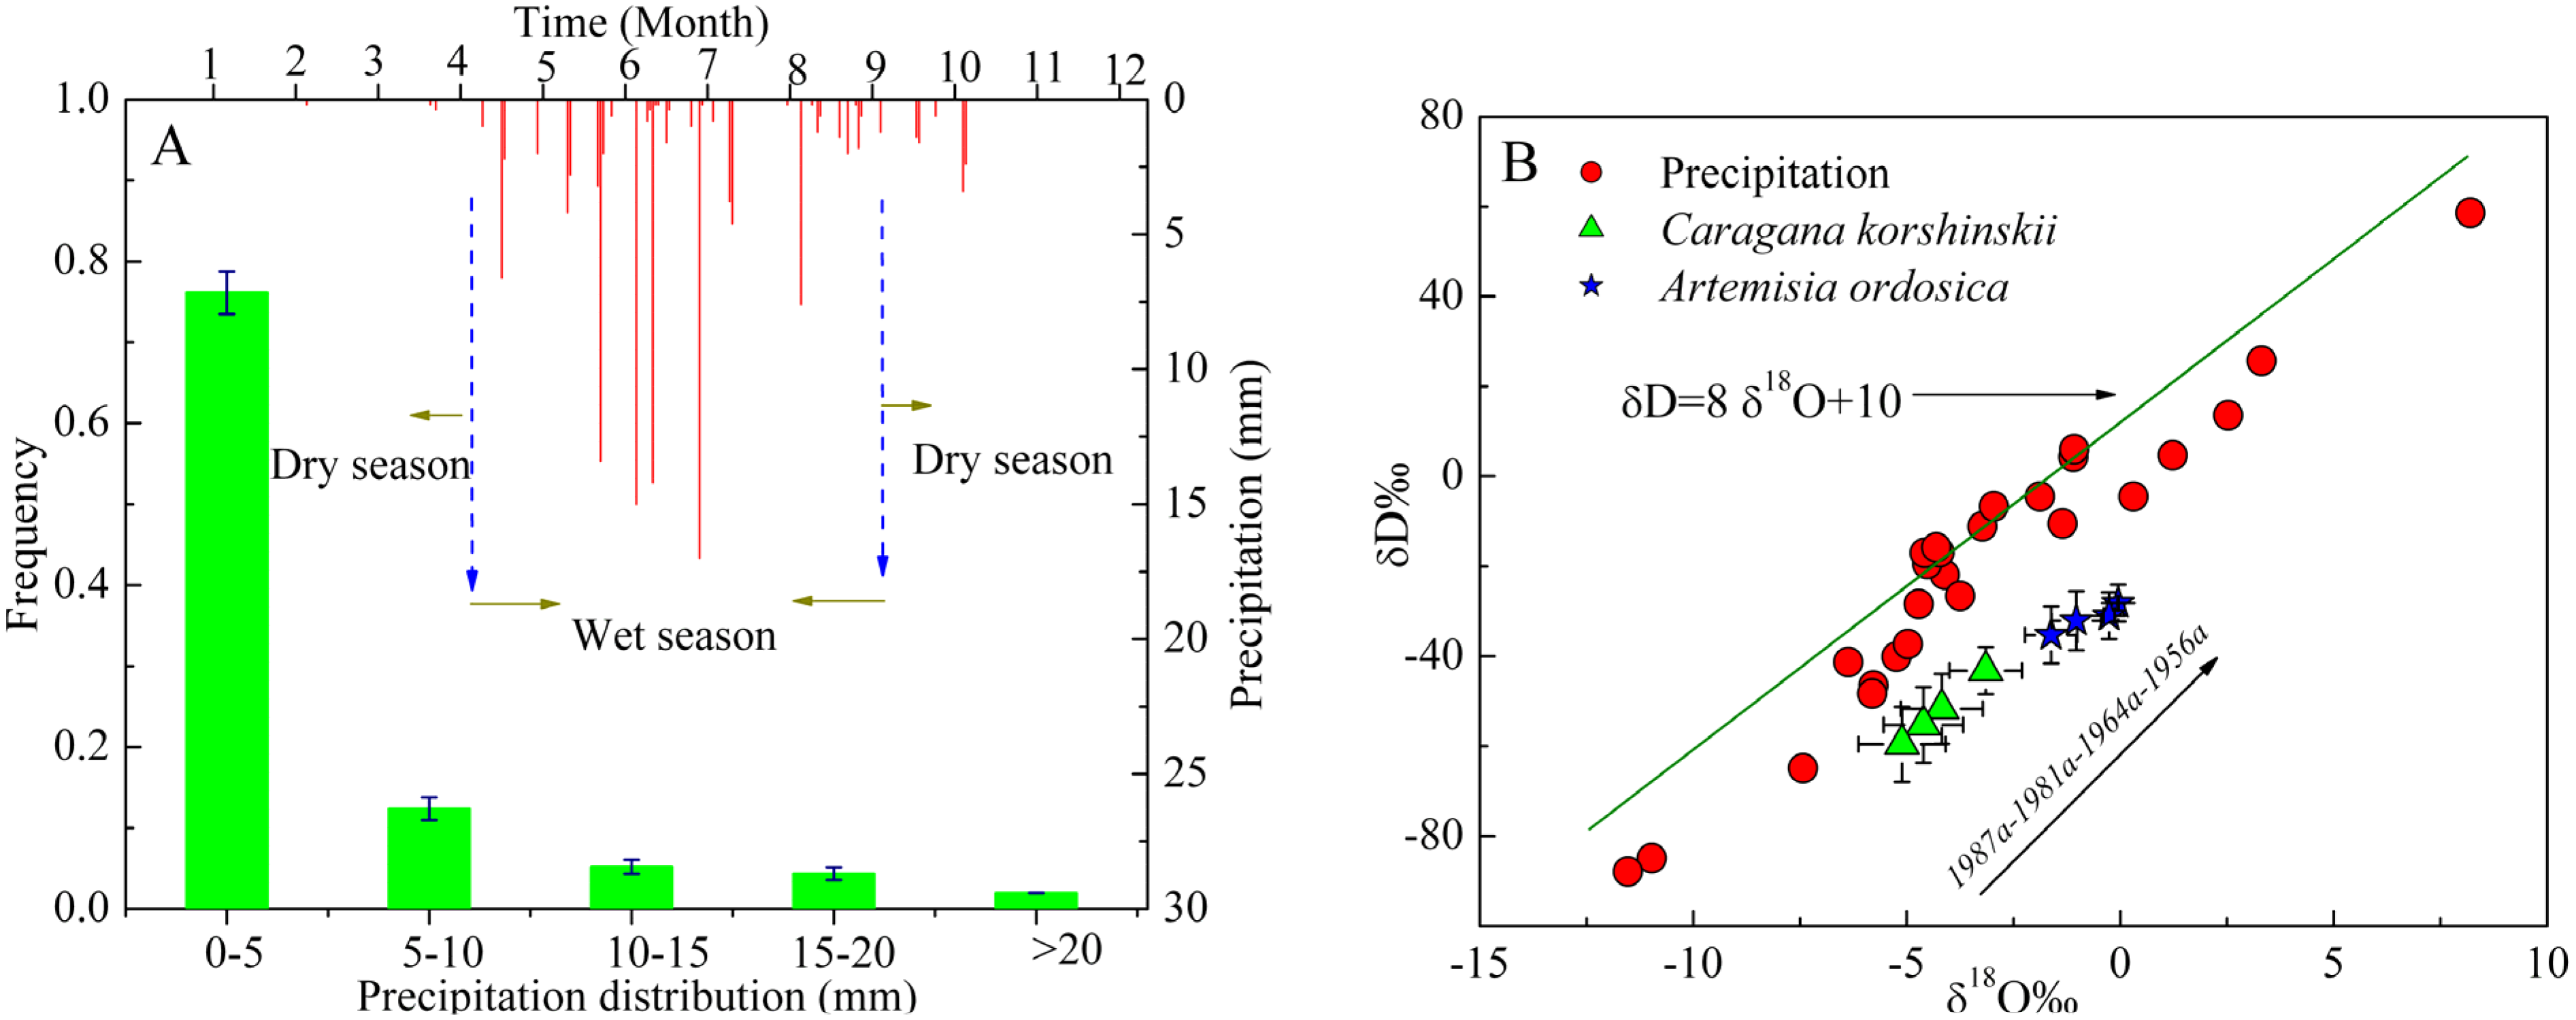
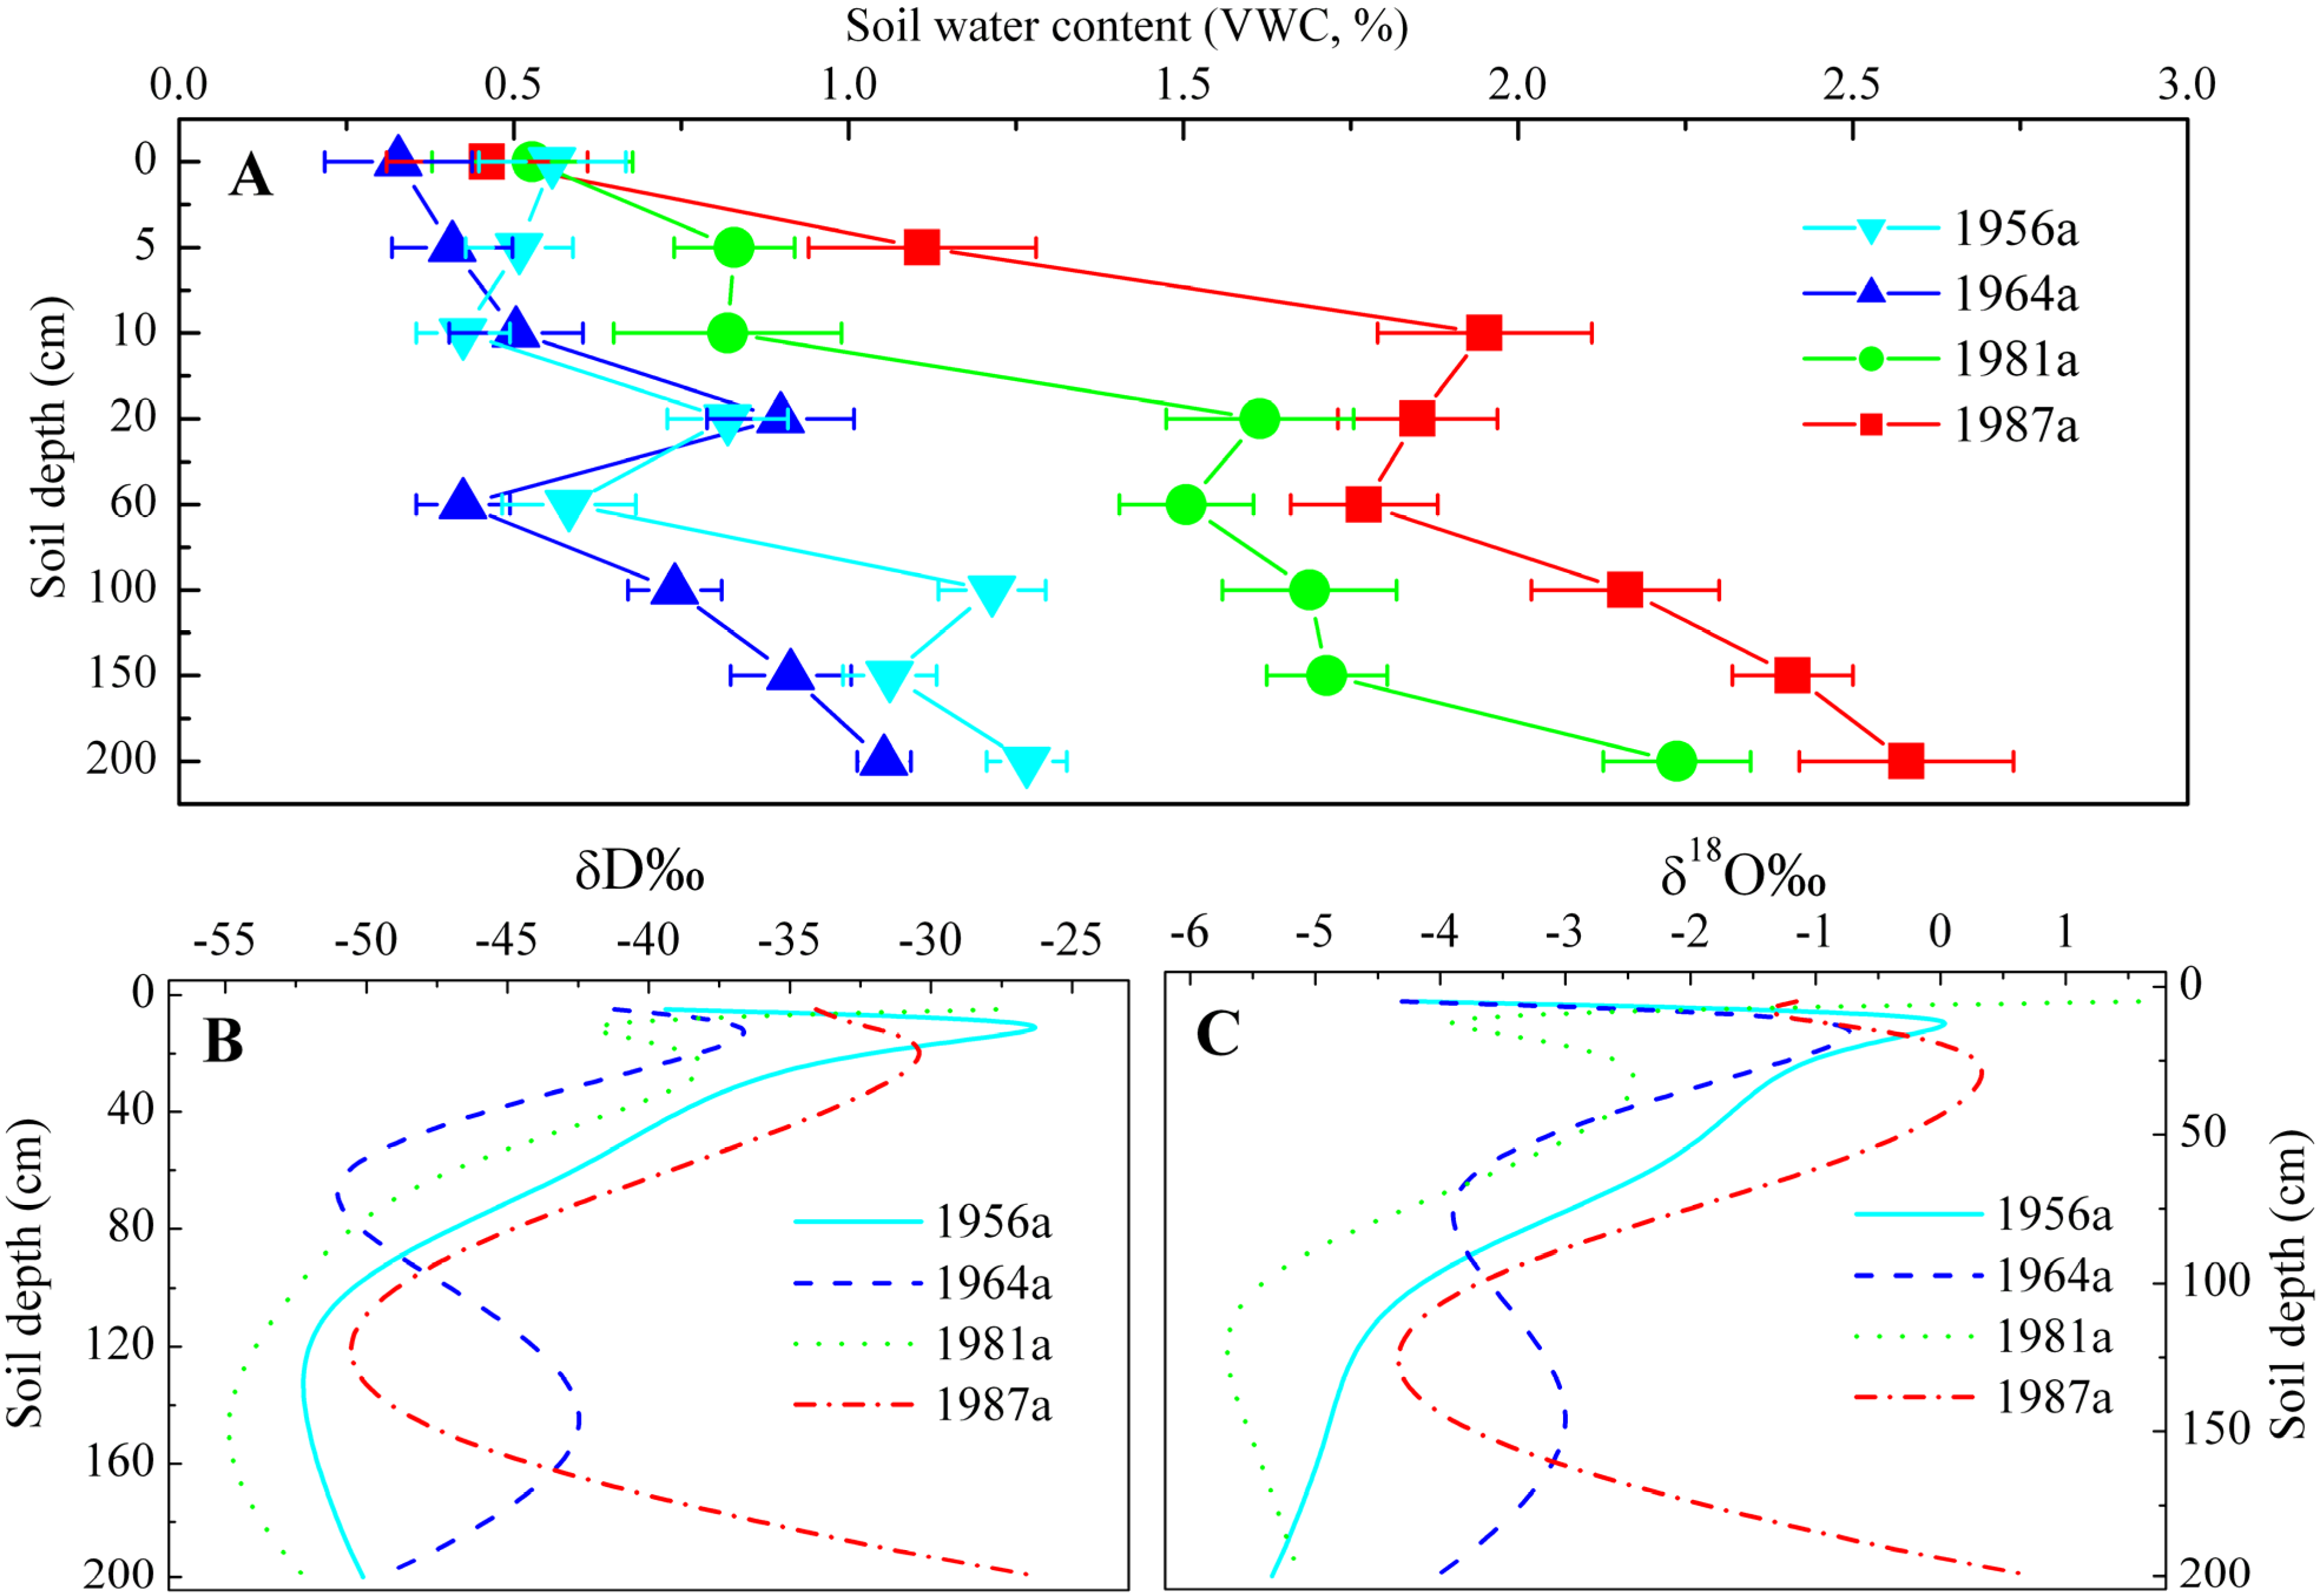
3.1. Variations in Stable Isotope Composition of Precipitation, Soil Water and Xylem Water

During the experimental period, the amount of precipitation in the year 2013 was 133.4 mm, in which the rainy season occurred from April to September. The rainfall during this period accounted for 86.8% of the annual rainfall. The rest of the period was the dry season, during which a relatively small amount of rainfall was available to plants. In Shapotou area, rainfall was mainly characterized as a small rainfall pulse, where 0–10 mm accounted for 76% of the total precipitation as shown in Figure 1A. Large rainfall events such as one-off rainfall events exceed 20 mm only accounted for 2% of the total precipitation. As shown in Figure 1B, the δD and δ18O values of local precipitation fell along or below the global meteoric water line (GMWL). The local meteoric water line (LMWL) at Shapotou is described as: δD = 7.39δ18O + 3.91 (R2 = 0.93; n = 26), thereby exhibiting low slope and intercept values that are located away to the right of the Global Meteoric Water Line (GMWL) [29]. LMWL depended on seasonal and geographical variability in local climatic conditions; this observation indicated that rain likely undergoes substantial secondary evaporation and elicits related isotopic effects on arid desert regions. Furthermore, the precipitation amount, temperature, altitude, relative humidity, and the source-specific fractionation between δD and δ18O could contribute to the isotope content of a precipitation sample. A marked seasonal variation in δD and δ18O values was observed, with minima in the winter and fall months (October to April) and maxima in the spring and summer months (ca. May to September, the growing season). The stable hydrogen isotope composition of precipitation exhibited a large seasonal variation. The lowest values were observed on 31 October 2013, during which δD and δ18O reached values as low as −87.9‰ and −11.5‰, respectively; the highest values were observed on 8 June 2013, during which δD and δ18O reached values as high as 58.6‰ and 8.2‰, respectively. The mean δD and δ18O values for local precipitation were −34.9‰ ± 6.2‰ and −4.2‰ ± 0.8‰, respectively. Generally, the xylem water samples were below the LMWL or GMWL. The δ18O and δD of C. korshinskii xylem water ranged from −5.11‰ ± 1.1‰ to −3.15‰ ± 0.8‰ and from −59.6‰ ± 8.4‰ to −43.2‰ ± 5.2‰, respectively. However, for A. ordosica plants, xylem water δ18O and δD values of −1.62‰ ± 0.62‰ to −0.05‰ ± 0.01‰ and −35.3‰ ± 6.4‰ to −28.2‰ ± 4.1‰ were obtained, respectively. These values were greater than those obtained from C. korshinskii. The δ18O and δD of both plants increased with increasing vegetation-fixing ages, but no significant difference was found between them (p > 0.05).
Figure 1. Precipitation and precipitation distribution in 2013 (A) The relationship of δD and δ18O in rainwater (PPT) (n = 25) and average xylem water in different revegetated sites in 2013; and (B) (mean ± SE, n = 63). The four revegetated sites were listed next to the symbols for plant stem water.
Water 07 01030 g001
In Figure 2A, average soil volumetric water content increased from the shallow layer (0.2% ± 0.07% to 1.8% ± 0.57%) at 0–20 cm and then decreased in deeper layers. The vertical distribution of soil water content in older vegetation areas (1956a and 1964a) was lower than that in relatively younger vegetation areas (1981a and 1987a). The isotopic composition of soil water at different depths changed abruptly (Figure 2B,C), indicating a very dynamic process of soil evaporation and rainfall percolation. Specifically, mean soil water δD and δ18O values varied with depth, and they increased from −40‰ ± 3.7‰ and −4.2‰ ± 0.9‰ near the surface to −25‰ ± 2.6‰ and 0.2‰ ± 0.03‰ at 0–20 cm soil profile. This pattern is consistent with the expected pattern of soil evaporative enrichment of the heavy isotope near the surface. However, soil water δD and δ18O values declined at 20–150 cm soil layers and then increased at below 150 cm soil layers, especially in 1987 revegetated sites.

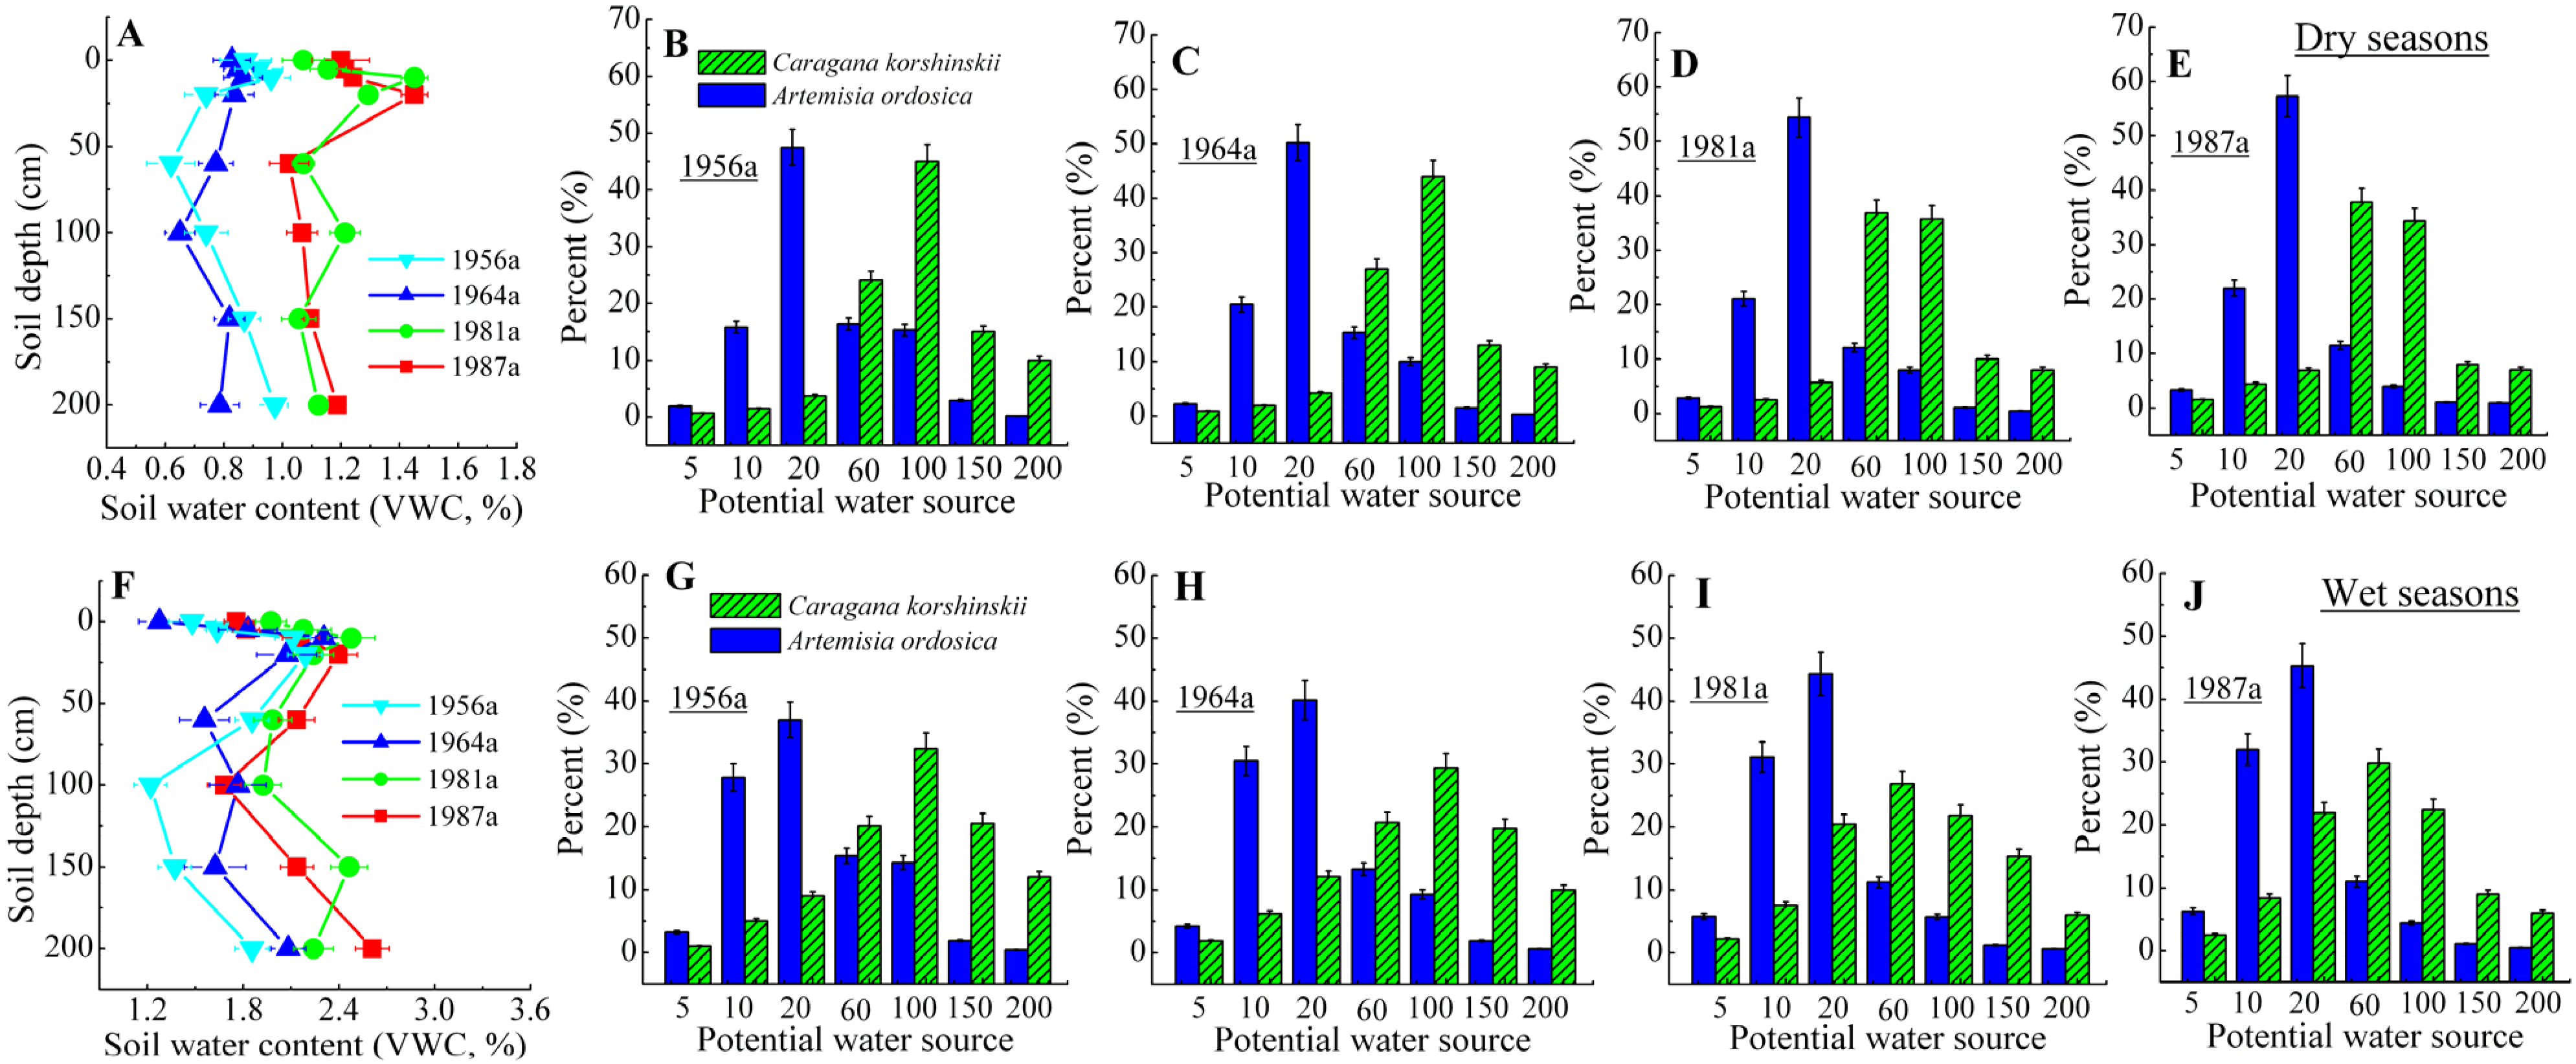
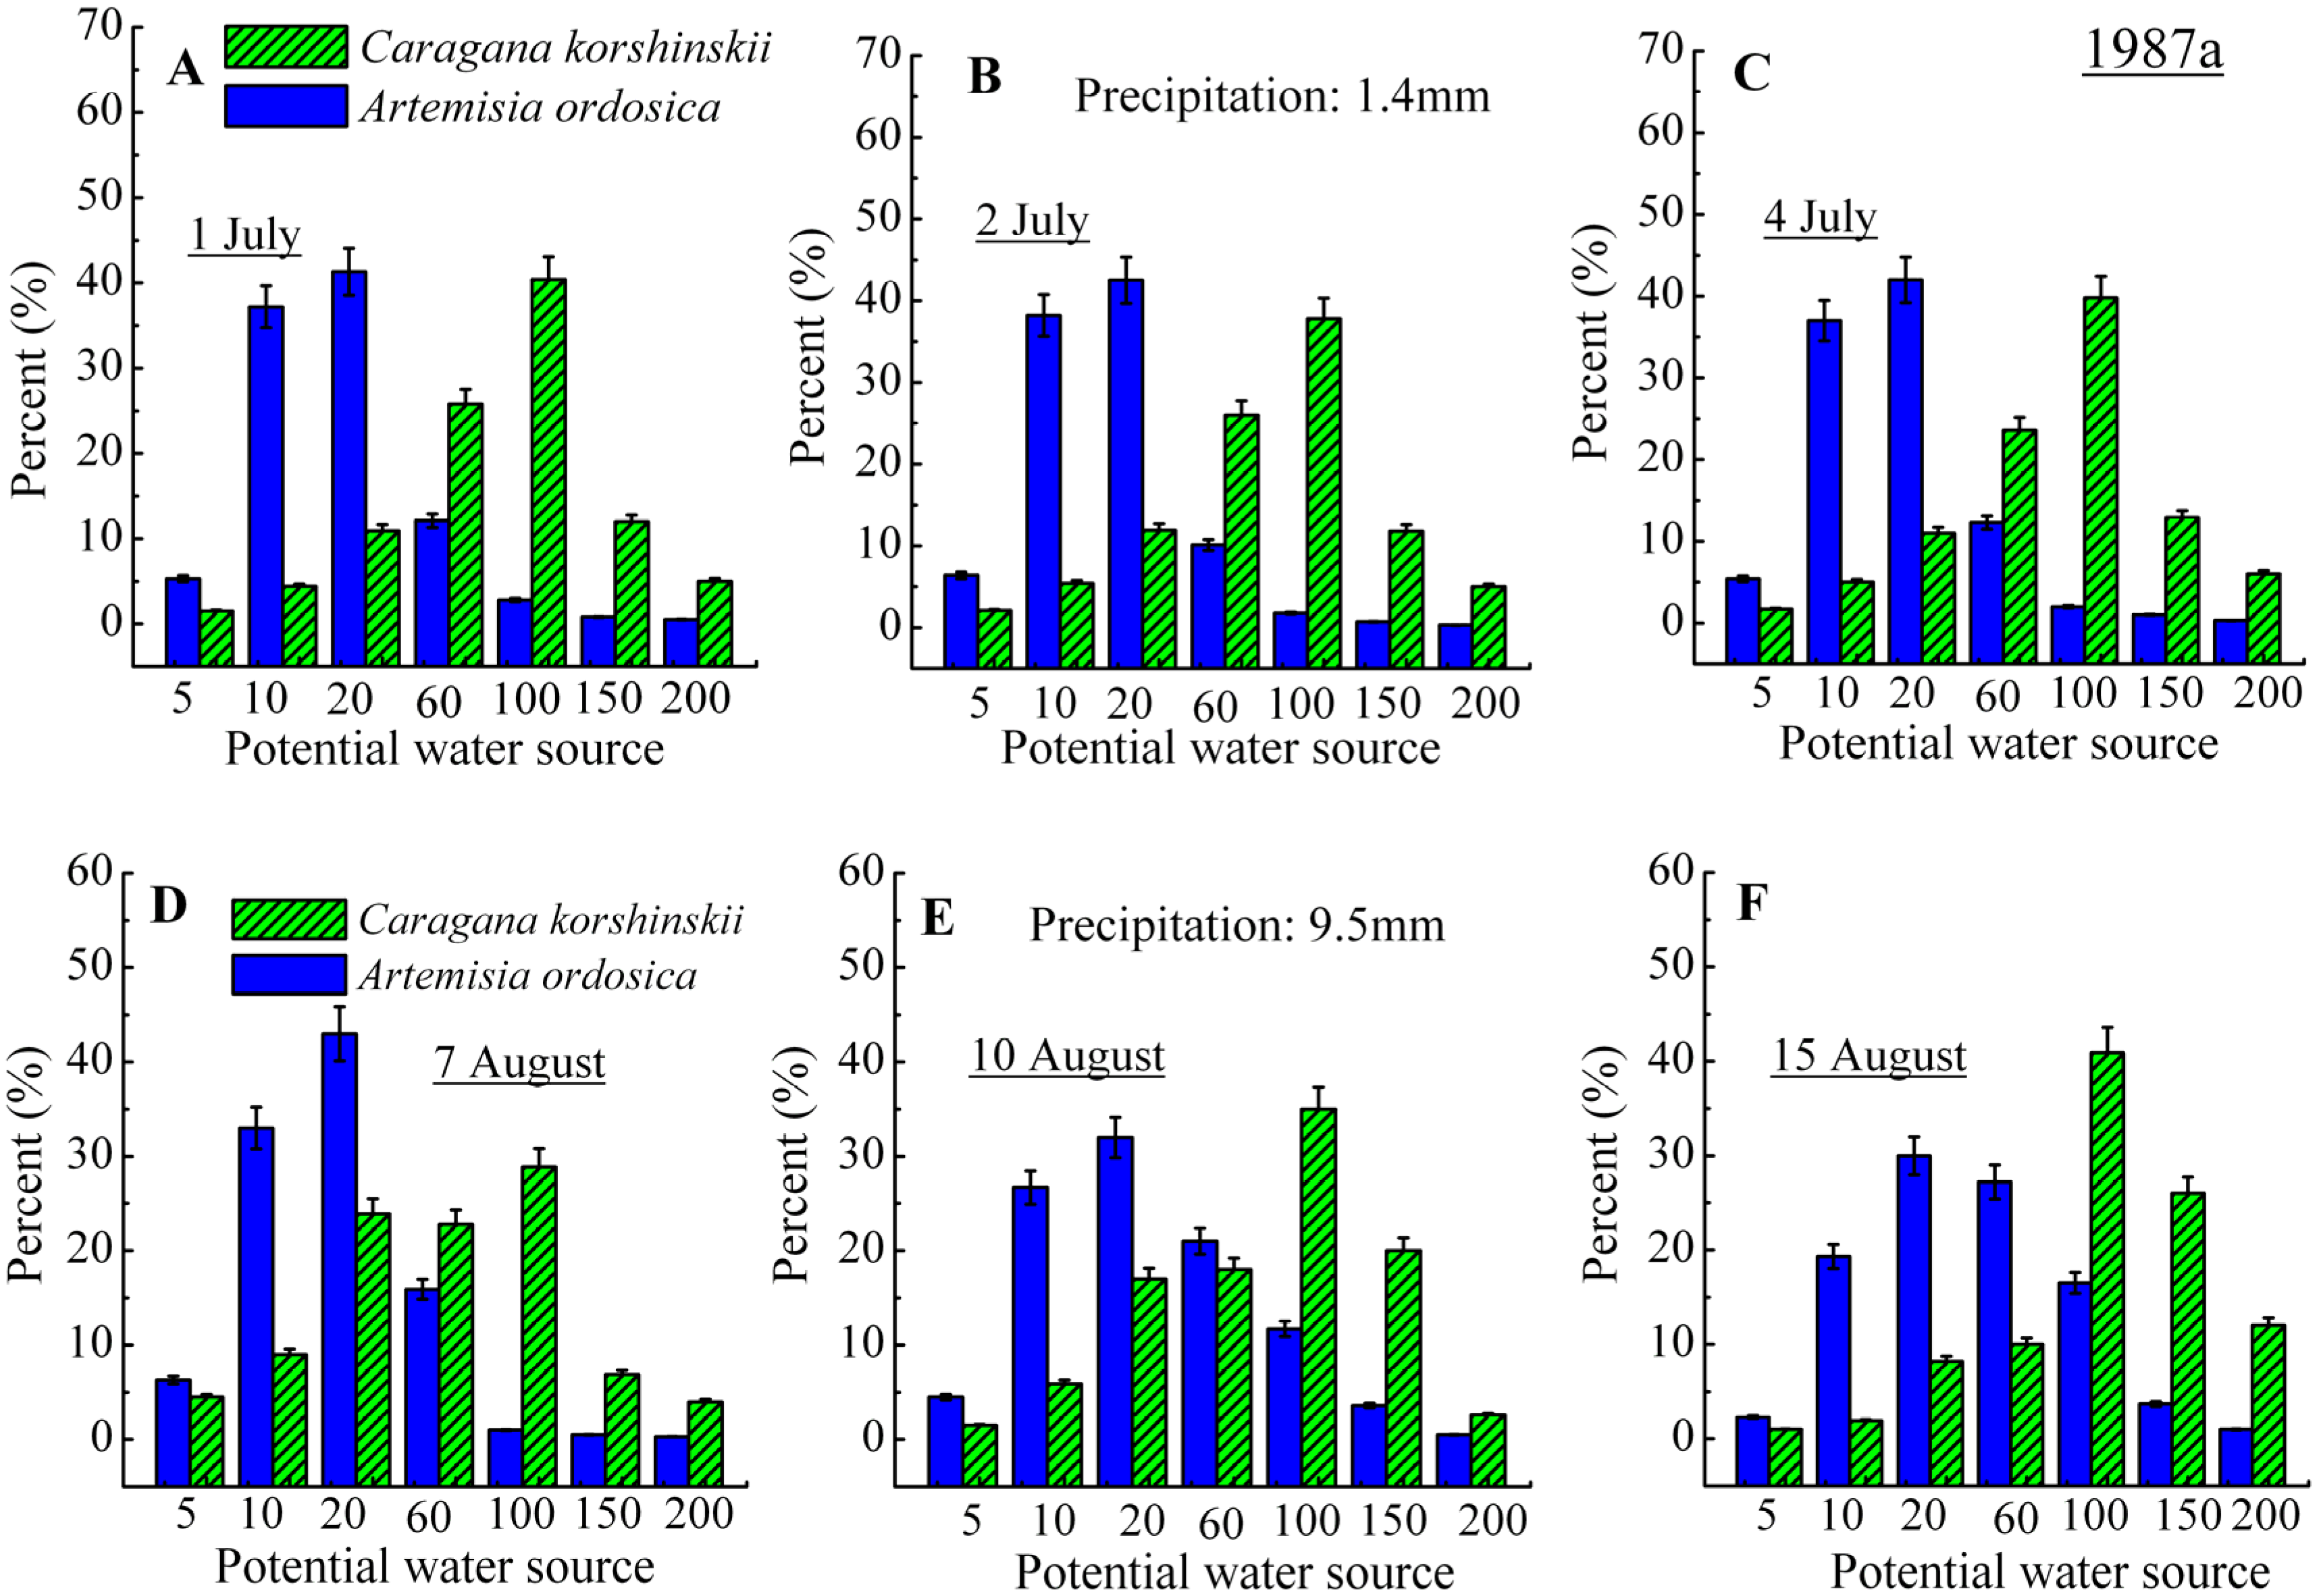
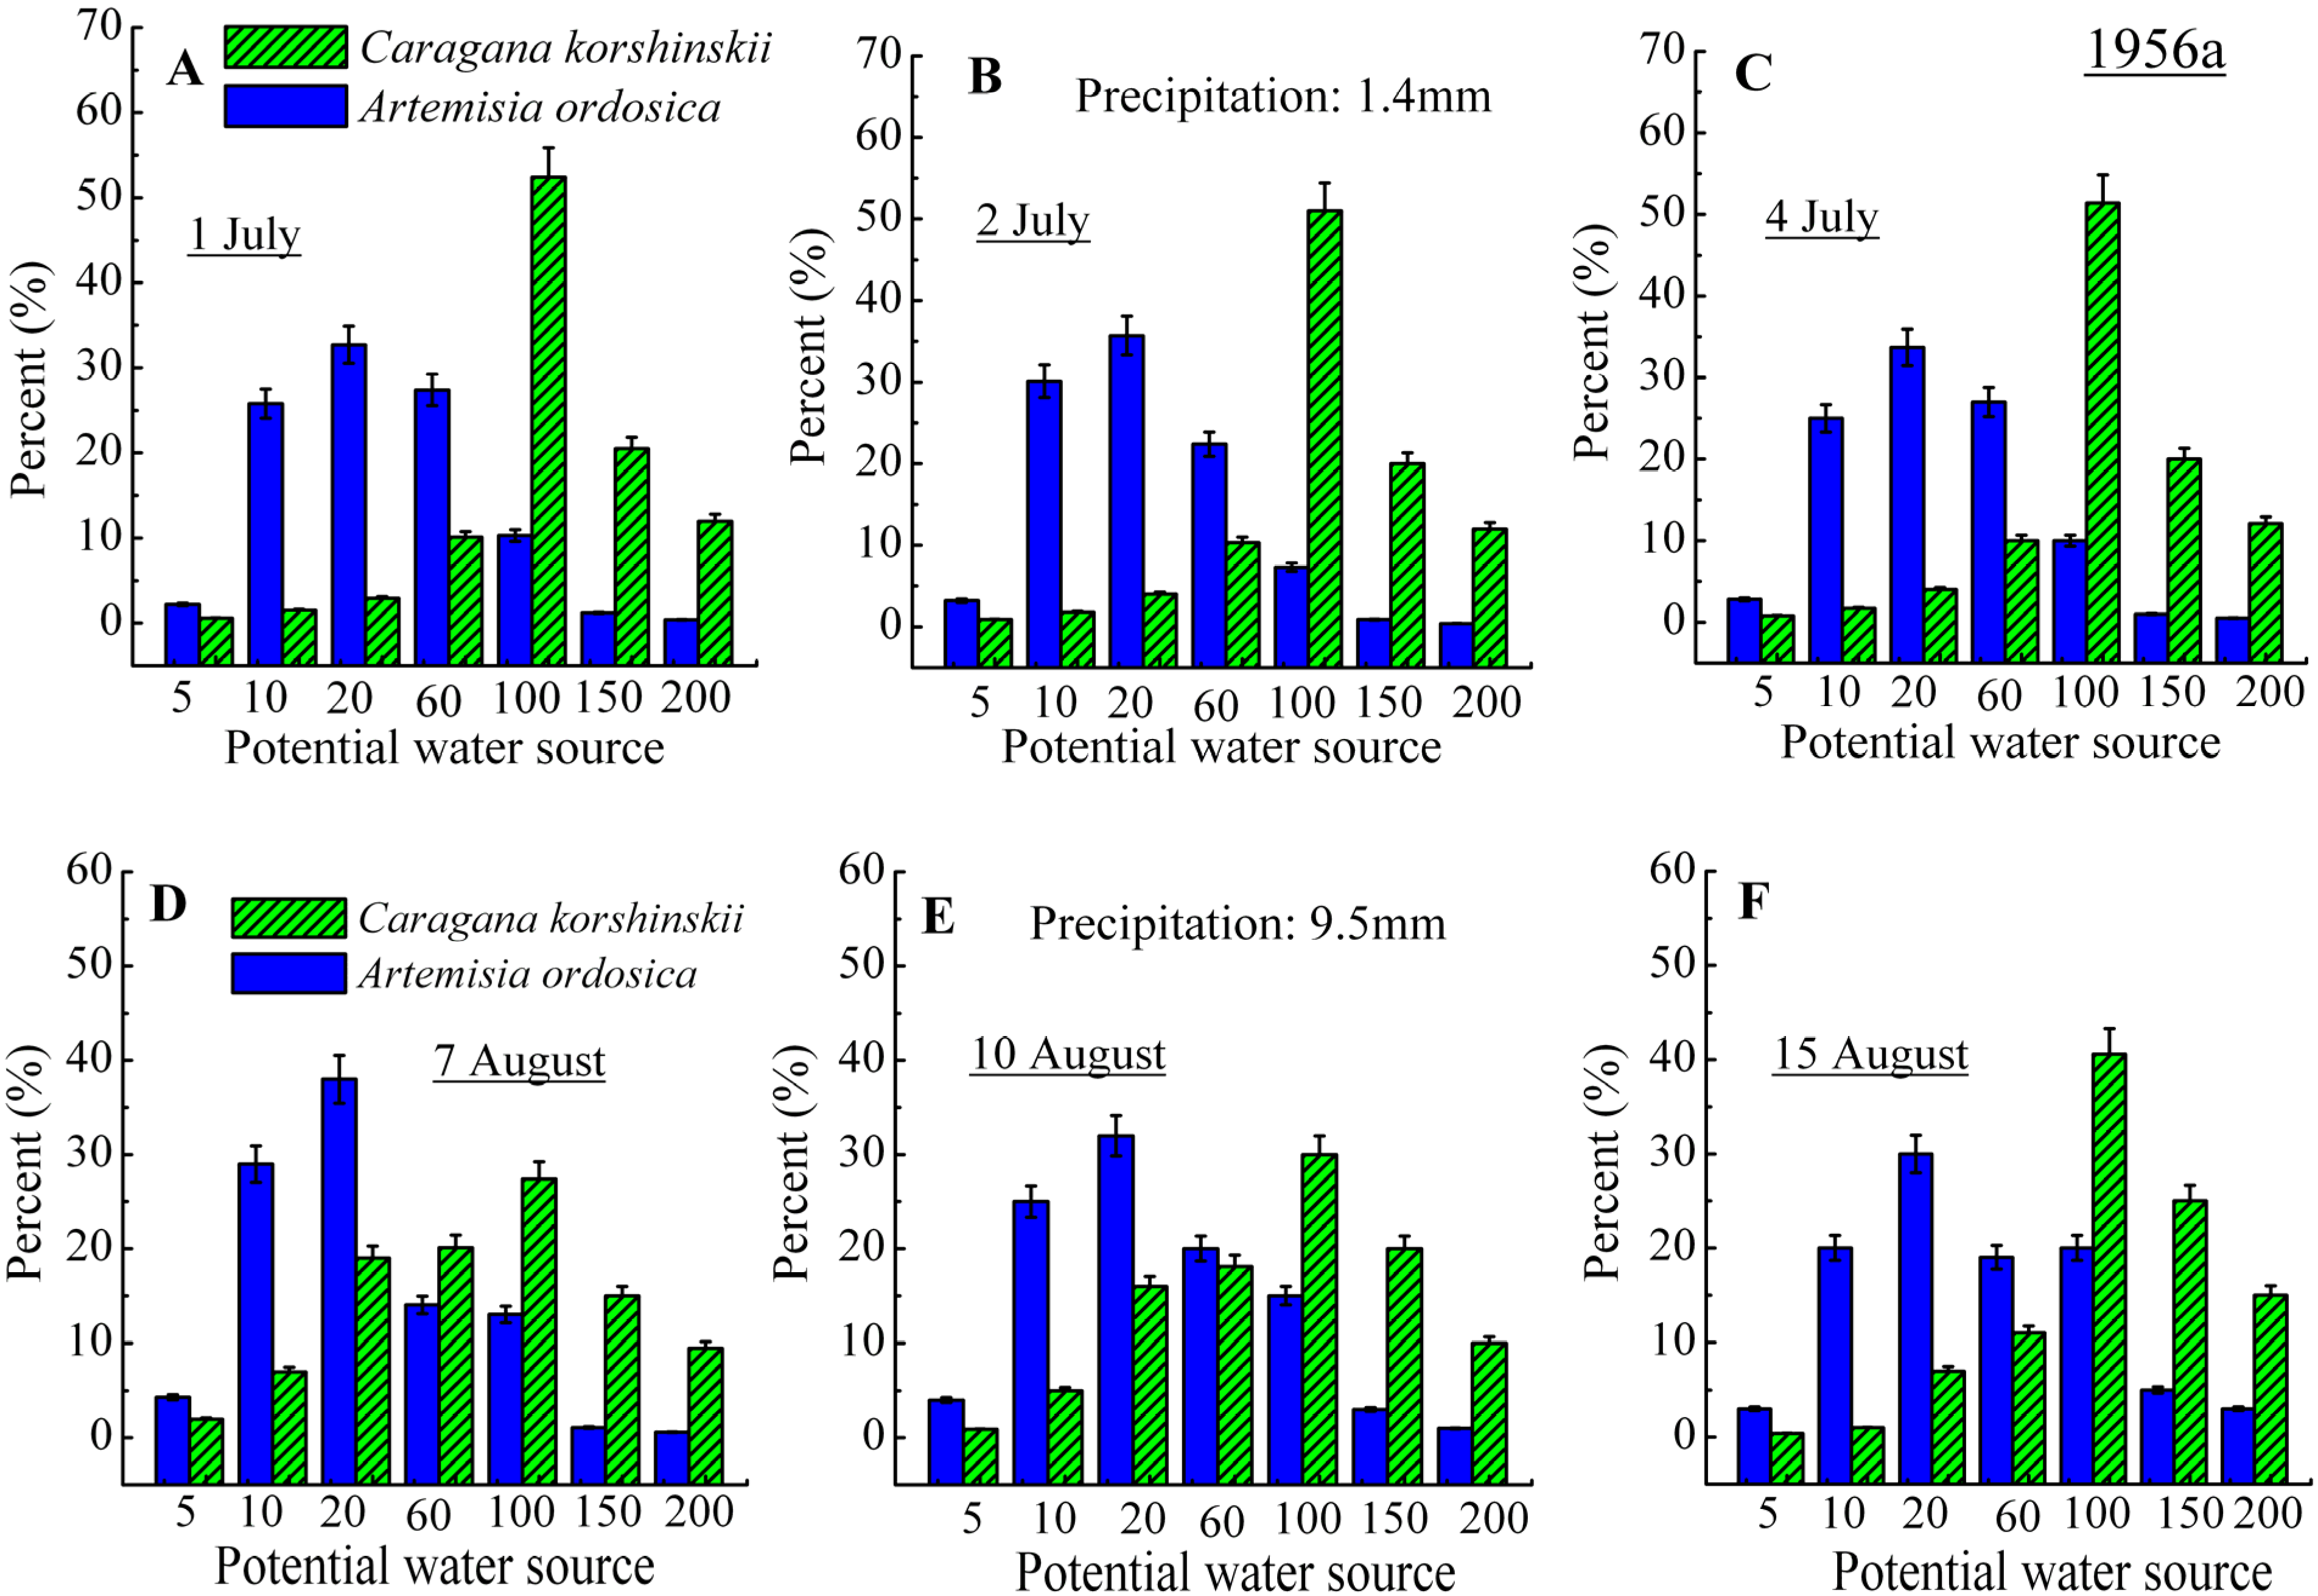
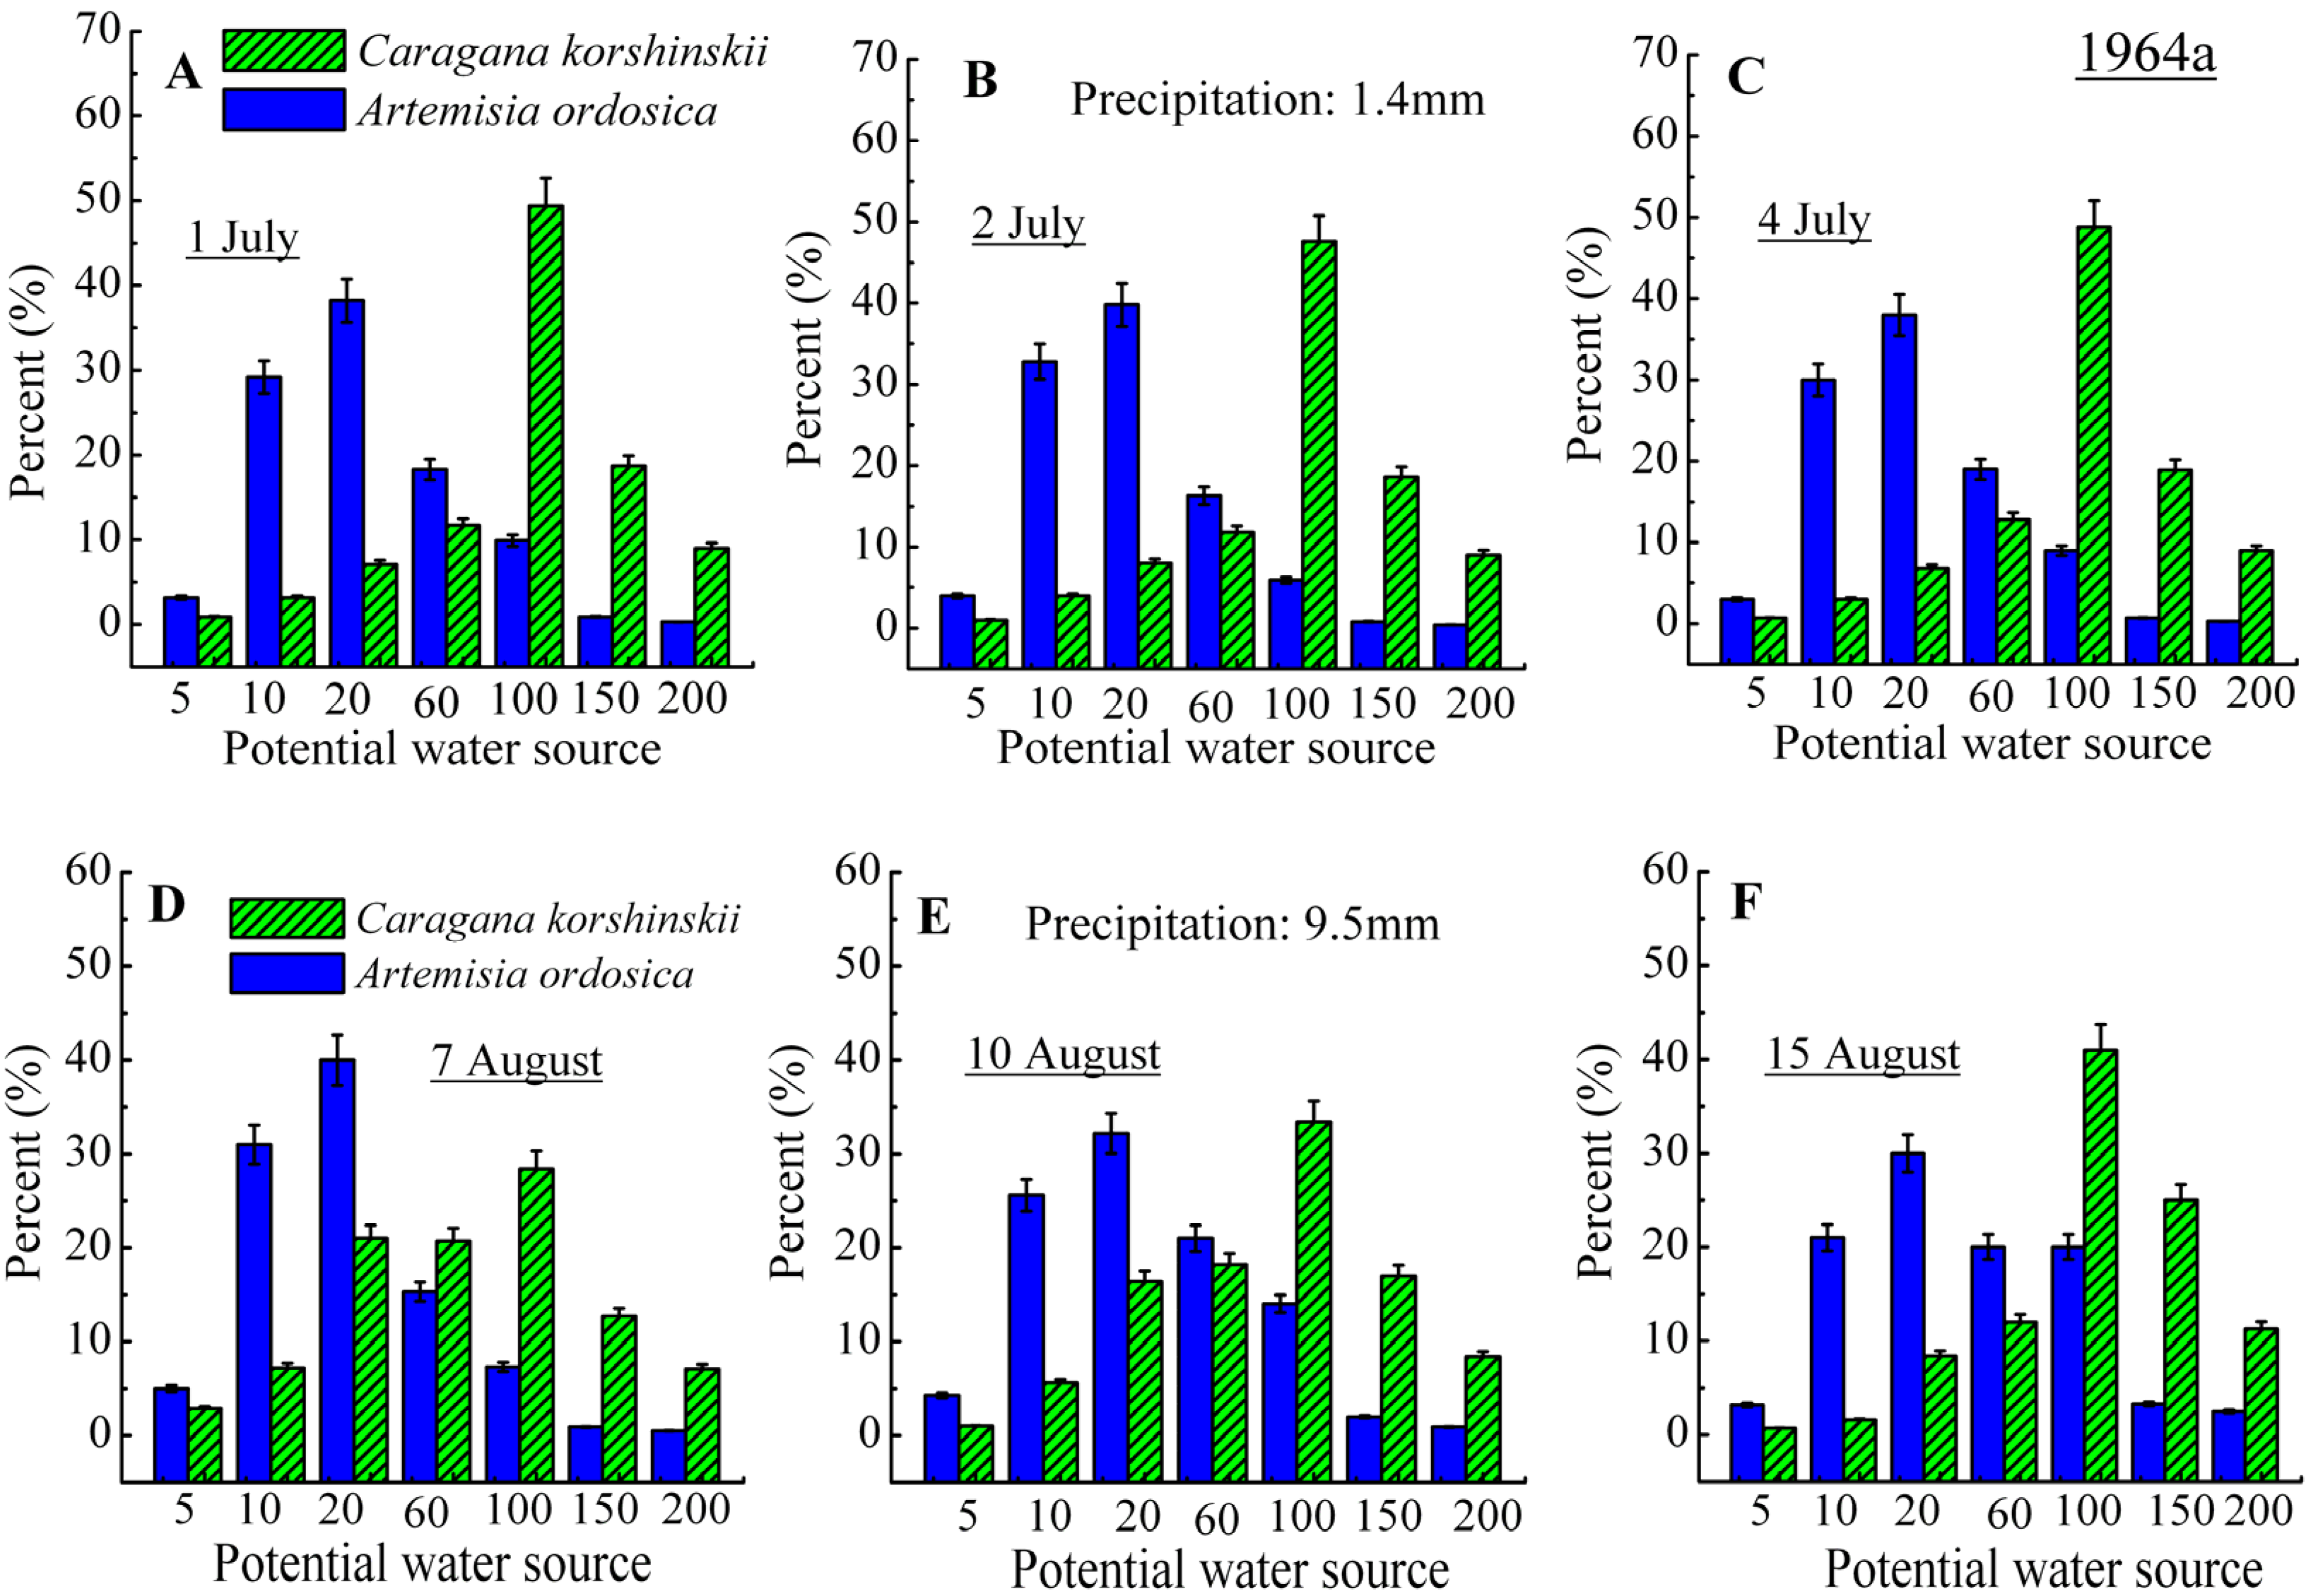
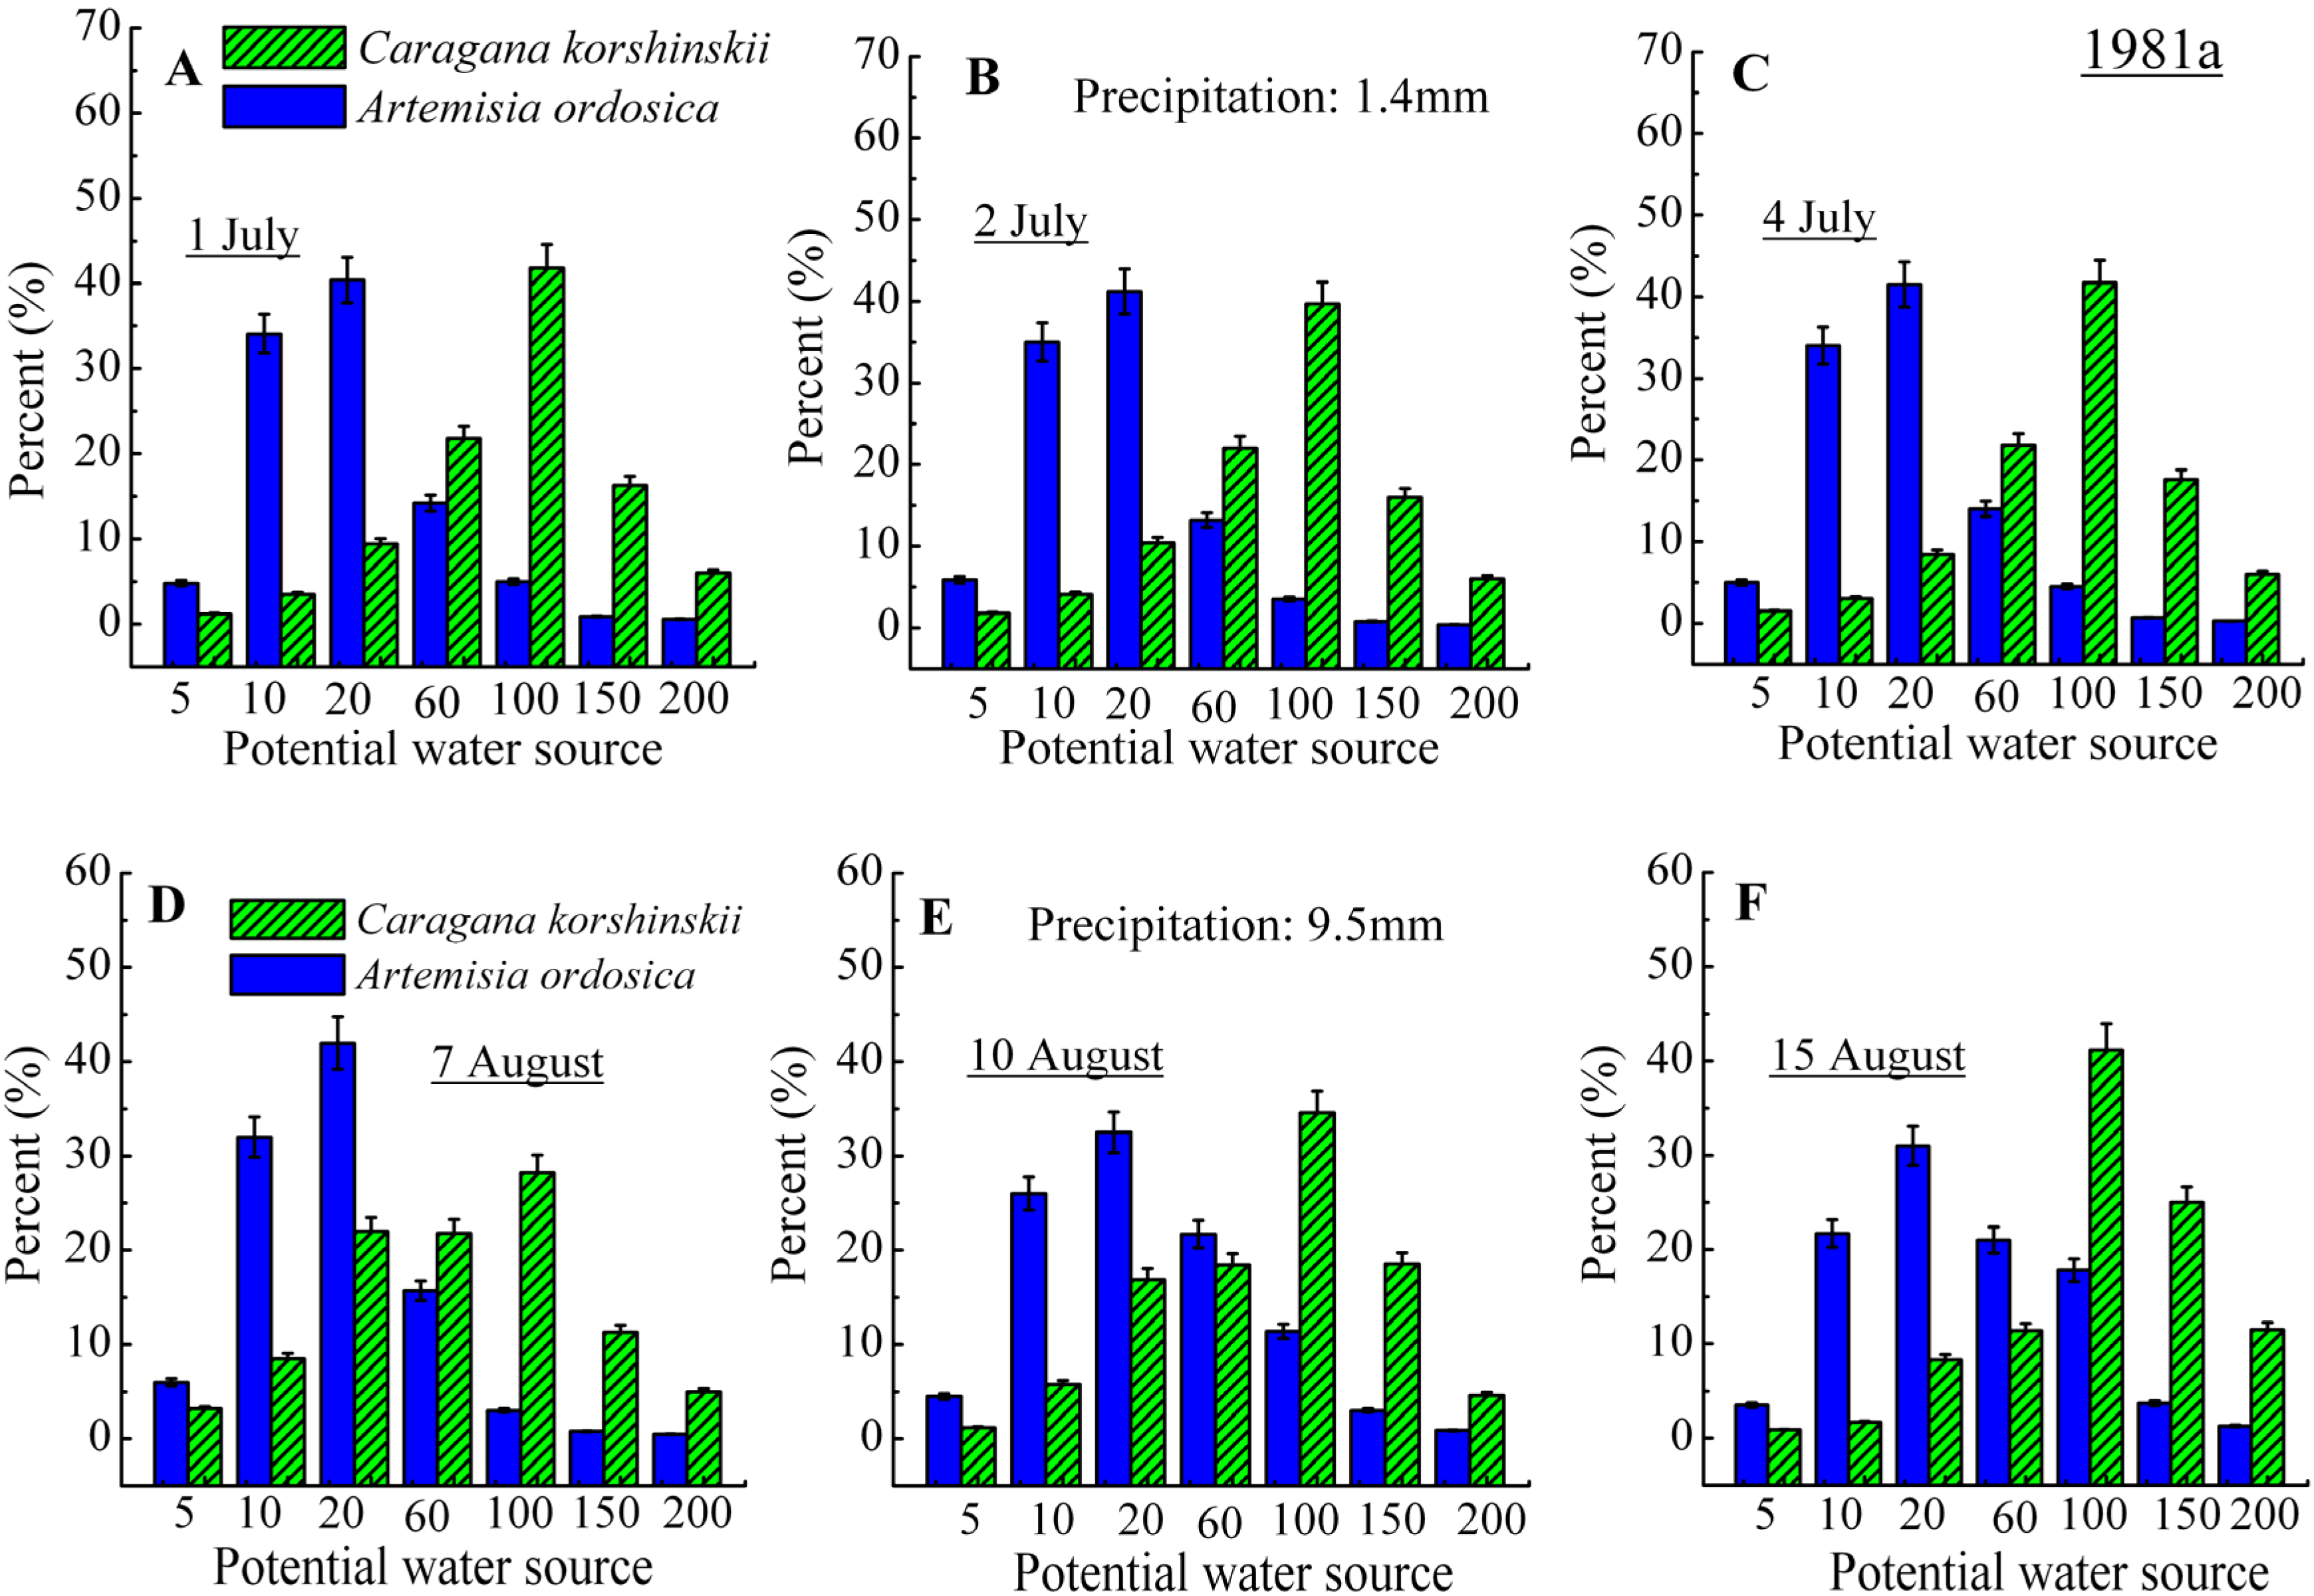
3.2. Identification of Water Source

During the dry seasons (25 April 2013 data; Figure 3A–E), average soil volumetric water content in older vegetation areas (1956a and 1964a) was 0.7% ± 0.1% to 1% ± 0.3%, which was lower than that in relatively younger vegetation areas (1981 and 1987; 1.1% ± 0.4% to 1.4% ± 0.5%). In 1981a and 1987a revegetated areas, soil moisture increased gradually and reached the maximum level in 20 cm soil layer; soil moisture subsequently decreased rapidly in 60 cm soil layer. No significant differences were observed in deeper soil layers. At different vegetation sites, C. korshinskii consumed water mostly in 100 cm soil layer, accounting for 40% ± 4.4% to 50% ± 5.2% of the total potential water sources. C. korshinskii then consumed water in 60 and 150 cm, accounting for approximately 20% ± 2.7% and 15% ± 2.2%. Furthermore, C. korshinskii consumed water in 200, 20, and 5 cm soil layers, accounting for ≤10% ± 1.8%. By contrast, A. ordosica, mainly tap water in the 20 cm upper soil layer, accounting for 50% ± 8.6% to 60% ± 7.9% of the total potential water sources, especially in 1987a revegetated site; A. ordosica then consumed tap water in 10 and 60 cm soil layers, accounting for approximately 10% ± 1.5% to 20% ± 1.9%, respectively. A. ordosica yielded water uptake rates of <5% ± 1.1% in 5, 100, 150, and 200 cm soil profiles.
Figure 2. Profiles of soil water content (A) and average soil water isotopic concentration δD (B) and δ18O (C) at different revegetated sites (n = 21).
Water 07 01030 g002
During the wet seasons (25 October 2013 data; Figure 3F–J), there was no significant difference in the vertical distribution of soil water content in the four vegetation areas (p > 0.05). In 0–20 cm soil profile, mean soil moisture varied from 1.2% ± 0.4% to 2.4% ± 0.9%. However, the vertical distribution characteristic of soil moisture was increased at a soil depth at 0–20 cm soil profile, and then decreased to the minimum level of 1.2% ± 0.3% in 100 cm soil layer. Conversely, soil moisture was increased in <150 cm soil layer; this result indicated that soil moisture exhibited evident stratification at different soil profiles. C. korshinskii and A. ordosica obtained a portion of water from shallow soil water; furthermore, soil moisture increased during the wet seasons. Such as the A. ordosica plant, which obtained 25% ± 2.1% and 45% ± 3.4% of water in the 10 and 20 cm of soil layer. In the 1987a vegetation site, the ratio reached 30% ± 2.3% and 45% ± 3.8%. In 1956a and 1964a vegetation sites, C. korshinskii consumed water mostly in 100 cm soil layer, accounting for 40% ± 3.5% of the total potential water sources. C. korshinskii then consumed water in 60 and 150 cm soil layer, accounting for approximately 25% ± 2.9%. C. korshinskii finally obtained water in 200, 20, and 5 cm soil layers. In 1981a and 1987a vegetation sites, C. korshinskii consumed water mostly in 60, 100, 20, and 150 cm soil layers, accounting for >90% ± 7.3% of the total potential water sources.
Figure 3. Soil water content and proportion of potential water source for C. korshinskii and A. ordosica in different revegetated sites during dry seasons (25 April 2013 data) and wet seasons (25 October 2013 data) (mean ± SE).
Water 07 01030 g003
C. korshinskii and A. ordosica mainly tapped water in the upper soil layer (10–100 cm) during the wet seasons. With an increase in sand stabilization age, the proportion of water from shallow soil layer was reduced, whereas deep soil moisture utilization increased. During the dry seasons, C. korshinskii and A. ordosica hierarchically use soil water in different soil layers. A. ordosica likely consumed shallow soil water, whereas C. korshinskii possibly obtained deeper soil water. This change was more evident with increasing sand stabilization age. A. ordosica also likely used deeper soil water during the wet seasons compared with that during the dry seasons. For instance, A. ordosica obtained soil water in 60 and 100 cm soil layers in 1956a revegetated site, accounting for 16% ± 1.8% and 15% ± 1.3% of the total potential water sources in the wet seasons, respectively; by contrast, A. ordosica obtained soil water in the same soil layers in the 1956a revegetated site, accounting for 14% ± 1.7% and 12% ± 1.6% in the dry seasons, respectively. In Figure 3, this change was likely more evident with increasing sand stabilization age.
To specify the mechanism by which water sources of C. korshinskii and A. ordosica plants are affected by precipitation, we examined two specific cases under natural conditions: water uptake characteristics following a small rain event (1.4 mm; Figure 4A–C), and water uptake characteristics following a large rain event (12.2 mm; Figure 4D–F). Take the 1956a revegetated site as an example (as seen from Figure 4A–C), the plants obtained the proportion of water from different soil layers at 2 and 4 d after the rainfall occurred. We found that no effect was observed in water use strategies of C. korshinskii during small rainfall events. In A. ordosica, only the proportion of water in 10 cm soil layer was increased from 25% ± 1.3% initially to 30% ± 1.9% at 2 day; afterward, the proportion of water was quickly decreased to the original level. The plants exhibited the same general trend (Figure A1, Figure A2 and Figure A3) compared with plants in other revegetated sites. In one large rainfall event, particularly 9.5 mm in this study, this influence was more complex. With soil moisture infiltration, C. korshinskii and A. ordosica possibly obtained water from deeper soil layer, particularly A. ordosica. The water source at 10–20 cm soil profiles accounted for approximately 30% ± 2.1% to 40% ± 3.9% before rainfall occurred; at 3 day after the rainfall occurred (10 August), water source was reduced to approximately 25% ± 1.6% to 35% ± 2.2%. After a week, this proportion was basically maintained at a range of 20% ± 1.5% to 30% ± 1.8%. The proportion of soil water source from deep soil layer increased from 2% ± 0.7% to approximately 5% ± 1.1%. In C. korshinskii, large rainfall events also induced the increase in utilization of deep soil moisture; the proportion of the water source at 100, 150 and 200 cm soil layers increased at approximately 5% ± 0.9% to 10% ± 1.4%. These plants exhibited the same general trend (Figure A1, Figure A2 and Figure A) compared with those in other revegetated sites, particularly in 1981a and 1987a revegetated sites, in which this pattern was more evident mainly because of the effects of soil water infiltration.
Figure 4. Proportion of potential water source for C. korshinskii and A. ordosica in 1956a revegetated site during a small precipitation event (1.4 mm; A–C) and a large precipitation event (9.5 mm; D–F).
Water 07 01030 g004

4. Discussion

Water source used by xerophytic desert shrubs should be understood to elucidate the function of these plants and the feedback mechanisms involved in soil-vegetation systems in arid zones. In addition, a theoretical basis of ecological restoration centered on vegetation reconstruction can be provided [4]. Precipitation is the main water source for revegetated desert ecosystems, and its isotope composition varies significantly during the growing season indicating that monsoon rain water yields different isotope signals to the study area [16]. The lower slope and intercept of the GMWL suggest the occurrence of substantial soil evaporation enrichments relative to rainwater [30]; these parameters also show a close correlation between xylem water supplies of C. korshinskii and A. ordosica. Mean δ18O and δD values of xylem water in different vegetation sites (−4.3‰ ± 0.4‰ and −52.5‰ ± 3.5‰ for C korshinskii; and −0.7‰ ± 0.3‰ and −31.7‰ ± 1.5‰ for A. ordosica) exhibited slight differences, suggesting that the access of these plants to water sources was relatively constant and stable. The vertical distribution of soil water content changed as artificial vegetation developed and evolved; furthermore, the magnitude of soil water variation was larger in later vegetation areas (1981a and 1987a) than in earlier ones (1956a and 1964a). The reason is that plant age, associated with root length and plant density, varied in different vegetation sites; plant density and coverage gradually decreased until a stable community of sand-binding vegetation was formed after 50 years of plant succession [2]. Another reason is that the formation of biological soil crusts composed primarily of photoautotrophs, cyanobacteria, algae, lichens, mosses, and heterotrophic bacteria after sand-binding vegetation was formed profoundly changed hydrological processes, such as precipitation infiltration, soil evaporation, dew deposition, and water balance of the original soil-vegetation system because hydrophysical characteristics of stable soils are different from those of moving sand [4]. Consistent with soil moisture dynamics, soil water δ18O and δD in different depths differed consistently. Soil water δ18O and δD values decreased with depth, especially in older revegetated sites (1956a and 1964a), mainly because precipitation recharged soil water and isotopically enriched surface layers by evaporative water loss; afterward, soil water depleted with depth in the soil profile [14,30].
Xylem water δ18O and δD values can provide an integrated estimate of water uptake by roots because plants do not fractionate water during the uptake process [31]. The main water source used by plants can be determined by comparing these values with δ18O and δD values of potential water sources [32]. In plants with different root sizes at different depths, the water sample in the xylem should indicate the zone from which plants obtain water [33]. In this study, the groundwater table in this region is located 80 m below the surface that cannot support vegetation survival; as such, plants mainly utilize soil water in the soil profile [2]. Furthermore, the water depletion zone was not associated with differences in soil properties; this phenomenon was most likely the result of differential water uptake by roots because soil texture and structure were quite homogeneous in these volcanically derived soils. In an ideal situation, in which all sources were sampled, isotopic-mixed models can be used to determine the fractional contribution of each source of soil water to plant water [30,32]. Based on the analysis results of potential water sources (different soil profile) of typical revegetated desert plans, such as C. korshinskii and A. ordosica in dry and wet seasons, our conclusion is that these plants exhibited evident hierarchical use of soil water. C. korshinskii obtained water mostly from the 100–150 cm soil layer, although the shallow soil water may be accounted for a large proportion during the wet seasons. A. ordosica was strongly dependent on the long-term availability of surface water in 20–60 cm soil layer. This finding was mainly because of plant root distribution, as A. ordosica acquired a greater proportion of root distribution in shallow soil layers of 40 cm; C. korshinskii showed deeper root distribution (100 cm) and could use deep soil water during dry periods when precipitation does not reach deep soil layers [34]. These findings are consistent with rooting patterns observed in dry forests in Puerto Rico [35] and Mexico [36] where a high proportion of roots is found in the upper 40 cm soil layer, species may obtain preferentially water from the upper 30 cm of the soil profile [37]. Some plants with deep roots such as Haloxylon ammodendron and Tamarix ramosissima, mainly acquire water from deeper soil layers and groundwater [38].
The water use strategy of C. korshinskii and A. ordosica was in accordance with Walter’s two-layer model in which shallow-rooted plants are possibly more efficient in utilizing shallow soil moisture, whereas deep-rooted plants obtain water from a deeper soil layer [39]. In short time scales, such as a one-off rainfall event, the two-layer model is not consistently supported by field data [40]. This finding is primarily caused by two factors: (i) Several key plant processes, including plasticity of rooting habits of woody plants, phenology, and plant age; and (ii) Timing and magnitude of individual rain events; both of these reasons may negate the importance of rooting depths alone [41]. In this research, the water use strategy of C. korshinskii and A. ordosica in dry and wet seasons illustrated diversity and complexity of plant water use countermeasures. A. ordosica mainly consume shallow soil water, whereas C. korshinskii mainly consume deep soil water during the dry seasons. During the wet seasons, water uptake from deep soil layers was increased (Figure 3), although A. ordosica mainly used shallow soil water; this result indicated that soil water recharge occurred between dry and wet seasons; furthermore, this process may be an important eco-hydrological mechanism for plants to survive in arid desert regions [4,5,6,7]. Some of the extreme weather phenomena, such as summer droughts or heavy rainfall events associated with climate change, increase in frequency and intensity in arid and semi-arid regions [42]. These single events may elicit more pronounced effects than long-term shifts of the water table in arid desert regions [43]. Small rainfall events are often considered as non-effective precipitation because of rainfall interception and redistribution by sand-binding shrubs; therefore, no significant effect was observed in the water source of C. korshinskii and A. ordosica during small rainfall events. In large rainfall events (such as 9.5 mm in this study), precipitation can complement deep soil moisture and function as reservoir; some shallow soil water-based plants can also consume this portion of water in the next period when plants experience drought stress. Another possible reason is that C. korshinskii shrubs exhibit a hydraulic-lifting effect; thus, these shrubs passively transport water acquired by roots from deep and moist soil layers to upper and dry soil layers [44,45,46]. It was especially more significant with increasing sand stabilization ages. This observation was mainly caused by the improvement of soil physical and hydraulic properties, such as silt and clay proportions, topsoil and biological soil crust depths, and soil organic C concentrations; water holding capacity has also increased since revegetation occurred [47]. Our results are consistent with those of Ehleringer and Dawson [13] and Chimner and Cooper [14], who suggested that plants utilize great amounts of summer rain, and some plants may utilize deep water and summer precipitation that recharges shallow soil water. Thus, a mutual compensation mechanism was possibly present in the soil profile via root systems; plant response to rainfall was diverse in different spatiotemporal scales. Although only two typical rainfall events were recorded, plant water use strategy was affected by rainfall density, as illustrated in this study. We may infer that the water use strategy of each plant differed in certain ranges of rainfall amount; further studies should be conducted to determine key rainfall thresholds of plant response.

5. Conclusions

In this study, isotopic compositions of water pools (precipitation, soil water, and xylem water) were determined and compared; furthermore, possible water uptake sources of two typical xerophytic shrubs, C. korshinskii and A. ordosica planted at four different-aged revegetated sites (1956a, 1964a, 1981a, and 1987a) in Tengger Desert, China, were investigated. LMWL at Shapotou was obtained and large seasonal variations were observed in isotope composition of precipitation and soil water. In general, C. korshinskii and A. ordosica mainly obtained water in the upper soil layer (10–100 cm) in the wet seasons. With increasing sand stabilization age, the proportion of water from shallow soil water decreased; by contrast, deep soil moisture utilization increased. During the dry seasons, C. korshinskii and A. ordosica exhibited evident hierarchical utilization of soil water in different soil layers. This conversion of soil water recharge between dry and wet seasons may be an important ecohydrological mechanism underlying the survival of plants in arid desert regions. No significant effect was observed in the water source of C. korshinskii and A. ordosica in small rainfall events. However, for large rainfall events, precipitation can complement deep soil moisture and recharge shallow soil water after a few days. Our results could provide scientific recommendations for future ecological vegetation reconstruction and ecosystem management.

Acknowledgments

This work was supported by the National Key Basic Research program (2013CB429905) and Chinese National Natural Scientific Foundation (41201084; 31170385).

Author Contributions

All authors were involved in designing and discussing the study. Zhishan Zhang collected the precipitation, plant and soil samples. Lei Huang analyzed the samples and drafted and finalized the manuscript. All authors contributed substantially to revisions.

Appendix

Figure A1. Proportion of potential water source for C. korshinskii and A. ordosica in 1964a revegetated site during a small precipitation event (1.4 mm; A–C) and a large precipitation event (9.5 mm; D–F).
Water 07 01030 g005
Figure A2. Proportion of potential water source for C. korshinskii and A. ordosica in 1981a revegetated site during a small precipitation event (1.4 mm; A–C) and a large precipitation event (9.5 mm; D–F).
Water 07 01030 g006
Figure A3. Proportion of potential water source for C. korshinskii and A. ordosica in 1987a revegetated site during a small precipitation event (1.4 mm; A–C) and a large precipitation event (9.5 mm; D–F).
Water 07 01030 g007

Conflicts of Interest

The authors declare no conflict of interest.

References

  1. Le Houerou, H.N.L. Man-made deserts: Desertification processes and threats. Arid Land Res. Manag. 2002, 16, 1–36. [Google Scholar]
  2. Li, X.R.; Xiao, H.L.; Zhang, J.G.; Wang, X.P. Long-term ecosystem effects of sand-binding vegetation in the Tengger Desert, northern China. Restor. Ecol. 2004, 12, 376–390. [Google Scholar] [CrossRef]
  3. Li, X.R.; Zhang, Z.S.; Huang, L.; Liu, L.C.; Wang, X.P. The ecohydrology of the soil–vegetation system restoration in arid zones: A review. Sci. Cold Arid Reg. 2009, 1, 199–206. [Google Scholar]
  4. Li, X.R.; Zhang, Z.S.; Huang, L.; Wang, X.P. Review of the ecohydrological processes and feedback mechanisms controlling sand-binding vegetation systems in sandy desert regions of China. Chin. Sci. Bull. 2013, 58, 1483–1496. [Google Scholar] [CrossRef]
  5. Huang, L.; Zhang, Z.S.; Li, X.R. Sap flow of Artemisia ordosica and the influence of environmental factors in a revegetated desert area: Tengger Desert, China. Hydrol. Process. 2010, 24, 1248–1253. [Google Scholar]
  6. Schwinning, S.; Ehleringer, J.R. Water use trade-offs and optimal adaptations to pulse-driven arid ecosystems. J. Ecol. 2001, 89, 464–480. [Google Scholar] [CrossRef]
  7. Loik, M.E.; Breshears, D.D.; Lauenroth, W.K.; Belnap, J. A multiscale perspective of water pulses in dryland ecosystems: Climatology and ecohydrology of the western USA. Oecologia 2004, 141, 269–281. [Google Scholar] [CrossRef] [PubMed]
  8. Dawson, T.E.; Siegwolf, R.T.W. Stable Isotopes as Indicators of Ecological Change; Academic Press, Elsevier: San Diego, CA, USA, 2007. [Google Scholar]
  9. Resco, V.; Querejeta, J.I.; Ogle, K.; Voltas, J.; Sebastià, M.; Serrano-Ortiz, P.; Linares, J.C.; Moreno-Gutiérrez, C.; Herrero, A.; Carreira, J.A.; et al. Stable isotope views on ecosystem function: Challenging or challenged? Biol. Lett. 2010, 6, 287–289. [Google Scholar] [CrossRef] [PubMed]
  10. Werner, C.; Schnyder, H.; Cuntz, M.; Keitel, C.; Zeeman, M.J.; Dawson, T.E.; Badeck, F.W.; Brugnoli, E.; Ghashghaie, J.; Grams, T.E.E.; et al. Progress and challenges in using stable isotopes to trace plant carbon and water relations across scales. Biogeosciences 2012, 9, 3083–3111. [Google Scholar] [CrossRef] [Green Version]
  11. Dawson, T.E.; Mambelli, S.; Plamboeck, A.H.; Templer, P.H.; Tu, K.P. Stable isotopes in plant ecology. Annu. Rev. Ecol. Syst. 2002, 33, 507–559. [Google Scholar] [CrossRef]
  12. Herczeg, A.L.; Leaney, F.W. Review: Environmental tracers in arid-zone hydrology. Hydrogeol. J. 2011, 19, 17–29. [Google Scholar] [CrossRef]
  13. Ehleringer, J.R.; Dawson, T.E. Water uptake by plants: Perspectives from stable isotope composition. Plant Cell Environ. 1992, 15, 1073–1082. [Google Scholar] [CrossRef]
  14. Chimner, R.A.; Cooper, D.J. Using stable oxygen isotopes to quantify the water source used for transpiration by native shrubs in the San Luis Valley, Colorado USA. Plant Soil 2004, 260, 225–236. [Google Scholar] [CrossRef]
  15. Schwinning, S. The water relations of two evergreen tree species in a karst savanna. Oecologia 2008, 158, 373–383. [Google Scholar] [CrossRef] [PubMed]
  16. Wei, Y.F.; Fang, J.; Liu, S.; Zhao, X.Y.; Li, S.G. Stable isotopic observation of water use sources of Pinus sylvestris var. mongolica in Horqin Sandy Land, China. Trees Struct. Funct. 2013, 27, 1249–1260. [Google Scholar] [CrossRef]
  17. Williams, D.G.; Ehleringer, J.R. Intra- and interspecific variation for summer precipitation use in pinyon–juniper woodlands. Ecol. Monogr. 2000, 70, 517–537. [Google Scholar]
  18. Mensforth, L.J.; Thorbum, P.J.; Tyerman, S.D.; Walker, G.R. Sources of water used by riparian Eucalyptus camaldulensis overlying highly saline groundwater. Oecologia 1994, 100, 21–28. [Google Scholar] [CrossRef]
  19. Thorbum, P.J.; Walker, G.R. Variations in stream water uptake by Eucalyptus camaldulensis with differing access to stream water. Oecologia 1994, 100, 293–301. [Google Scholar] [CrossRef]
  20. Smith, S.D.; Wellington, A.B.; Nachlinger, J.A.; Fox, C.A. Functional responses of riparian vegetation to streamflow diversions in the eastern Sierra Nevada. Ecol. Appl. 1991, 1, 89–97. [Google Scholar] [CrossRef]
  21. Busch, D.E.; Ingraham, N.L.; Smith, S.D. Water uptake in woody riparian phreatophytes of the southwestem United States: A stable isotope study. Ecol. Appl. 1992, 2, 450–459. [Google Scholar] [CrossRef]
  22. Ohte, N.; Koba, K.; Yoshikawa, K.; Sugimoto, A.; Matsuo, N.; Kabeya, N.; Wang, L.H. Water utilization of natural and planted trees in the semiarid desert of Inner Mongolia, China. Ecol. Appl. 2003, 13, 337–351. [Google Scholar] [CrossRef]
  23. Huang, L.; Zhang, Z.S.; Li, X.R. The extrapolation of the leaf area-based transpiration of two xerophytic shrubs in a revegetated desert area in the Tengger Desert, China. Hydrol. Res. 2014. [Google Scholar] [CrossRef]
  24. Ehleringer, J.R.; Osmond, C.B. Stable isotopes. In Plant Physiological Ecology: Field Methods and Instrumentation; Pearcy, R.W., Ehleringer, J., Mooney, H.A., Rundel, P.W., Eds.; Chapman and Hall: London, UK, 1989. [Google Scholar]
  25. Socki, R.A.; Romanek, C.S.; Gibson, E.K., Jr. On-line technique for measuring stable oxygen and hydrogen isotopes from microliter quantities of water. Anal. Chem. 1999, 71, 2250–2253. [Google Scholar] [CrossRef] [PubMed]
  26. Coplen, T.B.; Wildman, J.D.; Chen, J. Improvements in the gaseous hydrogen–water equilibration technique for hydrogen isotope ratio analysis. Anal. Chem. 1991, 63, 910–912. [Google Scholar] [CrossRef]
  27. Phillips, D.L.; Gregg, J.W. Source partitioning using stable isotopes: Coping with too many sources. Oecologia 2003, 136, 261–269. [Google Scholar] [CrossRef]
  28. Phillips, D.L.; Newsome, S.D.; Gregg, J.W. Combining sources in stable isotope mixing models: Alternative methods. Oecologia 2005, 144, 520–527. [Google Scholar] [CrossRef] [PubMed]
  29. Craig, H. Isotope variations in meteoric waters. Science 1961, 133, 1702–1703. [Google Scholar] [CrossRef] [PubMed]
  30. Allison, G.; Barnes, C.; Hughes, M. The distribution of deuterium and 18O in dry soil 2. Experimental. J. Hydrol. 1983, 64, 377–397. [Google Scholar] [CrossRef]
  31. Dawson, T.E.; Ehleringer, J.R. Streamside trees that do not use stream water. Nature 1991, 350, 335–337. [Google Scholar] [CrossRef]
  32. Jackson, P.C.; Meinzer, F.C.; Bustamante, M.; Goldstein, G.; Franco, A.; Rundel, P.W.; Caldas, L.; Igler, E.; Causin, F. Partitioning of soil water among tree species in a Brazilian Cerrado ecosystem. Tree Physiol. 1999, 19, 717–724. [Google Scholar] [CrossRef] [PubMed]
  33. Dawson, T.E. Determining water use by trees and forests from isotopic, energy balance and transpiration analyses: The role of tree size and hydraulic lift. Tree Physiol. 1996, 16, 263–272. [Google Scholar] [CrossRef] [PubMed]
  34. Zhang, Z.S.; Li, X.R.; Liu, L.C.; Jia, R.L.; Zhang, J.G.; Wang, T. Distribution, biomass, and dynamics of roots in a revegetated stand of Caragana korshinskii in the Tengger Desert, northwestern China. J. Plant Res. 2009, 122, 109–119. [Google Scholar] [CrossRef] [PubMed]
  35. Murphy, P.; Lugo, A.E. Ecology of tropical dry forests. Annu. Rev. Ecol. Syst. 1986, 17, 67–88. [Google Scholar] [CrossRef]
  36. Castellanos, J.; Maass, M.; Kummerow, J. Root biomass of a dry deciduous tropical forest in Mexico. Plant Soil 1991, 131, 225–235. [Google Scholar] [CrossRef]
  37. Stratton, L.C.; Goldstein, G.; Meinzer, F.C. Temporal and spatial partitioning of water resources among eight woody species in a Hawaiian dry forest. Oecologia 2000, 124, 309–317. [Google Scholar] [CrossRef]
  38. Ruan, Y.F.; Zhao, L.J.; Xiao, H.L.; Cheng, G.D.; Zhou, M.X.; Wang, F. Water sources of plants and groundwater in typical ecosystems in the lower reaches of the Heihe River Basin. Sci. Cold Arid Reg. 2014, 6, 0226–0235. [Google Scholar]
  39. Walker, B.H.; Ludwig, D.; Holling, C.S.; Peterman, R.M. Stability of semi-arid savanna grazing systems. J. Ecol. 1981, 69, 473–498. [Google Scholar] [CrossRef]
  40. Reynolds, J.F.; Kemp, P.R.; Tenhunen, J.D. Effects of long-term rainfall variability on evapotranspiration and soil water distribution in the Chihuahuan Desert: A modeling analysis. Plant Ecol. 2000, 150, 145–159. [Google Scholar] [CrossRef]
  41. Ogle, K.; Reynolds, J.F. Plant responses to precipitation in desert ecosystems: Integrating functional types, pulses, thresholds, and delays. Oecologia 2004, 141, 282–294. [Google Scholar] [CrossRef] [PubMed]
  42. Intergovernmental Panel on Climate Change (IPCC). Climate Change 2007: Synthesis Report. Contribution of Working Groups I, II and III to the Fourth Assessment Report of the Intergovernmental Panel on Climate Change; IPCC: Geneva, Switzerland, 2007. [Google Scholar]
  43. Huang, L.; Zhang, Z.S.; Li, X.R. Soil CO2 concentration in biological soil crusts and its driving factors in a revegetated area of the Tengger Desert, Northern China. Environ. Earth Sci. 2014, 72, 767–777. [Google Scholar] [CrossRef]
  44. Horton, J.L.; Hart, S.C. Hydraulic lift: A potentially important ecosystem process. Trends Ecol. Evol. 1998, 13, 232–235. [Google Scholar] [CrossRef] [PubMed]
  45. Armas, C.; Padilla, F.M.; Pugnaire, F.I.; Jackson, R.B. Hydraulic lift and tolerance to salinity of semiarid species: Consequences for species interactions. Oecologia 2010, 162, 11–21. [Google Scholar] [CrossRef]
  46. Dawson, T.E. Hydraulic lift and the water use by plants: Implications for water balance, performance and plant–plant interactions. Oecologia 1993, 95, 565–574. [Google Scholar] [CrossRef]
  47. Li, X.R.; He, M.Z.; Duan, Z.H.; Xiao, H.L.; Jia, X.H. Recovery of topsoil physiochemical properties in revegetated sites in the sand-burial ecosystems of the Tengger Desert, northern China. Geomorphology 2007, 88, 254–265. [Google Scholar] [CrossRef]

