Article

Blending the Analytic Hierarchy Process and Fuzzy Logical Systems in Scenic Beauty Assessment of Check Dams in Streams

1
Department of Spatial Design, Chienkuo Technology University, No. 1, Chieh-Shou N. Rd., Changhua 500, Taiwan
2
State Key Laboratory of Geohazard Prevention and Geoenvironment Protection, Chengdu University of Technology, Chengdu 610059, China
*
Author to whom correspondence should be addressed.
Water 2015, 7(12), 6983-6998; https://doi.org/10.3390/w7126670
Submission received: 8 October 2015 / Revised: 30 November 2015 / Accepted: 2 December 2015 / Published: 11 December 2015

Abstract

:
With Taiwan’s steep terrain and fracture geology, natural disasters are likely to occur after heavy rainfall. To reduce the effects of upstream sediment on human surroundings, check dams are an essential transverse structure for streams in watersheds. However, there is likely to be a detrimental visual impact on the landscape without consideration of the integration of dams with the environment. Based on previous studies of landscape assessment, this paper considers the factors of texture, color, and form, often used as part of expert paradigms, as the major aesthetic aspects of check dams. These factors are used to construct an expert questionnaire using the Delphi Method and Analytic Hierarchy Process (AHP). The preliminary criteria and weights for Scenic Beauty Assessment of check dams are determined based on the results of AHP. A Fuzzy Logical System is further applied to solve the linguistic fuzziness of landscape assessment so as to establish a complete expert scenic beauty assessment model. Five cases are further tested for comparison with 224 public samples with Scenic Beauty Estimation (SBE). Results demonstrate that the model presents the validity of expert paradigm and the reliability of the psychophysical paradigm. These results can provide a reference for engineering designers seeking to integrate check dams with the natural landscape. The results indicate that the present method can efficiently assess the scenic beauty of check dams as established by a scientific method.

1. Introduction

There is a broad spectrum of resources in Taiwan’s forests. The managerial strategies for the upper streams of watersheds often focus on the protection of forests and water sources. Despite this, the high mountains with steep slopes, fragile geology, and frequent occurrence of typhoons and earthquakes have frequently resulted in natural disasters. In order to protect the forests as well as people’s lives and property along the downstream areas, it is necessary to establish check dams. Taiwan’s Technical Manual for Soil and Water Conservation [1] defines check dams as having a transverse structure, higher than 5 m, for damming river sediments in the river, regulating sediment deposits, stabilizing the river bed and stream banks, preventing erosion and washout, and restraining mudslides. Concrete gravity dams or semi-gravity reinforced concrete dams were previously the most common types of check dams in Taiwan’s mountain areas. For environmental and ecological demands, however, permeable gabion dams or slit dams and steel dams for specific demands have been applied in recent years. However, the design for the forest protection and hazard, in many cases, was not able to integrate with the natural environment, leading to harmful consequences for the visual landscape.
The term “landscape” covers a broad range of meanings. It originally referred to agricultural countryside scenery, and then changed to natural field or hill scenery. The German term landschaft is used to describe the beauty and spatial characteristics of all visual entities within environments, generally covering the natural ecology, humanities, and aesthetics. In previous research on stream ecology and the visual assessment of rivers [2,3,4], however, very few studies have discussed the influence of artificial structures on landscape aesthetics, and the studies discussing it have focused on the surrounding natural landscape [5,6,7,8].
To implement the environmental management and understand the characteristics of natural landscapes, various theories for landscape assessment have been developed [9,10]. Landscape assessment generally refers to the assessment of the visual quality of an environment through visual perception. The visual quality can be considered from an aesthetic standpoint, aiming to understand the function and value of a landscape for the purposes of regional development or conservation. Zube et al. [11] classified general landscape assessments into an expert paradigm, psychophysical paradigm, cognitive paradigm, and experiential paradigm. However, there are few scientific studies on landscape design related to the divergence between expert paradigms and non-expert paradigms for landscape assessments. García et al. [12] proposed that the visual aesthetics of any object could be defined by its color, form, line, and texture. These characteristics were simplified into color, form, and texture by Chen & Lin [13] to establish operational principles for the aesthetic design of check dams, referring to Clark & Pause’s 11 analytical methods of formative ideas [14]. Subsequently, Shih’s color system was used to evaluate natural environments [15], as were the object characteristics of texture regularity, density, and grain size in García et al. [12].
Based on this literature review and the aesthetic principles of check dams (texture, color, and form) proposed by Chen & Lin [13], it is assumed that the engineering structure should be integrated with the environment as part of the basic requirements for aesthetic design in order to discuss the integration design for dam body and forest background. By establishing a fuzzy logical system along with questionnaires to modify the aesthetic design principles of check dams, several cases were examined and compared with 224 public samples through the Scenic Beauty Estimation Method (SBE) [16]. SBE is a psycho-physical method developed by Daniel & Boster [17]. Within a limited period of time, subjects were asked to view a continuous series of slides and then rate their preference, scored from 0 to 9, where “0” indicated least preferred and “9” indicated most preferred [18,19]. The results of the present study are intended to provide a design reference for relevant personnel in the future.

2. Research Method

2.1. Analytic Hierarchy Process

The Analytic Hierarchy Process (AHP), proposed by Thomas Saaty, has become a common decision-making tool for various applications [20,21,22,23,24,25,26]. Its use is divided into the establishment of hierarchy and the assessment of hierarchy. With AHP, the elements of complex problems are assessed by experts and then presented through simple hierarchical structures, which are further evaluated with scales for subsequent paired comparison and matrix establishment. Eigenvectors are then used to compare the priority of elements in hierarchies. Finally, the consistency of the paired-comparison matrix is tested for reference. According to the paired comparison used to establish the matrix A, aij is the compared value between i and j, while the diagonal shows the self-comparison of elements that have a value of 1. The upper right values in the matrix are the comparison results of the questionnaire, while the lower left values are the reciprocals of the upper right values, i.e., aji = 1/aij.
A = [ 1 a 12 ... a 1 n a 21 1 ... a 2 n ... a n 1 a n 2 ... 1 ] = [ 1 a 12 ... a 1 n 1 / a 12 1 ... a 2 n ... 1 / a 1 n 1 / a 2 n ... 1 ]
When the paired-comparison matrix is established, the eigen vector and the maximum eigen value are calculated to establish the weight. Saaty proposed the following approximate steps for acquiring the eigenvector: (1) average of normalized columns; (2) normalization of row average; then (3) normalization of the column reciprocal average; and (4) normalization of the geometric mean of the rows [22,23]. Based on the characteristics of MatLAB suitable for the computation of vector matrices, window-interfaced programming codes are self-developed for this study. These utilize the functions built into MatLAB for directly calculating the eigenvalues and eigenvectors as well as selecting the maximum eigenvalue and the corresponding eigenvector as the weight. Having calculated the vector, a consistency test is applied, including the calculation of consistency index (C.I.) and consistency ratio (C.R.):
C . I . = λ max n n 1
C . R . = C . I . R . I .
where λ max is the maximum eigenvalue; n is the matrix rank; and R.I. is the random index, which is the randomly generated consistency index of the matrix and is related to the rank of matrix, as Saaty suggested in Table 1 [22]. Saaty considered that the comparison was randomly generated as C.R. approached 1, and that greater consistency appeared as C.R. approached 0. Generally, C.R. 0.1 is acceptable. The weight of the overall hierarchy can be further calculated and tested for consistency after acquiring the relative weight between elements.
The current study is based on previous studies [13,27,
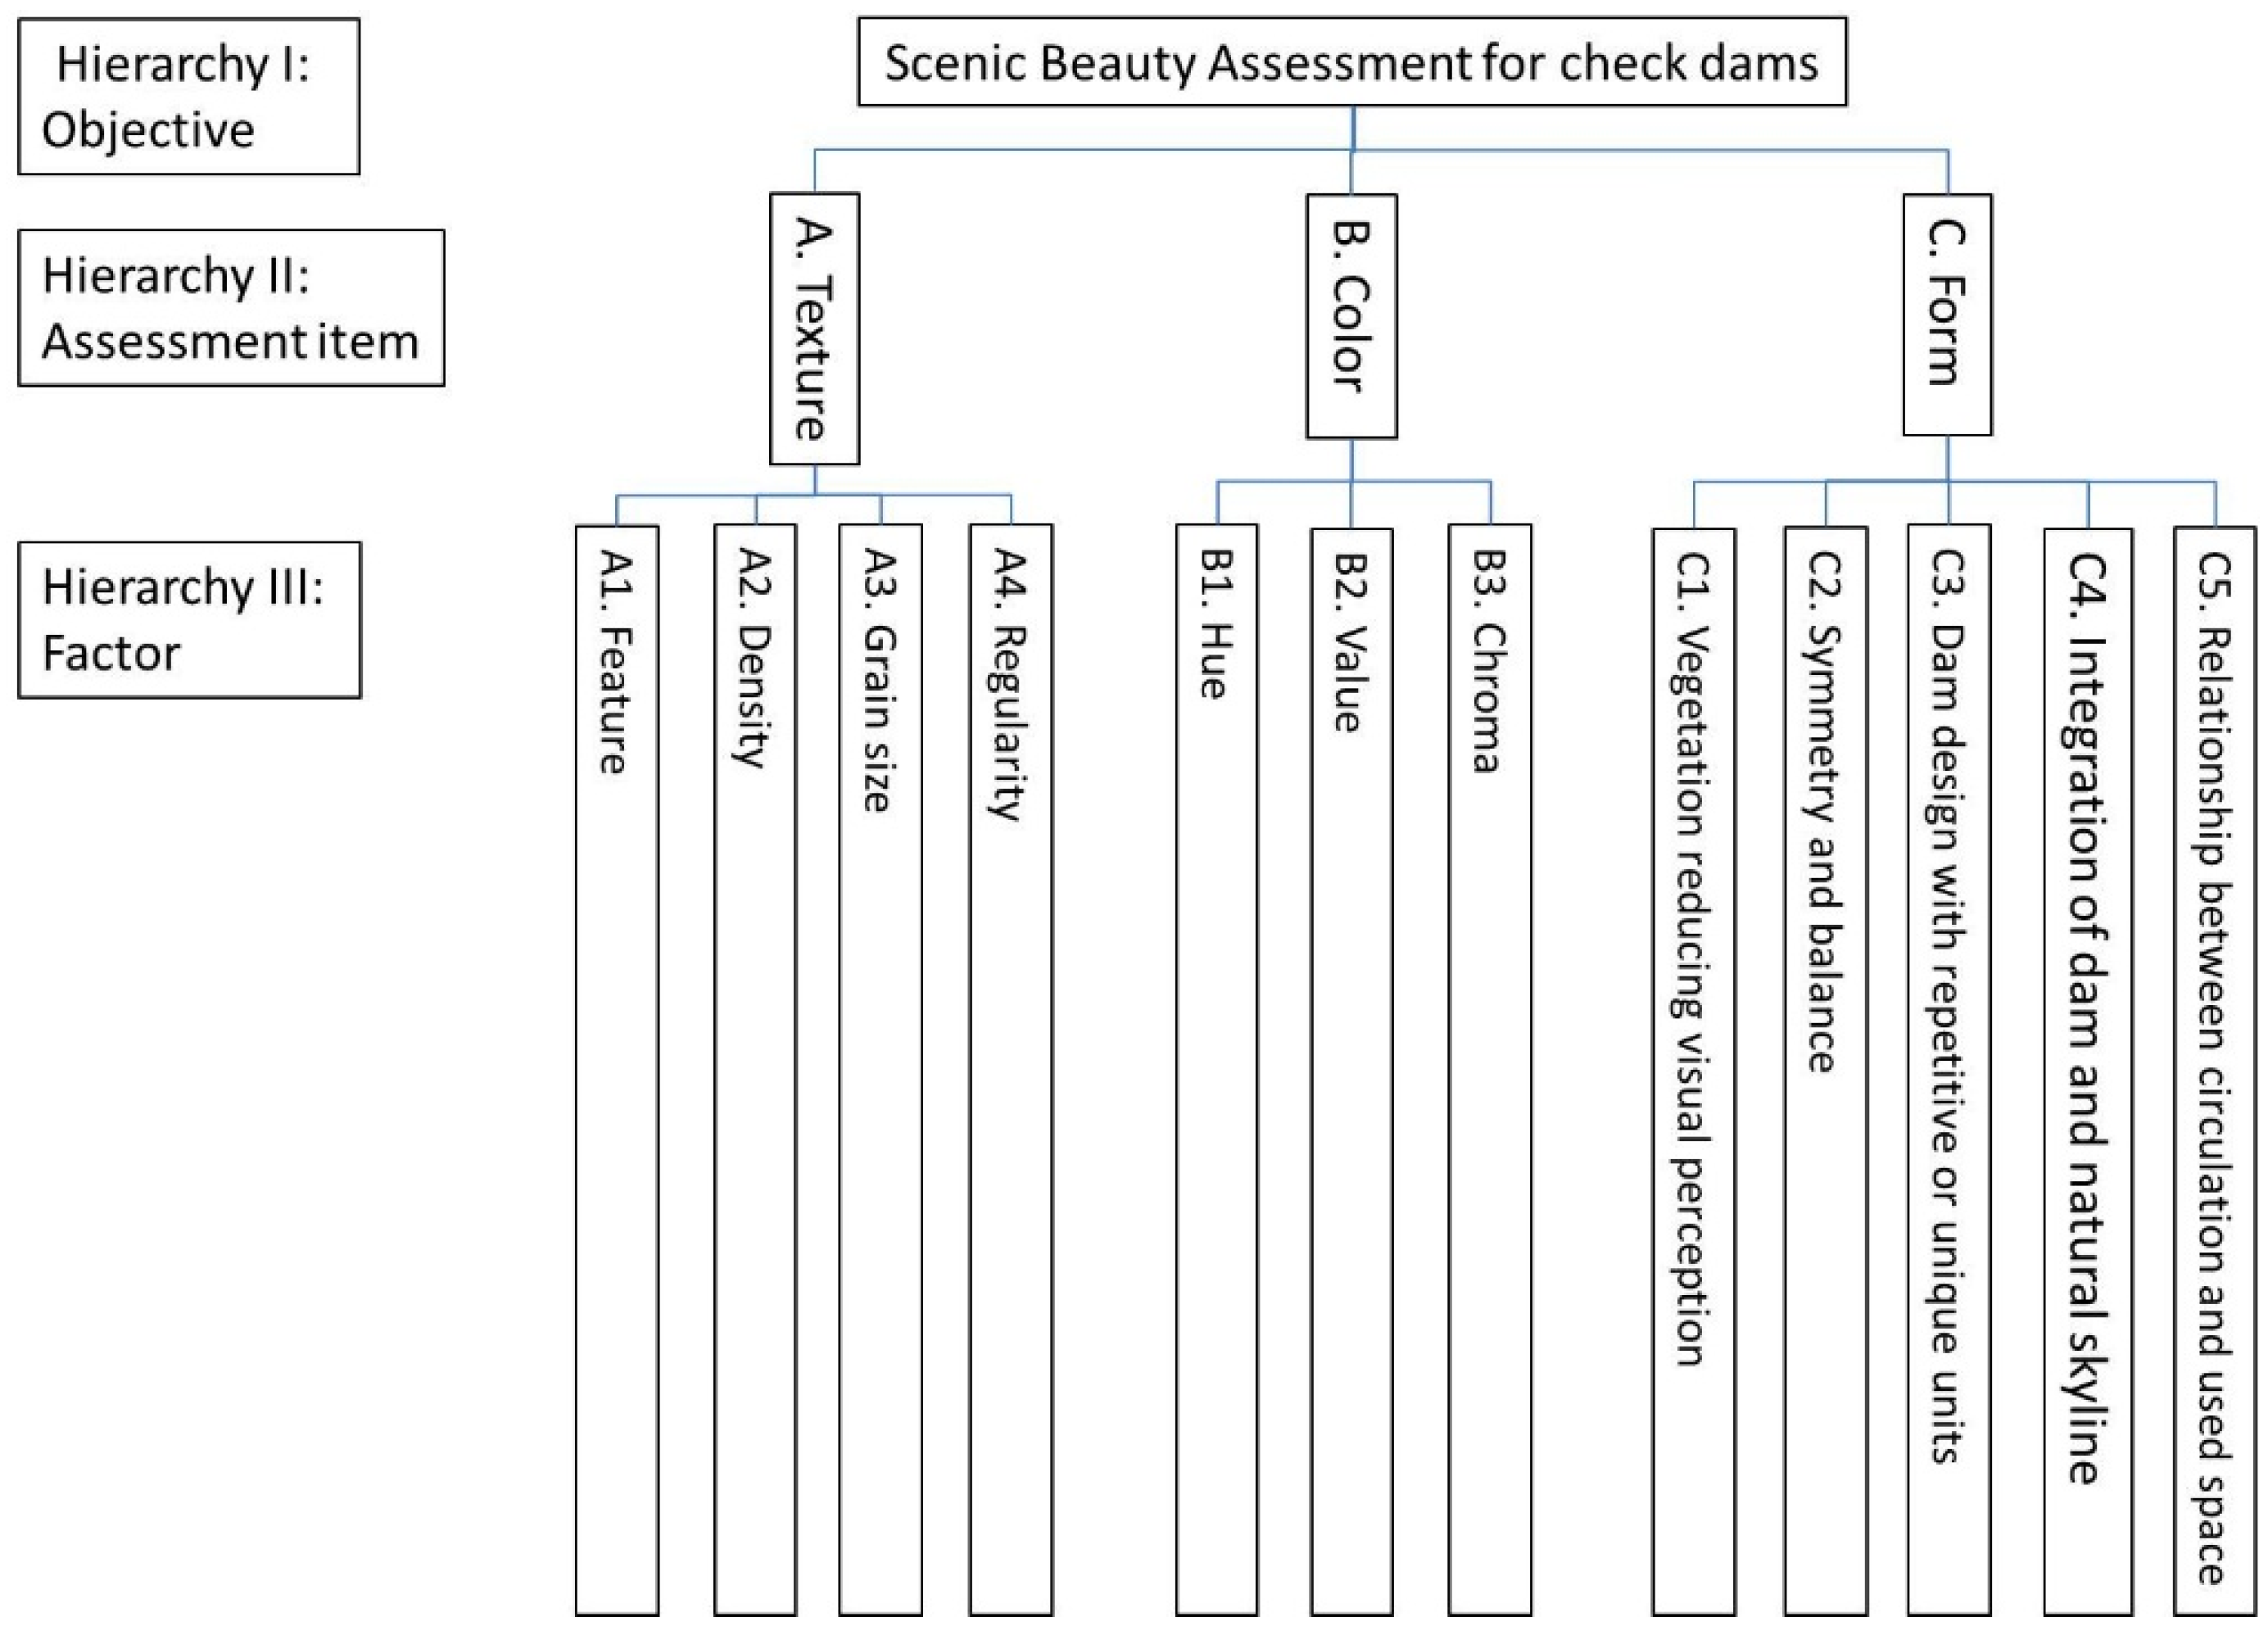
28] that used the Scenic Beauty Assessment (SBA) criteria to evaluate check dams with expert questionnaires, and the hierarchy of the evaluated factors is depicted in Figure 1. Implementation of the expert questionnaire is divided into Phase 1, for clarifying the importance of factors with the Delphi Method used to collect the opinions for the reference in the next step; and Phase 2, for evaluating the relative importance of the assessment items in order to determine the hierarchical matrix in AHP. MatLAB programming language is utilized for self-developing a Windows-interfaced program to calculate the eigenvalues, eigenvectors, C.I., and C.R. of the paired-comparison matrix as well as to directly calculate the weights between factors.
Table 1. Values of random index R.I. [13].
Rank12345678910
R.I.0.000.000.580.901.121.241.321.411.451.49
Figure 1. Structure of landscape assessment factors in check dam.
Water 07 06670 g001

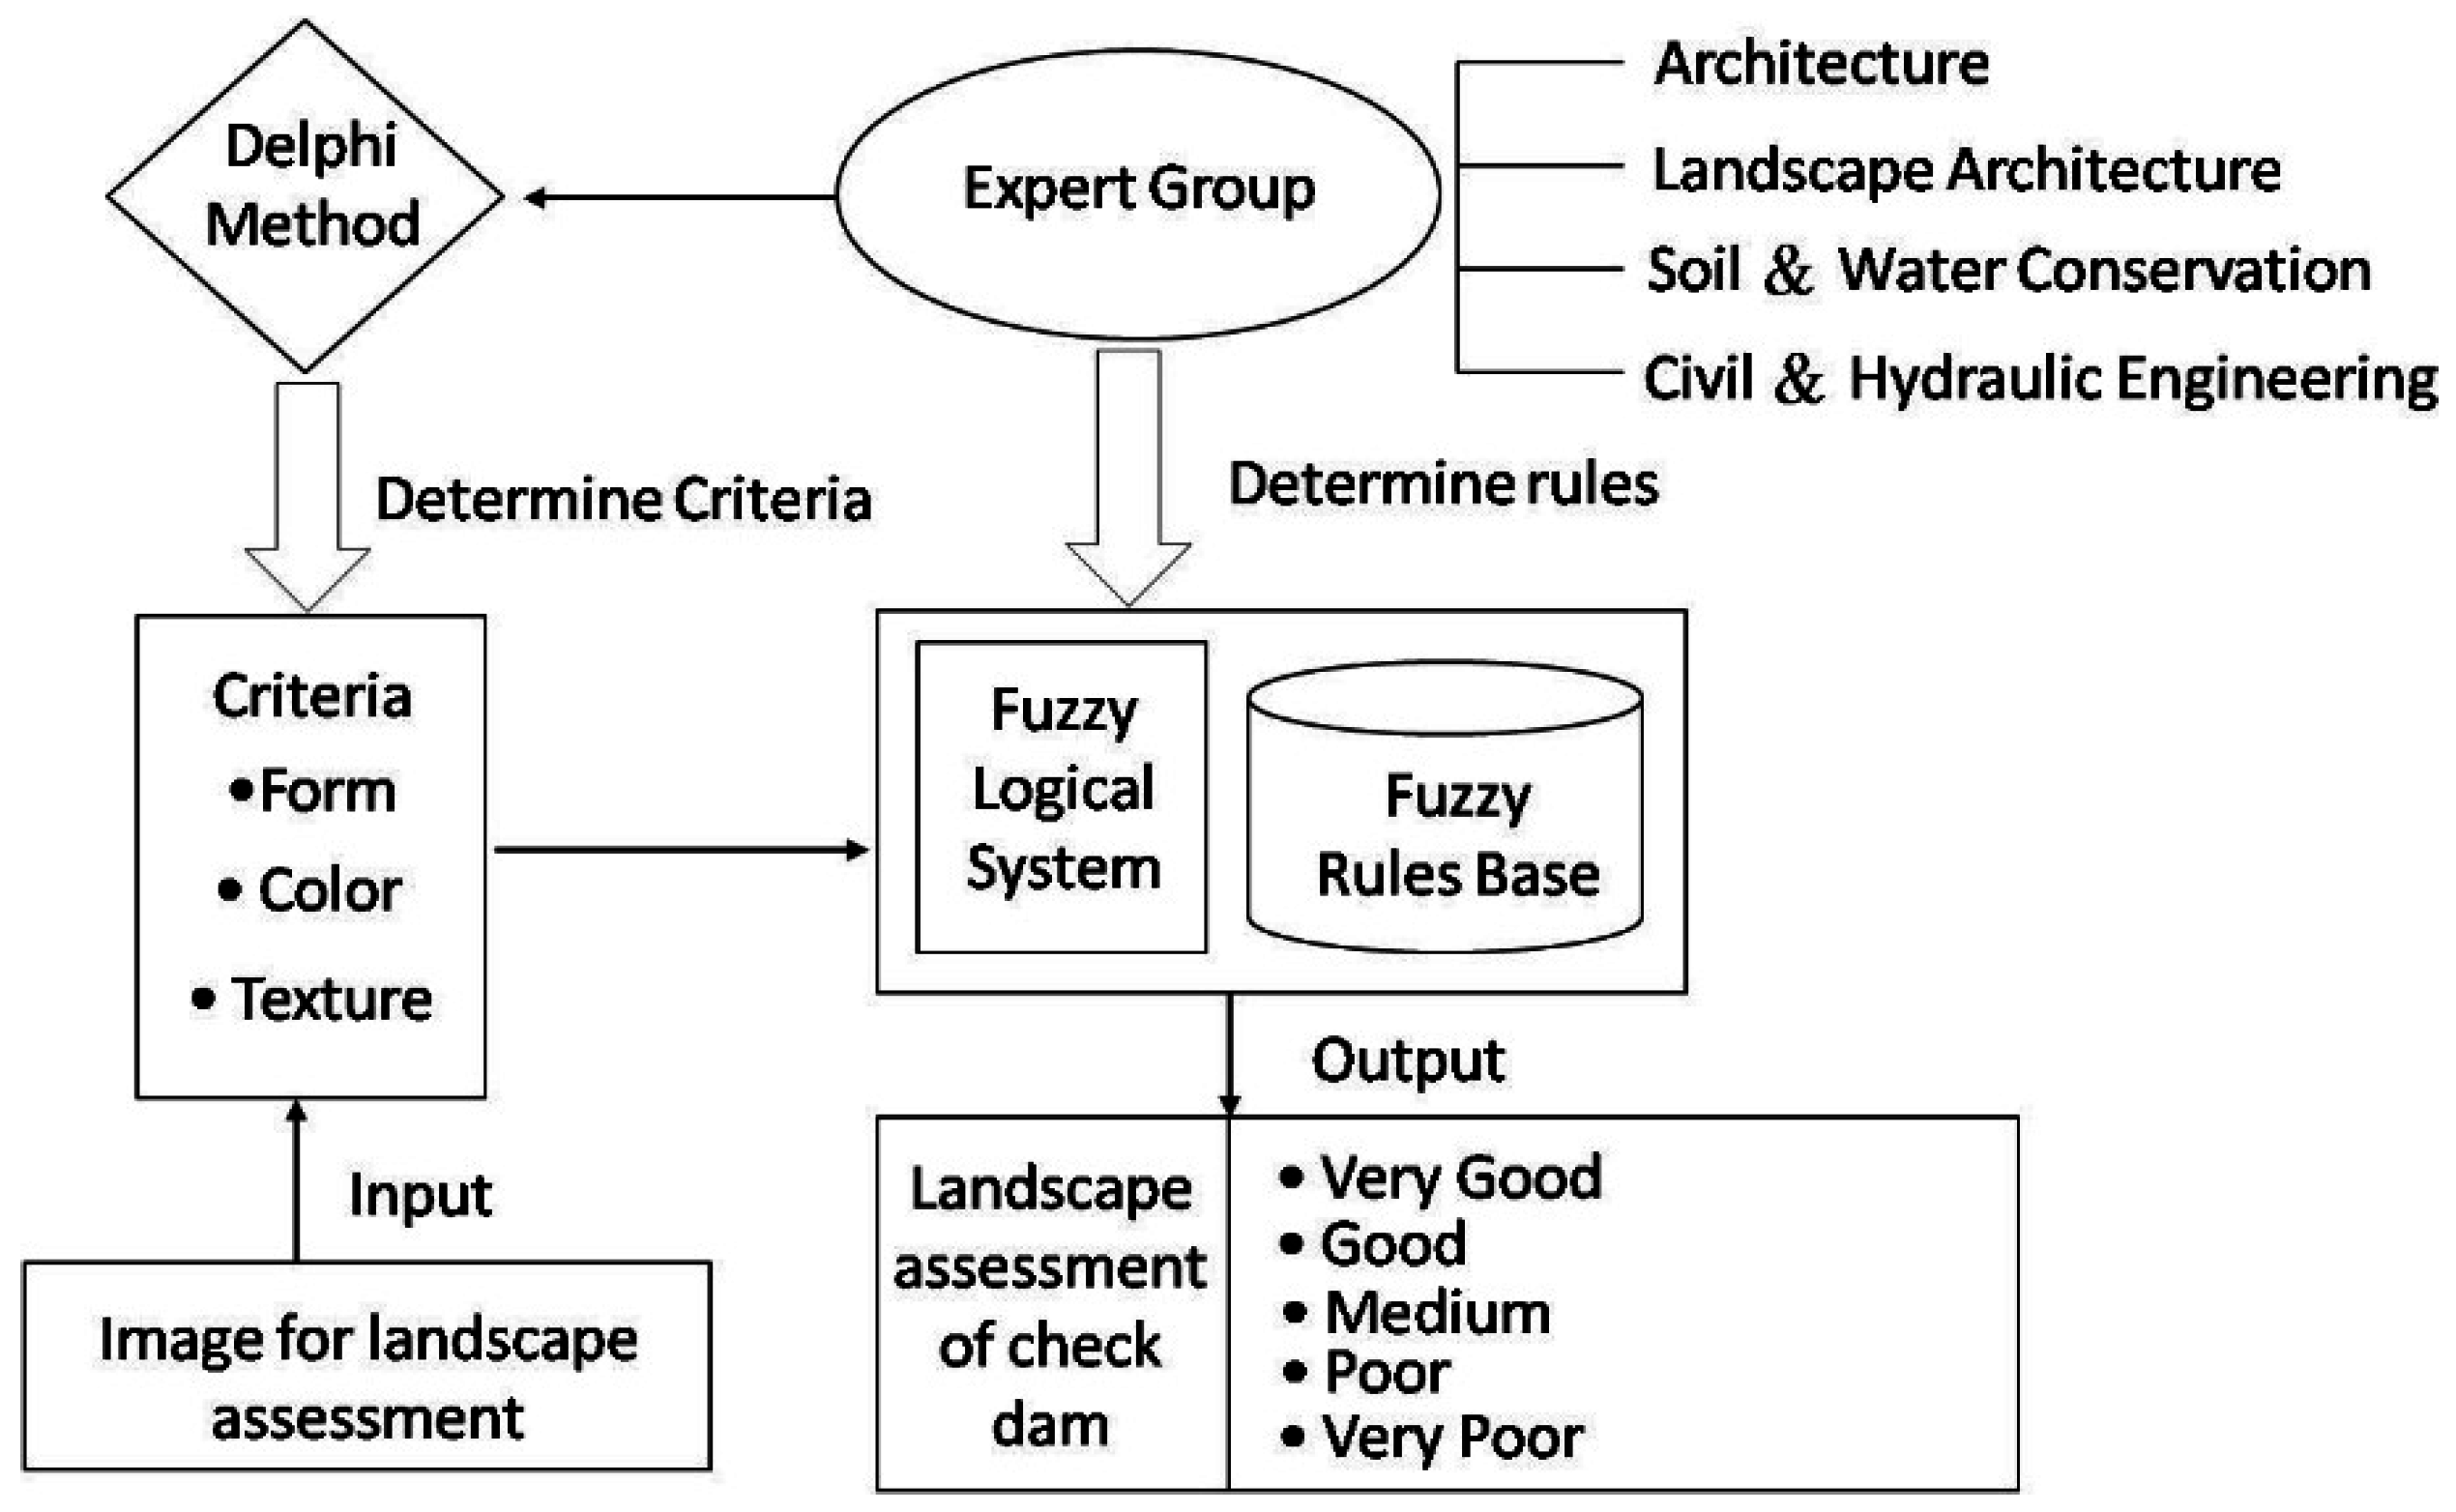
2.2. Fuzzy Logical System

Traditional Boolean logic has obvious limits. For example, a grade over 60 points might be needed to pass a course, which would be failed with less than 60, even though there is actually not a large difference between 61 and 59. In such a case, experts would generally apply common sense and use ambiguous language for solving problems. To overcome these limits, fuzzy control has two main advantages: (1) not requiring accurate mathematical models; and (2) being able to combine expert knowledge with the fuzzy system designed on computers [29,30,31,32]. When applying fuzzy control, the system is described with fuzzy rules, which use linguistic fuzzy information, rather than mathematical equations. As a result, expert knowledge could be transformed into fuzzy control rules to reduce the design complexity of expert assessment system. In this study, the expert questionnaires organized using AHP are utilized for establishing the fuzzy rules, and the Fuzzy Logical Toolbox in MatLAB is applied to establish the logical system.
Based on previous studies [27,28,33,34] and the results of our Expert Questionnaire Survey, the Scenic Beauty Assessment criteria for check dams and the fuzzy logic rules were determined. In addition, the Fuzzy Logical Toolbox [35] in MatLAB was used to establish a Fuzzy Logical System for Scenic Beauty Assessment (see Figure 2). Based on the research results of Chen & Lin [
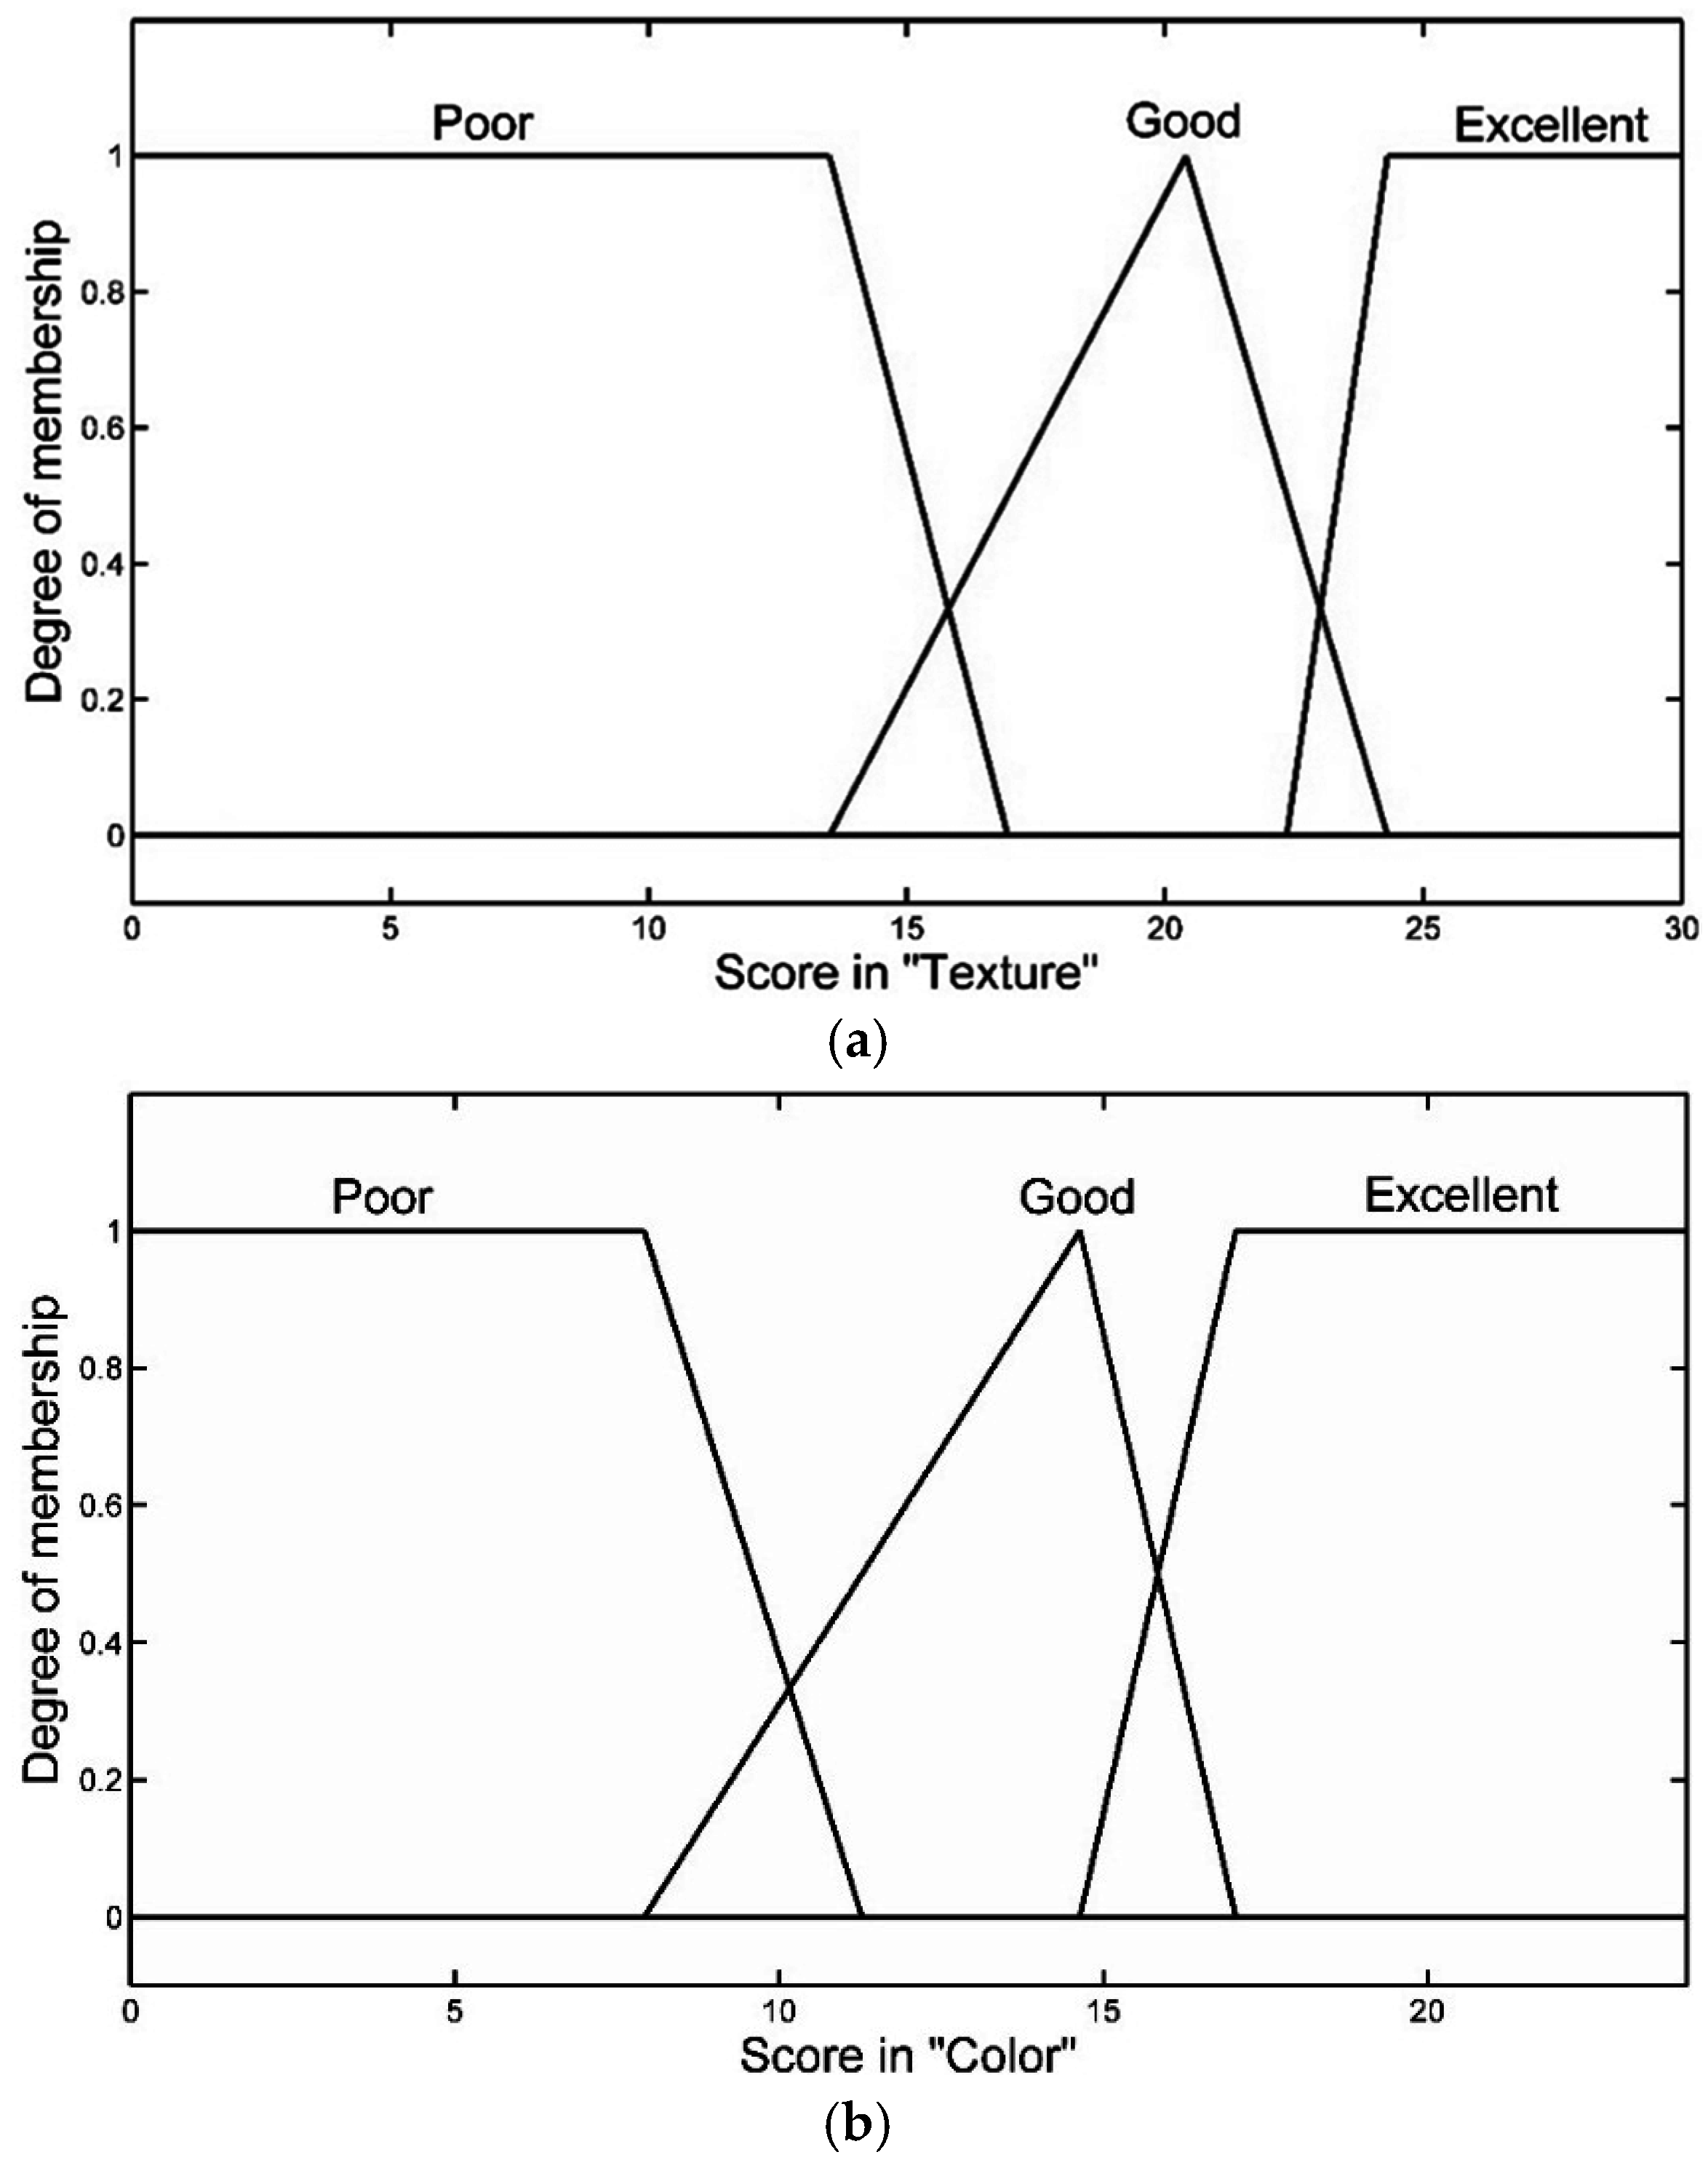
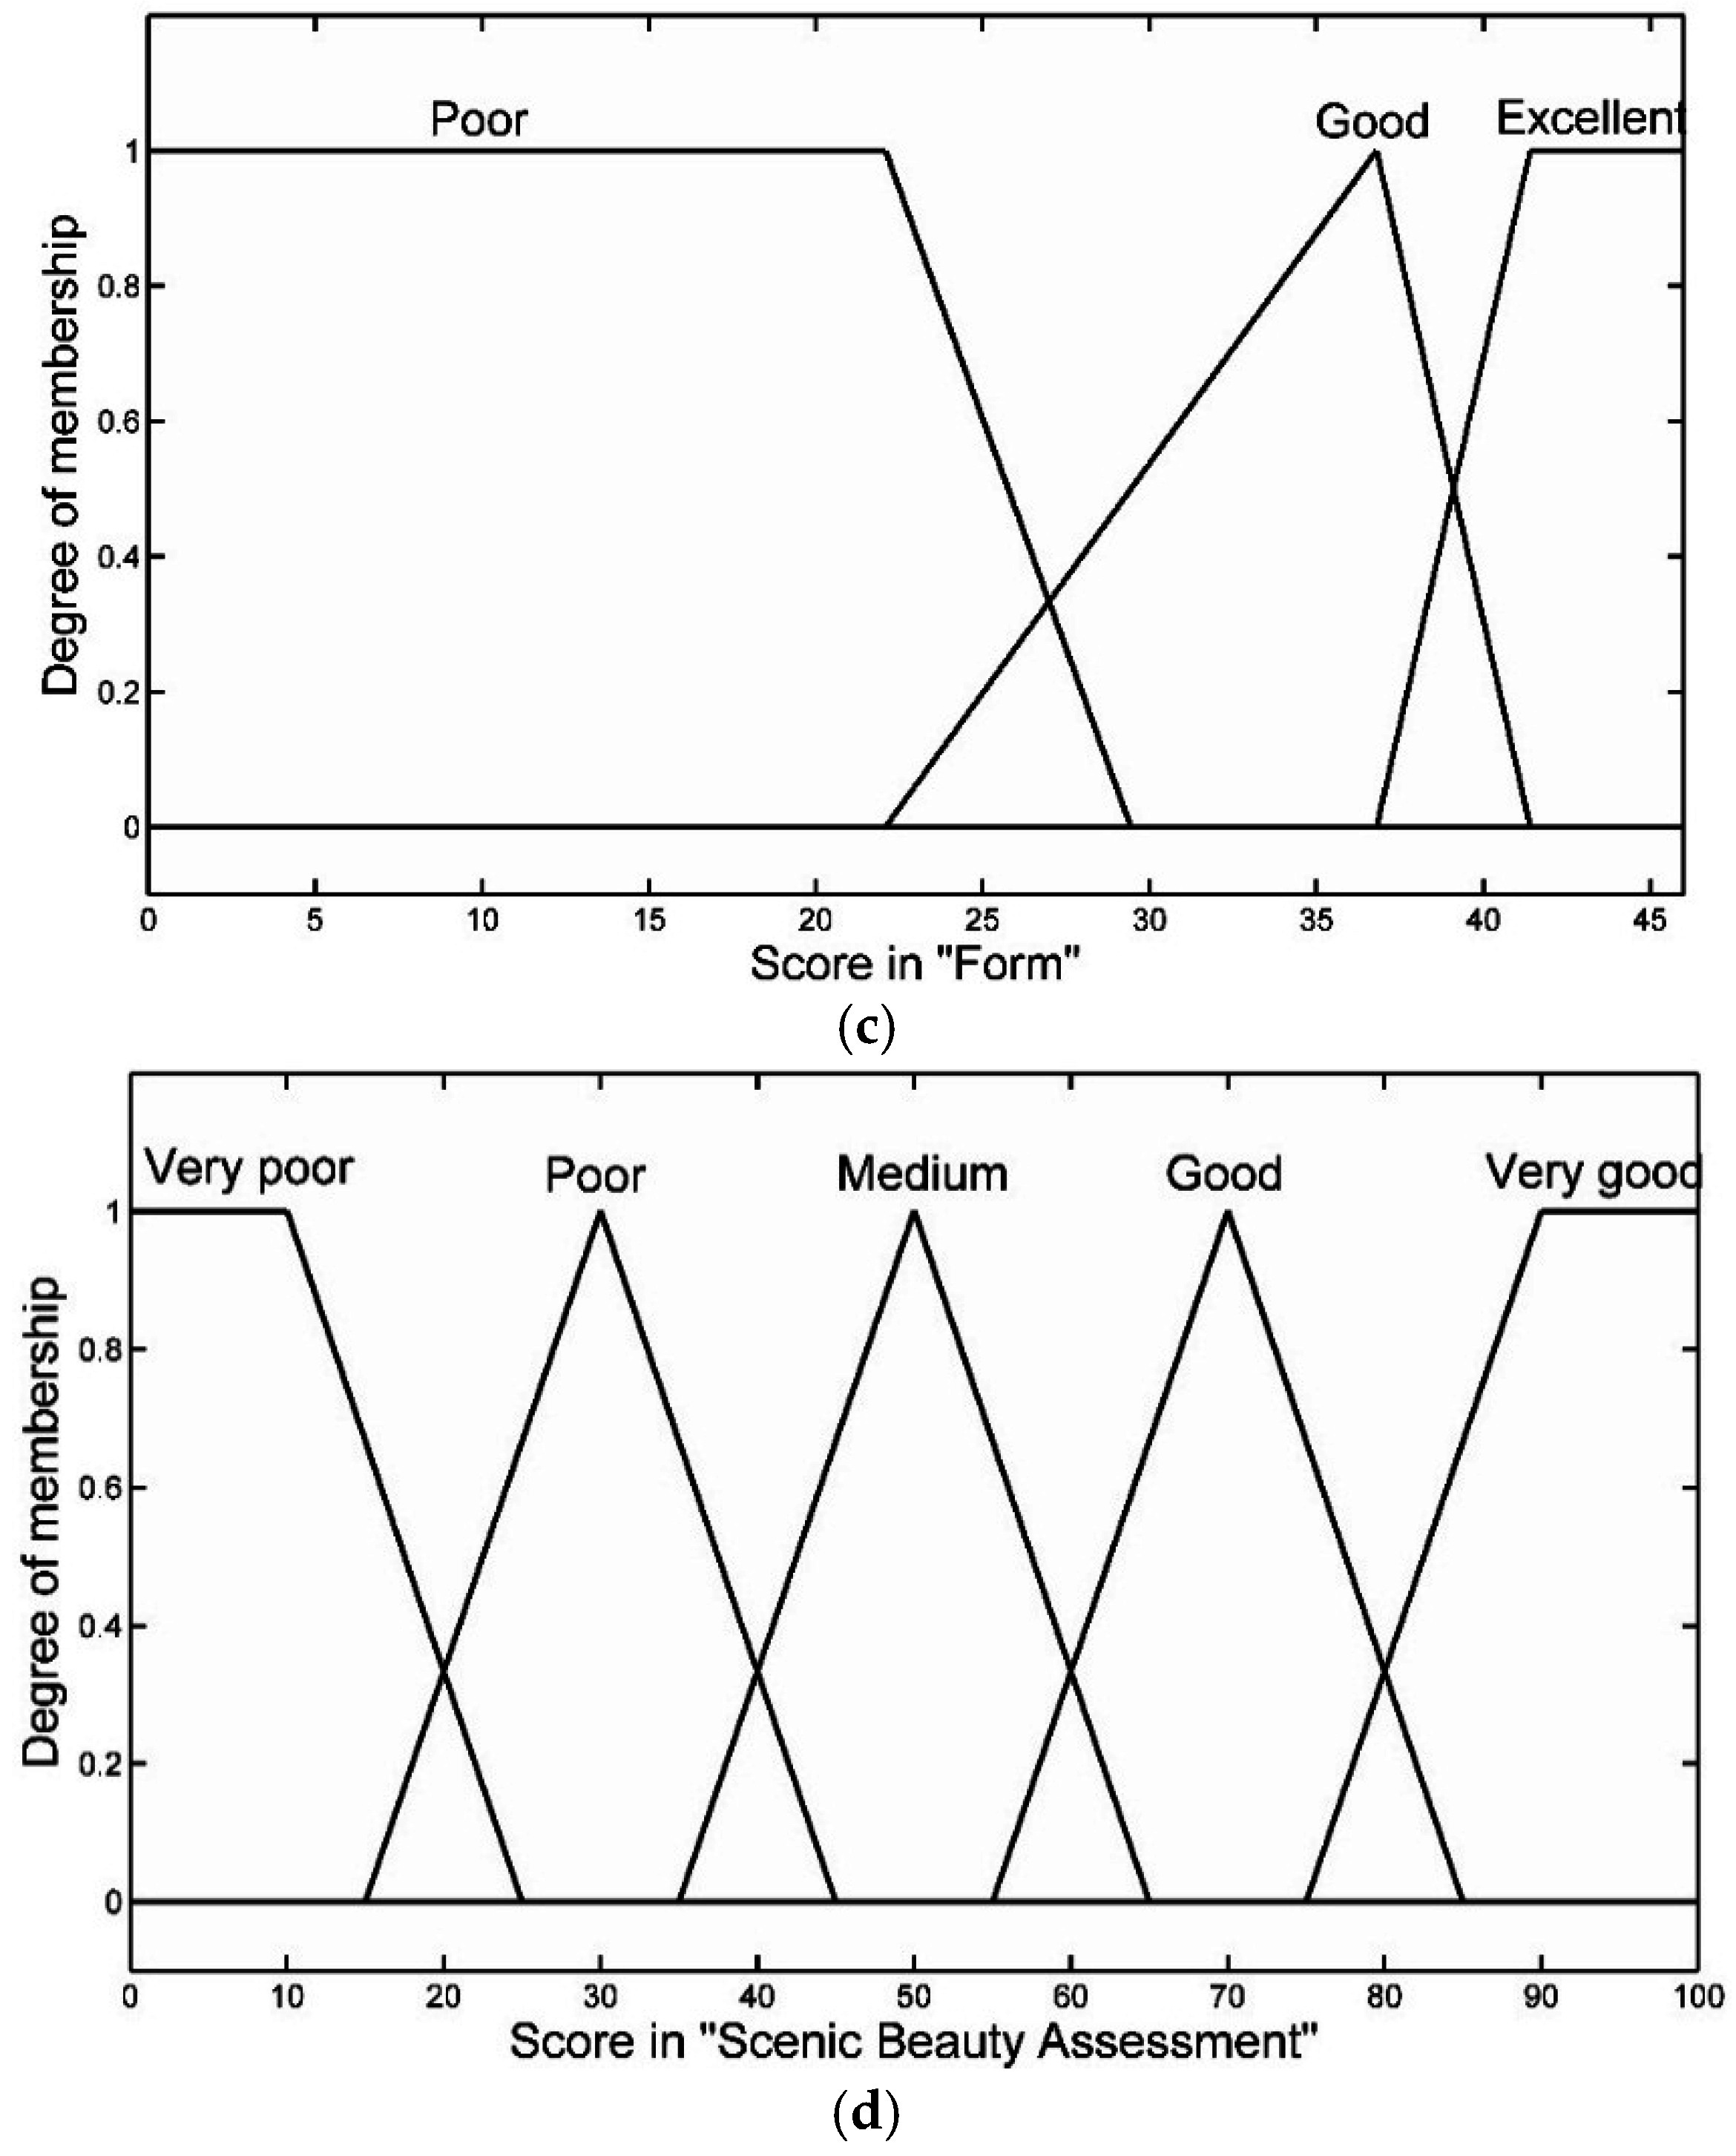
13], the Scenic Beauty Assessment criteria are established. These include an assessment range for the Fuzzy Logical System, including poor, good, and excellent, which is based on the weights of texture, color, and form. The values of very poor, poor, medium, good, and very good are the resulting Scenic Beauty Assessment (0–100). The fuzzy set of texture, color, form, and Scenic Beauty Assessment is shown in Figure 3, where the assessment range and the weights are further regulated based on results from the Experts Questionnaire Survey [28]. Detailed illustrations are described in the next section.
Figure 2. Flow chart of fuzzy logical system.
Water 07 06670 g002
Figure 3. Fuzzy sets of fuzzy logical system: (a) fuzzy set of texture; (b) fuzzy set of color; (c) fuzzy set of form; (d) fuzzy set of Scenic Beauty Assessment.
Water 07 06670 g003aWater 07 06670 g003b
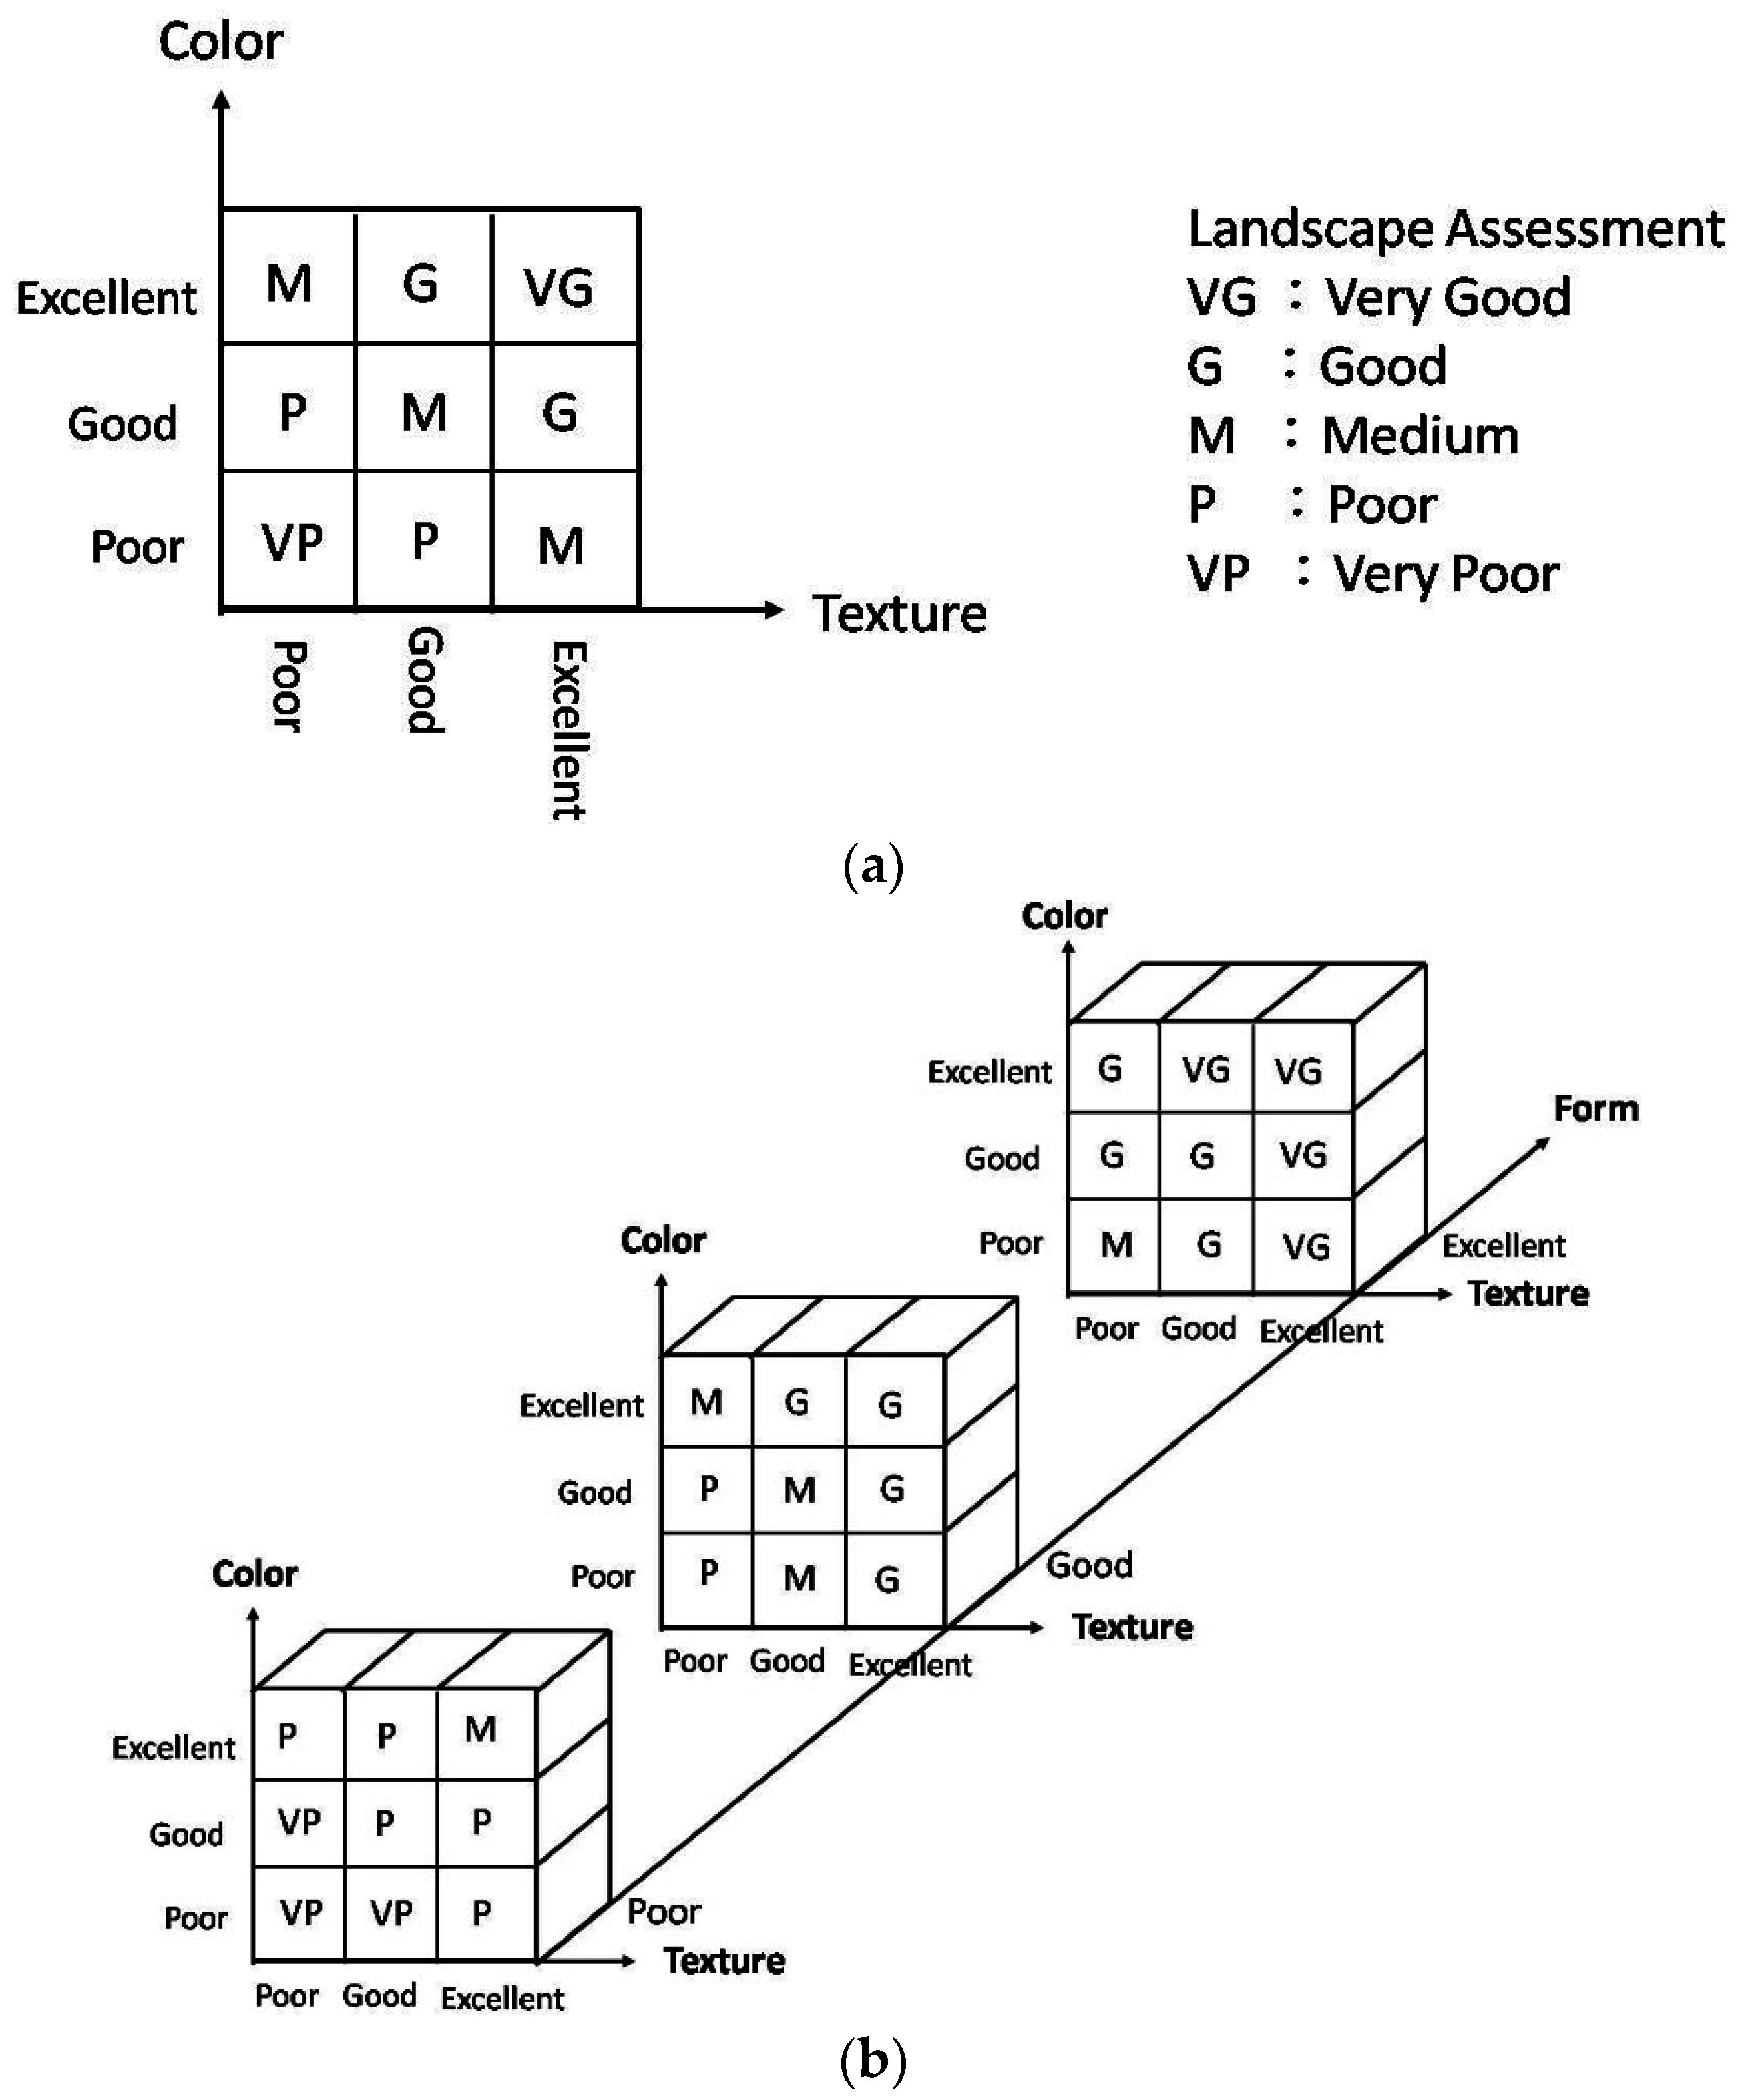
The fuzzy rules are further established. Since this study involves the application of three inputs and one output, it is convenient to present the fuzzy rules with a M × N × K matrix for such a three-to-one system [30]. Assuming that form receives the highest weight, form is first taken into account for the following rules.
  • If (form is excellent) then (Scenic Beauty Assessment is good)
  • If (form is good) then (Scenic Beauty Assessment is medium)
  • If (form is poor) then (Scenic Beauty Assessment is poor)
A 3   ×   3 FAM (Fuzzy Association Memory) could be used for the remaining rules, as shown in Figure 4a, where nine rules are acquired, from a total of 12 rules that form Rule Base 1. A cubic (3   ×   3   ×   3) FAM could be deducted for 27 rules that describe the complexity of all variables in the expert system, as shown in Figure 4b. Rule Base 2 is further established. This completes the fuzzy rules for the Fuzzy Logical System.
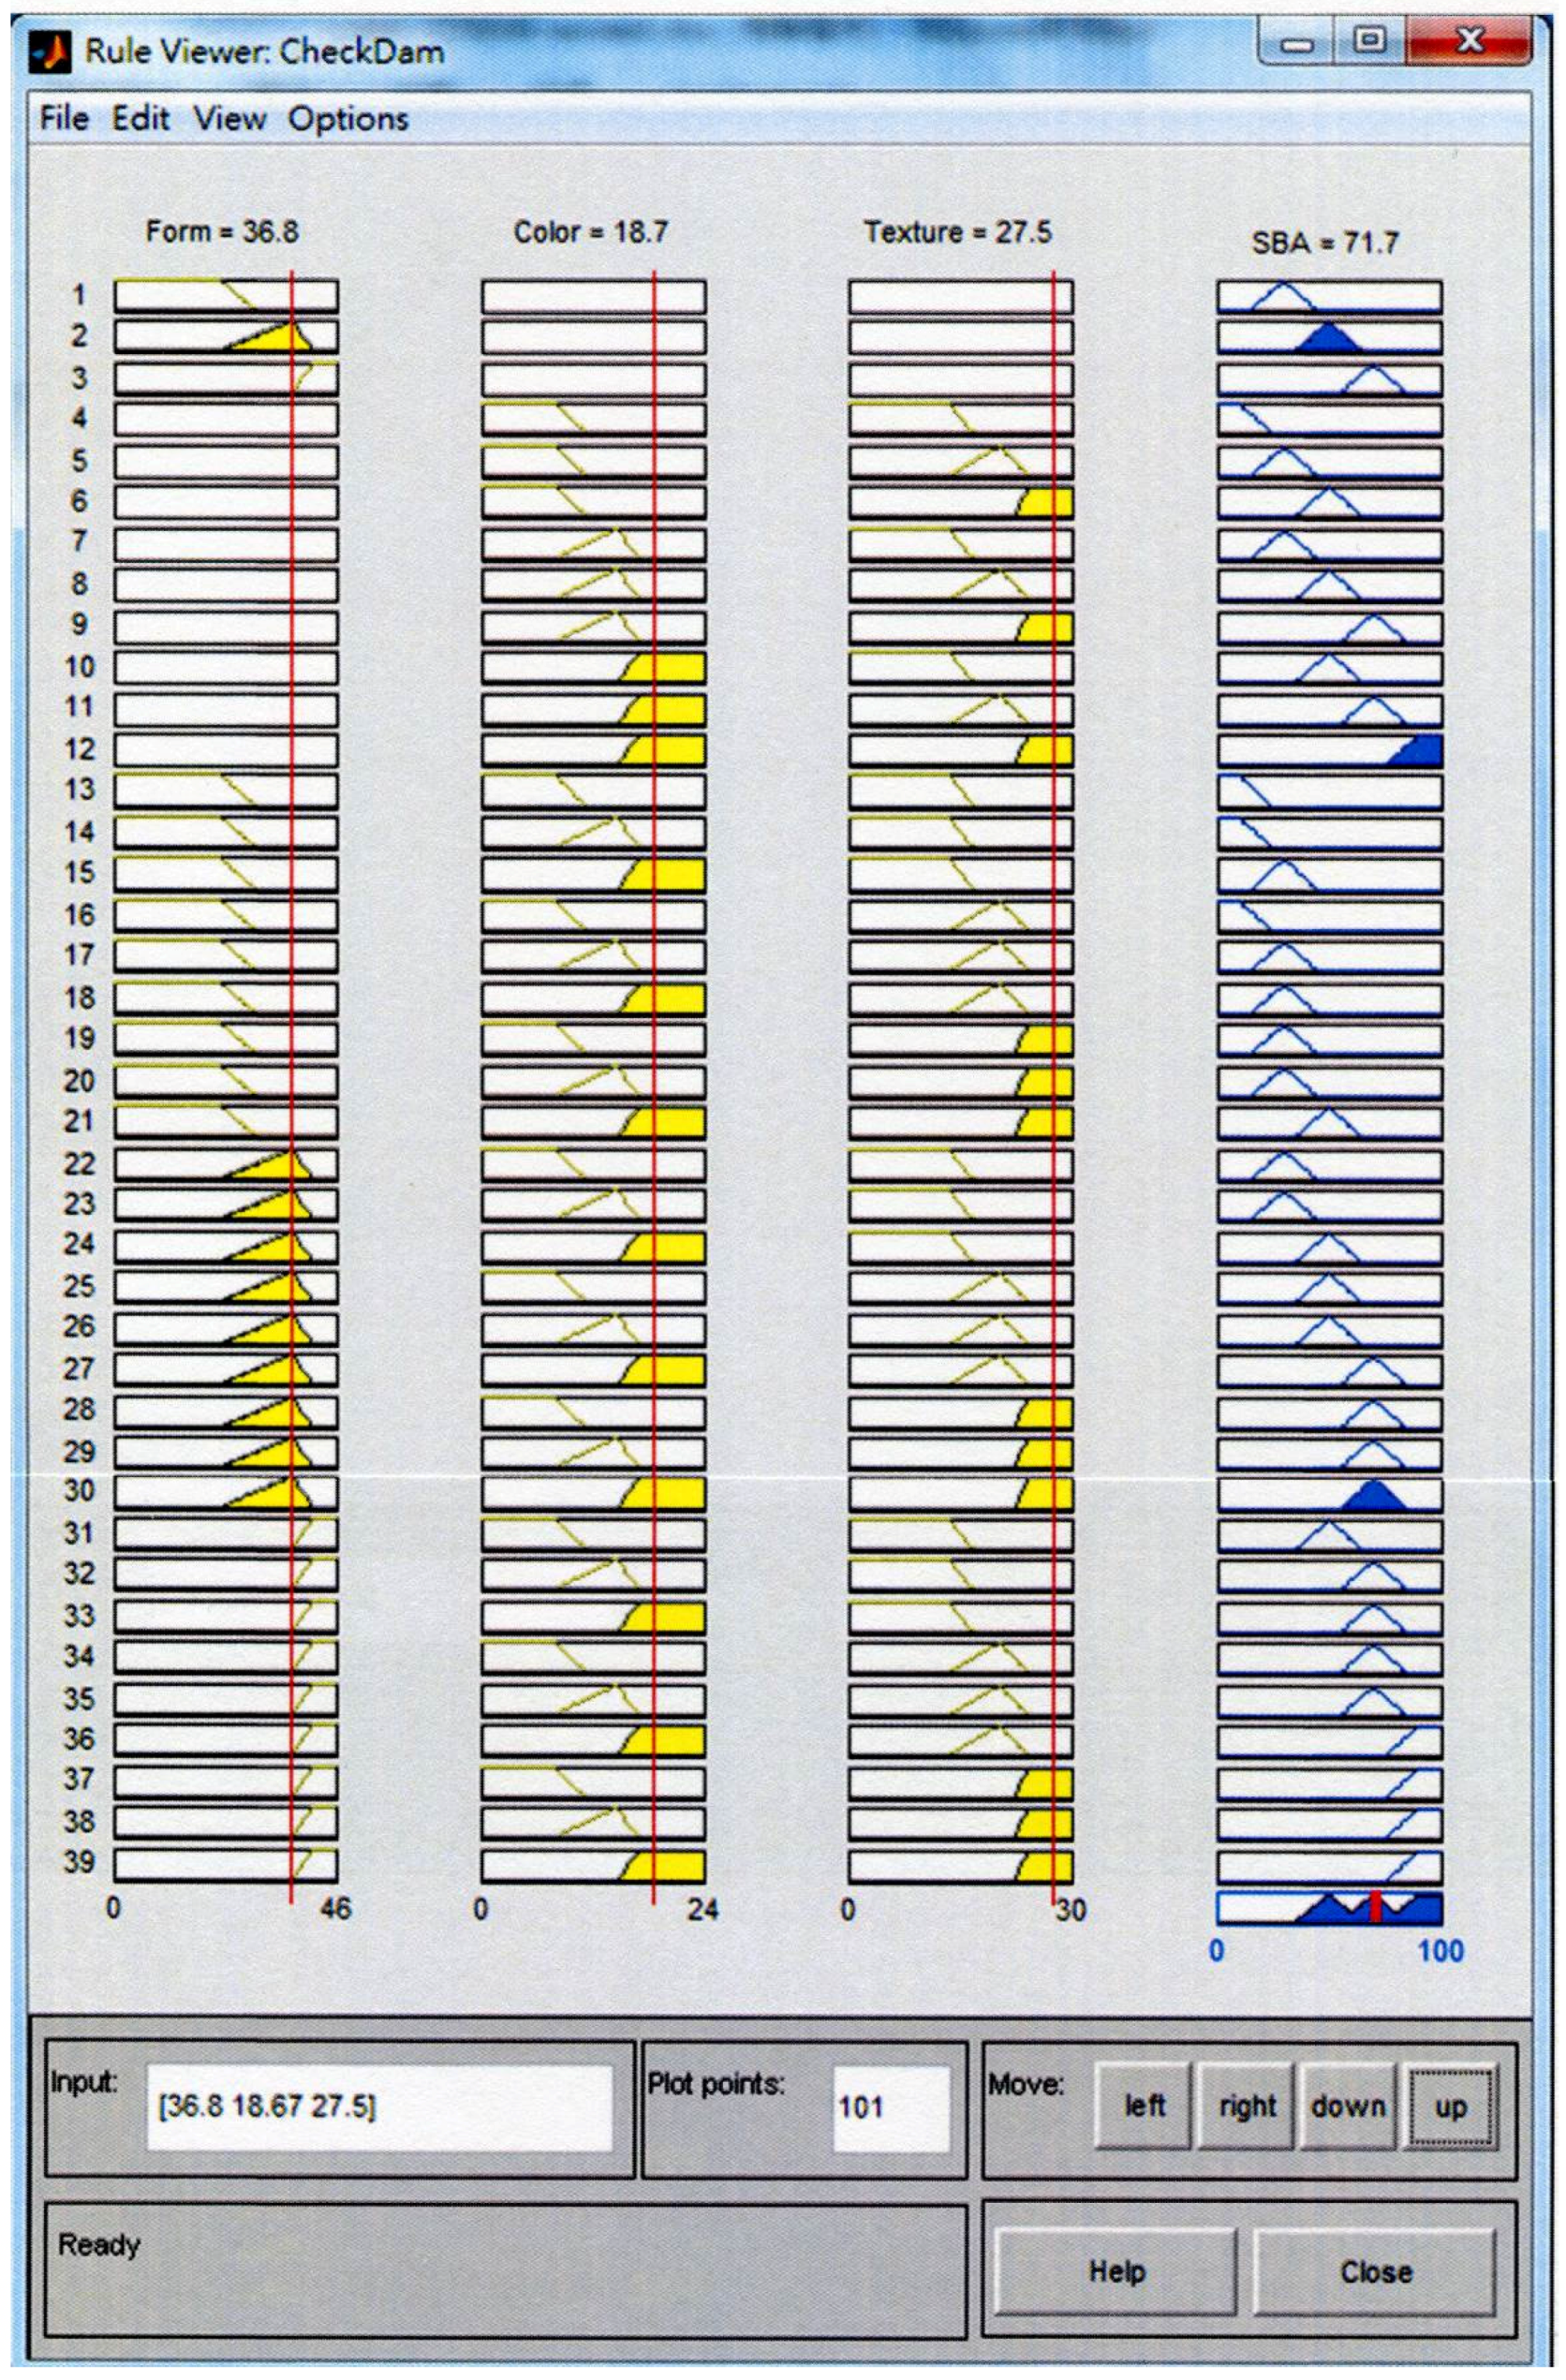
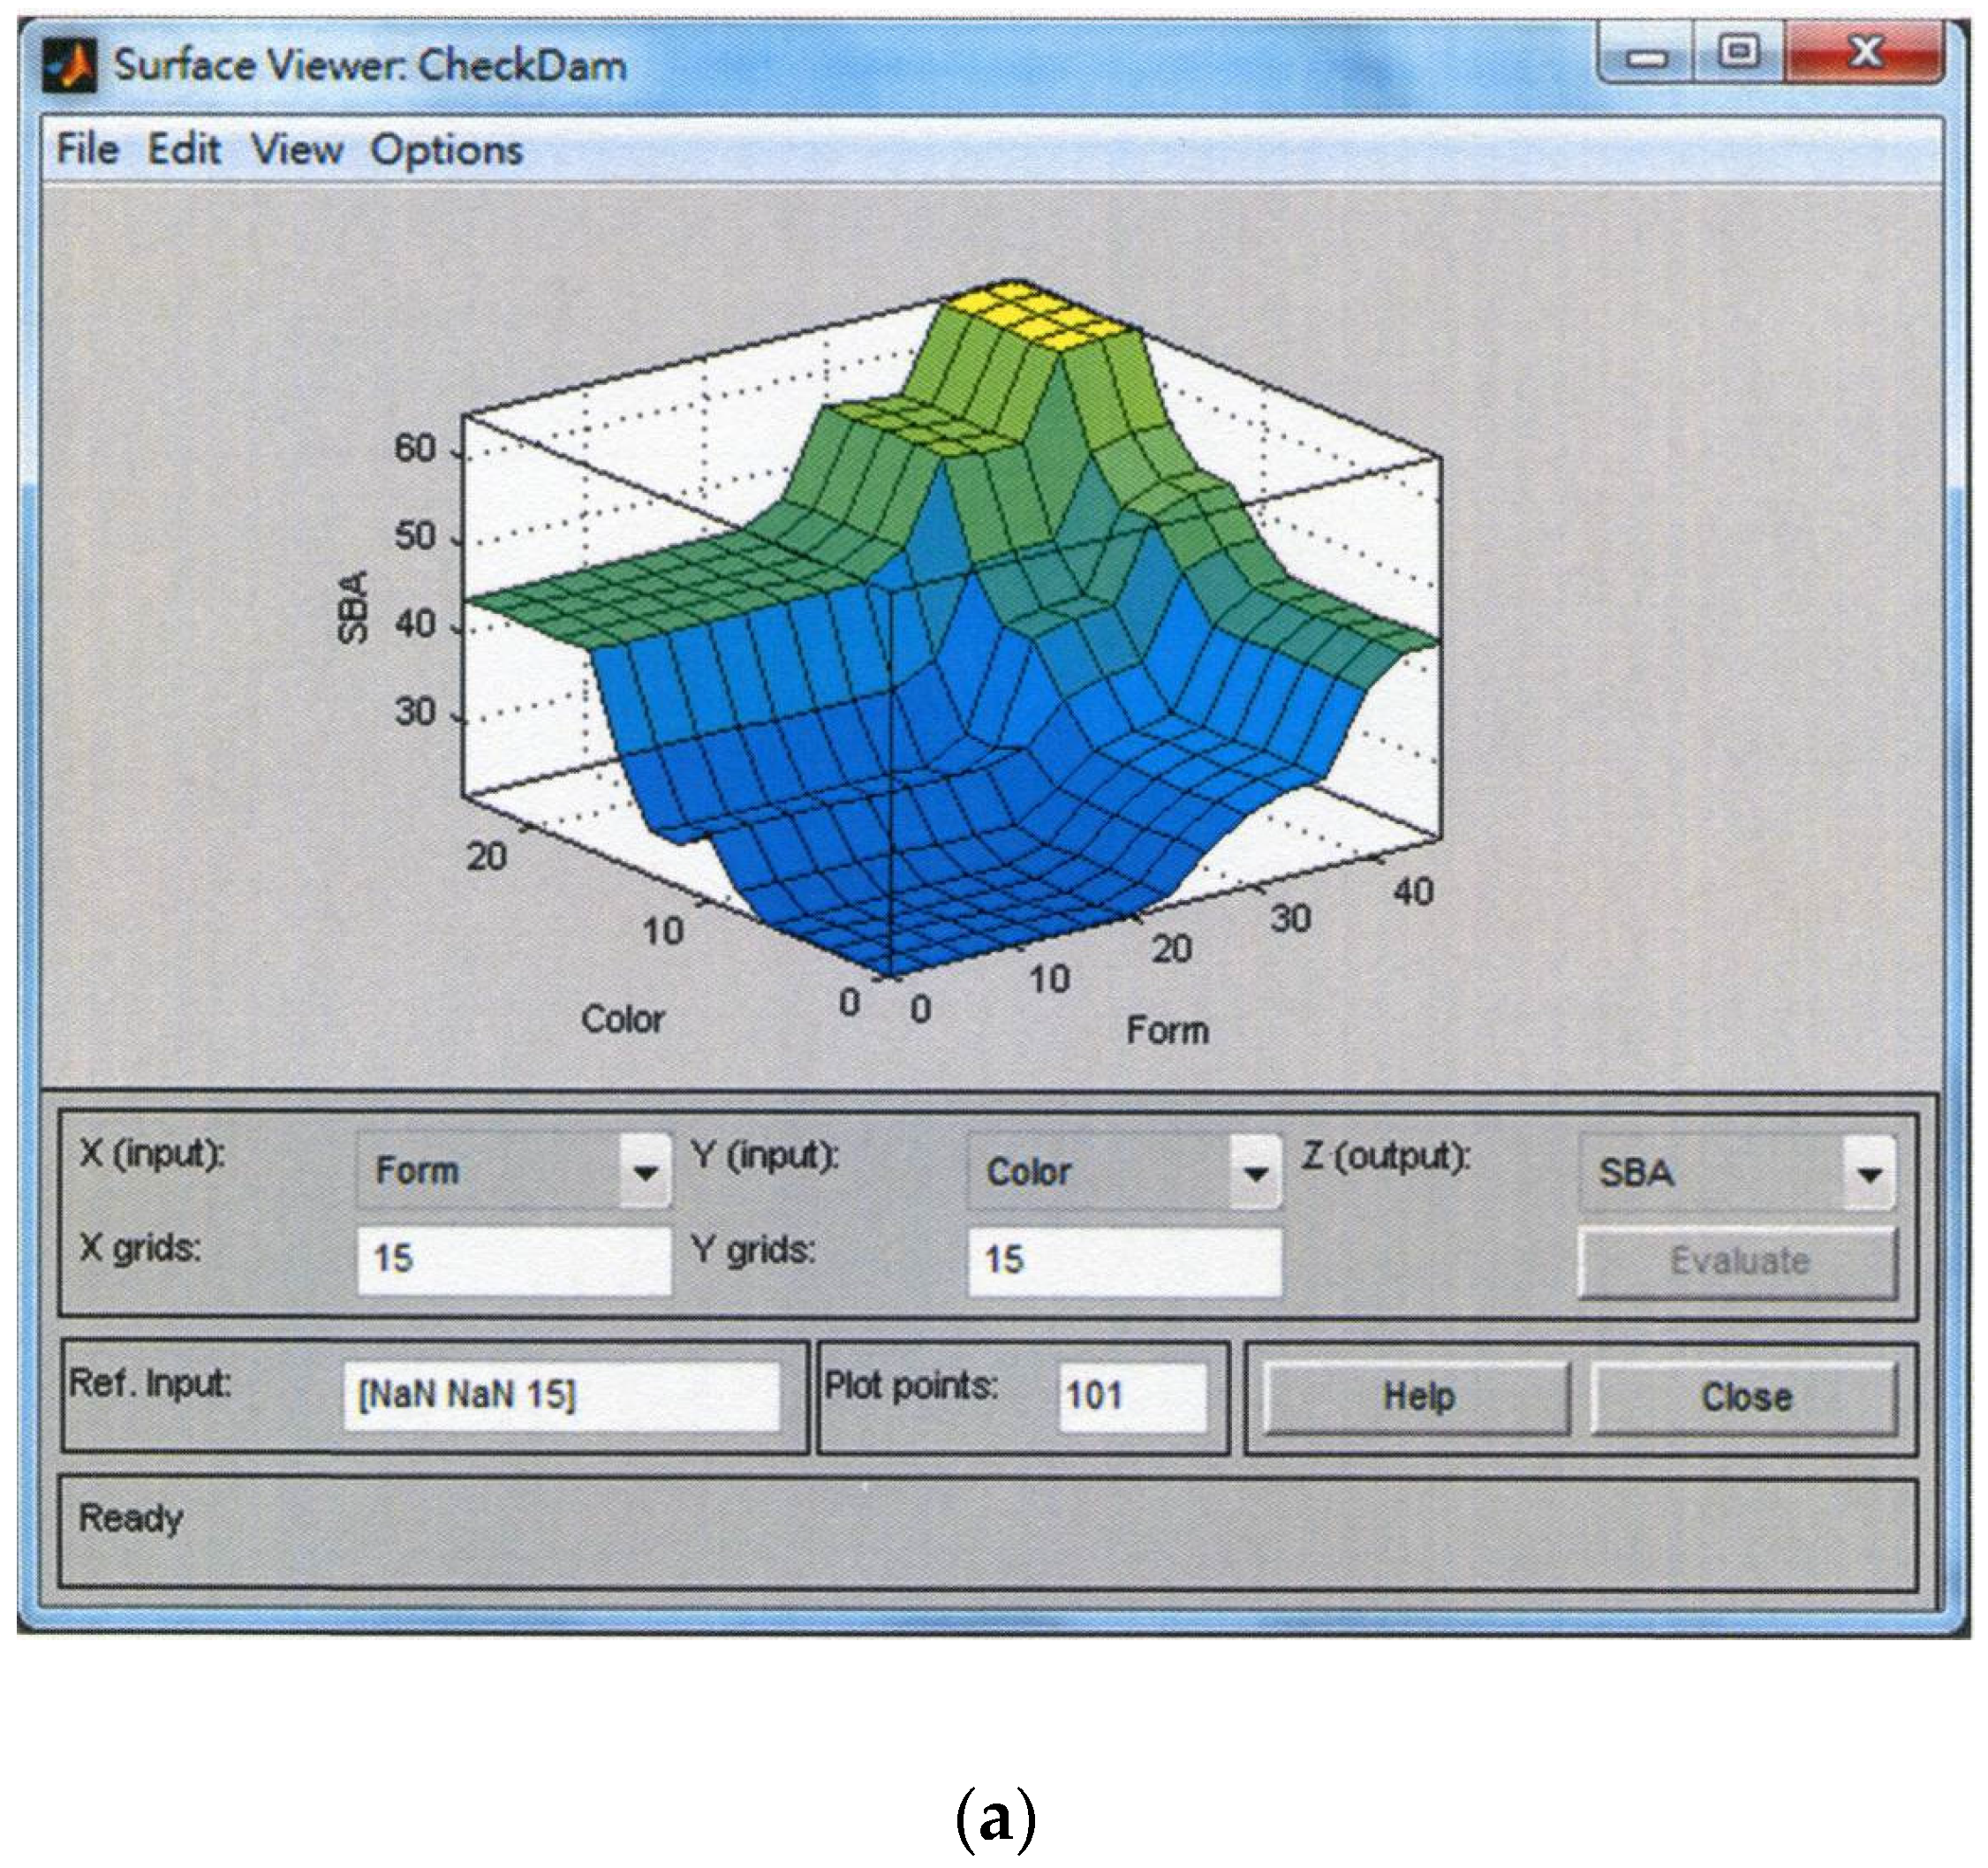
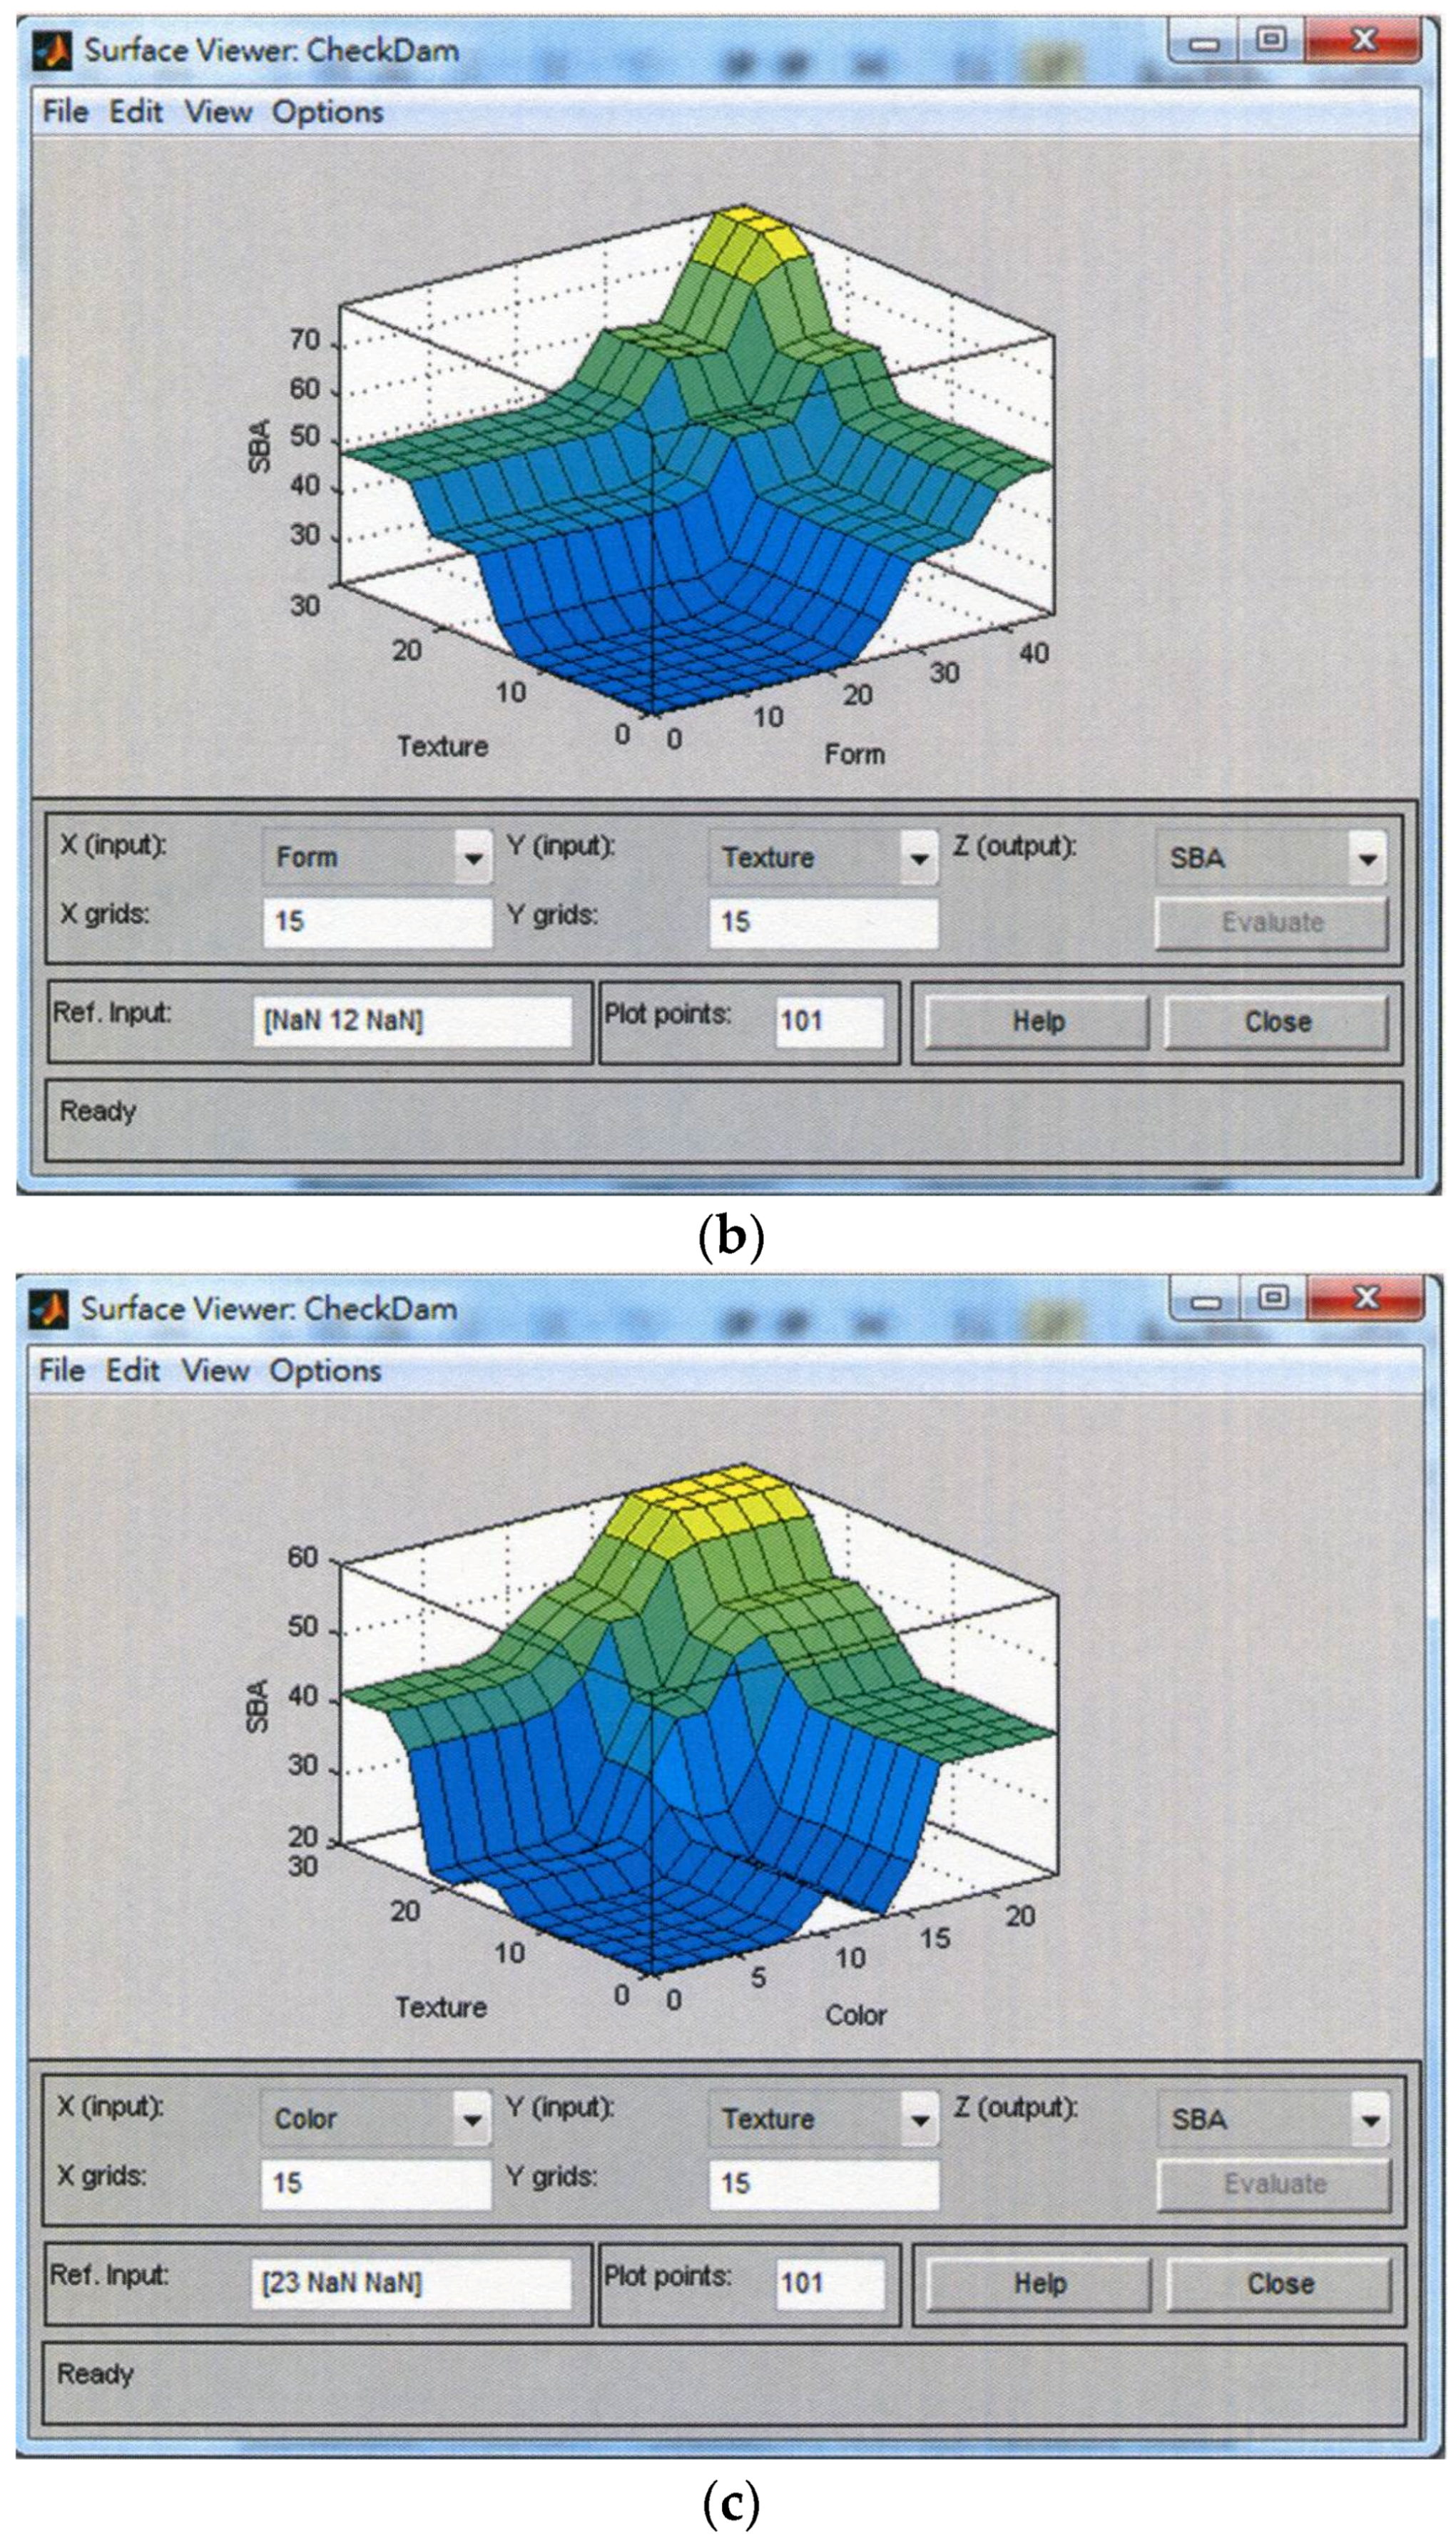
After confirming the fuzzy rules for the expert system, the Fuzzy Logical Toolbox in MatLAB can be applied to determine the relationship between texture, color, form and Scenic Beauty Assessment (Figure 5). When an assessment is required, the assessment scores for texture, color, and form can be input into the expert system to obtain the results.
Figure 4. Setup rules for a fuzzy logical system: (a) presented with square FAM; (b) presented with cubic FAM and hierarchic cubic FAM.
Water 07 06670 g004
Figure 5. Relationship between texture, color, form and Scenic Beauty Assessment: (a) form, color, and Scenic Beauty Assessment; (b) form, texture, and Scenic Beauty Assessment; (c) color, texture, and Scenic Beauty Assessment.
Water 07 06670 g005aWater 07 06670 g005b
Referring to the items in Figure 1, the assessment reference is drawn as shown in Table 2, which could be used for the assessment when applying this expert system. The Scenic Beauty Assessment is calculated with the fuzzy rules from the previous fuzzy expert theory, rather than directly adding the scores for texture, color, and form. In Fuzzy Theory, there is a fuzzy space between assessment levels, so the evaluator could provide a general score by referring to the table, which is further regulated by the expert system, without concern for errors.
Table 2. Criteria of landscape assessment for check dam.
ItemDetailEvaluation Criteria
A. TextureA1. Feature: Texture feature on damsUsing natural materials similar to local landscape for the dam body (3 points)
Using similar texture to natural materials for the dam body (2 points)
Artificial vein lines of the dam body not matching the environment (1 point)
A2. Density: Density difference between object and backgroundContinuity between object and background density (3 points)
Discontinuous diversification between object and background density (2 points)
Compatibility contrast between object and background density (1 point)
A3. Grain size: Grain size difference between object and backgroundContinuity between object and background grain size (3 points)
Discontinuous diversification between object and background grain size (2 points)
Compatibility contrast between object and background grain size (1 point)
A4. Regularity: Similarity regularity between object and backgroundVisual continuity (3 points)
Visual discontinuous diversification (2 points)
Visual compatibility contrast (1 point)
B. ColorB1. Hue: Blue, green, yellow, red, and purple as the representativeYellowish-brown color, green color (3 points)
Reddish-yellow color (2 points)
Other colors (1 point)
B2. Value: 0~10 (0 for black; 10 for white; 5 for standard gray)Similar to Forest Value 7.5~8.5 (3 points)
Similar to Grassland Value 7~8 (2 points)
Similar to Sand land Value 7.5~9 (1 point)
B3. Chroma: Levels 0~20 (the higher level shows the higher brightness)Similar to Forest Chroma 2~4 (3 points)
Similar to Grassland Chroma 1~4 (2 points)
Similar to Sand land Chroma 1~4 (1 point)
C. FormC1. Vegetation reducing visual perception: Percentage of vegetation in the evaluated imageFlourishing vegetation to cover most parts of dam body (3 points)
Vegetation to cover some parts of dam body (2 points)
Little vegetation to cover the dam body (1 point)
C2. Symmetry and balance: Symmetry refers to same visual form on both sides of the axis; balance refers to different forms on both sides of the axis.Same visual form on both sides of the axis (3 points)
Different forms on both sides of the axis, but conforming to the harmony force field of the form (2 points)
Different forms on both sides of the axis (1 point)
C3. Dam design with repetitive or unique units: When the structure is composed of repetitive units, it is relative dull.Mostly using unique units different from forms with repetitive units (3 points)
Less using unique units different from forms with repetitive units (2 points)
Merely using several repetitive units (1 point)
C4. Integration of dam and natural skyline: The vertical and horizontal outlines of dam body largely different from the background (landscape) receive lower scores, and vice versa.Similar outline of dam body to the skyline with more than four tangent lines (3 points)
Similar outline of dam body to the skyline with 1–3 tangent lines (2 points)
Low similarity between the outline of dam body and the skyline (1 point)
C5. Relationship between circulation and used space: The visual perception depends on the relationship between the circulation of people and cars and the dam site, the used space on both banks.People and car circulation allowing close view of the dam, and the used space on both banks designed water-friendly facilities or landscape (3 points)
People and car circulation not allowing close view of the dam, but the used space on both banks designed water-friendly facilities or landscape; or people and car circulation allowing close view of the dam, but the used space on both banks not being designed water-friendly facilities or landscape (2 points)
People and car circulation not allowing close view of the dam, and no design of water-friendly facilities or landscape for the used space on both banks (1 point)

3. Results and Discussion

3.1. Expert Questionnaire Survey

This questionnaire survey is divided into two phases, aiming to clarify the relationship between factors for Scenic Beauty Assessment of check dams. The expert questionnaire in the first phase is intended to ensure the priority of factors in this study for the Scenic Beauty Assessment of check dams. Ten levels are classified for the assessment, and a higher score indicates higher importance. A total of 11 expert questionnaires were retrieved and organized in this study. Each of the surveyed individuals had more than 10 years’ experience, covering the professional backgrounds of civil and hydraulic engineering, landscape architecture, architectural design, urban planning, community empowerment, soil and water conservation, and environmental management.
The first phase is intended to understand the importance and priority of all factors, which have been assessed by the experts, and the arithmetic mean is presented for reference in the second phase in order to restrain the experts’ opinions. The assessment results in the first phase can be a reference in the second phase. Having integrated the Experts Questionnaire Survey in the first phase (Table 3), this can become the criteria for the second phase, where the experts compare the importance of paired factors for the matrices in hierarchies. Meanwhile, the fuzzy sets of texture, color, and form are also determined according to these results.
These matrices are further used for calculating the relative weights, and here use the relative weights of the assessment items in Hierarchy II, Figure 1, shown in Table 4 as an example. The relative weights of the assessment items in Hierarchy II are multiplied by the relative weights of the factors in Hierarchy III for the final weights of factors, which are shown in Table 5. It is clear that the “A1. Feature” has the highest weight for texture, “B1. Hue” has the highest weight in color, and “C4. Integration of dam and natural skyline” has the highest weight in form. In this case, the major items for Scenic Beauty Assessment of check dams could be selected by the weights through the Analytic Hierarchy Process of expert questionnaires. Moreover, the upper and lower limits of the average factor importance can be the reference of rules for the Fuzzy Logical System in Figure 4.
The preceding develops the reference for establishing the fuzzy sets by Table 3, Table 4 and Table 5. For example, form has the highest weight, 46%, among the three factors. The minimum, the most probable, and the maximum acceptable values of importance for these factors are 4.8, 8, and 9, respectively. These values were rearranged from maximum value 10 to 46, and the values 4.8, 8, and 9 were changed into 22.08, 36.8, and 41.4. Then the average 29.44 of 22.08 and 36.8 is taken as the upper limit of “poor” in Figure 3c. Similarly, the lower limit of “excellent” is the average, 39.1, of 36.8 and 41.4. The other turning points are 22.08, 36.8, and 41.4, respectively. Other fuzzy sets, such as texture and color, were also developed according to this method, except for the fuzzy set of Scenic Beauty Assessment, which was divided through equalization.
Table 3. Importance of assessment factors on the landscape aesthetics consideration of a check dam.
Assessment FactorImportance: the Most Probable Value (0–10)Acceptable Range
Maximum Acceptable ValueMinimum Acceptable Value
Texture 6.88.14.5
Color6.17.13.3
Form894.8
Table 4. Relative importance of assessment factors in hierarchy 2.
Evaluation CriteriaTextureColorFormWeight
Texture 11.35130.628130.40%
Color 0.740010.546623.75%
Form 1.59221.8294145.85%
Note: λ max =3.00; C.I. = 0.0015; C.R. = 0.0025.
Table 5. Weights of assessment factors using the Analytic Hierarchy Process (AHP).
Hierarchy I: ObjectiveHierarchy II: Assessment ItemHierarchy III: FactorWeight
Assessment of aesthetics design principles for check damsA. TextureA1. Feature8.38%
A2. Density8.15%
A3. Grain size6.30%
A4. Regularity7.56%
B. ColorB1. Hue12.34%
B2. Value5.23%
B3. Chroma6.17%
C. FormC1. Vegetation reducing visual perception11.42%
C2. Symmetry and balance6.65%
C3. Dam design with repetitive and unique units5.04%
C4. Integration of dam and natural skyline12.96%
C5. Relationship between circulation and used space9.77%

3.2. Scenic Beauty Assessment for Check Dams with Expert System

Referring to the results of the Expert Questionnaire Survey, the assessment criteria are drawn according to Table 2, and five cases are tested by the Fuzzy Logical System (Figure 6 and Table 6). We here present the example of Case 1 (Huashan Village in Kukeng Township, Yunlin County, Taiwan). (1) Texture: The form of the surface materials for this dam is overly artificial in the Texture Feature; the dam body does not match the background in Density; and the composition units for the dam are too large, which disrupts continuity with the background in Regularity; (2) Color: Hue is the major consideration and the dam is gray; (3) Form: the tangent line of the dam is consistent with the tangent line of the skyline for the integration of dam and natural skyline; the dam uses little vegetation for coverage in vegetation, resulting in poorer visual perception; and the dam can be closely viewed but no water-friendly facility has been included for the relationship between circulation and used space. The assessment criteria for Cases 2–5 are similar. The assessment of this expert system presents results similar to those from SBE [16], which are shown in the last row of Table 6. The results of subjects’ ratings in SBE were transferred through the RMRATE computer program [18,19]. The rating score of SBE was the result of normalization, so preferred assessment is indicated by positive values and poor assessment is indicated by negative values.
Figure 6. Photos of check dams: (a) case 1; (b) case 2; (c) case 3; (d) case 4; (e) case 5.
Water 07 06670 g006
Table 6. Results of Scenic Beauty Assessment on a check dam.
Assessment ItemResults
Case 1Case 2Case 3Case 4Case 5
  • Texture
A1. Feature23122
A2. Density23122
A3. Grain size22111
A4. Regularity23122
Sum811477
Adjusted sum20.0027.5010.0017.5017.50
B.
Color
B1. Hue33131
B2. Value12111
B3. Chroma12111
Sum57353
Adjusted sum13.3318.678.0013.338.00
C.
Form
C1. Vegetation reducing visual perception13221
C2. Symmetry and balance32332
C3. Dam design with repetitive or unique units32122
C4. Integration of dam and natural skyline33121
C5. Relationship between circulation and used space12121
Sum11128117
Adjusted sum33.7336.8024.5333.7321.47
Scenic Beauty Assessment50.071.721.650.021.5
Scenic Beauty Estimation [16]84.20129.3−46.7397.42−75.56
Scenic Beauty Assessment in this study is calculated by the previous fuzzy rules based on Fuzzy Logical theories, rather than directly adding the scores for texture, color, and form. In Fuzzy Theory, a fuzzy space is left between levels so that the evaluator could give a general evaluation by referring to the table, which is further regulated by the expert system, without concern for errors. For instance, 27.5 points for texture, 18.67 points for color, and 36.8 points for form for Case 2 are input into the expert system (Figure 7) so that the system can calculate the Scenic Beauty Assessment value (71.7) with the fuzzy algorithm, and the calculated result of each rule is shown. Finally, the results of all rules are organized into a chart (the chart in the last row of column 4 in Figure 7), where the mean (rough line) shows the corresponding assessment as “good”.
Figure 7. Result of fuzzy logical system.
Water 07 06670 g007
The assessments of SBE and Scenic Beauty Assessment (SBA) presented in this study show a similar trend. The results indicate that higher scores for landscape evaluation generally include less structure and more harmony with the environment. This is also in line with the general aesthetic principle that the structure should be integrated with the environment [13]. Furthermore, water features can also enhance the overall landscape beauty [36,37]. Although there is no special description for water features in Table 2, the characteristics can be included within the item of “color.” At present, the method proposed in this study should be suitable for landscape assessment.
For future applications, this model can be easily operated if the evaluation is preceded by pictures and questionnaires. This saves time for field investigation since it is convenient and fast. It is also reliable and valid, and few experts are required, so it is more suitable for planning and design than the present landscape aesthetic models. In addition, 3D simulation or visual reality could be applied with questionnaires during the planning and design stages to evaluate the impact of check dams on the environmental landscape. The drawbacks reveal that the picture-based aesthetic assessment was not able to completely represent the landscape aesthetic perception that was actually experienced, and the weights set by the experts are questioned. It is suggested that experts from different fields could be invited to modify the weights in order to reduce subjective judgments.

4. Conclusions

This study mainly refers to previously established aesthetic principles for check dam design and acquires the weights of evaluation factors by analyzing expert questionnaires from various fields. The representative assessment items are selected in order to establish a scientific and objective model for the Scenic Beauty Assessment of check dams. Of the three major factors, texture, color, and form, form is the most important in the AHP analysis. Although “integration of dam and natural skyline” in form has the highest weight (12.96%), the weight (11.42%) of the factor “vegetation reducing visual perception” is very close. These two factors become the main components of form. The fuzzy logical rules and sets can be established based on these results. In this study, five cases are applied using a Fuzzy Logical System for Scenic Beauty Assessment of check dams. The test results indicate that the approach is feasible and the expert system could be implemented. The evaluation results show a trend similar to the results of 224 public samples with SBE. This indicated that the assessment results of experts from more fields might be closer to the public preference. This result can provide an additional consideration to assist designers in integrating check dams with their surroundings.

Acknowledgments

The paper was supported in part by the Ministry of Science and Technology in Taiwan (NSC 102-2313-B-270-001) and the opening fund of the State Key Laboratory of Geohazard Prevention and Geoenvironment Protection at Chengdu University of Technology (SKLGP2013K008).

Author Contributions

The text of this article was mainly written by Szu-Hsien Peng. Chuan Tang participated the discussion and provided many valuable comments.

Conflicts of Interest

The authors declare no conflict of interest.

References

  1. SWCB. Technical Manual for Soil and Water Conservation; Soil and Water Conservation Bureau, Council of Agriculture: Taiwan, 2005. [Google Scholar]
  2. FISRWG. Stream Corridor Restoration: Principles, and Practices; Federal Interagency Stream Restoration Working Group: Washington, DC, USA, 2001. [Google Scholar]
  3. Newton, B.; Pringle, C.; Bjorkland, R. National Water Climate Center Technology Note 99-1: Stream Visual Assessment Protocol; United States Department of Agriculture: Washington, DC, USA, 1998. [Google Scholar]
  4. Wu, H.L.; Feng, Z.Y. Ecological engineering methods for soil and water conservation in Taiwan. Ecol. Eng. 2006, 28, 333–344. [Google Scholar] [CrossRef]
  5. Chen, S.Y.; Lin, J.Y. Developing a simplified river landscape assessment model: Examples from the Chungkang and Touchien Rivers, Taiwan. Environ. Monit. Assess. 2007, 127, 489–502. [Google Scholar] [CrossRef] [PubMed]
  6. Han, K.T. A proposed landscape assessment framework: A connection of theories and practical techniques. J. Archit. Plan. Res. 1999, 16, 313–327. [Google Scholar]
  7. Pfluger, Y.; Rackham, A.; Larned, S. The aesthetic value of river flows: An assessment of flow preferences for large and small rivers. Landsc. Urban Plan. 2010, 95, 68–78. [Google Scholar] [CrossRef]
  8. Jaal, Z.; Abdullah, J. User's preferences of highway landscapes in Malaysia: A review and analysis of the literature. Proced. Soc. Behav. Sci. 2012, 36, 265–272. [Google Scholar] [CrossRef]
  9. Regan, H.; Davis, F.; Andelman, S.; Widyanata, A.; Freese, M. Comprehensive criteria for biodiversity evaluation in conservation planning. Biodivers. Conserv. 2007, 16, 2715–2728. [Google Scholar] [CrossRef]
  10. Silvennoinen, H.; Alho, J.; Kolehmainen, O.; Pukkala, T. Prediction models of landscape preferences at the forest stand level. Landsc. Urban Plan. 2001, 56, 11–20. [Google Scholar] [CrossRef]
  11. Zube, E.H.; Sell, J.L.; Taylor, J.G. Landscape perception: Research, application and theory. Landsc. Plan. 1982, 9, 1–33. [Google Scholar] [CrossRef]
  12. Garcia, L.; Hernandez, J.; Ayuga, F. Analysis of the materials and exterior texture of agro-industrial buildings: A photo-analytical approach to landscape integration. Landsc. Urban Plan. 2006, 74, 110–124. [Google Scholar] [CrossRef]
  13. Chen, S.C.; Lin, H.C. Visual aesthetic design principles of check dams. J. Chin. Soil Water Conserv. 2010, 41, 34–49. [Google Scholar]
  14. Clark, R.H.; Pause, M. Precedents in Architecture; John Wiley & Sons: Hoboken, New Jersey, USA, 1985. [Google Scholar]
  15. Shi, S.W. Color Design of the Built Environment; Shuxin Press: Taipei, Taiwan, 1994. [Google Scholar]
  16. Lin, H.C.; Peng, S.H.; Chen, S.C. Scenic beauty estimation of soil and water conservation engineering constructions on the slopeland. J. Soil Water Conserv. 2013, 45, 831–846. [Google Scholar]
  17. Daniel, T.C.; Boster, R.S. Measuring Landscape Esthetics: The Scenic Beauty Estimation Method; Rocky Mountain Forest and Range Experiment Station Fort Collins, CO: Washington, DC, USA, 1976. [Google Scholar]
  18. Brown, T.C.; Daniel, T.C. Scaling of Ratings: Concepts and Methods; USDA Forest Service, Rocky Mountain Forest and Range Experiment Station: Washington, DC, USA, 1990. [Google Scholar]
  19. Brown, T.C.; Daniel, T.C.; Schroeder, H.W.; Brink, G.E. Analysis of Ratings: A Guide to RMRATE; US Department of Agriculture, Forest Service, Rocky Mountain Forest and Range Experiment Station: Washington, DC, USA, 1990. [Google Scholar]
  20. Ananda, J.; Herath, G. The use of analytic hierarchy process to incorporate stakeholder preferences into regional forest planning. For. Policy Econ. 2003, 5, 13–26. [Google Scholar] [CrossRef]
  21. Mardle, S.; Pascoe, S.; Herrero, I. Management objective importance in fisheries: An evaluation using the analytic hierarchy process (ahp). Environ. Manag. 2004, 33, 1–11. [Google Scholar] [CrossRef] [PubMed]
  22. Saaty, T.L. How to make a decision: The analytic hierarchy process. Eur. J. Oper. Res. 1990, 48, 9–26. [Google Scholar] [CrossRef]
  23. Saaty, T.L. Decision making with the analytic hierarchy process. Int. J. Serv. Sci. 2008, 1, 83–98. [Google Scholar] [CrossRef]
  24. Shapira, A.; Shoshany, M.; Nir-Goldenberg, S. Combining analytical hierarchy process and agglomerative hierarchical clustering in search of expert consensus in green corridors development management. Environ. Manag. 2013, 52, 123–135. [Google Scholar] [CrossRef] [PubMed]
  25. Shapira, A.; Simcha, M. Ahp-based weighting of factors affecting safety on construction sites with tower cranes. J. Constr. Eng. Manag. 2009, 135, 307–318. [Google Scholar] [CrossRef]
  26. Bottero, M.; Comino, E.; Riggio, V. Application of the analytic hierarchy process and the analytic network process for the assessment of different wastewater treatment systems. Environ. Model. Softw. 2011, 26, 1211–1224. [Google Scholar] [CrossRef]
  27. Juan, Y.K.; Castro, D.; Roper, K. Decision support approach based on multiple objectives and resources for assessing the relocation plan of dangerous hillside aggregations. Eur. J. Oper. Res. 2010, 202, 265–272. [Google Scholar] [CrossRef]
  28. Peng, S.H.; Lin, H.C.; Chen, S.C. Landscape aesthetics quality estimation method for check dams—Application of the fuzzy logic system. J. Chin. Soil Water Conser. 2012, 43, 312–322. [Google Scholar]
  29. Li, T.; Jin, J.; Li, C. Refractured well selection for multicriteria group decision making by integrating fuzzy ahp with fuzzy topsis based on interval-typed fuzzy numbers. J. Appl. Math. 2012, 2012, 21. [Google Scholar] [CrossRef]
  30. Negnevitsky, M. Artificial Intelligence: A Guide to Intelligent Systems, 3rd ed.; Pearson Education Limited: Essex, England, UK, 2011. [Google Scholar]
  31. Shaverdi, M.; Akbari, M.; Fallah Tafti, S. Combining fuzzy MCDM with bsc approach in performance evaluation of iranian private banking sector. Adv. Fuzzy Syst. 2011, 2011, 12. [Google Scholar] [CrossRef]
  32. Tsiko, R.G.; Haile, T.S. Integrating geographical information systems, fuzzy logic and analytical hierarchy process in modelling optimum sites for locating water reservoirs. A case study of the debub district in eritrea. Water 2011, 3, 254–290. [Google Scholar] [CrossRef]
  33. Wang, H.; Ho, Y.; Chen, K. Fuzzy evaluation method of virtual reality for urban landscape design. In Proceedings of the International Association of Socienties of Design Research, Hongkong, China, 12–15 November 2007; pp. 1–15.
  34. Lami, I.M.; Abastante, F.; Bottero, M.C.; Masala, E.; Pensa, S. A MCDA and data visualization framework as a problem structuring method (PSM) to address transport projects. Eur. J. Decis. Processes 2014, 2, 281–312. [Google Scholar] [CrossRef]
  35. MathWorks. Fuzzy Logic Toolbox™ User's Guide; MathWorks, Incorporated: Natick, MA, USA, 2010. [Google Scholar]
  36. Aizawa, M. The texture of falling water, landscape, and culture of Japan. NAGARE Jpn. Soc. Fluid Mech. 2004, 23, 69–78. [Google Scholar]
  37. Brown, T.C.; Daniel, T.C. Landscape aesthetics of riparian environments: Relationship of flow quantity to scenic quality along a wild and scenic river. Water Resour. Res. 1991, 27, 1787–1795. [Google Scholar] [CrossRef]

