
Effect of Nitrogen and Irrigation Application on Water Movement and Nitrogen Transport for a Wheat Crop under Drip Irrigation in the North China Plain


Abstract
:1. Introduction
2. Materials and Methods
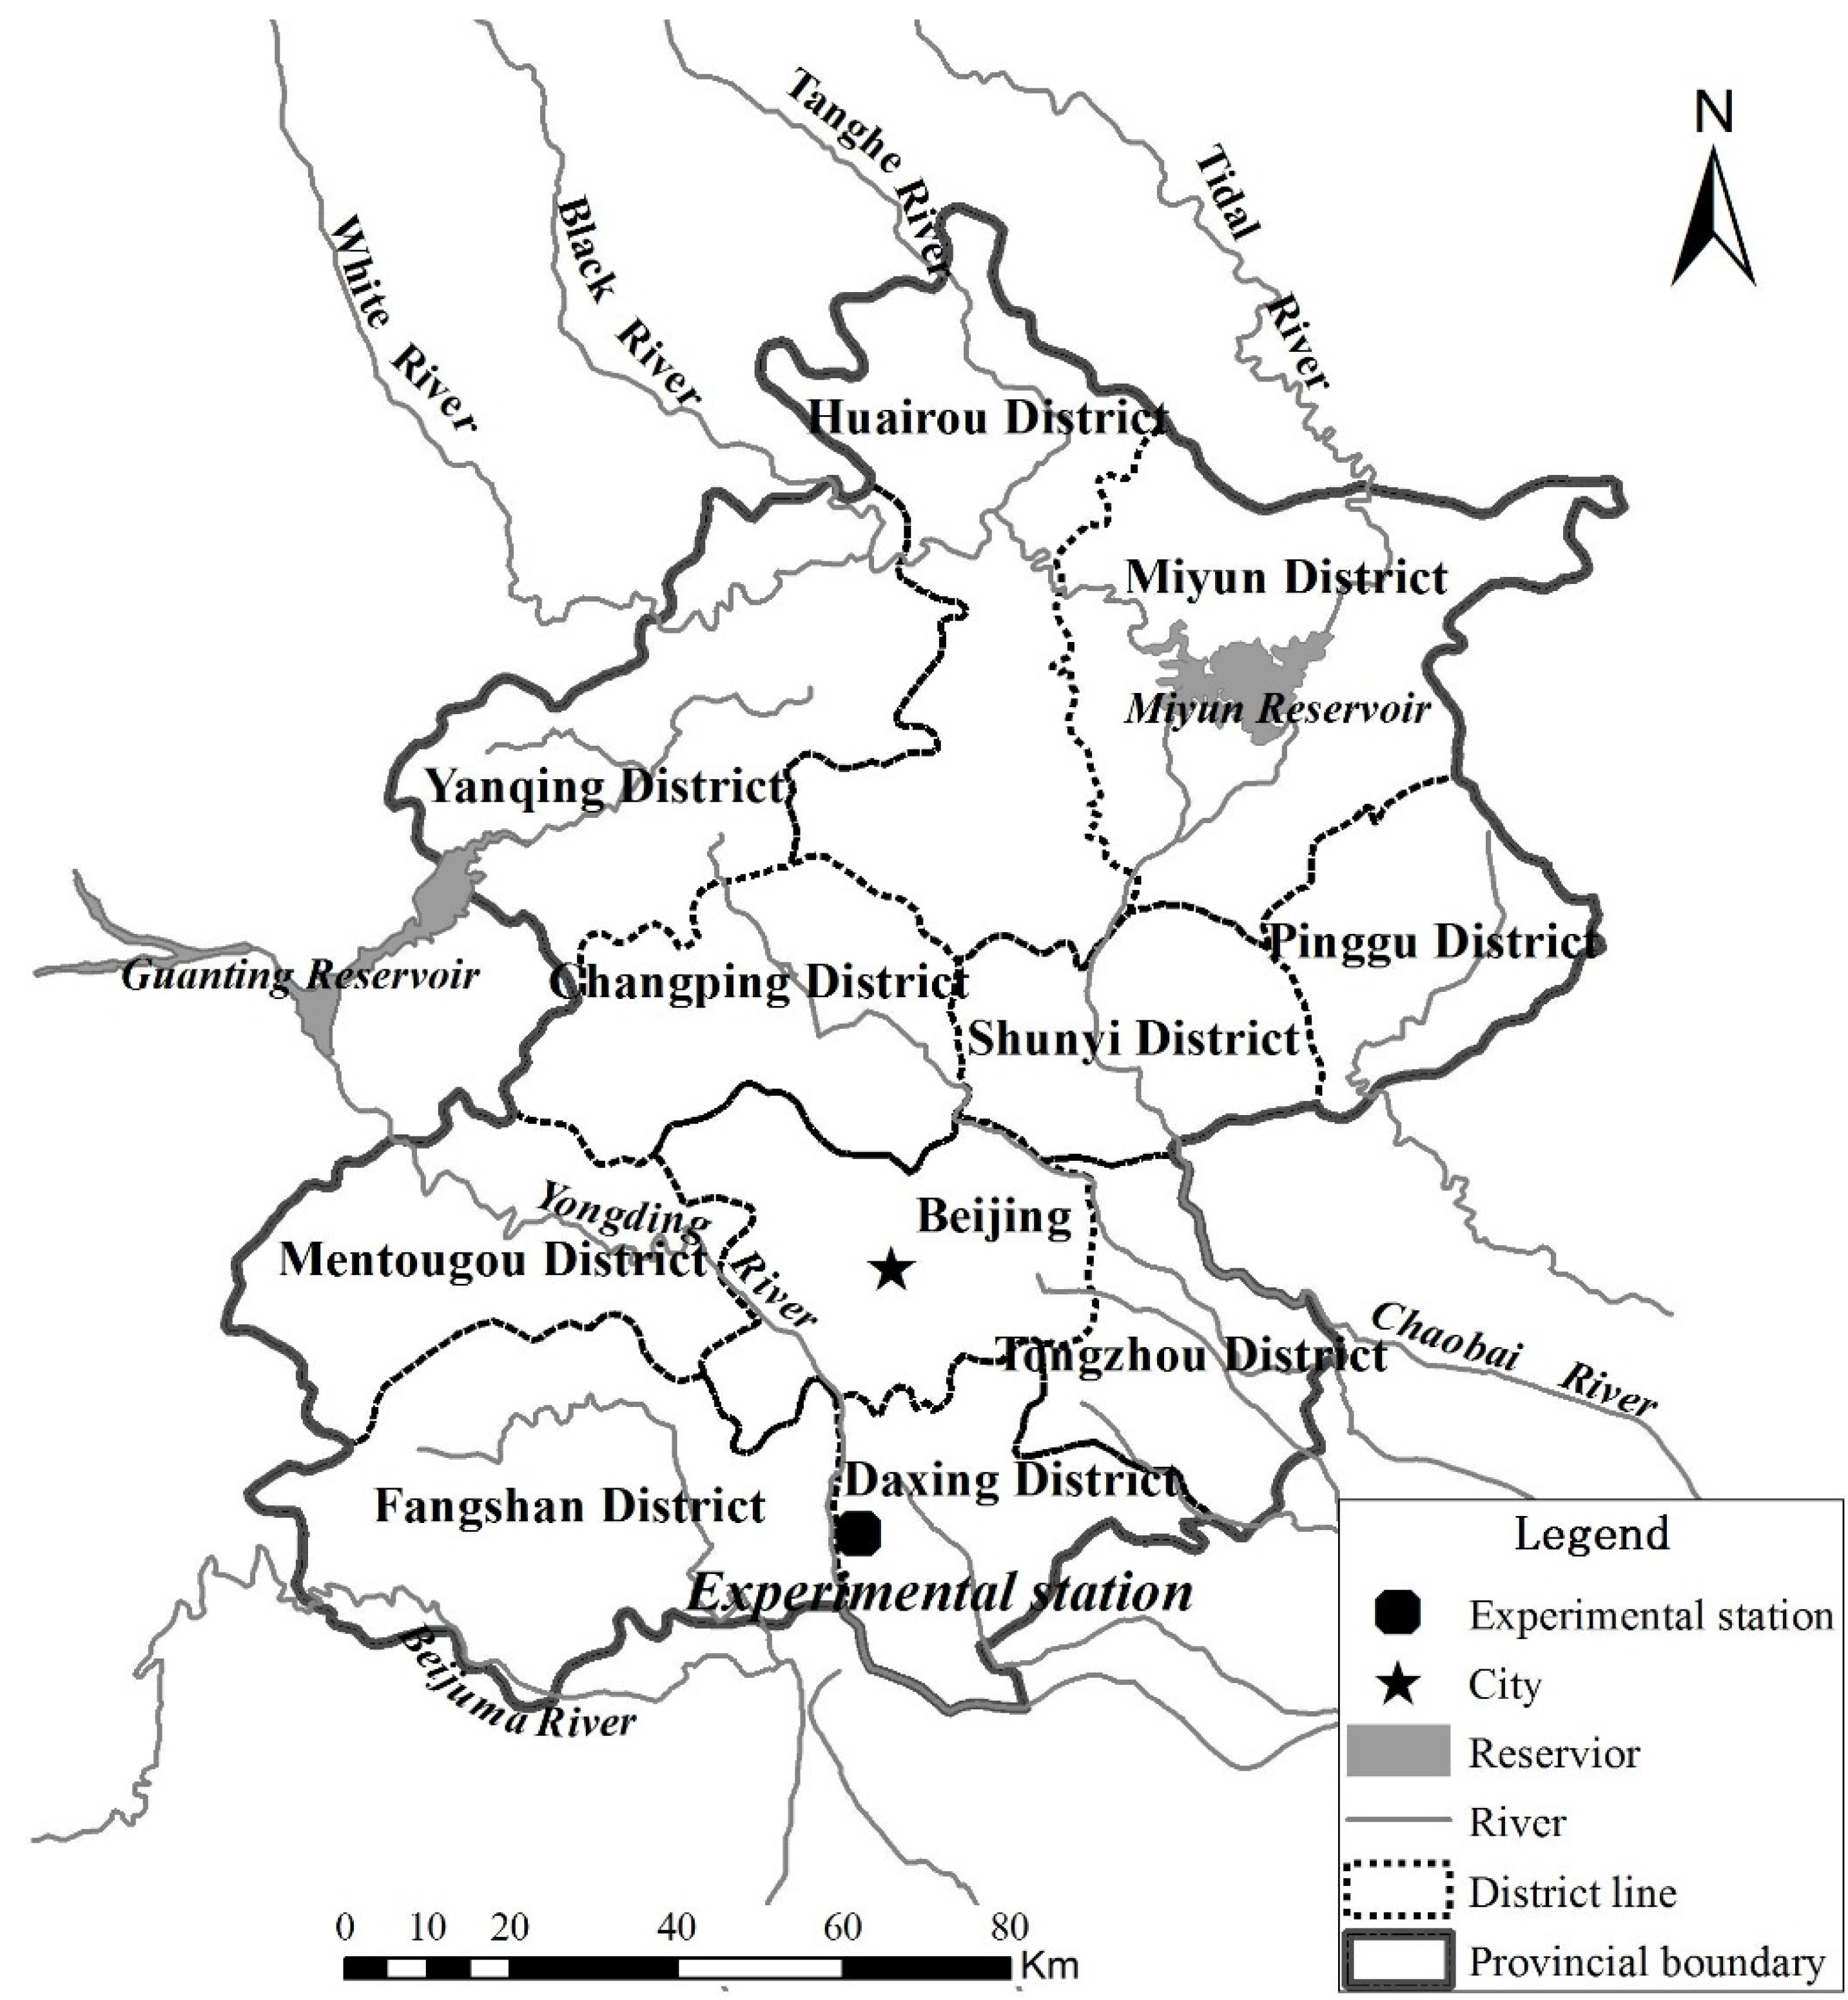
2.1. Experimental Site and Field Management


| Month | 2012 | 2013 | Average (1951–2013) | |||||||||
|---|---|---|---|---|---|---|---|---|---|---|---|---|
| P (mm) | T (°C) | Tmin (°C) | Tmax (°C) | P (mm) | T (°C) | Tmin (°C) | Tmax (°C) | P (mm) | T (°C) | Tmin (°C) | Tmax (°C) | |
| April | 58 | 15.0 | 8.2 | 21.1 | 3 | 11.6 | 4.6 | 18.1 | 22 | 13.9 | 7.8 | 20.2 |
| May | 7 | 21.5 | 14.0 | 28.2 | 3 | 20.6 | 13.8 | 26.7 | 35 | 20.3 | 13.9 | 26.6 |
| June | 72 | 24.0 | 18.3 | 30.2 | 92 | 22.5 | 18.1 | 27.4 | 76 | 24.4 | 18.8 | 30.4 |
| Year | Growth Stage | |||||||||||
|---|---|---|---|---|---|---|---|---|---|---|---|---|
| Sowing | Tillering | Stem-Elongation | Inflorescence Emergence, Heading | Development of Fruit | Harvesting | |||||||
| date | days | date | days | date | days | date | days | date | days | date | days | |
| 2011–2012 | 3/10 | 1 | 31/3 | 181 | 24/4 | 205 | 11/5 | 222 | 17/5 | 228 | 13/6 | 255 |
| 2012–2013 | 9/10 | 1 | 5/4 | 179 | 27/4 | 201 | 11/5 | 215 | 18/5 | 222 | 19/6 | 254 |
2.2. Experimental Design
| Treatments | Application of N (kg·ha−1) | Irrigation Amounts (mm) | Evaporative Demands (mm) | |||
|---|---|---|---|---|---|---|
| 2012 | 2013 | 2012 | 2013 | 2012 | 2013 | |
| W1F1 | 120 | 120 | 112 | 144 | 253 | 221 |
| W1F2 | 140 | 112 | 248 | |||
| W1F3 | 190 | 190 | 112 | 144 | 252 | 216 |
| W1F4 | 290 | 144 | 222 | |||
| W2F1 | 120 | 120 | 70 | 90 | 239 | 206 |
| W2F2 | 140 | 70 | 233 | |||
| W2F3 | 190 | 190 | 70 | 90 | 235 | 189 |
| W2F4 | 290 | 90 | 207 | |||
| W3F1 | 120 | 120 | 42 | 54 | 244 | 187 |
| W3F2 | 140 | 42 | 213 | |||
| W3F3 | 190 | 190 | 42 | 54 | 206 | 180 |
| W3F4 | 290 | 54 | 175 | |||
2.3. Soil Sampling
2.4. Deep Percolation
2.5. Nitrate N Loss Assessment
2.6. Statistical Analyses
3. Results
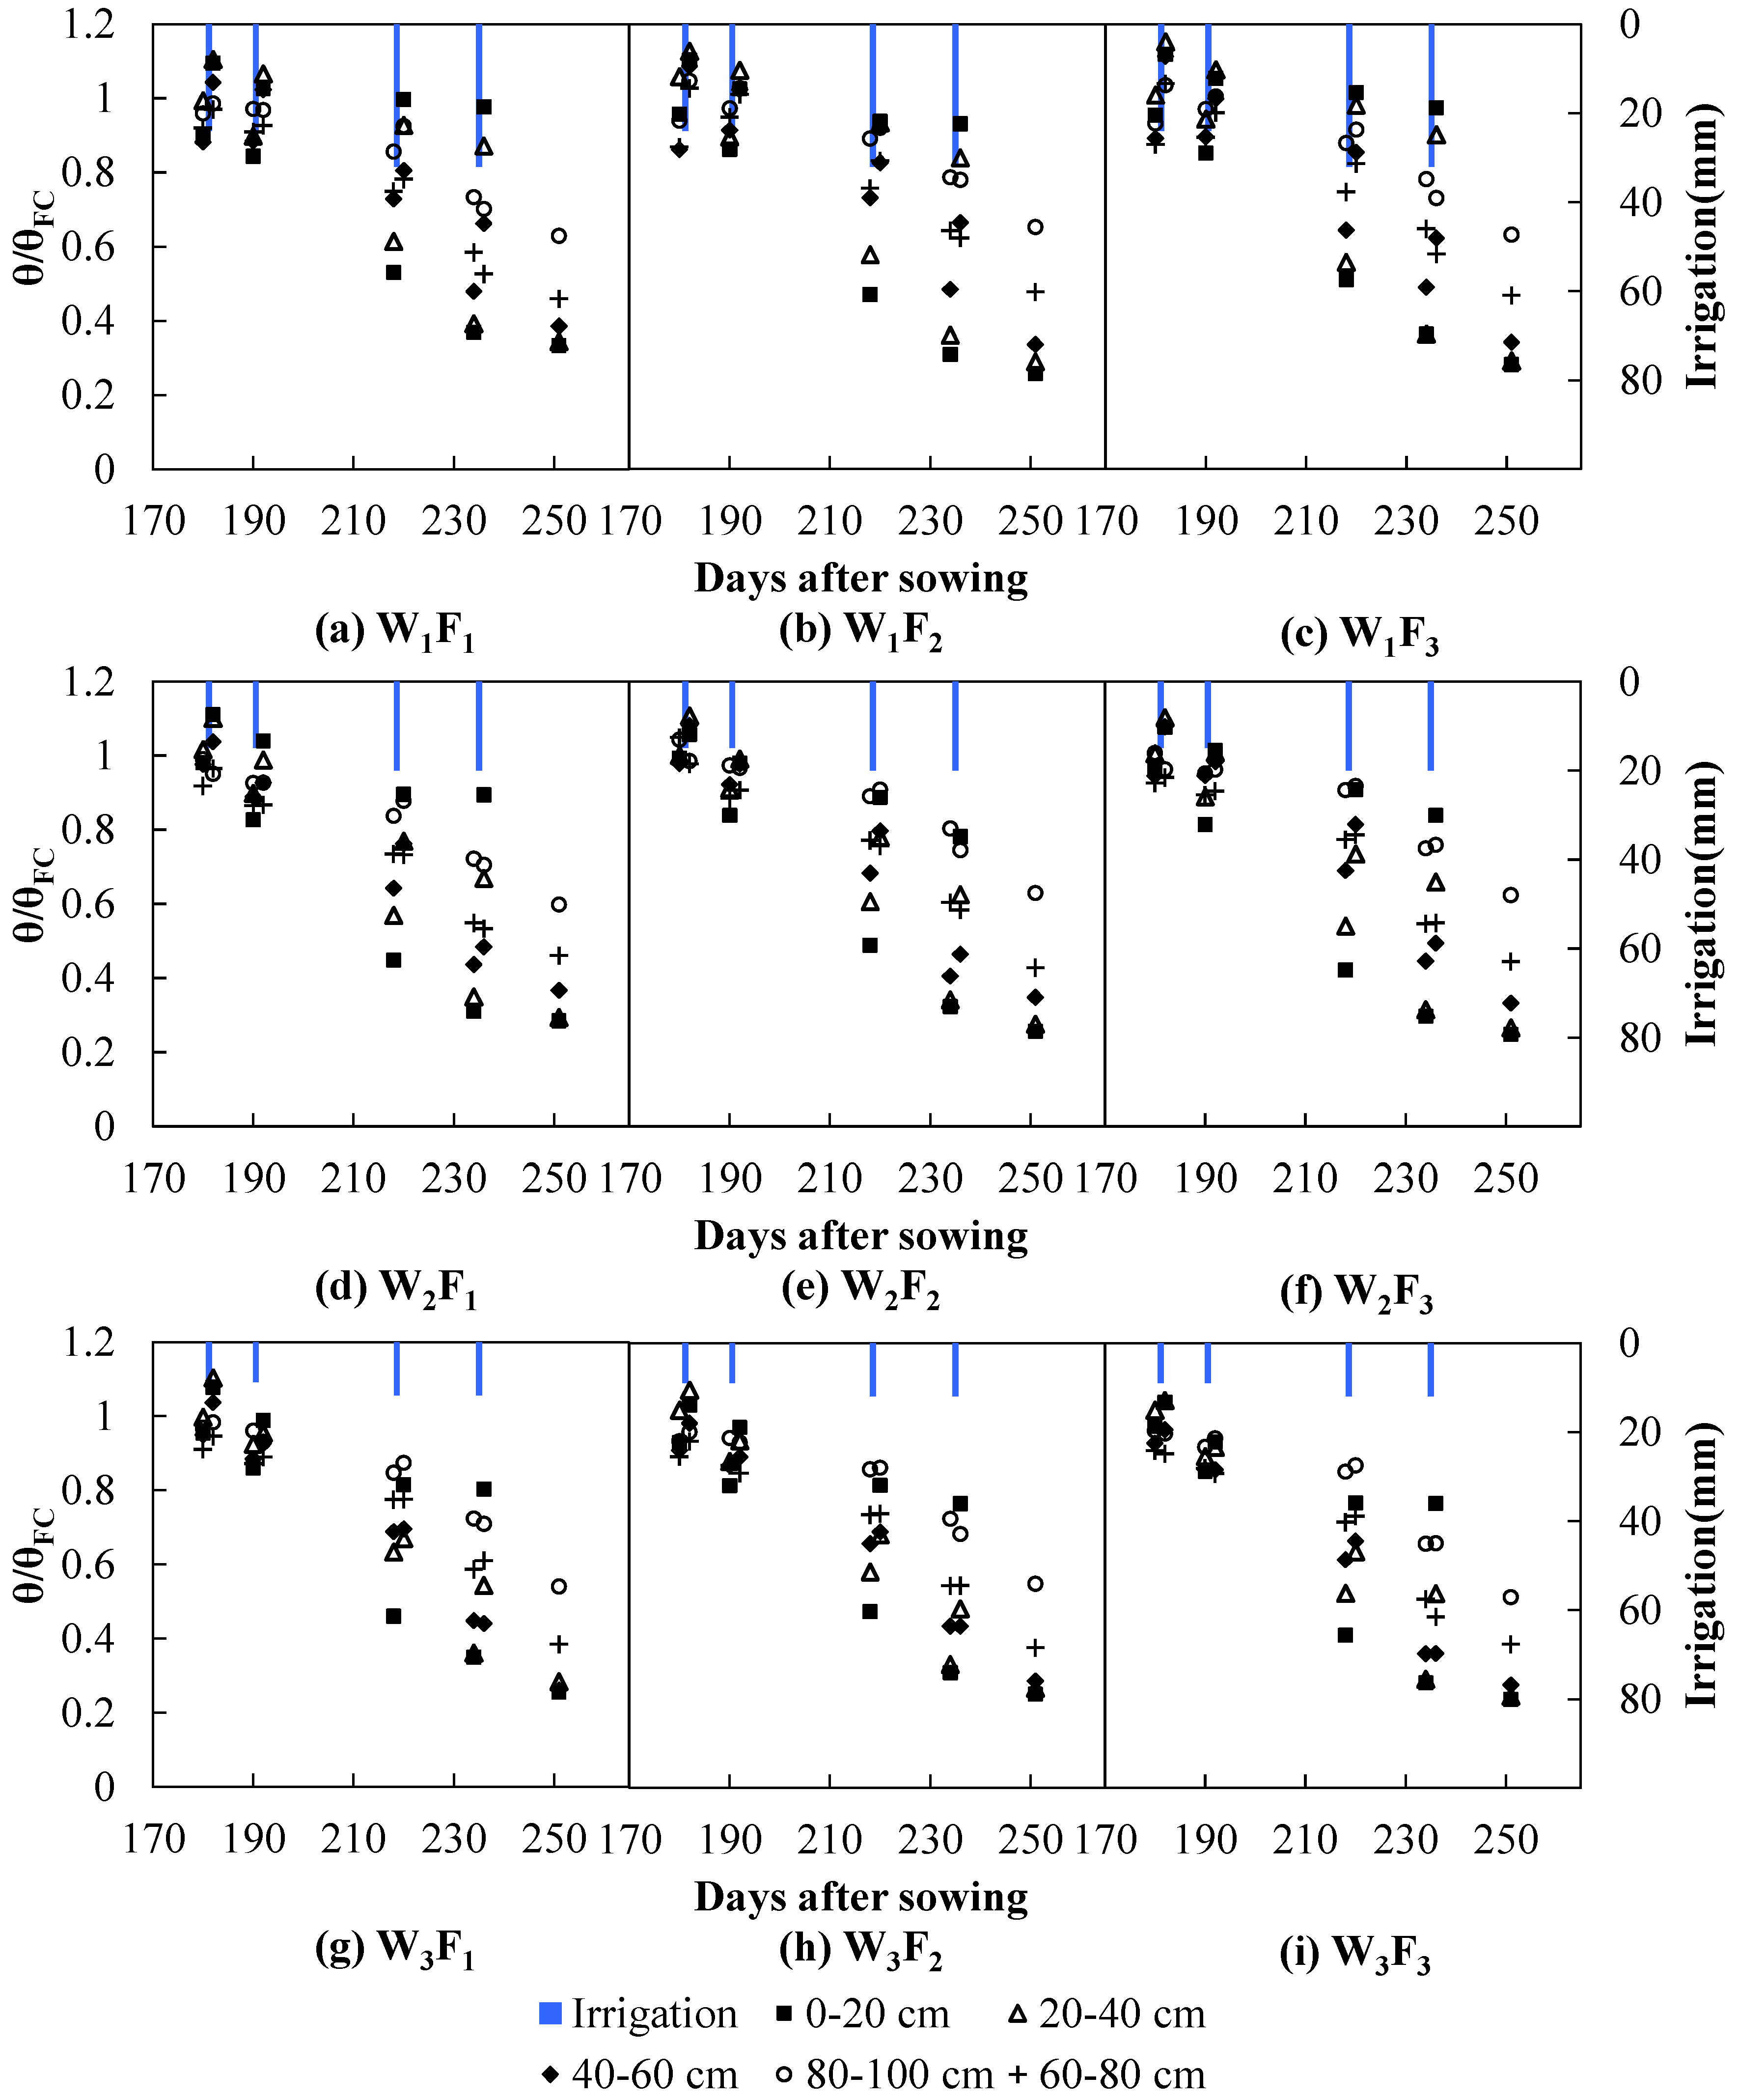
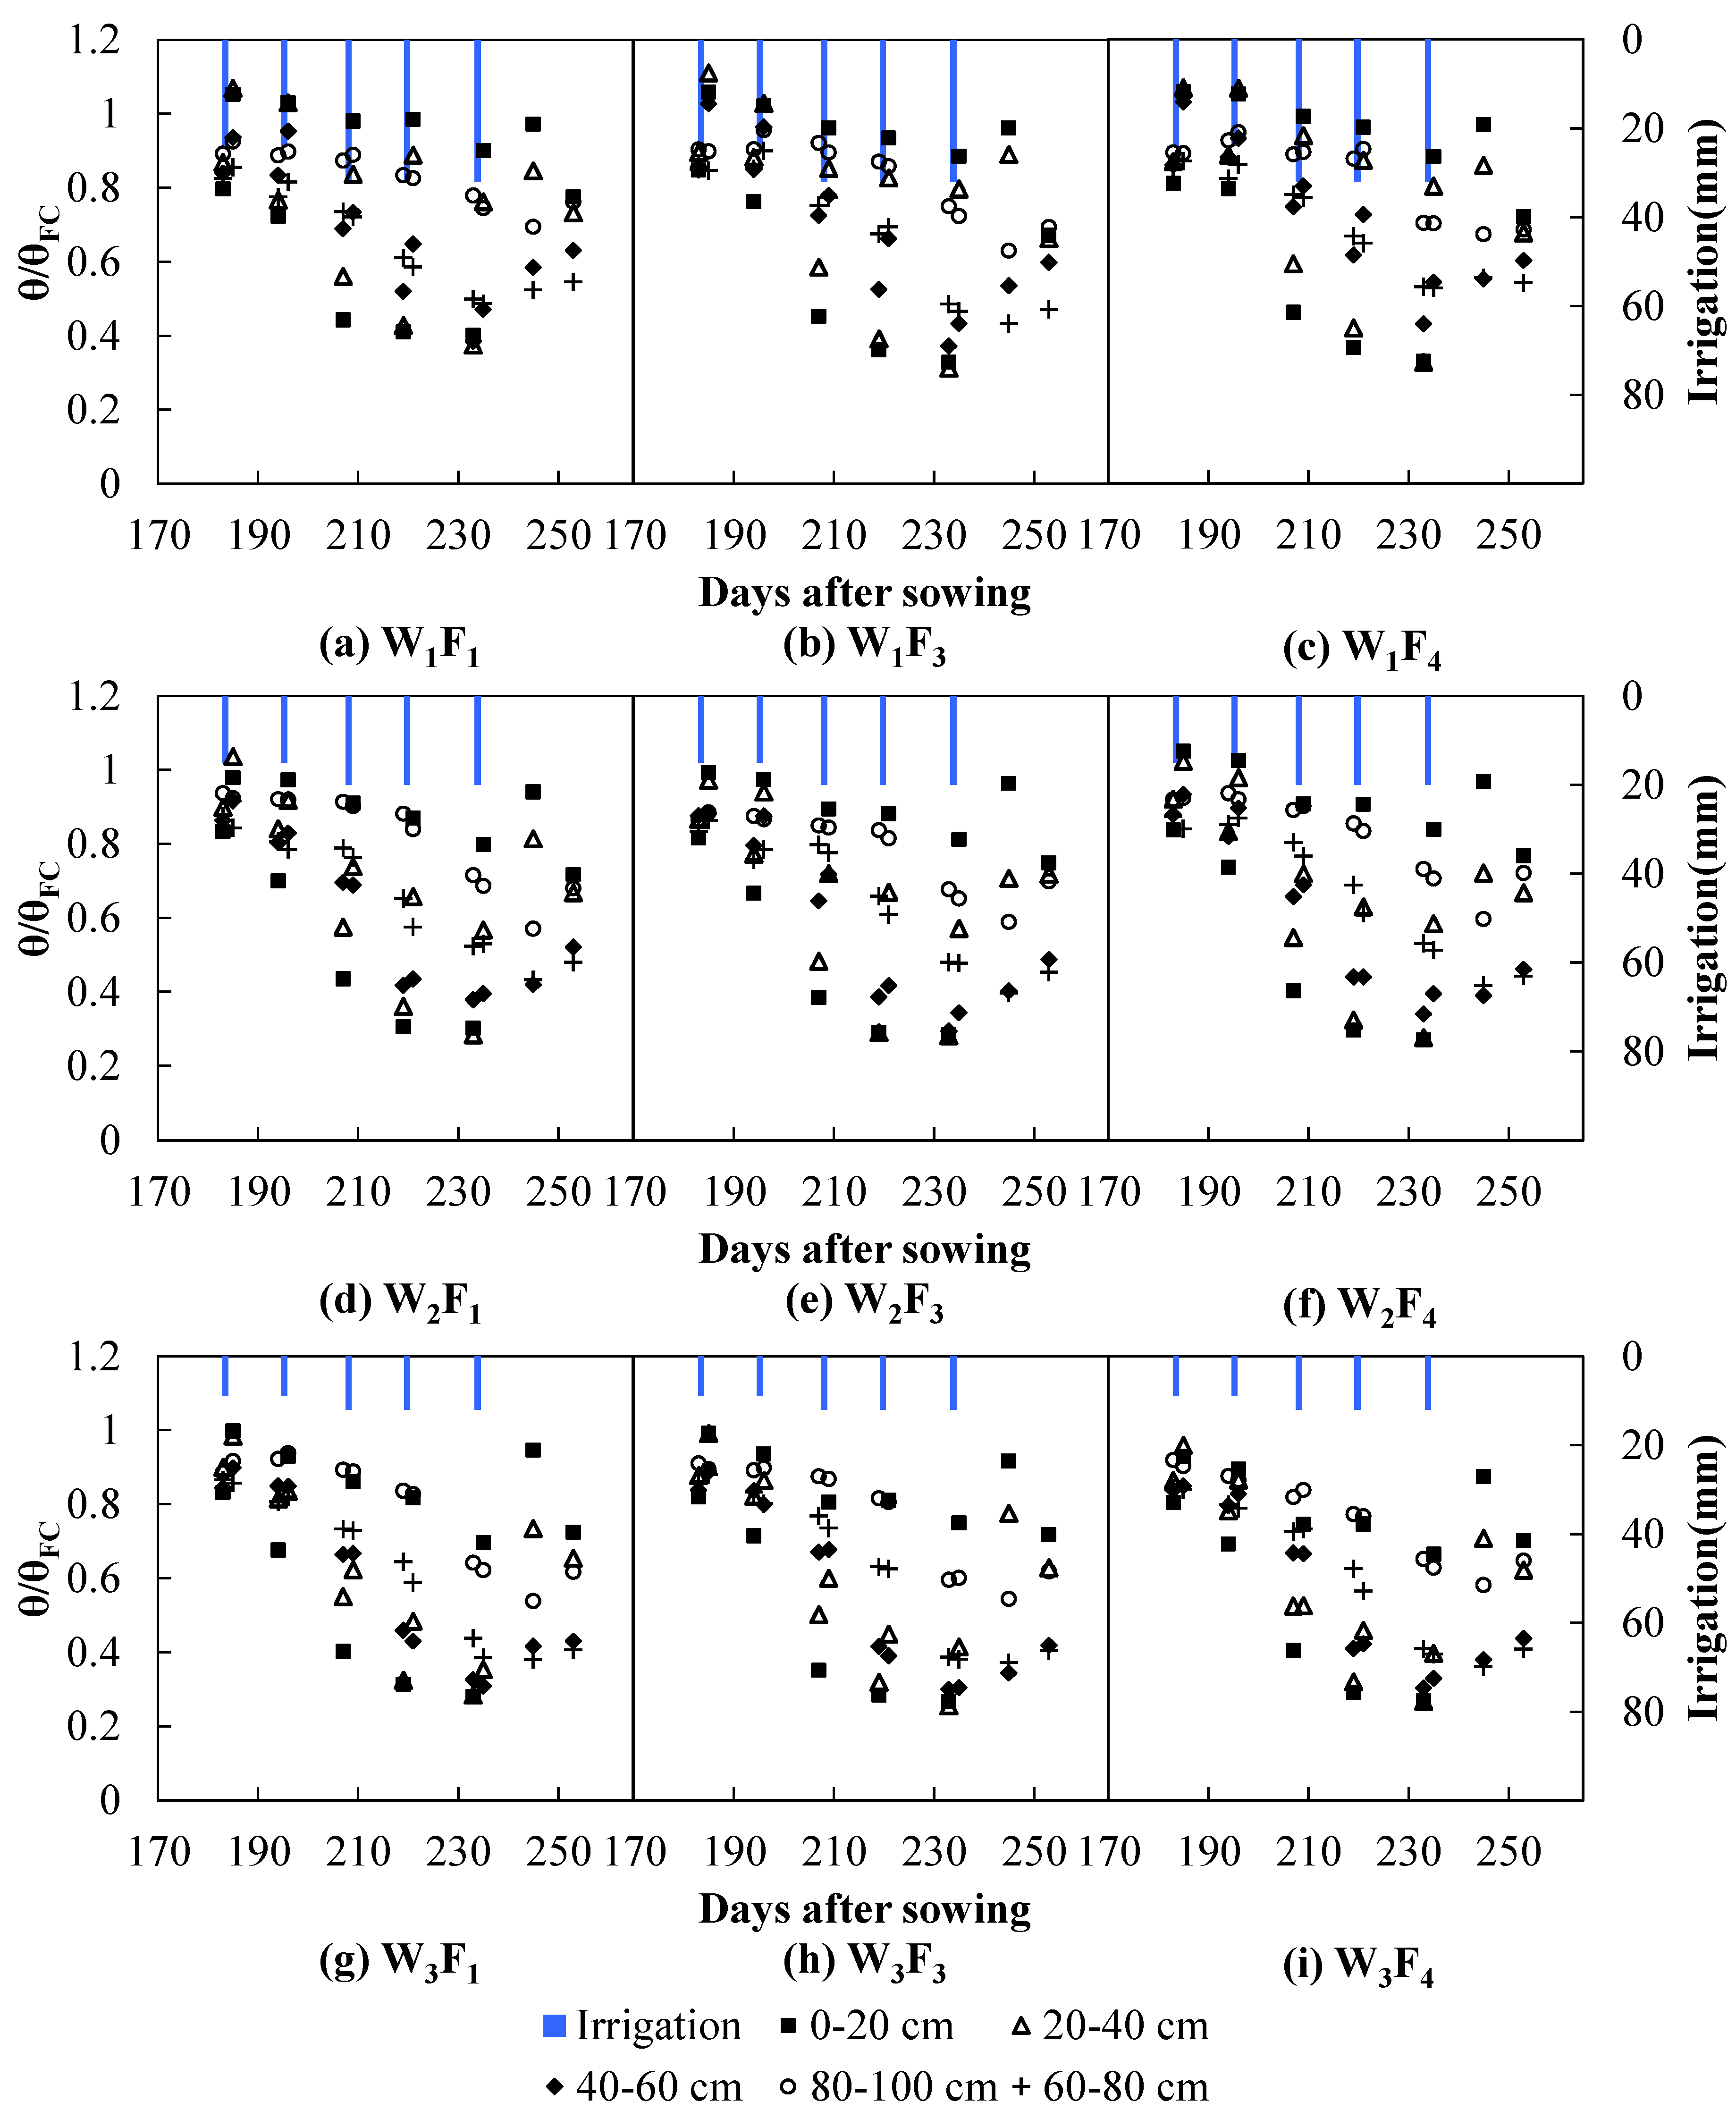
3.1. Depth and Time Changes of Relative Soil Moisture
3.2. Deep Percolation


| Calculation Method | Deep Percolation (mm) | ||||||||
|---|---|---|---|---|---|---|---|---|---|
| W1F1 | W1F2 | W1F3 | W2F1 | W2F2 | W2F3 | W3F1 | W3F2 | W3F3 | |
| M1 | 146 | 150 | 139 | 149 | 147 | 139 | 133 | 126 | 119 |
| M2 | 101 | 105 | 100 | 114 | 112 | 97 | 93 | 93 | 85 |
| M3 | 38 | 38 | 38 | 29 | 29 | 29 | 24 | 24 | 24 |
| SEm (W) | 3.10 | 3.20 | - | ||||||
| LSD (W) | 6.51 | 6.72 | - | ||||||
| SEm (F) | 3.10 | 3.20 | - | ||||||
| LSD (F) | 6.51 | 6.72 | - | ||||||
| Calculation Method | Deep Percolation (mm) | ||||||||
|---|---|---|---|---|---|---|---|---|---|
| W1F1 | W1F3 | W1F4 | W2F1 | W2F3 | W2F4 | W3F1 | W3F3 | W3F4 | |
| M1 | 81 | 70 | 70 | 90 | 72 | 76 | 73 | 63 | 52 |
| M2 | 40 | 36 | 33 | 38 | 33 | 29 | 31 | 26 | 23 |
| M3 | 42 | 42 | 42 | 31 | 31 | 31 | 24 | 24 | 24 |
| SEm (W) | 3.07 | 2.38 | - | ||||||
| LSD (W) | 6.45 | 5.01 | - | ||||||
| SEm (F) | 3.07 | 2.38 | - | ||||||
| LSD (F) | 6.45 | 5.01 | - | ||||||
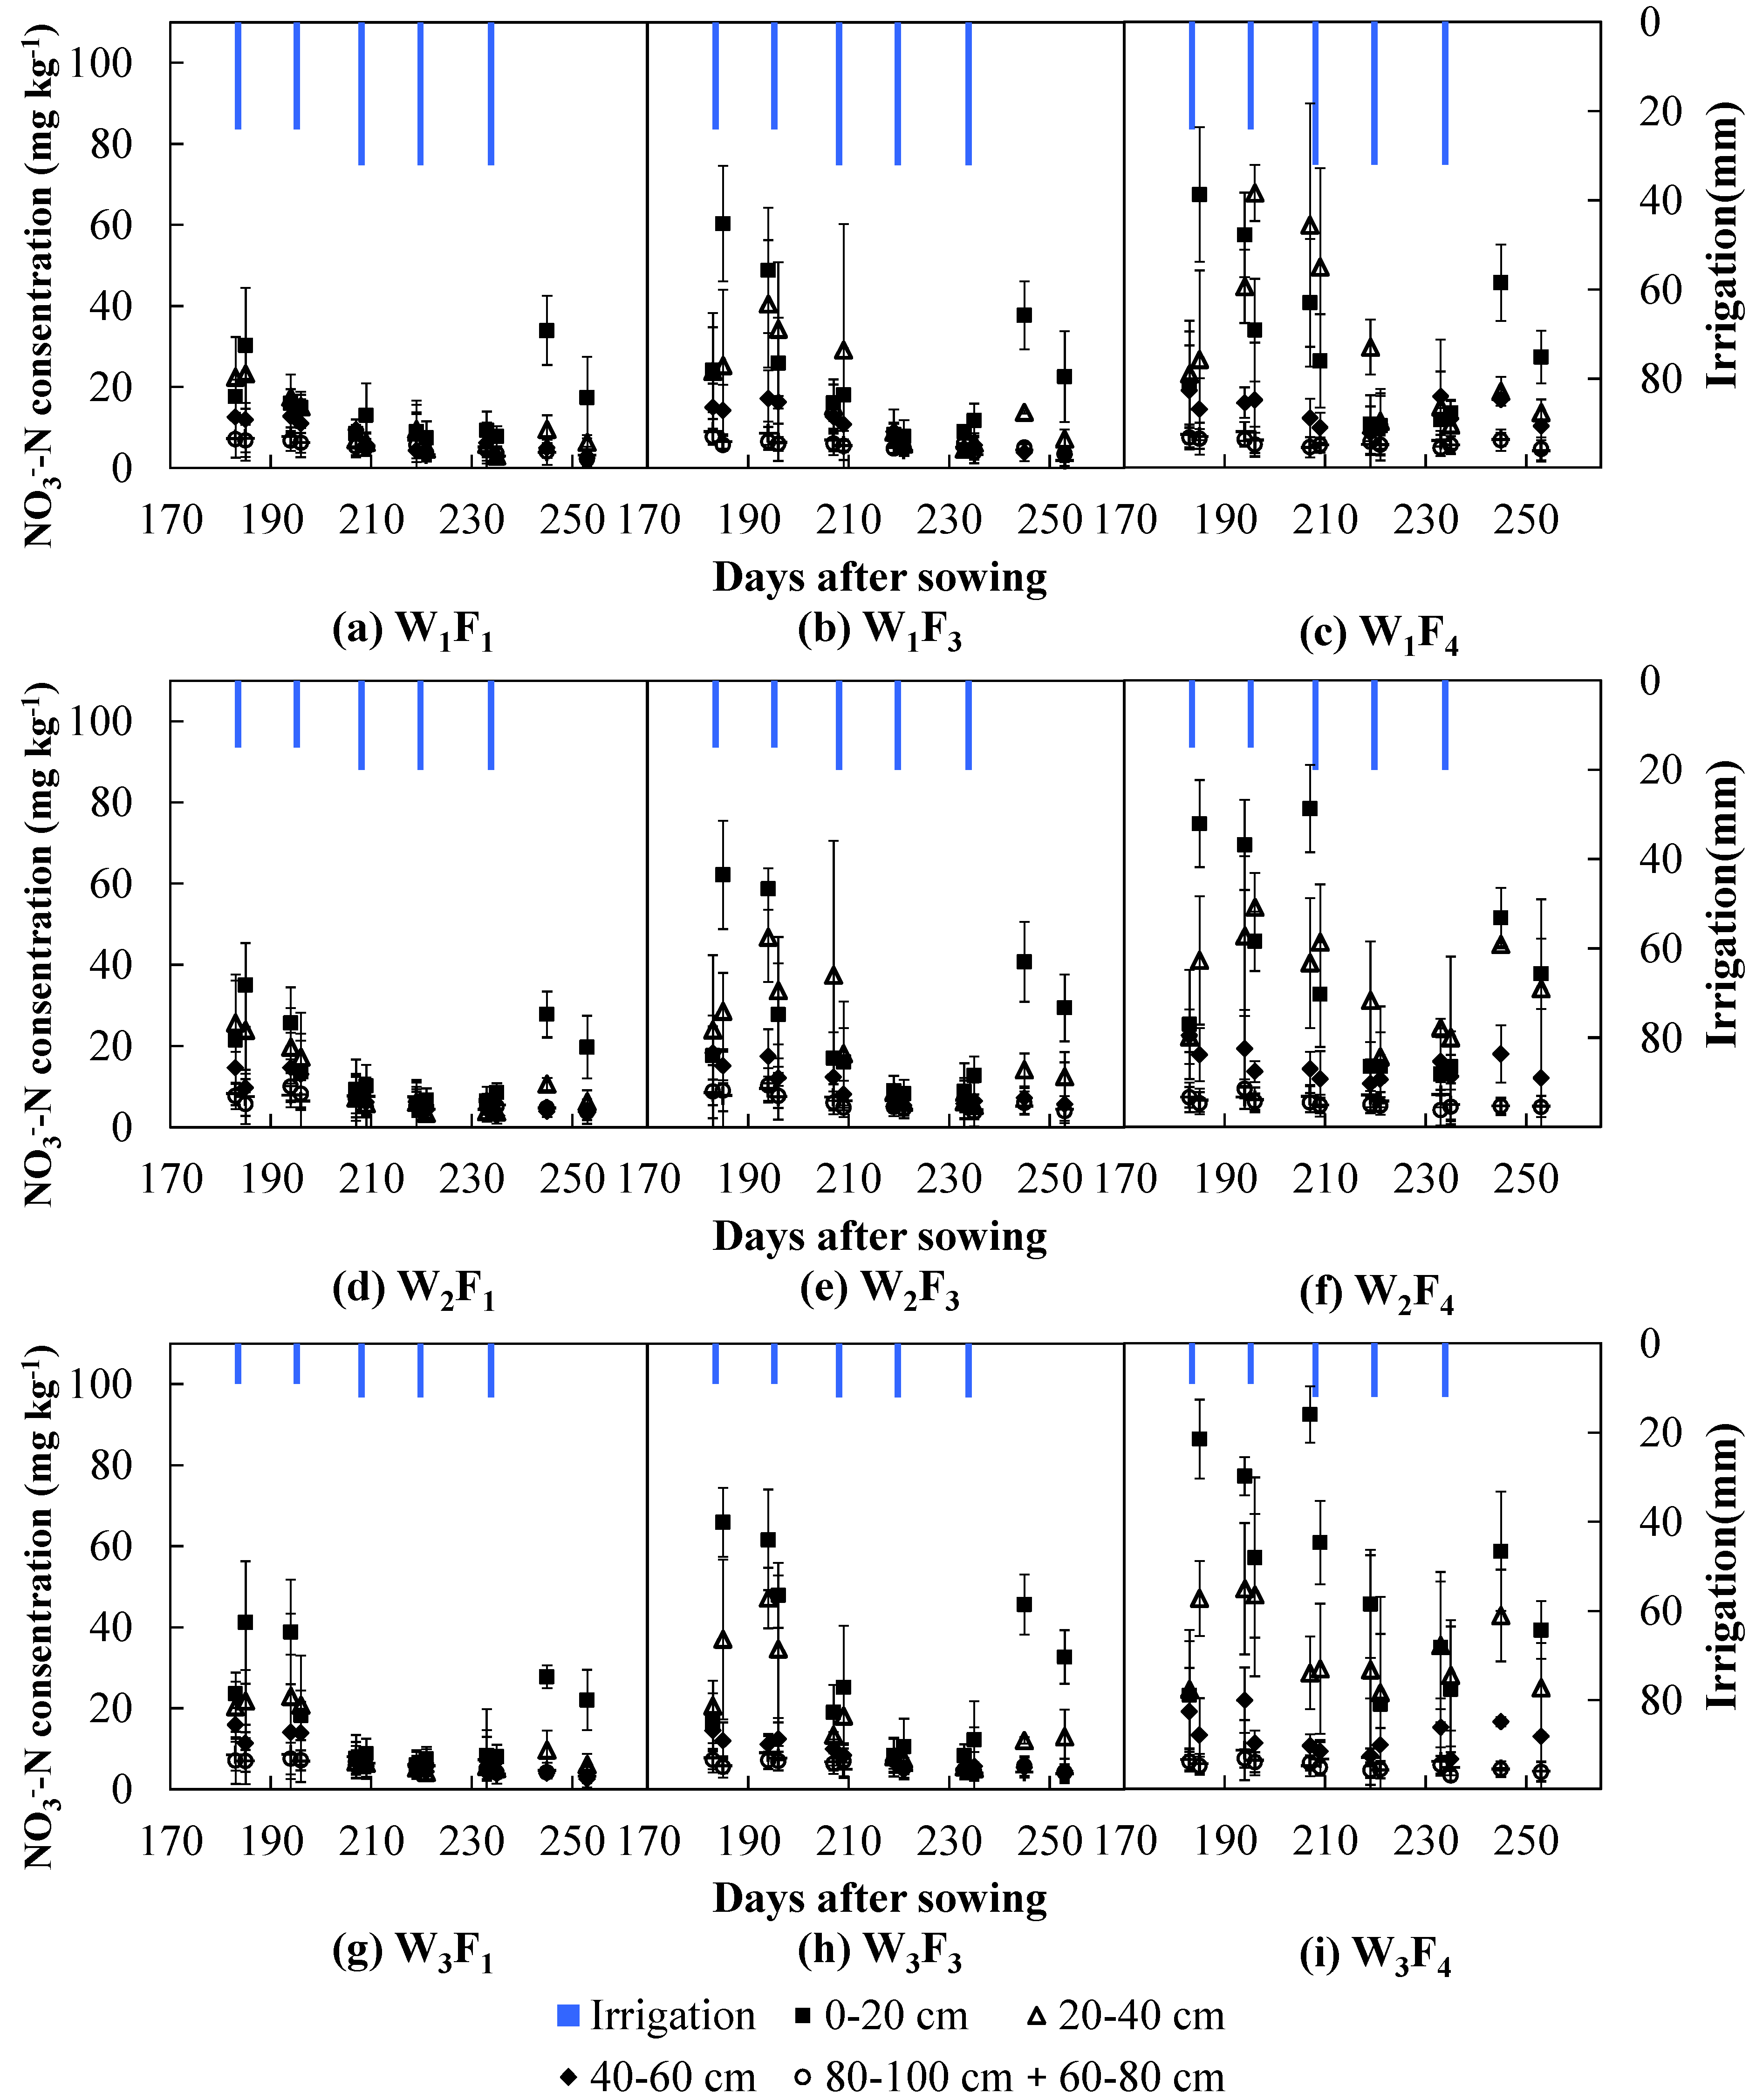
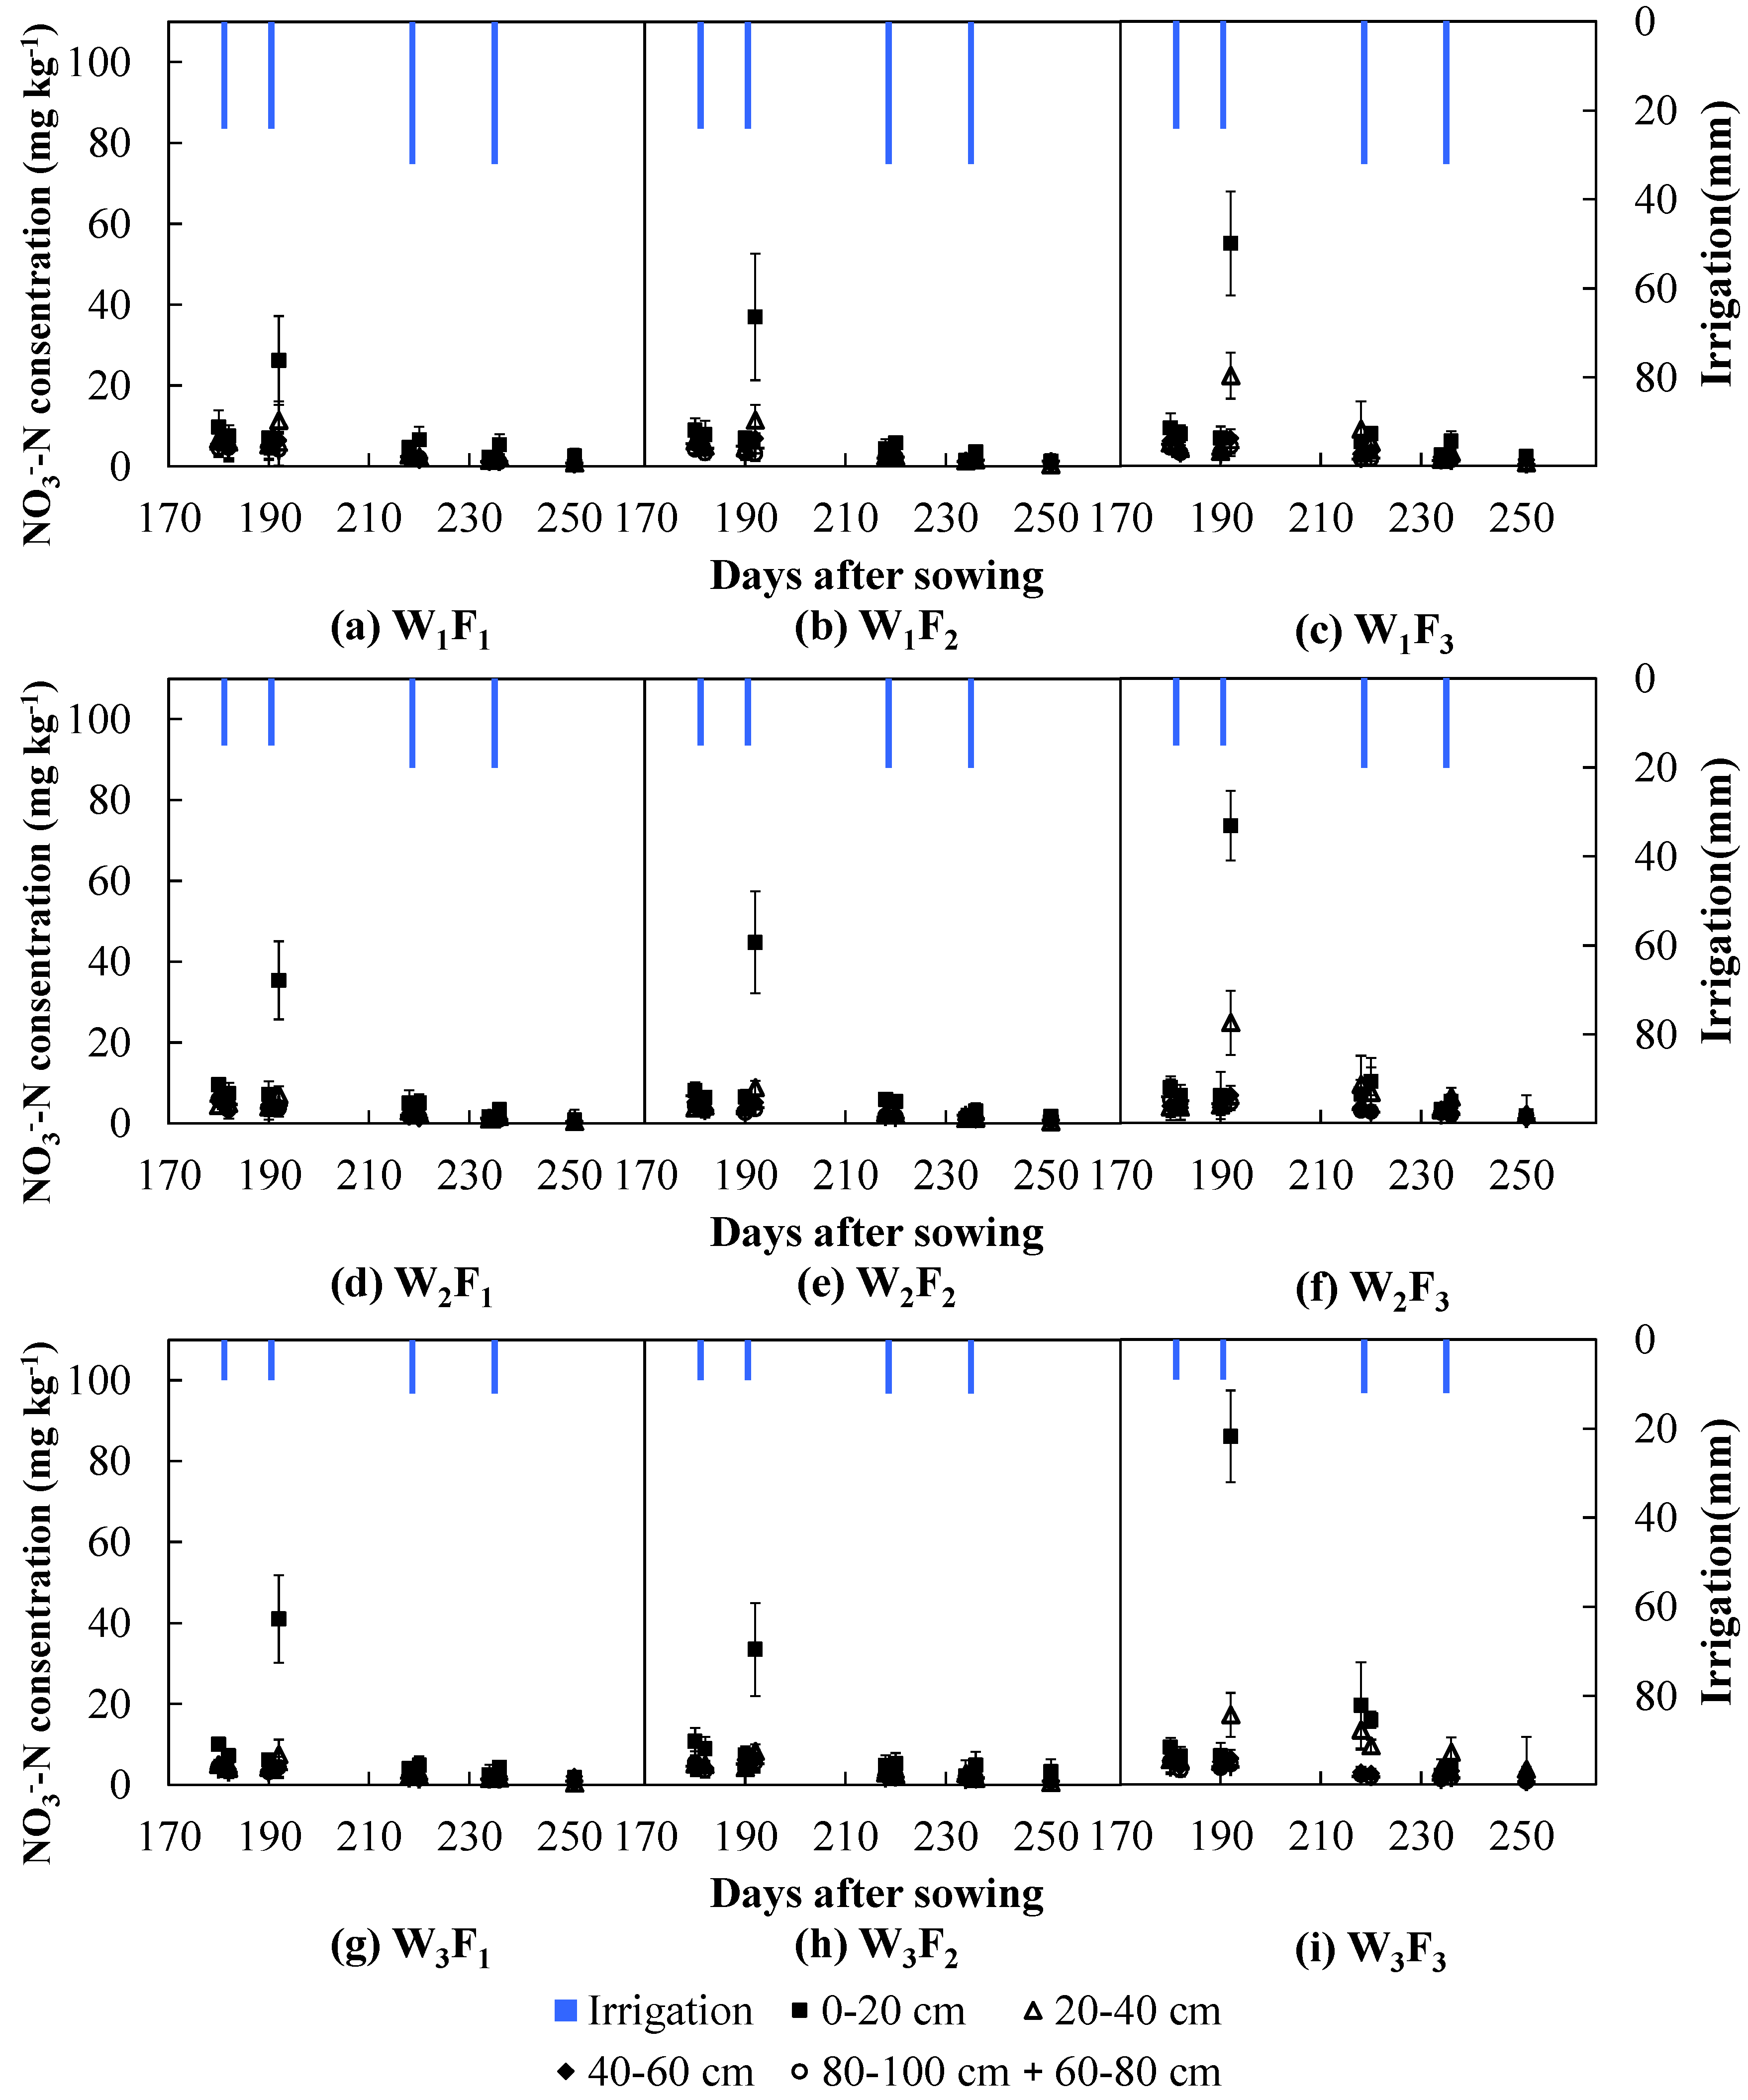
3.3. Depth and Time Changes of NO3−-N Concentrations

3.4. NO3− Leaching and NO3− Residual
| Treatments | W1F1 | W1F2 | W1F3 | W2F1 | W2F2 | W2F3 | W3F1 | W3F2 | W3F3 |
|---|---|---|---|---|---|---|---|---|---|
| NL at 100 cm layer (kg·ha−1) | 21.5 | 21.6 | 23.9 | 29.5 | 22.6 | 31.2 | 21.1 | 26.2 | 27.3 |
| Nini at 100 cm layer (kg·ha−1) | 14.7 | 13.8 | 15.3 | 19.7 | 14.8 | 19.0 | 15.0 | 18.0 | 18.8 |
| Two-way analysis of variance | |||||||||
| Irrigation schedule | NS (p = 0.215) | ||||||||
| Nitrogen rate | NS (p = 0.337) | ||||||||
| NL at 60 cm layer (kg·ha−1) | 14.7 | 16.0 | 18.5 | 16.9 | 16.5 | 23.6 | 11.0 | 12.4 | 20.6 |
| Nini at 60 cm layer (kg·ha−1) | 17.3 | 17.1 | 19.5 | 17.9 | 16.7 | 13.4 | 14.0 | 14.1 | 18.3 |
| Two-way analysis of variance | |||||||||
| Irrigation schedule | NS (p = 0.088) | ||||||||
| Nitrogen rate | * (p = 0.017) | ||||||||
| NR in 0–100 cm layer (kg·ha−1) | 13.9 | 15.4 | 17.9 | 12.1 | 16.6 | 25.6 | 18.6 | 19.2 | 28.0 |
| Two-way analysis of variance | |||||||||
| Irrigation schedule | * (p = 0.000) | ||||||||
| Nitrogen rate | * (p = 0.000) | ||||||||
| SEm (W) | 0.88 | ||||||||
| LSD (W) | 1.86 | ||||||||
| SEm (F) | 0.88 | ||||||||
| LSD (F) | 1.86 | ||||||||
| Treatments | W1F1 | W1F3 | W1F4 | W2F1 | W2F3 | W2F4 | W3F1 | W3F3 | W3F4 |
|---|---|---|---|---|---|---|---|---|---|
| NL at 100 cm layer (kg·ha−1) | 25.3 | 30.5 | 28.6 | 30.4 | 26.4 | 28.4 | 23.7 | 22.6 | 18.7 |
| Nini at 100 cm layer (kg·ha−1) | 23.6 | 25.6 | 24.5 | 25.4 | 24.5 | 24.2 | 23.6 | 23.3 | 22.4 |
| Two-way analysis of variance | |||||||||
| Irrigation schedule | NS (p = 0.073) | ||||||||
| Nitrogen rate | NS (p = 0.828) | ||||||||
| NL at 60 cm layer (kg·ha−1) | 21.6 | 31.5 | 45.3 | 31.6 | 46.5 | 62.1 | 18.2 | 27.2 | 40.5 |
| Nini at 60 cm layer (kg·ha−1) | 39.7 | 47.3 | 60.1 | 46.2 | 57.7 | 70.7 | 50.1 | 45.9 | 60.3 |
| Two-way analysis of variance | |||||||||
| Irrigation schedule | * (p = 0.001) | ||||||||
| Nitrogen rate | * (p = 0.000) | ||||||||
| NR in 0–100 cm layer (kg·ha−1) | 99.2 | 114.9 | 185.6 | 119.3 | 169.0 | 288.2 | 117.8 | 180.6 | 303.8 |
| Two-way analysis of variance | |||||||||
| Irrigation schedule | * (p = 0.000) | ||||||||
| Nitrogen rate | * (p = 0.000) | ||||||||
| SEm (W) | 4.21 | ||||||||
| LSD (W) | 8.85 | ||||||||
| SEm (F) | 4.21 | ||||||||
| LSD (F) | 8.85 | ||||||||
4. Discussion
4.1. Effects of Irrigation on Water Movement and N Dynamics
4.2. Movement of Water for a Wheat Crop under Drip Irrigation
4.3. Distribution of NO3−-N in Relation to the Movement of Water
4.4. Deep Percolation at Different Levels of N and Water under Drip Irrigation
4.5. Risk of N Leaching at Different Levels of N and Water under Drip Irrigation
5. Conclusions
Acknowledgments
Author Contributions
Conflicts of Interest
References
- Boyer, J.S.; Westgate, M.E. Grain yields with limited water. J. Exp. Bot. 2004, 55, 2385–2394. [Google Scholar] [CrossRef] [PubMed]
- Jones, H.G.; Corlett, J.E. Current topics in drought physiology. J. Agric. Sci. 1992, 119, 291–296. [Google Scholar] [CrossRef]
- Rockström, J.; Lannerstad, M.; Falkenmark, M. Assessing the water challenge of a new green revolution in developing countries. Proc. Natl. Acad. Sci. USA 2007, 104, 6253–6260. [Google Scholar] [CrossRef] [PubMed]
- Zhang, Y.; Kendy, E.; Yu, Q.; Liu, C.; Shen, Y.; Sun, H. Effect of soil water deficit on evapotranspiration, crop yield, and water use efficiency in the north china plain. Agric. Water Manag. 2004, 64, 107–122. [Google Scholar] [CrossRef]
- Wang, Z.; Li, J.; Li, Y. Effects of drip irrigation system uniformity and nitrogen applied on deep percolation and nitrate leaching during growing seasons of spring maize in semi-humid region. Irrig. Sci. 2014, 32, 221–236. [Google Scholar] [CrossRef]
- Zhang, H.; Wang, X.; You, M.; Liu, C. Water-yield relations and water-use efficiency of winter wheat in the north China plain. Irrig. Sci. 1999, 19, 37–45. [Google Scholar] [CrossRef]
- Liu, C.; Zhang, X.; Zhang, Y. Determination of daily evaporation and evapotranspiration of winter wheat and maize by large-scale weighing lysimeter and micro-lysimeter. Agric. For. Meteorol. 2002, 111, 109–120. [Google Scholar] [CrossRef]
- Li, W.; Wang, M.Y.; Liu, L.Y.; Yan, Y. Assessment of long-term evolution of groundwater hydrochemical characteristics using multiple approaches: A case study in Cangzhou, northern China. Water 2015, 7, 1109–1128. [Google Scholar] [CrossRef]
- Li, X.; Li, G.; Zhang, Y. Identifying major factors affecting groundwater change in the north China plain with grey relational analysis. Water 2014, 6, 1581–1600. [Google Scholar] [CrossRef]
- Zhang, Y.; Li, G. Long-term evolution of cones of depression in shallow aquifers in the north China plain. Water 2013, 5, 677–697. [Google Scholar] [CrossRef]
- Garabet, S.; Ryan, J.; Wood, M. Nitrogen and water effects on wheat yield in a mediterranean-type climate. II. Fertilizer-use efficiency with labelled nitrogen. Field Crops Res. 1998, 58, 213–221. [Google Scholar] [CrossRef]
- Li, Z.Z.; Li, W.D.; Li, W.L. Dry-period irrigation and fertilizer application affect water use and yield of spring wheat in semi-arid regions. Agric. Water Manag. 2004, 65, 133–143. [Google Scholar] [CrossRef]
- Hou, P.; Gao, Q.; Xie, R.; Li, S.; Meng, Q.; Kirkby, E.A.; Römheld, V.; Müller, T.; Zhang, F.; Cui, Z.; et al. Grain yields in relation to n requirement: Optimizing nitrogen management for spring maize grown in china. Field Crops Res. 2012, 129, 1–6. [Google Scholar] [CrossRef]
- Ju, X.T.; Xing, G.X.; Chen, X.P.; Zhang, S.L.; Zhang, L.J.; Liu, X.J.; Cui, Z.L.; Yin, B.; Christie, P.; Zhu, Z.L.; et al. Reducing environmental risk by improving n management in intensive chinese agricultural systems. Proc. Natl. Acad. Sci. USA 2009, 106, 3041–3046. [Google Scholar] [CrossRef] [PubMed] [Green Version]
- Timsina, J.; Singh, U.; Badaruddin, M.; Meisner, C.; Amin, M.R. Cultivar, nitrogen, and water effects on productivity, and nitrogen-use efficiency and balance for rice-wheat sequences of bangladesh. Field Crops Res. 2001, 72, 143–161. [Google Scholar] [CrossRef]
- Behera, S.; Jha, M.K.; Kar, S. Dynamics of water flow and fertilizer solute leaching in lateritic soils of kharagpur region, India. Agric. Water Manag. 2003, 63, 77–98. [Google Scholar] [CrossRef]
- Zhu, J.H.; Li, X.L.; Christie, P.; Li, J.L. Environmental implications of low nitrogen use efficiency in excessively fertilized hot pepper (Capsicum frutescens L.) cropping systems. Agric. Ecosyst. Environ. 2005, 111, 70–80. [Google Scholar] [CrossRef] [Green Version]
- Garnier, M.; Recanatesi, F.; Ripa, M.N.; Leone, A. Agricultural nitrate monitoring in a lake basin in central italy: A further step ahead towards an integrated nutrient management aimed at controlling water pollution. Environ. Monitor. Assess. 2010, 170, 273–286. [Google Scholar] [CrossRef] [PubMed]
- Laegreid, M.B.O.C.; Kaarstad, O. Agriculture, Fertilizers and the Environment; CABI Publishing in Association with Norsk Hydro ASA: Norsk Hydro ASA, Porsgrunn, Norway, 1999. [Google Scholar]
- Wang, J.; Gong, S.; Xu, D.; Yu, Y.; Zhao, Y. Impact of drip and level-basin irrigation on growth and yield of winter wheat in the north china plain. Irrig. Sci. 2013, 31, 1025–1037. [Google Scholar] [CrossRef]
- Cassel Sharmasarkar, F.; Sharmasarkar, S.; Miller, S.D.; Vance, G.F.; Zhang, R. Assessment of drip and flood irrigation on water and fertilizer use efficiencies for sugarbeets. Agric. Water Manag. 2001, 46, 241–251. [Google Scholar] [CrossRef]
- Souza, C.; Folegatti, M.; Or, D. Distribution and storage characterization of soil solution for drip irrigation. Irrig. Sci. 2009, 27, 277–288. [Google Scholar] [CrossRef]
- Watts, D.G.; Martin, D.L. Effects of water and nitrogen management on nitrogen leaching loss from sands. Trans. ASAE 1981, 24, 911–916. [Google Scholar] [CrossRef]
- Gärdenäs, A.I.; Hopmans, J.W.; Hanson, B.R.; Šimůnek, J. Two-dimensional modeling of nitrate leaching for various fertigation scenarios under micro-irrigation. Agric. Water Manag. 2005, 74, 219–242. [Google Scholar] [CrossRef]
- Vázquez, N.; Pardo, A.; Suso, M.L.; Quemada, M. Drainage and nitrate leaching under processing tomato growth with drip irrigation and plastic mulching. Agric. Ecosyst. Environ. 2006, 112, 313–323. [Google Scholar] [CrossRef]
- Ritter, W.F. Nitrate leaching under irrigation in the United States—A review. J. Environ. Sci. Health Part A 1989, 24, 349–378. [Google Scholar] [CrossRef] [PubMed]
- Liao, L.; Zhang, L.; Bengtsson, L. Soil moisture variation and water consumption of spring wheat and their effects on crop yield under drip irrigation. Irrig. Drain. Syst. 2008, 22, 253–270. [Google Scholar] [CrossRef]
- Meier, U. Growth Stages of Mono- and Dicotyledonous Plants, 2nd ed.; Federal Biological Research Center for Agriculture and Forestry: Berlin, Germany, 2001. [Google Scholar]
- Liu, Y.; Li, J.; Li, Y. Effects of split fertigation rates on the dynamics of nitrate in soil and the yield of mulched drip-irrigated maize in the sub-humid region. Appl. Eng. Agric. 2015, 31, 103–117. [Google Scholar]
- Lu, R. (Ed.) Chemical Analysis Methods of Soils in Agriculture; Science and Technology Press: Beijing, China, 1999. (In Chinese)
- Home, P.G.; Panda, R.K.; Kar, S. Effect of method and scheduling of irrigation on water and nitrogen use efficiencies of okra (abelmoschus esculentus). Agric. Water Manag. 2002, 55, 159–170. [Google Scholar] [CrossRef]
- Genuchten, V.; Th, M. Closed-form. Equation for predicting the hydraulic conductivity of unsaturated soils. Soil Sci. Soc. Am. J. 1980, 44, 892–898. [Google Scholar] [CrossRef]
- Allen, R.; Pereira, L.; Raes, D.; Smith, M. Crop Evapotranspiration—Guidelines for Computing Crop Water Requirements; FAO Irrigation and Drainage Paper 56; Food and Agriculture Organization of the United Nations: Rome, Italy, 1998. [Google Scholar]
- Arregui, L.M.; Quemada, M. Drainage and nitrate leaching in a crop rotation under different n-fertilizer strategies: Application of capacitance probes. Plant Soil 2006, 288, 57–69. [Google Scholar] [CrossRef]
- Bruckler, L.; de Cockborne, A.M.; Renault, P.; Claudot, B. Spatial and temporal variability of nitrate in irrigated salad crops. Irrig. Sci. 1997, 17, 53–61. [Google Scholar] [CrossRef]
- Ploeg, R.R.V.D.; Ringe, H.; Machulla, G.; Hermsmeyer, D. Postwar nitrogen use efficiency in west german agriculture and groundwater quality. J. Environ. Qual. 1997, 1203–1212. [Google Scholar] [CrossRef]
- Laan, M.V.D.; Stirzaker, R.J.; Annandale, J.G.; Bristow, K.L.; Preez, C.C.D. Monitoring and modelling draining and resident soil water nitrate concentrations to estimate leaching losses. Agric. Water Manag. 2010, 97, 1779–1786. [Google Scholar] [CrossRef]
- Bar-Yosef, B. Advances in fertigation. Adv. Agron. 1999, 65, 1–77. [Google Scholar]
- Li, J.S.; Ji, H.Y.; Li, B.; Liu, Y.C. Wetting patterns and nitrate distributions in layered-textural soils under drip irrigation. Agric. Sci. China 2007, 6, 970–980. [Google Scholar] [CrossRef]
- Arbat, G.; Roselló, A.; Domingo Olivé, F.; Puig-Bargués, J.; González Llinàs, E.; Duran-Ros, M.; Pujol, J.; Ramírez de Cartagena, F. Soil water and nitrate distribution under drip irrigated corn receiving pig slurry. Agric. Water Manag. 2013, 120, 11–22. [Google Scholar] [CrossRef]
- Kong, Q.; Li, G.; Wang, Y.; Huo, H. Bell pepper response to surface and subsurface drip irrigation under different fertigation levels. Irrig. Sci. 2012, 30, 233–245. [Google Scholar] [CrossRef]
- Behera, S.K.; Panda, R.K. Effect of fertilization and irrigation schedule on water and fertilizer solute transport for wheat crop in a sub-humid sub-tropical region. Agric. Ecosyst. Environ. 2009, 130, 141–155. [Google Scholar] [CrossRef]
- Li, J.S.; Liu, Y.C. Water and nitrate distributions as affected by layered-textural soil and buried dripline depth under subsurface drip fertigation. Irrig. Sci. 2011, 29, 469–478. [Google Scholar] [CrossRef]
- Bar-Yosef, B. Fertilization under drip irrigation. In Fluid Fertilizer Science and Technology; Palgrave, D.A., Ed.; Marcel Dekker: New York, NY, USA, 1991; pp. 285–329. [Google Scholar]
- Shi, Z.; Li, D.; Jing, Q.; Cai, J.; Jiang, D.; Cao, W.; Dai, T. Effects of nitrogen applications on soil nitrogen balance and nitrogen utilization of winter wheat in a rice-wheat rotation. Field Crops Res. 2012, 127, 241–247. [Google Scholar] [CrossRef]
- Gheysari, M.; Mirlatifi, S.M.; Homaee, M.; Asadi, M.E.; Hoogenboom, G. Nitrate leaching in a silage maize field under different irrigation and nitrogen fertilizer rates. Agric. Water Manag. Int. J. 2009, 96, 946–954. [Google Scholar] [CrossRef]
- Barber, S.A.; Mackay, A.D.; Kuchenbuch, R.O.; Barraclough, P.B. Effects of soil temperature and water on maize root growth. Plant Soil 1988, 111, 267–269. [Google Scholar] [CrossRef]
- Gorska, A.; Zwieniecka, A.; Michele Holbrook, N.; Zwieniecki, M. Nitrate induction of root hydraulic conductivity in maize is not correlated with aquaporin expression. Planta 2008, 228, 989–998. [Google Scholar] [CrossRef] [PubMed]
- Webster, C.P.; Shepherd, M.A.; Goulding, K.W.T.; Lord, E. Comparisons of methods for measuring the leaching of mineral nitrogen from arable land. J. Soil Sci. 1993, 44, 49–62. [Google Scholar] [CrossRef]
- Zupanc, V.; Šturm, M.; Lojen, S.; Maršić-Kacjan, N.; Adu-Gyamfi, J.; Bračič-Železnik, B.; Urbanc, J.; Pintar, M. Nitrate leaching under vegetable field above a shallow aquifer in Slovenia. Agric. Ecosyst. Environ. 2011, 144, 167–174. [Google Scholar] [CrossRef]
- Sexton, B.T.; Moncrief, J.F.; Rosen, C.J.; Gupta, S.C.; Cheng, H.H. Optimizing nitrogen and irrigation inputs for corn based on nitrate leaching and yield on a coarse-textured soil. J. Environ. Qual. 1998, 27, 982–992. [Google Scholar] [CrossRef]
- Allaire-Leung, S.E.; Wu, L.; Mitchell, J.P.; Sanden, B.L. Nitrate leaching and soil nitrate content as affected by irrigation uniformity in a carrot field. Agric. Water Manag. 2001, 48, 37–50. [Google Scholar] [CrossRef]
© 2015 by the authors; licensee MDPI, Basel, Switzerland. This article is an open access article distributed under the terms and conditions of the Creative Commons Attribution license (http://creativecommons.org/licenses/by/4.0/).
Share and Cite
Sui, J.; Wang, J.; Gong, S.; Xu, D.; Zhang, Y. Effect of Nitrogen and Irrigation Application on Water Movement and Nitrogen Transport for a Wheat Crop under Drip Irrigation in the North China Plain. Water 2015, 7, 6651-6672. https://doi.org/10.3390/w7116651
Sui J, Wang J, Gong S, Xu D, Zhang Y. Effect of Nitrogen and Irrigation Application on Water Movement and Nitrogen Transport for a Wheat Crop under Drip Irrigation in the North China Plain. Water. 2015; 7(11):6651-6672. https://doi.org/10.3390/w7116651
Chicago/Turabian StyleSui, Juan, Jiandong Wang, Shihong Gong, Di Xu, and Yanqun Zhang. 2015. "Effect of Nitrogen and Irrigation Application on Water Movement and Nitrogen Transport for a Wheat Crop under Drip Irrigation in the North China Plain" Water 7, no. 11: 6651-6672. https://doi.org/10.3390/w7116651