
State of the Art of Online Monitoring and Control of the Coagulation Process

1
Norwegian University of Life Sciences, PO Box 5003-IMT, Aas 1432, Norway
2
University of Applied Sciences Ostwestfalen-Lippe, An der Wilhelmshöhe 44, Höxter 37671, Germany
*
Author to whom correspondence should be addressed.
†
These authors contributed equally to this work.
Water 2015, 7(11), 6574-6597; https://doi.org/10.3390/w7116574
Submission received: 27 September 2015
/
Revised: 4 November 2015
/
Accepted: 9 November 2015
/
Published: 17 November 2015
Abstract
:Coagulation is an essential process for the removal of suspended and colloidal material from water and wastewater. However, no comprehensive or universally accepted mathematical description of the process has been developed so far. Therefore, process optimization and control is usually based on data from jar tests and simple flow-proportional dosing concepts, while more accurate concepts based on water quality parameters that can be measured online are emerging. In addition, there have been attempts to develop software sensors and control schemes that involve advanced mathematical analyses of these parameters. The paper presents an overview of the parameters and physical sensors that are used for feed-forward and feed-backward control schemes and the experiences that have been made with their implementation. Moreover, the development and use of software sensors is described. Finally, the practical applications of different control techniques are given in order to illustrate the state of the art of coagulation control. Some thoughts about research needs conclude this review.
Keywords:
coagulation; water; wastewater; purification; modeling; feed-forward control; feedback control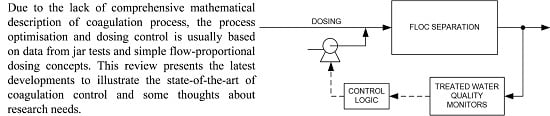
1. Introduction
1.1. The Relevance of the Coagulation Process
Removal of suspended and colloidal material from water and wastewater requires the application of inorganic or organic coagulants for destabilization and subsequent flocculation and separation. In addition, chemical phosphorus removal via the formation of aluminum or iron precipitates also depends on their entrapment into flocs. The maximum removal of particles and phosphates is not the universal objective in coagulation anymore. Controlled removal of phosphates to optimize downstream biological processes and minimizing the use of coagulants not only to reduce the sludge volumes but also to enhance the plant availability of phosphates are examples that call for optimized online dosing control [1].
Worldwide, several million tons per year of metal salts (Al- and Fe- based coagulants) are used for these purposes, and the world market for coagulants and flocculants in 2013 was estimated to be on the order of $5.4 billion [2]. However, coagulation is no longer solely a pre-stage of conventional solid-liquid separation, i.e., sedimentation, flotation, and filtration, but has also been successfully combined with membrane filtration processes [3].
A mathematical description of the process is important in understanding the coagulation process and its further optimization and control. A number of valuable mathematical descriptions like the DLVO theory, Shulze–Hardy rule, Smoluchovski equation, etc. describe phenomena at various stages of the coagulation process. However, no comprehensive or universally accepted mathematical description of the process has been developed that accounts for all of the relevant parameters and that could be used to optimize the process and control its operation. The main factor is the complex nature of the electrostatic and/or steric stabilization of particles in aqueous solutions as well as the influence of equilibrium conditions and kinetics of the hydrolysis and precipitation reactions when applying metal coagulants.
When looking at charge neutralization and sweep coagulation as the two main destabilization mechanisms [4], charge effects only play a minor role in the latter case. In many water treatment plants, however, charge neutralization can be considered the predominant process, especially if the coagulant dose has been optimized. Meanwhile, in wastewater treatment plants phosphate precipitation is often the primary goal of adding coagulants. In both cases there are relationships between water parameters (e.g., concentration and charge of particles, phosphate concentration) and coagulant dose that must be investigated and quantified.
This is the reason why jar testing that was developed almost 100 years ago is still applied in order to determine optimal coagulation conditions. However, this technique is not suited for real-time control of a continuous process, especially when the raw water quality rapidly varies in time and amplitude. Therefore, the use of online sensors has become quite common for monitoring raw water quality as well as coagulant feed and floc separation [5]. In addition to using these data for simple feed-forward or feed-backward control of coagulant dosage, there have been attempts to develop software sensors and control schemes that are based on advanced mathematical analyses of the parameters measured online.
TeKippe and Ham [6,7] gave an early overview over monitoring and control of coagulation processes in 1970. Some 20 years later Dentel [8] summarized newer results with an emphasis on the use of online sensors. The next review, with the first overview of the application of software tools for process control was given by Ratnaweera [9] in 2004. This review will primarily focus on the approaches and results that have been achieved during the past 10–15 years.
1.2. Parameters and Physical Sensors Related to Coagulation
The following raw water parameters have been identified as some of the most relevant for coagulation: pH, temperature, conductivity, turbidity, suspended solids, UV-absorbance, color, TOC, alkalinity, total-P, surface charge/zeta-potential, and ortho-P concentration. Only recently the use of fluorescence components for assessing the treatability of natural organic substances by coagulation has been suggested [10]. For most of the parameters robust and reliable online sensors are available, though some are still either complicated and expensive in full-scale use or restricted to certain conditions. As an example, the charge titration unit developed by Bernhardt and Schell [11] was developed for controlling the coagulation of reservoir water in Germany but has never been successfully applied by others.
In order to monitor the water to be treated shortly after coagulant addition, the main focus is the characterization of destabilized particles and the formation of flocs. In this respect, particle counting and sizing as well as light scattering methods have been developed. An overview of their principles has recently been given by Gregory [12]. However, for online control these methods are limited because of the dynamic nature of the aggregation process.
Moreover, the determination of electrokinetic parameters, namely electrophoretic mobility and streaming current, may be helpful in optimizing the coagulation process. From electrophoretic mobility data the Zeta potential can be derived that is widely accepted as an indicator for successful particle destabilization. Since this method could not be applied online in the past, streaming current detection had become popular over the years. The parameter streaming current can be related to the Zeta potential, though, as pointed out by Dentel [8], there are some limitations with its application as an online sensor. Quite recently an instrument has been developed that is capable of measuring Zeta potential in coagulated water online [13]. When applied at a drinking water treatment plant in the United Kingdom, it was demonstrated that the coagulant dose could be reduced without compromising the performance of the coagulation stage.
In finished water the main parameters of interest are: pH, residual values for turbidity, suspended solids, UV-absorbance, color, TOC, total-P, and ortho-P concentration. In addition, particle counting and (offline) measurement of the Zeta potential of remaining particles has been applied.
In Table 1 an overview of online sensors and their application for monitoring the coagulation process in practice is given. The assessment reflects the experiences of the authors, which may deviate to some extent from U.S. practices, and even among European countries.
1.3. The Floc Formation Process
There are numerous attempts to model the floc formation process mathematically. A detailed overview of earlier studies was given by Thomas et al. [14]. As already suggested by Wistrom and Farrell [15], the ultimate objective should be to develop control laws for the flocculation process, based on measurement of particle size distributions and a dynamic model. In their case a population balance approach was used but the model could only partially be validated.

Table 1.
Online sensors applied for monitoring and control of the coagulation process, according to experiences and applications in Northern Europe/Scandinavia.
| Monitoring stage | Parameter | Commonly Measured | Occasionally Measured | Commonly Used for Dosing Control | Occasionally Used for Dosing Control |
|---|---|---|---|---|---|
| Raw water (inlet) | Flow | X | X | ||
| pH | X | X | |||
| Temperature | X | ||||
| Conductivity | X | ||||
| Turbidity | X | X | |||
| Suspended solids | X | X | |||
| UV-absorbance | X | X | |||
| Color | X | X | |||
| TOC | X | ||||
| Ortho-P | X | ||||
| Total-P | X | ||||
| Particle counter | X | ||||
| Coagulated water (immediately after dosing of coagulants) | pH | X | X | ||
| Streaming current | X | X | |||
| Zeta potential | X | ||||
| Finished water (outlet) | pH | X | X | ||
| Turbidity | X | X | |||
| Suspended solids | X | ||||
| UV-absorbance | X | ||||
| Color | X | ||||
| TOC | X | ||||
| Ortho-P | X | ||||
| Total-P | X |
The same approach was applied by Schuetz and Piesche [16] to predict floc size distributions in a stirred tank reactor. According to their results, it is important to take the influence of different local energy inputs inside the reactor into account, i.e., the assumption of an ideally mixed reactor is too simplified for this type of modeling. Kim and Kramer [17] compared different modeling techniques and presented an improved model that made it possible to simulate fractal aggregate coagulation accurately with short computation times.
Theoretically it should be possible to develop predictive simulations for the flocculation process that could be used for real-time process control, but there are no practical solutions in this respect so far.
2. Direct Use of Online Parameters for Dosing Control
2.1. General Approach
Given the case that influent water quality is constant and the optimum amount of coagulant has been determined, the dosage will be proportional to the water flow. Thus flow-proportional dosing should be applied by each treatment plant as part of a feed-forward control scheme. This requirement is largely fulfilled both in drinking and wastewater treatment [9].
With respect to the influence of water quality, Jackson and Tomlinson [18] have described the general possibilities for using online parameters directly:
- Feed-forward control based on raw water quality;
- Feed-backward control based on dosed water quality;
- Feed-backward control based on treated water quality.
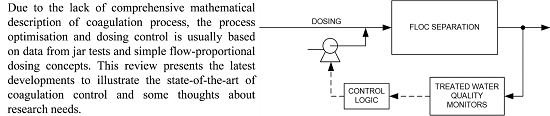
2.2. Feed-Forward Control Based on Raw Water Quality
A successful feed-forward control strategy requires that a functional relationship is established between the raw water parameters measured and the optimal coagulant dose for each site. For this purpose data from jar tests, pilot-plant runs, or technical-scale operation must be available that cover all of the parameter variations that might occur in the course of at least a few months, preferably over a whole year. In Figure 1, the principle of feed-forward control is visualized.
Figure 1.
Sketch of a feed-forward control scheme based on raw water quality.

An early example for this strategy is the treatment of directly abstracted river water with iron sulfate at Hazard’s Green waterworks [18]. An evaluation of historical data covering about four years by multiple regression led to an equation with nine empirical constants:
where the turbidity, conductivity, and temperature of the raw water are given as Turb, Cond, and Temp, respectively. The concept was successfully implemented at the waterworks. However, at two other sites this approach failed, i.e., a similar correlation could not be determined.
For the raw water in Piteå waterworks in Sweden a simple empirical equation was derived by Hernebring [19]. In this case the required dose of aluminum sulfate (ALS) was primarily dependent on the NOM concentration measured via UV absorbance:
where A is the UV absorption at 254 nm, given as m−1. The approach was applied by the waterworks for dosing control purposes. However, its successful implementation requires that the coagulation pH is about constant and that the NOM properties are not changing significantly.
For similar types of surface water from Norway another empirical correlation was suggested by Eikebrokk and Fettig [20], who took pH, initial NOM (NOMi), and residual NOM (NOMr) concentrations into account:
The parameters C1 to C6 were quite different between the five types of water studied, indicating that the nature of NOM plays an important role with respect to coagulant demand. The resulting stoichiometric ratios Al:TOC varied between 0.2 and 1 mg/mg. The equation was not applied in a dosing control scheme.
The specific ultraviolet absorbance (SUVA) concept suggested and further developed by Edzwald [21] was meant to characterize the properties of NOM with respect to coagulation in a simple way. SUVA values are calculated from UV absorbance at 254 nm, divided by the dissolved organic carbon (DOC) concentrations of the NOM. If raw water has an average SUVA of 2–2.5 and greater, the coagulant dosage is controlled by NOM rather than turbidity. In a case study with five different waterworks in the United States, the applicability of the concept was recently demonstrated [22]. For two types of raw water, the following simple equation was derived between the Al dose required and the UV absorbance:
where A is UV absorption at 254 nm, given as cm−1. The empirical parameters C1 and C2 were different for the two raw water types, indicating the site-specific influence of the NOM characteristics. Meanwhile the stoichiometric ratios Al:TOC were between 0.6 and 0.65 mg/mg for both sites. This was in good agreement with results obtained by Archer and Singer [23] who evaluated data from several hundred waterworks in the United States, applying coagulation with alum and obtained mean and median stoichiometric ratios Al:TOC of 0.6 and 0.7 mg/mg, respectively.
Based on an evaluation of jar test data for 21 raw water sources coagulated with ferric salts and 39 raw waters coagulated with alum, Edwards [24] developed an empirical model for NOM coagulation where the final DOC is assumed to consist of two fractions: The non-adsorbable DOC (DOCna, not removable by coagulation) and the adsorbable DOC remaining in water after coagulation. The non-adsorbable DOC is related to the influent DOCi and its SUVAi value:
The fraction DOCa,f is dependent on pH, DOCi, DOCna, and dosage. Altogether six parameters were determined for ferric salts and alum, respectively, by regression analysis. The main purpose of the approach was to estimate NOM removal in terms of DOC and to design more detailed jar testing at a specific site.
These findings show that feed-forward dosing control can be based on online measurements of UV absorbance or TOC in raw water where NOM determines the coagulant demand. A number of suppliers offer spectrophotometers that either measure UV absorbance at a single wavelength or scan a range of the UV-VIS spectra. Some instruments are also equipped with turbidity compensation techniques. However, in each case a systematic adaption and calibration with respect to the local conditions is required.
A more comprehensive empirical description was developed by Van Leeuwen et al. [25,26], who evaluated data from jar tests and pilot plant studies with surface water from different sources in Australia. They derived correlations between raw water parameters (UV absorbance, color, DOC), removal efficiencies, and dosage requirements for two different coagulants. In addition, pH changes due to hydrolysis reactions could be predicted. The software mEnCo® (SA Water Centre for Water Management and Reuse, Mawson Lakes, SA 5095, Australia) has been used by Australian waterworks to adjust coagulant doses from 2004. Most recently mEnCo© has been applied to predict coagulant doses in a modified jar test protocol [27].
The basic concept of the Australian approach was recently applied and developed further, based on data for 13 raw water types in China [28,29]. Besides describing pH changes for four coagulants in more detail, an attempt has also been made to characterize the NOM properties by physical and chemical fractionation techniques. However, a transfer into the practical operation of waterworks has not yet been done.
A different approach was described by Xianjun et al. [30], who analyzed data from the Xining Water Treatment Plant No. 8 in China. In their case, raw water turbidity (Turb) seemed to control coagulant demand, and the following empirical equation was derived by regression analysis from more than 400 datasets covering one full year:
It was claimed that the correlation is applied for dosing control purposes by the plant now, but further data were not provided.
A new approach for feed-forward dosing control for the removal of dissolved organic matter is based on fluorescence spectroscopy. Here the organic substances are characterized by excitation-emission matrices that are analyzed by multi-way techniques, in particular parallel factor analysis (PARAFAC) [31,32]. By evaluating data from a full-scale drinking water treatment plant, Sanchez et al. [33] have demonstrated that this approach was suitable to evaluate the performance of two coagulants. Shutova et al. [10] identified a number of fluorescence parameters that were useful to characterize the properties of organic substances with respect to treatability. They derived the following empirical correlation between DOC removal and three PARAFAC components and their ratios C1, C2, and C4, respectively:
DOC removal (%) = 26.161 (C1:C2) + 3.171 (C1:C4) − 12.003
According to their analysis, fluorescence spectroscopy may be a more robust method to monitor organic substances than the use of UV absorbance or the SUVA value. Ongoing studies will show whether this approach can be applied for online dosing control in the future. For wastewater treatment plants, devices that measure ortho-P concentrations on-line are available for feed-forward dosing control. They are usually adapted empirically to the local conditions.
2.3. Feed-Backward Control Based on Dosed Water Quality
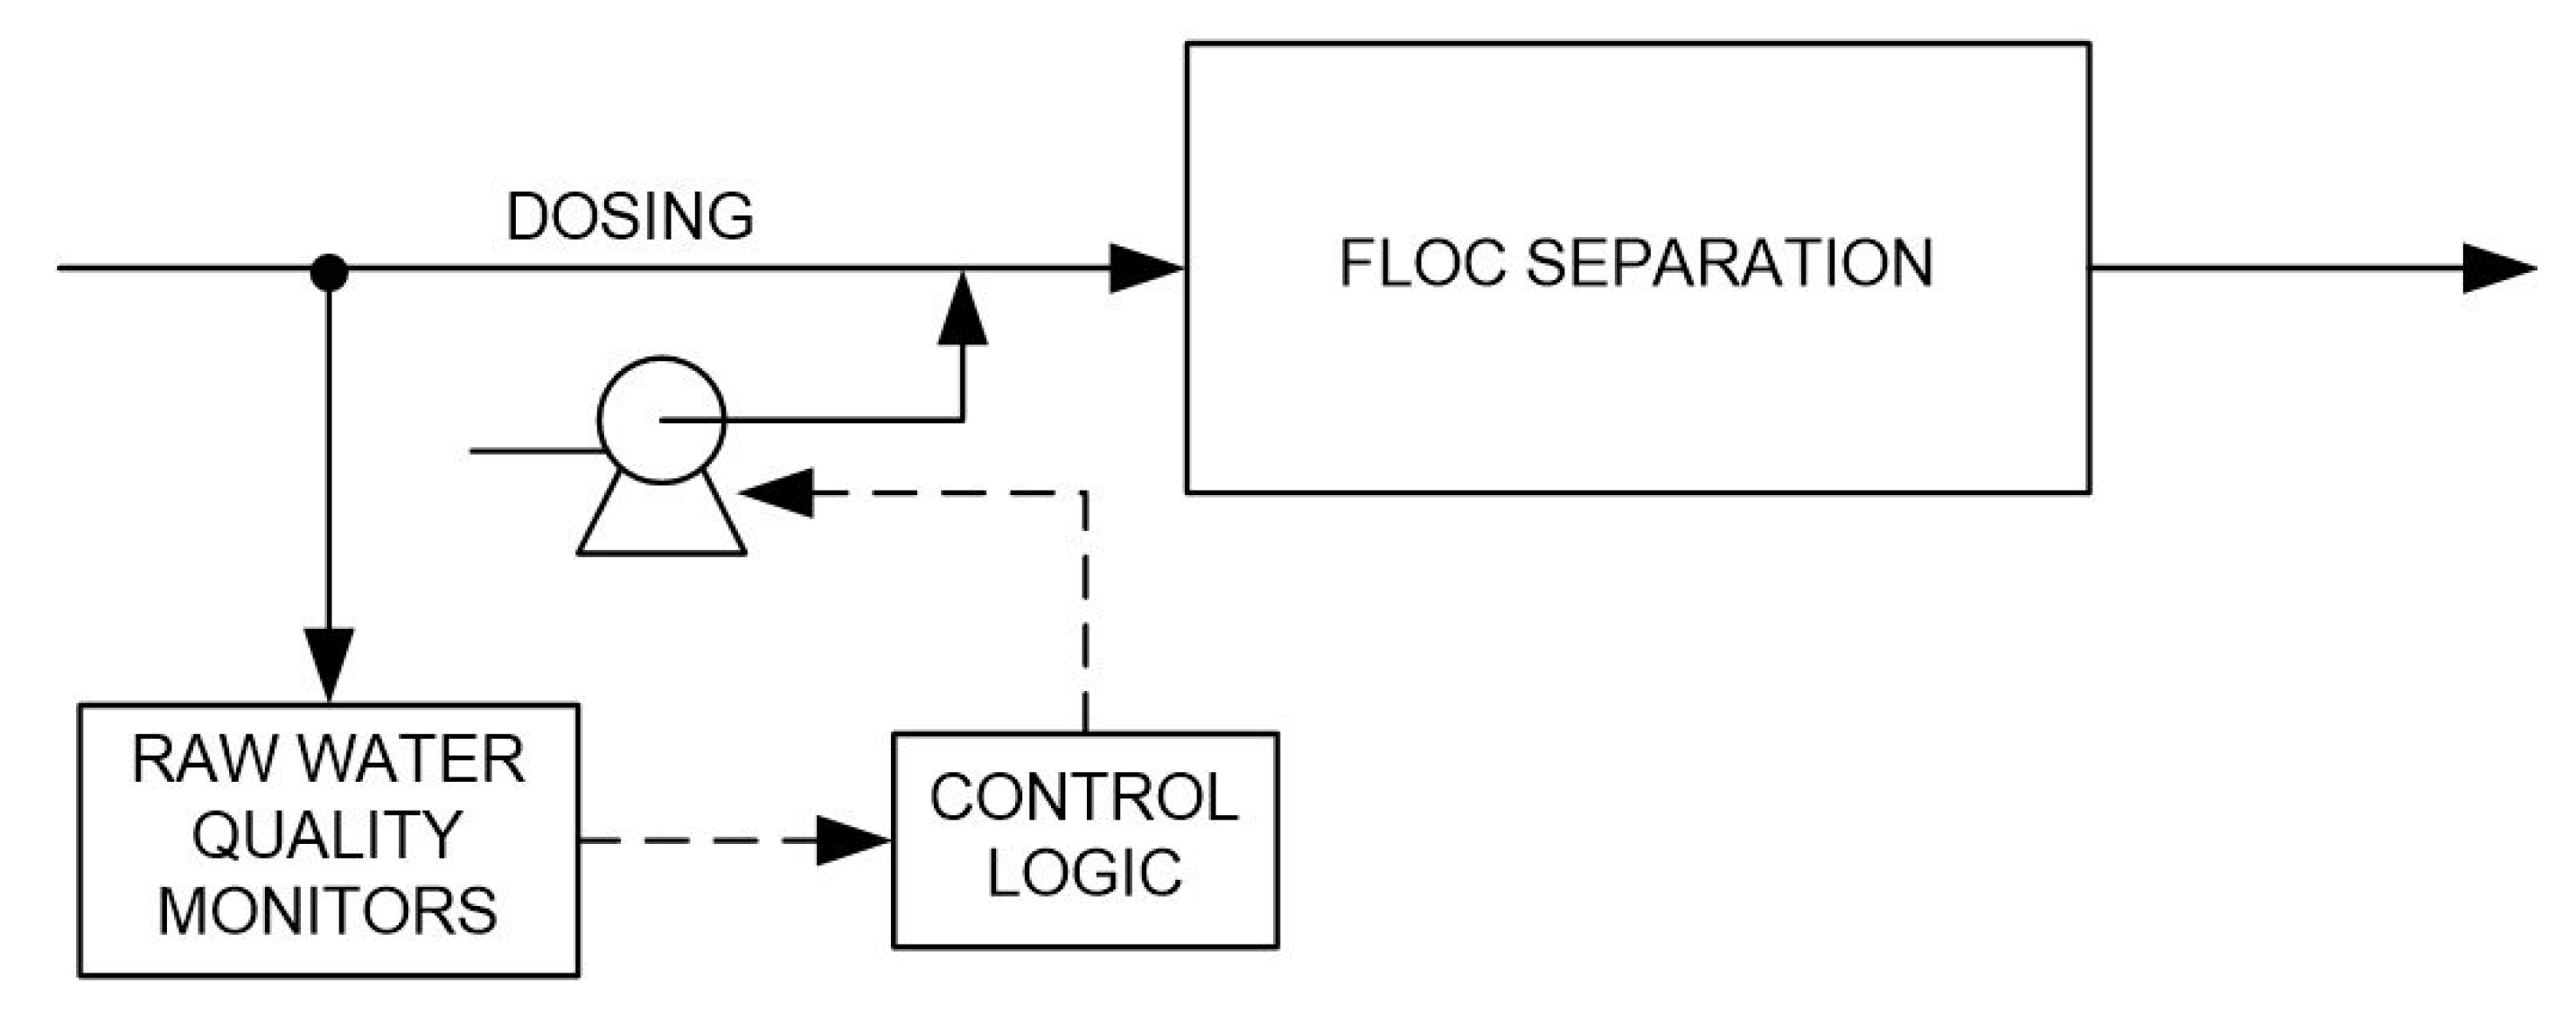
There are two different possibilities for characterizing dosed water quality: direct methods focus on the properties of destabilized particles and freshly formed flocs; indirect methods try to evaluate the effects of coagulation on subsequent separation processes (sedimentation, filtration). The principle of using directly measured parameters for feed-backward control is depicted in Figure 2.
Figure 2.
Sketch of a feed-backward control scheme based on dosed water quality.
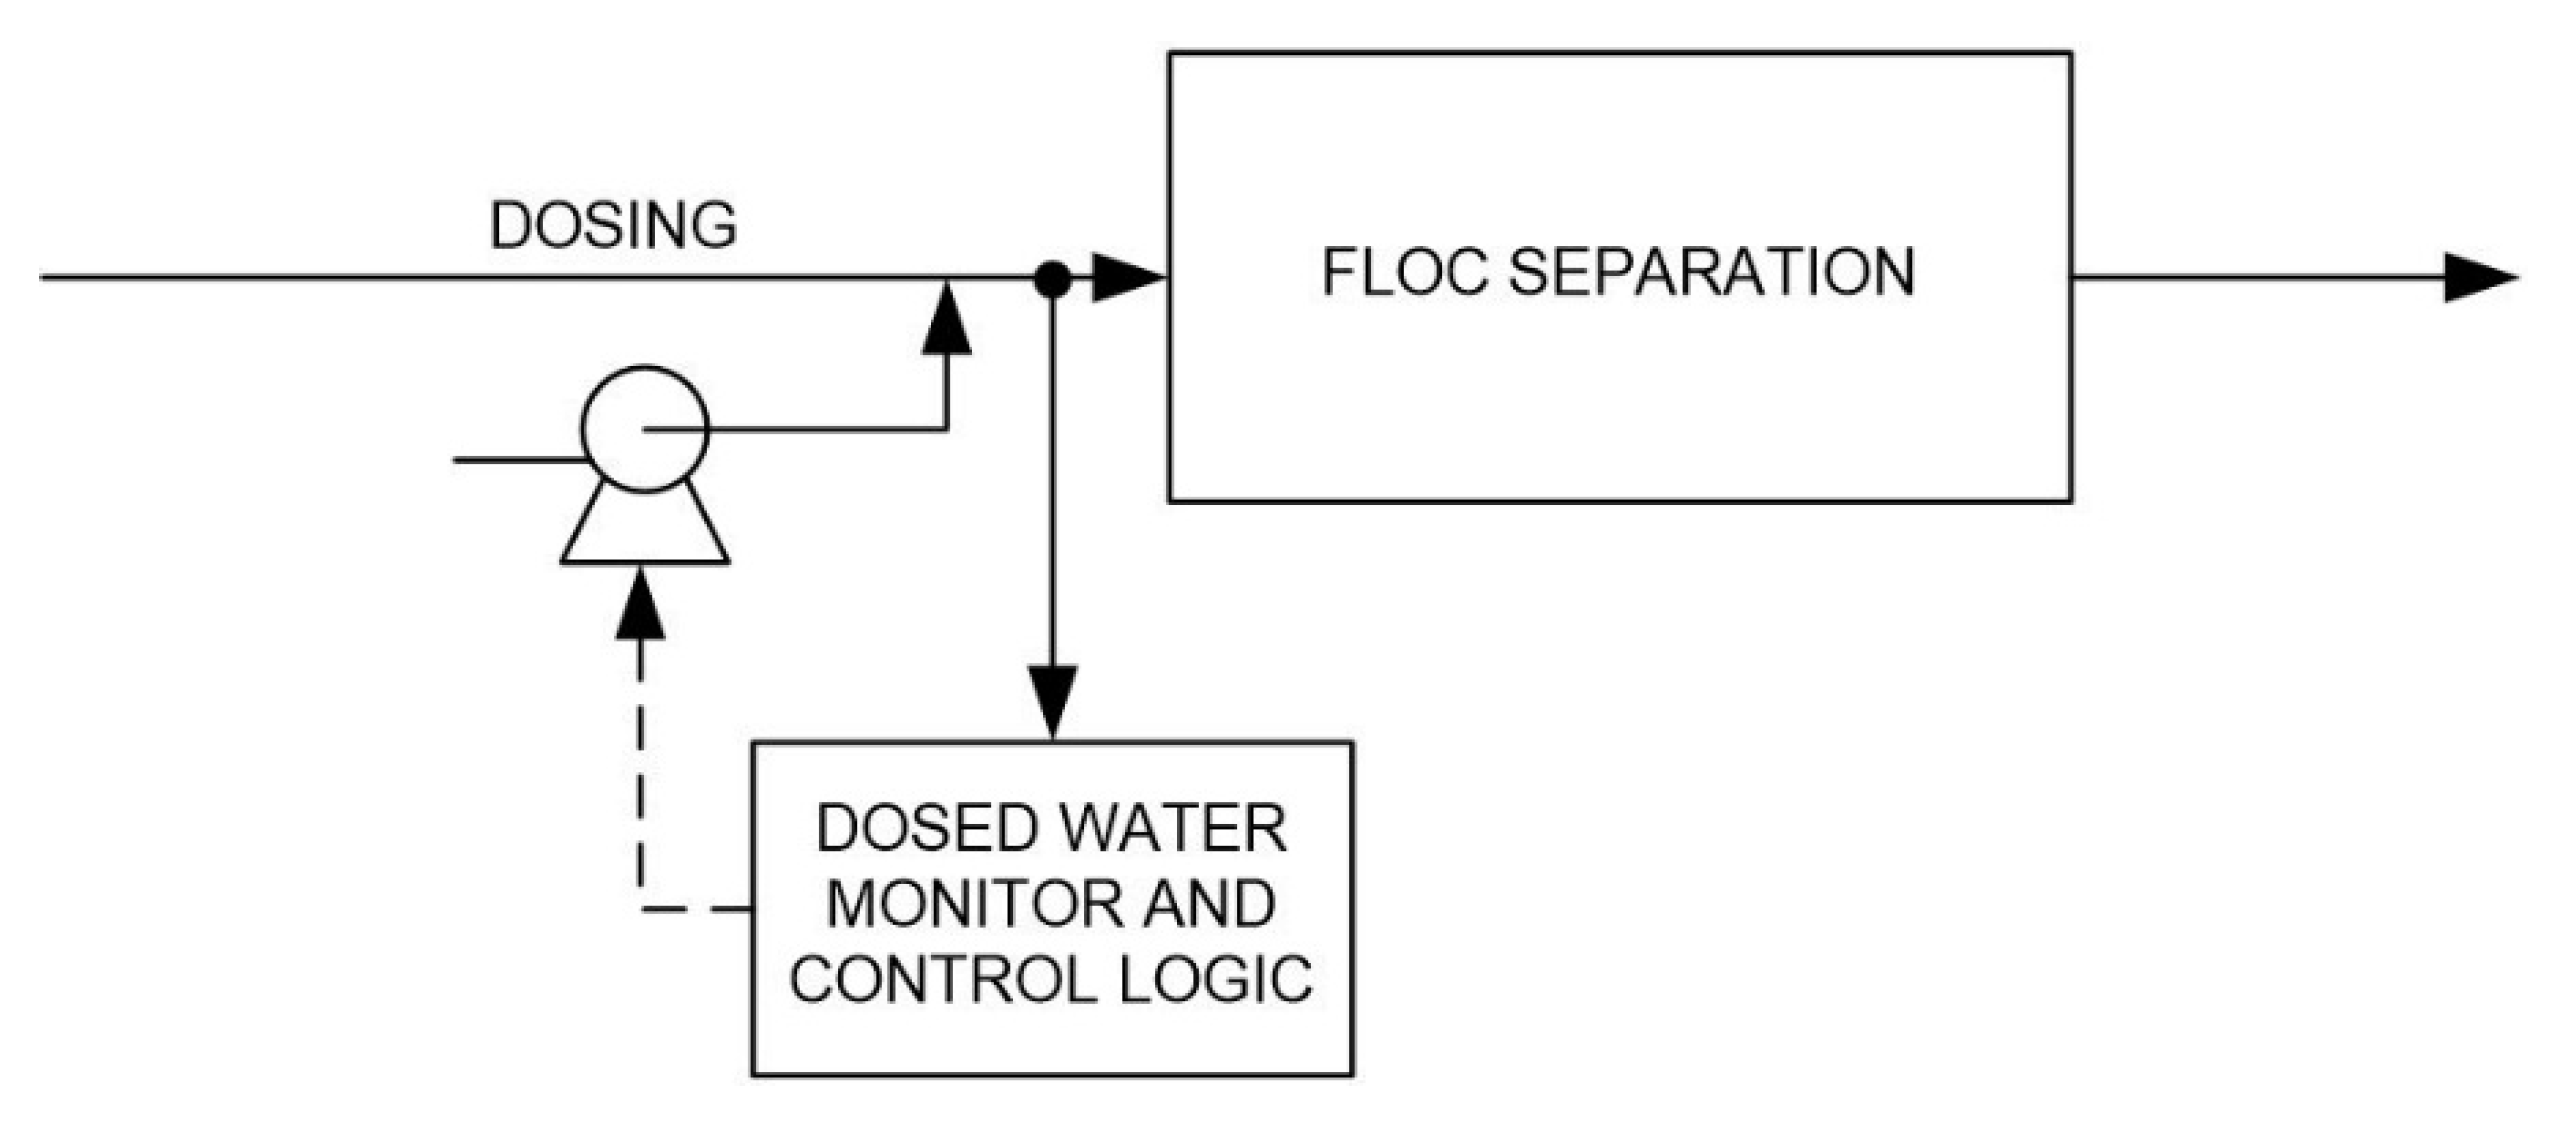
Among the direct methods, the application of streaming current detection (SCD) is most common. A critical point of streaming current monitoring is that the signal varies with pH, and that rapid fluctuations in flow or poor mixing of chemicals can lead to unstable signals [34]. In a pilot plant study, Adgar et al. [35] developed an advanced control strategy that accounts empirically for the relationship between streaming current and pH. From their data they concluded that this strategy appeared to be less susceptible to disturbances.
Yavich and de Wege [36] compared the performance of SCD and the application of feed-forward control (mainly based on UV absorbance and turbidity) in full-scale treatment of raw water from Lake Michigan. They found that the optimum SCD set point may need to be adjusted regularly, in some cases even daily, depending on the raw water conditions. Moreover, SCD may be limited when raw water turbidity changes rapidly or when NOM concentrations increase. In contrast, the feed-forward control scheme developed for the waterworks that was not operated automatically but gave real-time recommendations to the operating staff was suited to predict proper dosages for all raw water conditions.
Oh and Lee [37] determined optimum coagulant dosages for the treatment of river water by pre-coagulation and microfiltration that were defined by a maximum removal efficiency and a minimum flux decline in the membrane stage. They concluded that coagulation was dominated by charge neutralization, and that the streaming current signal monitored simultaneously could be used to indicate whether the optimum dosage was applied.
Nam et al. [38] combined a rapid titration procedure for turbid waters with SCD measurements. The results were satisfactory when poly-aluminum chloride (PAC) was used but were not conclusive with a mixture of PAC and a cationic polymer (poly-DADMAC). The authors claimed that their technique could be used to replace jar testing for the determination of the optimum coagulant dosage; however, further development of an online tool was not discussed.
The application of SCD for feed-backward control of polymer dosing for the conditioning of alum sludge from a waterworks in Korea was investigated by Byun et al. [39]. In a pilot-plant study they showed that there was a linear relationship between SCD readings and zeta potential measurements after dosage where the zero points were not identical, and that SCD could be successfully used for online dosing control.
Streaming current detectors are available from a number of suppliers. It should be noted that no standard calibration procedures have been developed so far [5]. In each application a proper set-point of the instrument has to be determined that should be compared frequently to jar test results or plant performance.
Online sensors that are directed towards the size and shape of the aggregates formed in the flocculation stage are mainly applied in research; they are not in practice so far. A commercially available instrument is the photometric dispersion analyzer (PDA) that measures turbidity and turbidity fluctuations after coagulant addition via a fiber-optical monitor. The principle developed by Gregory and Nelson [40] relies on the determination of a flocculation index derived from the mean turbidity value and its fluctuation that indicates optimum coagulation conditions. The applicability has been proven in several jar test studies, e.g., in order to compare different coagulants [41,42], to optimize new coagulants [43], and to evaluate the impact of turbulent heterogeneity during flocculation [44]. As shown by Huang and Liu [45], the PDA analyzer is also suited to adjust dosing to inflow turbidities varying between 20 and 2000 NTU. However, there does not seem to be a technical application of the instrument to online dosing control so far.
A somewhat similar approach was described by Cheng et al. [46,47], who evaluated turbidity data measured continuously 3 cm below the water surface during the slow mixing stage in jar tests. They observed that there was a linear relationship between the square root of the average floc diameter and the standard deviation of the measured turbidity fluctuations. The technique, called nephelometric turbidimeter monitoring system (NTMS), is supposed to determine optimum operational parameters for coagulation/flocculation. This was recently demonstrated at a full-scale drinking water treatment plant in Taiwan [48], but a combination with an online control system is not developed yet.
Sangu et al. [49,50] described an automatic coagulant dosage control method that relies on the measurement of residual aluminum concentrations in the rapid mixing stage. The technique should be especially applicable for rapid changes of raw water turbidity. It might be questioned, however, whether in this case coagulation pH is not the determining parameter that is indirectly measured via residual aluminum under sweep floc conditions.
With some limitations, particle size analysis can be used for floc characterization. Especially small-angle light scattering instruments have shown some potential; however, for low-density flocs the effective size might be underestimated [12]. Nevertheless, there have been several applications of particle size analyzers that have contributed to a better understanding of the kinetics of flocculation processes [51,52]. From the measured data, not only mean floc diameters can be derived but also their fractal dimensions.
By using high-resolution photographic techniques it is possible to analyze floc images in situ. Jin [53] investigated the effect of temperature and dosage on floc growth and floc size in the mixing phase of jar test experiments. Yu et al. [54] determined the size and fractal dimensions of aggregates during the settling period in batch tests and demonstrated the influence of dosage on these parameters. Lin et al. [51] published data obtained by floc image analysis via wet scanning electron microscopy. Their results confirmed that there is a distinct effect of dosage on floc size. Raspati et al. [55] investigated the influence of two coagulants under different mixing conditions on the fractal dimensions of flocs formed via in-line coagulation of NOM prior to microfiltration. They concluded that these floc parameters could be helpful in membrane fouling elucidation.
Another property of flocs that is closely related to their structure is the strength, i.e., the resistance to external stress. As described in detail by Jarvis et al. [56], there are several established techniques to determine floc strength.
However, because of the costs of the equipment and the qualified manpower needed to operate it, an application of these advanced floc characterization methods for real-time dosing control will be difficult. There is only one sensing device available that detects the status of coagulated flocs using laser scattering light on a real-time basis where the output is used for dosing control [57]. Another concept using online techniques for image analysis has been reported [58], though success of such a method will be strongly dependent on the availability of robust and reliable tools.
In recent years indirect methods for optimizing coagulation and flocculation that are related to the floc separation step seem to have gained more interest. Tse et al. [59] developed a flocculation residual turbidity analyzer (FReTA) that monitors the turbidity of floc suspensions undergoing quiescent settling and records the residual turbidity. From the data, the sedimentation velocity distribution characterized by the mean value and the variance can be determined. The technique could theoretically be used for feed-backward control but has not been applied for that purpose so far.
Blankert et al. [60] studied the combination of in-line coagulation and ultrafiltration with raw water from a Dutch river on a pilot scale. They found a correlation between the coagulant dosage and the initial resistance of the last dead-end filtration before the chemical cleaning phase that could be used for feed-backward control. This approach has recently been applied at a technical scale, resulting in up to 75% coagulant savings [61].
Wei et al. [62] reported successful full-scale applications of feed-backward coagulant dosing control for drinking water plants, mainly based on raw water qualities, but also supplemented with pH after dosing. Manamperuma et al. [63] have reported the successful application of the same concept with coagulated pH after dosing in wastewater treatment.
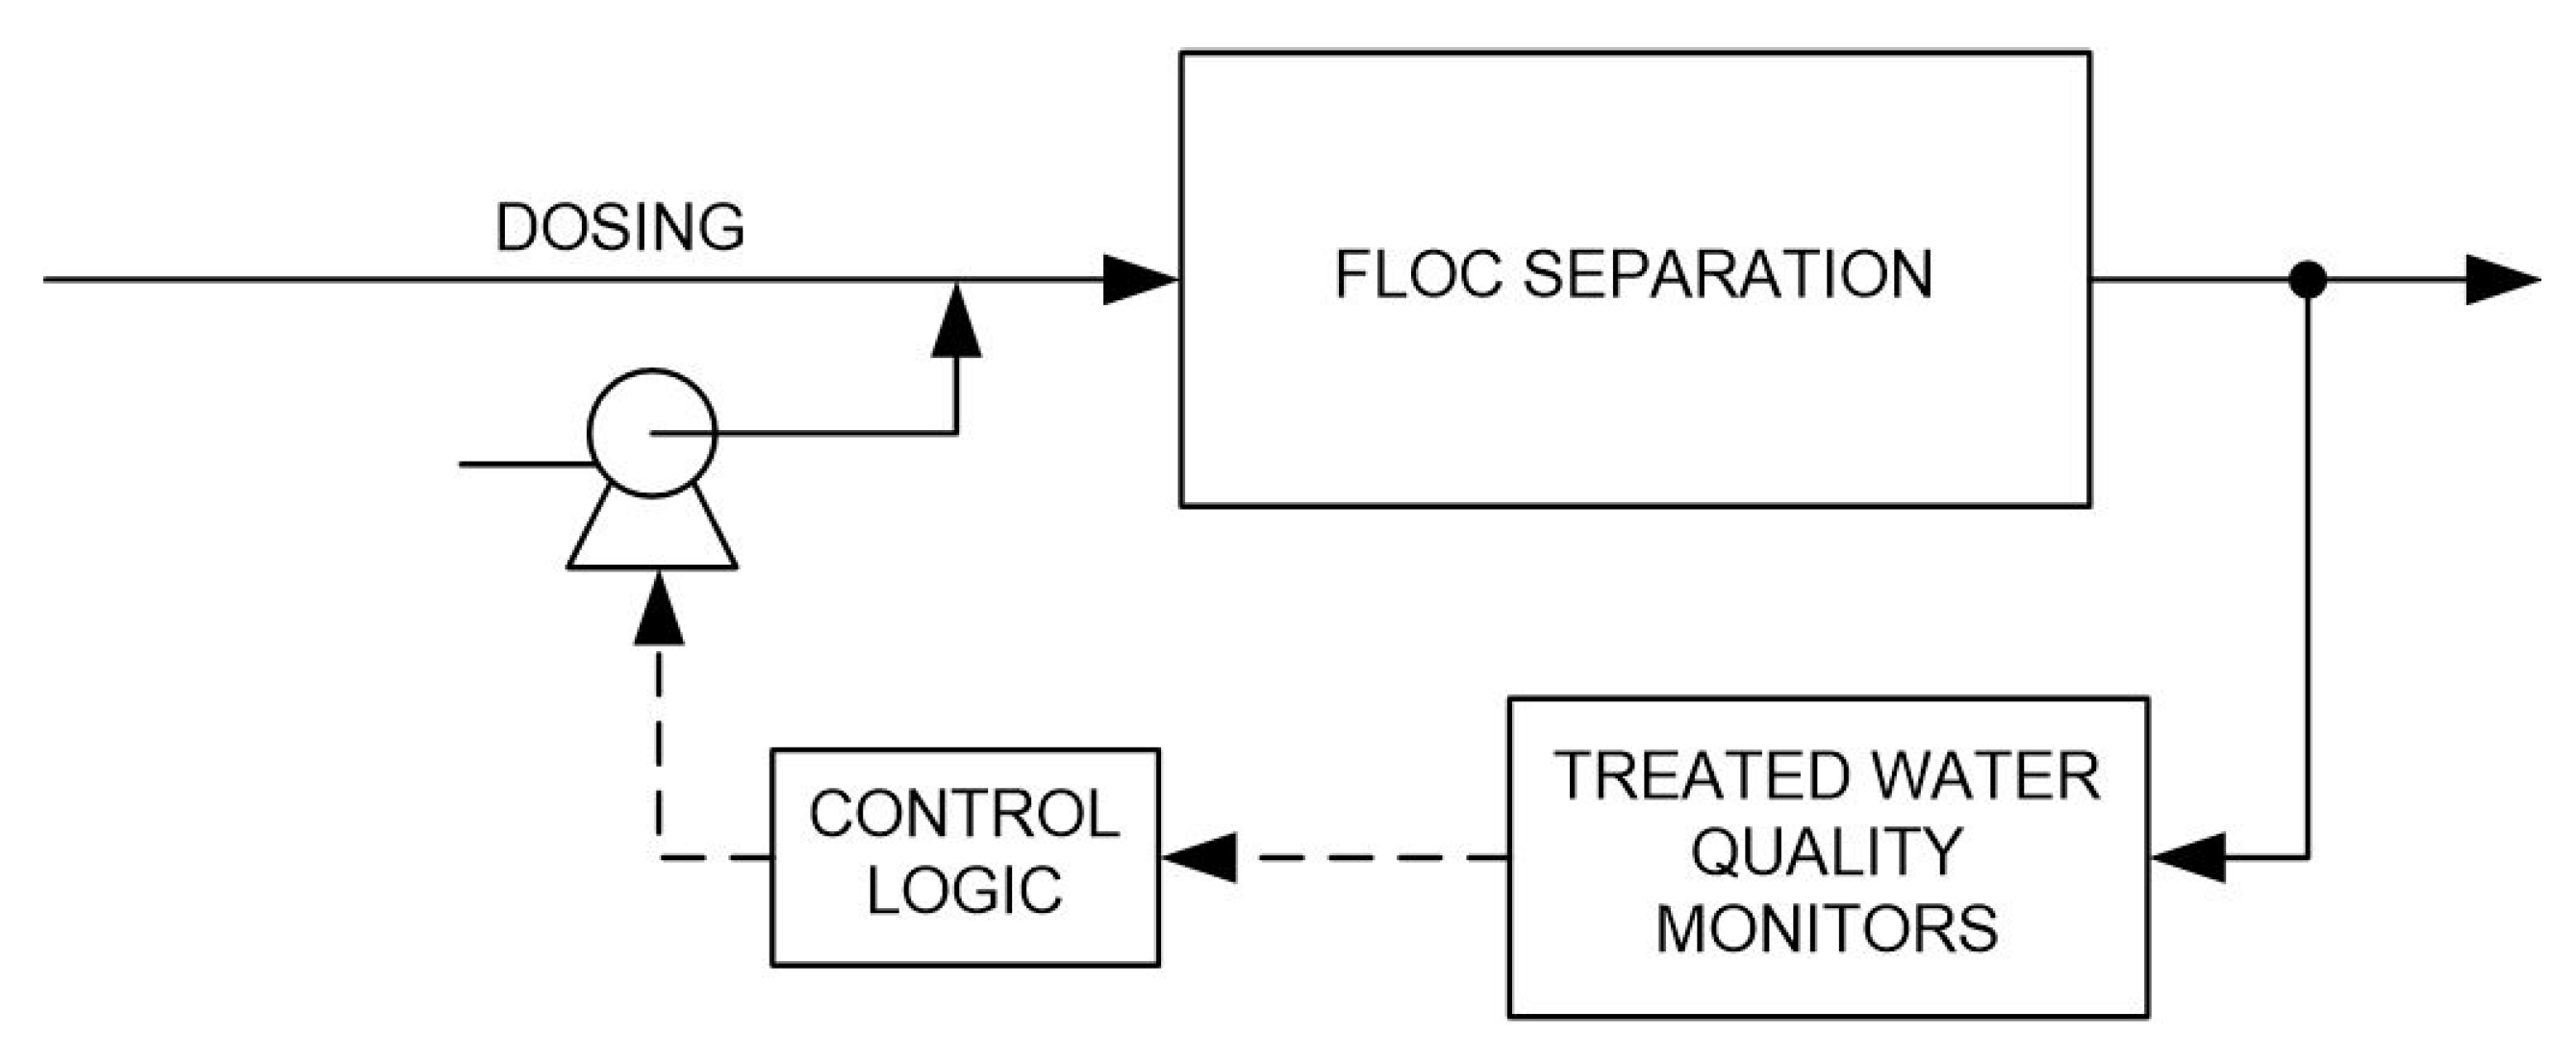
2.4. Feed-Backward Control Based on Finished Water Quality
Although final water quality is the dominant criterion for optimum coagulation, there are very few approaches that use finished water parameters for real-time control purposes. One reason might be the time lag between dosing and effluent from the separation stage, on the order of at least 30 min for direct filtration and some hours for conventional settling stages. In this respect, ballasted flocculation like the Actiflo® (Veolia Water Technologies, Saint Maurice, France) process or in-line coagulation followed by membrane filtration have clear advantages. Figure 3 shows the principle of this type of feed-backward control.
Figure 3.
Sketch of a feed-backward control scheme based on finished water quality.

In drinking water treatment, finished water quality is closely monitored as required by the respective guidelines. The data are normally used to adjust coagulant dosage manually by the operating staff based on empirical knowledge [5]. Although software tools have been developed that predict both dosages and finished water quality based on feed-forward control techniques [27,37], automatic processing of finished water parameters for direct feed-backward control has not yet been realized. For raw water sources with quality variations observed only after weeks or months, for example Scandinavian lakes, feed-backward control of finished water quality could be employed though many plants actually do not see the real need for online dosing control.
With respect to wastewater, the direct use of finished water data for dosing control is not common either. Although many municipal treatment plants measure particles and ortho-P concentrations in the effluent, this information is not used for automatic dosing control purposes in a feed-backward control scheme [64].
In a recent study, Tik and Vanrolleghem [65] have proposed a control scheme for a full-scale chemically enhanced primary clarifier that uses a turbidity sensor at the effluent. While the coagulation/flocculation process is described on the basis of jar tests, a layer approach is used to model the clarifier. According to their observations so far, jar tests tend to overestimate suspended solids removal, that is, the control scheme has to be adapted accordingly.
3. Indirect Use of Online Parameters for Dosing Control
3.1. Development of Software Sensors for Dosing Control
In recent years data from jar tests, pilot-plant tests, and/or full-scale operation have been evaluated by means of advanced mathematical tools in a number of studies in order to derive relationships between several input and one or several output parameters. The resulting correlations were usually called models although they are not built on a physical understanding of the processes but rather on a mathematical analysis of existing data. There are basically three different approaches:
- Multivariate regression analysis;
- Artificial neural network models (ANN);
- Fuzzy logic models.
Their common feature is that long time series of water quality data as well as of operational parameters should be available for model calibration and verification. Afterwards the models can be used in combination with appropriate physical sensors for dosing control tasks as so-called software sensors or virtual sensors. In the following sections recent developments as well as their potential applications are described. However, a common feature of these approaches is that they usually require a broad database regarding water- and process-related parameters, and extensive data evaluation. Therefore, the application of the models in practice is still very limited.
3.2. Multivariate Regression Analysis
AlGhazzawi and Lennox [66] have given a comprehensive overview of the use of multivariate statistical process control methods, namely principal component analysis (PCA) and partial least squares (PLS). They developed a model predictive control condition monitoring tool that enables users to detect abnormal controller operation and resolve abnormalities when necessary, but they also point out that process knowledge and experience are necessary to analyze model predictive control or process abnormalities correctly.
A thorough analysis of jar test data obtained with synthetic raw water containing both particles and NOM that was coagulated with alum was conducted by Franceschi et al. [67]. Eight water quality parameters—type of particles, initial turbidity, initial UV absorbance, temperature, pH, conductivity, calcium concentration, and sulfate concentration—were accounted for. A two-level fractional factorial design method was applied in order to determine the importance of each parameter on the minimum dosage required and the residual turbidity after settling. They found that there was an antagonistic influence of the different input parameters on the two responses studied (dosage minimization and residual turbidity), so it was not possible to simultaneously optimize the process with respect to both. When applied to data from a water treatment plant in France, the results were in good agreement except for conditions when the raw water had a low concentration of organic matter. However, an online dosing control tool was not developed based on this approach.
Trinh and Kang [68] conducted jar tests with water from the Nakdong River in Korea and used the response surface methodology to determine optimum conditions. They applied a quadratic model in order to describe the relationship between coagulant dosage and pH as input parameters and turbidity and DOC removal, respectively, as responses. The coefficients were determined by multiple linear regression analysis. According to the results, there was only a small pH-dosage range where the removal of both turbidity and DOC was optimal, whereas the optimum ranges for only one of the parameters were much broader. The modeling approach was validated with data obtained in independent tests but not developed further to an online control tool.
Juntunen [69,70] used laboratory and full-scale data from treatment of lake water in Finland in order to apply both multiple linear regression analysis and a neural network multilayer perceptron model with five neurons by forward selection and backward propagation. The input water quality parameters were permanganate index, color, pH, hardness, turbidity, conductivity, and silicate concentration. Flow rate, coagulant dosage, coagulation pH, and temperature were the most important process variables accounted for. The aim was to predict final turbidity and residual aluminum concentrations. The results showed that both models could be used for this purpose. Although the goodness of the nonlinear model was slightly better than that of the linear one, it was concluded that the linear model was more suitable for applications that require explicit correlations or fast calculations, as is the case with adaptive soft sensors.
Ratnaweera et al. [71,72] described a novel concept for dosage control in mechanical-chemical wastewater treatment plants in Norway. They used technical-scale data and applied partial least square regression analysis in order to relate coagulant dosage to the input parameters flow rate, temperature, pH, conductivity, turbidity, ortho-P, the process parameter settling time, and the effluent parameter turbidity. The first results were promising, and an online control tool called DOSCON® (DOSCON AS, Oslo, Norway) was developed in subsequent studies. The concept was documented after several years of full-scale verifications that have enabled a reduction of coagulant consumption by over 30% compared with flow proportional dosing [63].
Simulating the behavior of storm water using synthetic water containing both turbidity and NOM, Annadurai et al. [73] applied the response surface methodology to determine optimum conditions from jar tests. They used a quadratic polynomial equation to relate the input parameters pH, turbidity, UV absorbance, and alkalinity as well as the process variable dosage to residual turbidity and final UV absorbance, respectively, as responses. The coefficients were determined by multiple regression analysis. The proposed strategy was successfully applied to predict the dosage for the treatment of storm water extremely high in turbidity (1650 NTU).
In a similar approach, Ghafari et al. [74] also used the response surface methodology in order to evaluate data from the coagulation of landfill leachate with poly-aluminum chloride and alum, but with different parameters. Here, only pH and dosage were defined as input data while COD removal, turbidity removal, color removal, and TSS removal were the response parameters. The coefficients of the quadratic polynomial equations were determined by multiple regression analysis. This type of data evaluation was later applied to leachate treatment by coagulation with iron chloride and floc separation by dissolved air flotation [75] where pressure, flow rate, and injection time (proportional to the gas-to-liquid ratio) in the flotation unit were used as additional input data. The method was suited to identify the significance of different parameters and to optimize removal efficiencies.
Guida et al. [76] studied the coagulation behavior of real wastewater from five municipal plants in Italy in a series of jar tests. The data were evaluated by applying different statistical tools in order to determine whether there were any correlations between the parameters. While COD removal was significantly dependent on the origin of the wastewater as well as on influent COD, influent TSS concentration, pH, and alum dose, TSS removal was only affected by the latter factors (influent TSS concentration, pH, and dosage). The findings were not used further for online control purposes.
3.3. Artificial Neural Network Models (ANN)
A neural network is a nonlinear regression technique that provides a predictive tool by learning to recognize patterns in historical data. Depending on the architecture of the model, the following types are distinguished: multilayer perceptron (MLP) model, time delay neural network (TDNN), and radial basis function (RBF) neural network. A comprehensive overview of their applications in different fields has been given by Paliwal and Kumar [77], who further put an emphasis on the comparison of ANN and statistical techniques for the prediction of dynamic processes. In recent years, ANN models have also shown their capability to be used as software sensors for several water quality parameters in wastewater treatment plants [78].
Zhang and Stanley [79] and Baxter et al. [80,81] developed and validated a process control system based on an ANN model for NOM removal by enhanced coagulation in a waterworks in Edmonton, Canada. According to their results, this type of dosing control technique is feasible, and it can help to realize cost savings in water treatment. Valentin and Denoeux [82] and Bloch and Denoeux [83] described in detail the building of MLP and RBF neural network models and applied the first one to a coagulation stage in France where river water is treated. Data obtained from jar tests covering a period of one year were used with turbidity, conductivity, pH, temperature, dissolved oxygen, and UV absorbance of the raw water being the input variables and optimum coagulant dosage the output parameter. A total of 1600 datasets were available for building and validating the model. After its implementation for process control, a significant savings in coagulant usage was obtained.
In a comparative study of different modeling approaches, Yu et al. [84] used raw water pH, conductivity, and turbidity as well as settled water turbidity from a waterworks in Taiwan as input variables and coagulant dosage as the output parameter in order to build the respective models. They found that their ANN model gave better predictions than regression or time series methods. Joo et al. [85] emphasized that the accumulated operating data used in ANN training may have some corrupt and noisy data records. They developed a data pre-processing method to prepare the training and test datasets that can help to improve the reliability of ANN models derived from the data.
Maier et al. [86] analyzed data from jar tests with Australian water sources and built a MLP neural network model based on two different simulation tools. The first one used the raw water parameters pH, turbidity, color, UV absorbance, DOC, and alkalinity, and, in addition, the alum dose in order to predict residual values for turbidity, color, and UV absorbance. The second tool used the same raw water parameters and, further, the desired treated water quality (turbidity, color, and UV absorbance) for the prediction of optimal dosage, final pH, and residual aluminum concentration. However, the authors point out that further testing was required before the tools could be deployed for real-time control purposes at full-scale water treatment plants.
Using data from full-scale operation of a waterworks in China, Zhang and Luo [87] built a MLP neural network model with raw water temperature, pH, and turbidity as input parameters and coagulant dosage as well as the streaming current signal as model output. Applying their system the treatment plant could achieve significant coagulant savings. A similar approach was described by Lamrini et al. [88] for a large drinking water treatment plant in Morocco. In this case, the input parameters were temperature, pH, conductivity, dissolved oxygen, and turbidity or TSS, respectively. A data series covering four years of operation was used for building the model. The software sensor was intended to be applied subsequently as an online tool by the treatment plant. The same ANN model was the basis for a concept where the information generated was integrated into plant operation as an input to a diagnosis system [89].
Wu and Lo [90] used data from full-scale treatment of surface water in Taiwan for building a MLP neural network model and an adaptive network-based fuzzy inference system (ANFIS). Temperature, pH, turbidity, and color of both raw and treated water were fed into the models as input variables, and the dosage of poly-aluminum chloride was the output parameter. The ANFIS model gave slightly better predictions than the ANN model and was recommended to be applied by operators for assisting in dosing control. In a later study the same authors [91] developed another method to build an improved ANN model that had better predictive capabilities.
The approach of Maier et al. [86] was recently applied to water treatment plant data in Bhopal, India [92]. Using the raw water parameters pH, turbidity, TSS, conductivity, and dissolved oxygen as well as the conductivity and turbidity of settled water as inputs, a MLP neural network model was built that gave satisfactory predictions of the alum dose required. Meanwhile Kumar et al. [93] found that an ANFIS model provided better results when trained with jar test data and applied to pilot plant operation, compared with an ANN model. Therefore, the first model was implemented for real-time dosing control.
In a pilot study looking at the removal of BOD, nitrogen, and phosphorus in municipal wastewater treatment, Dellana and West [94] have compared linear autoregressive integrated moving average (ARIMA) models and a TDNN model. They found that the neural network model was more accurate for single period and multi-period predictions of their real-world data, while for artificially generated sets of data the ARIMA models were sometimes superior to the TDNN approach. Their main conclusion was that one should carefully consider the nature and intended use of water quality data if choosing between neural networks and other statistical methods.
Zheng et al. [95] conducted jar tests with domestic wastewater and polymeric phosphate-aluminum chloride as a coagulant. Based on the results, a RBF neural network model was built with initial pH, coagulant dosage, P/Al ratio, and agitation speed as input parameters and COD removal as output. Furthermore, the flocs were analyzed by a photographic image technique. As a main result, the ANN could predict the coagulation efficiency only to some extent, probably because the number of experimental data points was too small. It is, however, questionable whether the selection of the input parameters was optimal here because the raw water load was not directly accounted for.
3.4. Fuzzy Logic Models
During the past 30 years fuzzy controllers have found a wide range of applications in technical processes. They rely on the idea of using real-time data as an input and a set of logic rules (if-then rules) to generate an output signal that keeps the parameters as close as possible to the predefined set-point.
Liu and Wu [96] conducted jar tests and continuous bench-scale experiments with synthetic raw water and ferric chloride as coagulant. They applied a fuzzy logic feed-backward control system with streaming current (set point −0.05) and pH (set point 8.0) as input, and coagulant dose as well as base dose as output parameters. As a result, the initial turbidity of 110 NTU in the raw water could be steadily reduced to less than 10 NTU after coagulation and sedimentation. There are no references on a full scale application of their approach.
Ratnaweera et al. [97] have demonstrated the capability of fuzzy logic in water treatment to manage raw water with qualities that vary in time and concentration. The concept was based on a feed-forward system and successfully treated raw water with color up to 225 mg-Pt/L and turbidities up to 16 NTU to below 7 mg-Pt/L and 0.1 NTU, respectively. No full-scale applications were reported after repeated tests on continuous pilot-scale demonstrations.
Chen and Hou [98] developed a feed-forward control system with a fuzzy feed-backward component for a drinking water treatment plant in Taiwan. The model was based on full-scale data collected over a period of four years, and pH as well as turbidity in settled water was used to establish the fuzzy control rules. The effectiveness of the proposed strategy was successfully demonstrated in several field tests.
Heddam et al. [99] choose two different approaches to build an adaptive neuro-fuzzy inference system (ANFIS): the first one was grid partition-based; the second was subtractive clustering-based. ANFIS is a multilayer feed-forward network where adaptive learning parameters are used to achieve optimal output data. The main difference between the two approaches used was the determination of the optimum number and form of fuzzy rules, resulting in 729 rules for the grid partition-based model and only 15 rules for the subtractive clustering-based model. The raw water parameters temperature, pH, conductivity, turbidity, UV absorbance, and dissolved oxygen were the input variables, and alum dosage was the output parameter. A total of 725 datasets collected at the Boudouaou drinking water treatment plant in Algeria were used to build, validate, and test the models. It was found that the subtractive clustering-based model outperformed the other one due to its simplicity in parameter selection and a more accurate and reliable prediction of the optimal coagulant dosage.
Studying the coagulation of paper-mill wastewater with poly-aluminum chloride in China, Wan et al. [100] developed an integral neural-fuzzy process controller. They fed flow rate, raw water COD, and coagulant dosage data into the model and defined effluent COD as the output parameter. Altogether, 100 datasets were available for model development and testing. The performance of the new process controller was compared with the results obtained with a simple feed-backward controller based on effluent COD data. It was shown that almost 25% of chemicals could be saved by applying the advanced control scheme.
4. Practical Applications
Some control strategies that have been described above are implemented in large-scale treatment plants all over the world. However, little has been published on the experiences and drawbacks obtained with their long-term application both in drinking water and wastewater treatment.
Kramer and Horger [101] described their experiences when applying a streaming current monitor to optimize coagulant dosages in Philadelphia’s largest drinking water plant. According to their results, the instrument is useful when coagulation pH is below 7.0 as long as it is located, maintained, and calibrated properly. At pH ≥ 7.0, however, it was not applicable.
Yorkshire Water in the United Kingdom has equipped its water treatment plants with feed-forward dosing control based on flow rate and UV absorbance [102]. The authors reported that 1500 t of coagulant could be saved during the first year after the control system was put into operation, and that the need for manual intervention was reduced.
In South Africa, Rand Water developed an ANN model for the Zuikerbosch water treatment plant [103]. The model was able to correctly predict the dosages applied during a period where raw water quality spikes were experienced. The authors emphasize that it was necessary to train the model with good operational data.
In Australia the software mEnCo© [26] is recommended to water treatment plants in order to predict coagulant doses, pH control reagents, and residual DOC in treated water. According to the Cooperative Research Centre for Water Quality and Treatment [104], this tool is applied by several water utilities, but further data have not been published so far.
In several large wastewater treatment plants in the German Ruhr area where an effluent concentration for total-P of less than 1 mg/L is to be reached, simultaneous precipitation with iron salts is used to supplement biological phosphorous removal [105]. In six plants ortho-P is measured between the activated sludge stage and the secondary clarifier (dosed water quality) in order to control coagulant dosage, and in two plants this parameter is measured in the effluent from the settling stage (finished water quality). This method is considered reliable and sufficiently precise.
In Norway and China, several wastewater treatment plants now use the DOSCON® control strategy in their coagulation stages. The Nedre Romerike WWTP in Norway has used the model since 2009 [62], while several drinking water plants in Haining, China have reported successful full-scale applications [62].
5. Research Needs
There is still no universally accepted mathematical description for water and wastewater coagulation. Thus it was very desirable that research groups from different countries make further effort in this respect. An important aspect of the work must be to obtain an improved understanding of the relationship between water quality data and the basic chemical and physical processes of coagulation. The increasing use of online water quality monitoring produces a vast amount of operational data that should be useful in this process. Moreover, appropriate physical sensors should be developed that could be used to account for variations of the raw water parameters in the respective control schemes. Regarding future control strategies, it could be interesting to focus not only on feed-forward and feed-backward techniques but also study combinations of them.
Many attempts have been made so far to design software sensors. However, their application still seems to be limited because they have often been based on pilot-scale data only. Here, more experiences are needed from technical-scale applications over longer periods of operation. Although this might be a time-consuming task in the beginning, water supply utilities should use some resources to support this type of work in order to have new tools available that can help them to improve plant operation and reduce costs in the long run.
6. Conclusions
A number of physical sensors are available for online monitoring of water quality data used in forward and feed-backward control strategies. Besides flow rate and pH, the parameters turbidity and UV absorbance are most common in drinking water treatment, while ortho-P is often used as an additional parameter in wastewater coagulation.
There have been several attempts to model the floc formation process. However, in the foreseeable future no applicable tool for real-time process control is likely to be developed.
Mathematical analyses of jar test and/or process data have led to the design of so-called software sensors. These are based either on a multivariate regression analysis, on artificial neural network models or on fuzzy logic models. While the latter has not been applied very often, probably because of time constraints, there are a number of successful applications of the other two approaches.
Both for the use of physical sensors in appropriate control schemes and the use of software sensors, it has been demonstrated that an improved stability of the coagulation process can be reached. In addition, savings of chemicals on the order of several tens of percentage points might be possible, which will also reflect in the sludge management costs. Therefore it is desirable that studies are conducted on the improvement of physical sensors as well as on further development of software sensors and their implementation in the future.
Acknowledgments
The paper was prepared during a sabbatical term of one of the authors. The funding from both universities is gratefully acknowledged.
Conflicts of Interest
The authors declare no conflict of interest.
References
- Ratnaweera, H. Phosphorus recovery from wastewater—Should we rebuild our wastewater treatment plants? VANN 2013, 04, 551–556. (In Norwegian) [Google Scholar]
- Dhiman, R. Speciality Chemicals for Water Treatment: The Global Market; Report No. CHM050A; BCC Research: Wellesley, MA, USA, 2008; p. 101. [Google Scholar]
- Hagmeyer, G.; Gimbel, R.; Kiepke, O.; Dautzenberg, W. Flocculation/Ultrafiltration for drinking water treatment of reservoir water. In Proceedings of the AWWA Membrane Technology Conference, San Antonio, TX, USA, 4–7 March 2001. [CD-ROM].
- Amirtharajah, A.; Mills, K.M. Rapid-mix design for mechanisms of alum coagulation. J. Am. Water Works Assoc. 1982, 74, 210–216. [Google Scholar]
- American Water Works Association (AWWA). Operational Control of Coagulation and Filtration Processes. In Manual of Water Supply Practices M37, 3rd ed.; AWWA: Denver, CO, USA, 2011. [Google Scholar]
- TeKippe, R.J.; Ham, R.K. Coagulation Testing: A Comparison of Techniques, Part I. J. AWWA 1970, 62, 594–602. [Google Scholar]
- TeKippe, R.J.; Ham, R.K. Coagulation Testing: A Comparison of Techniques, Part II. J. AWWA 1970, 62, 620–628. [Google Scholar]
- Dentel, S.K. Coagulation Control in Water Treatment. Crit. Rev. Environ. Control 1991, 21, 41–135. [Google Scholar] [CrossRef]
- Ratnaweera, H. Coagulant Dosing Control—A Review. In Chemical Water and Wastewater Treatment VIII; Hahn, H.H., Hoffmann, E., Ødegaard, H., Eds.; IWA Publishing: London, UK, 2004; pp. 10–18. [Google Scholar]
- Shutova, Y.; Baker, A.; Bridgeman, J.; Henderson, R.K. Spectroscopic characterisation of dissolved organic matter changes in drinking water treatment: From PARAFAC analysis to online monitoring wavelengths. Water Res. 2014, 54, 159–169. [Google Scholar] [CrossRef] [PubMed]
- Bernhardt, H.; Schell, H. Experience in coagulant control by use of a charge titration unit. J. Water Supply Res. Technol. Aqua 1996, 45, 19–27. [Google Scholar]
- Gregory, J. Monitoring particle aggregation processes. Adv. Colloid Interface Sci. 2009. [Google Scholar] [CrossRef] [PubMed]
- Sharp, E.; Norris, R. Using online zeta potential measurements for coagulation control: A first for the UK water industry. In Proceedings of the 6th IWA Specialist Conference on Natural Organic Matter in Drinking Water, Malmö, Sweden, 7–10 September 2015.
- Thomas, D.N.; Judd, S.J.; Fawcett, N. Flocculation Modelling: A Review. Water Res. 1999, 33, 1579–1592. [Google Scholar] [CrossRef]
- Wistrom, A.; Farrell, J. Simulation and system identification of dynamic models for flocculation control. Water Sci. Technol. 1998, 37, 181–192. [Google Scholar] [CrossRef]
- Schuetz, S.; Piesche, M. A model of the coagulation process with solid particles and flocs in a turbulant flow. Chem. Eng. Sci. 2002, 57, 4357–4368. [Google Scholar] [CrossRef]
- Kim, J.W.; Kramer, T.A. Improved models for fractal colloidal agglomeration: Computationally efficient algorithms. Colloids Surf. A Physicochem. Eng. Asp. 2005, 254, 33–49. [Google Scholar] [CrossRef]
- Jackson, P.J.; Tomlinson, E.J. Automatic Coagulation Control—Evaluation of Strategies and Techniques. Water Supply 1986, 4, 55–67. [Google Scholar]
- Hernebring, C. Rapid Methods for the Determination of Required Alum Dosage in Surface Water Treatment Plants. Vatten 1987, 43, 209–219. (In Swedish) [Google Scholar]
- Eikebrokk, B.; Fettig, J. Treatment of Coloured Surface Water by Coagulation/Direct Filtration: Effect of Water Quality, Type of Coagulant and Filter Aids. In Chemical Water and Wastewater Treatment I; Hahn, H.H., Klute, R., Eds.; Springer-Verlag: Berlin, Germany, 1990; pp. 361–376. [Google Scholar]
- Edzwald, J.K. Coagulation in Drinking Water Treatment: Particles, Organics, and Coagulants. Water Sci. Technol. 1993, 27, 21–35. [Google Scholar]
- Edzwald, J.K.; Kaminski, G.S. A Practical Method for Water Plants to Select Coagulant Dosing. J. NEWWA 2009, 123, 11–27. [Google Scholar]
- Archer, A.D.; Singer, P.C. An evaluation of the relationship between SUVA and NOM coagulation using the ICR database. J. AWWA 2006, 98, 110–123. [Google Scholar]
- Edwards, M. Predicting DOC Removal during Enhanced Coagulation. J. AWWA 1997, 89, 78–89. [Google Scholar]
- Van Leeuwen, J.; Holmes, M.; Heidenreich, C.; Daly, R.; Fisher, I.; Kastl, G.; Sathasivan, A.; Bursill, D. Modelling the Application of Inorganic Coagulants and pH Control Reagents for Removal of Organic Matter from Drinking Waters. In Proceedings of the MODSIM Conference—Integrated Modelling of Biophysical, Social and Economic Systems for Resource Management Solutions, Townsville, Australia, 14–17 July 2003; [CD-ROM]. pp. 1835–1840.
- Van Leeuwen, J.; Holmes, M.; Kaeding, U.; Daly, R.; Bursill, D. Development and implementation of the software mEnCo© to predict coagulant doses for DOC removal at full-scale WTPs in South Australia. J. Water Supply Res. Technol. Aqua 2009, 58, 291–298. [Google Scholar] [CrossRef]
- Murshed, M.F.; van Leeuwen, J.A.; Chow, C.W.K.; Drikas, M. Modification of jar testing protocol combined with mEnCo model predicted dose to predict dissolved organic matter removal for surface water. Water Sci. Technol. Water Supply 2014, 14, 358–366. [Google Scholar] [CrossRef]
- Wang, D.; Xie, J.; Chow, C.W.; Xing, L.; van Leeuwen, J. Characterization and predicting DOM treatability by enhanced coagulation. Water Sci. Technol. Water Supply 2012, 13, 147–157. [Google Scholar] [CrossRef]
- Xie, J.; Wang, D.; van Leeuwen, J.; Zhao, Y.; Xing, L.; Chow, W.C. pH modeling for maximum dissolved organic matter removal by enhanced coagulation. J. Environ. Sci. 2012, 24, 276–283. [Google Scholar] [CrossRef]
- Xianjun, D.; Ping, Y.; Songtao, S. Study on Modeling of Coagulant Dosage System in Water Purification Process. Inf. Technol. J. 2013, 12, 2651–2655. [Google Scholar] [CrossRef]
- Stedmon, C.A.; Markager, S.; Bro, R. Tracing dissolved organic matter in aquatic environments using a new approach to fluorescence spectroscopy. Mar. Chem. 2003, 82, 239–254. [Google Scholar] [CrossRef]
- Ohno, T.; Bro, R. Dissolved organic matter characterization using multiway spectral decomposition of fluorescence landscapes. Soil Sci. Soc. Am. J. 2003, 70, 2028–2037. [Google Scholar] [CrossRef]
- Sanchez, N.; Skeriotis, A.; Miller, C. A PARAFAC-Based Long-Term Assessment of DOM in a Multi-Coagulant Drinking Water Treatment Scheme. Environ. Sci. Technol. 2014, 48, 1582–1591. [Google Scholar] [CrossRef] [PubMed]
- Critchley, R.F.; Smith, E.O.; Pettit, P. Automatic Coagulation Control at Water Treatment Plants in the North-West Region of England. Water Environ. J. 1990, 4, 535–543. [Google Scholar] [CrossRef]
- Adgar, A.; Cox, C.S.; Jones, C.A. Enhancement of coagulation control using the streaming current detector. Bioprocess Biosyst. Eng. 2005, 27, 349–357. [Google Scholar] [CrossRef] [PubMed]
- Yavich, A.A.; van de Wege, J. Chemical feed control using coagulation computer models and a streaming current detector. Water Sci. Technol. 2013, 67, 2814–2821. [Google Scholar] [CrossRef] [PubMed]
- Oh, J.I.; Lee, S.H. Influence of streaming potential on flux decline of microfiltration with in-line rapid pre-coagulation process for drinking water production. J. Membr. Sci. 2005, 254, 39–47. [Google Scholar] [CrossRef]
- Nam, S.W.; Jo, B.I.; Kim, M.K.; Kim, W.K.; Zoh, K.D. Streaming current titration for coagulation of high turbidity water. Colloids Surf. A Physicochem. Eng. Asp. 2013, 419, 133–139. [Google Scholar] [CrossRef]
- Byun, S.; Kwon, J.H.; Kim, M.K.; Park, K.Y.; Lee, S. Automatic control of polymer dosage using streaming potential for waterworks sludge conditioning. Sep. Purif. Technol. 2013, 57, 230–236. [Google Scholar] [CrossRef]
- Gregory, J.; Nelson, D.W. Monitoring aggregations in flowing suspension. Colloids Surface 1986, 18, 175–188. [Google Scholar] [CrossRef]
- Huang, C.; Chen, G.S. Use of the Fiber-Optical Monitor in Evaluating the State of Flocculation. Water Res. 1996, 30, 2723–2727. [Google Scholar] [CrossRef]
- Staaks, C.; Fabris, R.; Lowe, T.; Chow, C.; van Leeuwen, J.; Drikas, M. Coagulation assessment and optimisation with a photometric dispersion analyser and organic characterisation for natural organic matter removal performance. Chem. Eng. J. 2011, 168, 629–634. [Google Scholar] [CrossRef]
- Zouloubis, A.I.; Tzoupanos, N. Alternative cost-effective preparation method of PAC coagulant agent: Characterization and comparative application for water/wastewater treatment. Desalination 2010, 250, 339–344. [Google Scholar] [CrossRef]
- Hopkins, D.C.; Ducoste, J.J. Characterizing flocculation under heterogeneous turbulence. J. Colloid Interface Sci. 2003, 264, 184–194. [Google Scholar] [CrossRef]
- Huang, C.; Liu, C.B. Automatic Control for Chemical Dosing in Laboratory-scale Coagulation Process by Using an Optical Monitor. Water Res. 1996, 30, 1924–1929. [Google Scholar] [CrossRef]
- Cheng, W.P.; Kao, Y.P.; Yu, R.F. A novel method for on-line evaluation of floc size in coagulation process. Water Res. 2008, 42, 2691–2697. [Google Scholar] [CrossRef] [PubMed]
- Cheng, W.P.; Chang, J.N.; Chen, P.H.; Yu, R.F.; Huang, Y.W. Turbidity fluctuation as a measure of floc size in a coagulation pilot study. Desalination Water Treat. 2011, 30, 98–104. [Google Scholar] [CrossRef]
- Cheng, W.P.; Chen, P.H.; Yu, R.F.; Chang, J.N. Assessing Coagulant Dosage in Full-Scale Drinking Water Treatment Plants Using Nephelometry. Environ. Eng. Sci. 2012, 29, 212–217. [Google Scholar] [CrossRef]
- Sangu, Y.; Yokoi, H.; Tadokoro, H.; Tachi, T. Development of automatic coagulant dosage control technology for rapid changes of raw water quality parameters. Water Sci. Technol. Water Supply 2012, 12, 918–925. [Google Scholar] [CrossRef]
- Sangu, Y.; Yokoi, H.; Tadokoro, H.; Tachi, T. Verification of automatic coagulant dosage control technology based on aluminium concentration at a water treatment plant quality. Water Sci. Technol. Water Supply 2015, 15, 25–33. [Google Scholar] [CrossRef]
- Lin, J.; Huang, C.; Chin, C.; Pan, J. Coagulation dynamics of fractal flocs induced by enmeshment and electrostatic patch mechanisms. Water Res. 2008, 42, 4457–4466. [Google Scholar] [CrossRef] [PubMed]
- Xiao, F.; Huang, J.H.; Zhang, B.; Cui, C. Effects of low temperature on coagulation kinetics and floc surface morphology using alum. Desalination 2009, 237, 201–213. [Google Scholar] [CrossRef]
- Jin, Y. Use of a High Resolution Photographic Technique for Studying Coagulation/Flocculation in Water Treatment. Master’s Thesis, University of Saskatchewan, Saskatchewan, Canada, 3 June 2005. [Google Scholar]
- Yu, R.F.; Cheng, W.P.; Huang, H.D. On-line Assessment of the Particle Separation in Chemical Flocculant Suspension by Image Analysis. In Proceedings of the International Conference on Particle Separation, Berlin, Germany, 18–20 June 2012; pp. 53–57.
- Raspati, G.S.; Leiknes, T.O.; Meyn, T. Fractal Dimension Analysis of Flocs in In-line Coagulation-Microfiltration of Natural Organic Matter (NOM). Sep. Sci. Technol. 2013, 48, 2713–2723. [Google Scholar] [CrossRef]
- Jarvis, P.; Jefferson, B.; Gregory, J.; Parsons, S.A. A review of floc strength and breakage. Water Res. 2005, 39, 3121–3137. [Google Scholar] [CrossRef] [PubMed] [Green Version]
- Kurita Water Industries. Launch of a Water Treatment Management Service Using the Newly Developed Mobile Water Quality Analyzer, S.sensing MA. Available online: http://www.kurita.co.jp/english/aboutus/press140331.html (accessed on 10 September 2014).
- Sivchenko, N.; Kvaal, K.; Ratnaweera, H. Image analysis of flocs and mathematical modelling applied to coagulation-flocculation process. In Proceedings of the IWA Specialist Conference “Advances in Particle Science and Separation: From mm to nm Scale and Beyond”, Sapporo, Japan, 15–18 June 2014.
- Tse, I.C.; Swetland, K.; Weber-Shirk, M.L.; Lion, L.W. Method for quantitative analysis of flocculation performance. Water Res. 2011, 45, 3075–3084. [Google Scholar] [CrossRef] [PubMed]
- Blankert, B.; Betlem, B.H.L.; Roffel, B. Development of a control system for in-line coagulation in an ultrafiltration process. J. Membr. Sci. 2007, 301, 39–45. [Google Scholar] [CrossRef]
- Futselaar, H.; Blankert, B.; Spanjer, T.; Spenkelink, F. Ultrafiltration used as pre-treatment for SWRO desalination: Dynamic coagulant control under extreme conditions. Desalination Water Treat. 2013, 51, 407–415. [Google Scholar] [CrossRef]
- Wei, L.; Ratnaweera, H.; Heping, S. Better treatment efficiencies and process economics with real-time coagulant dosing control. In Proceedings of the Instrumentation, Control and Automation ICA 2013 Conference, Narbonne, France, 18–20 September 2013.
- Manamperuma, L.; Ratnaweera, H.; Rathnaweera, S. Retrofitting coagulant dosing control using real-time water quality measurements to reduce coagulant consumption. In Proceedings of the Instrumentation, Control and Automation Conference (ICA) 2013, Narbonne, France, 18–20 September 2013.
- Storhaug, R. Methods for Improving Chemical Phosphorus Removal in Municipal Wastewater Treatment Plants; Report No. 166; Norwegian Water BA: Hamar, Norway, 2009. (In Norwegian) [Google Scholar]
- Tik, S.; Vanrolleghem, P.A. Modelling and control of a full-scale chemically enhanced primary treatment. In Proceedings of the International Conference on Particle Separation, Berlin, Germany, 18–20 June 2012; Jekel, M., Ed.; pp. 329–330.
- AlGhazzawi, A.; Lennox, B. Model predictive control monitoring using multivariate statistics. J. Process Control 2009, 19, 314–327. [Google Scholar] [CrossRef]
- Franceschi, M.; Girou, A.; Carro-Diaz, A.M.; Maurette, M.T.; Puech-Costes, E. Optimisation of the coagulation-flocculation process of raw water by optimal design method. Water Res. 2002, 36, 3561–3572. [Google Scholar] [CrossRef]
- Trinh, T.K.; Kang, L.S. Response surface methodological approach to optimize the coagulation-flocculation process in drinking water treatment. Chem. Eng. Res. Des. 2011, 89, 1126–1135. [Google Scholar] [CrossRef]
- Juntunen, P.; liukkonen, M.; Pelu, M.; Lehtola, M.; Hiltunen, Y. Modelling of Water Quality: An Application to a Water Treatment Process. Appl. Comput. Intell. Soft Comput. 2012. [Google Scholar] [CrossRef]
- Juntunen, P.; Liukkonen, M.; Lehtola, M.; Hiltunen, Y. Dynamic soft sensors for detecting factors affecting turbidity in drinking water. J. Hydroinf. 2013, 15, 416–426. [Google Scholar] [CrossRef]
- Ratnaweera, H.; Lu, L.; Lindholm, O. Simulation Program for Wastewater Coagulation. In Chemical Water and Wastewater Treatment VII; Hahn, H.H., Hoffmann, E., Ødegaard, H., Eds.; IWA Publishing: London, UK, 2002; pp. 253–260. [Google Scholar]
- Ratnaweera, H.; Smozcynski, L.; Lewandowski, A.; Bielecka, M. Efficient Coagulant Dosing Control in Wastewater Treatment. Pol. Acad. Sci. 2005, 505, 347–352. [Google Scholar]
- Annadurai, G.; Sung, S.S.; Lee, D.J. Simultaneous removal of turbidity and humic acid from high turbidity stormwater. Adv. Environ. Res. 2004, 8, 713–725. [Google Scholar] [CrossRef]
- Ghafari, S.; Abdul Aziz, H.; Isa, M.H.; Zinatizadeh, A. Application of response surface methodology (RSM) to optimize coagulation-flocculation treatment of leachate using poly-aluminium chloride (PAC) and alum. J. Hazard. Mater. 2009, 163, 650–656. [Google Scholar] [CrossRef] [PubMed]
- Adlan, M.N.; Palaniandy, P.; Aziz, H.A. Optimization of coagulation and dissolved air flotation (DAF) treatment of semi-aerobic landfill leachate using response surface methodology (RSM). Desalination 2011, 277, 74–82. [Google Scholar] [CrossRef]
- Guida, M.; Mattei, M.; Della Rocca, C.; Melluso, G.; Meric, S. Optimization of alum-coagulation/flocculation for COD and TSS removal from five municipal wastewater. Desalination 2007, 211, 113–127. [Google Scholar] [CrossRef]
- Paliwal, M.; Kumar, U.A. Neural networks and statistical techniques: A review of applications. Expert Syst. Appl. 2009, 36, 2–17. [Google Scholar] [CrossRef]
- Ráduly, B.; Gernaey, K.V.; Capodaglio, A.G.; Mikkelsen, P.S.; Henze, M. Artificial neural networks for rapid WWTP performance evaluation: Methodology and case study. Environ. Modell. Softw. 2007, 22, 1208–1216. [Google Scholar] [CrossRef]
- Zhang, Q.; Staney, S.J. Real-Time Water Treatment Process Control with Artificial Neural Network. J. Environ. Eng. 1999, 125, 153–159. [Google Scholar] [CrossRef]
- Baxter, C.W.; Stanley, S.J.; Zhang, Q. Development of a full-scale artificial neural network for the removal of natural organic matter by enhanced coagulation. Aqua 1999, 48, 129–136. [Google Scholar] [CrossRef]
- Baxter, C.W.; Shariff, R.; Stanley, S.J.; Smith, D.W.; Zhang, Q.; Saumer, E.D. Model-based advanced process control of coagulation. Water Sci. Technol. 2002, 45, 9–17. [Google Scholar] [PubMed]
- Valentin, N.; Denoeux, T. A neural network-based software sensor for coagulation control in a water treatment plant. Intell. Data Anal. 2001, 5, 23–39. [Google Scholar]
- Bloch, G.; Denoeux, T. Neural networks for process control and optimization: Two industrial applications. ISA Trans. 2003, 42, 39–51. [Google Scholar] [CrossRef]
- Yu, R.F.; Kang, S.F.; Liaw, S.L.; Chen, M.C. Application of artificial neural network to control the coagulant dosing in water treatment plant. Water Sci. Technol. 2000, 42, 403–408. [Google Scholar]
- Joo, D.S.; Choi, D.J.; Park, H. The Effects of Data Preprocessing in the Determination of Coagulant Dosing Rate. Water Res. 2000, 34, 3295–3302. [Google Scholar] [CrossRef]
- Maier, H.R.; Morgan, N.; Chow, C. Use of artificial neural networks for predicting optimal alum doses and treated water quality parameters. Environ. Modell. Softw. 2004, 19, 1189–1195. [Google Scholar] [CrossRef]
- Zhang, H.; Luo, D. Application of an expert system using neural network to control the coagulant dosing in water treatment plant. J. Control Theory Appl. 2004, 2, 89–92. [Google Scholar] [CrossRef]
- Lamrini, B.; Benhammou, A.; Le Lann, M.V.; Karama, A. A neural software sensor for online prediction of coagulant dosage in a drinking water treatment plant. Transact. Inst. Meas. Control 2005, 27, 195–213. [Google Scholar] [CrossRef]
- Hernandez, H.; Le Lann, M.V. Development of a Neural Sensor for On-line Predictions of Coagulant Dosage in a Potable Water Treatment Plant in the Way of its Diagnosis. In Advances in Artificial Intelligence, IBERAMA-SBIA; Springer-Verlag: Berlin, Germany, 2006; pp. 249–257. [Google Scholar]
- Wu, G.D.; Lo, S.L. Predicting real-time coagulant dosage in water treatment by artificial neural networks and adaptive network-based fuzzy inference system. Eng. Appl. Artif. Intell. 2008, 21, 1189–1195. [Google Scholar] [CrossRef]
- Wu, G.D.; Lo, S.L. Effects of data normalization and inherent-factor on decision of optimal coagulant dosage in water treatment by artificial neural network. Expert Syst. Appl. 2010, 37, 4974–4983. [Google Scholar] [CrossRef]
- Kriti, S.; Smita, J. Artificial Neural Network Modelling of Shyamala Water Works, Bhopal MP, India. Res. J. Recent Sci. 2013, 2, 26–28. [Google Scholar]
- Kumar, J.S.; Poongodi, P.; Balakumaran, P. Artificial Intelligence Based Alum Dosage Control in Water Treatment Plant. Int. J. Eng. Technol. 2013, 5, 3344–3350. [Google Scholar]
- Dellana, S.A.; West, D. Predictive modelling for wastewater applications: Linear and nonlinear approaches. Environ. Modell. Softw. 2009, 24, 96–106. [Google Scholar] [CrossRef]
- Zheng, H.; Zhu, G.; Jiang, S.; Tshukudu, T.; Xiang, X.; Zhang, P.; He, Q. Investigations of coagulation-flocculation process by performance optimization, model prediction and fractal structure of flocs. Desalination 2011, 269, 148–156. [Google Scholar] [CrossRef]
- Liu, J.C.; Wu, M.D. Fuzzy control of coagulation reaction through streaming current monitoring. Water Sci. Technol. 1997, 36, 127–134. [Google Scholar] [CrossRef]
- Ratnaweera, H.; Anderssen, E.; Seim, F.; Njål, E.; Nilsen, N.K. Fuzzy Control in Water Supply- Pilot Project; NIVA Report OR-3849; Norwegian Institute for Water Research: Oslo, Norway, 1998; p. 38. [Google Scholar]
- Chen, C.L.; Hou, P.L. Fuzzy model identification and control system design for coagulation chemical dosing of potable water. Water Sci. Technol. Water Supply 2006, 6, 97–104. [Google Scholar] [CrossRef]
- Heddam, S.; Bermad, A.; Dechemi, N. ANFIS-based modelling for coagulant dosage in drinking water treatment plant: A case study. Environ. Monit. Assess. 2012, 184, 1953–1971. [Google Scholar] [CrossRef] [PubMed]
- Wan, J.Q.; Huang, M.Z.; Ma, Y.W.; Guo, W.J.; Wang, Y.; Zhang, H.P. Control of the Coagulation Process in a Paper-mill Wastewater Treatment Process Using a Fuzzy Neural Network. Chem. Biochem. Eng. Q. 2010, 24, 425–435. [Google Scholar]
- Kramer, L.; Horger, J. Streaming Current Monitor Used to Optimize Coagulant Dosages. WaterWorld 2001, 17, 10–14. [Google Scholar]
- Boruszenko, P.; Haley, J.; Thompson, K.C. On-line Analysis—A Water Company Perspective. Available online: http://www.rsc.org/images/JohnHaleyYWS5thNovCambridge_tcm18-143639.pdf (accessed on 16 November 2015).
- Naidoo, P.; van der Walt, J.J. Artificial Neural Networks as a Chemical Dosing Budgeting Tool. Available online: http://www.ewisa.co.za/literature/files/ID107%20Paper102%20van%20der%20walt%20M.pdf (accessed on 16 November 2015).
- Cooperative Research Centre (CRC) for Water Quality and Treatment. Natural Organic Matter—Understanding and Controlling the Impact on Water Quality and Water Treatment Processes. Available online: http://www.waterra.com.au/publications/document-search/ (accessed on 16 November 2015).
- Schlegel, S. Coagulant demand of large wastewater treatment plants with dosage control. Korresp. Abwasser 2009, 50, 1442–1446. (In German) [Google Scholar]
© 2015 by the authors; licensee MDPI, Basel, Switzerland. This article is an open access article distributed under the terms and conditions of the Creative Commons Attribution license (http://creativecommons.org/licenses/by/4.0/).
Share and Cite
MDPI and ACS Style
Ratnaweera, H.; Fettig, J. State of the Art of Online Monitoring and Control of the Coagulation Process. Water 2015, 7, 6574-6597. https://doi.org/10.3390/w7116574
AMA Style
Ratnaweera H, Fettig J. State of the Art of Online Monitoring and Control of the Coagulation Process. Water. 2015; 7(11):6574-6597. https://doi.org/10.3390/w7116574
Chicago/Turabian StyleRatnaweera, Harsha, and Joachim Fettig. 2015. "State of the Art of Online Monitoring and Control of the Coagulation Process" Water 7, no. 11: 6574-6597. https://doi.org/10.3390/w7116574