1. Introduction
Within the context of water management, dune aquifers have been used to store, treat and recover water for more than 60 years [
1,
2,
3,
4,
5,
6,
7]. In arid lands, rainfall events are sparse and commonly produce flash flood events that are not conductive to recharge of most aquifers (e.g., wadi aquifers) [
8]. Dune aquifers are known to be effective at allowing natural recharge [
9,
10,
11,
12,
13]. Increasingly, dune aquifers are being considered for use in storing captured storm water or treated wastewater for future use [
14]. Therefore, there is a need to understand the hydraulic properties of dune aquifers to assess water storage and recovery potential using the concept of aquifer storage and recovery (ASR).
Dunes are an important part of the landscape in arid regions, especially within the desert areas of Australia, the Sahara, and Arabia, where dune field cover constitutes 31%, 28%, and 26%, respectively, of the total land area [
15]. Investigations of dune fields have been conducted to assess the physics of wind-transported sediment mechanisms [
16], the sediment grain size properties [
17,
18,
19], and the movement of the dunes because of geohazard potential [
20]. Little consideration has been given to assessment of the sediment hydraulic properties in terms of hydraulic conductivity (saturated), porosity, and specific yield [
21,
22,
23].
Empirical equations are commonly used to estimate saturated hydraulic conductivity from grain size data in various sediment types to populate grids in models or to set limits for the maximum rate of recharge for unsaturated zone flow [
24,
25,
26]. There are over 30 published empirical equations commonly used to perform this task with each one having a different set of assumptions for its use. Unfortunately, many of these equations were developed using very limited databases with the comparative number of measured grain size distributions analyses and hydraulic conductivity measurements being limited to a population as small as 20. Considerable improvements to the accuracy of these empirical equations for analysis of specific depositional environments have been made recently [
26]. Herein, we analyze the use of the inversion mathematical method to calibrate a new equation for relating the grain size distribution to the hydraulic conductivity of interior dune sediment at a specific location and compare the developed equation to the improved method of Rosas
et al. [
26].
In this research, the grain size distribution, porosity, and hydraulic conductivity variations in an interior dune field are measured in an effort to (1) provide a characterization of these parameters along the cross-section of a dune, and (2) develop an improved empirical relationship between grain size distribution and hydraulic conductivity for this dune field, using a mathematical inversion method, (3) compare the developed equation to other empirical equations used to estimate interior dune field hydraulic conductivity, and (4) investigate the impact of the mud percentage (silt and clay) fraction on the hydraulic conductivity. Furthermore, a calibration procedure was proposed to estimate the fitting parameter of the developed empirical relationship by considering twenty five samples collected in the Khulays dune field, then applying the equation to prediction of another set of 25 samples for assessment of predictive error. This methodology could be applied to various other depositional environments to facilitate estimates of hydraulic conductivity without having to measure it in a large numbers of samples in the laboratory. This research applies to prediction of saturated hydraulic conductivity. It is clearly understood that the packing of the dune sediment has an impact on the saturated hydraulic conductivity and that the empirical equations do not take this into consideration, so the calculated values can be assessed to be similar to dune sands located within 10 to 20 m of the surface, which are not well compacted.
Four research hypotheses where developed for testing and are: (1) most empirical equations currently used to estimate saturated hydraulic conductivity from grain size distribution of dune sands have large errors; (2) a significant statistical correlation exists between the percentage of mud (silt and clay) in dune sand and the hydraulic conductivity; (3) a significant statistical relationship exists between saturated hydraulic conductivity and the dispersion (and other statistical moments) in interior dune sands, and (4) inversion modeling can be applied to calibrate a field specific empirical equation relating saturated hydraulic conductivity and grain size distribution in interior dune sands.
2. Background and Methods
2.1. Site Description
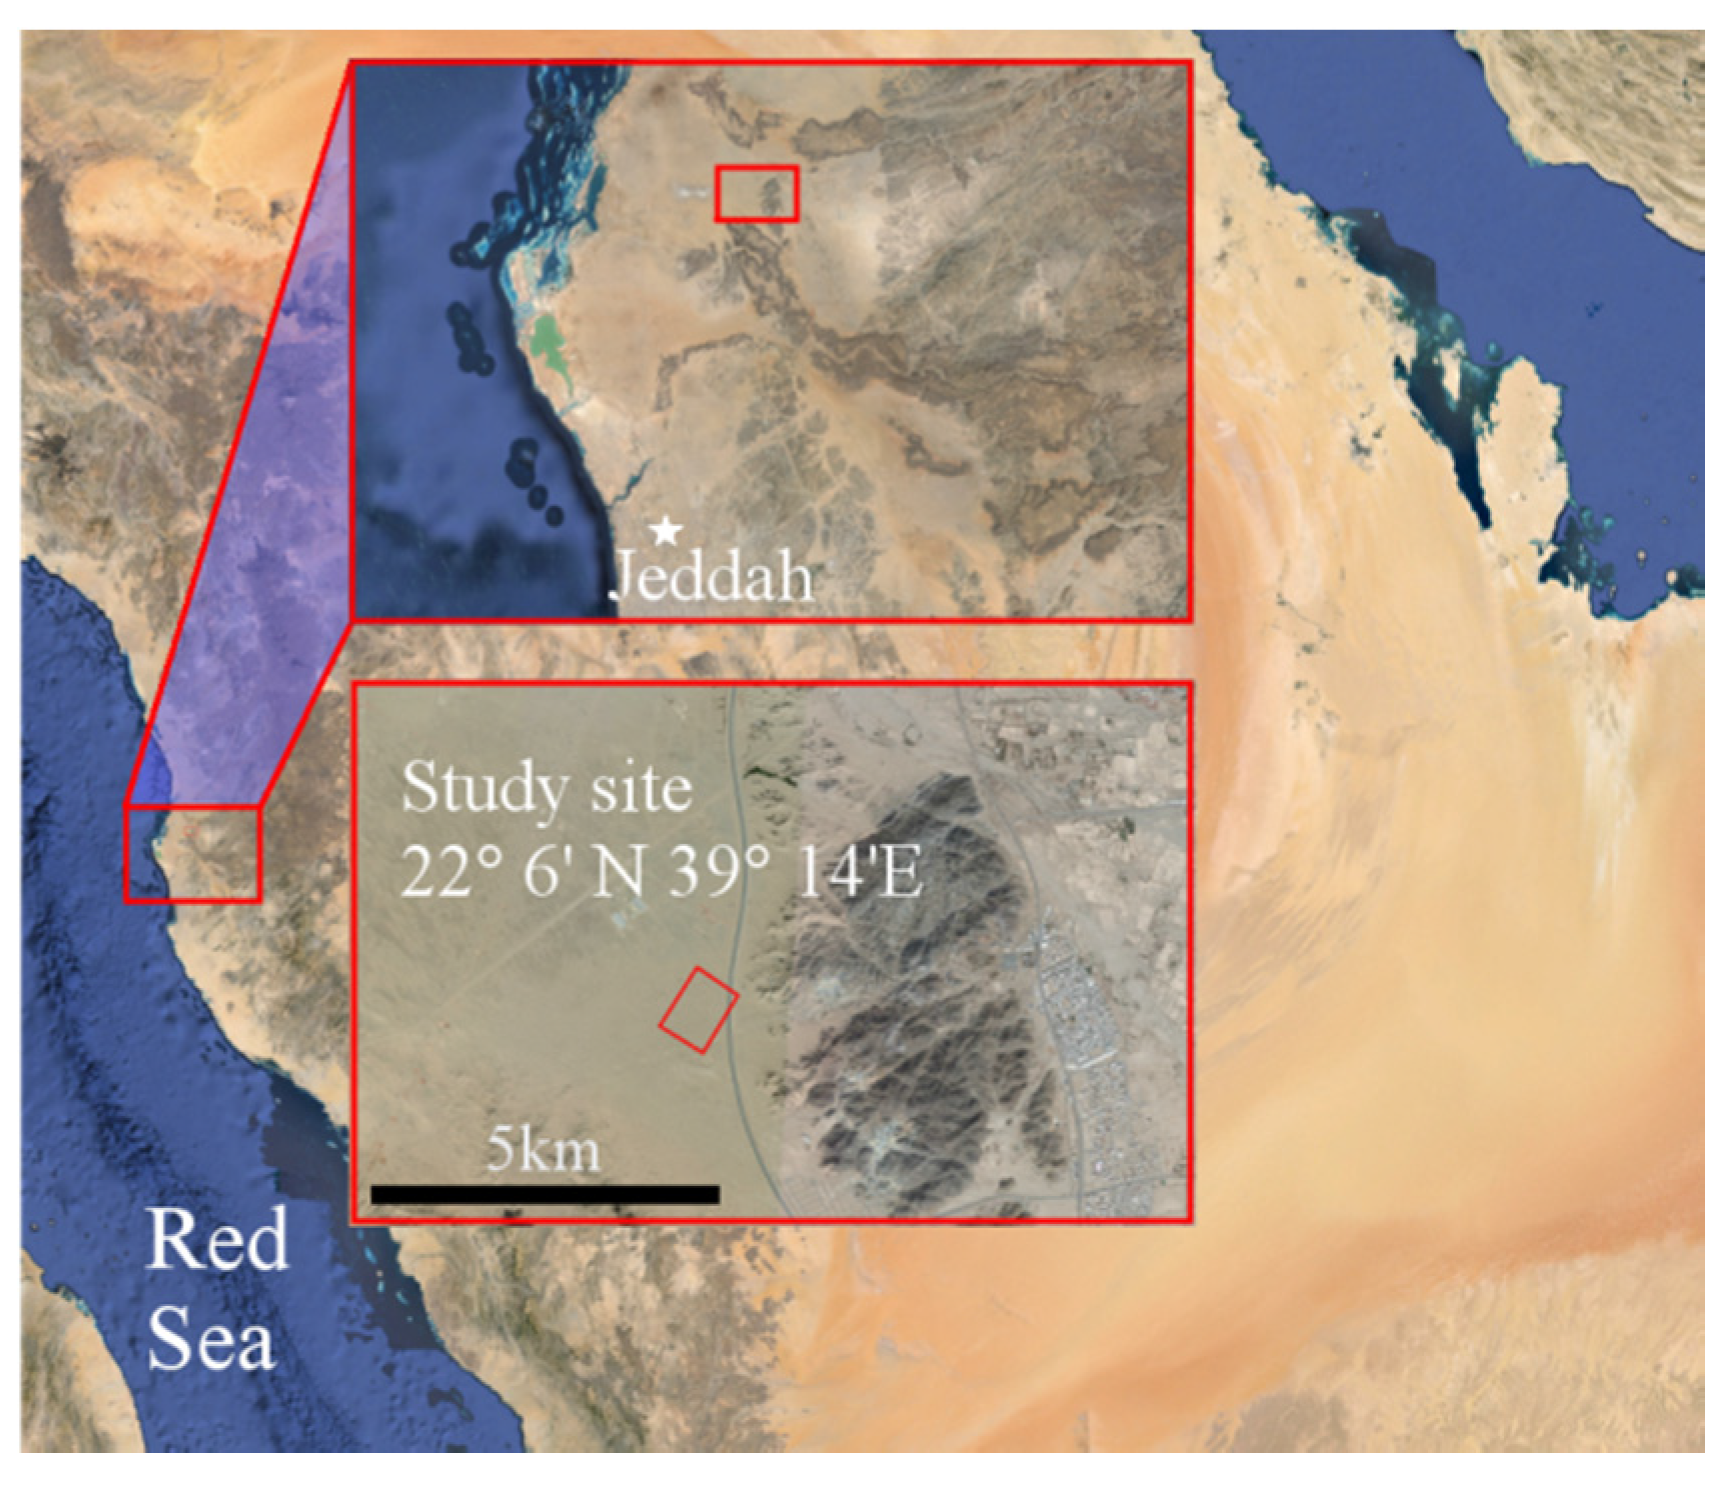
The Wadi Khulays aquifer system, located about 50 km northeast of Jeddah, Saudi Arabia (
Figure 1), consists of several valleys that drain from the western slope of the Arabian Shield into the Wadi Khulays plain near the Red Sea coast [
27]. A dune field was formed by the prevailing northwesterly wind transporting alluvial deposits from the northern sheet wash and Wadi plains of Wadi Khulays to the south side, centered at about 22°6′ N, 39°14′ E [
28,
29]. Dune heights range from 3.5 to 8 m, depending on the location within the field. The dune sediment is predominantly quartz sand with some other siliciclastic minerals. Dune sediments lie on desert pavement that dips slightly westward and contains a significant percentage of mud and has a low hydraulic conductivity. Moisture was found at the base of the dune sediments. No significant vegetation occurs within the dune field.
Figure 1.
Map of Saudi Arabia showing the location of the dune field site.
Figure 1.
Map of Saudi Arabia showing the location of the dune field site.
2.2. Field Study and Laboratory Methods
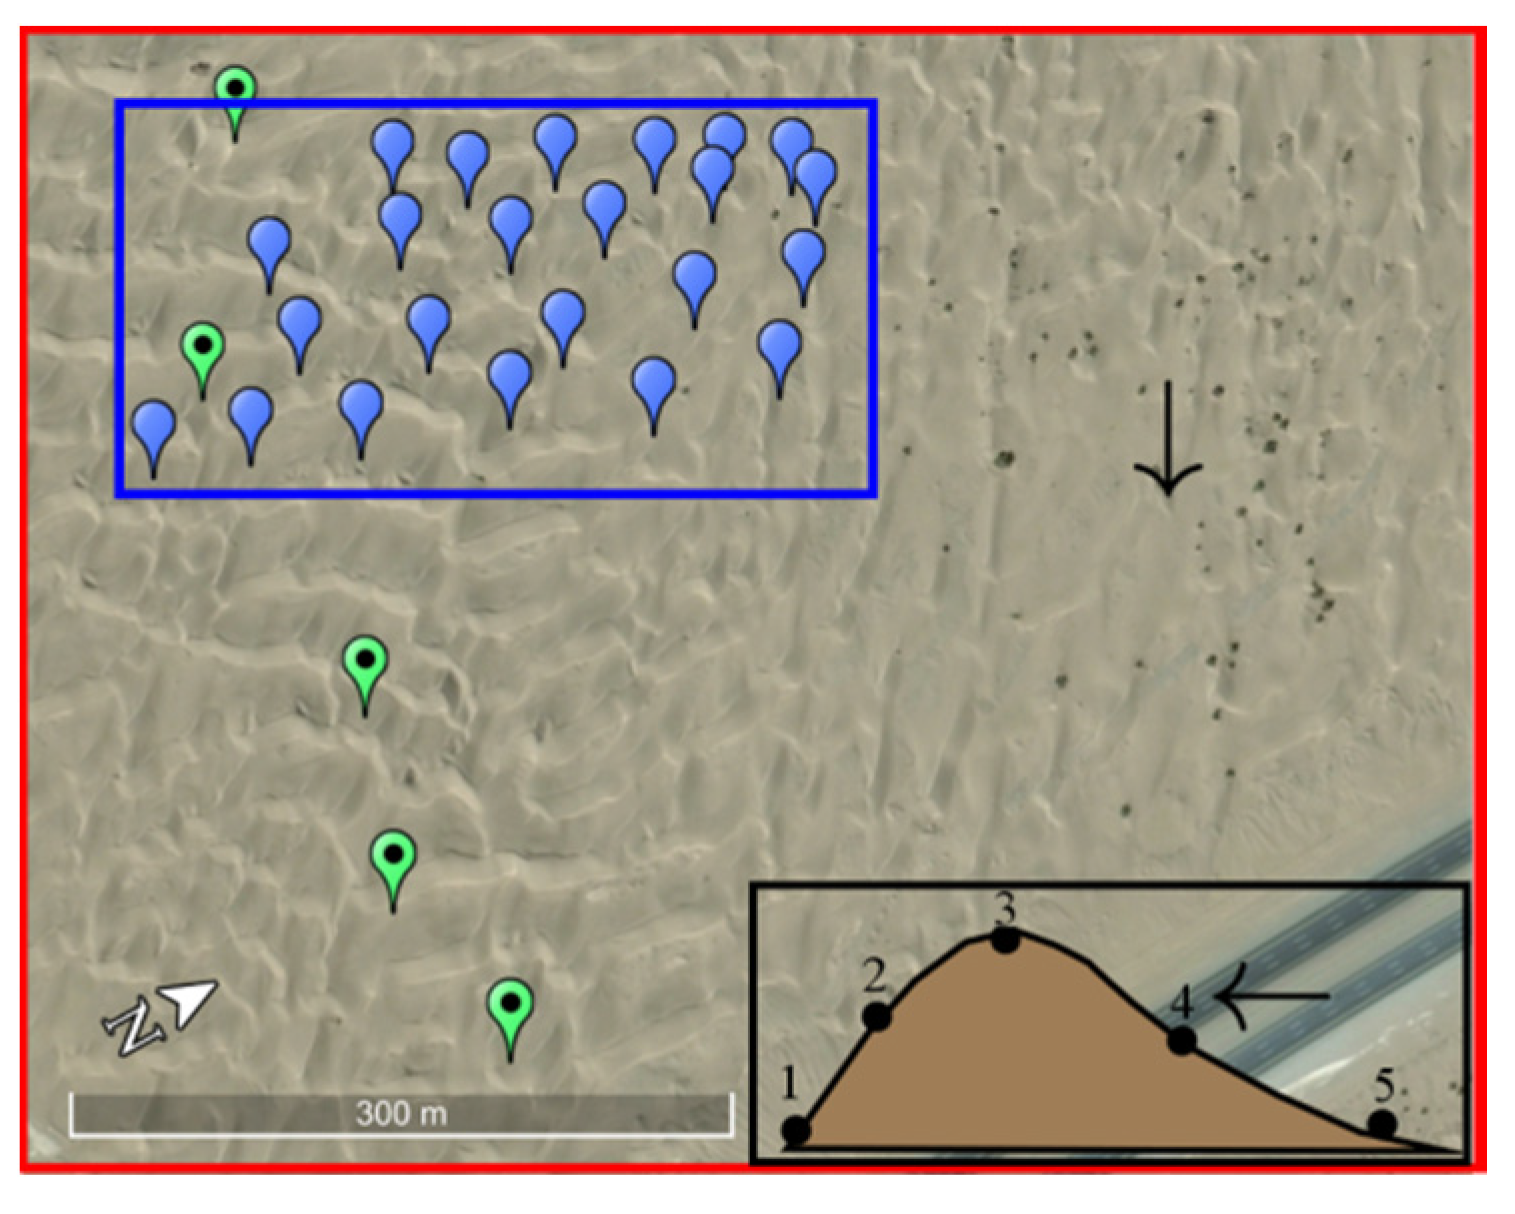
The sediments were evaluated using standard laboratory methods for the determination of hydraulic conductivity, grain size distribution and porosity. First, samples were collected from the upper 5 to 10 cm across several dunes at five locations beginning at the toe and ending downwind of the avalanche face within the inter-dune area (
Figure 2A). The dunes sampled occurred in two 800 m long transects (green markers on
Figure 2B,C). A total of 50 samples were collected for full analysis. An additional 24 samples were collected from dune crests covering a surface area of about 37,500 m
2 and were analyzed only for grain size distribution (
Figure 2B, blue markers).
Figure 2.
Wadi Khulays dune field sample locations (black arrows show the predominant wind direction). Green markers show the location of dunes selected for full sampling (analysis of grain size, porosity and hydraulic conductivity across the dune). Blue markers show a second sampling for grain size analysis only from dune crests. The blue region corresponds to the analysis shown in
Figure 8. Inset: Diagram showing the sample location across individual dunes.
The grain size distribution was determined using the standard sieving technique as described by Tanner and Balsillie [
29] and the American Society of Testing and Materials [
30]. About 70 g of sample were analyzed using 34 standard sieves with size increments corresponding to 0.25-phi units (phi is equal to −log to the base 2 in mm). The amount of mud (silt and clay) in a sample was determined as the weight of the sample left in the pan after passing through all of the sieves with the smallest being 0.0063 mm. The sieving process involved the continuous rotation and tapping of the sieves by the use of a Ro-Tap machine for 30 min as recommended by Tanner and Balsillie [
29]. The weight retained within each sieve was measured to an accuracy of 0.01g and the statistical moments were calculated following the approach described in Tanner and Balsillie [
29], using custom software developed by Rosas
et al. [
26].
The hydraulic conductivity was measured using a standard constant head permeameter based on the methodology described by Wenzel [
31] and following the American Society for Testing and Materials standard D2434-68 [
32]. A constant head was applied to an approximate 10 cm column filled with saturated sediment sample and water flow was from bottom to top through the cylinder. The hydraulic conductivity was obtained by applying Darcy’s Law of flow through porous media and was reported in meters per day.
In order to obtain an estimate of total porosity of each sample, a 250 mL (cc) graduated cylinder was first filled partially with a known volume of water. Sediment was carefully added to the cylinder and allowed to settle and compact. Additional water and sediment were added to the column. Care was taken to not allow air entrapment within the saturated column. The column was also compacted slightly by tapping the side of the cylinder with a rubber mallet to approximate natural system packing conditions near surface. The volume of sediment was determined along with the volume of water added. When the water level in the cylinder rose above the surface of the sediment, a correction was made to the water volume added (subtraction). Then, the estimated porosity was determined by dividing the volume of water by the volume of sediment.
2.3. Mathematical Analysis
Among the 21 empirical equations that estimate the hydraulic conductivity from the grain size distribution, most of them use a relationship in the form shown in Equation (1), where n is the porosity and β is a coefficient that may depend on the shape of the grain, type of depositional environment or other factors, d10 is the effective grain diameter (at which 10% of the sample is finer), g is the gravitational acceleration and is the kinematic viscosity of water.
Rosas
et al. [
26] compared the effectiveness of these equations for different depositional environments, and provided depositional environment-dependent β coefficients, as well as offset values (bias) for beach sands, offshore marine sands, and dune sands (coastal and interior), as well as for river sediments. In this study, the four equations that showed the best fit for interior dune sands, as recommended in Rosas
et al. [
26], were selected as target equations to be modified by the inclusion of other grain size distribution parameters, based on the significance of their correlation with the hydraulic conductivity values. The inclusion was done by adding a second term to the target equations, which contains the mud percentage and a fitting parameter. The inclusion of a second term in the Beyer Equation [
33] is shown below:
where
C is the coefficient of uniformity defined as
C = d
60/d
10 (d
60 is the diameter at which 60% of the sample is finer),
P1 and
P2 are the fitting parameters to be optimized. The inverse problem was formulated in the sense of root mean square error and the objectivity function was accordingly defined as:
where
and
are the vectors containing the measured and modeled hydraulic conductivity, respectively,
b = [
P1,
P2] is the parameter vector to be estimated, and,
n is the number of samples. An inversion the first twenty-five measurements was used to estimate the fitting parameters
P1 and
P2. To properly deal with the nonlinearity of the objective function during minimization and, in particular, avoid being trapped in local minima, we adopted a global optimization approach. Hence, we used the shuffled complex evolution (SCE-UA) algorithm for the global optimization. This global optimization algorithm has been widely used in hydrologic modeling [
34], and proved to be consistent and efficient for finding the global optimum parameter values of integrated hydrogeophysical and hydrologic models [
35,
36].
3. Results
3.1. Grain Size, Porosity, and Hydraulic Conductivity Analyses
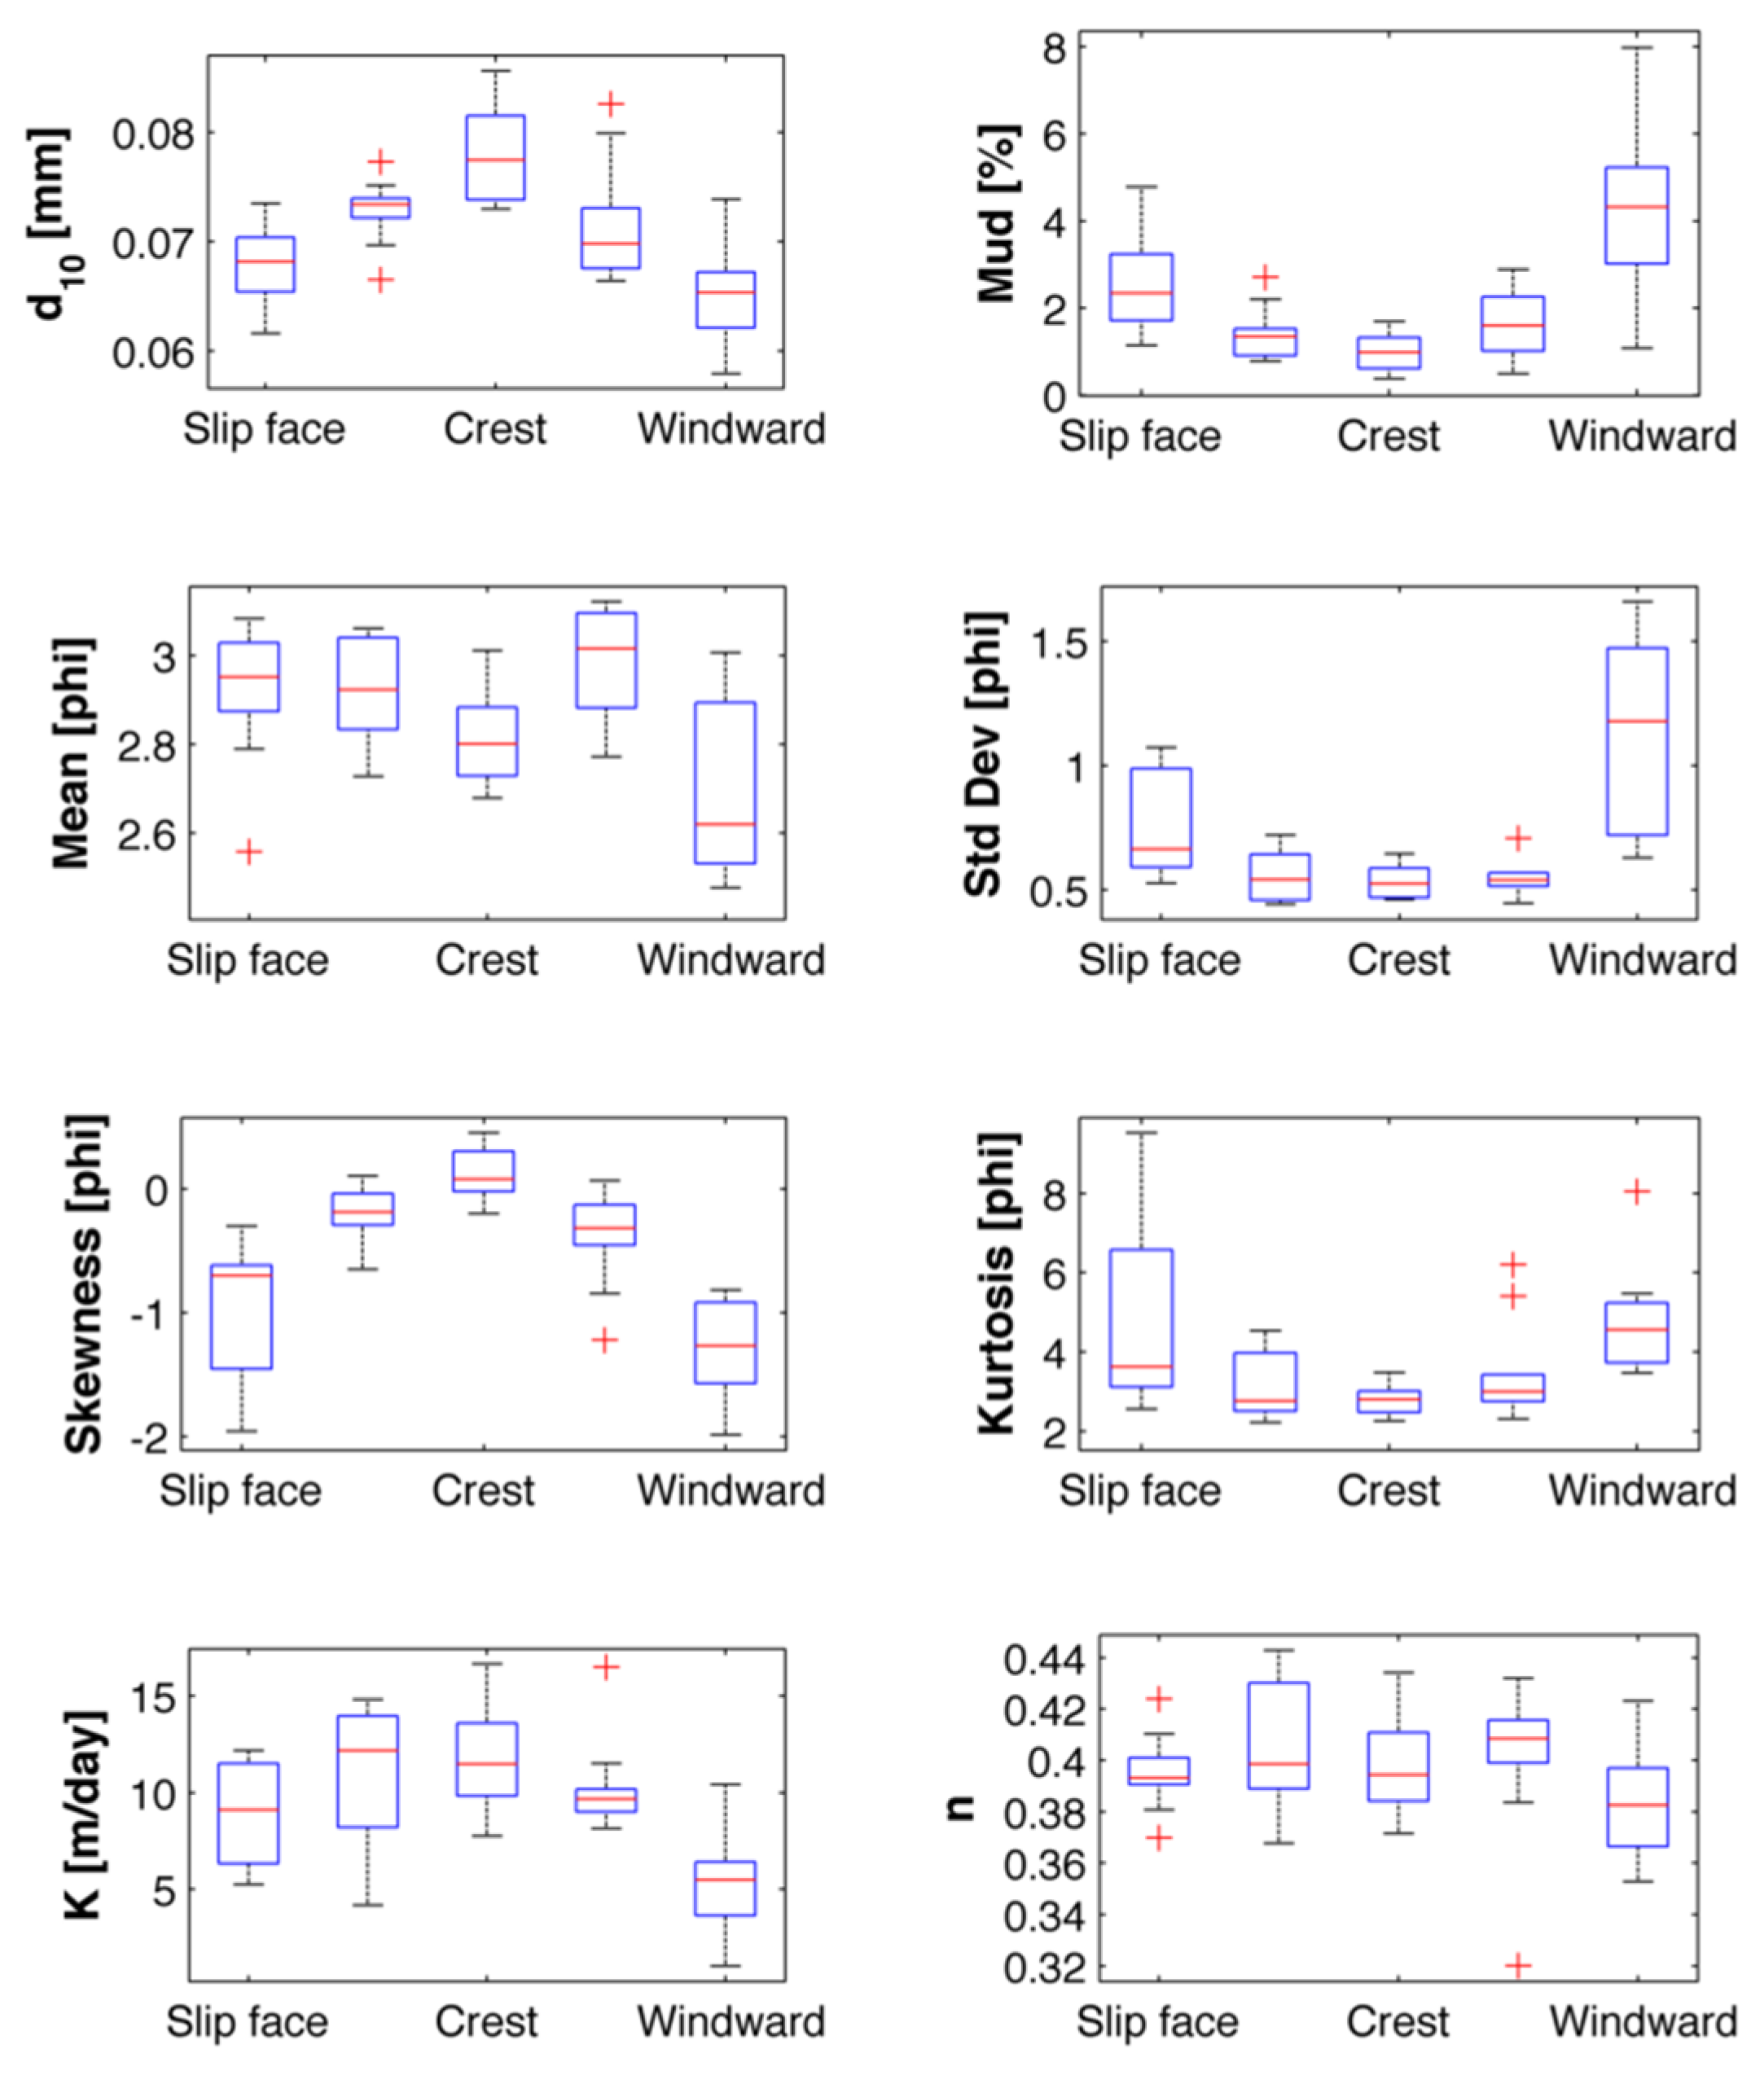
Measured grain size statistical parameters, d
10, mud percentage, measured porosity and measured hydraulic conductivity of the 50 samples collected across the individual windward and leeward dunes are summarized in
Figure 3. The grain size statistical properties d
10, mud (%), standard deviation, skewness, and kurtosis, and the measured hydraulic conductivity vary in a regular pattern across the dune profile, while mean grain diameter does not vary in the same pattern (
Figure 3). The dunes crests have significantly higher hydraulic conductivities and d
10 values, corresponding to the lowest percentage of mud content. Porosity of the dune sands was found to be relatively uniform with a mean of 0.39 and a standard deviation of 0.02. The red-cross marks on the figure show the location of outlier samples.
Figure 3.
Summary of grain size and hydraulic properties along the cross-section of the dunes. Red crosses are outlier samples.
Figure 3.
Summary of grain size and hydraulic properties along the cross-section of the dunes. Red crosses are outlier samples.
3.2. Empirical Hydraulic Conductivity Estimates from Grain Size Distribution
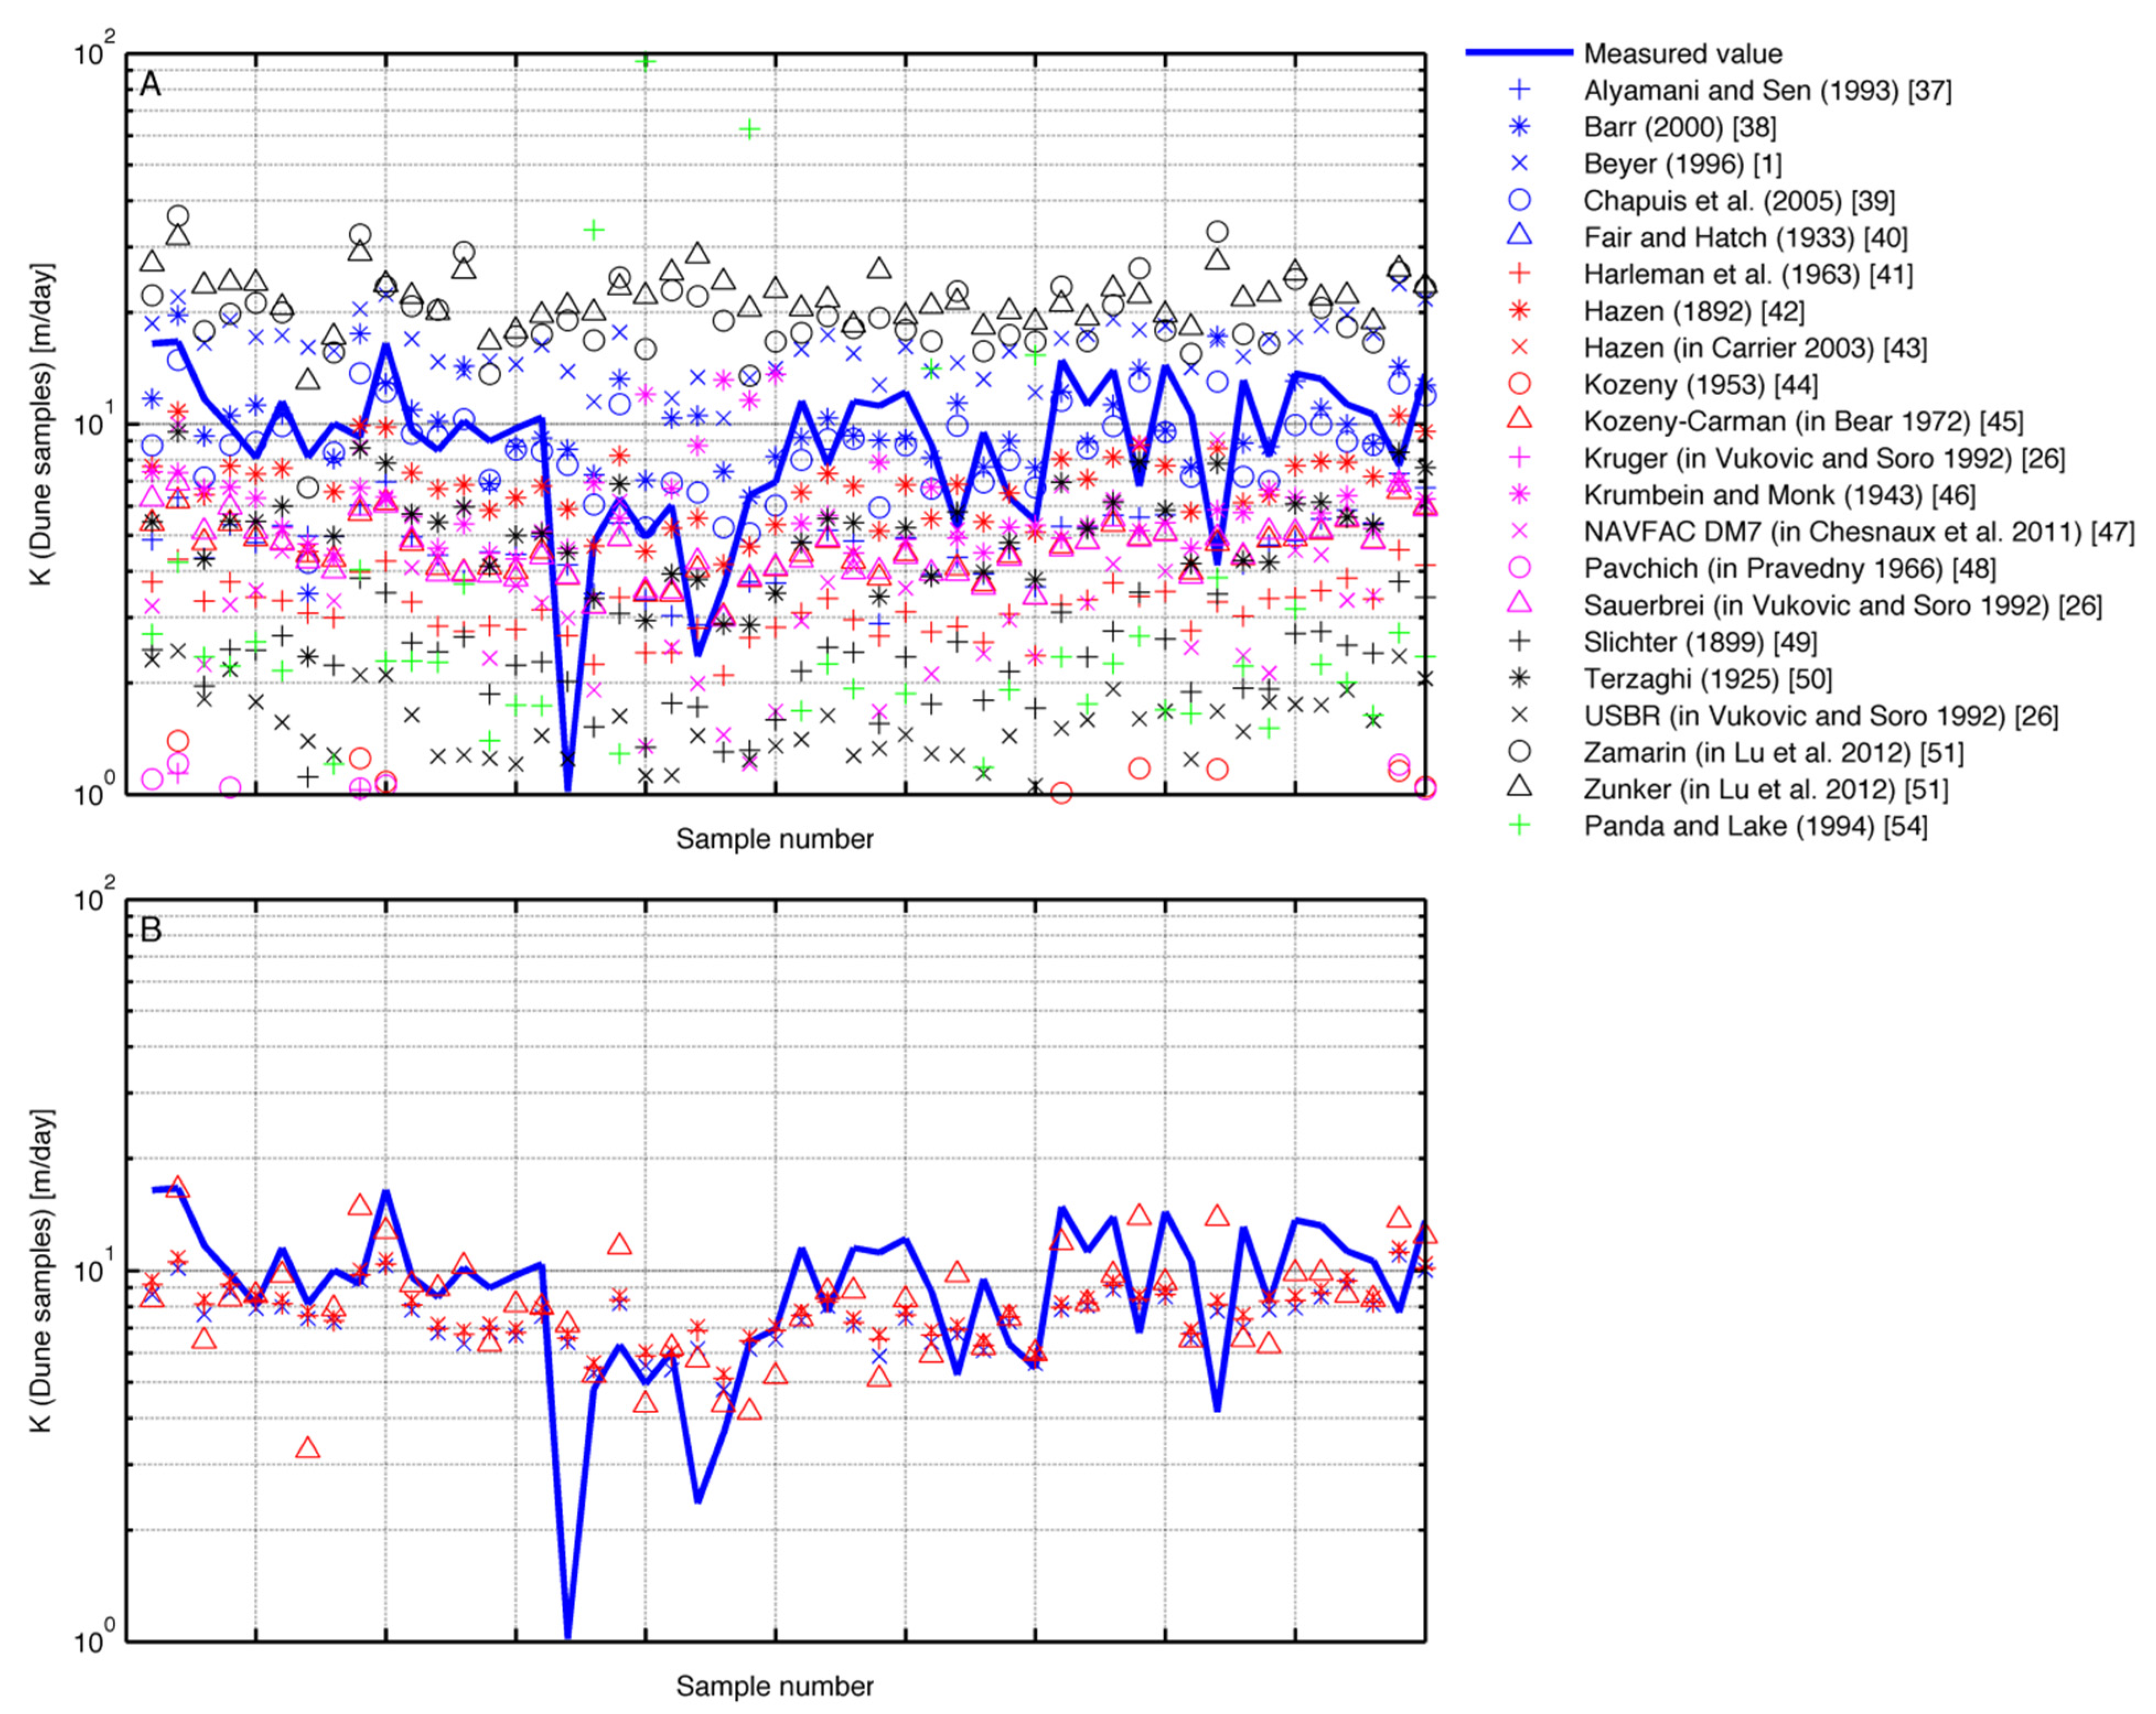
An analysis of 21 empirical methods used to estimate hydraulic conductivity from grain size analysis shows that there is a large error between measured and estimated values using most of the methods (
Figure 4A) [
37,
38,
39,
40,
41,
42,
43,
44,
45,
46,
47,
48,
49,
50,
51]. Each of the 21 methods contains somewhat different assumptions and specific equations should be applied to specific recommended sediment types, but many of these methods have not been used properly in numerous investigations, particularly by practitioners in the engineering field. It is evident in viewing this graphic that the estimate accuracy is based on the assumptions of each equation and perhaps on the properties of the sediments at the specific location being investigated. Equations for the listed methods and assumptions for use are contained in Rosas
et al. [
26]. The Beyer, Harleman, Hazen (modified) and Kozeny-Carman methods showed the best fit for hydraulic conductivity of interior dune sands in this analysis. Coefficients used by these methods were modified for dune sands in Rosas
et al. [
26] and showed a significant improvement (
Figure 4B). As shown, there is still room for additional improvement of these modified equations.
Figure 4.
Estimated hydraulic conductivity using 21 empirical methods for all Wadi Khulays dune sample compared to the measured values (blue line) (
A). (
B) Comparison of the estimated hydraulic conductivities to the measured values using the modified methods for dune interior dune sands using the modified equations in Rosas
et al. [
26].
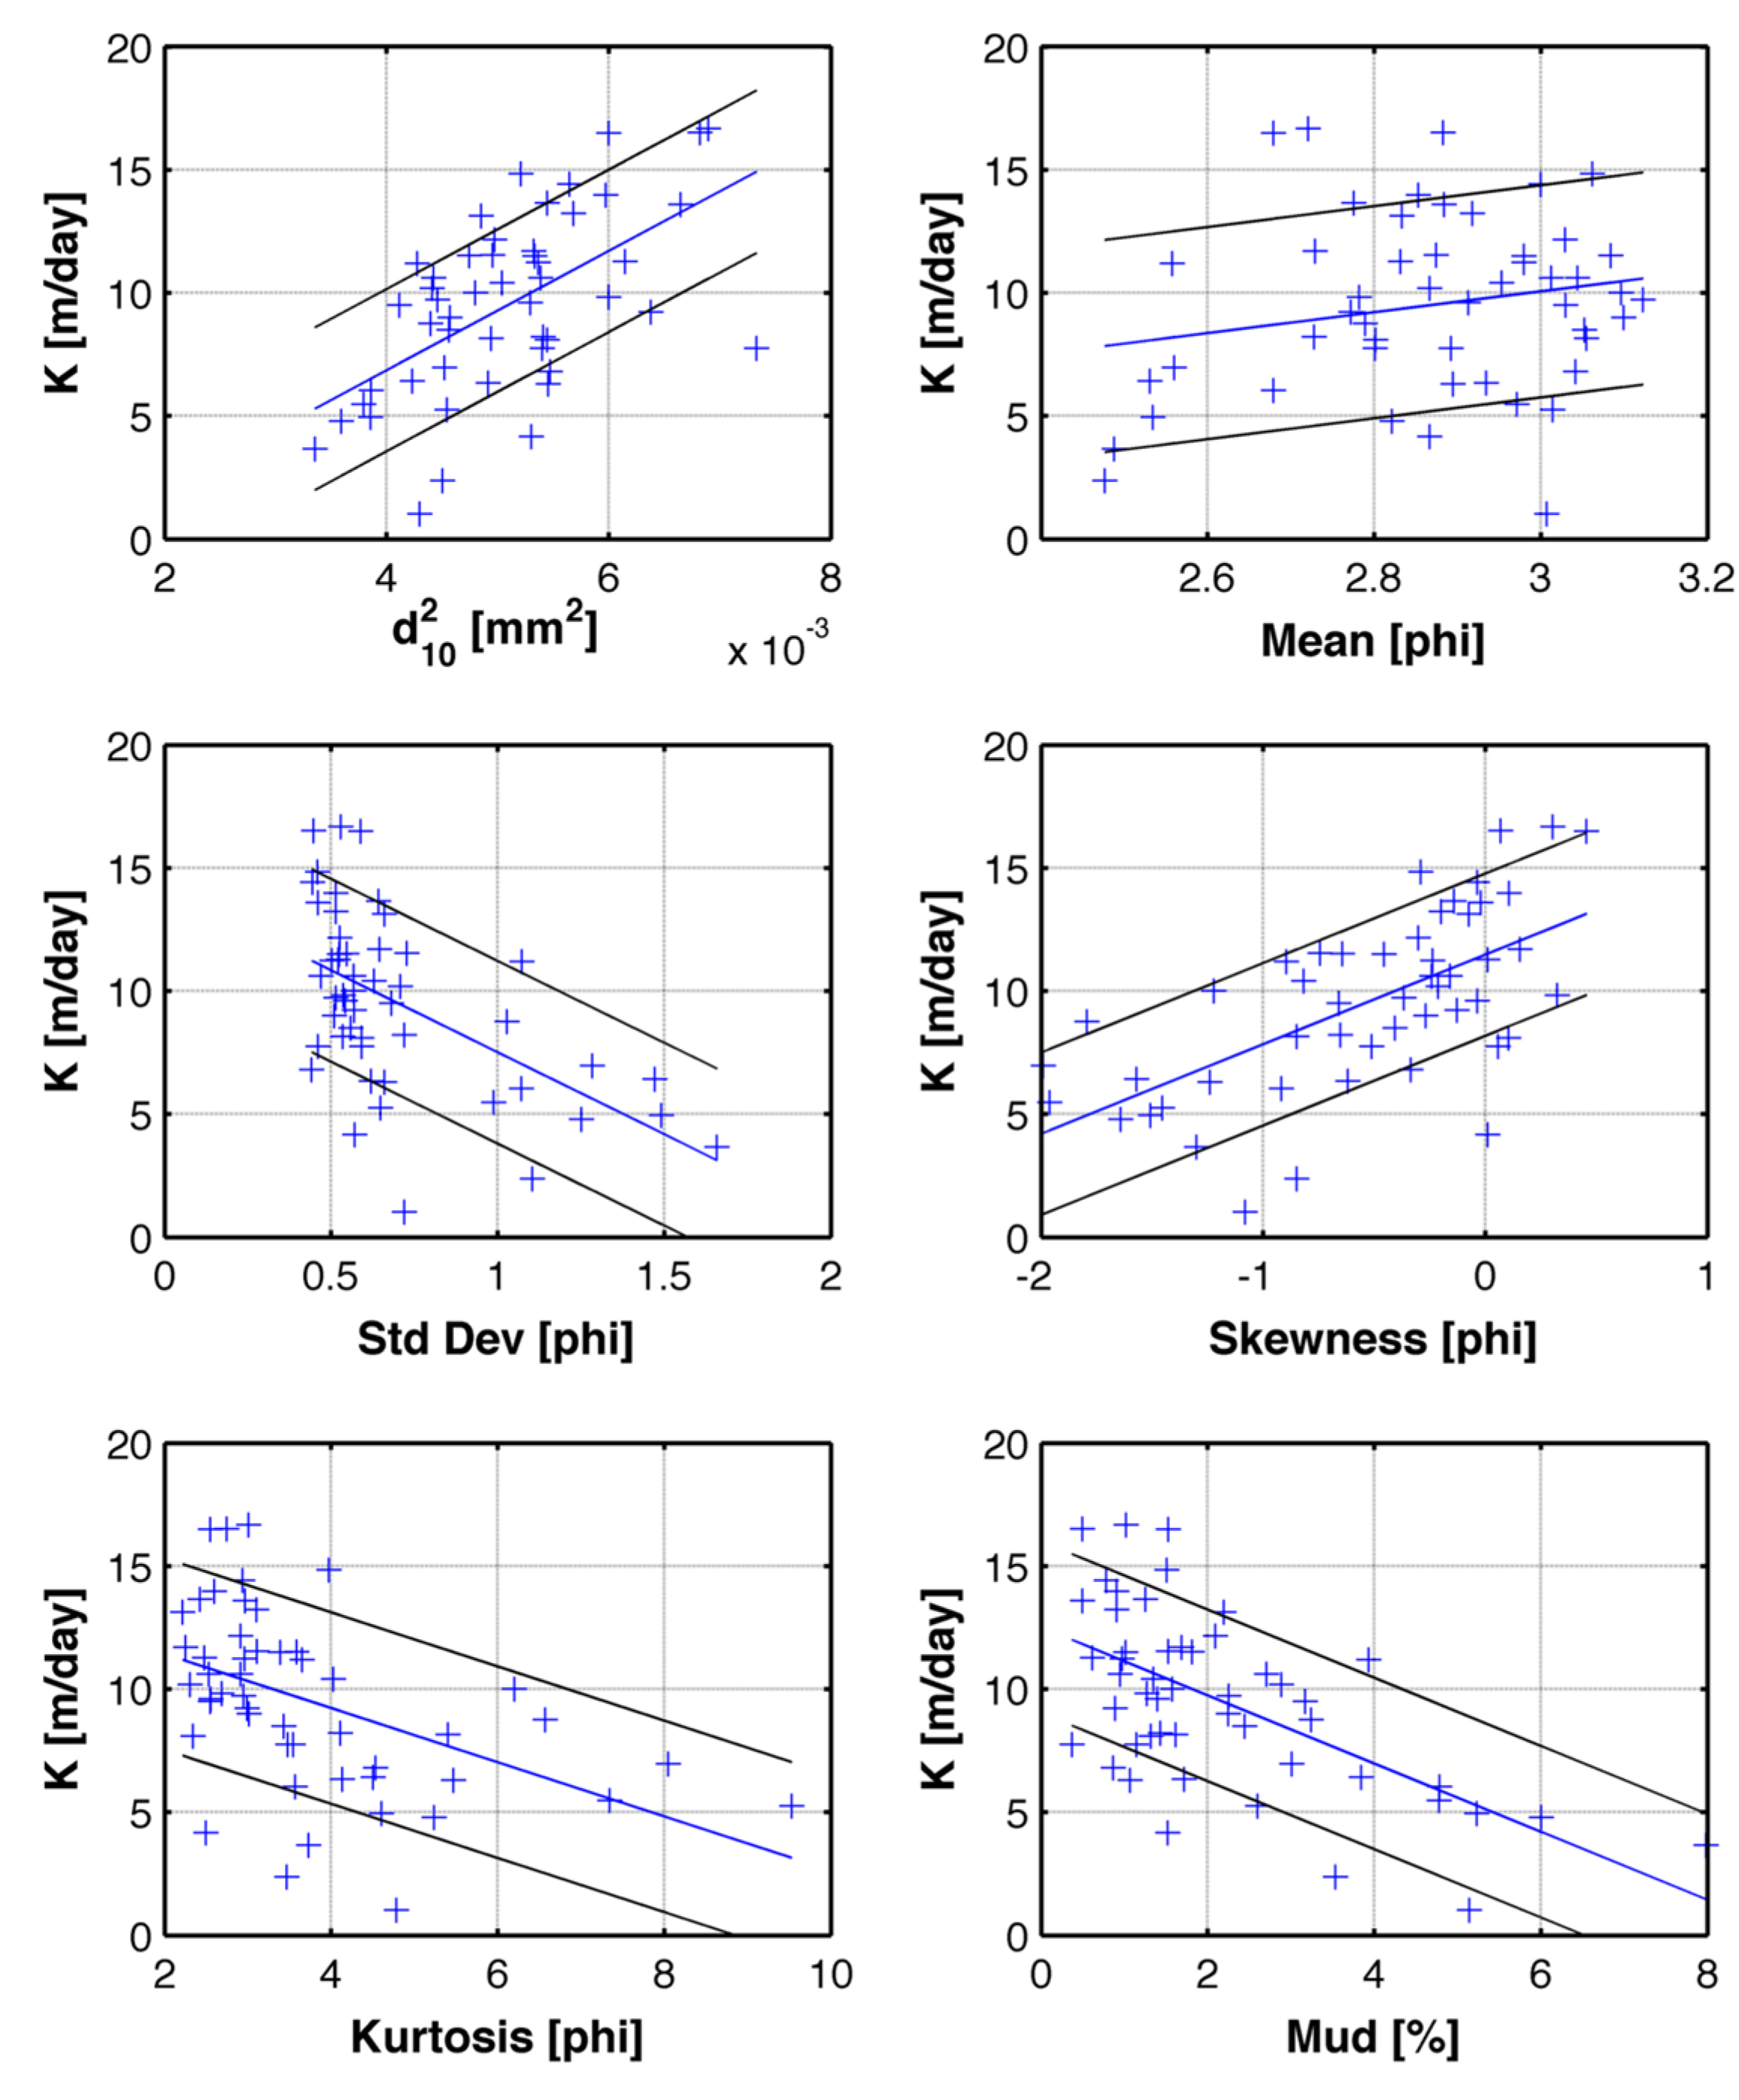
3.3. Statistical Analyses between Sediment Grain Size Properties and Hydraulic Conductivity
Linear relationships between the statistical moments and other properties of the grain size distribution
vs. measured are shown as plots in
Figure 5. The correlation coefficients R
2 and p are shown in
Table 1. The p-values are reported as −log(p) in order to compare the order of magnitude of the correlations, with a significant correlation being considered to have a value of −log(p) of 2 or more (
p < 0.01). Even though the R
2 values were very low for all the parameters considered (
R2 < 0.4), significant p-values were found for the correlation between the hydraulic conductivity and d
102, the standard deviation, skewness and kurtosis of the distribution in phi units (−log
2 mm; [
52]), as well as for the mud percentage of the sample (fraction <0.0625 mm).
Table 1.
Correlation coefficients between hydraulic conductivity and grain size distribution parameters.
Table 1.
Correlation coefficients between hydraulic conductivity and grain size distribution parameters.
| Correlated Parameters | R2 | −log(p-Value) |
|---|
| K, d102 | 0.34 | 4.9 |
| K, mean | 0.04 | 0.8 |
| K, standard deviation | 0.30 | 4.4 |
| K, skewness | 0.39 | 6.0 |
| K, kurtosis | 0.22 | 3.2 |
| K, mud | 0.37 | 5.6 |
| Mud, mean | 0.16 | 2.4 |
| Mud, standard deviation | 0.72 | 14.2 |
| Mud, skewness | 0.45 | 7.1 |
| Mud, kurtosis | 0.11 | 1.7 |
| K, | 0.56 | 4.8 |
The mud percentage in the samples was positively correlated with the standard deviation (
R2 = 0.72) and negatively correlated with the skewness of the distribution (
R2 = 0.45) (
Figure 5).
Figure 5.
Relationship between mud percentage and other grain size distribution statistical parameters.
Figure 5.
Relationship between mud percentage and other grain size distribution statistical parameters.
3.4. Optimization of the Target Equations by Inclusion of a Second Parameter
The percentage of mud was used for development of the fitting parameters (
P1 and
P2) for Equation (2).
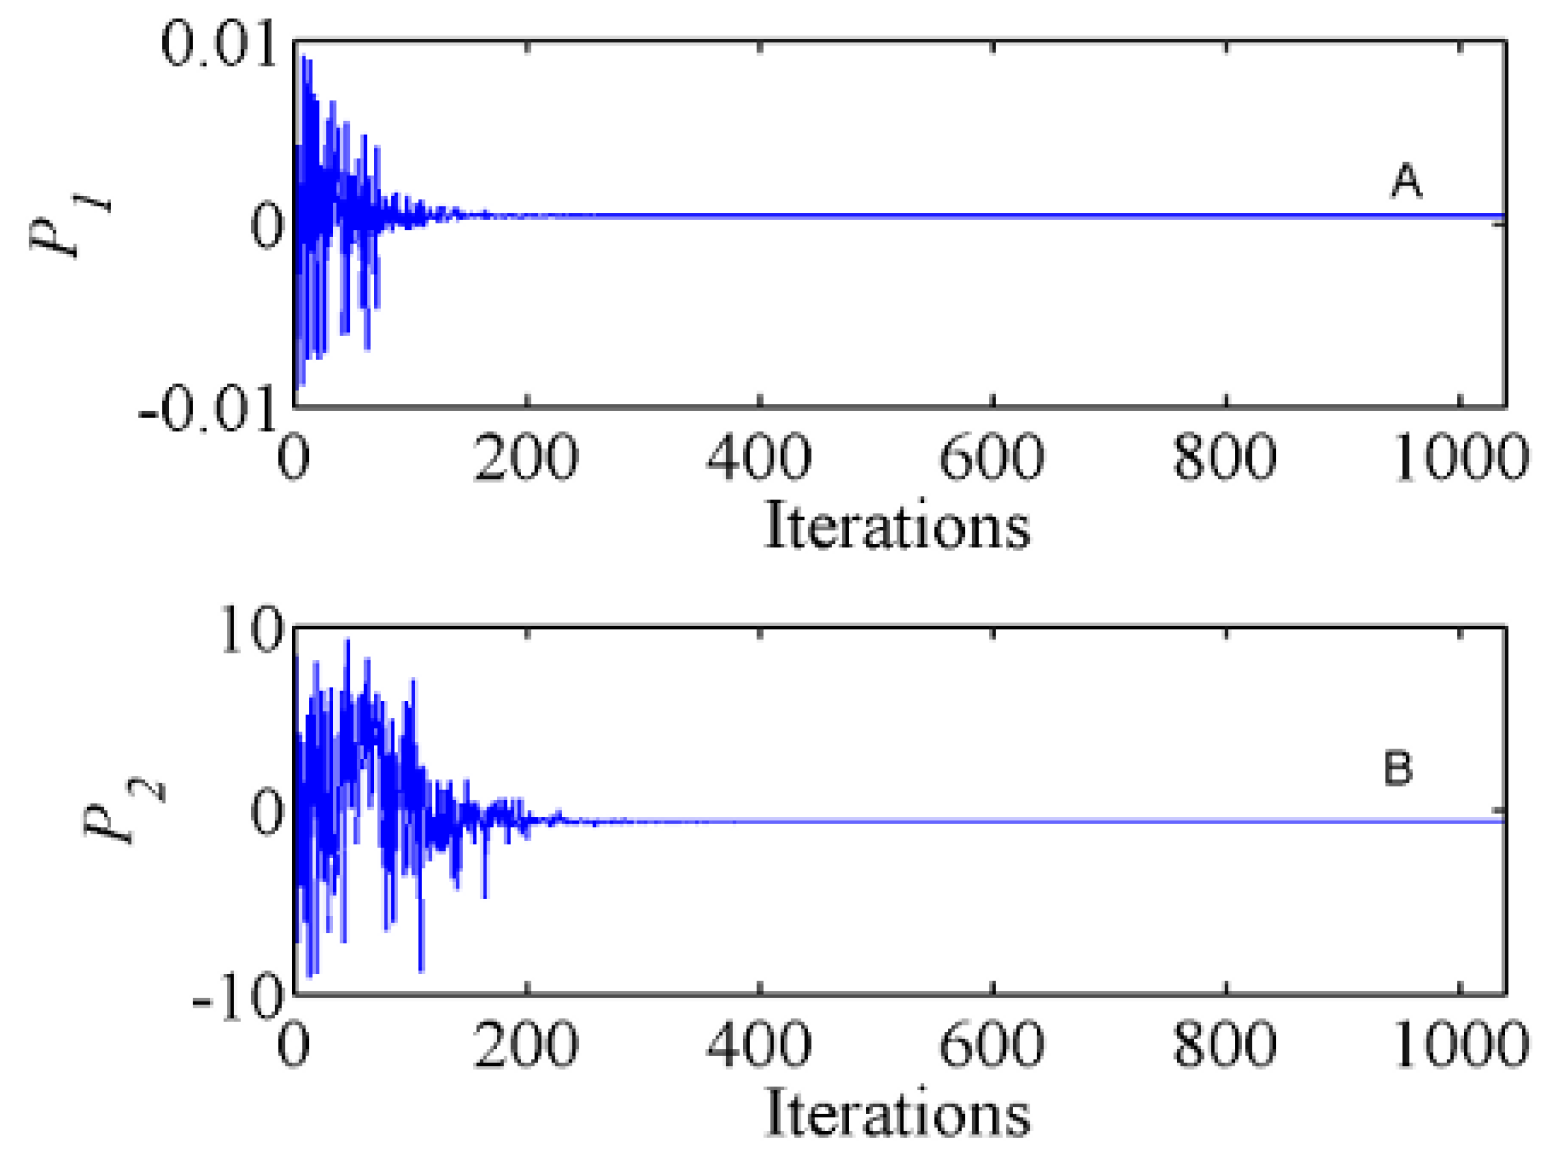
Figure 6A,B shows the convergence of the
P1 and
P2 parameters, respectively, to the global optimum values. For the inversion, the optimization parameter space was set to −1 × 10
−2 ≤
P1 ≤ 1 × 10
−2 and −10 ≤
P2 ≤ 10. In the first 180 iterations the optimization algorithm searched different parameters set in the provided parameter space and later converged to the optimum values. The stopping criterion for the inversion was specified with respect to the convergence criterion in which an optimum was assumed to be reached when the objective function did not improve by more than 0.01% in 10 successive evolution loops. The estimated parameters
P1 and
P2 were 4.0 × 10
−4 and −0.595.
Figure 6.
Convergence in the optimization of P1 and P2.
Figure 6.
Convergence in the optimization of P1 and P2.
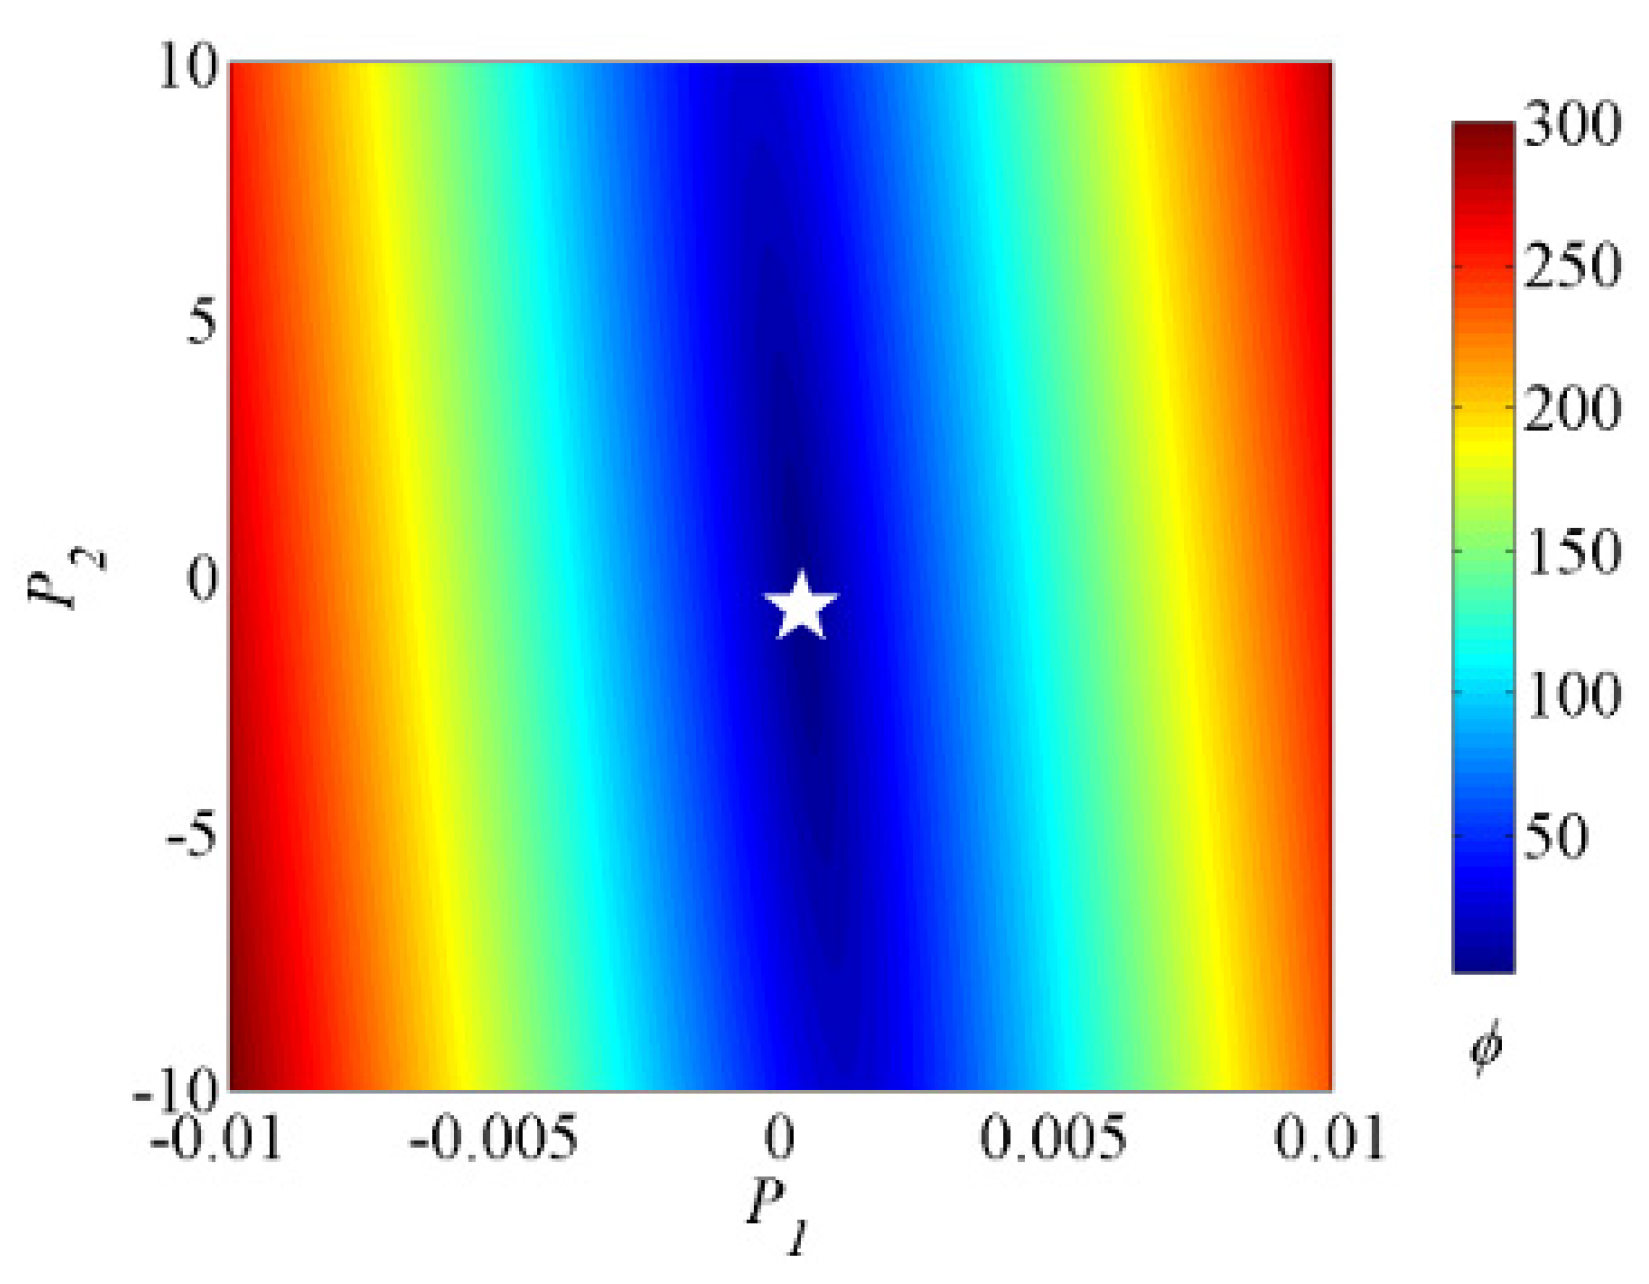
Figure 7 shows the response surfaces of the objective functions for the
P1 and
P2 parameter plane. The range of each parameter has been divided into 500 discrete values resulting in 250,000 objective function calculations for the plot. The white star marker corresponds to the solution found by the SCE optimization algorithm. Response surface analysis of the objective function is important as it provides valuable insights into the uniqueness of the inverse solution, the sensitivity of the model to the different parameters, and parameter correlations. The topography of the objective function shows that the parameters
P1 and
P2 are not correlated and a U-valley can be observed in the direction of the
P2 parameter. Furthermore, in the direction of parameter P
1, the V-shape valley of decreasing and increasing trend of the objective function shows that the objective function is more sensitive to the parameter
P1 as compared to the
P2.
Figure 7.
Response surfaces of the objective functions for P1 and P2 parameter plane.
Figure 7.
Response surfaces of the objective functions for P1 and P2 parameter plane.
Table 2 shows a comparison of the R-square and RMSE values obtained for the four best fitted empirical equations for interior dune sands: Beyer [
33], Harleman
et al. [
41], Hazen [
42] and Kozeny-Carmen [
45], and the new equation by including mud (%) and two fitting parameters. The fitting parameters were estimated by inversion using first 25 measurements and for the rest of the measurements model hydraulic conductivity was estimated by using the estimated fitting parameters in the new equation. Values of R
2 and RMSE indicate that the new equation estimates modeled hydraulic conductivity close to the measured hydraulic conductivity. The RMSE improvement is calculated with respect to Equation (2).
Table 2.
Performance of empirical equations.
Table 2.
Performance of empirical equations.
| Equation | R2 | RMSE (m/day) | RMSE Improvement (%) |
|---|
| Beyer | 0.60 | 3.04 | 25% |
| Harleman | 0.59 | 3.01 | 23% |
| Hazen | 0.59 | 3.03 | 24% |
| Kozeny-Carmen | 0.36 | 3.38 | 38% |
| Equation (2) | 0.61 | 2.44 | |
4. Discussion
The patterns along the cross-section of the dunes were similar for the d10 value, the mud percentage and the hydraulic conductivities; dune crests showed higher hydraulic conductivities and d10 values, as well the lowest mud content, which were progressively lower (hydraulic conductivity and d10) and higher (mud percentage) towards the extremities of the dune.
Since the dunes are constantly being turned over by physical processes (wind action and gravity), the patterns reveal the vertical distribution of the properties inside the dune. Sediments within the interdune areas were poorly sorted as indicated by a higher standard deviation. Coarser gravelly grains tend to accumulate in these areas due to gravity, and these larger grains offer a protection for the finer particles against wind erosion. Most of the samples were negatively skewed except for a number of samples collected from the crests.
Most of the equations found in the literature for the determination of hydraulic conductivity from grain size distribution use the square of the d
10 value and a function of the porosity [
26]. The porosity of the dune sands from the Wadi Khulays dune field was determined to be relatively uniform and therefore the effect of porosity on the hydraulic conductivity could not be evaluated.
The skewness of the grain distribution, as well as the mud content showed a statistically significant correlation with the hydraulic conductivity. None of the equations used in the Rosas
et al. [
26] study make use of the skewness in the distribution. Panda and Lake [
53] modified the Kozeny-Carman equation to include a corrective factor based on the skewness and coefficient of variation (
where
is the mean grain diameter) of the particle size distribution (psd). The equation was found to underestimate the hydraulic conductivity of the dune sands and is problematic for a number of samples with high standard deviation in the psd (
Figure 4). Krumbein and Monk [
46] use the standard deviation of the distribution in phi units, however, the estimated hydraulic conductivities by this method were shown to be ineffective in determining the values for dune sands (
Figure 4; [
26]). Moreover, evaluating the statistical moments of the grain size distribution is not a straightforward task. Because the mud percentage is significantly correlated with both the hydraulic conductivity values and the skewness of the distribution, it was selected as a proxy parameter that can be used to improve the effectiveness in determining the hydraulic conductivity from grain size distribution.
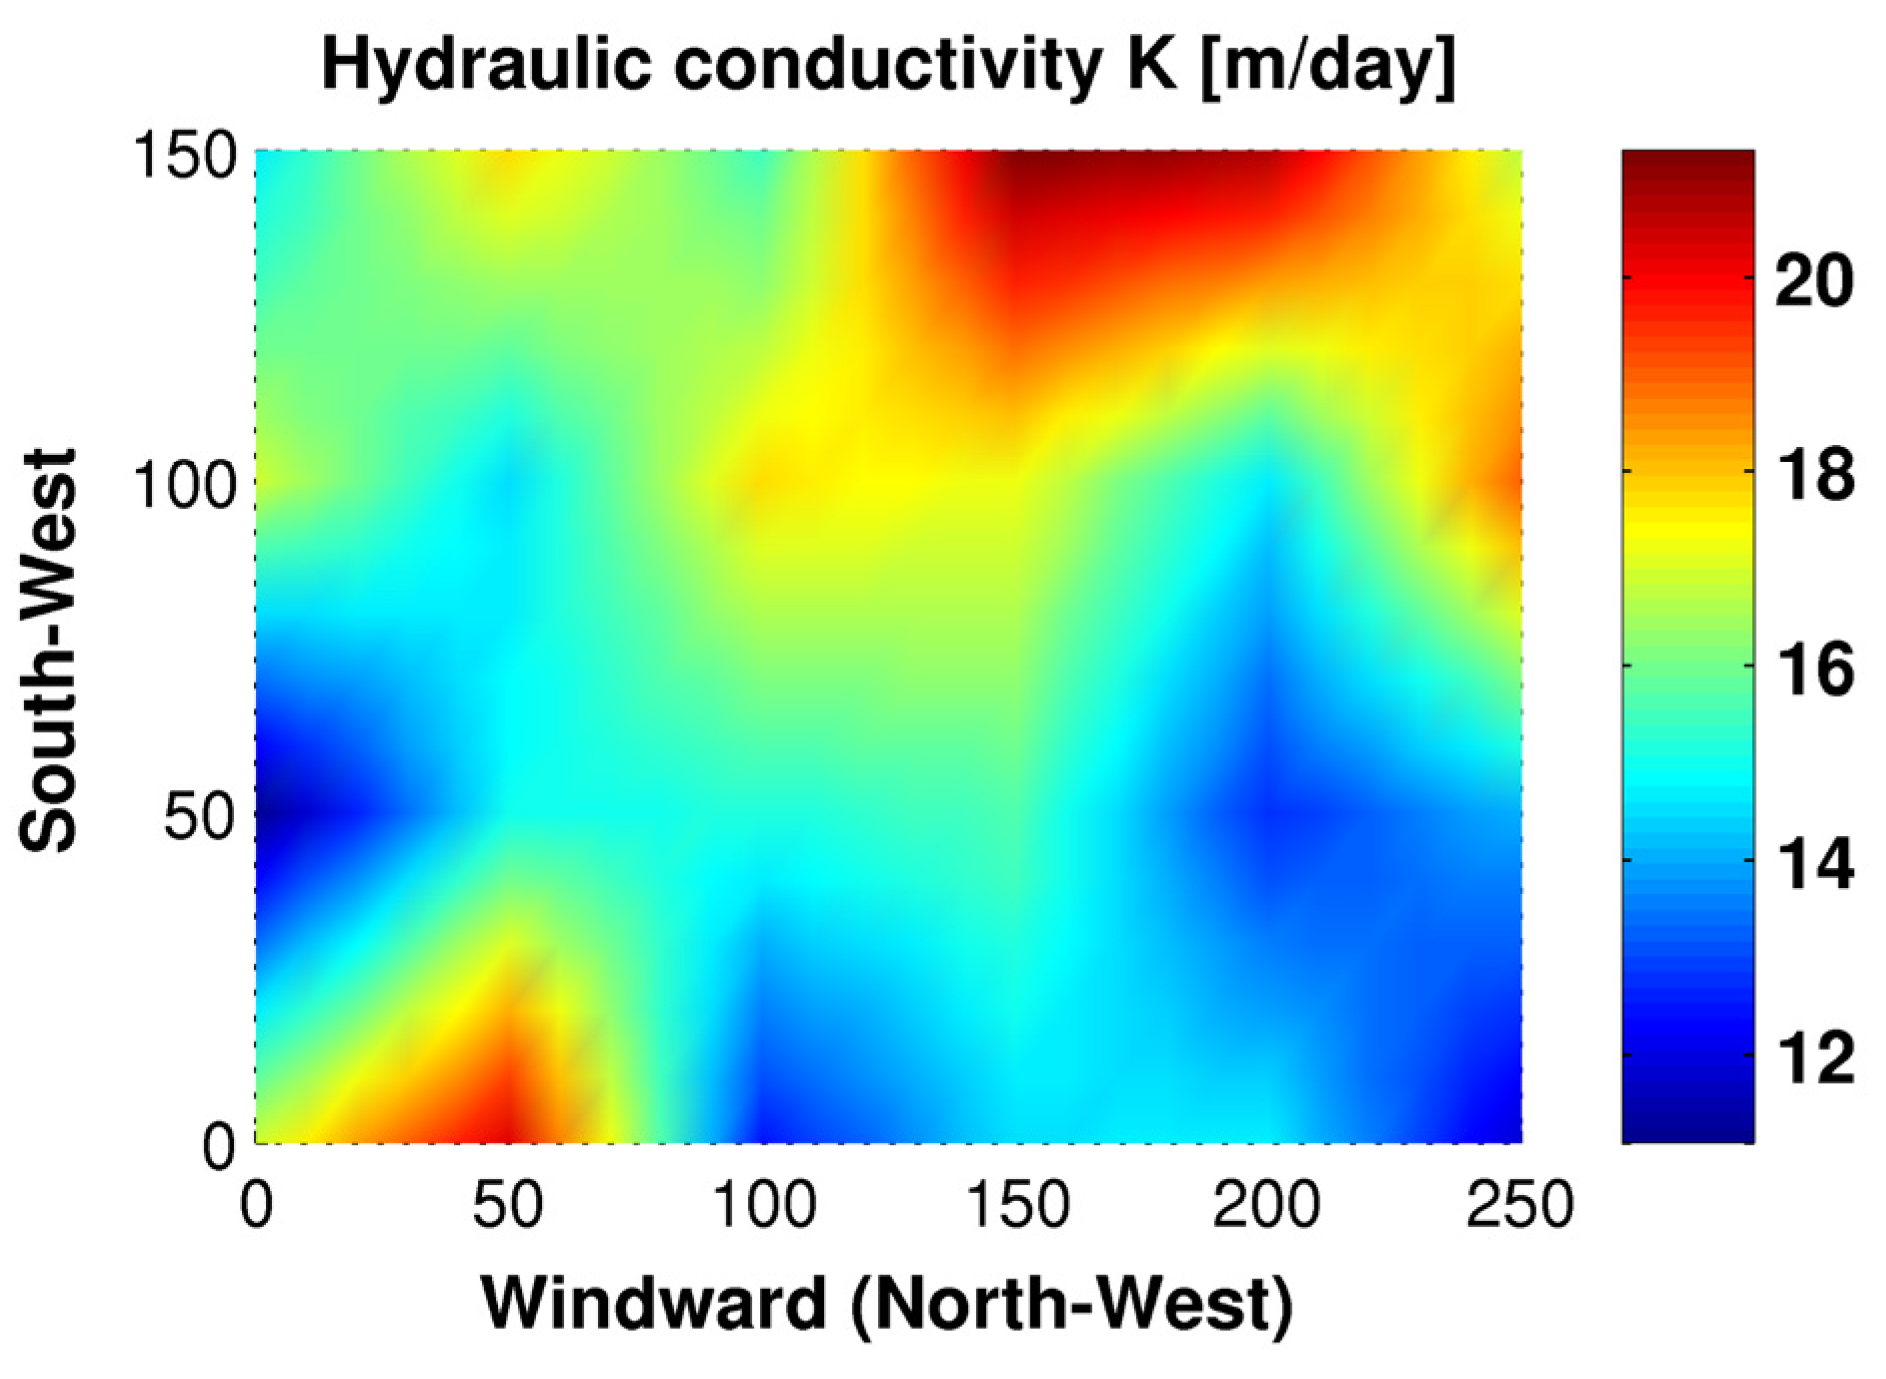
The ability to accurately predict the hydraulic conductivity of several samples from grain size distribution should significantly reduce the effort in the characterization of large areas, such as dune fields. In this study, the inclusion of the mud term significantly reduced the RMSE of the predicted hydraulic conductivity values. This allowed for the calculation of the spatial distribution of the hydraulic properties over a large area of the dune field by measuring only the grain size distribution parameters and applying Equation (2) (
Figure 8). Since the porosity of the dune sands was relatively uniform, the function of the porosity was assumed to be constant. This approach may be used in large dune areas to determine the appropriate locations for water infiltration or can be correlated with the infiltration rate in dune recharge studies.
Figure 8.
Spatial distribution of the hydraulic conductivity along the dune crests in a selected site within the dune field.
Figure 8.
Spatial distribution of the hydraulic conductivity along the dune crests in a selected site within the dune field.
Since the samples used to develop the equation were relativity small in volume compared to the full dimensions of the dunes, the issue of scale needs to be addressed in that small samples commonly tend to underestimate the bulk hydraulic conductivity of an aquifer [
54]. Larger scale measurement methods used to assess saturated aquifer systems, such as standard aquifer performance tests or tracer tests, almost always yield higher average hydraulic conductivity values based on the occurrence of bedding or diagenetic enhancement of hydraulic conductivity within an aquifer. While dune aquifers are not homogeneous and isotopic, they approach this condition better than almost any other type of aquifer, especially when located near or at land surface. Therefore, use of the new equation to determine the average hydraulic conductivity of a dune system will yield a reasonable estimate, perhaps on the low end of the actual average value. Within other types of aquifer systems, the error of using grain size distribution to estimate hydraulic conductivity becomes greater, especially as the heterogeneity of the sediment increases, as found by Rosas
et al. [
26].
5. Conclusions
Evaluating the hydraulic properties of dune sands is an important task in understanding recharge and in designing artificial storage and recovery systems in dune aquifer systems. The vertical distribution of these properties inside most dunes, except where there are internal mud layers, can be obtained by measuring the grain size distribution along the cross-section of the dune. Furthermore, there is interest in reducing the effort in estimating the hydraulic properties of dune sands over a large area. This can be achieved by the use of empirical relationships between grain size distribution parameters and the hydraulic conductivity.
Significant correlations between the hydraulic conductivity values of dune sands and their grain size distribution parameters were found, especially for the skewness of the distribution and the mud content, as well as with the d10 value, which is commonly used in empirical equations for determining the hydraulic conductivity. While the relationship of the hydraulic conductivity and the skewness is significant, its influence can be accounted for by the use of a proxy parameter, the mud content, which showed high correlations with both the skewness and hydraulic conductivity of the samples. Finally, the porosity of the dune sands is very uniform at a high porosity of 0.39, with a standard deviation of 0.02. Therefore, an accurate estimation of the hydraulic conductivity can be obtained by employing an empirical equation using the d10 value, the mud percentage of the sample and two optimized coefficients. This approach can be used to study the spatial distribution of dune sands in larger areas. Application of the new empirical equation developed from this research will improve estimates of hydraulic conductivity for interior dune fields, but may not be applied to coastal dune fields that tend to contain coarser sand, have a higher d10 value, and contain little or no mud.
The data and analysis confirms the first research hypothesis that large errors occur between estimated and measured saturated hydraulic conductivity using the published empirical equations. The second hypothesis concerning the statically significant relationship between the measured and estimated hydraulic conductivity and mud percentage is confirmed. The hypothesis concerning a significant statistical relationship between the hydraulic conductivity and the dispersion is not supported, but a statistically significant relationship with skewness was confirmed. A confirmation of the last hypothesis shows that the use of inversion modeling using the mud percentage with one of the existing empirical equations leads to improved estimation of hydraulic conductivity. The technique did make a slight reduction in error of prediction compared to the modified equations developed by Rosas
et al. [
26].
Detailed design of aquifer recharge systems in dune field settings does require that a number of field and laboratory tests should be performed to assess the saturated and unsaturated hydraulic conductivity (vertical and horizontal) using more sophisticated methods, such as double-ring infiltrometer tests and measurements made using undisturbed cores (if they can be collected) and aquifer performance tests where the sand is saturated. However, the relationship between grain size distribution and hydraulic conductivity can be used as a rapid scanning tool, to add data between detailed tests (populating a model grid), and for estimation in locations where large amounts of grain size data have been published (data mining and reanalysis). The estimation of saturated hydraulic conductivity from grain size analysis is therefore useful particularly in the planning of large-scale managed aquifer recharge projects, but cannot replace more detailed analytical methods used in design.


