Article

Simulation of Groundwater-Surface Water Interactions under Different Land Use Scenarios in the Bulang Catchment, Northwest China

1
School of Water Resources and Environment, China University of Geosciences (Beijing), Beijing 10083, China
2
UNESCO-IHE Institute for Water Education, PO Box 3015, Delft 2601 DA, The Netherlands
3
Institute of Huai River Water Resources Protection, Bengbu 233001, China
4
Faculty of Civil Engineering and Geosciences, Water Resources Section, Delft University of Technology, PO Box 5048, Delft 2600 GA, The Netherlands
*
Author to whom correspondence should be addressed.
Water 2015, 7(11), 5959-5985; https://doi.org/10.3390/w7115959
Submission received: 11 July 2015 / Revised: 12 October 2015 / Accepted: 26 October 2015 / Published: 30 October 2015
(This article belongs to the Special Issue Water Resources Assessment and Management in Drylands)

Abstract

:
Groundwater is the most important resource for local society and the ecosystem in the semi-arid Hailiutu River catchment. The catchment water balance was analyzed by considering vegetation types with the Normalized Difference Vegetation Index (NDVI), determining evapotranspiration rates by combining sap flow measurements and NDVI values, recorded precipitation, measured river discharge and groundwater levels from November 2010 to October 2011. A simple water balance computation, a steady state groundwater flow model, and a transient groundwater flow model were used to assess water balance changes under different land use scenarios. It was shown that 91% of the precipitation is consumed by the crops, bushes and trees; only 9% of the annual precipitation becomes net groundwater recharge which maintains a stable stream discharge in observed year. Four land use scenarios were formulated for assessing the impacts of land use changes on the catchment water balance, the river discharge, and groundwater storage in the Bulang catchment. The scenarios are: (1) the quasi natural state of the vegetation covered by desert grasses; (2) the current land use/vegetation types; (3) the change of crop types to dry resistant crops; and (4) the ideal land use covered by dry resistant crops and desert grasses, These four scenarios were simulated and compared with measured data from 2011, which was a dry year. Furthermore, the scenarios (2) and (4) were evaluated under normal and wet conditions for years in 2009 and 2014, respectively. The simulation results show that replacing current vegetation and crop types with dry resistant types can significantly increase net groundwater recharge which leads to the increase of groundwater storage and river discharges. The depleted groundwater storage during the dry year could be restored during the normal and wet years so that groundwater provides a reliable resource to sustain river discharge and the dependent vegetations in the area.

1. Introduction

Water is the most important limiting factor for agricultural production and ecosystem protection in semi-arid conditions [1]. To maintain a delicate balance between the protection of the ecosystem and the sustainable development of local society is critical task in semi-arid regions. Optimizing water use efficiency for agricultural crops [2] is a key approach to mitigate water shortages and to reduce environmental problems in arid and semi-arid regions. Along with the water shortage limitation for agricultural productivity, the desertification has been controlled by planting shrubs as ecosystem rehabilitation measures in recent decades in the semi-arid parts of northwest China [3]. However, the water balance in semi-arid catchments can be significantly influenced by vegetation type [4], irrigation schedules [5], and groundwater irrigation [5]. Brown et al. [6] determined that the changes in water yield at various time scales were a result of permanent changes in the vegetation cover by means of mean annual water balance model. Jothityangkoon et al. [7] concluded that spatial variability of soil depths appears to be the most important controlling parameter for runoff variability at all time and space scales, followed by the spatial variability of climate and vegetation cover in semi-arid catchments. The differences in water balance components between a number of temperate and semi-arid catchments in Australia can be attributed to the variability of soil profile characteristics like water storage capacity and permeability, vegetation coverage and water use efficiency, rainfall, and potential evaporation [8]. Scott et al. [9] indicated that grassland relies primarily on recent precipitation, while the tree/shrub obtained water from deeper parts of the soil profile in the semi-arid riparian floodplain of the San Pedro River in southeastern Arizona. Planting of shrub seedlings can significantly enhance topsoil development on the dune surface and stabilizing the sand dunes [10], but the water consumption of artificially introduced plants and the effects on the water balance have not been investigated.
Land use management and rehabilitation strategies would have significant impact on the catchment water balance and hence on water yield and groundwater recharge [11]. Consequently, understanding impacts of land use change on the catchment water balance dynamics is critical for sustainable water resources management. Stream flow [12,13,14], flow regime [15], and the river water quality [16,17] can be influenced by the change of land use/land cover in the catchment. Compared with the mechanism of land use effects on the surface water, the groundwater recharge [18,19], discharge [20,21], levels [22], hydrochemistry and contamination [23], and nitrate concentrations [24,25,26,27] can be indirectly affected by the land use changes through infiltration. Krause et al. [28] assessed the impacts of different strategies for managing wetland water resources and groundwater dynamics of landscapes based on the analysis of model simulation results of complex scenarios for land-use changes and changes of the density of the drainage-network, but regional groundwater modeling studies are often hampered by data scarcity in space and time especially in semi-arid regions [29]. Thus, the estimation of areal inputs such as precipitation and actual evapotranspiration (ET) is essential for groundwater model studies. Actual ET corresponds to the real water consumption and is usually estimated by considering weather parameters, crop factors, management and environmental conditions [30]. Despite of some uncertainties and inconsistencies in the results, remote sensing is a useful technique for the study of groundwater hydrology and has aided the successful location of important groundwater resources [31]. Remote sensing and Geographic Information Systems (GIS) have been used for the investigation of springs [32], determining the groundwater dependent ecosystems [33], determining the recharge potential zones [34], mapping groundwater recharge and discharge areas [35], detecting potential groundwater flow systems [36], and monitoring infiltration rates in semi arid soils [37]. Remote sensing data can be employed for estimating the ET by means of energy balance methods, statistical methods using the difference between surface and air temperature, surface energy balance models, and spatial variability methods at different scales [38]. Remote sensing and the Normalized Difference Vegetation Index (NDVI) have been widely employed for estimating groundwater evapotranspiration [39,40], investigating the relationship between vegetation growth and depth to groundwater table [41,42,43,44], and accessing groundwater recharge fluxes [45]. Many researchers have conducted direct measurements like the sap flow method which uses the stem heat balance technique [46], and scaled these values to the catchment level transpiration [47]. The remote sensing could offer the relevant spatial data and parameters at the appropriate scale for use in distributed hydrological models [48] and groundwater models [49,50]. Those studies trend to utilize the areal ET calculated from the theory of surface energy balance with remote sensing data at lager scale. However, few studies have been conducted on simulating the groundwater response to different land use scenarios by determining areal ET using field measurements and remote sensing data in semi-arid regions particularly in Asia.
Most recent studies focus on the simulation of land use or climate change impacts for improving the water use efficiency for agricultural production, but few have been conducted on artificially introduced plants for stabilizing sand dunes and the effects on the water resources in semi-arid regions. Since evapotranspiration from crops and shrubs dominate groundwater discharge in semi-arid catchments [51], a balance must be achieved between land use (prevention of desertification) and water resources conservation for agricultural and other purposes. Sap flow measurements can directly provide transpiration rates of the individual vegetation in carefully selected sites. However, the uncertainty of estimating areal ET rates varies in space and time through the necessary up-scaling for the areal computation. Remote sensing technologies have been recently employed for calculating the areal ET by means of energy balance at large scale, but few were conducted using combined field measurements and remote sensing data (NDVI) in semi-arid regions. Multiple procedures have been employed in this study in order to evaluate the influence of land use management on hydrological processes in the semiarid Bulang catchment. The methods used in this study consisted of identifying vegetation types with NDVI values, determining evapotranspiration rates with sap flow measurements in the field, and computing the areal ET rates by a combination of remote sensing data (NDVI) and field measurements. Impacts of different land use scenarios on water resources were simulated by a groundwater model with the aid of combined field measurements, remote sensing, and GIS techniques, which reveals the catchment water balance in the sandy region of the middle section of the Yellow River Basin. The results provide scientific information to support rational land use management and water resources conservation in semi-arid areas.

2. Materials and Methods
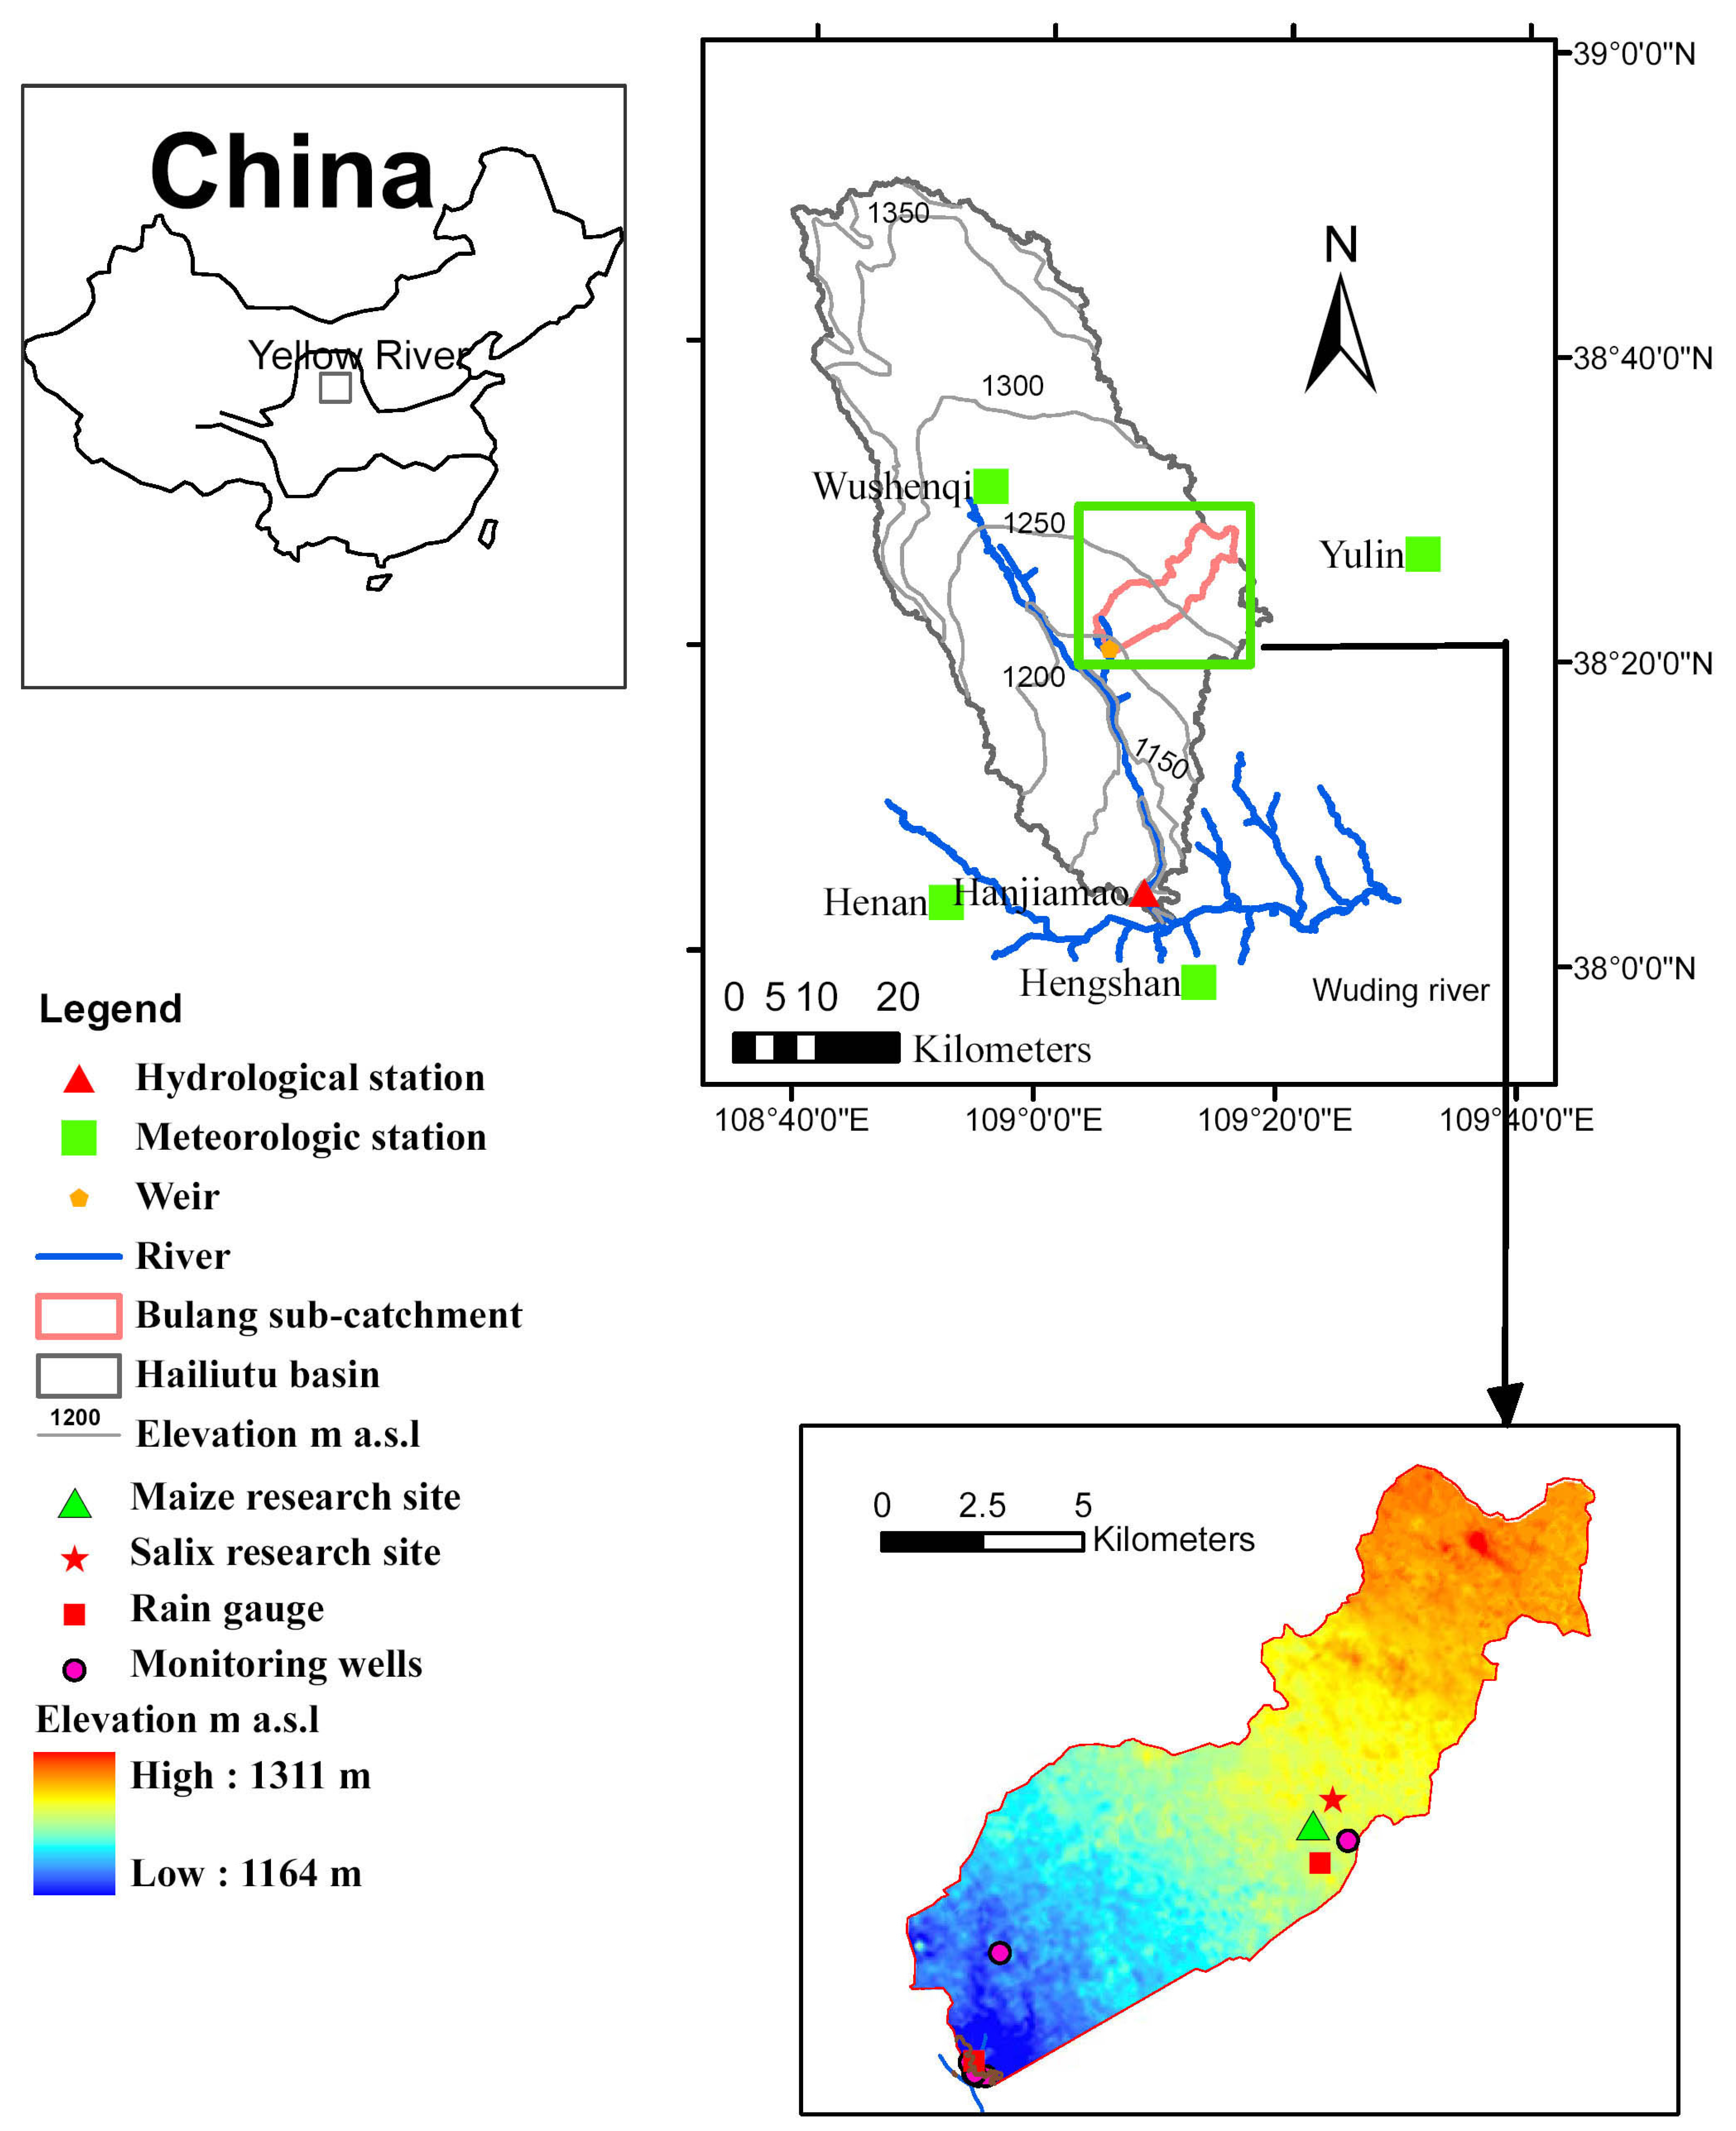
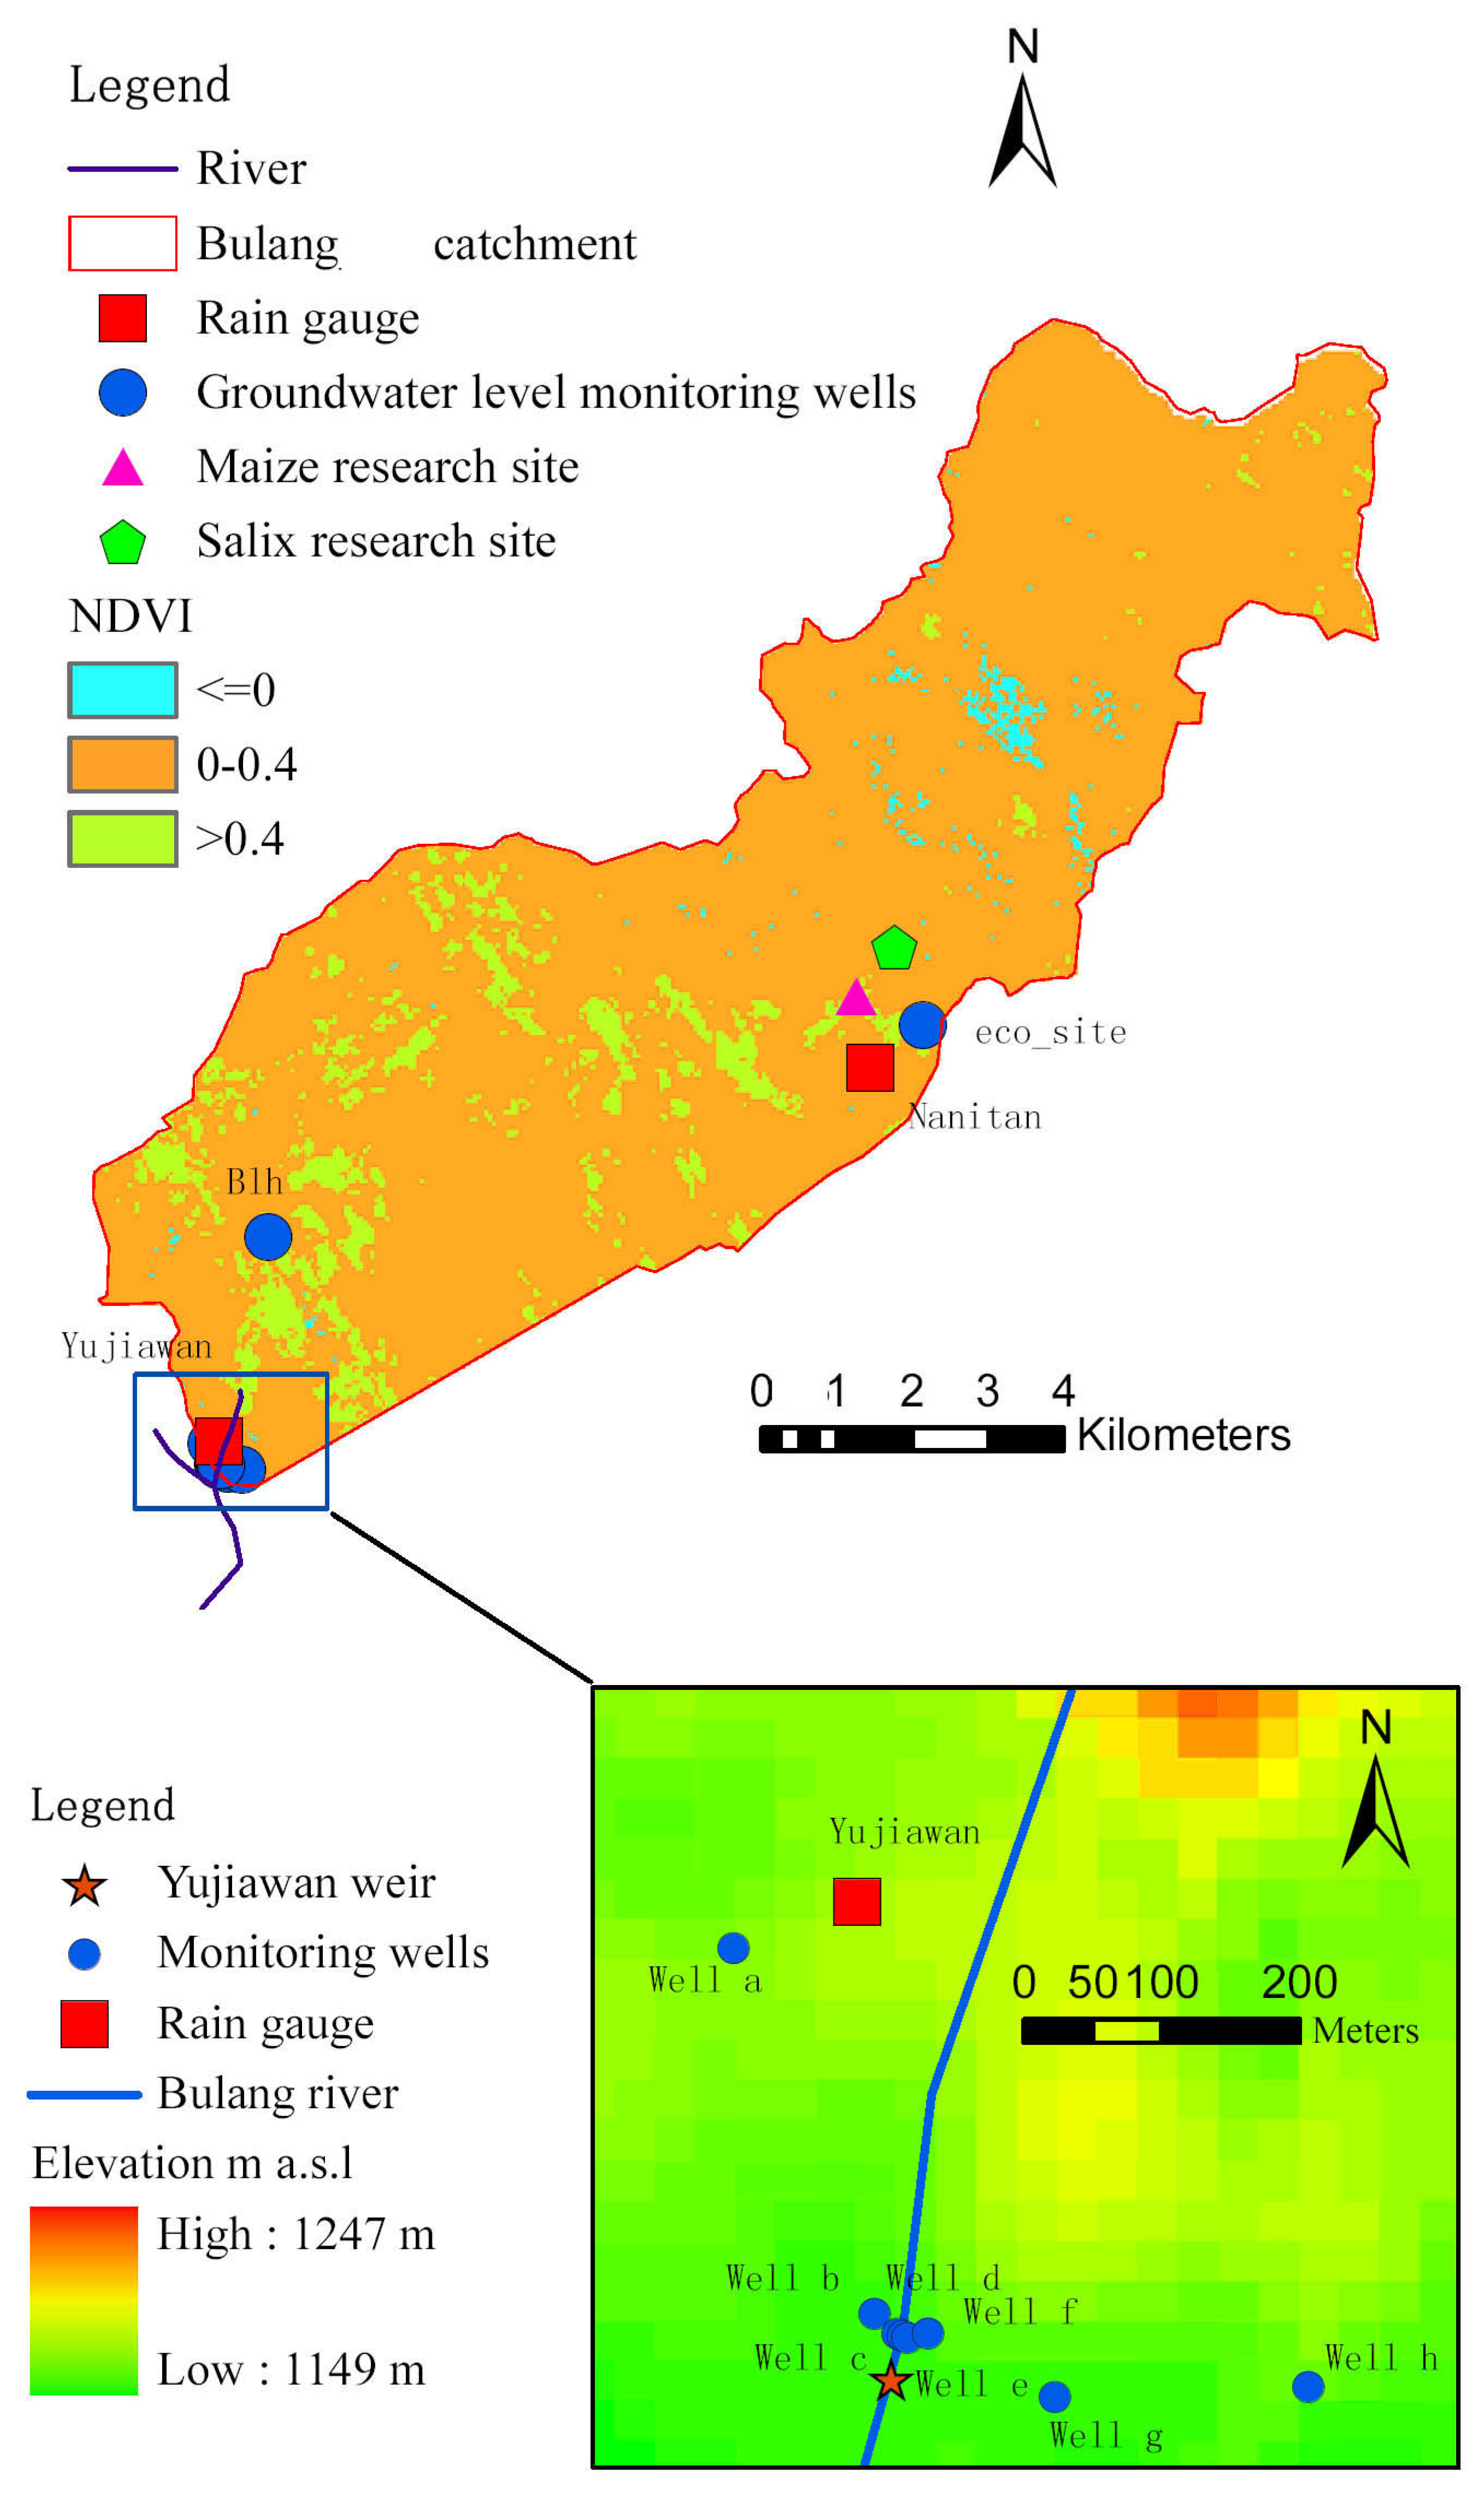
2.1. Study Area

The Bulang River is a tributary of the Hailiutu River, which is located in the middle reach of the Yellow River in northwest China (Figure 1). Located in a semi-arid region, the total area of the Bulang catchment is 91.7 km2. The land surface is characterized by undulating sand dunes, scattered desert bushes (Salix Psammophila), cultivated croplands (Zea mays), and a perennial river in the southwestern downstream area. The surface elevation of the Bulang catchment ranges from 1300 m at the northeastern boundary to 1160 m above mean sea level at the catchment outlet in the southwest. The long-term annual average daily mean temperature is 8.1 °C and the monthly mean daily air temperature is below zero in the winter time from November until March. The mean annual precipitation measured at the nearby Wushenqi meteorological station for the period 1984 to 2011 was 340 mm/year. Precipitation mainly falls in June, July, August and September. The mean annual pan evaporation (recorded with an evaporation pan with a diameter of 20 cm) is 2184 mm/year (Wushenqi metrological station, 1985–2004). The geological formations in the Bulang catchment mainly consist of four strata (1) the Holocene Maowusu sand dunes with a thickness from 0 to 30 m; (2) the upper Pleistocene Shalawusu formation (semi consolidated sandstone) with a thickness of 5 to ~90 m; (3) the Cretaceous Luohe sandstone with a thickness of 180 to ~330 m; and (4) the underlying impermeable Jurassic sedimentary formation.

2.2. Methods

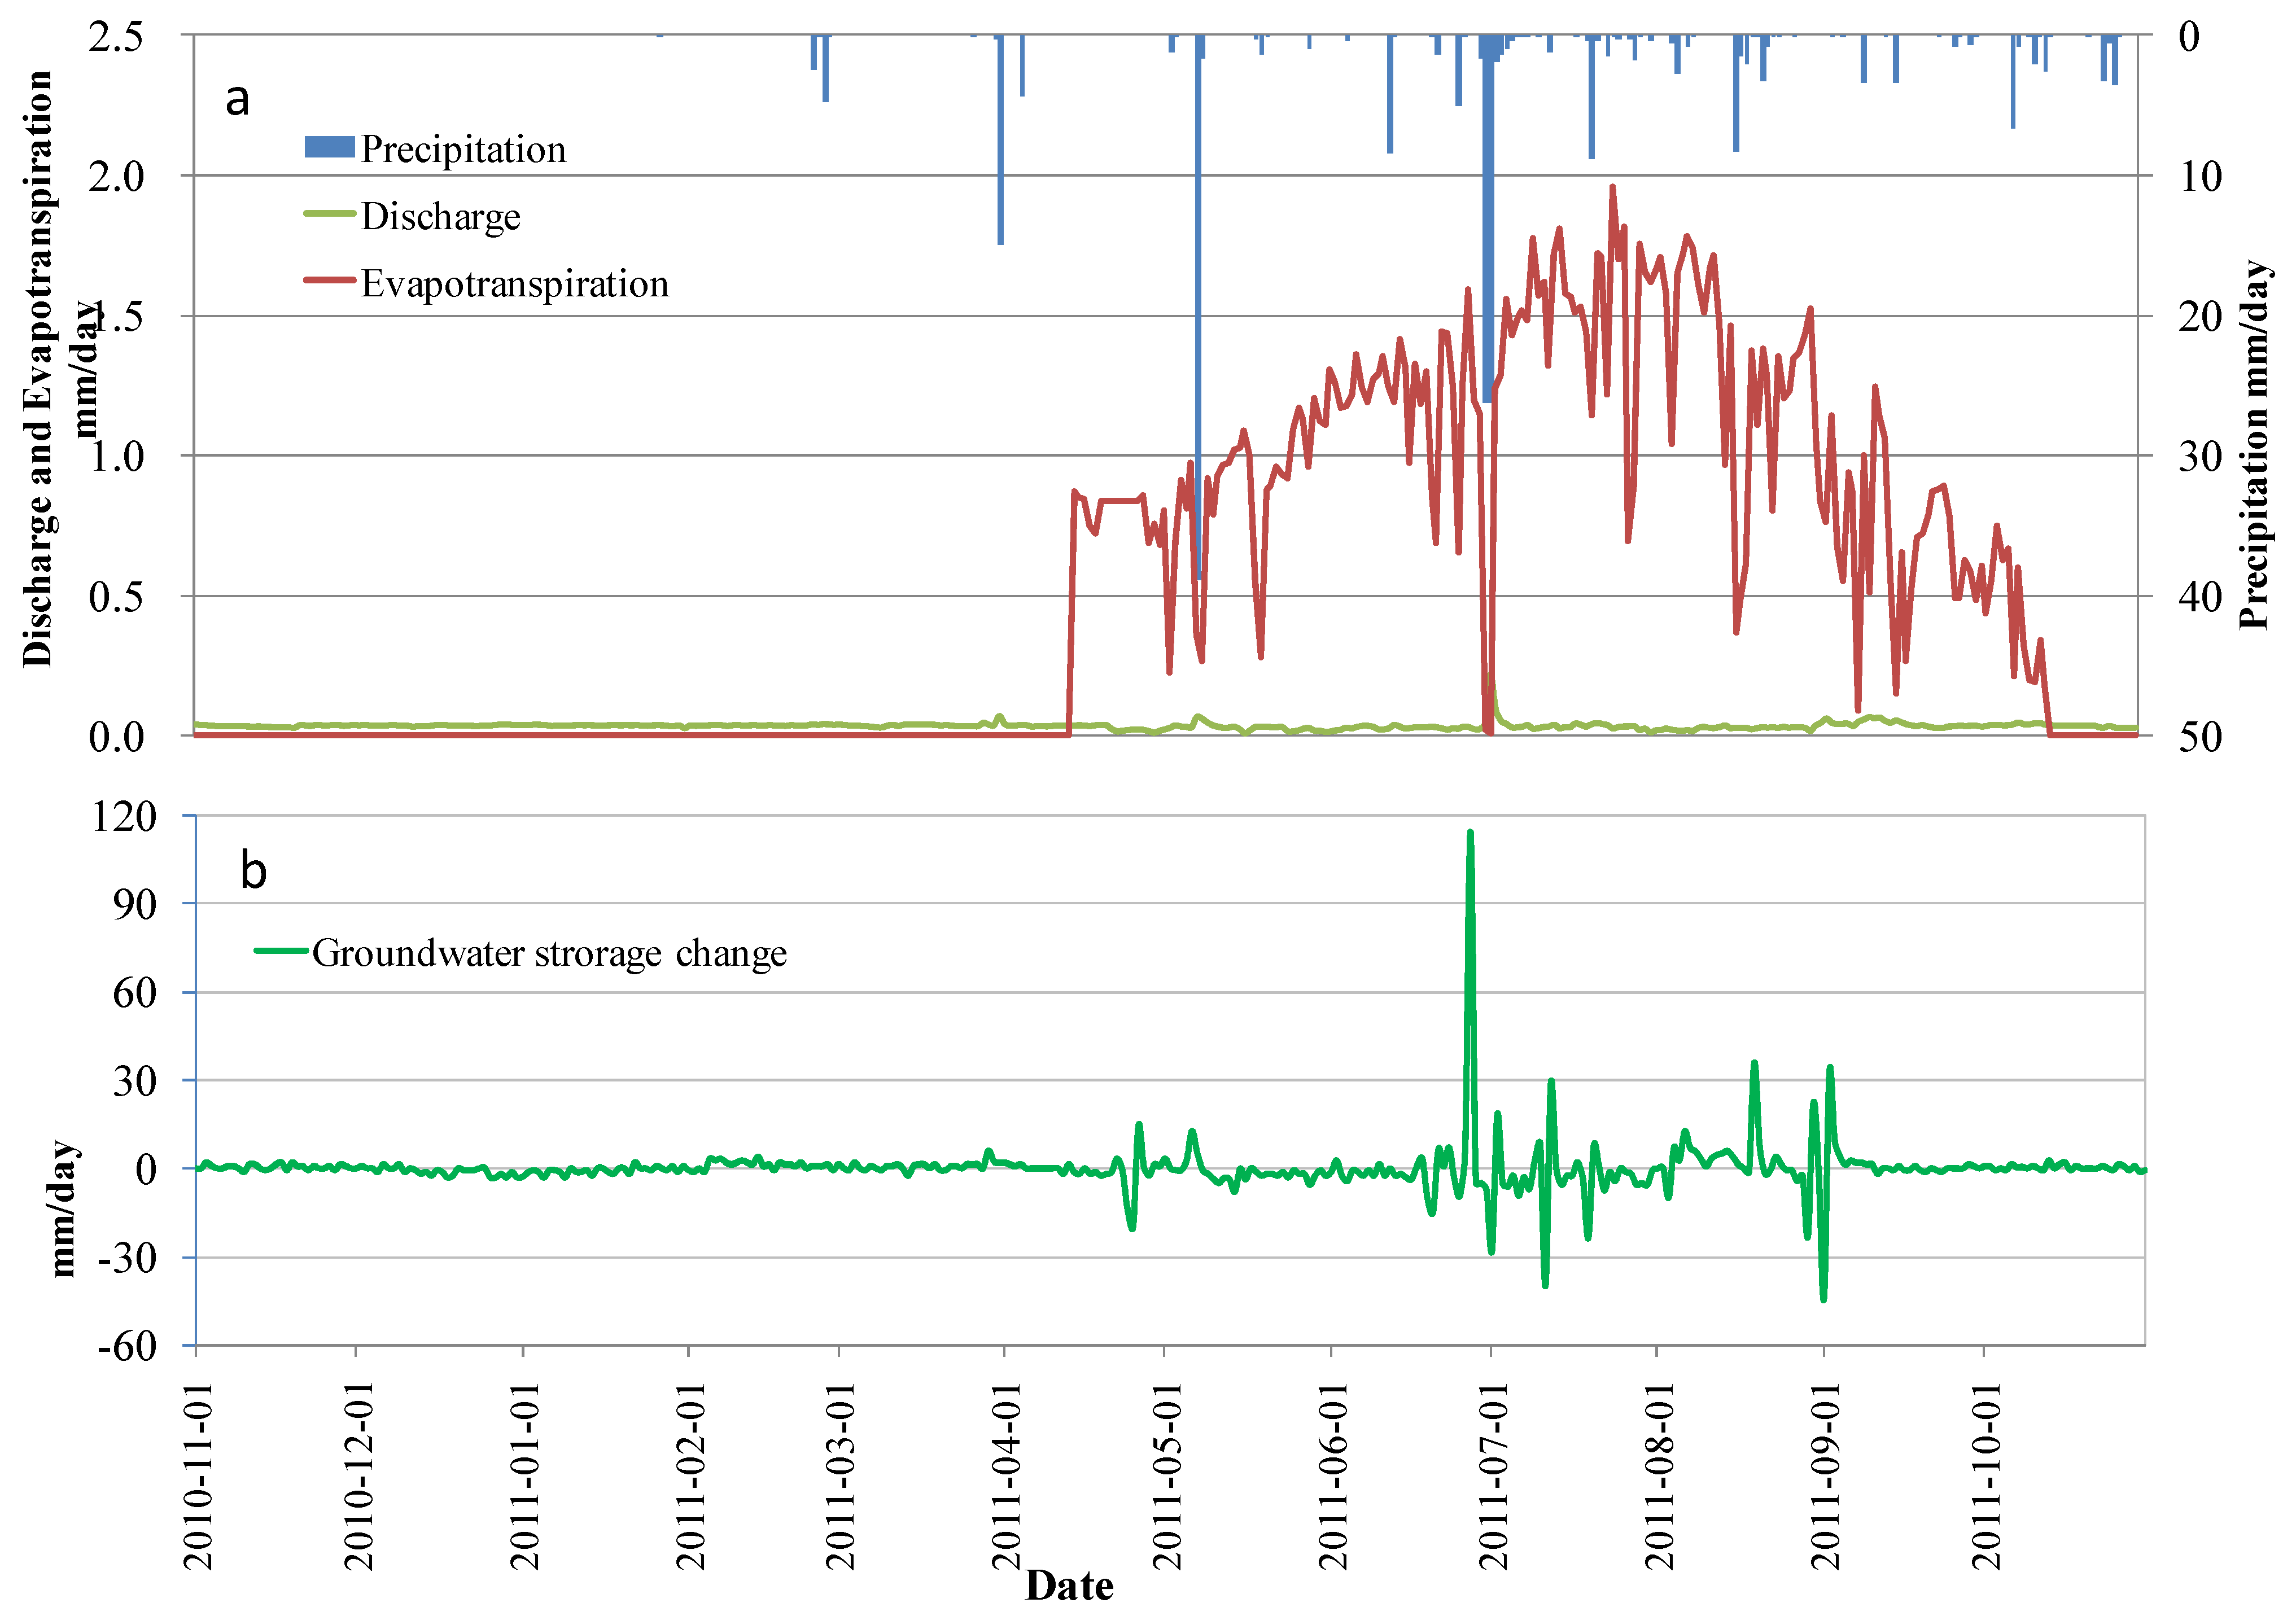
2.2.1. Water Balance

The catchment water balance can be calculated with the components of precipitation (P), evapotranspiration (ET), discharge of the Bulang stream (Q), deep groundwater circulation discharging to the main Hailiutu River (D), and the change of storage (dS/dt ) in the catchment as:
P - E T - Q - D = d S d t
Precipitation, discharge of the Bulang River, and the change of the groundwater levels that represent the storage change in the system can be directly measured in the field, but not the ET and deep circulation fluxes. In this study, the areal ET was estimated from the site measurements of sap flow of maize, salix bush, and willow tree which were up scaled by using the NDVI generated vegetation cover from remote sensing data.
Figure 1. Location of the Bulang sub-catchment within the Hailiutu basin in Northwest China, the location of sap flow measurements for maize and salix, hydrological and meteorological stations, groundwater level monitoring wells, and the digital elevation model.
Water 07 05959 g001

2.2.2. Groundwater Discharge

The groundwater discharge as the baseflow was separated from daily average river discharge measurements according to hydrograph separation results using isotopic tracers [51]. Daily river discharge can be considered as groundwater discharge during days without rainfall, while 74.8% of the river discharge originated from the groundwater in the two days after the recorded heavy rainfall based on the trace method [51].

2.2.3. Groundwater Model

In correspondence with the geological structure, the upper Maowusu sand dunes together with Shalawush deposits were simulated with one model layer as the unconfined aquifer and the underlying Cretaceous Luohe sandstone was simulated with another model layer as the confined aquifer. The outlet of the river valley was simulated as a head-dependent flow boundary, considered to be the deep groundwater discharge to the Hailiutu River. All other boundaries were taken as no-flow boundaries in line with the catchment water divide. The Bulang stream was simulated as a drain since groundwater always discharges to the stream. Net groundwater recharge was calculated as precipitation (P) minus evapotranspiration (ET).
The popular numerical model code MODFLOW [52] was used for the flow simulation. The numerical model grid cell has a uniform size of 50 by 50 m, resulting in a model grid consisting of 310 rows and 350 columns. The top elevation of the model is the surface elevation which is taken from the Digital Elevation Model with a resolution of 30 by 30 m. The bottom elevation of the model is interpolated from the limited geological borehole data. The hydrogeological parameters such as hydraulic conductivity, specific yield, and specific storage were divided into three zones according to lithology. The General-Head Boundary (GHB) package of MODFLOW was used to simulate deep groundwater discharge to the Hailiutu River, where flow into or out of a GHB cell is calculated in proportion to the difference between the head in the model cell and the stage of the Hailiutu River. The MODFLOW Drain package was used to simulate groundwater discharge to the Bulang stream since the stream acts as a drain which always receives groundwater discharge. The Recharge package was used to simulate the net recharge which was calculated in an Excel sheet being precipitation minus evapotranspiration.
A steady state flow model was calibrated first with the annual average values of rainfall, ET rates, stream discharges, and the groundwater levels measured from November 2010 to October 2011. A transient flow model was then constructed and calibrated with the measured daily data from November 2010 to October 2011. The model calibration was performed with the optimization code PEST [53]. PEST found optimal values of hydraulic conductivities and storage parameters by minimizing the sum of squared differences between model-calculated and observed values of groundwater heads at the observation wells. The Drain conductance was further calibrated by comparing calculated and measured stream discharges.

2.2.4. Scenario Analysis

For semi-arid areas such as our study area, a delicate balance among vegetating sand dunes, agricultural production, and water resources conservation must be maintained [44]. Over-vegetating sand dunes with high water consumption species (such as poplar trees and salix bushes) would reduce net groundwater recharge and diminish stream flows. Desert grasses, such as Artemisia Ordosica and Korshinsk Peashrub, consume much less water and are better choice for vegetating sand dunes. These grasses are common in areas with a deep groundwater table. The dominant agricultural crop type in the area is maize. Maize needs to be irrigated six times [54] and consumes a lot of water. The local agricultural department has started a program to extend dry-resistant crops such as sorghum and millet. Considering the possible land use changes in the area, the following scenarios are proposed:
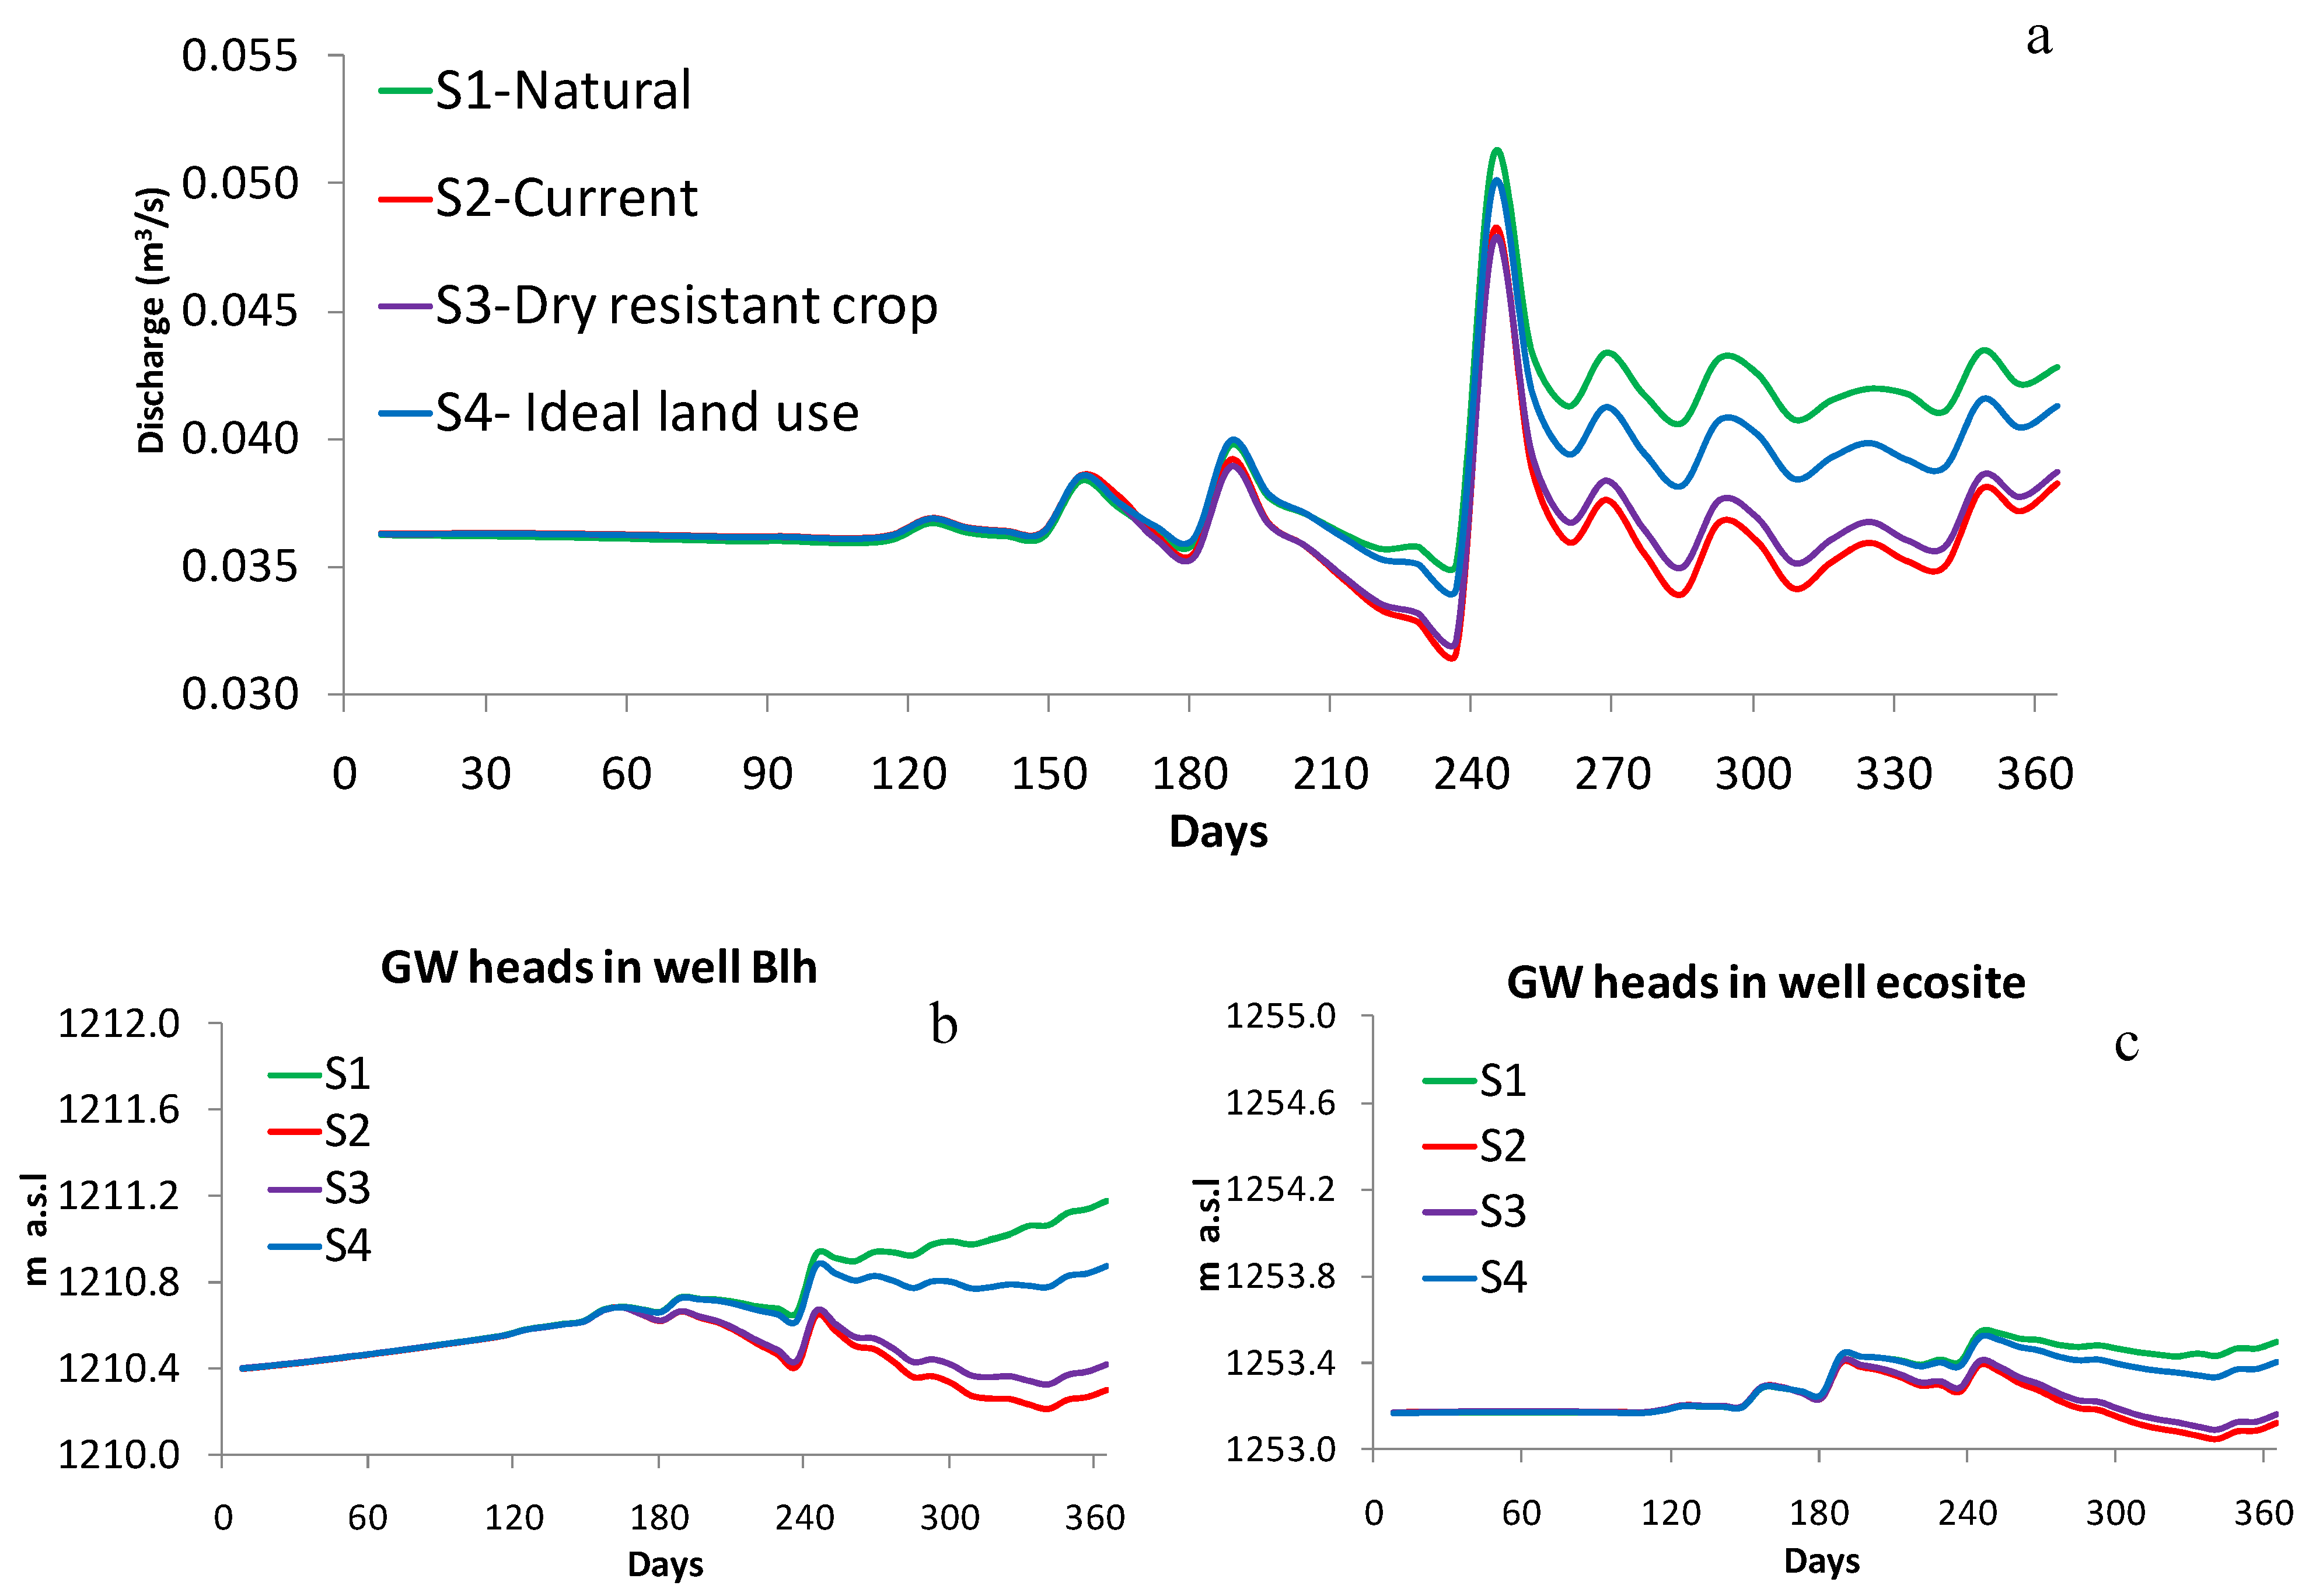
  • Scenario 1 assumes a natural situation in which the catchment is covered by desert grasses. This scenario sets up a bench mark case to compare impacts of land use changes on groundwater and stream flow.
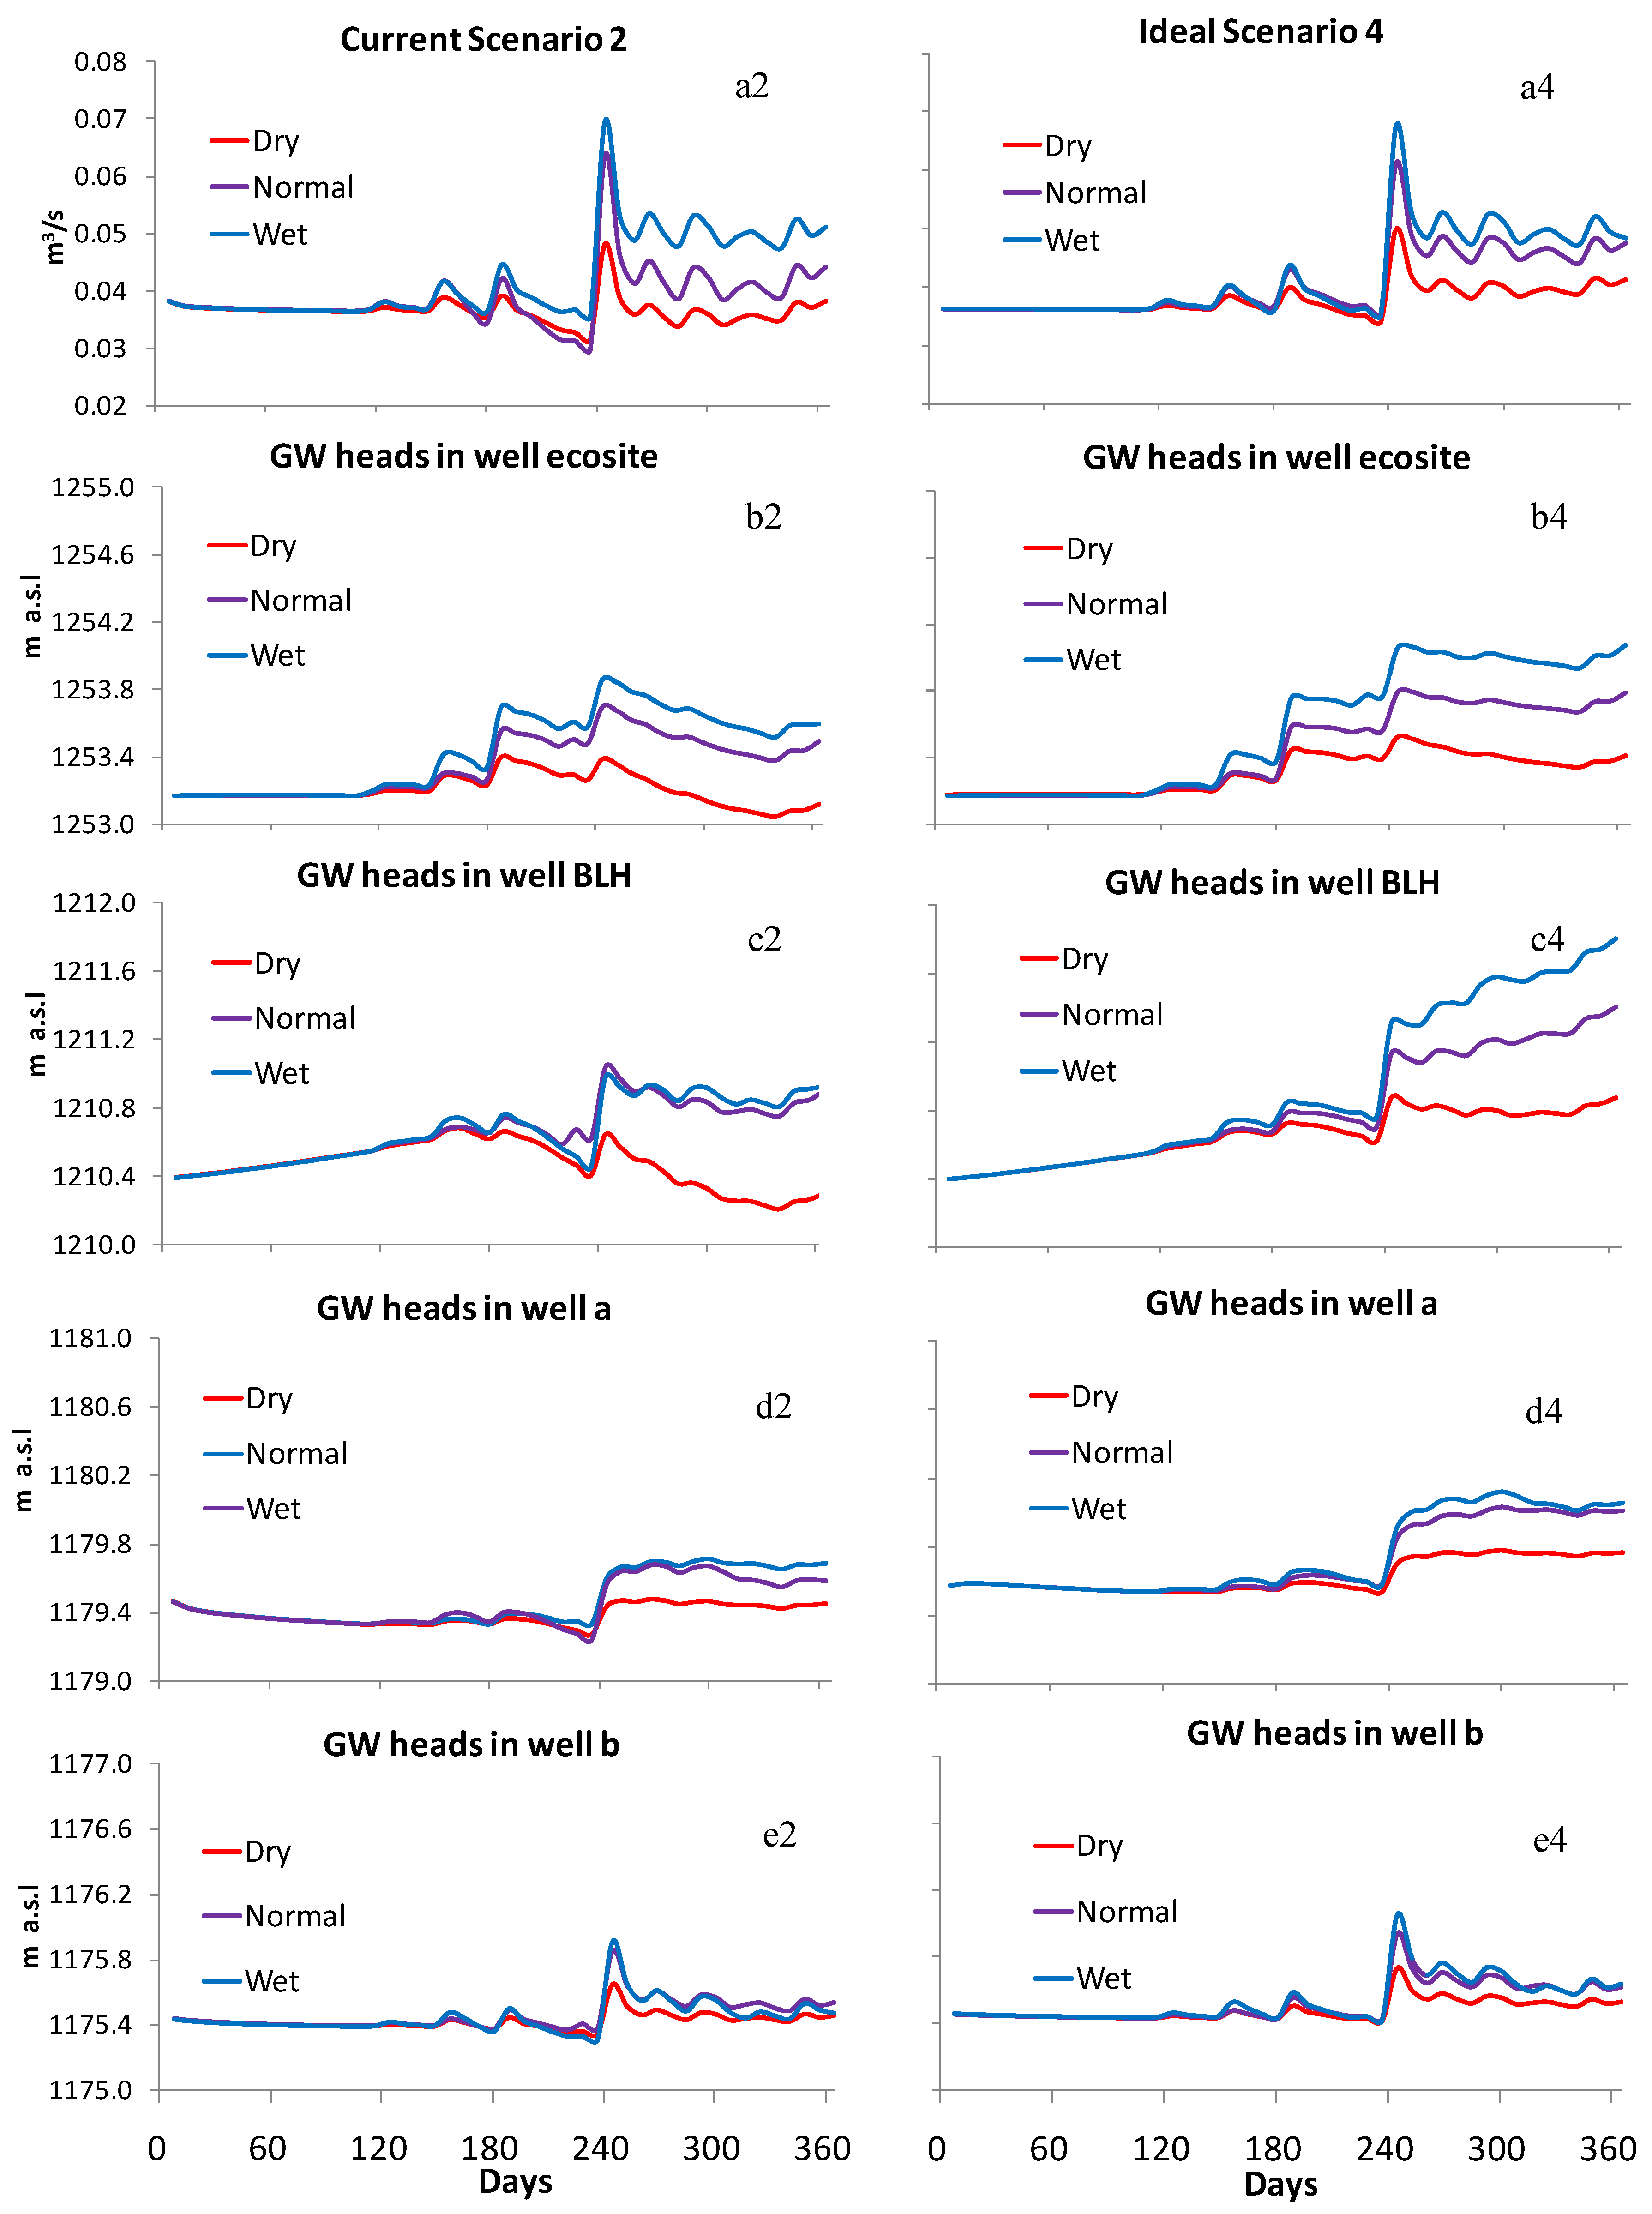
  • Scenario 2 represents the current land use in 2011. Impacts of current land use changes on groundwater and stream flow can be analyzed by a comparison to scenario 1.
  • Scenario 3 simulates effects of replacing maize crops with less water consumptive crops such as sorghum and millet in order to provide support to the policy of extending dry-resistant crops in the area.
  • Scenario 4 proposes an ideal land use scenario where sand dunes are covered by desert grasses and dry-resistant crops are grown. This scenario gives direction to the future land use changes in the area.
Since there are inter-annual variations of precipitation and evapotranspiration accordingly, scenarios 2 and 4 were simulated under the dry, normal, and wet years. Analysis of long-term annual precipitation (Wushenqi meteorological station, 1959–2014) found that 2011, 2009, and 2014 represent dry (87.7%), normal (50.2%), and wet (27.8%) years, respectively. These two land use scenarios were further simulated with a multiple year transient groundwater model in order to assess impacts of inter-annual variations of climate.

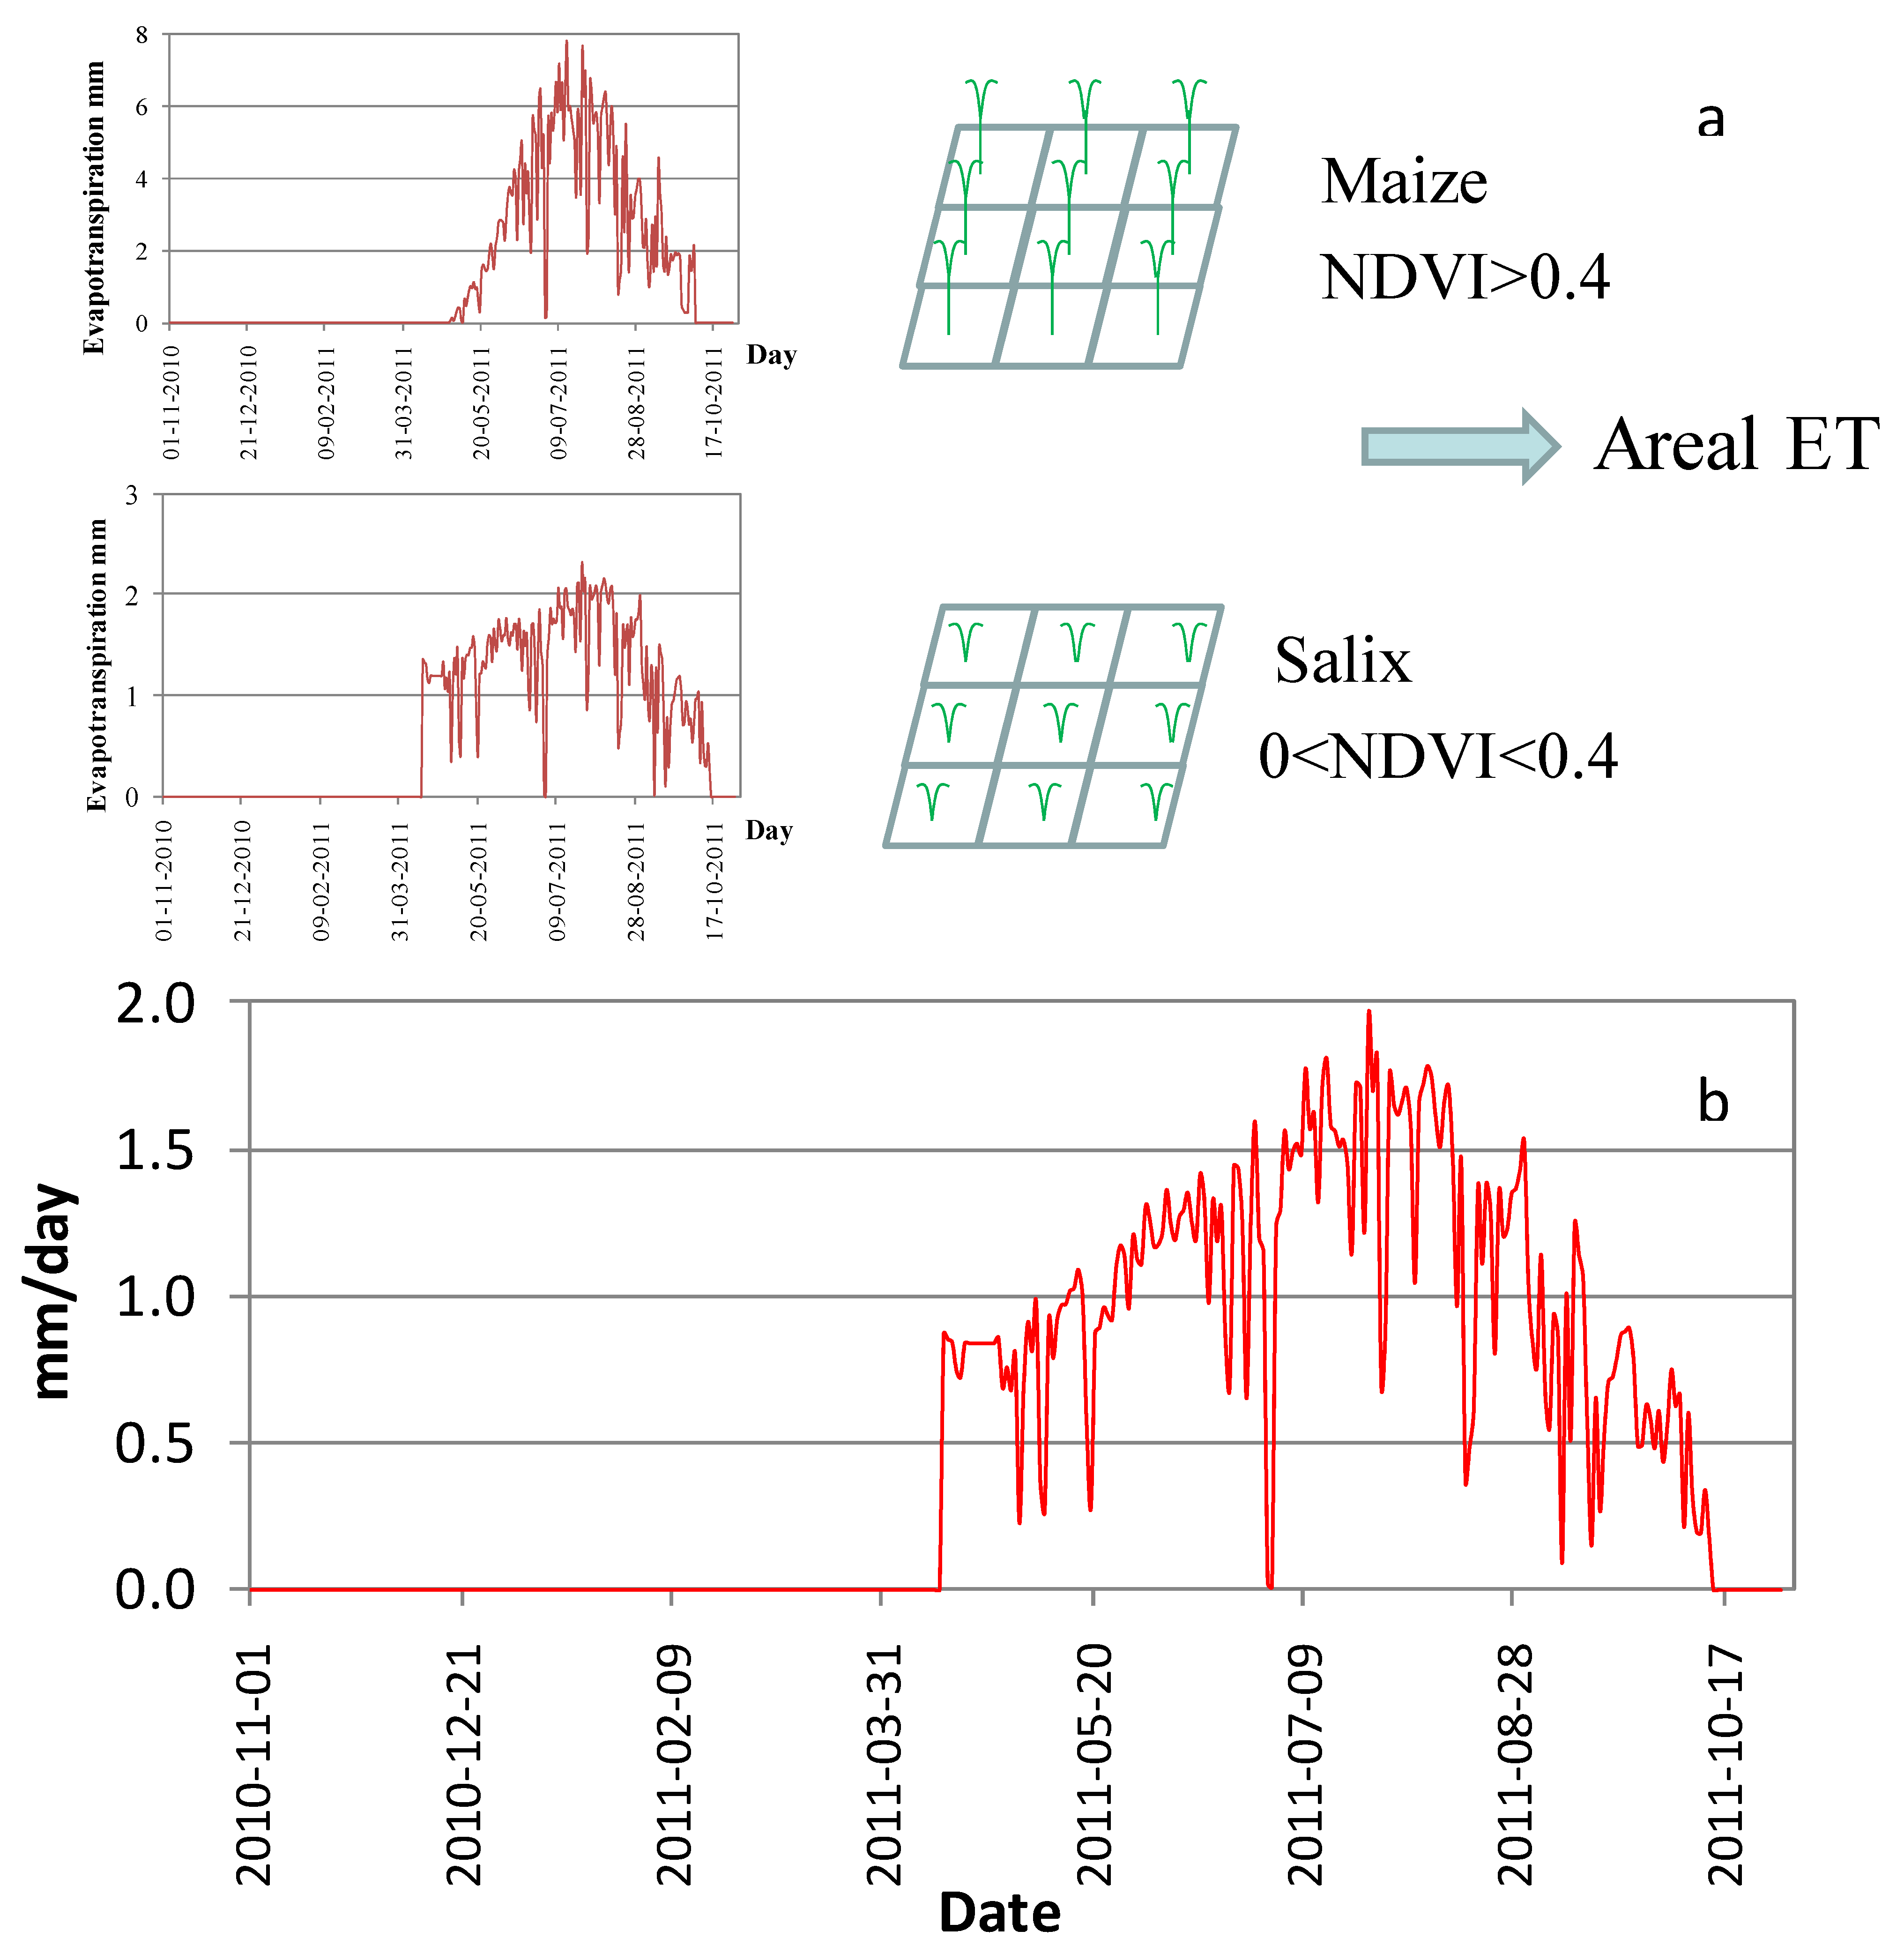
2.2.5. Model Inputs for the Simulation of Land Use Scenarios

The calibrated transient groundwater flow model was used to simulate these four land use scenarios. Given inputs of 8-days net recharge for November 2010 to October 2011, the model simulates groundwater level changes and computes groundwater discharge to the Bulang River, deep groundwater circulation to the Hailiutu River and change of groundwater storage.
The net recharge was calculated to be the precipitation minus evapotranspiration. The evapotranspiration was estimated in the same procedure as before with equations of:
ET i = N D V I i N D V I p l a n t  ET plant   ,        0 < NDVI i <  0.4
ET i = N D V I i N D V I c r o p  ET crop   ,        NDVI i 0.4
where ETi is estimated model grid ET value. ETplant and ETcrop were found from relevant studies [55] and are presented in Table 1.
Table 1. ET values for reference crops and plants for scenario simulations (mm/year).
ScenarioRainfallCrop ETPlant ETNDVI Map
1-Natural situation214.8Artemisia Ordosica (133.6)Artemisia Ordosica (133.6)August 2011
2-Current land use214.8Maize (503.1)Salix Psammophila (245.1)August 2011
3-Dry-resistant crop214.8Sorghum (402.5)Salix Psammophila (245.1)August 2011
4-Ideal land use214.8Sorghum (402.5)Artemisia Ordosica (133.6)August 2011
In order to evaluate impacts of inter-annual variations of precipitation on the water balances, scenarios 2 and 4 were further simulated under a normal and wet years. The year of 2009 represents a normal year and 2014 represents a wet year. Daily precipitation of Wushenqi station was collected to compute net recharge. NDVI maps of 2009 and 2014 were processed to estimate ET values. These data are presented in Table 2.
Table 2. Precipitation and ET values for reference crops and plants for scenarios 2 and 4 (mm/year).
ScenarioRainfallCrop ETPlant ETNDVI Map
2-Current land useDry (214.8)Maize (503.1)Salix Psammophila (245.1)August 2011
Normal (340.0)August 2009
Wet (420.0)September 2014
4-Ideal land useDry (214.8)Sorghum (402.5)Artemisia Ordosica (133.6)August 2011
Normal (340.0)August 2009
Wet (420.0)September 2014

2.3. Field Measurements

2.3.1. Precipitation and Evapotranspiration

In order to measure the hydrological variables, a set of instruments had been installed in the catchment. Precipitation was measured from November 2010 to October 2011 using two Hobo rain gauges (RG3-M Data Logging Rain Gauge, Onset Corporation, Bourne, MA, USA) at the outlet of the catchment and at Nanitan (Figure 1 and Figure 2). Stem flow sensors (Flow 32, Dynamax, Houston, TX, USA) were used to measure sap flow in maize stems at the maize research site [54] and in salix stems at the salix research site [56] during the growing season in 2011. The NDVI map (resolution 30 m × 30 m) generated from remote sensing data have been utilized for classifying the land use and vegetation types in the area (Figure 2). NDVI values larger than 0.4 indicate crop land, between 0 and 0.4 are desert bushes, and smaller than 0 are considered as bare sand.
Figure 2. NDVI map of the Bulang catchment, interpretation of remote sensing data from TM on August 2011.
Water 07 05959 g002

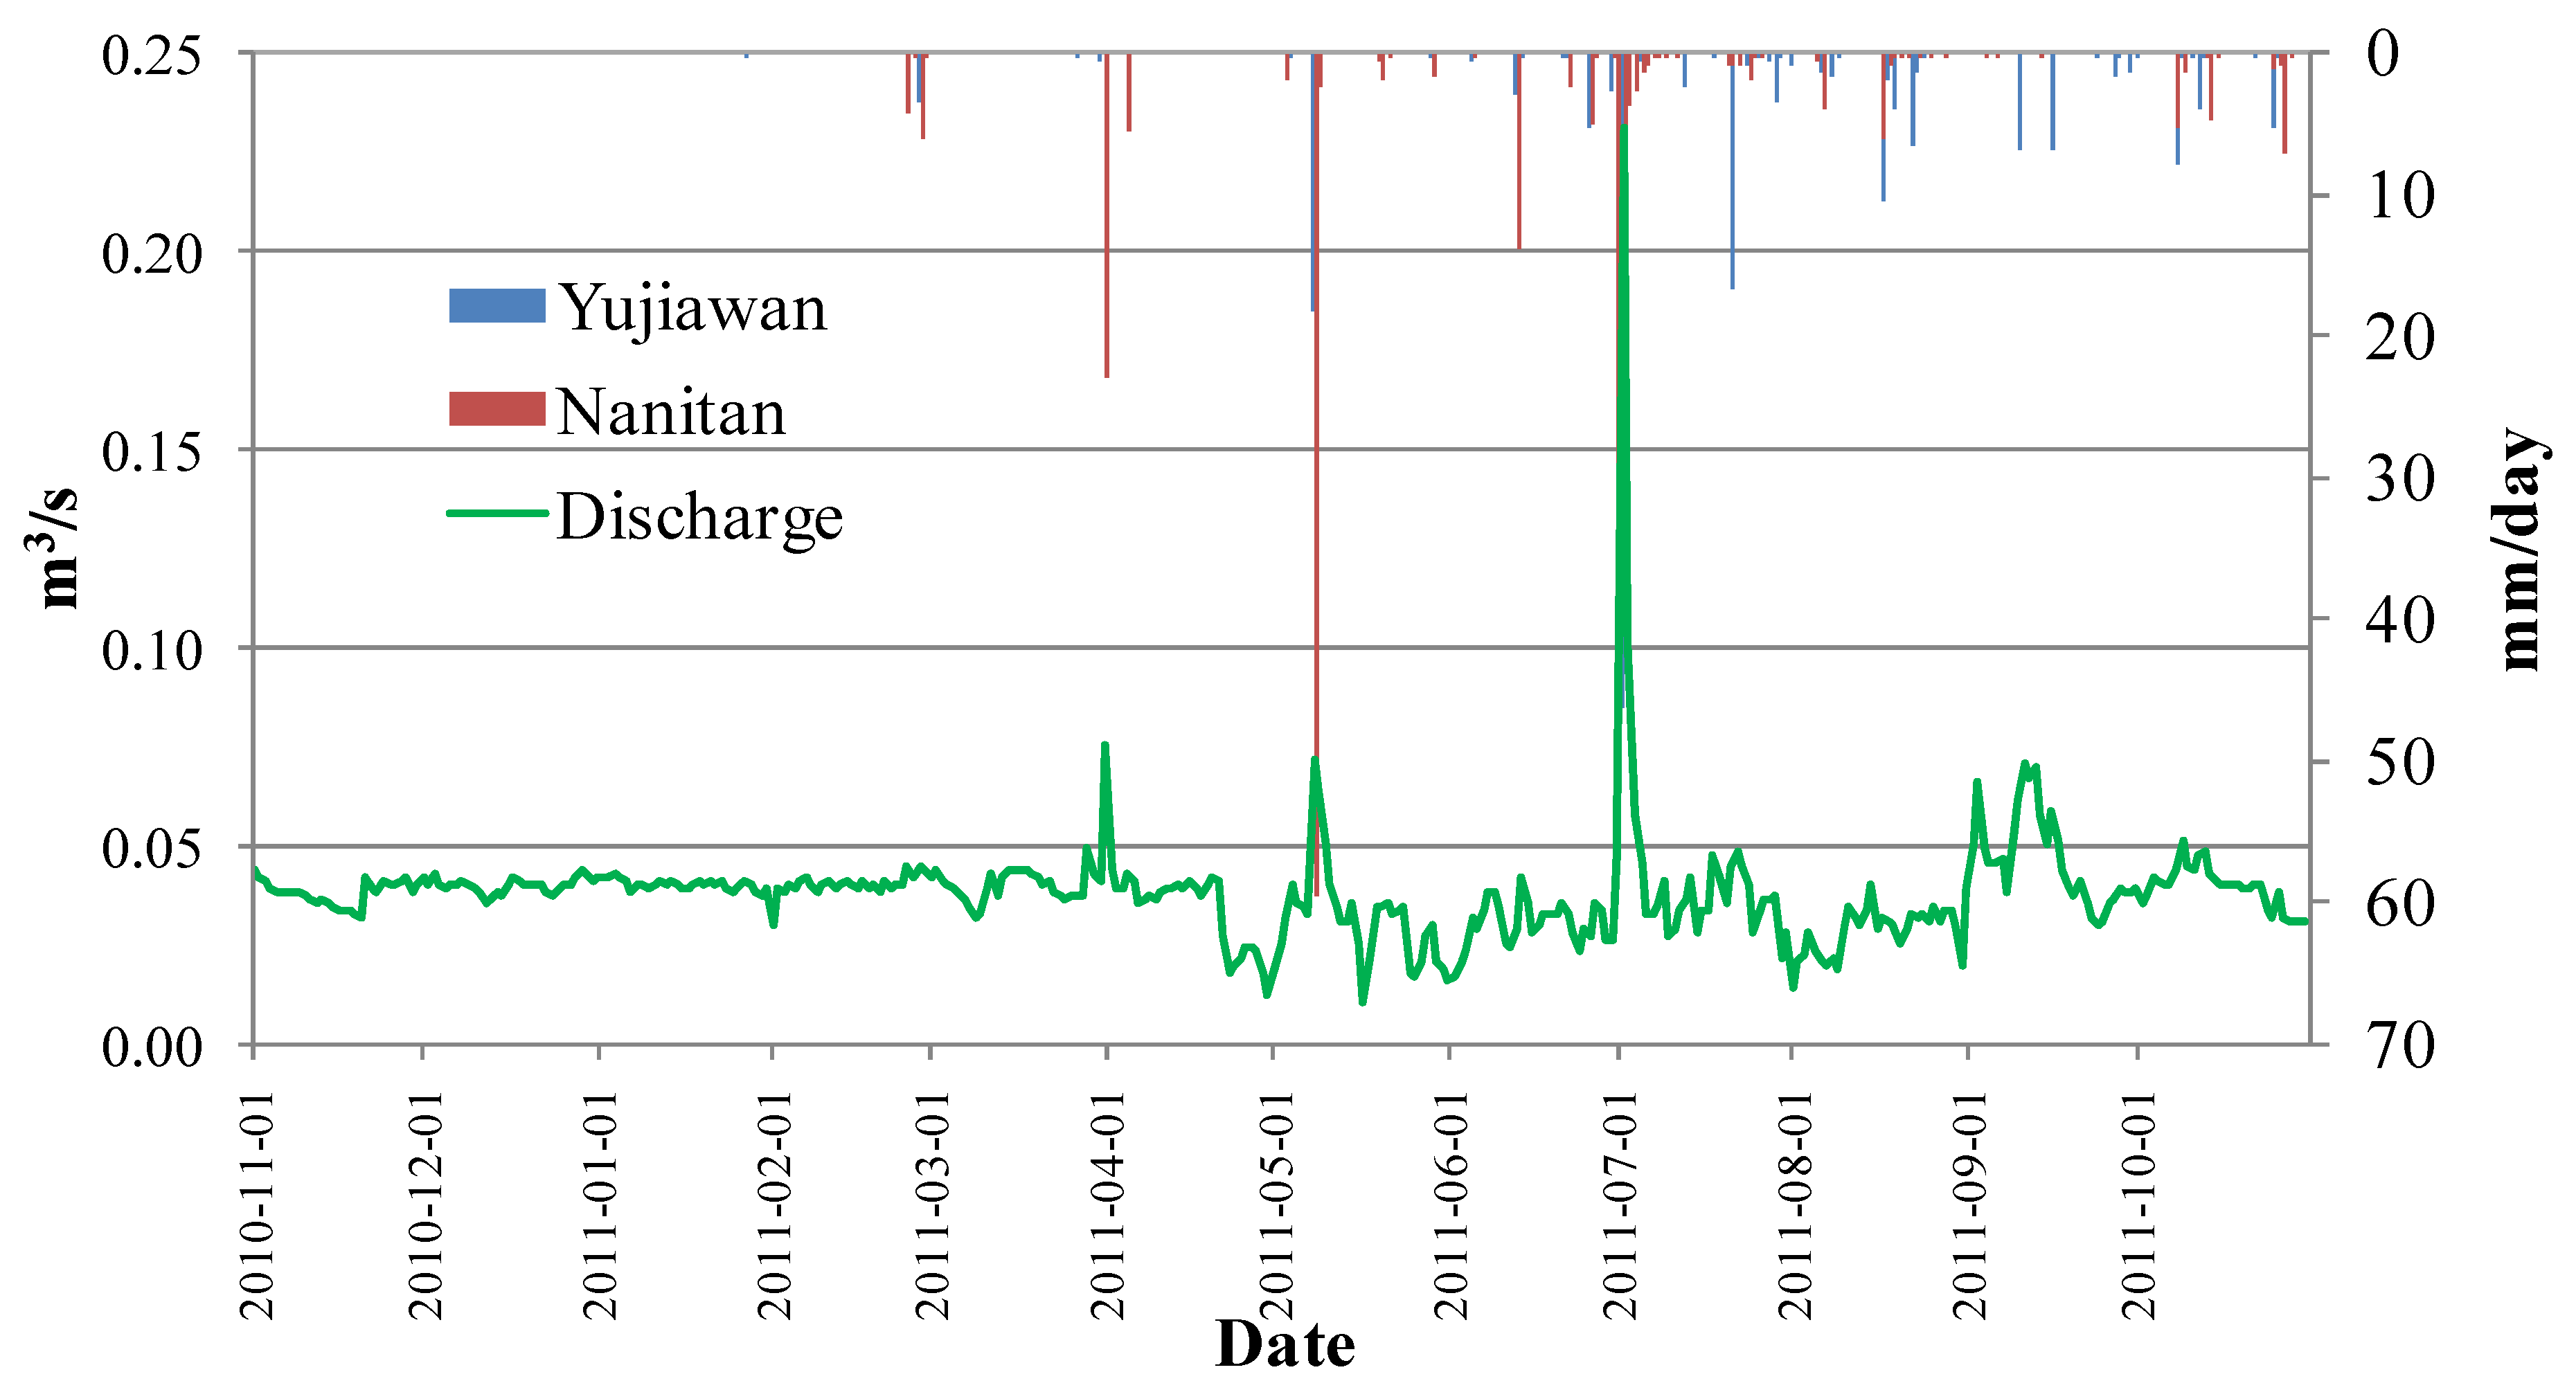
2.3.2. Discharge Gauge

One discharge gauging station was constructed at the outlet of the Bulang catchment (Figure 1). The Yujiawan gauging station consists of one permanent rectangular weir equipped with an e + WATER L water level logger (Type 11.41.54, Eijkelkamp Agrisearch Equipment, Giesbeek, The Netherlands) where water levels are recorded with a frequency of 30 min. Water depths are converted to discharges using a rating curve based on regular manual discharge measurements carried out with a current meter and the velocity-area method.

2.3.3. Observation Wells

Several groundwater level monitoring wells were installed in the Bulang catchment (Figure 1 and Figure 2). Equipped with submersible pressure transducers (Type: MiniDiver, Eijkelkamp Agrisearch Equipment, Giesbeek, The Netherlands), the groundwater levels in these observation wells were recorded at 10-min intervals. Barometric compensation was carried out using air pressure measurements from a pressure transducer (Type: BaroDiver, Eijkelkamp Agrisearch Equipment, Giesbeek, The Netherlands) installed at the site. Groundwater levels were converted into the height of the water table above mean sea level with the calibration of the land elevation of wells, height of water column above the MiniDiver in the wells, and the depth of the MiniDiver in the boreholes.

3. Results

3.1. Estimation of Water Balance and Groundwater Discharge

3.1.1. Estimation of Catchment Water Balance

The total observed precipitation from November 2010 to October 2011 at Yujiawan and Nanitan station are 206.8 mm and 217.6 mm, respectively. The annual areal precipitation in the catchment was estimated to be 214.8 mm/year by means of area weighed average of two rainfall stations. Discharge at the Yujiawan weir varies from 0.01 to 0.23 m3/s (Figure 3). Stream discharge is very stable during the winter months and varies in the summer months due to irrigation water use and sporadic rainfall. A heavy rain event occurred on 2 July and generated the highest discharge in the observation period.
Figure 3. Rainfall at Yujiawan and Nanitan station, measured discharge at Yujiawan weir from November 2010 to October 2011.
Water 07 05959 g003
ET rates measured at the maize and salix research site were 503.1 mm/year and 245.1 mm/year, respectively. The NDVI values at the sap flow measurement sites for maize and salix are 0.59 and 0.17, respectively. The NDVI was used to upscale evapotranspiration rate measured in the salix and maize research sites to the catchment using Equations (2) and (3).
The areal ET value of the catchment was calculated as the average ET of all cell ET values.
Figure 4a illustrates the up-scaling approach for areal ET with sap flow measurements and NDVI values. Figure 4b plots the estimated daily ET rates. The daily ET rates increases from mid April, peak in July and August, and decreases from September onwards. Daily ET rates were very low during rainy days. The total areal evapotranspiration rate in the Bulang catchment is estimated to be 186.2 mm/year.
Figure 4. Up-scaling approach for areal evapotranspiration with sap flow measurements and NDVI values (a); and the estimated areal evapotranspiration (b).
Water 07 05959 g004
The estimation of areal interception in the Bulang catchment followed the same approach as the estimation of the areal ET. The areal interception of 9.8 mm/year was obtained with the reference interception coefficient of 0.249 for salix [57] and 0.373 for maize [58].
Mu et al. [59] created a data set of the evapotranspiration rates in 8 days intervals from MOD16 Global Terrestrial Evaporation Data Set. Figure 5 compares the areal ET rates of 8 days estimated from this study and Mu's data set. The larges differences are found during the winter period. ET values estimated from the remote sensing methods show significant different distribution compared with the ET values estimated in this study based on sap flow measurements in the experimental period, where ET rates are zero in the winter period from December to March. There should be no ET in winter since the daily average air temperature is below zero and there are no crops and the trees do not transpire in this period.
Figure 5. Comparison of evapotranspiration estimated by remote sensing and calculated by upscaling approach with NDVI and sap flow measurements from November 2010 to October 2011.
Water 07 05959 g005
The change of the storage in the catchment is mainly based on the change of groundwater storage. Groundwater storage change can be estimated by the change of the groundwater levels multiplied by the porosity of the aquifer. Figure 6 shows that all groundwater levels at the end of the measuring period recovered back to the values at the beginning of the measuring period. Therefore, it can reasonably be assumed that there is no overall change of groundwater storage. The results of the water balance computation are shown in Figure 7 as daily water depth and are summarized in Table 3 as annual water depth in the catchment. The deep circulation in Table 3 refers to the regional groundwater flow to the Hailiutu River. The deep groundwater circulation was estimated in the water balance equation as the difference of total inflow minus total outflow. The net groundwater recharge equals to the precipitation minus total evapotranspiration.
Table 3. Annual water balance estimation in the Bulang catchment in mm/year.
Estimation methodPrecipitationETNet RechargeDischargeDeep CirculationChange of Storage
Water Balance214.8196.018.812.66.20
Steady model214.8196.018.813.15.80
Figure 6. Observed groundwater levels in Bulang catchment.
Water 07 05959 g006
Figure 7. Average precipitation, river discharge, and estimated ET (a); groundwater storage change (b) in Bulang catchment from November 2010 to October 2011.
Water 07 05959 g007

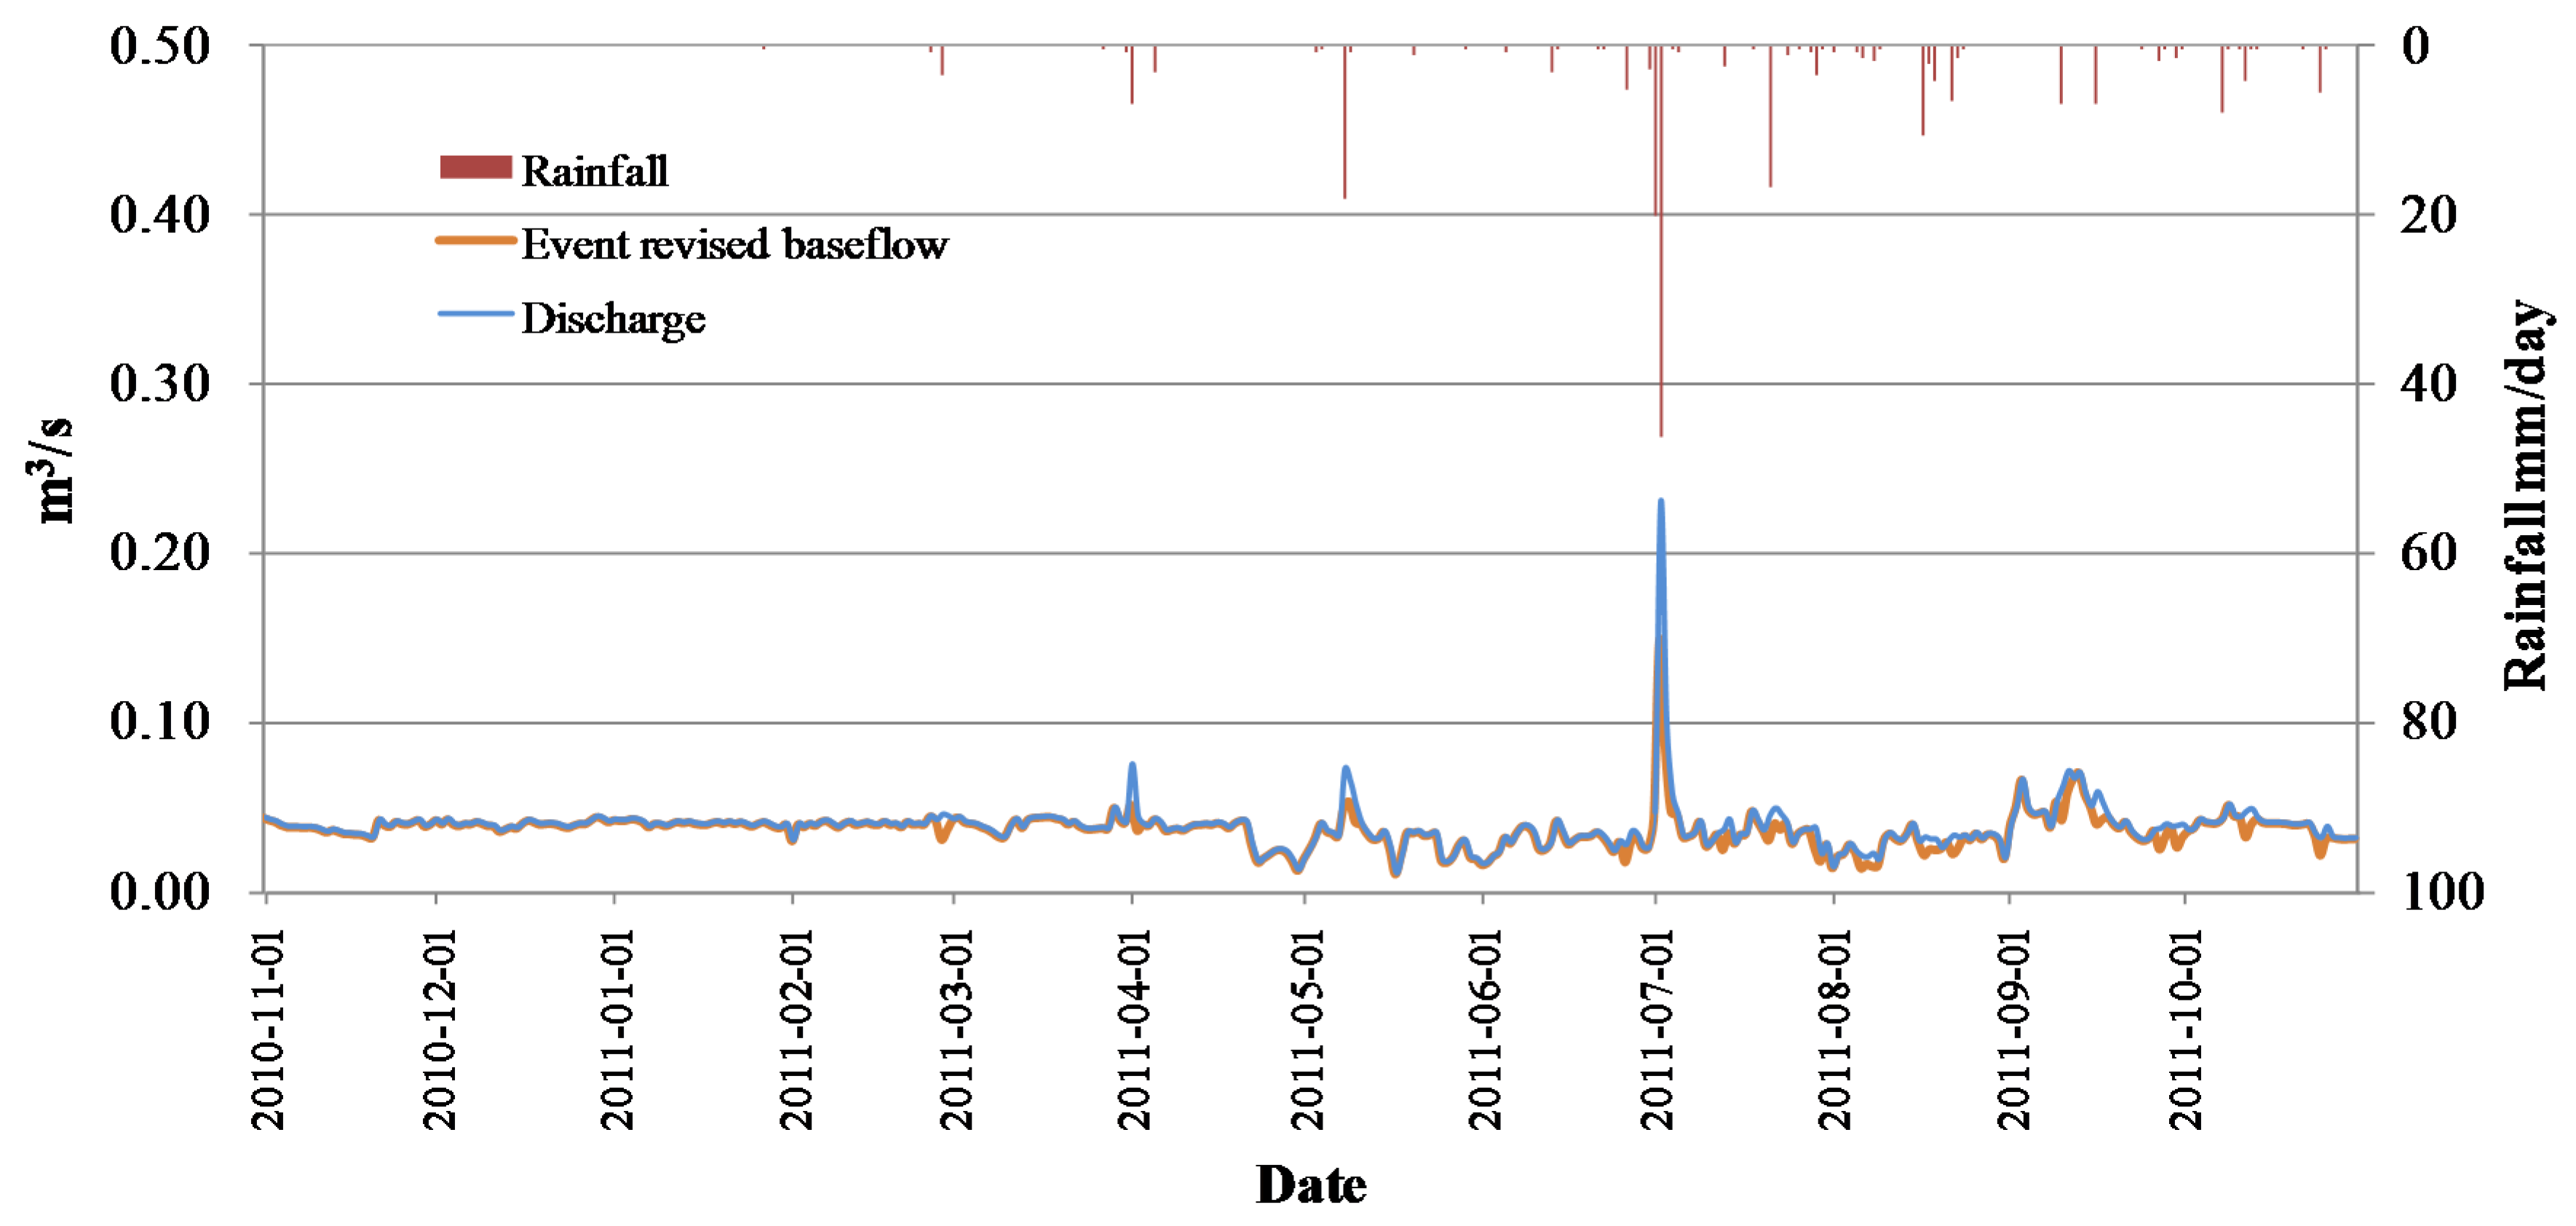
3.1.2. Estimation of Groundwater Discharge

Groundwater discharge as the base flow in the Bulang catchment can be derived from the river discharge measurements during the experimental period. A base flow separation was carried out based on the analysis of the isotopic tracers in the river, groundwater, and the heavy rainfall occurred in July 2011 [51]. Results of the hydrograph separations illustrate that the pre-event component accounts for 74.8% of the total discharge during rainfall events. Compared to other graphical and mathematical hydrograph separation methods, the event based isotopic separation method provides more accurate estimation of the groundwater discharge. It is estimated that 96.4% of total stream flow is composed of groundwater based on the event separation results from November 2010 to October 2011. Figure 8 illustrates the relations among the discharge, base flow, and the rainfall in the Bulang catchment.

3.2. Calibration of the Groundwater Model

3.2.1. Calibration of the Steady Groundwater Model

Since the change of groundwater storage in the observed period from November 2010 to October 2011 can be neglected, a steady state groundwater flow model was constructed and calibrated first with annual average values of the net recharge, groundwater discharge, and groundwater levels. The purposes of the steady state model were to calibrate the hydraulic conductivity and to create initial conditions for the transient model. Average values of groundwater levels measured in nine observation wells (Figure 2) were used to compare model-calculated groundwater levels for the model calibration. The optimization code, PEST was used to optimize values of hydraulic conductivity in three zones so that the sum of squared differences between calculated and measured groundwater levels are minimized.
Figure 8. Relations among the observed discharge, separated baseflow, and the rainfall in the Bulang catchment.
Water 07 05959 g008
The coefficient of determination of the computed and measured groundwater levels is as high as 0.99 indicating that the steady state model is capable to reproduce the measured groundwater levels with a very high accuracy. The optimized values of hydraulic conductivity are 8.59 m/day, 3.86 m/ay, and 1.86 m/day, respectively, in the three parameter zones. The computed discharge to the Bulang River and deep groundwater circulation are very close to the estimated values in the previous water balance computation (Table 3).

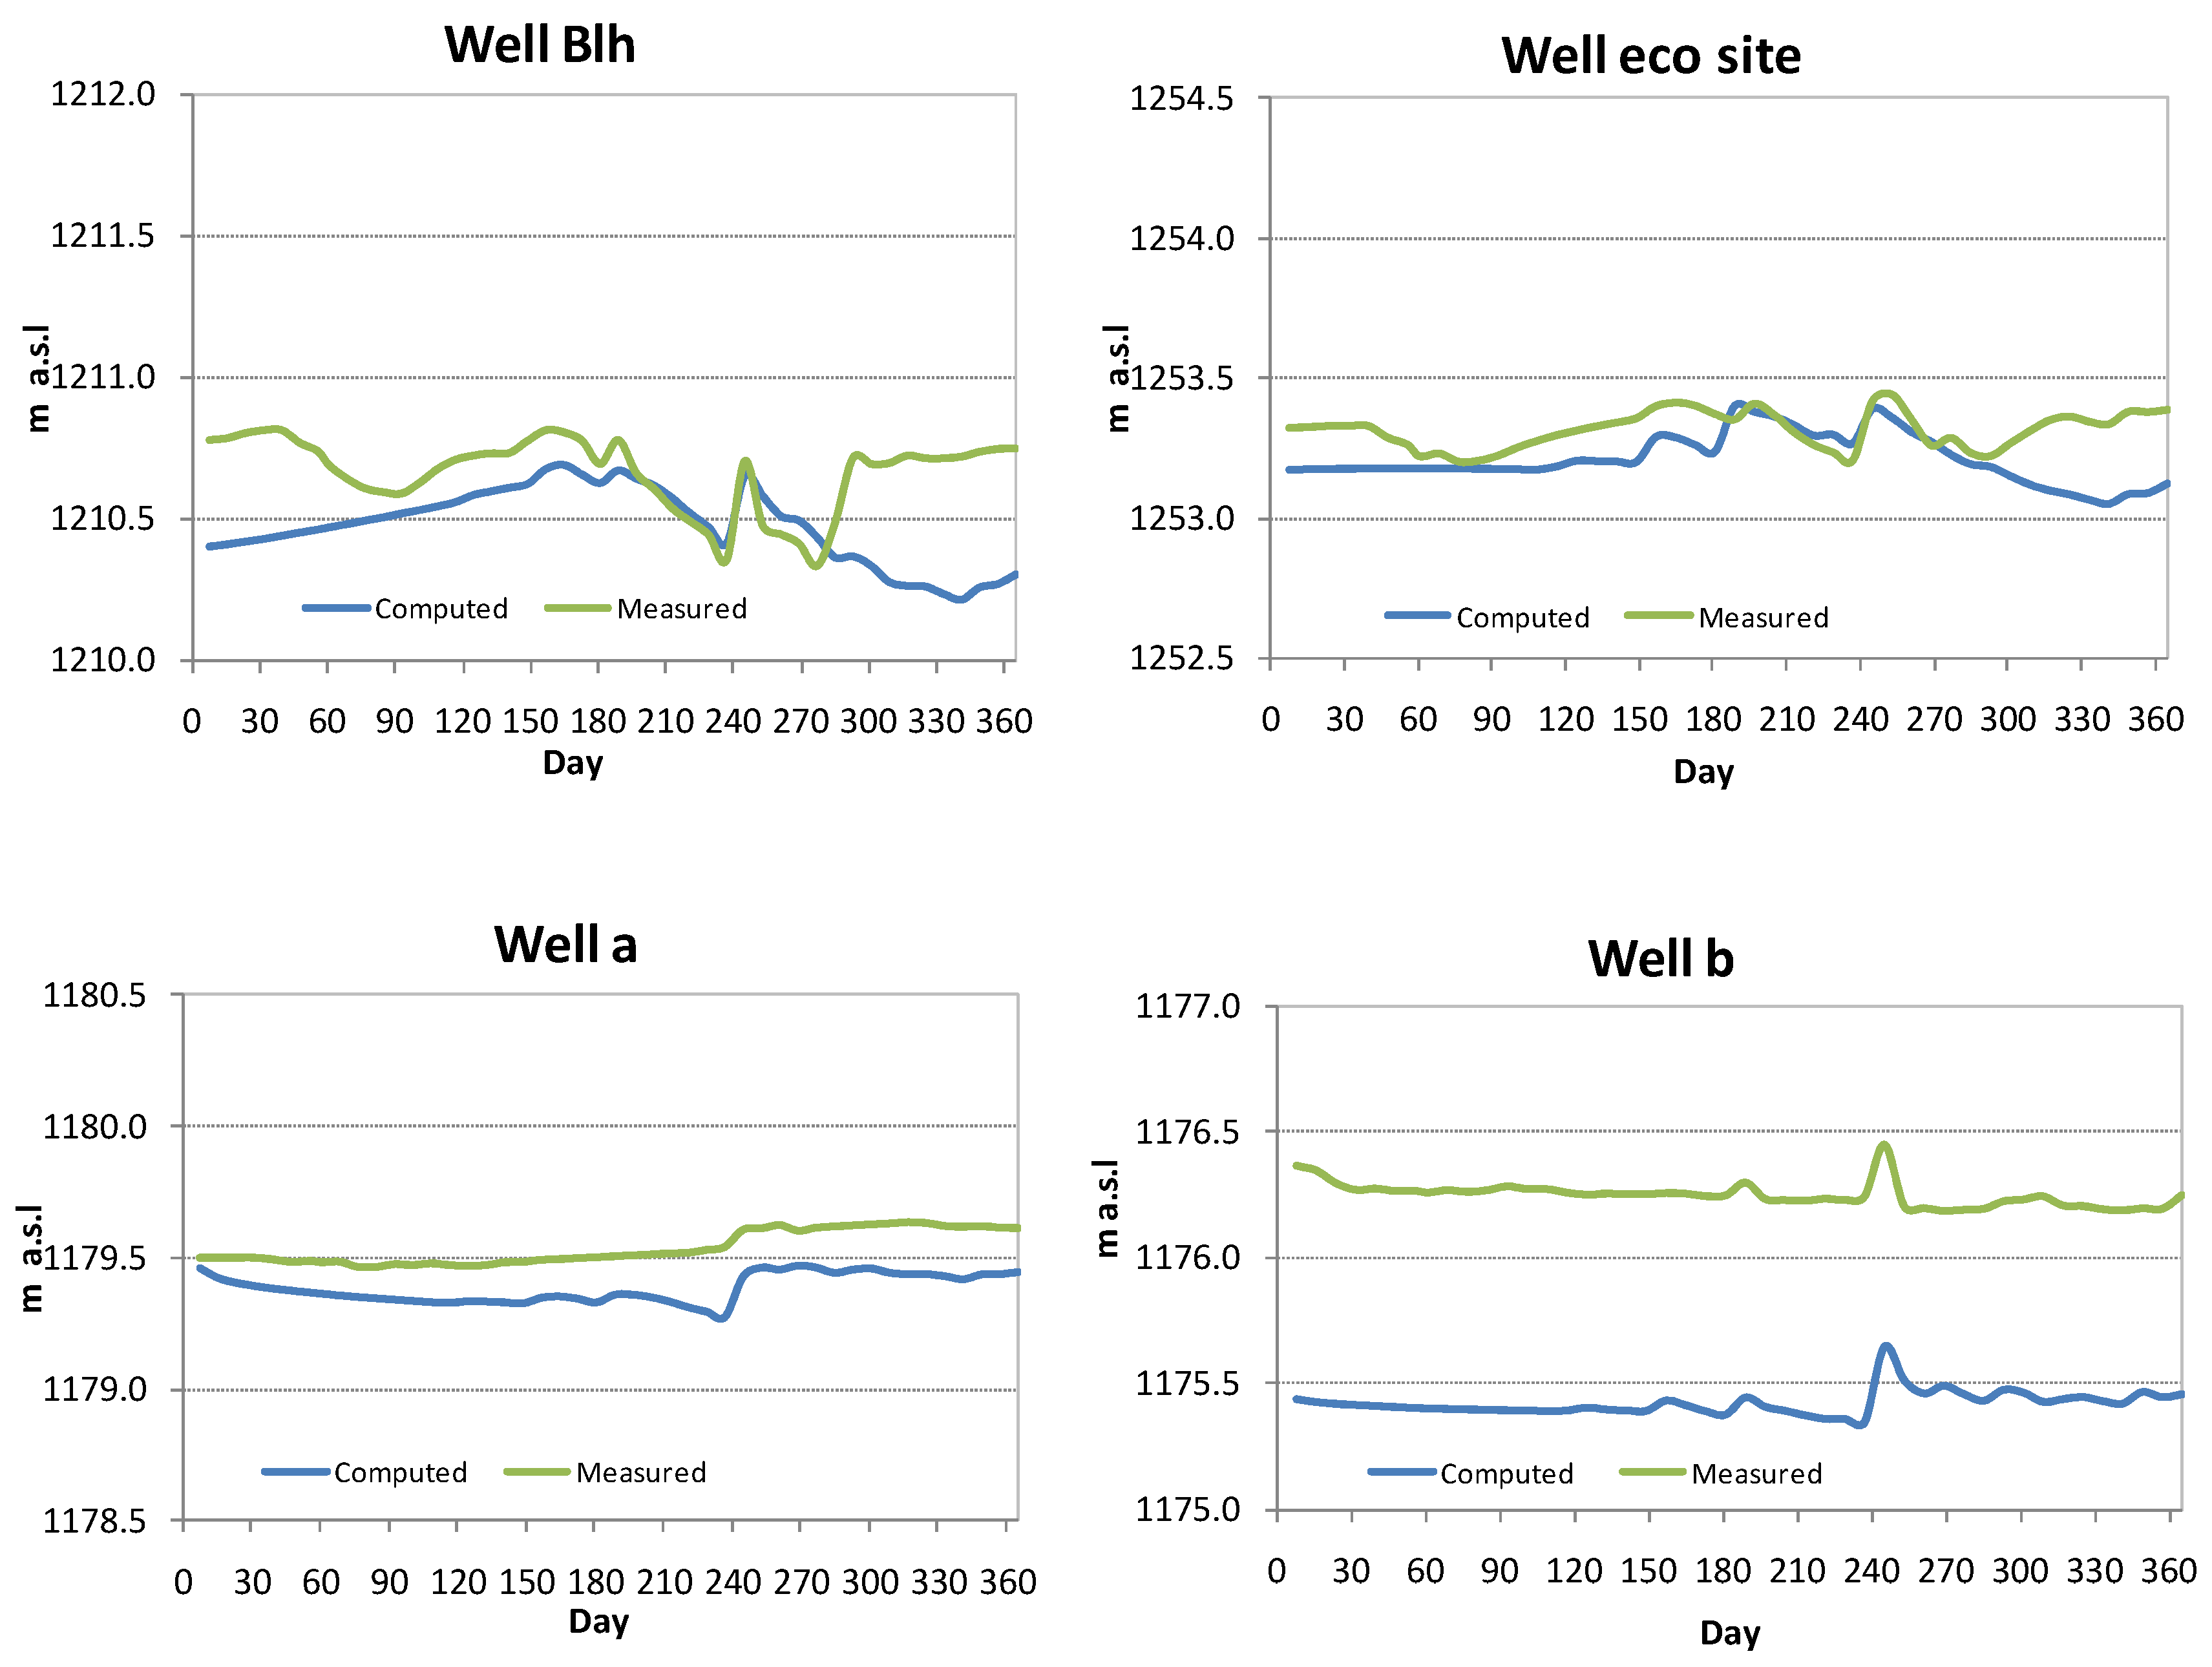
3.2.2. Calibration of the Transient Groundwater Model

The purpose of the transient model is to simulate seasonal variations of groundwater levels and stream flow caused by varying precipitation and evapotranspiration values. The simulation period is one year from November 2010 to October 2011. A stress period of 8 days was chosen in line with estimated ET values from remote sensing data. The computed groundwater levels by the steady state model were used as initial groundwater heads in the transient model. The average values of daily precipitation and evapotranspiration values in every 8 days were used to compute transient net recharge values for the transient model. The specific yield values of three zones in the first model layer were optimized using PEST so that computed groundwater level series fit well with the measurement series. Figure 9 shows the match of the computed groundwater levels to the measurements in four observation wells. The RMSE values are 0.26 m, 0.14 m, 0.15 m, and 0.82 m for the computed groundwater levels at well Blh, eco-site, well a, and well b, respectively. The optimized values of specific yield are 0.29, 0.25 and 0.1, respectively, in the three parameter zones.
Figure 9. Fit of the computed groundwater levels to the measured ones in four wells in Bulang sub-catchment.
Water 07 05959 g009
Figure 10 shows the comparison of the computed groundwater discharge to the stream and separated baseflow with the stream discharge measurements. The RMSE is 0.0075 m3/s for the computed groundwater discharge. In general, the transient model computes more smooth discharges than the results of baseflow separation. Large differences in summer months may be caused by irrigation water use diverted from the river which is not considered in the model.
Figure 10. Comparison of simulated groundwater discharge to the Bulang River and the separated base flow from November 2010 to October2011.
Water 07 05959 g010

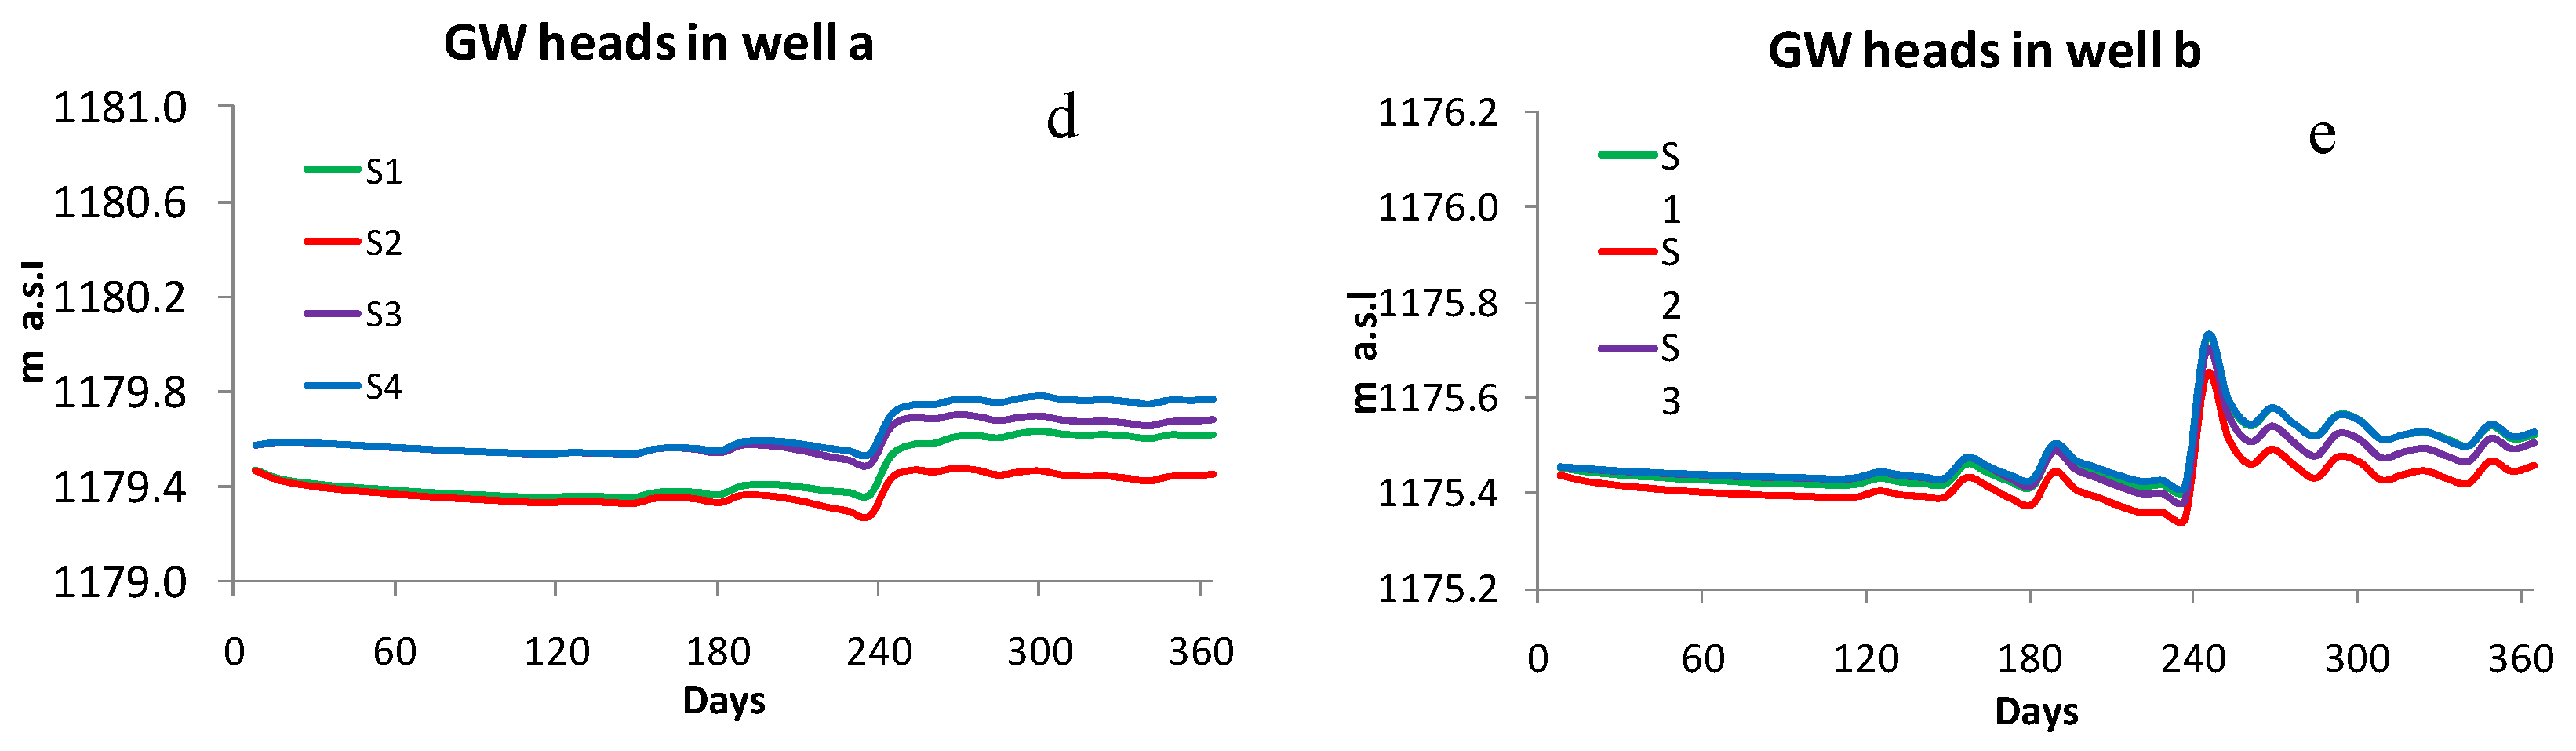
3.2.3. Sensitivity of the Transient Groundwater Model

Since the model was calibrated based on the one year measurements of groundwater levels and stream discharge and there are uncertainties in upscaling ET and estimating hydraulic conductivities, sensitivity analysis was performed to test sensitivities of computed groundwater levels and stream discharges to uncertainties in ET and hydraulic conductivity. In order to evaluate effects of inter-annual variations of precipitation, sensitivity of precipitation is also investigated. The coefficient of variation of the annual precipitation is 0.265 in the area. Therefore, precipitation, ET, and hydraulic conductivities were alternately increased and decreased by 26.5%, the transient model was run to compute the changes of groundwater levels and stream discharges while the other variables were kept fixed. The results are shown in Figure 11. The stream discharges are more sensitive to uncertainties in hydraulic conductivities while groundwater levels are more sensitive to changes in precipitation and ET values.
The calibrated transient groundwater flow model was used to simulate the scenarios. For each scenario, the model computes groundwater level changes, groundwater discharge to the Bulang River, deep groundwater circulation to the Hailiutu River, and change of groundwater storage.
Figure 11. Sensitivity of computed stream discharge (a); and groundwater levels (be) to precipitation (P), evapotranspiration (ET), and hydraulic conductivity (HC); the sign (−) and (+) in the legend indicates the decreasing and increasing values by 26.5%.
Water 07 05959 g011

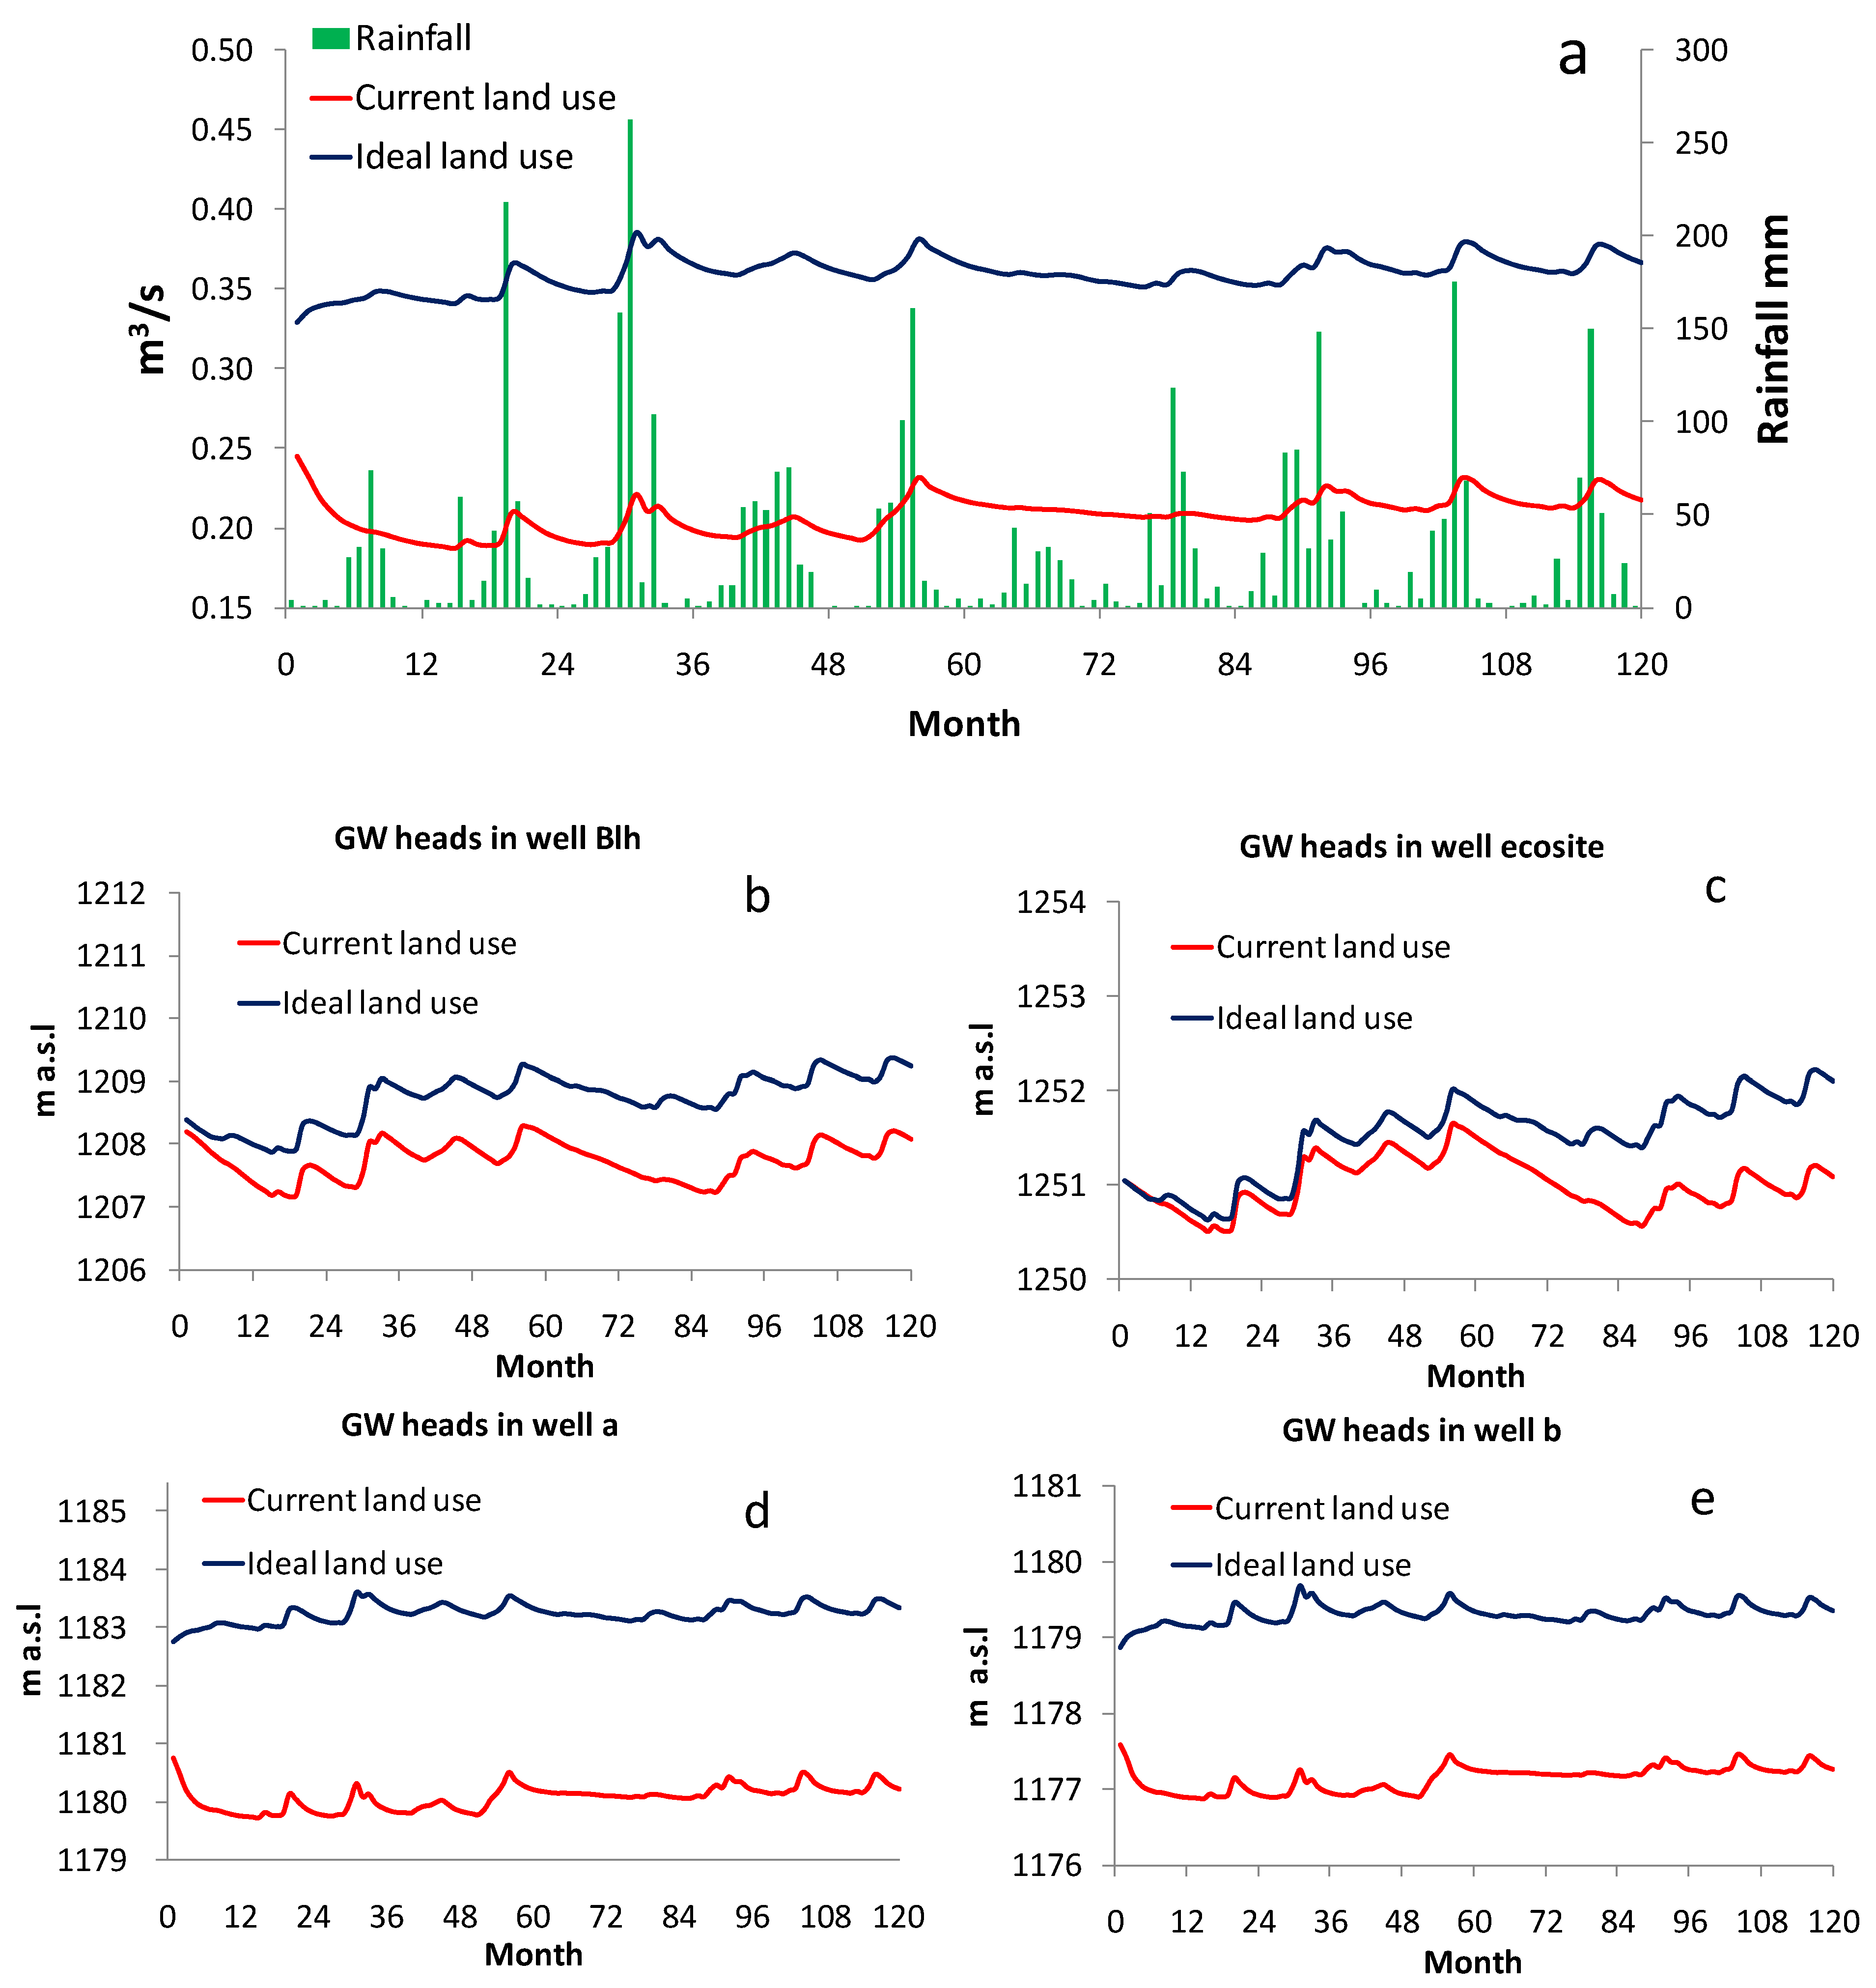
3.3. Simulation of Land Use Change Scenarios

Annual water balance components for the four scenarios are summarized in Table 4. Time series of changes in discharge to the Bulang River and groundwater levels in four observation wells are plotted in Figure 12. The annual water balance computations show that net groundwater recharge increases significantly in scenario (1) and (4) when desert grasses were used for the protection of sand dunes. Discharge to the Bulang River increases slightly with increasing net recharge, while deep groundwater circulation discharging to the Hailiutu River remains constant. The benefit of increasing net recharge is largely in increasing groundwater storage, especially in scenarios (1) and (4). Increase of discharge to the Bulang River and increase of groundwater levels occur in the growing period from mid April to mid September (Figure 12). In the winter months, river discharge and groundwater levels are stable since there is neither precipitation nor evapotranspiration.
Table 4. Comparison of simulated water balance for four scenarios (mm/year).
Annual ComponentsPrecipitationETNet RechargeDischargeDeep CirculationChange of Storage
Scenario 1214.8102.7112.113.48.190.1
Scenario 2214.8196.018.812.78.0−4.1
Scenario 3214.8189.225.612.88.03.9
Scenario 4214.8120.993.913.28.172.4
Figure 12. Simulated groundwater discharge to the Bulang River (a); and the calculated groundwater heads in well Blh (b); eco_site (c); well a (d); and well b (e) for four land use scenarios.
Water 07 05959 g012aWater 07 05959 g012b
Annual water balance components for scenarios 2 and 4 under different hydrological years are summarized in Table 5. Time series of changes in discharge to the Bulang River and groundwater levels in four observation wells are plotted in Figure 13. The simulation results show that net groundwater recharge is increased significantly in normal and wet hydrological years as a result of increase of precipitation while evapotranspiration is only increased slightly comparing to the dry year. The increase of net recharge contributes largely to the increase of groundwater storage while discharge to the stream also increases. The increase of groundwater storage and stream discharges is more profound under the ideal land use scenario 4 compared to the current land use scenario 2. Under the ideal land use scenario, a healthy vegetation cover can be sustained in all years while water resources can be conserved for other social and economic uses.
Table 5. Comparison of simulated annual water balance components for scenarios 2 and 4 under different hydrological years (mm/year).
Annual ComponentsPrecipitationETNet RechargeDischargeDeep CirculationChange of Storage
Scenario 2Dry214.8196.018.812.78.0−4.06
Normal340.0218.4121.613.68.299.24
Wet420.0280.5139.513.88.4115.86
Scenario 4Dry214.8120.993.913.28.172.4
Normal340.0136.7203.314.18.3179.9
Wet420.0166.0254.014.58.4228.6
In order to evaluate the long-term impact of land use scenarios on groundwater discharges and groundwater levels in consideration of inter-annual variability of climate in the Bulang catchment, the calibrated transient model was extended to multiple years from 2000 to 2009. The month was chosen as stress period so that the transient model simulates 120 months. The monthly net groundwater recharge was estimated from monthly precipitations at Wushenqi station and estimated ET values. The monthly ET values for the current land use and ideal land use scenarios were estimated using the ratio of monthly ET to precipitation in the annual simulation of dry, normal and wet years. The simulation results are presented in Figure 14. In general, groundwater discharges and groundwater levels exhibit inter-annual variations. Groundwater levels and discharges were increased during the wet years of 2001 and 2002, and decreased during dry years of 2005 and 2006, and recovered during subsequent normal years. The depleted groundwater storage during the dry years can be restored during the normal and wet years. The alternating dry, normal and wet years will not cause degradation of vegetations since groundwater provides a reliable resource to sustain the vegetation. In comparison to the current land use, under the ideal land use scenario, groundwater levels in 4 observation wells are increased which lead to the increase of groundwater discharge to the river.
Figure 13. Simulated groundwater discharge to the Bulang River and calculated groundwater heads with current land use (a2e2); and Ideal land use scenario (a4e4) under dry, normal and wet hydrological years.
Water 07 05959 g013
Figure 14. Simulated groundwater discharge to the Bulang River and the monthly rainfall at Wushenqi from 2000 to 2009 (a); the calculated groundwater heads in well Blh (b); eco_site (c); well a (d); and well b (e) for current and ideal land use scenarios from 2000 to 2009.
Water 07 05959 g014

4. Discussions

Located in a semi-arid region, the Bulang catchment is covered by sand dunes. The hydrological processes are dominated by direct infiltration of precipitation and evapotranspiration. Direct surface runoff is limited and river discharge is maintained by groundwater discharge. Local authorities have implemented count mobilization measures against desertification by planting shrubs on unstable sand dunes, but large scale plantations of salix bushes to prevent desertification consumes too much water resources. The model simulation of current land use scenario in 2011 shows that in total 91% of the annual precipitation is consumed by the vegetation and crops in the catchment, the net groundwater recharge amounts to only 9% of the precipitation, which maintains stream discharge. However, for the ideal land use of planting desert grasses and dry resistant crops, only 56% of the annual precipitation would be consumed by dry resistant plants and crops and net groundwater recharge will be increased to 44% of the annual precipitation. In comparison with the result of scenario 3, the increase of net groundwater recharge is mainly contributed from planting desert grasses since the cropland area is limited to 3% of the land area in the Hailiutu River [60].
Inter-annual variations of precipitation have large impacts on the catchment water balance. The net groundwater recharge will be increased to 60.0% of the annual precipitation during normal and wet hydrological years for the ideal land use scenario. Groundwater storage and stream discharges are increased significantly during normal and wet years. The preliminary long-term simulations indicate that the depleted groundwater storage can be restored during normal and wet hydrological years while alternating dry, normal and wet hydrological years occur.
Although the study attempts estimating evapotranspiration rates using site measurements and upscaling with NDVI values, there are a number of limitations to be considered in the future research.
First, the site measurements of sap flow of salix bush, willow tree, and maize should be continued to obtain long-term reference evapotranspiration values for dry, normal and wet years. A field ecohydrological research site is under construction which includes large diameter lysimeters for measuring evapotranspiration of dominant plants and crops and net groundwater recharge at various groundwater table depths. Second, evapotranspiration of desert grasses (Artemisia Ordosica) and dry resistant crops (Sorghum and millet) should be measured. Eddy covariance technique [61] is most suited to measure evapotranspiration of grasses and crops at the plot scale. Third, the same NDVI map was used to compute the grid ET values for scenarios 2, 3, and 4 with the reference ET values of crops and plants. There are uncertainties in the estimated grid ET values with this upscaling method. Seasonal variations of NDVI values of crops and plants were not considered. ET values might change for different combinations of crops and plants in different scenarios. A more reliable relationship between seasonal NDVI and ET values could be established with long-term systematic measurements of plot scale ET values of dominant crops and plants with Eddy covariance technique.
The constructed groundwater model could be further improved by installing a number of monitoring wells in the recharge area in the northwestern part of the catchment. One more rain gauge at the northern boundary could provide better information about the spatial distribution of the rainfall input. Since most of the cropland is irrigated by means of groundwater abstraction, the investigation of the location and amount of groundwater abstraction should be implemented. Furthermore, the scattered small pools in local depressions with open water evaporation should be taken into account, where the evapotranspiration (ET) package of MODFLOW would be considered in the groundwater model.
The interaction between evapotranspiration and groundwater table depth was not simulated in the model. For scenarios with a significant increase of groundwater storage, groundwater table depth becomes shallower resulting higher evapotranspiration. This interaction can be partially simulated by using the ET package in MODFLOW.
The long-term simulations show that groundwater levels and discharges are relatively stable and fluctuate around long term means. A recent study by Yin et al. [62] simulated impacts of long-term climate variations on tree water use in the area. The result shows that trees did not suffer from water stress during the dry years because of the availability of groundwater for transpiration. The long-term monitoring of metrology, hydrology, and vegetation should be continued to ascertain the findings from model simulation.

5. Conclusions

Groundwater is the most important resource for local society and ecosystem protection in the semi-arid Bulang catchment. Groundwater maintains stream discharge and sustains vegetation growth. Net groundwater recharge, defined as precipitation minus evapotranspiration, is a good indicator of water resources availability in the area since dominant hydrological processes are direct infiltration of precipitation and evapotranspiration.
The simulation of the current land use in 2011 (being a dry year) indicates that nearly 91% of the annual precipitation is consumed by evapotranspiration of salix bushes and maize crops. Only 9% of the annual precipitation becomes net groundwater recharge which maintains a stable stream discharge. Although it is not possible to restore pristine land cover by desert grasses (scenario 1), an ideal land use (scenario 4) can be achieved by planting desert grasses for fixing sand dunes and dry resistant crops (sorghum and millet) for the local society. The simulation shows that the evapotranspiration consumes only 56% of the annual precipitation under the ideal land use scenario in dry year, and 40% in normal and wet years. The increase of net groundwater recharge is mainly contributed by planting desert grasses since the cropland area is limited.
The simulation of scenarios 2 and 4 under normal and wet hydrological years show significant increase of groundwater storage and slight increase of river discharges comparing to the dry year. The long-term simulations show that groundwater levels and discharges are relatively stable and fluctuate around long-term means. The depleted groundwater storage during the dry years can be restored during normal and wet years.
The results of this study have relevant implications for water and ecosystem management in the catchment. In order to maintain river discharges and sustain a healthy growth of groundwater dependent vegetations, future land use changes should aim introducing dry resistant crops and desert grasses for vegetating sand dunes.

Acknowledgments

This study was supported by the Honor Power Foundation (China) and UNESCO-IHE (Delft, The Netherlands) and its donors. Assistance during the field work by Xi’an Center of Geological Survey is gratefully acknowledged. The critical review of three anonymous referees helped for the further improvement of the manuscript.

Author Contributions

Zhi Yang and Yangxiao Zhou were primarily responsible for implementing the research, conducting groundwater model simulations, and preparing manuscript. Jochen Wenninger was involved in the experimental field measurement setup, the hydrograph separation calculations, and revision of the manuscript. Stefan Uhlenbrook and Li Wan supervised the research and critically reviewed the draft manuscript.

Conflicts of Interest

The authors declare to have no conflict of interest.

References

  1. Snyman, H.; Fouché, H. Production and water-use efficiency of semi-arid grasslands of South Africa as affected by veld condition and rainfall. Water SA 1991, 17, 263–268. [Google Scholar]
  2. Deng, X.P.; Shan, L.; Zhang, H.; Turner, N.C. Improving agricultural water use efficiency in arid and semiarid areas of China. Agric. Water Manag. 2006, 80, 23–40. [Google Scholar] [CrossRef]
  3. Mitchell, D.; Fullen, M.; Trueman, I.; Fearnehough, W. Sustainability of reclaimed desertified land in Ningxia, China. J. Arid Environ. 1998, 39, 239–251. [Google Scholar] [CrossRef]
  4. Bellot, J.; Sanchez, J.; Chirino, E.; Hernandez, N.; Abdelli, F.; Martinez, J. Effect of different vegetation type cover on the soil water balance in semi-arid areas of south eastern Spain. Phys. Chem. Earth Part B: Hydrol. Oceans Atmos. 1999, 24, 353–357. [Google Scholar] [CrossRef]
  5. Mermoud, A.; Tamini, T.; Yacouba, H. Impacts of different irrigation schedules on the water balance components of an onion crop in a semi-arid zone. Agric. Water Manag. 2005, 77, 282–295. [Google Scholar] [CrossRef]
  6. Brown, A.E.; Zhang, L.; McMahon, T.A.; Western, A.W.; Vertessy, R.A. A review of paired catchment studies for determining changes in water yield resulting from alterations in vegetation. J. Hydrol. 2005, 310, 28–61. [Google Scholar] [CrossRef]
  7. Jothityangkoon, C.; Sivapalan, M.; Farmer, D. Process controls of water balance variability in a large semi-arid catchment: Downward approach to hydrological model development. J. Hydrol. 2001, 254, 174–198. [Google Scholar] [CrossRef]
  8. Farmer, D.; Sivapalan, M.; Jothityangkoon, C. Climate, soil, and vegetation controls upon the variability of water balance in temperate and semiarid landscapes: Downward approach to water balance analysis. Water Resour. Res. 2003, 39. [Google Scholar] [CrossRef]
  9. Scott, R.L.; James Shuttleworth, W.; Goodrich, D.C.; Maddock, T., III. The water use of two dominant vegetation communities in a semiarid riparian ecosystem. Agric. For. Meteorol. 2000, 105, 241–256. [Google Scholar] [CrossRef]
  10. Li, Y.; Cui, J.; Zhang, T.; Okuro, T.; Drake, S. Effectiveness of sand-fixing measures on desert land restoration in Kerqin Sandy Land, northern China. Ecol. Eng. 2009, 35, 118–127. [Google Scholar] [CrossRef]
  11. Zhang, L.; Dawes, W.; Walker, G. Response of mean annual evapotranspiration to vegetation changes at catchment scale. Water Resour. Res. 2001, 37, 701–708. [Google Scholar] [CrossRef]
  12. Lørup, J.K.; Refsgaard, J.C.; Mazvimavi, D. Assessing the effect of land use change on catchment runoff by combined use of statistical tests and hydrological modelling: Case studies from Zimbabwe. J. Hydrol. 1998, 205, 147–163. [Google Scholar] [CrossRef]
  13. Bronstert, A.; Niehoff, D.; Bürger, G. Effects of climate and land-use change on storm runoff generation: Present knowledge and modelling capabilities. Hydrol. Process. 2002, 16, 509–529. [Google Scholar] [CrossRef]
  14. Niehoff, D.; Fritsch, U.; Bronstert, A. Land-use impacts on storm-runoff generation: Scenarios of land-use change and simulation of hydrological response in a meso-scale catchment in SW-Germany. J. Hydrol. 2002, 267, 80–93. [Google Scholar] [CrossRef]
  15. Yang, Z.; Zhou, Y.; Wenninger, J.; Uhlenbrook, S. The causes of flow regime shifts in the semi-arid Hailiutu River, Northwest China. Hydrol. Earth Syst. Sci. 2012, 16, 87–103. [Google Scholar] [CrossRef]
  16. Ahearn, D.S.; Sheibley, R.W.; Dahlgren, R.A.; Anderson, M.; Johnson, J.; Tate, K.W. Land use and land cover influence on water quality in the last free-flowing river draining the western Sierra Nevada, California. J. Hydrol. 2005, 313, 234–247. [Google Scholar] [CrossRef]
  17. Zampella, R.A.; Procopio, N.A.; Lathrop, R.G.; Dow, C.L. Relationship of land-use/land-cover patterns and surface-water quality in the mullica river Basin1. J. Am. Water Resour. Assoc. 2007, 43, 594–604. [Google Scholar] [CrossRef]
  18. Harbor, J.M. A practical method for estimating the impact of land-use change on surface runoff, groundwater recharge and wetland hydrology. J. Am. Water Resour. Assoc. 1994, 60, 95–108. [Google Scholar] [CrossRef]
  19. Scanlon, B.R.; Reedy, R.C.; Stonestrom, D.A.; Prudic, D.E.; Dennehy, K.F. Impact of land use and land cover change on groundwater recharge and quality in the southwestern US. Glob. Chang. Biol. 2005, 11, 1577–1593. [Google Scholar] [CrossRef]
  20. Salama, R.; Hatton, T.; Dawes, W. Predicting land use impacts on regional scale groundwater recharge and discharge. J. Environ. Qual. 1999, 28, 446–460. [Google Scholar] [CrossRef]
  21. Batelaan, O.; De Smedt, F.; Triest, L. Regional groundwater discharge: Phreatophyte mapping, groundwater modelling and impact analysis of land-use change. J. Hydrol. 2003, 275, 86–108. [Google Scholar] [CrossRef]
  22. Furukawa, Y.; Inubushi, K.; Ali, M.; Itang, A.; Tsuruta, H. Effect of changing groundwater levels caused by land-use changes on greenhouse gas fluxes from tropical peat lands. Nutr. Cycl. Agroecosyst. 2005, 71, 81–91. [Google Scholar] [CrossRef]
  23. Jeong, C.H. Effect of land use and urbanization on hydrochemistry and contamination of groundwater from Taejon area, Korea. J. Hydrol. 2001, 253, 194–210. [Google Scholar] [CrossRef]
  24. McLay, C.; Dragten, R.; Sparling, G.; Selvarajah, N. Predicting groundwater nitrate concentrations in a region of mixed agricultural land use: A comparison of three approaches. Environ. Pollut. 2001, 115, 191–204. [Google Scholar] [CrossRef]
  25. Molénat, J.; Gascuel-Odoux, C. Modelling flow and nitrate transport in groundwater for the prediction of water travel times and of consequences of land use evolution on water quality. Hydrol. Process. 2002, 16, 479–492. [Google Scholar] [CrossRef]
  26. Cole, M.L.; Kroeger, K.D.; McClelland, J.W.; Valiela, I. Effects of watershed land use on nitrogen concentrations and δ 15 nitrogen in groundwater. Biogeochemistry 2006, 77, 199–215. [Google Scholar] [CrossRef]
  27. Choi, W.J.; Han, G.H.; Lee, S.M.; Lee, G.T.; Yoon, K.S.; Choi, S.M.; Ro, H.M. Impact of land-use types on nitrate concentration and δ15 N in unconfined groundwater in rural areas of Korea. Agric. Ecosyst. Environ. 2007, 120, 259–268. [Google Scholar] [CrossRef]
  28. Krause, S.; Jacobs, J.; Bronstert, A. Modelling the impacts of land-use and drainage density on the water balance of a lowland–floodplain landscape in northeast Germany. Ecol. Model. 2007, 200, 475–492. [Google Scholar] [CrossRef]
  29. Leblanc, M.; Favreau, G.; Tweed, S.; Leduc, C.; Razack, M.; Mofor, L. Remote sensing for groundwater modelling in large semiarid areas: Lake Chad Basin, Africa. Hydrogeol. J. 2007, 15, 97–100. [Google Scholar] [CrossRef] [Green Version]
  30. Courault, D.; Seguin, B.; Olioso, A. Review on estimation of evapotranspiration from remote sensing data: From empirical to numerical modeling approaches. Irrig. Drain. Syst. 2005, 19, 223–249. [Google Scholar] [CrossRef]
  31. Waters, P.; Greenbaum, D.; Smart, P.L.; Osmaston, H. Applications of remote sensing to groundwater hydrology. Remote Sens. Rev. 1990, 4, 223–264. [Google Scholar] [CrossRef]
  32. Sener, E.; Davraz, A.; Ozcelik, M. An integration of GIS and remote sensing in groundwater investigations: A case study in Burdur, Turkey. Hydrogeol. J. 2005, 13, 826–834. [Google Scholar] [CrossRef]
  33. Münch, Z.; Conrad, J. Remote sensing and GIS based determination of groundwater dependent ecosystems in the Western Cape, South Africa. Hydrogeol. J. 2007, 15, 19–28. [Google Scholar] [CrossRef]
  34. Shaban, A.; Khawlie, M.; Abdallah, C. Use of remote sensing and GIS to determine recharge potential zones: The case of Occidental Lebanon. Hydrogeol. J. 2006, 14, 433–443. [Google Scholar] [CrossRef]
  35. Tweed, S.O.; Leblanc, M.; Webb, J.A.; Lubczynski, M.W. Remote sensing and GIS for mapping groundwater recharge and discharge areas in salinity prone catchments, southeastern Australia. Hydrogeol. J. 2007, 15, 75–96. [Google Scholar] [CrossRef]
  36. Bobba, A.; Bukata, R.; Jerome, J. Digitally processed satellite data as a tool in detecting potential groundwater flow systems. J. Hydrol. 1992, 131, 25–62. [Google Scholar] [CrossRef]
  37. Ben-Dor, E.; Goldshleger, N.; Braun, O.; Kindel, B.; Goetz, A.; Bonfil, D.; Margalit, N.; Binaymini, Y.; Karnieli, A.; Agassi, M. Monitoring infiltration rates in semiarid soils using airborne hyperspectral technology. Int. J. Remote Sens. 2004, 25, 2607–2624. [Google Scholar] [CrossRef]
  38. Kalma, J.D.; McVicar, T.R.; McCabe, M.F. Estimating land surface evaporation: A review of methods using remotely sensed surface temperature data. Surv. Geophys. 2008, 29, 421–469. [Google Scholar] [CrossRef]
  39. Groeneveld, D.P.; Baugh, W.M.; Sanderson, J.S.; Cooper, D.J. Annual groundwater evapotranspiration mapped from single satellite scenes. J. Hydrol. 2007, 344, 146–156. [Google Scholar] [CrossRef]
  40. Groeneveld, D.P. Remotely-sensed groundwater evapotranspiration from alkali scrub affected by declining water table. J. Hydrol. 2008, 358, 294–303. [Google Scholar] [CrossRef]
  41. Jin, X.; Wan, L.; Zhang, Y.; Xue, Z.; Yin, Y. A study of the relationship between vegetation growth and groundwater in the Yinchuan Plain. Earth Sci. Front. 2007, 14, 197–203. [Google Scholar] [CrossRef]
  42. Jin, X.M.; Schaepman, M.E.; Clevers, J.G.; Su, Z.B.; Hu, G. Groundwater depth and vegetation in the Ejina area, China. Arid Land Res. Manag. 2011, 25, 194–199. [Google Scholar] [CrossRef]
  43. Lv, J.; Wang, X.S.; Zhou, Y.; Qian, K.; Wan, L.; Eamus, D.; Tao, Z. Groundwater-dependent distribution of vegetation in Hailiutu River catchment, a semi-arid region in China. Ecohydrology 2013, 6, 142–149. [Google Scholar] [CrossRef]
  44. Zhou, Y.; Wenninger, J.; Yang, Z.; Yin, L.; Huang, J.; Hou, L.; Wang, X.; Zhang, D.; Uhlenbrook, S. Groundwater—Surface water interactions, vegetation dependencies and implications for water resources management in the semi-arid Hailiutu River catchment, China—A synthesis. Hydrol. Earth Syst. Sci. 2013, 17, 2435–2447. [Google Scholar] [CrossRef]
  45. Lubczynski, M.W.; Gurwin, J. Integration of various data sources for transient groundwater modeling with spatio-temporally variable fluxes—Sardon study case, Spain. J. Hydrol. 2005, 306, 71–96. [Google Scholar] [CrossRef]
  46. Bethenod, O.; Katerji, N.; Goujet, R.; Bertolini, J.; Rana, G. Determination and validation of corn crop transpirationby sap flow measurement under field conditions. Theor. Appl. Climatol. 2000, 67, 153–160. [Google Scholar] [CrossRef]
  47. Ford, C.R.; Hubbard, R.M.; Kloeppel, B.D.; Vose, J.M. A comparison of sap flux-based evapotranspiration estimates with catchment-scale water balance. Agric. For. Meteorol. 2007, 145, 176–185. [Google Scholar] [CrossRef]
  48. Stisen, S.; Jensen, K.H.; Sandholt, I.; Grimes, D.I. A remote sensing driven distributed hydrological model of the Senegal River basin. J. Hydrol. 2008, 354, 131–148. [Google Scholar] [CrossRef]
  49. Hendricks Franssen, H.; Brunner, P.; Makobo, P.; Kinzelbach, W. Equally likely inverse solutions to a groundwater flow problem including pattern information from remote sensing images. Water Resour. Res. 2008, 44. [Google Scholar] [CrossRef]
  50. Li, H.; Brunner, P.; Kinzelbach, W.; Li, W.; Dong, X. Calibration of a groundwater model using pattern information from remote sensing data. J. Hydrol. 2009, 377, 120–130. [Google Scholar] [CrossRef]
  51. Yang, Z.; Zhou, Y.; Wenninger, J.; Uhlenbrook, S. A multi-method approach to quantify groundwater/surface water-interactions in the semi-arid Hailiutu River basin, northwest China. Hydrogeol. J. 2014, 22, 527–541. [Google Scholar] [CrossRef]
  52. McDonald, M.G.; Harbaugh, A.W. A Modular Three-Dimensional Finite-Difference Ground-Water Flow Model; Scientific Publications Company: Reston, VA, USA, 1984. [Google Scholar]
  53. Doherty, J.; Brebber, L.; Whyte, P. PEST: Model-Independent Parameter Estimation; Watermark Computing: Corinda, Australia, 1994. [Google Scholar]
  54. Hou, L.; Wenninger, J.; Shen, J.; Zhou, Y.; Bao, H.; Liu, H. Assessing crop coefficients for Zea mays in the semi-arid Hailiutu River catchment, northwest China. Agric. Water Manag. 2014, 140, 37–47. [Google Scholar] [CrossRef]
  55. Xuejun, D.; Xinshi, Z.; Baozhen, Y. A preliminary study on the water balance for some sand land shrubs based on transpiration measurements in field condition. Acta Phytoecol. Sin. 1997, 21, 208–225. [Google Scholar]
  56. Huang, J.; Zhou, Y.; Yin, L.; Wenninger, J.; Zhang, J.; Hou, G.; Zhang, E.; Uhlenbrook, S. Climatic controls on sap flow dynamics and used water sources of Salix psammophila in a semi-arid environment in northwest China. Environ. Earth Sci. 2015, 73, 289–301. [Google Scholar] [CrossRef]
  57. Yang, Z.; Li, X.; Sun, Y.; Liu, L.; Zhang, X.; Ma, Y. Characteristics of rainfall interception and stemflow for Salix Psammophila in Maowusu sandland, Northwest China. Adv. Water Sci. 2008, 19, 693–698. [Google Scholar]
  58. Lin, D.J.; Zheng, Z.C.; Zhang, X.Z.; LI, T.X.; Wang, Y.D. Study on the effect of maize plants on rainfall redistribution processes. Sci. Agric. Sin. 2011, 44, 2608–2615. [Google Scholar]
  59. Mu, Q.; Zhao, M.; Running, S.W. Improvements to a MODIS global terrestrial evapotranspiration algorithm. Remote Sens. Environ. 2011, 115, 1781–1800. [Google Scholar] [CrossRef]
  60. Yangxiao, Z.; Zhi, Y.; Danrong, Z.; Xiaomei , J.; Jun, Z. Inter-catchment comparison of flow regime between the Hailiutu and Huangfuchuan rivers in the semi-arid Erdos Plateau, Northwest China. Sci. J. 2015, 60, 688–705. [Google Scholar]
  61. Zhao, X.; Jia, Z.; Liu, H.; Song, T.; Wang, Y.; Shi, L.; Song, C.; Wang, Y. Effects of the conversion of marshland to cropland on water and energy exchanges in northeastern China. J. Hydrol. 2008, 355, 181–191. [Google Scholar] [CrossRef]
  62. Yin, L.; Zhou, Y.; Huang, J.; Wenninger, J.; Zhang, E.; Hou, G. Interaction between groundwater and trees in an arid site: Potential impacts of climate variation and groundwater abstraction on trees. J. Hydrol. 2015, 528, 435–448. [Google Scholar] [CrossRef]

