Article

Effects of Polymer Molecular Weight on Adsorption and Flocculation in Aqueous Kaolinite Suspensions Dosed with Nonionic Polyacrylamides

by
Byung Joon Lee
1,* and
Mark A. Schlautman
2
1
Department of Construction and Environmental Engineering, Kyungpook National University, 2559 Gyeongsang-daero, Sangju, Gyeongbuk 742-711, Korea
2
Department of Environmental Engineering & Earth Sciences, Clemson University, Anderson, SC 29625-6510, USA
*
Author to whom correspondence should be addressed.
Water 2015, 7(11), 5896-5909; https://doi.org/10.3390/w7115896
Submission received: 25 September 2015 / Revised: 22 October 2015 / Accepted: 22 October 2015 / Published: 28 October 2015

Abstract

:
The effects of polyacrylamide (PAM) molecular weights (MWs) on the PAM adsorption capacities and PAM-mediated flocculation of kaolinite suspensions were investigated using a series of nonionic PAMs with different MWs. Adsorption tests using aqueous kaolinite suspensions dosed with a series of PAMs with MWs of 1.5 kg/mol, 10 kg/mol, 0.6–1 Mg/mol, 5–6 Mg/mol, and 18 Mg/mol (referred to as 1.5 K, 10 K, 0.6–1 M, 5–6 M, and 18 M PAMs) indicated that the adsorption capacity of the kaolinite for PAM increased with increasing MW. However, the capacity for 18 M PAM was 20 times smaller than those for the 0.6–1 M and 5–6 M PAMs, although it has the highest MW. In steady-shear viscosity tests, a 1 g/L stock solution of 18 PAM was found to cause polymeric chain entanglements, which reduced the adsorption capacity. The 0.6–1 M and 5–6 M PAMs were further used in flocculation tests, in order to investigate the effect of PAM MW on the flocculation capability. The 5–6 M PAM was found to have higher flocculation capabilities than 0.6–1 M PAM; 5–6 M PAM was more subject to nonequilibrium flocculation, resulting in the development of unstable, stretched polymeric structures on solid surfaces and increasing particle-particle bridging and flocculation. Higher-MW PAMs are more effective flocculation agents, because of their higher adsorption capacities and flocculation capabilities. However, an extremely high-MW PAM, such as 18 M PAM, decreases adsorption/flocculation, and the preparation and handling of working solutions become difficult, because of polymeric chain entanglements.

1. Introduction

Soil erosion occurs in both urban and rural areas during storm events. Generally, the problem increases with increasing land disturbance (e.g., tillage, mining, road grading, and rural to urban land conversion). Colloidal-size clay particles are generally the most problematic soil particles, and if not controlled, they can enter various receiving water bodies, where the materials they carry (nutrients, toxicants, pathogens, etc.) can contribute to siltation of bottom sediments, algal blooms, oxygen depletion, and food-chain problems [1,2,3]. Polyacrylamides (PAMs) have been used as soil stabilizers or flocculants to counteract soil erosion and colloid Ws). Nonionicproliferation in water environments, because PAMs have high solubilities, viscosities, and molecular weights (M or anionic PAMs have mostly been used in soil and aquatic environments rather than cationic PAMs, which have been reported to poison various aquatic organisms by blocking body membranes [4,5,6,7].
A series of physicochemical processes, such as adsorption, reconfiguration, and flocculation, occur in clay suspensions dosed with polymers [8]. The adsorption of polymeric molecules on clay particles is the first step, triggering reconfiguration and flocculation. Various binding mechanisms between clay particles and polymeric molecules, such as covalent bonding, hydrogen bonding, hydrophobic interactions, electrostatic attractions, and divalent cationic bridging, are known to enhance adsorption [9,10,11,12,13]. Reconfiguration of the adsorbed polymeric molecules then occurs on the clay particles. The adsorbed polymeric molecules then reconfigure themselves as either flocculation-active standing or flocculation-inactive flat configurations on the clay particle surfaces, depending on the PAM MW and other polymeric properties. Finally, the adsorbed and reconfigured polymeric chains cause flocculation of polymer-adsorbed clay particles [14,15,16]. Flocculation in colloidal suspensions with polymers can be caused by charge neutralization and/or bridging flocculation [17]. However, charge neutralization can hardly induce flocculation in clay suspensions with nonionic or anionic polymers, because such polymers cannot neutralize negatively charged clay particles. Instead, bridging flocculation, in which adsorbed polymeric molecules reach other clay particles outside the electrostatic repulsion layer and bridge clay particles in a large settleable floc, may be the major flocculation mechanism in clay suspensions with polymers.
Similar to other polymers, PAMs undergo adsorption, reconfiguration, and flocculation in clay suspensions. Some PAM characteristics such as MW and charge density are known to control those physicochemical processes. It has been reported that MW is the key characteristic determining PAM-driven adsorption, reconfiguration, and flocculation; for example, the adsorption capacity and flocculation capability of a PAM have been reported to increase with increasing PAM MW [9,18,19]. The longer polymeric chains of a higher-MW PAM become more stretched out of the electrostatic repulsion layers on the clay surfaces, increasing the adsorption capacity and flocculation capability [20]. Furthermore, longer polymeric chains have been reported to be more susceptible to nonequilibrium flocculation, in which stretching and waving of polymeric chains enhance the flocculation capability before settling on the clay surfaces [14,16,21].
The purpose of this research was to investigate the effect of PAM MW on adsorption, reconfiguration, and flocculation in aqueous kaolinite suspensions dosed with a series of nonionic PAMs with different MWs. First, the hypothesis that the PAM adsorption capacity increased with increasing PAM MW was tested using bottle-point adsorption tests. Second, the effect of PAM MW on polymeric chain reconfiguration and particle flocculation was investigated in shear-controlled flocculation tests. It was hypothesized that a higher-MW PAM in strong fluid turbulence caused stretching and waving configurations of adsorbed polymeric chains, and consequently enhanced flocculation via a nonequilibrium flocculation mechanism. In this paper, we discuss the validity of this hypothesis, based on experimental data from adsorption and flocculation tests.

2. Materials and Methods

2.1. Materials

A series of PAMs with different MWs, i.e., MWs of 1.5 kg/mol, 10 kg/mol, 0.6–1 Mg/mol, 5–6 Mg/mol, and 18 Mg/mol (Polyscience Inc., Warrington, PA, USA), which are denoted by 1.5 K, 10 K, 0.6–1 M, 5–6 M, and 18 M PAMs in this paper, were tested as adsorbates and flocculants in adsorption and flocculation tests. PAM stock solutions of concentration 1 g/L were prepared by dissolving the PAMs in distilled, deionized water. The solutions were gently stirred for several days to ensure complete dissolution and then stored in the dark during the adsorption and flocculation tests. Kaolinite suspensions were prepared by dissolving commercial kaolinite powders in distilled, deionized water and adjusting to pH 7 and 0.01 M NaCl. The suspensions were stirred for about 2 days to achieve complete hydration of the kaolinite surfaces and equilibration with the atmosphere. In this research, two different commercial kaolinites were used in the adsorption and flocculation tests, respectively. Sigma kaolin (Sigma-Aldrich, St. Louis, MO, USA) was used in the adsorption tests, and Kaofil kaolinite (Thiele Kaolin Company, Sandersville, GA, USA) was purchased in bulk for the flocculation experiments. The vendor reported that the particle size range of the Sigma kaolinite was 0.1–4 µm. The mean particle size of Kaofil was previously determined to be 1.4 µm [22].

2.2. Adsorption Tests

Bottle-point adsorption tests were used to obtain the adsorption isotherms of five different PAMs (i.e., 1.5 K, 10 K, 0.6–1 M, 5–6 M, and 18 M PAMs) [23]. The kaolinite suspension and PAM stock solutions, at pH 7 and 0.01 M NaCl concentration, were prepared, and then 225 mL polypropylene bottles (VWR, Radnor, PA, USA) were filled with 200 mL of 10 g/L kaolinite suspension and different amounts of 1 g/L PAM stock solution. For each bottle point of the adsorption isotherm curve, the test bottles were triplicated for quality control and assurance. Additionally, a set of control systems without kaolinite addition were prepared, to check the PAM loss in the aqueous phase by physicochemical processes other than adsorption on kaolinite; to generate eight points on a PAM adsorption isotherm curve, 24 experimental bottles and three control bottles were therefore prepared. These adsorption-testing bottles containing kaolinite suspensions and PAMs were stirred, using a Thermolyne® Bigger Bill orbital shaker (Thermo Fisher Scientific Inc., Waltham, MA, USA), at 20 °C for 48 h. After 48 h, the suspended kaolinite samples were centrifuged at 10,000g for 20 min, using a super-speed centrifuge (Sorvall Evolution RC; Thermo Fisher Scientific Inc., Waltham, USA), to separate the solids from the solution phase. The solution-phase equilibrium PAM concentrations (Ce) were measured using a total organic carbon/total nitrogen analyzer (TOC-VCSH; Shimadzu Corp., Kyoto, Japan). The solid-phase equilibrium PAM concentration (qe) was calculated by subtracting the solution-phase PAM concentration from the total dosed PAM concentration. The adsorption capacity (i.e., the solid-phase PAM concentration) was then expressed as adsorbed PAM mass per kaolinite mass (mg-PAM/g-kaolinite), and used as a point on the adsorption isotherm curve. Finally, the PAM adsorption isotherm curves were evaluated by nonlinear data fitting with the Langmuir isotherm equation, using SigmaPlot software (SPSS Inc., Chicago, IL, USA).

2.3. Viscosity Measurements

The steady-shear viscosities of a series of PAM solutions with different PAM concentrations were measured to identify the critical entanglement concentration, which separates the dilute and semi-dilute polymeric solution regimes [23,24,25,26]. PAM solutions in the concentration range 0.02–1 g/L were prepared by dissolving different amounts of a PAM sample in distilled, deionized water. The solutions were gently stirred for several days for complete dissolution, and adjusted to pH 7 and 0.01 M NaCl, i.e., the same solution properties as those in the adsorption tests. The steady-shear viscosities of the PAM solutions were determined using a Rheometric Scientific ARES Rheometer with a Couttee cup (TA Instruments, New Castle, CO, USA); the unidirectional shear rates were increased from 0.1 to 500 s−1.

2.4. Flocculation Tests

Flocculation tests were performed to estimate the adsorption capacities and flocculation capabilities of PAM samples at different fluid turbulent shear rates [23]. For a set of flocculation tests, different amounts of a 1 g/L PAM stock solution, equivalent to final concentrations of 0–35 mg-PAM/L in the kaolinite suspensions, were first injected into 2 L jars containing 2 g/L of kaolinite suspension. All the PAM stock solutions and kaolinite suspensions were prepared at pH 7 and 0.01 M NaCl concentration. Then, using a PB-700TM Jar-tester (Phipps & Bird, Inc., Richmond, VA, USA), the PAM- and kaolinite-containing suspensions were stirred at 50, 100, 200, or 300 rpm (equivalent to shear rates of 42, 95, 220, or 360 s−1, which cover slow to rapid mixing intensities in natural and engineering environments) for 2 or 4 min to evaluate the effects of turbulent shear rate and contact time on adsorption and flocculation. After stirring for 2 or 4 min, the PAM-kaolinite suspensions were settled for 60 min and aliquots were taken at 1 cm below the water surface for further analyses. The aliquot turbidity was measured using a Hach 2100N Turbidimeter (Hach, Inc., Loveland, CO, USA) and used as an experimental index of the flocculation capability. For the PAM concentration measurements, the same analytical method as in the adsorption tests was used (TOC-VCSH analyzer; Shimadzu Corporation, Kyoto, Japan). The adsorption capacity was calculated by subtracting the solution-phase PAM concentration from the total dosed PAM concentration, and the adsorption capacity was expressed as the solid-phase PAM concentration (mg-PAM/g-kaolinite).

3. Results and Discussion

3.1. PAM Adsorption on Kaolinite

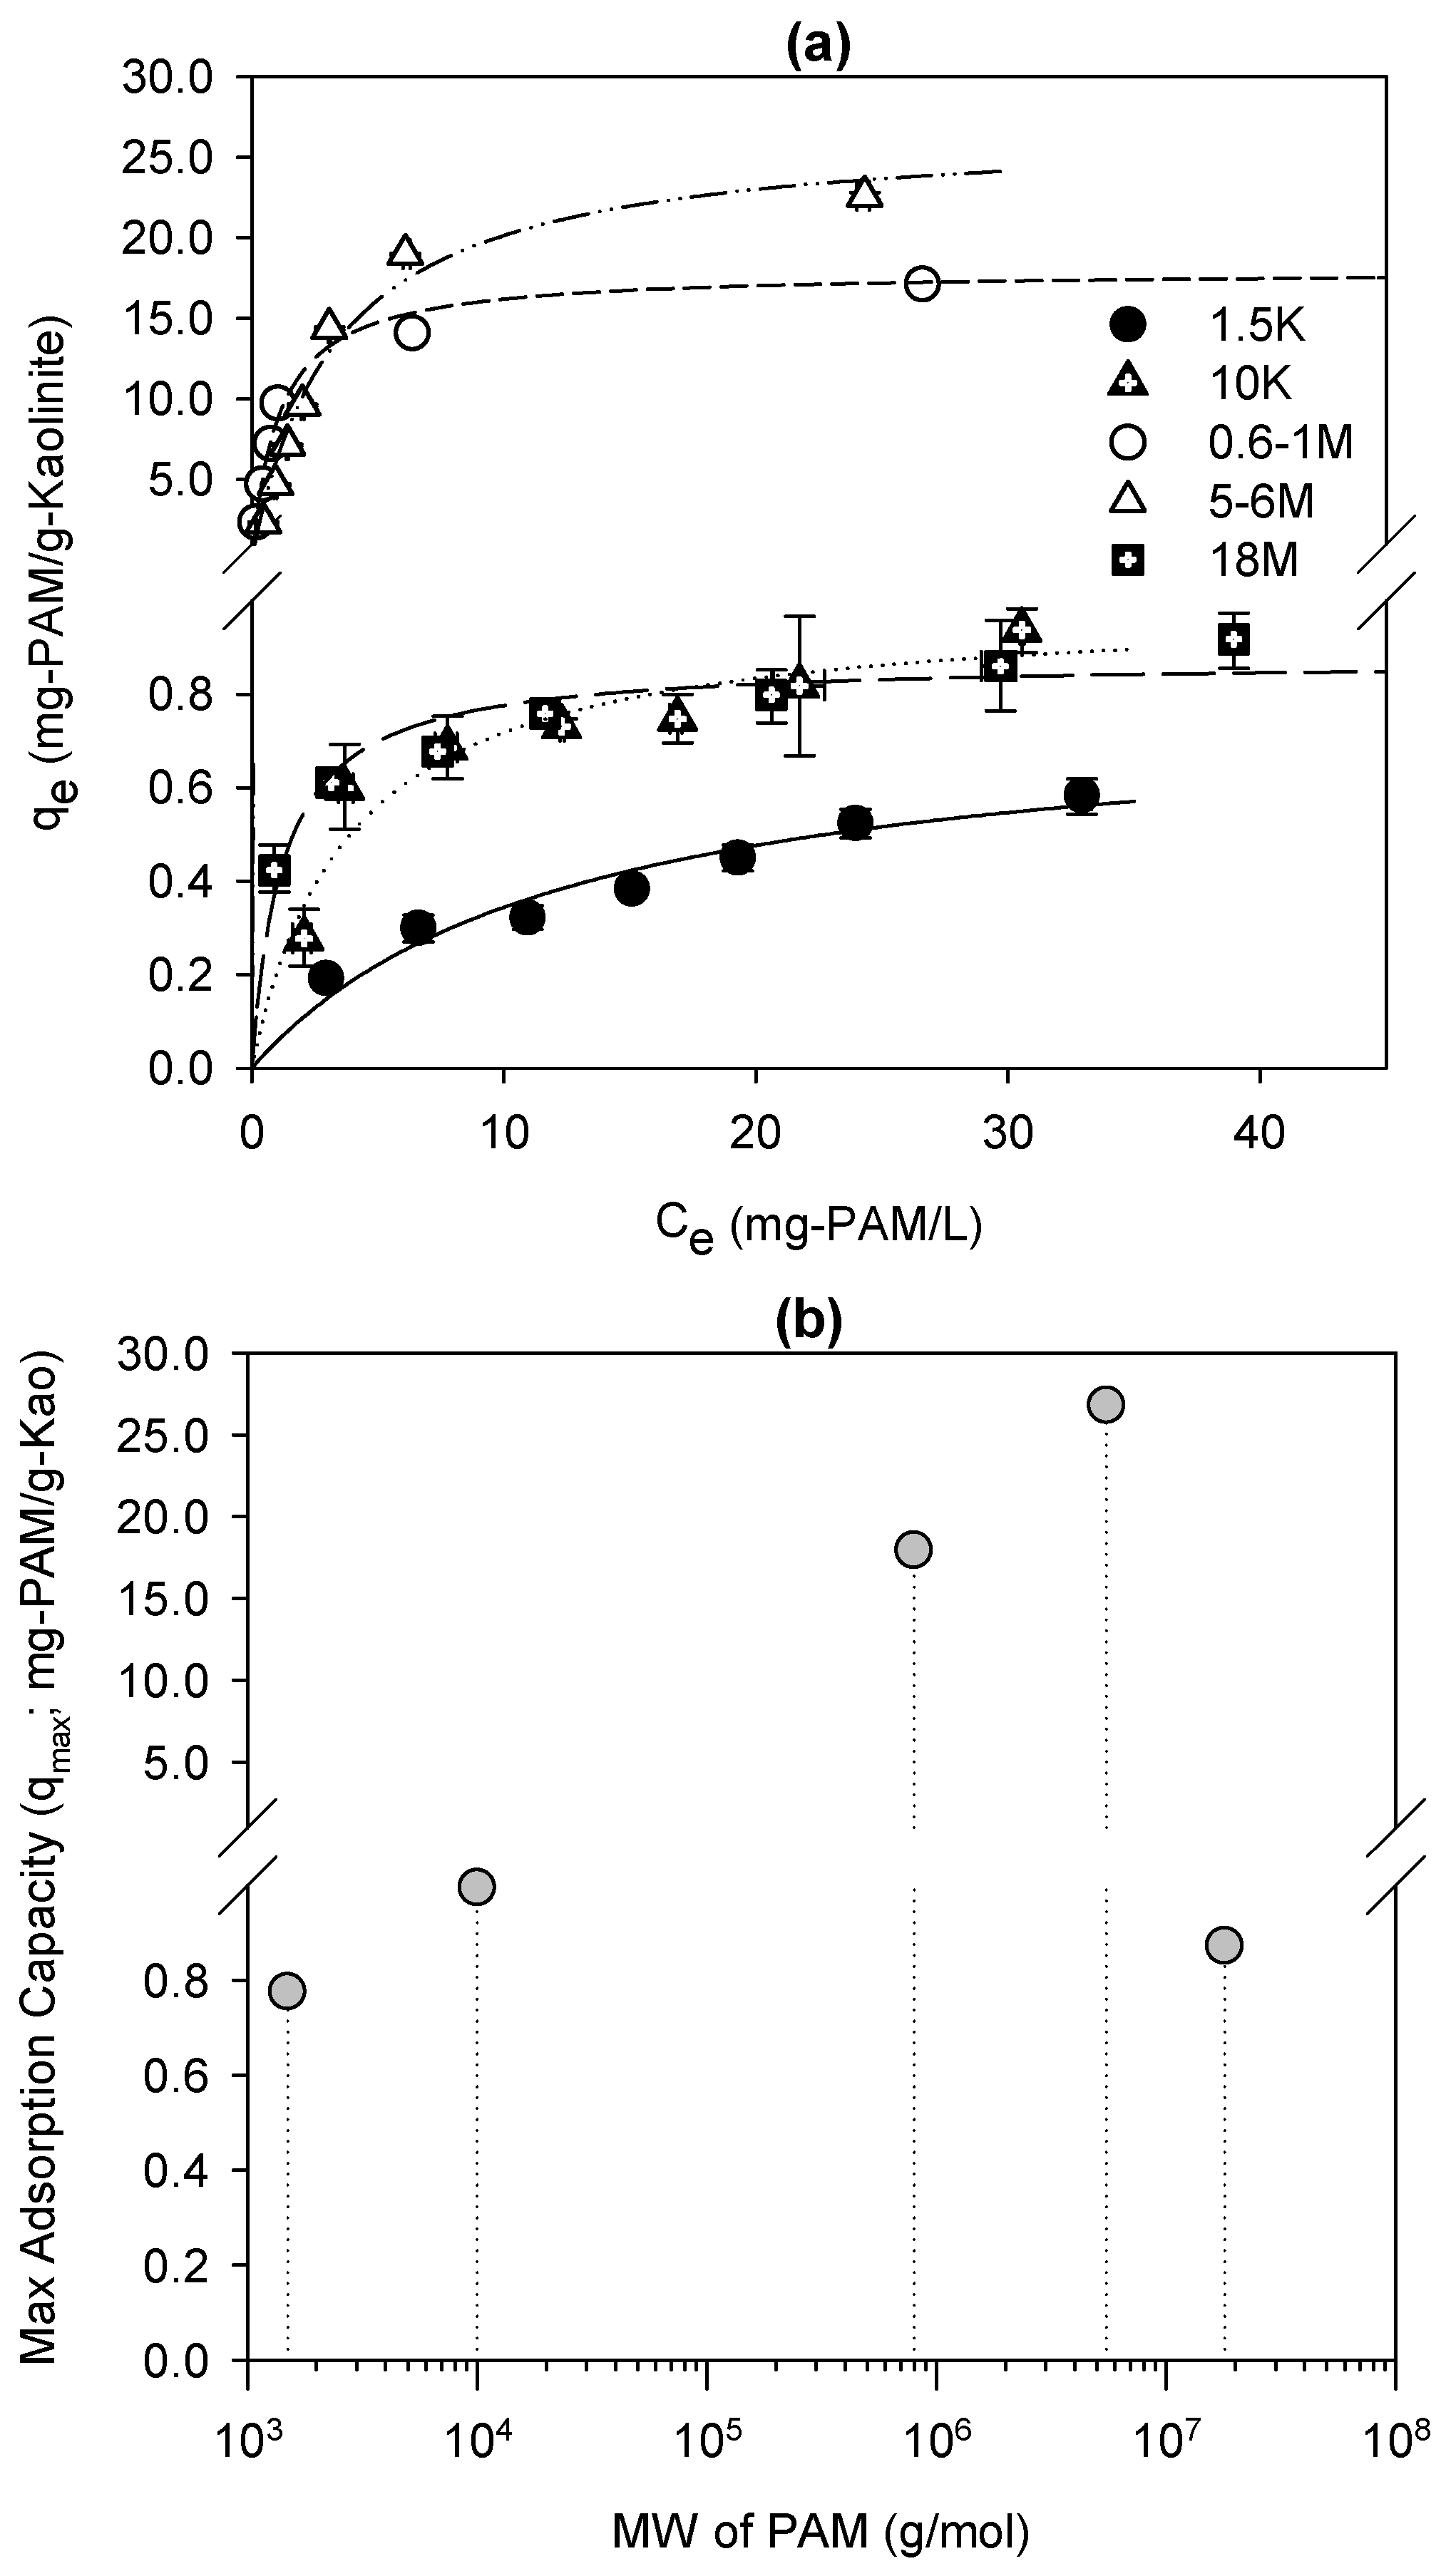
Figure 1a shows that the adsorption isotherms of the 10 K, 0.6–1 M, 5–6 M, and 18 M PAMs increased steeply and then reached a (pseudo) plateau, resembling the high-affinity adsorption isotherms of polymeric substances on solid surfaces [20,27,28]. However, the rounded part of the adsorption isotherm between the initial steep rise and the plateau differs from high-affinity adsorption behavior. The polydispersity of a tested PAM, i.e., the distribution of the PAM MW, has been reported to develop the rounded part of a high-affinity adsorption isotherm [20]. Small polymeric molecules occupy more adsorption sites than larger polymeric molecules at a low polymer concentration, because of their higher mobility toward the solid surface. With increasing polymer concentration, large polymeric molecules start replacing small polymeric molecules, because of the thermodynamic advantages of their adsorption on the solid surface. This replacement process develops the rounded part of the high-affinity adsorption isotherm. All the high-affinity adsorption isotherms with rounded parts fitted the Langmuir isotherm well (Table 1 and Figure 1a). However, the adsorption isotherm of the smallest PAM, i.e., 1.5 K PAM, was different from a high-affinity adsorption isotherm, increasing continuously without an apparent plateau. The adsorption isotherm of 1.5 K PAM might follow those of relatively small compounds rather than of large polymers.
Table 1. Results of nonlinear data fitting to Langmuir isotherms (qe = qmax × Ce/(Ks + Ce)) for 1.5 K, 10 K, 0.6–1 M, 5–6 M, and 18 M polyacrylamides (PAMs).
MW (g/mol)q,max (mgPAM/gKaolinite)Ks (mgPAM/L)R2
1.5 K 0.775312.5420.9280
10 K0.99513.87490.9078
0.6~1 M 17.9411.08110.9851
5~6 M26.7963.30320.9730
18 M0.87181.23650.9128
Notes: K represents 103; M represents 106.
The maximum adsorption capacities of the tested PAMs on kaolinite increased with increasing PAM MW, except for the largest, i.e., 18 M PAM (Table 1 and Figure 1b). The maximum adsorption capacities of the 0.6–1 M and 5–6 M PAMs were 20–30 times higher than those of the other tested PAMs. This supports the suggestion that a high-MW polymer has a higher adsorption capacity on the solid surface than a small-MW polymer does [9,19,20,29]. However, the maximum adsorption capacity of the highest-MW PAM, i.e., 18 M PAM, decreased to those of the smallest-MW PAMs, i.e., 1.5 K and 10 K PAMs. The 1 g/L stock solution of 18 M PAM was a gel with a very high viscosity, therefore it was hypothesized that the PAM concentration of the stock solution exceeded the critical entanglement concentration, above which the polymeric chains in the solution phase are entangled each other (semi-dilute) and not dissolved independently (dilute) [26]. Entanglements among PAM chains might prevent PAM molecules from adsorbing on kaolinites.
Figure 1. Experimental results of adsorption tests: (a) adsorption isotherm curves of 1.5 K, 10 K, 0.6–1 M, 5–6 M, and 18 M polyacrylamides (PAMs), representing the PAM adsorption capacity (i.e., the solid-phase equilibrium PAM concentration; qe) versus the solution-phase equilibrium PAM concentration (Ce) and (b) maximum adsorption capacity versus PAM molecular weight.
Water 07 05896 g001

3.2. Entanglements in High-MW Polymeric Solutions

Steady-shear viscosity tests could provide scientific proof of polymeric chain entanglements in the 18 M PAM solution. Generally, the steady-shear viscosity curve of a high-MW polymeric solution increases, and then reaches a plateau as it approaches the zero shear rate (shear rate → 0). 
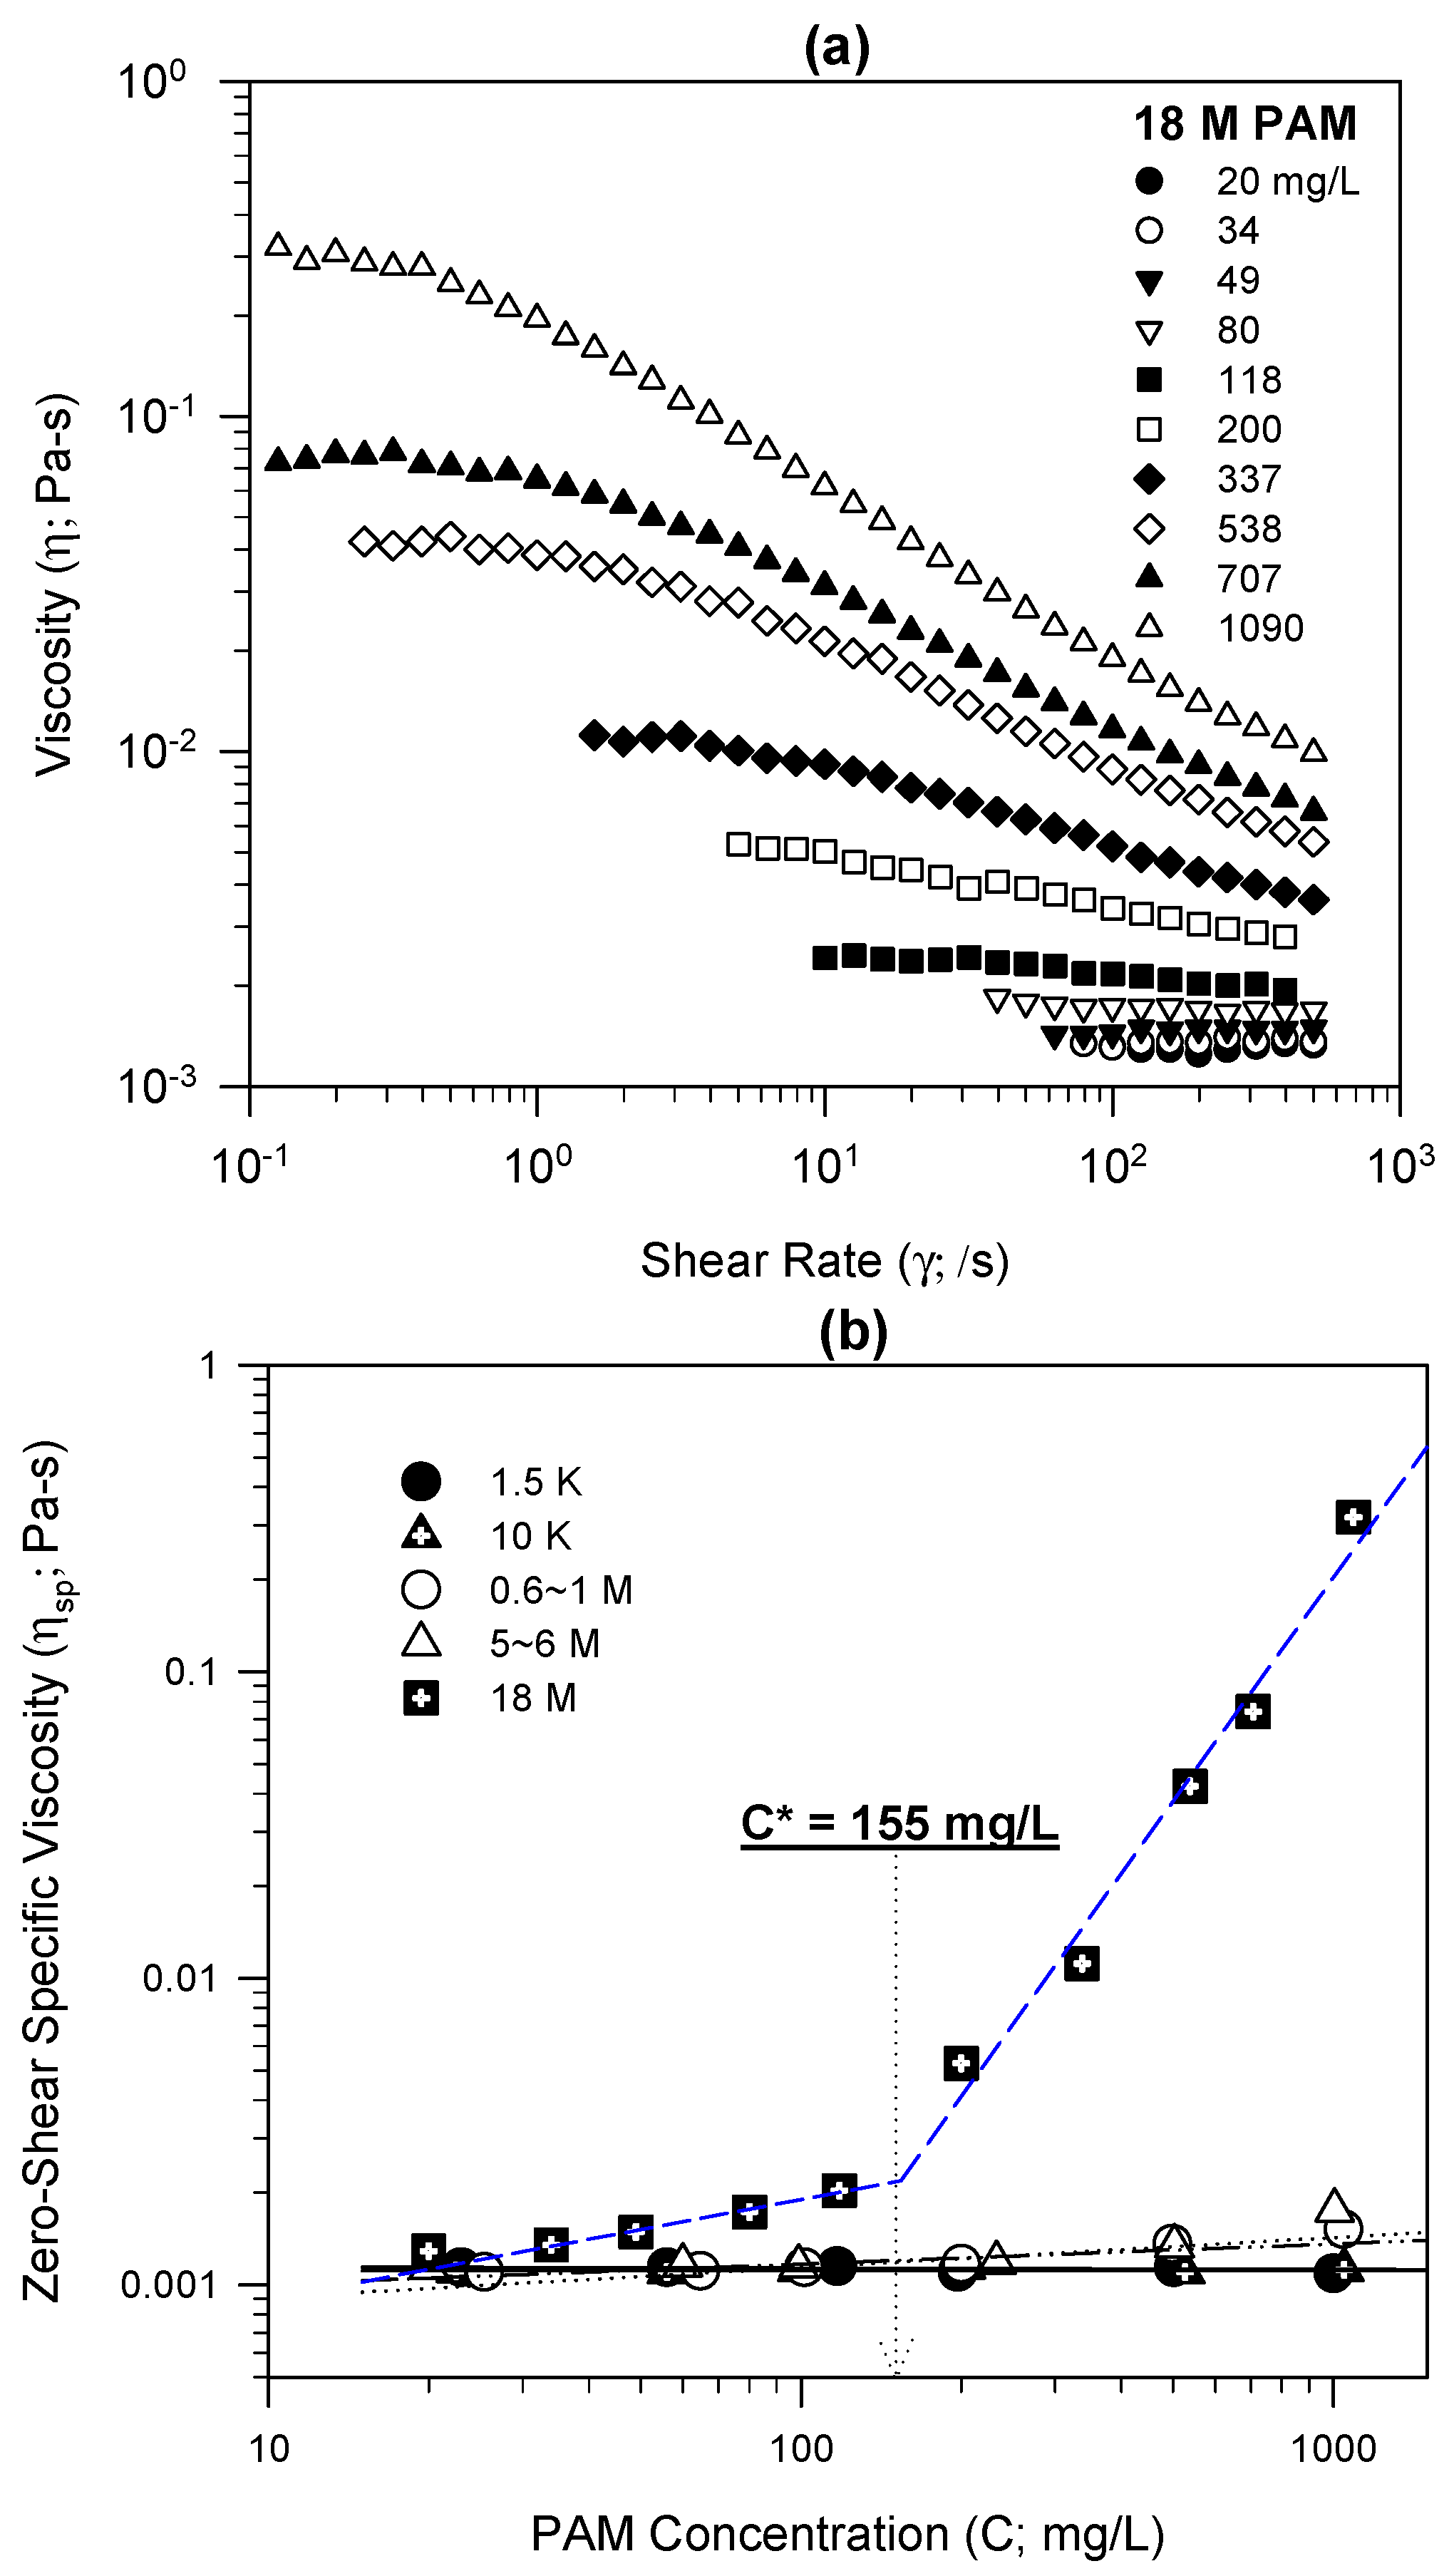
Figure 2a shows typical steady-shear viscosity curves, which were measured using a series of 18 M PAM solutions prepared at different PAM concentrations. The zero-shear specific viscosities, obtained from the plateau (shear rate → 0) of the steady-shear viscosity curves, were then plotted against the solution-phase PAM concentration to identify the critical entanglement concentration separating dilute and semi-dilute regions (Figure 2b).
The highest-MW PAM, i.e., 18 M PAM, showed a typical zero-shear specific viscosity curve of a high-MW polymer, i.e., the zero-shear specific viscosity curve increased with increasing PAM concentration and had an inflexion point at about 155 mg-PAM/L, separating two linear regions. This inflexion point is commonly called the critical entanglement concentration, and is the border between the two regimes of the polymeric solution, i.e., the dilute and semi-dilute regimes [24,25,26]. The 18 M PAM solution, with a concentration above 155 mg-PAM/L, was therefore in the semi-dilute region, and polymeric chain entanglements developed. However, the zero-shear specific viscosities of the 1.5 K, 10 K, 0.6–1 M, and 5–6 M PAMs were constant, near the level of pure water (≈0.001 Pa-s at 20 °C), irrespective of shear rates and PAM concentrations (see Figure 2b). These PAM solutions remained in the dilute region, without polymeric chain entanglements.
Figure 2. Experimental results of steady-shear viscosity measurements: (a) steady-shear viscosity versus shear rate at different polyacrylamide (PAM) concentrations for 18 M PAM and (b) zero-shear specific viscosity versus PAM concentration for 1.5 K, 10 K, 0.6–1 M, 5–6 M, and 18 M PAMs.
Water 07 05896 g002
The concentration of the stock solution of 18 M PAM was 1 g/L, above the critical entanglement concentration (155 mg/L) in the adsorption tests, so the small adsorption capacity of 18 M PAM might be caused by polymeric chain entanglements. Even after mixing the PAM stock solution and kaolinite suspensions in the adsorption tests, PAM molecules might remain entangled as a gel during these tests, without enough energy or time for disentangling the polymeric chains. This further indicates that the preparation and handling of excessively high-MW PAMs need to be performed with caution, so they may not be suitable for in situ applications [18].

3.3. PAM-Mediated Particle Flocculation

The flocs in kaolinite suspensions with 0.6–1 M or 5–6 M PAMs were large enough to be visible in the bottle-point adsorption tests, but flocs with 1.5 K, 10 K, or 18 M PAMs were not. The 1.5 K and 10 K PAMs might be confined within the electrostatic repulsion layer, because of their short polymeric chain structures, and therefore unable to develop polymeric bridges between particles and decrease the flocculation capability. However, 18 M PAM might reduce the flocculation capability, probably because of polymeric chain entanglements and the low adsorption capacity (see also Section 3.1 and Section 3.2). Only the 0.6–1 M and 5–6 M PAMs were therefore used in the flocculation tests.
The PAM MWs and flow turbulent shear rates were selected as the experimental parameters in the flocculation tests, and their effects on the adsorption capacities and flocculation capabilities, particularly nonequilibrium flocculation [14,16,
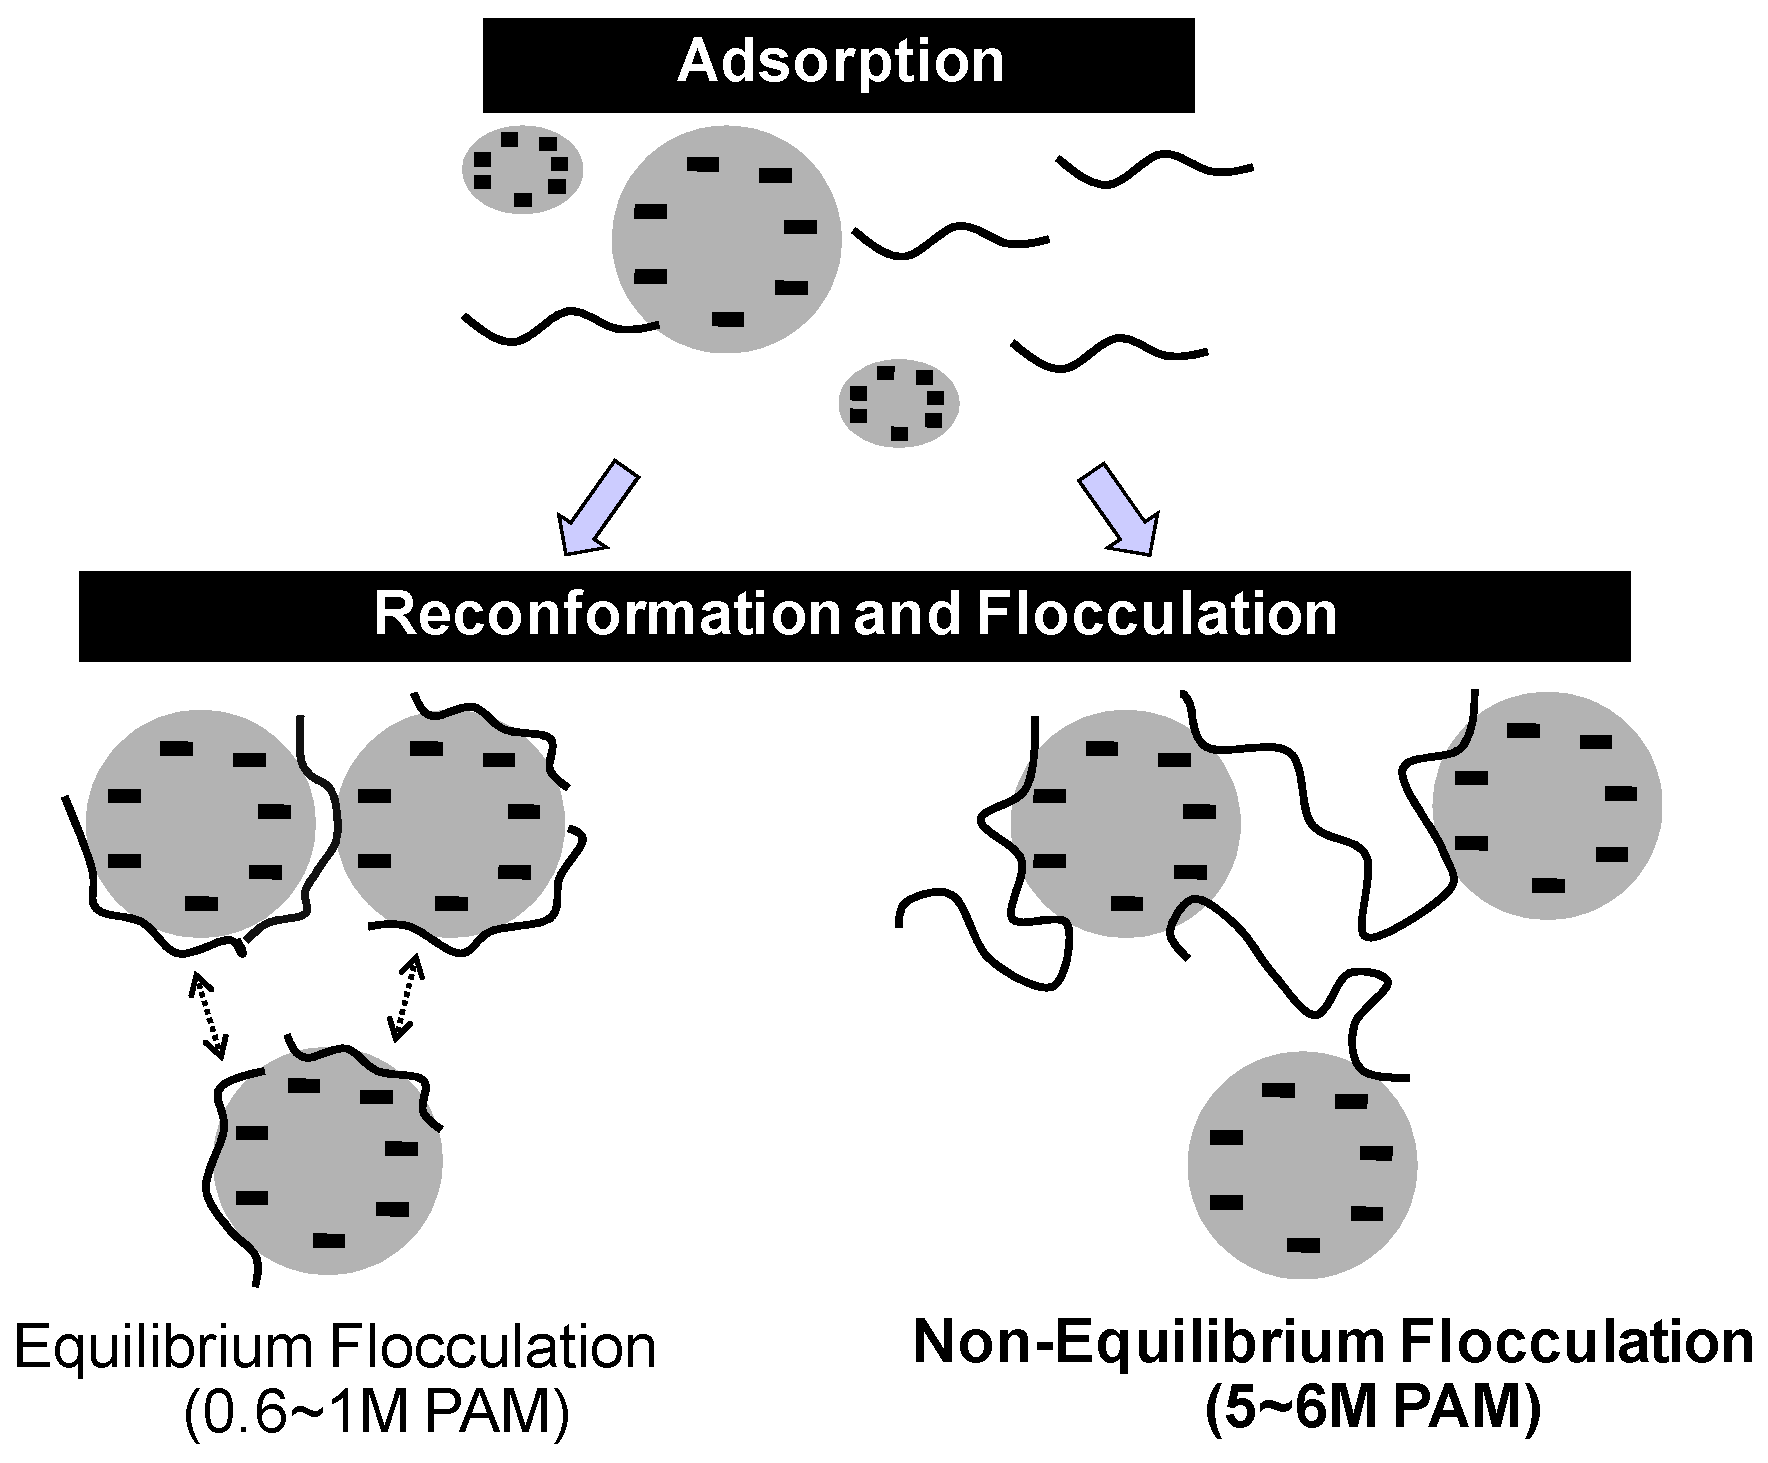
21], were investigated. Equilibrium flocculation occurs after stepwise completion of adsorption and reconfiguration of the adsorbed polymeric chains, but nonequilibrium flocculation occurs before completion of adsorption and reconfiguration (Figure 3) [8,15]. Nonequilibrium flocculation therefore enhances the flocculation capability, because of stretching and waving of the polymeric chains before they settle on the solid surfaces. A high-MW PAM increases the time for polymer reconfiguration, but a higher fluid shear rate decreases the time for particle collision and attachment, because of the thermodynamics of the polymeric chain structure. A high-MW PAM is therefore more prone to nonequilibrium flocculation, and this increases the flocculation capability compared with that of a low-MW PAM. The PAM MWs and fluid shear rates were therefore investigated as the experimental parameters in the flocculation tests.
Figure 3. Schematic diagram of equilibrium and nonequilibrium flocculation mechanisms in kaolinite suspensions dosed with polyacrylamides.
Water 07 05896 g003
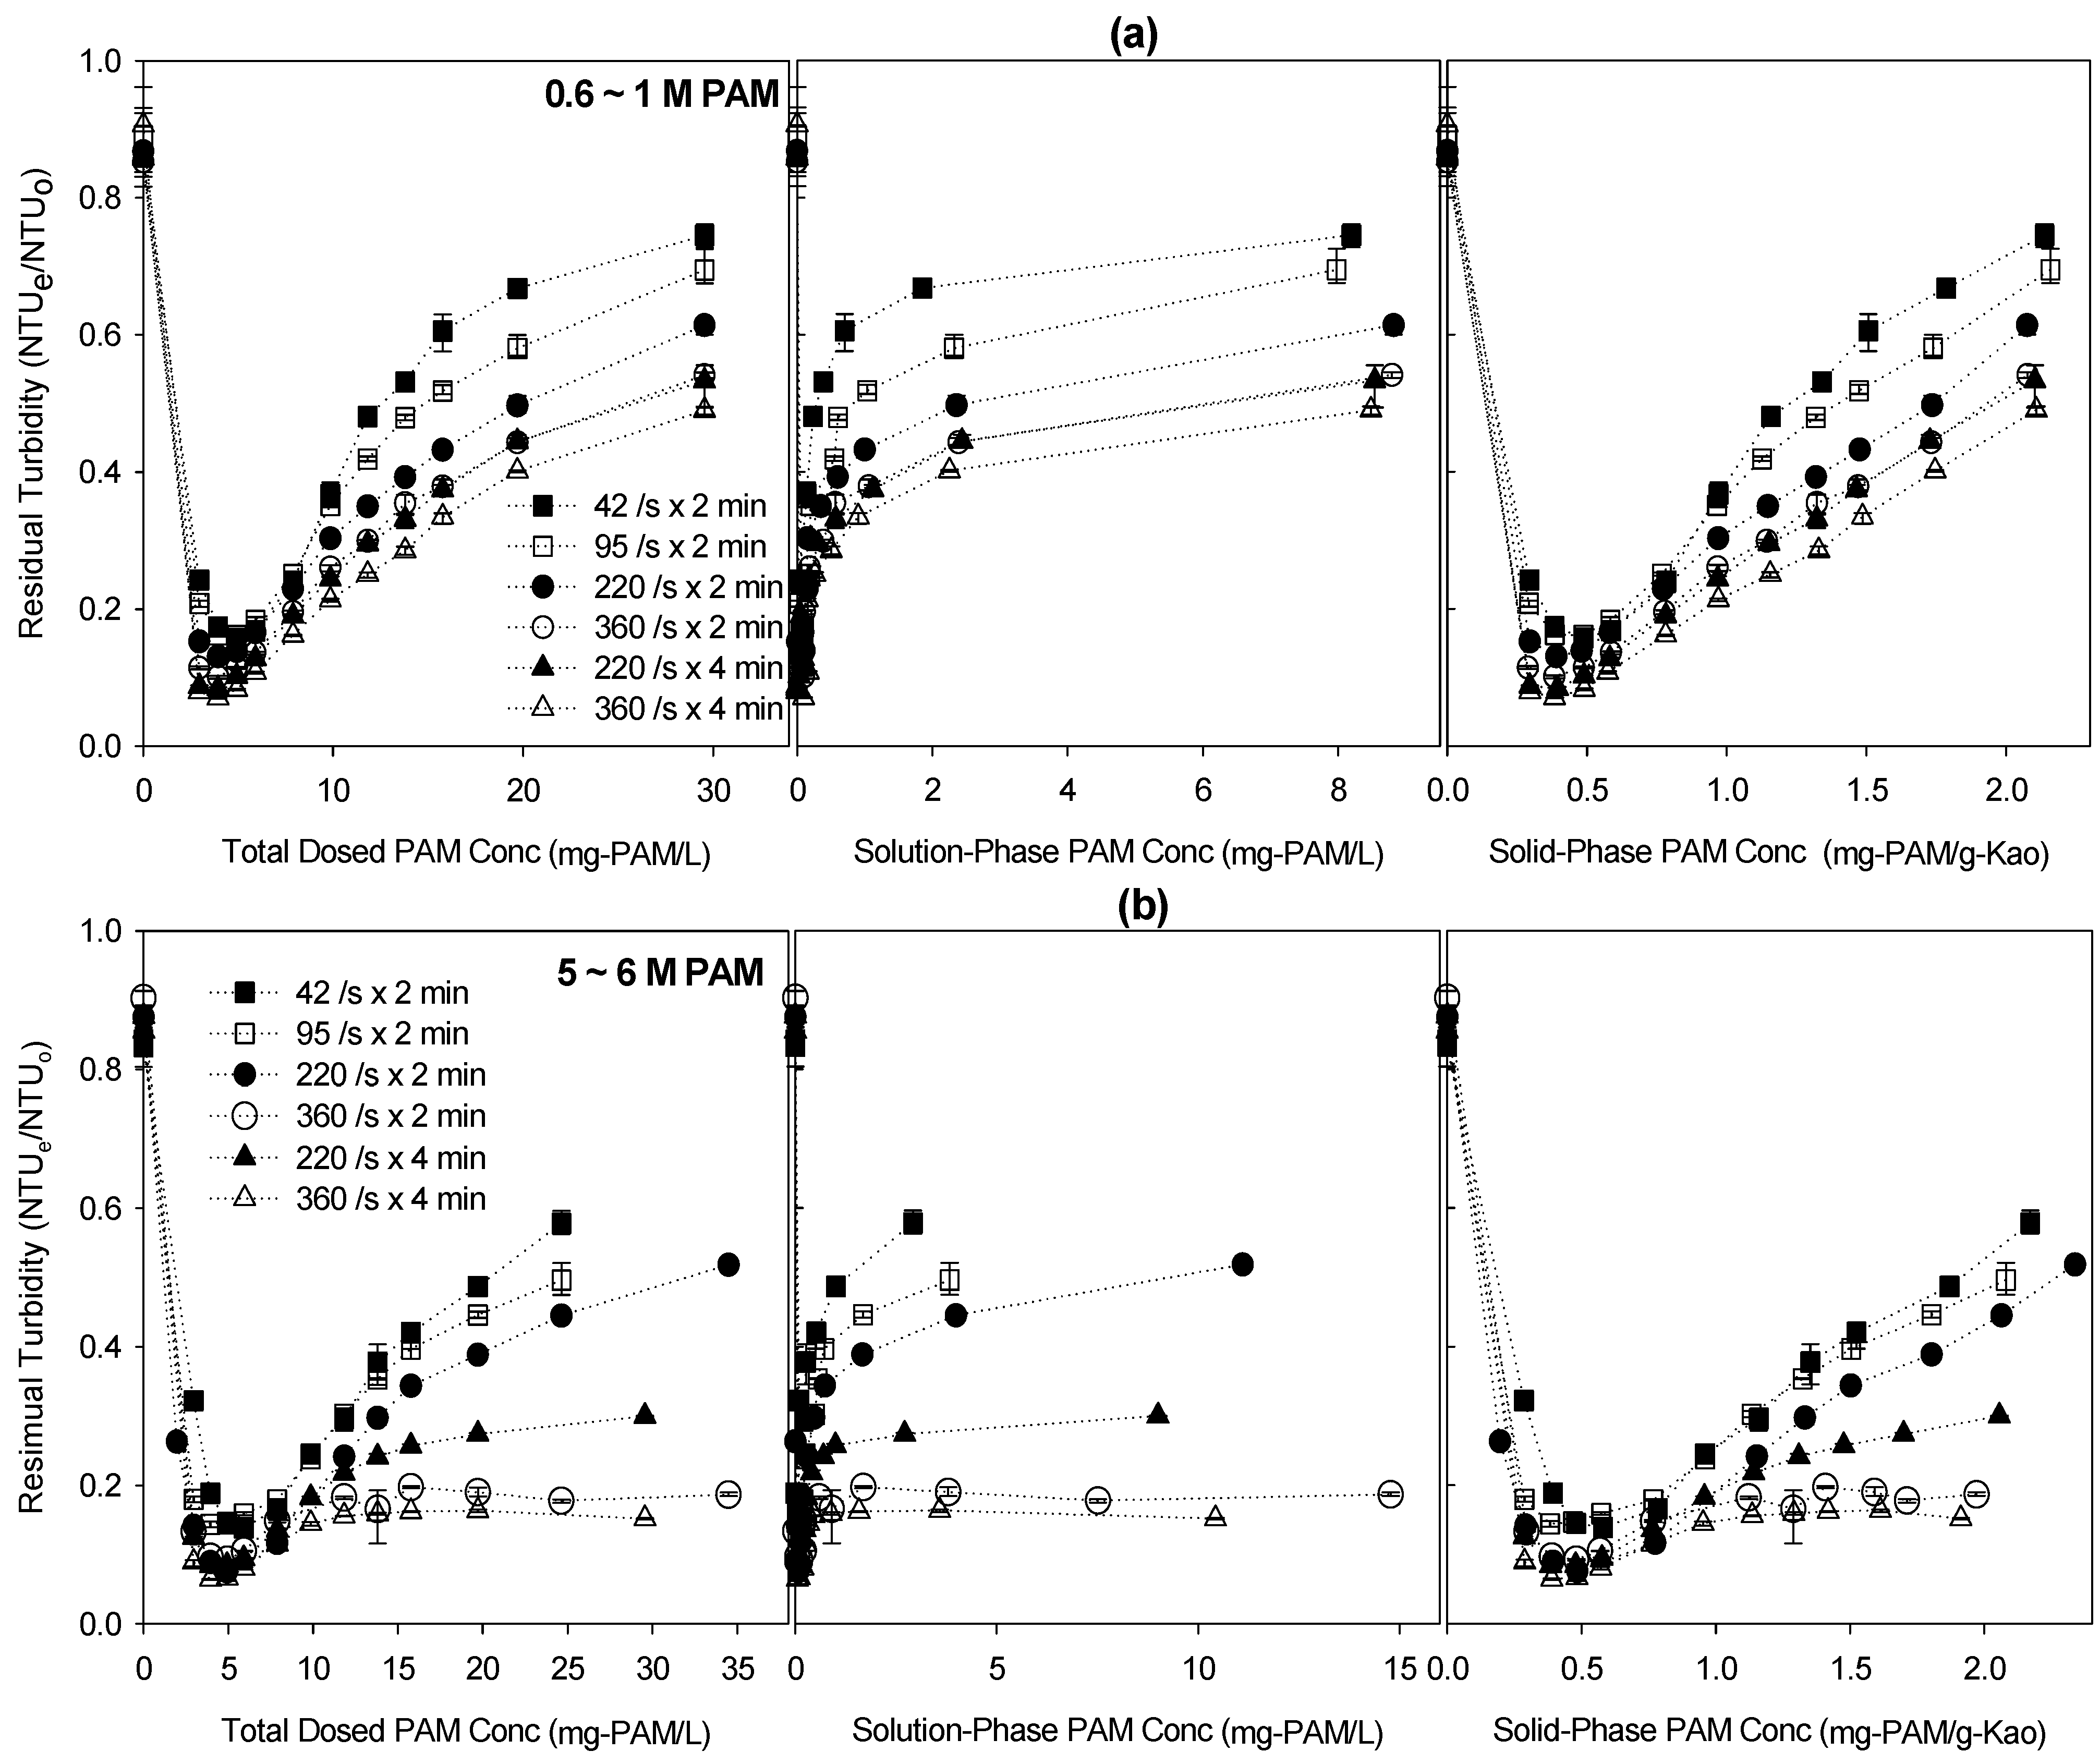
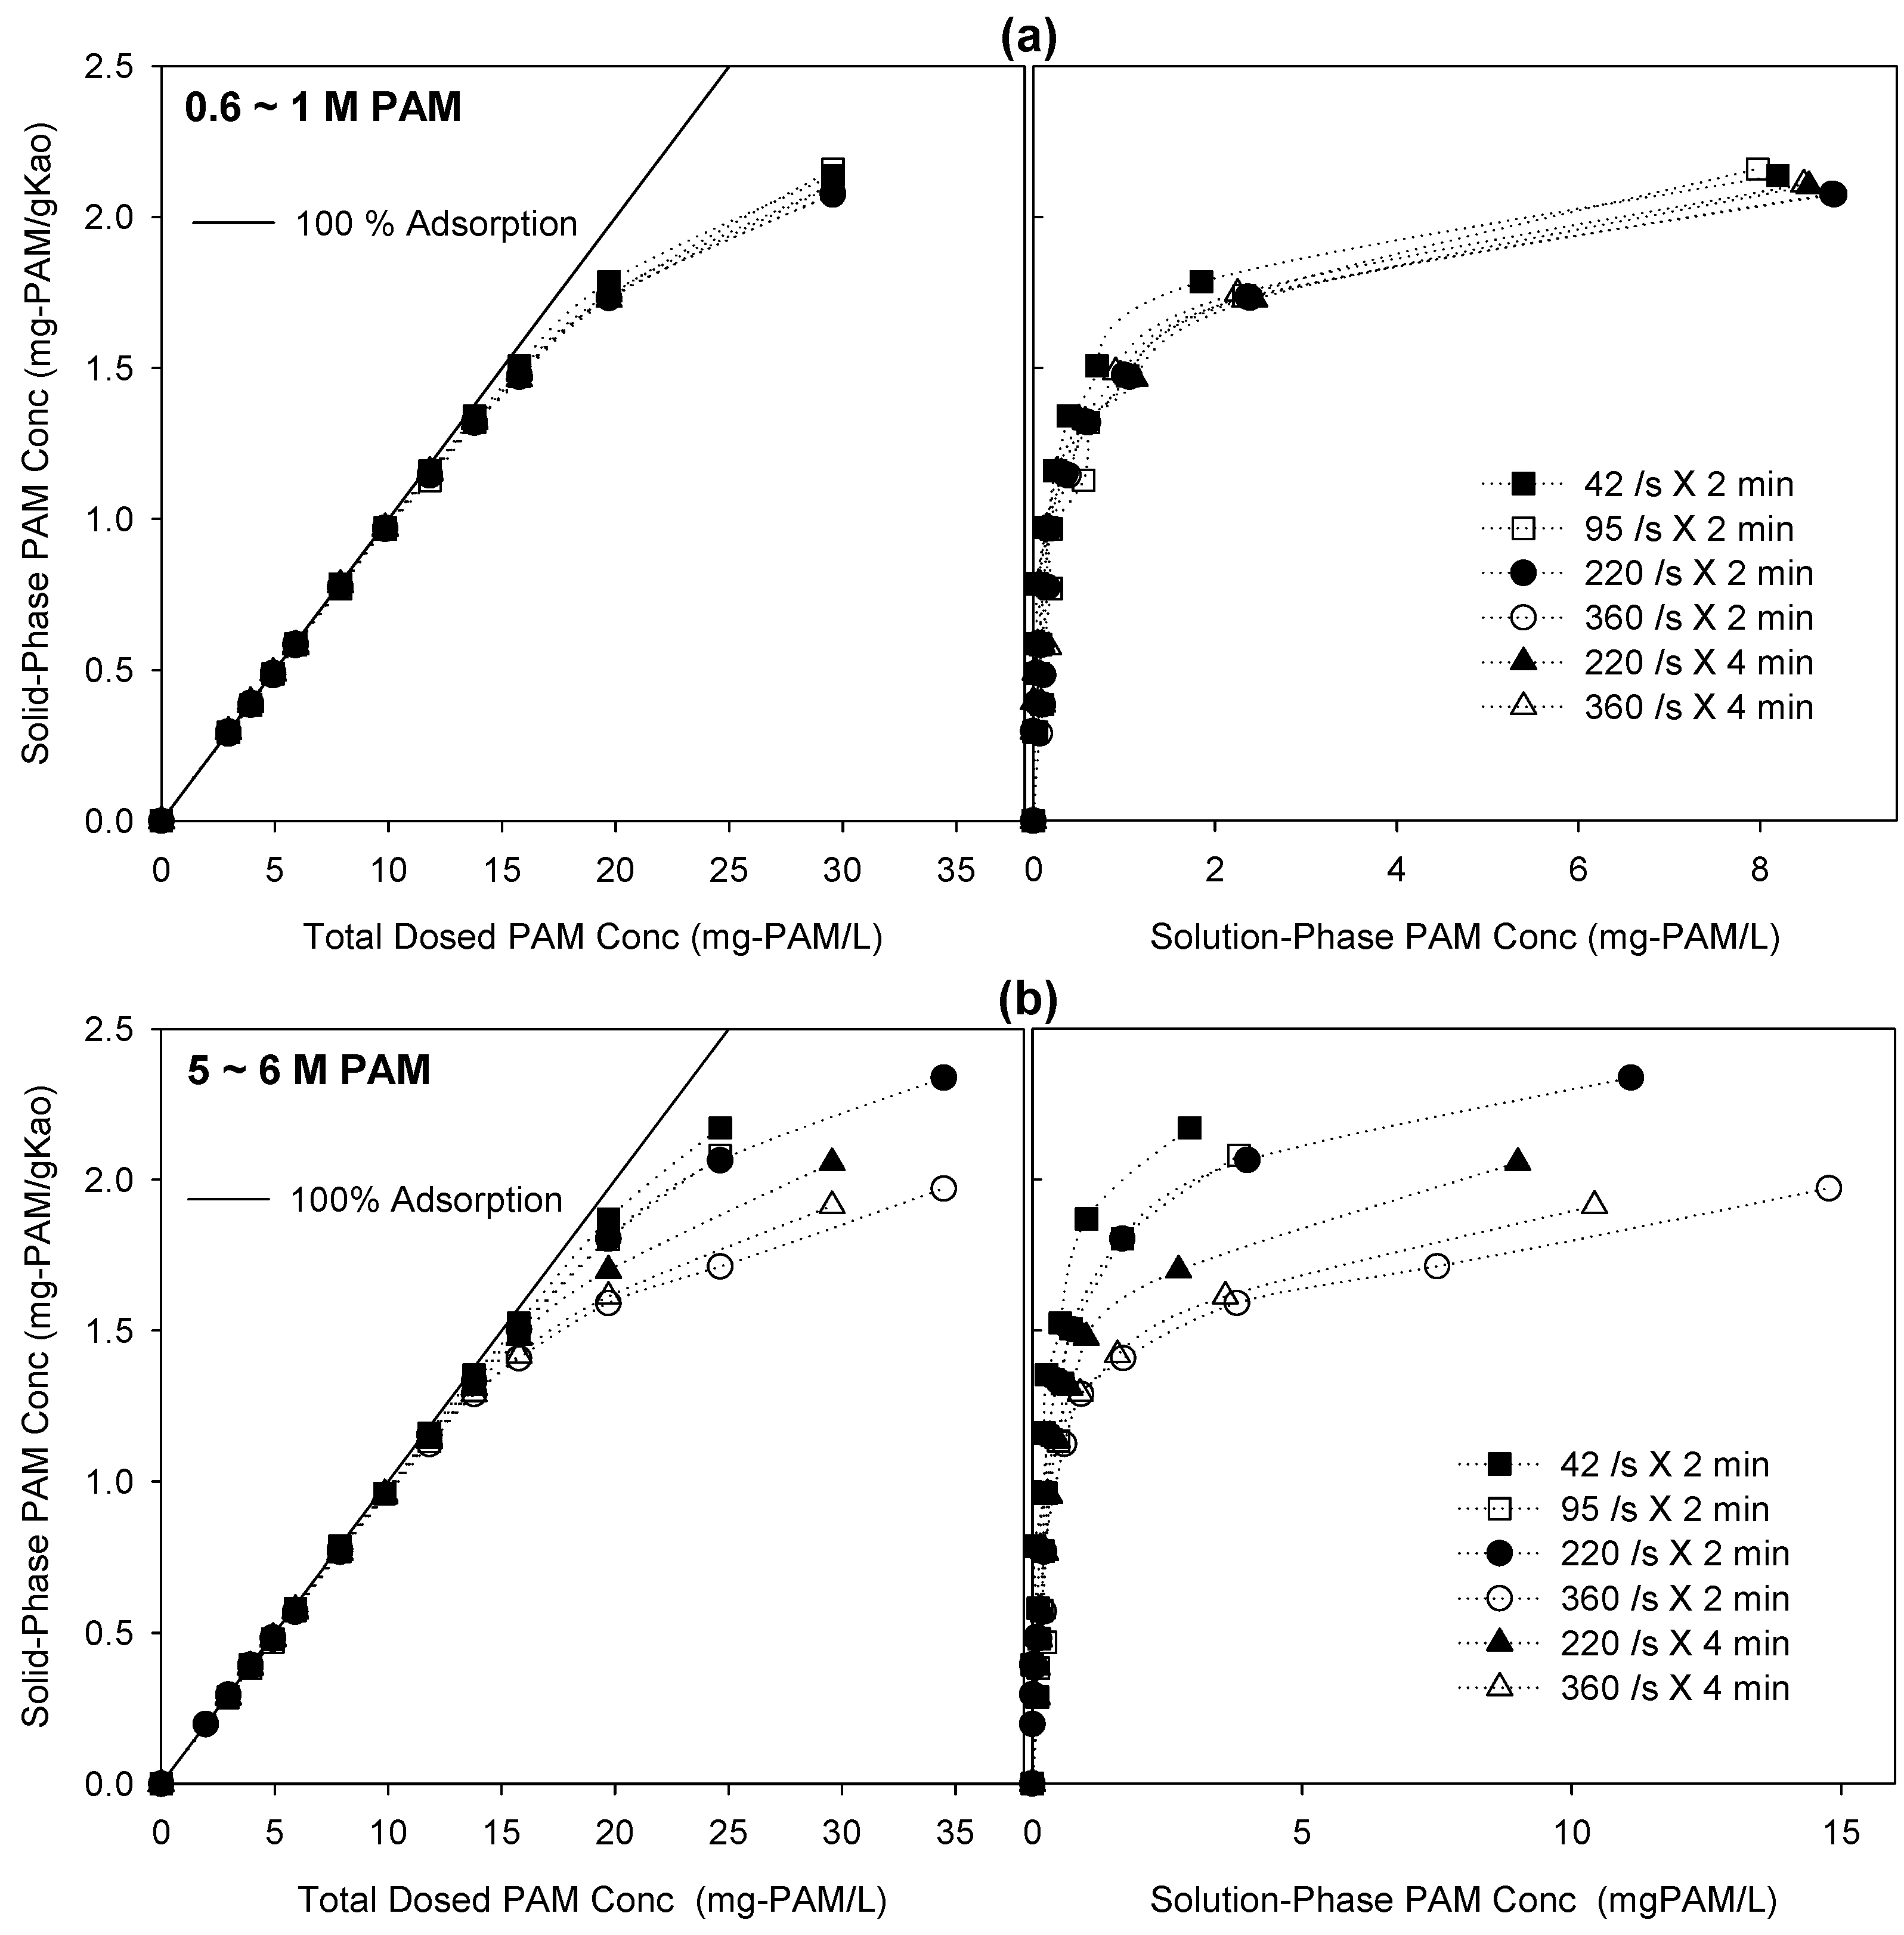
The adsorption capacities obtained from the flocculation tests are plotted in Figure 4 for different PAM MWs (0.6–1 M and 5–6 M PAMs), shear rates (42–360 s−1), and contact times (2–4 min). The relationship between adsorption capacity (i.e., the solid-phase PAM concentration) and the solution-phase PAM concentration (the right-hand panels of Figure 4) was typical high-affinity adsorption behavior, similar to the adsorption isotherms obtained in the bottle-point adsorption tests (see also Section 3.2). However, because of the short reaction time (2 or 4 min), the adsorption capacities were about an order of magnitude less in the flocculation tests than in the bottle-point adsorption tests. The major finding is that the adsorption capacities of the higher-MW 5–6 M PAM were scattered for different shear rates and contact times, in particular, deviating from the 100% adsorption line and the y-axis, but those of the lower-MW 0.6–1 M PAM remained constant (Figure 4). The adsorption capacity of the higher-MW 5–6 M PAM decreased with increasing shear rate and contact time.
Figure 4. Experimental results of flocculation tests performed using 0.6–1 M and 5–6 M polyacrylamides (PAMs) at different shear rates and contact times. (a,b) represent PAM adsorption capacity versus PAM concentration for 0.6–1 M and 5–6 M, respectively. The x-axis represents the total dosed PAM concentrations in the left-hand panels, and solution-phase PAM concentrations in the right-hand panels.
Water 07 05896 g004
The higher-MW 5–6 M PAM might need higher mechanical energy and a longer time for chain reconfiguration and settlement on kaolinite than the lower-MW 0.6–1 M PAM, because of the thermodynamic disadvantages of the polymeric chain structure for reconfiguration and settlement. At a higher shear rate, resulting in a shorter particle collision time (e.g., 360 s−1 in Figure 4b), the higher-MW 5–6 M PAM might quickly start flocculation, before completing polymeric chain reconfiguration and settlement. The aggregated and closed structure of the floc might then inhibit PAM molecules from approaching and adsorbing on kaolinite particles, thereby reducing the adsorption capacity (Figure 4b). The lower-MW 0.6–1 M PAM, however, might start flocculation after rapid completion of polymeric chain reconfiguration, producing similar adsorption isotherms irrespective of the shear rate and contact time. In fact, the higher-MW 5–6 M PAM was more susceptible to fluid shear rates and likely to develop different adsorption isotherms than the low-MW 0.6–1 M PAM was, because of the unstable polymeric structures on the solid surfaces.
The residual turbidity (final turbidity/initial turbidity) was used as an experimental index of the flocculation capability of PAM-dosed kaolinite suspensions and plotted against different x-axes for different shear rates and contact times (Figure 5). The residual turbidity generally decreased to a minimum at a total dosed PAM concentration of about 5 mg-PAM/L and continuously increased (the left-hand panels in Figure 5). When plotted against the solution-phase PAM concentration, the residual turbidity curves sharply decreased to a minimum near the zero solution-phase PAM concentration, but increased and approached the plateau with increasing solution-phase PAM concentration (the middle panels). The plot of the residual turbidity against the solid-phase PAM concentration (the right-hand panels) became more linear in the restabilization phase, after passing the minimum, than in the plot against the total dosed PAM concentration (the left panels). This might indicate that particle restabilization is linearly correlated with the amount of adsorbed PAM molecules.
The residual turbidity of the higher-MW 5–6 M PAM decreased more, i.e., the flocculation capability increased more, with increasing shear rate and contact time, than did those of the lower-MW 0.6–1 M PAM. The relative turbidity curves of the higher-MW 5–6 M PAM changed from a U-shape to an L-shape at a higher shear rate and contact time (Figure 5b), whereas the curves of the lower-MW 0.6–1 M PAM remained U-shaped (Figure 5a). Particle restabilization resulting in U-shaped residual turbidity curves is common in colloidal suspensions with polymeric substances, especially under polymer-over-dosed conditions, because the saturated polymeric layers on the particle surfaces inhibit formation of polymeric bridges and increase the repulsive forces among particles [14,21]. In contrast, the higher-MW 5–6 M PAM developed L-shaped residual turbidity curves, especially at high shear rates (e.g., 220 or 360 s−1), indicating a higher flocculation capability. As shown in Figure 3, the higher-MW 5–6 M PAM might be more susceptible to nonequilibrium flocculation, and thus enhance particle flocculation but reduce restabilization, especially under polymer-over-dosed conditions at high shear rates, because of stretching and waving of the polymeric chain structures on the solid surfaces. In contrast, the lower-MW 0.6–1 M PAM might be governed by equilibrium flocculation, and thus reduce particle flocculation but enhance restabilization at higher shear rates, quickly reconfiguring and settling on the solid surfaces.
Figure 5. Experimental results of flocculation tests performed using 0.6–1 M and 5–6 M polyacrylamides (PAMs) at different shear rates and contact times. (a,b) represent the residual turbidity (final turbidity/initial turbidity) versus PAM concentrations for 0.6–1 M and 5–6 M, respectively. The x-axis represents the total dosed PAM concentrations in the left-hand panels, the solution-phase PAM concentrations in the middle panels, and the solution-phase PAM concentrations in the right-hand panels.
Water 07 05896 g005

4. Conclusions

The results of this research elucidated the effects of PAM MWs on adsorption and flocculation in aqueous kaolinite suspensions dosed with nonionic PAMs. First, higher-MW PAMs were found to increase the adsorption capacity of PAMs on kaolinite, except the highest-MW 18 M PAM. The maximum adsorption capacities of 0.6–1 M and 5–6 M PAMs were estimated to be 17.9 and 26.8 mg-PAM/g-kaolinite, respectively, whereas those of the 1.5 K, 10 K, and 18 M PAMs were below 1 mg-PAM/g-kaolinite. The 1 g/L stock solution of the 18 M PAM used in the adsorption tests was found to be in the semi-dilute region, so it developed polymeric chain entanglement, decreasing the adsorption capacity. Secondly, the flocculation capability of the higher-MW 5–6 M PAM was higher than that of the 0.6–1 M PAM, because the higher-MW PAM was more prone to nonequilibrium flocculation. Under a fluid shear, for the higher-MW 5–6 M PAM, reduced particle restabilization was observed under PAM-over-dosed conditions. A high-MW PAM and a higher fluid shear rate ensure a higher adsorption capacity and flocculation capability in field applications, because of nonequilibrium flocculation. However, extremely high-MW PAMs, like the highest-MW PAM, i.e., 18 M PAM, in this research, may not be desirable in field applications, because they are subject to polymeric chain entanglements; this decreases the adsorption capacity and flocculation capability, and makes the preparation and handling of working solutions more difficult. In short, a high-MW PAM, which is, however, not such a high-MW to entangle, and high fluid shear are desirable to enhance flocculation in soil and aquatic environments.

Acknowledgments

This research was supported by Basic Science Research Program through the National Research Foundation of Korea (NRF) funded by the Ministry of Education (No. 2014R1A1A2055622) and the Changing Land Use and Environment (CLUE) Project at Clemson University funded by the Natural Resources Conservation Service (NRCS) of the US Department of Agriculture (USDA) (NRCS-69-4639-1-0010).

Author Contributions

Byung Joon Lee and Mark A. Schlautman conceived and designed the experiments; Byung Joon Lee performed the experiments, analyzed the results and wrote the paper.

Conflicts of Interest

The authors declare no conflict of interest.

References

  1. Stumm, W.; Morgan, J. Aquatic Chemistry: Chemical Equilibria and Rates in Natural Waters, 3rd ed.; John Wiley & Sons, Inc.: New York, NY, USA, 1996. [Google Scholar]
  2. Chapra, S. Surface Quality Modeling; McGraw-Hill: New York, NY, USA, 2002. [Google Scholar]
  3. Schwartzenbach, R.; Gschwend, P.; Imboden, D. Environmental Organic Chemistry, 2nd ed.; John Wiley & Sons: Hoboken, NJ, USA, 2003. [Google Scholar]
  4. McCollister, D.; Hake, C.; Sadek, S.; Rowe, V. Toxicologic investigations of polyacrylamides. Toxicol. Appl. Pharmacol. 1965, 7, 639–651. [Google Scholar] [CrossRef]
  5. Wallace, A.; Wallace, G. Effects of soil conditioners on emergence and growth of tomato, cotton, and lettuce seedlings. Soil Sci. 1986, 141, 313–316. [Google Scholar] [CrossRef]
  6. Myagachenkov, V.; Kurenkov, V. Applications of acrylamide polymers and copolymers: A review. Polym. Plast. Technol. Eng. 1991, 30, 109–135. [Google Scholar] [CrossRef]
  7. Stephens, S. Final report on the safety assessment of polyacrylamide. Int. J. Toxicol. 1991, 10, 193–202. [Google Scholar] [CrossRef]
  8. Gregory, J. Polymer adsorption and flocculation in sheared suspensions. Colloids Surf. 1988, 31, 231–253. [Google Scholar] [CrossRef]
  9. Heller, H.; Keren, R. Anionic polyacrylamide polymers effects on rheological behavior of sodium-montmorillonite suspension. Soil Sci. Soc. Am. J. 2002, 66, 19–25. [Google Scholar] [CrossRef]
  10. Morris, G.; Fornasiero, D.; Ralston, J. Polymer depressants at the talc-water interface: Adsorption isotherm, microflotation and electrokinetic studies. Int. J. Miner. Process. 2002, 67, 211–227. [Google Scholar] [CrossRef]
  11. Mpofu, P.; Addai-Mensah, J.; Ralston, J. Investigation of the effect of polymer structure type on flocculation, rheology and dewatering behaviour of kaolinite dispersions. Int. J. Min. Process. 2003, 71, 247–268. [Google Scholar] [CrossRef]
  12. Mpofu, P.; Addai-Mensah, J.; Ralston, J. Influence of hydrolyzable metal ions on the interfacial chemistry, particle interactions, and dewatering behavior of kaolinite dispersion. J. Colloid Interface Sci. 2003, 261, 349–359. [Google Scholar] [CrossRef]
  13. Tom, L.; de Keizer, A.; Koopal, L.; Lyklema, J. Mixed adsorption of poly(vinylpyrrolidone) and sodium dodecylbenzenesulfonate on kaolinte. J. Colloid Interface Sci. 2003, 260, 1–8. [Google Scholar] [CrossRef] [PubMed]
  14. Pelssers, E.; Cohen Stuart, M.; Fleer, G. Kinetics of bridging flocculation. J. Chem. Soc. Faraday Trans. 1990, 86, 1355–1361. [Google Scholar] [CrossRef]
  15. Adachi, Y. Dynamic aspects of coagulation and flocculation. Adv. Colloid Interface Sci. 1995, 56, 1–31. [Google Scholar] [CrossRef]
  16. Lu, C.; Pelton, R. PEO flocculation of polystyrene-core poly(vinylphenol)-shell latex: An example of ideal bridging. Langmuir 2001, 17, 7770–7776. [Google Scholar] [CrossRef]
  17. Elimelech, M.; Gregory, J.; Jia, X.; Williams, R. Particle Deposition and Aggregation: Measurement, Modeling, and Simulation; Butterworth-Heinemann: Oxford, UK, 1995. [Google Scholar]
  18. Levy, G.; Agasi, M. Polymer molecular weight and degree of drying effects on infiltration and erosion of three different soils. Aust. J. Soil Res. 1995, 33, 1007–1018. [Google Scholar] [CrossRef]
  19. Green, V.; Stott, D.; Norton, L.; Graveel, J. Polyacrylamide molecular weight and charge effects on infiltration under simulated rainfall. Soil Sci. Soc. Am. J. 2000, 64, 1786–1791. [Google Scholar] [CrossRef]
  20. Fleer, G.; Cohen Stuart, M.; Scheutjens, J.; Cosgrove, T.; Vincent, B. Polymers at Interfaces; Chapman & Hall: London, UK, 1993. [Google Scholar]
  21. Pelssers, E.; Cohen Stuart, M.; Fleer, G. Kinetic aspects of polymer bridging: Equilibrium flocculation and nonequilibrium flocculation. Colloids Surf. 1989, 38, 15–25. [Google Scholar] [CrossRef]
  22. Ren, J.; Packman, A. Stream-subsurface exchange of zinc in the presence of silica and kaolinite colloids. Environ. Sci. Technol. 2004, 38, 6571–6581. [Google Scholar] [CrossRef] [PubMed]
  23. Lee, B. Experimental and Modeling Studies for Optimizing Flocculant-Aided Sediment Retention Ponds. Ph.D. Thesis, Clemson University, Clemson, SC, USA, December 2008. [Google Scholar]
  24. Milas, M.; Rinaudo, M.; Knipper, M.; Schuppiser, J. Flow and viscoelastic properties of Xanthan Gum solution. Macromolecules 1990, 23, 2506–2511. [Google Scholar] [CrossRef]
  25. Tuinier, R.; Zoon, P.; Stuart, M.; de Kruif, C. Concentration and shear-rate dependence of the viscosity of an exocellular polysaccharide. Biopolymers 1999, 50, 641–646. [Google Scholar] [CrossRef]
  26. Sperling, L. Introduction to Physical Polymer Science, 4th ed.; John Wiley & Sons, Inc.: Hoboken, NJ, USA, 2006. [Google Scholar]
  27. Parfitt, G.; Rochester, C. Adsorption from Solution at the Solid/Liquid Interface; Adademic Press Inc.: New York, NY, USA, 1983. [Google Scholar]
  28. Feast, W.; Munro, H. Polymer Surfaces and Interface; John Wiley & Sons: Chichester, UK, 1987. [Google Scholar]
  29. Yuang, P.; Shen, Y. Determination of the surface area of smectite in water by ethylene oxide chain adsorption. J. Colloid Interface Sci. 2005, 285, 443–447. [Google Scholar] [CrossRef] [PubMed]

