
Runoff and Sediment Yield Variations in Response to Precipitation Changes: A Case Study of Xichuan Watershed in the Loess Plateau, China

Abstract
:1. Introduction
2. Methodology

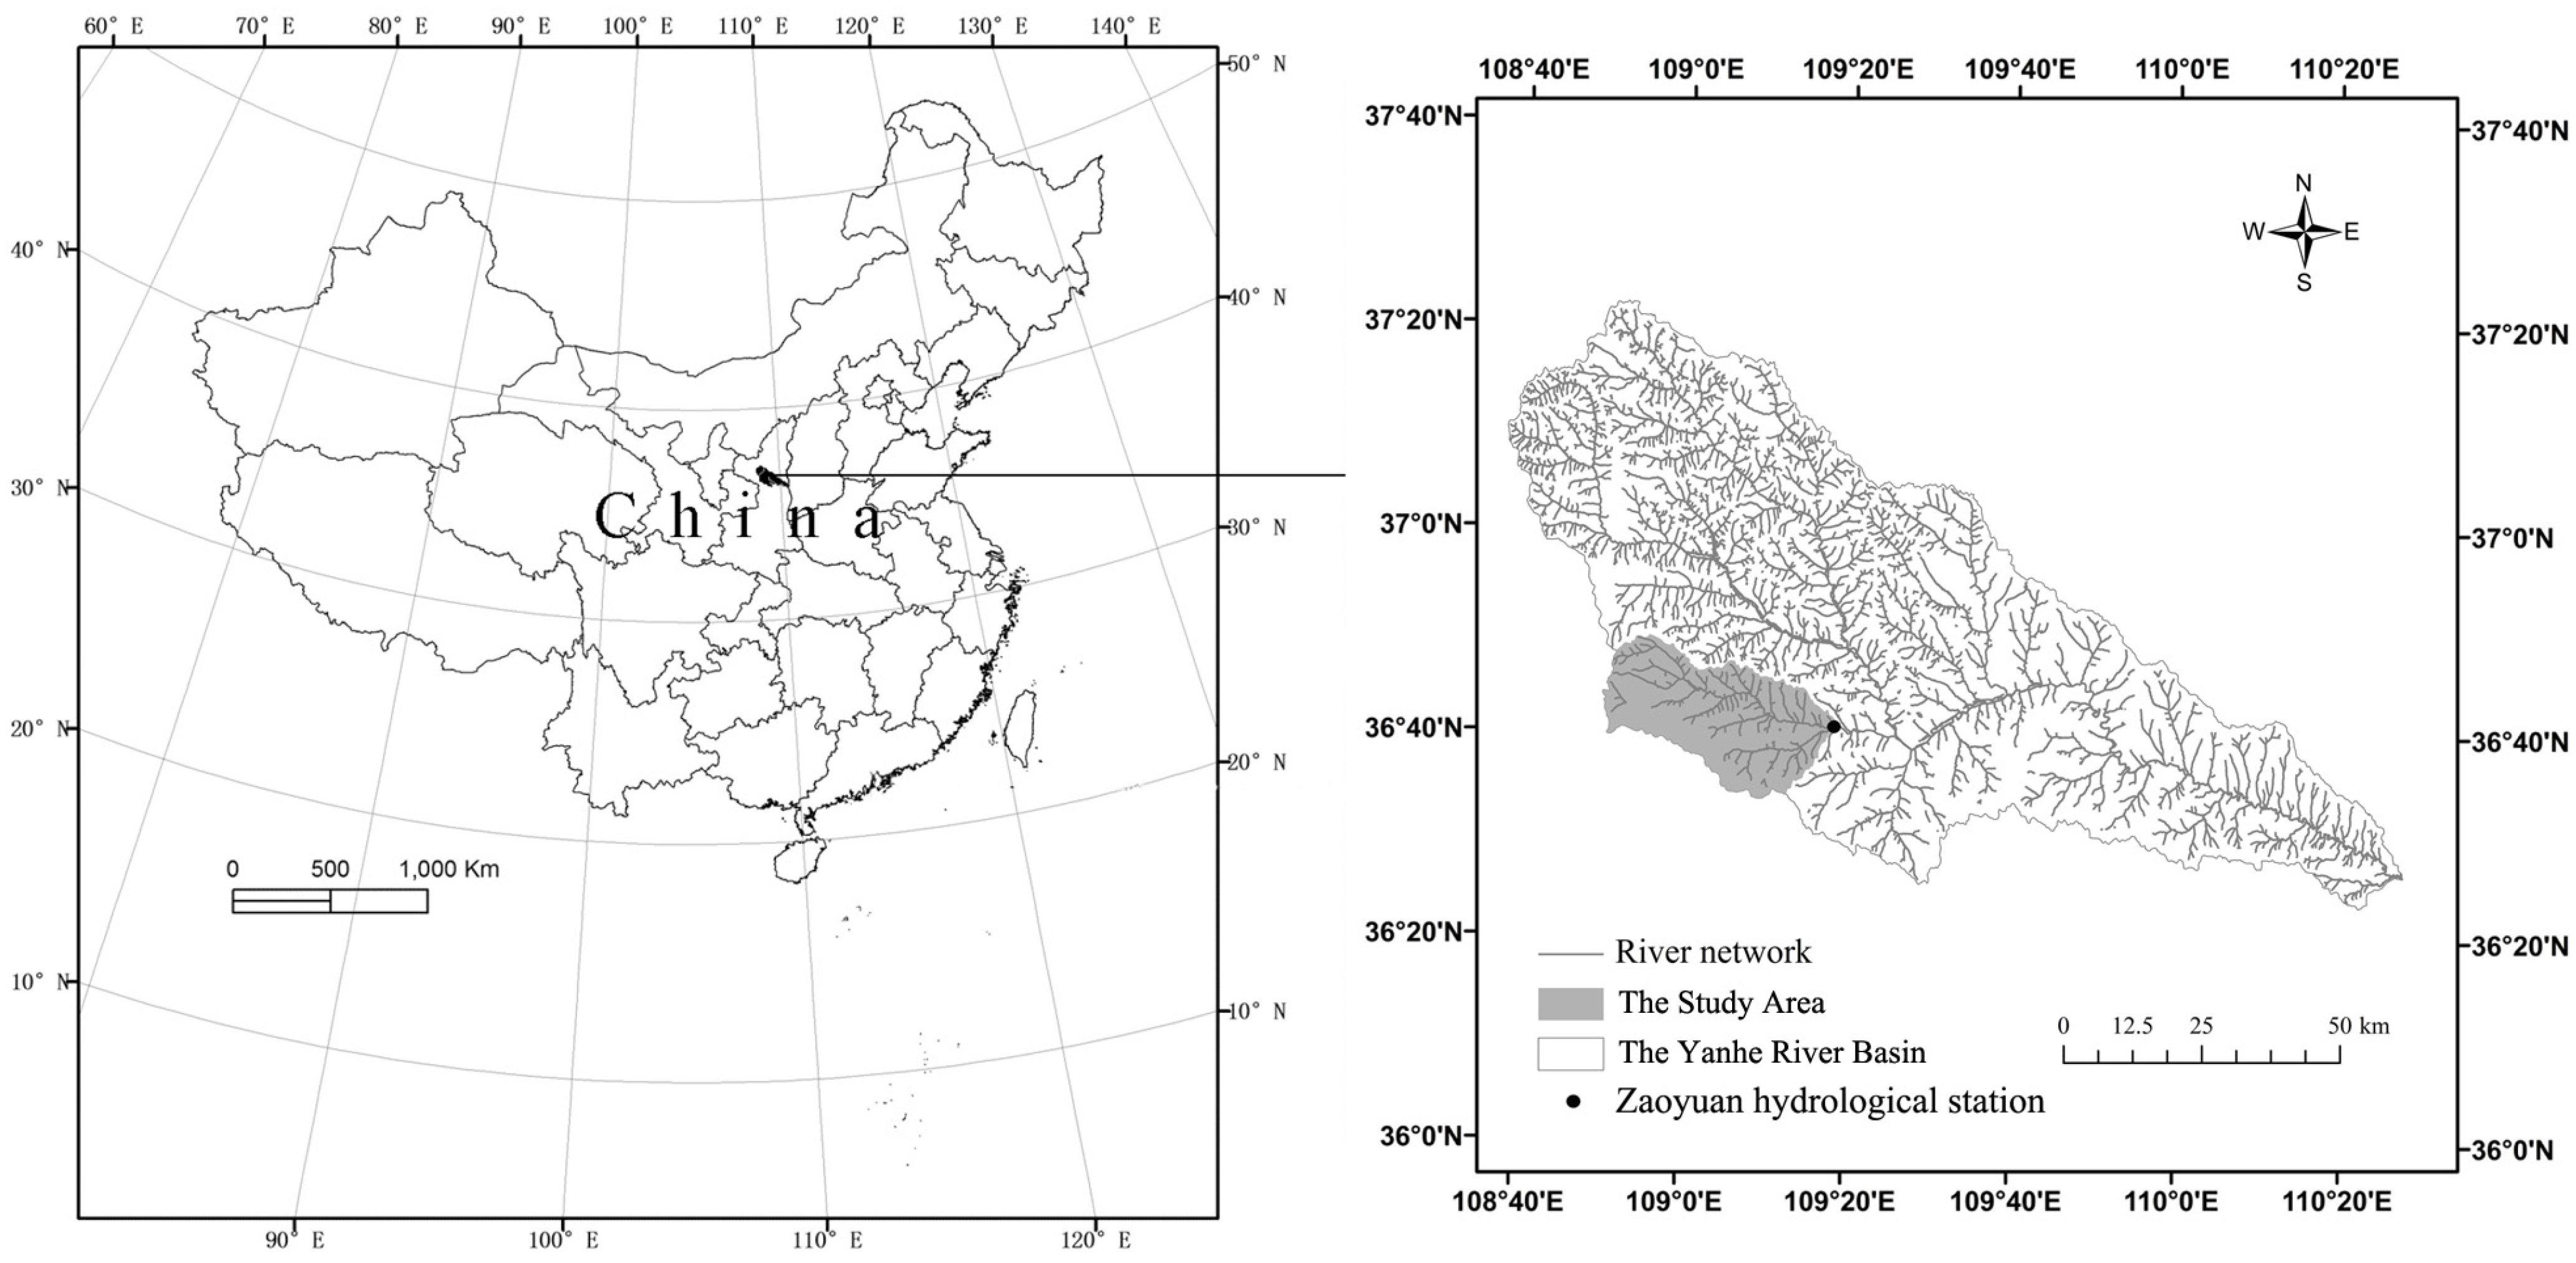
2.1. Study Area
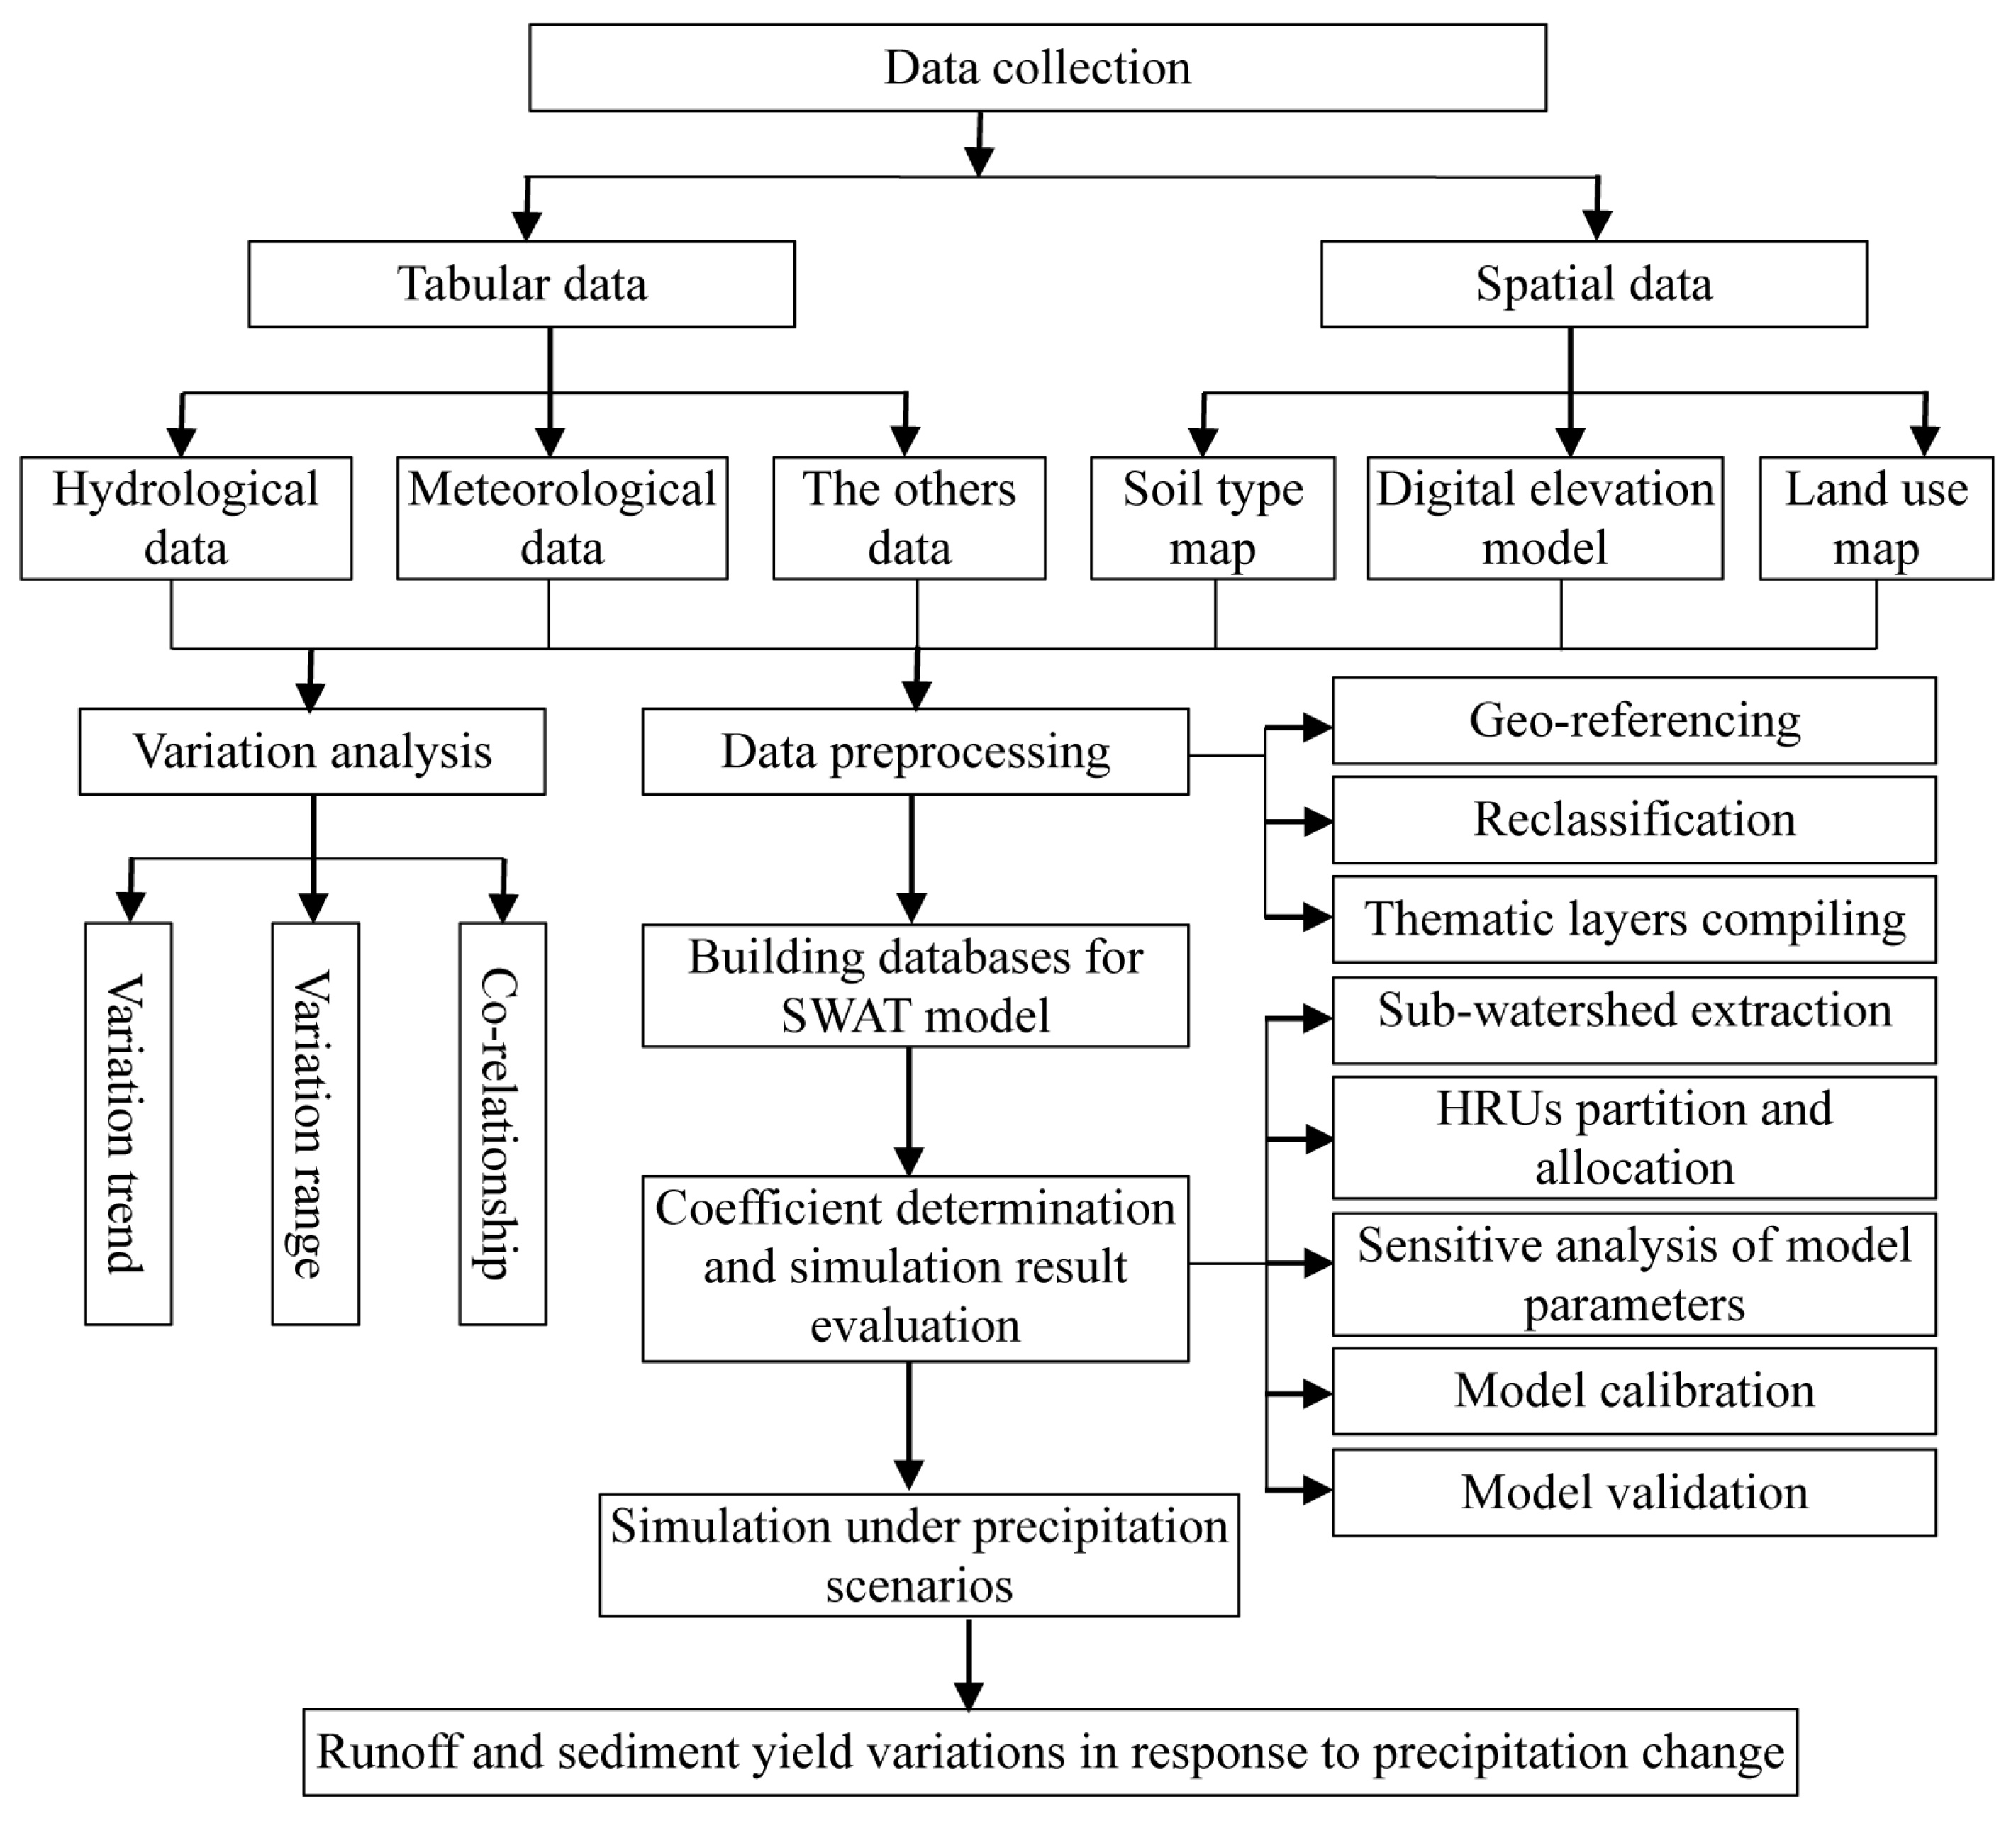
2.2. Data and Data Preprocessing

| Data Type | Temporal/Spatial Resolution | Source |
|---|---|---|
| DEM data | Grid format, 30 m/grid | Data Application Environment Sharing Platform of the Chinese Academy of Sciences |
| Land use map | At the scale of 1:100,000, compiled at 2005 | Data Application Environment Sharing Platform of the Chinese Academy of Sciences |
| Soil type map | At the scale of 1:1,000,000, compiled at 2005 | Data Application Environment Sharing Platform of the Chinese Academy of Sciences |
| Meteorological data | Daily precipitation, daily maximum temperature and daily minimum temperature between 1990 and 2010 | China Meteorological Data Sharing Service Website |
| Runoff and sediment yield | Monthly runoff and sediment yield between 2001 and 2010 | The Zaoyuan Meteorological Station in the Yan’an City |
2.3. SWAT Model Development
2.3.1. Model Construction
2.3.2. Sensitivity Analysis, Validation, and Testing of the SWAT Parameters
2.4. Precipitation Scenarios
- (1)
- the annual mean precipitation increases by 20%, i.e., 617 mm;
- (2)
- the annual mean precipitation increases by 10%, i.e., 565 mm;
- (3)
- the annual mean precipitation decreases by 10%, i.e., 462 mm; and
- (4)
- the annual mean precipitation decreases by 20%, i.e., 411 mm.
2.5. Variance Analysis
3 Results
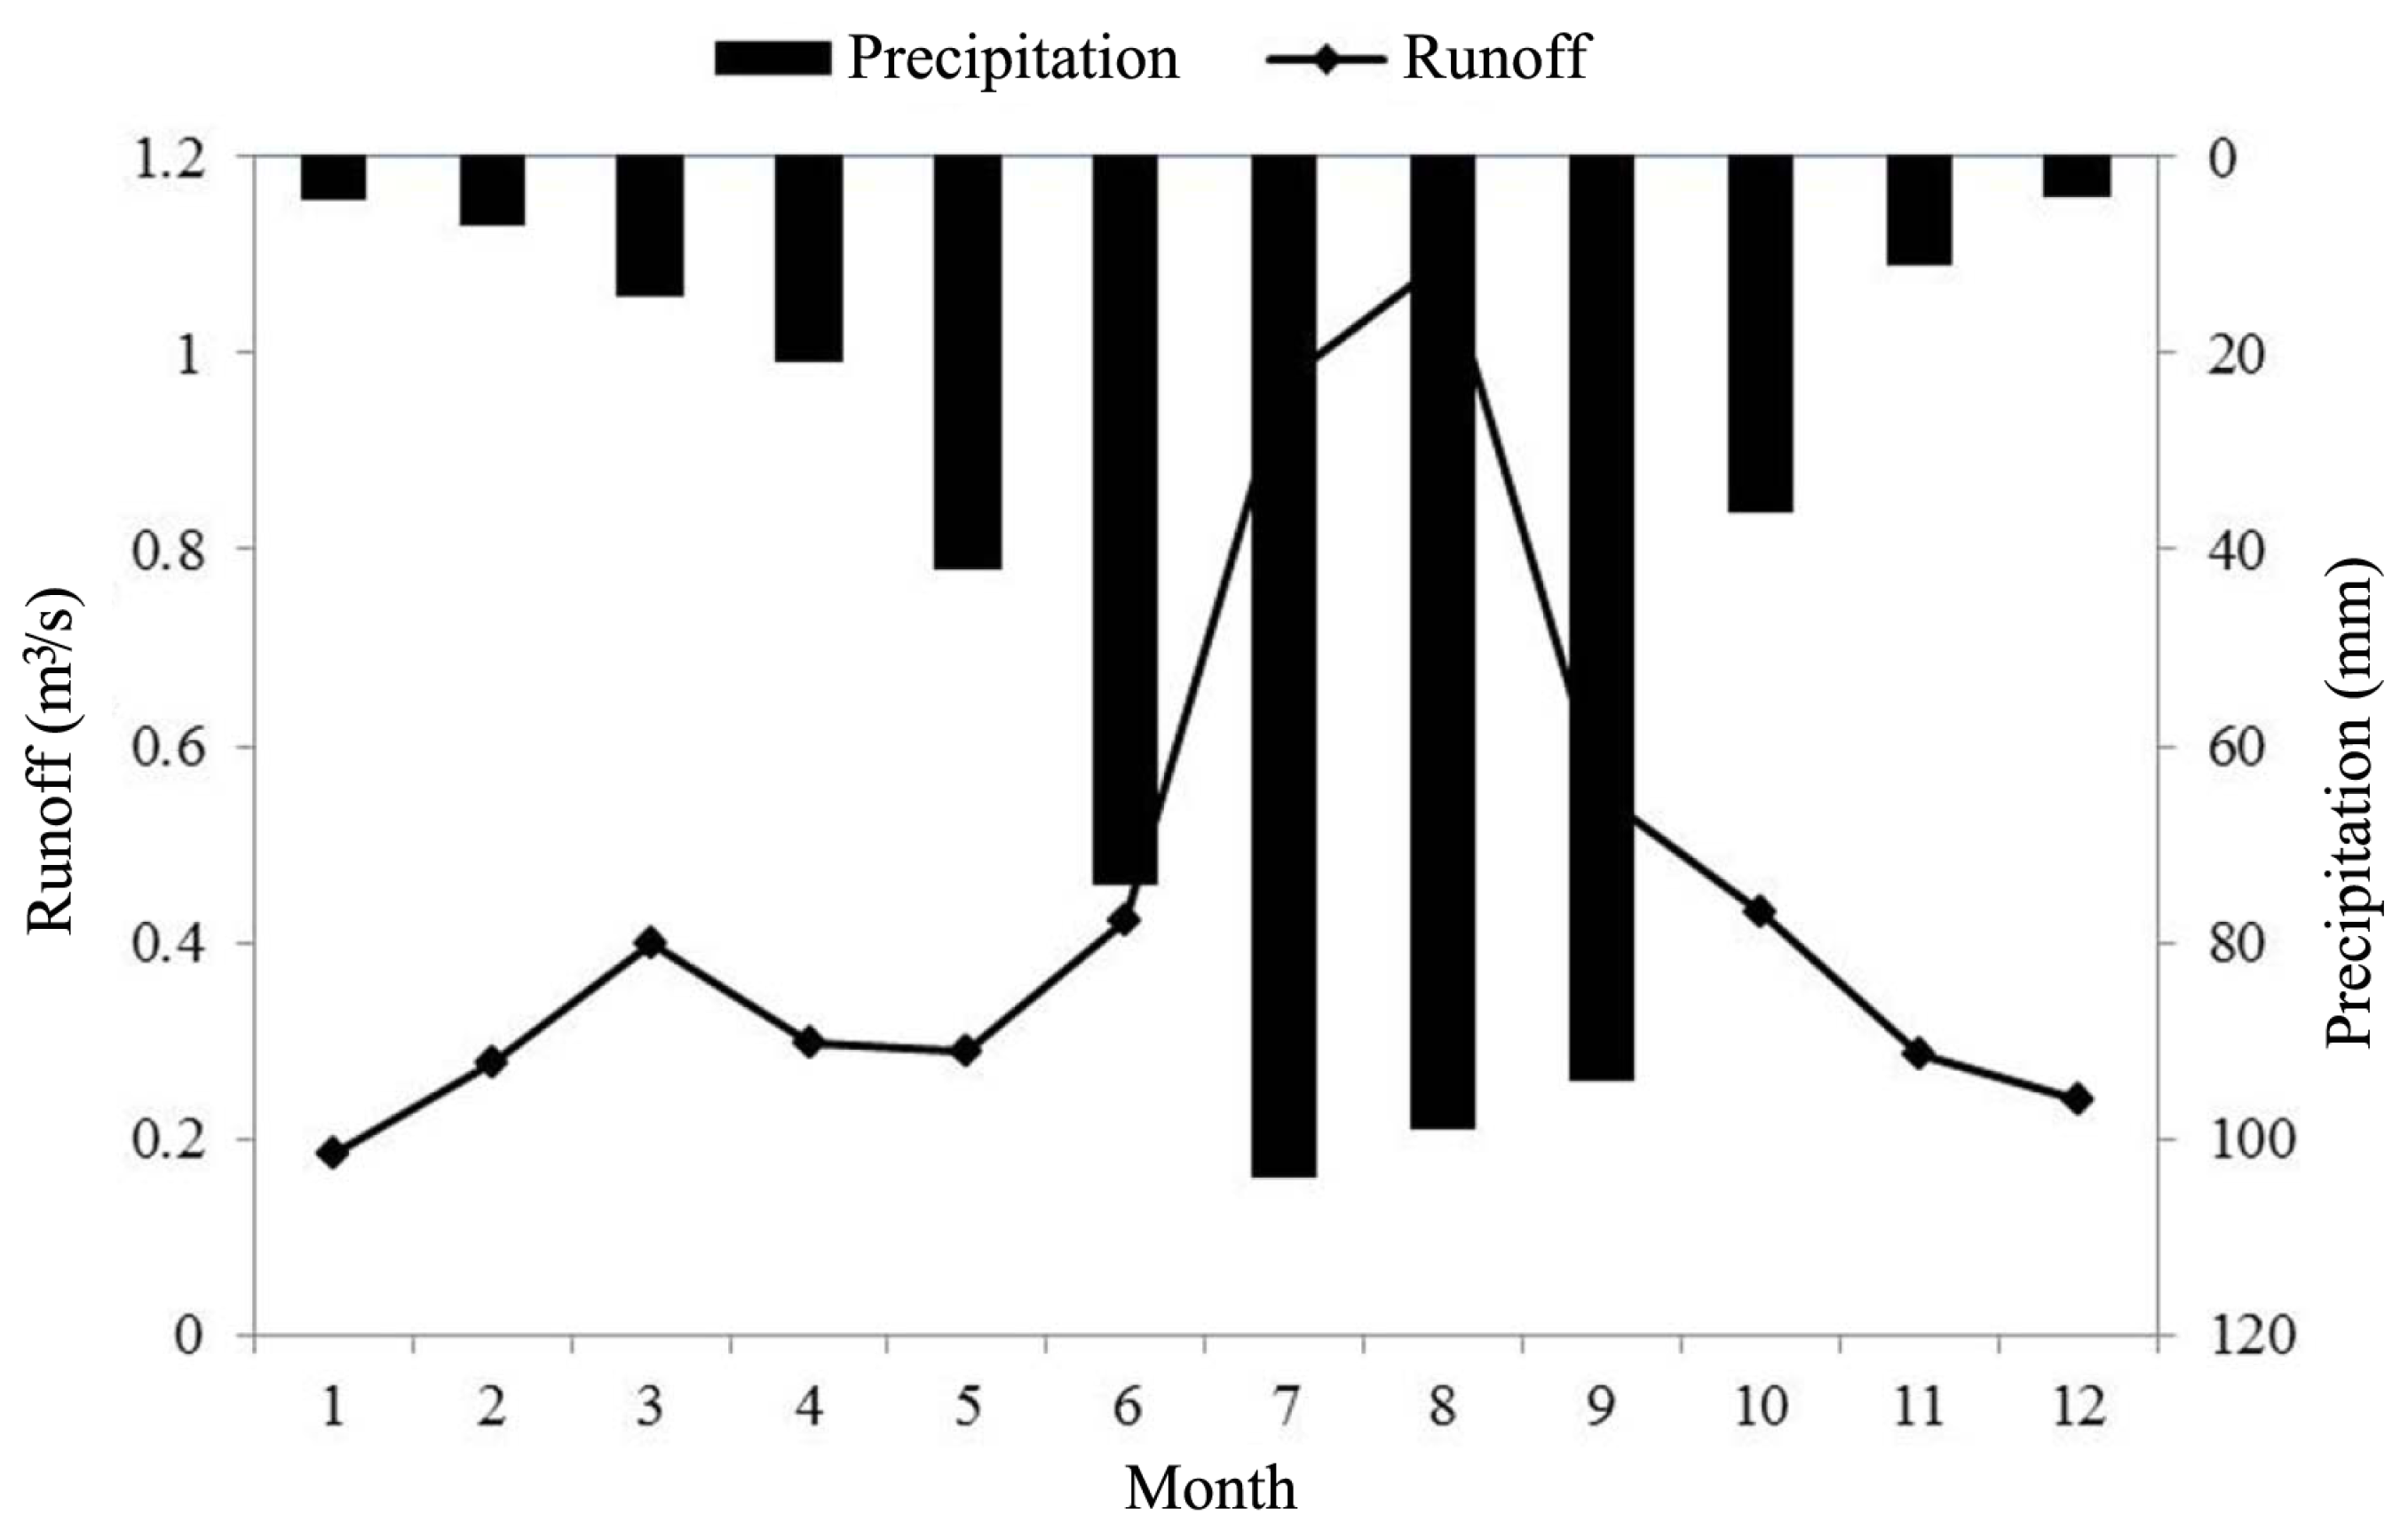
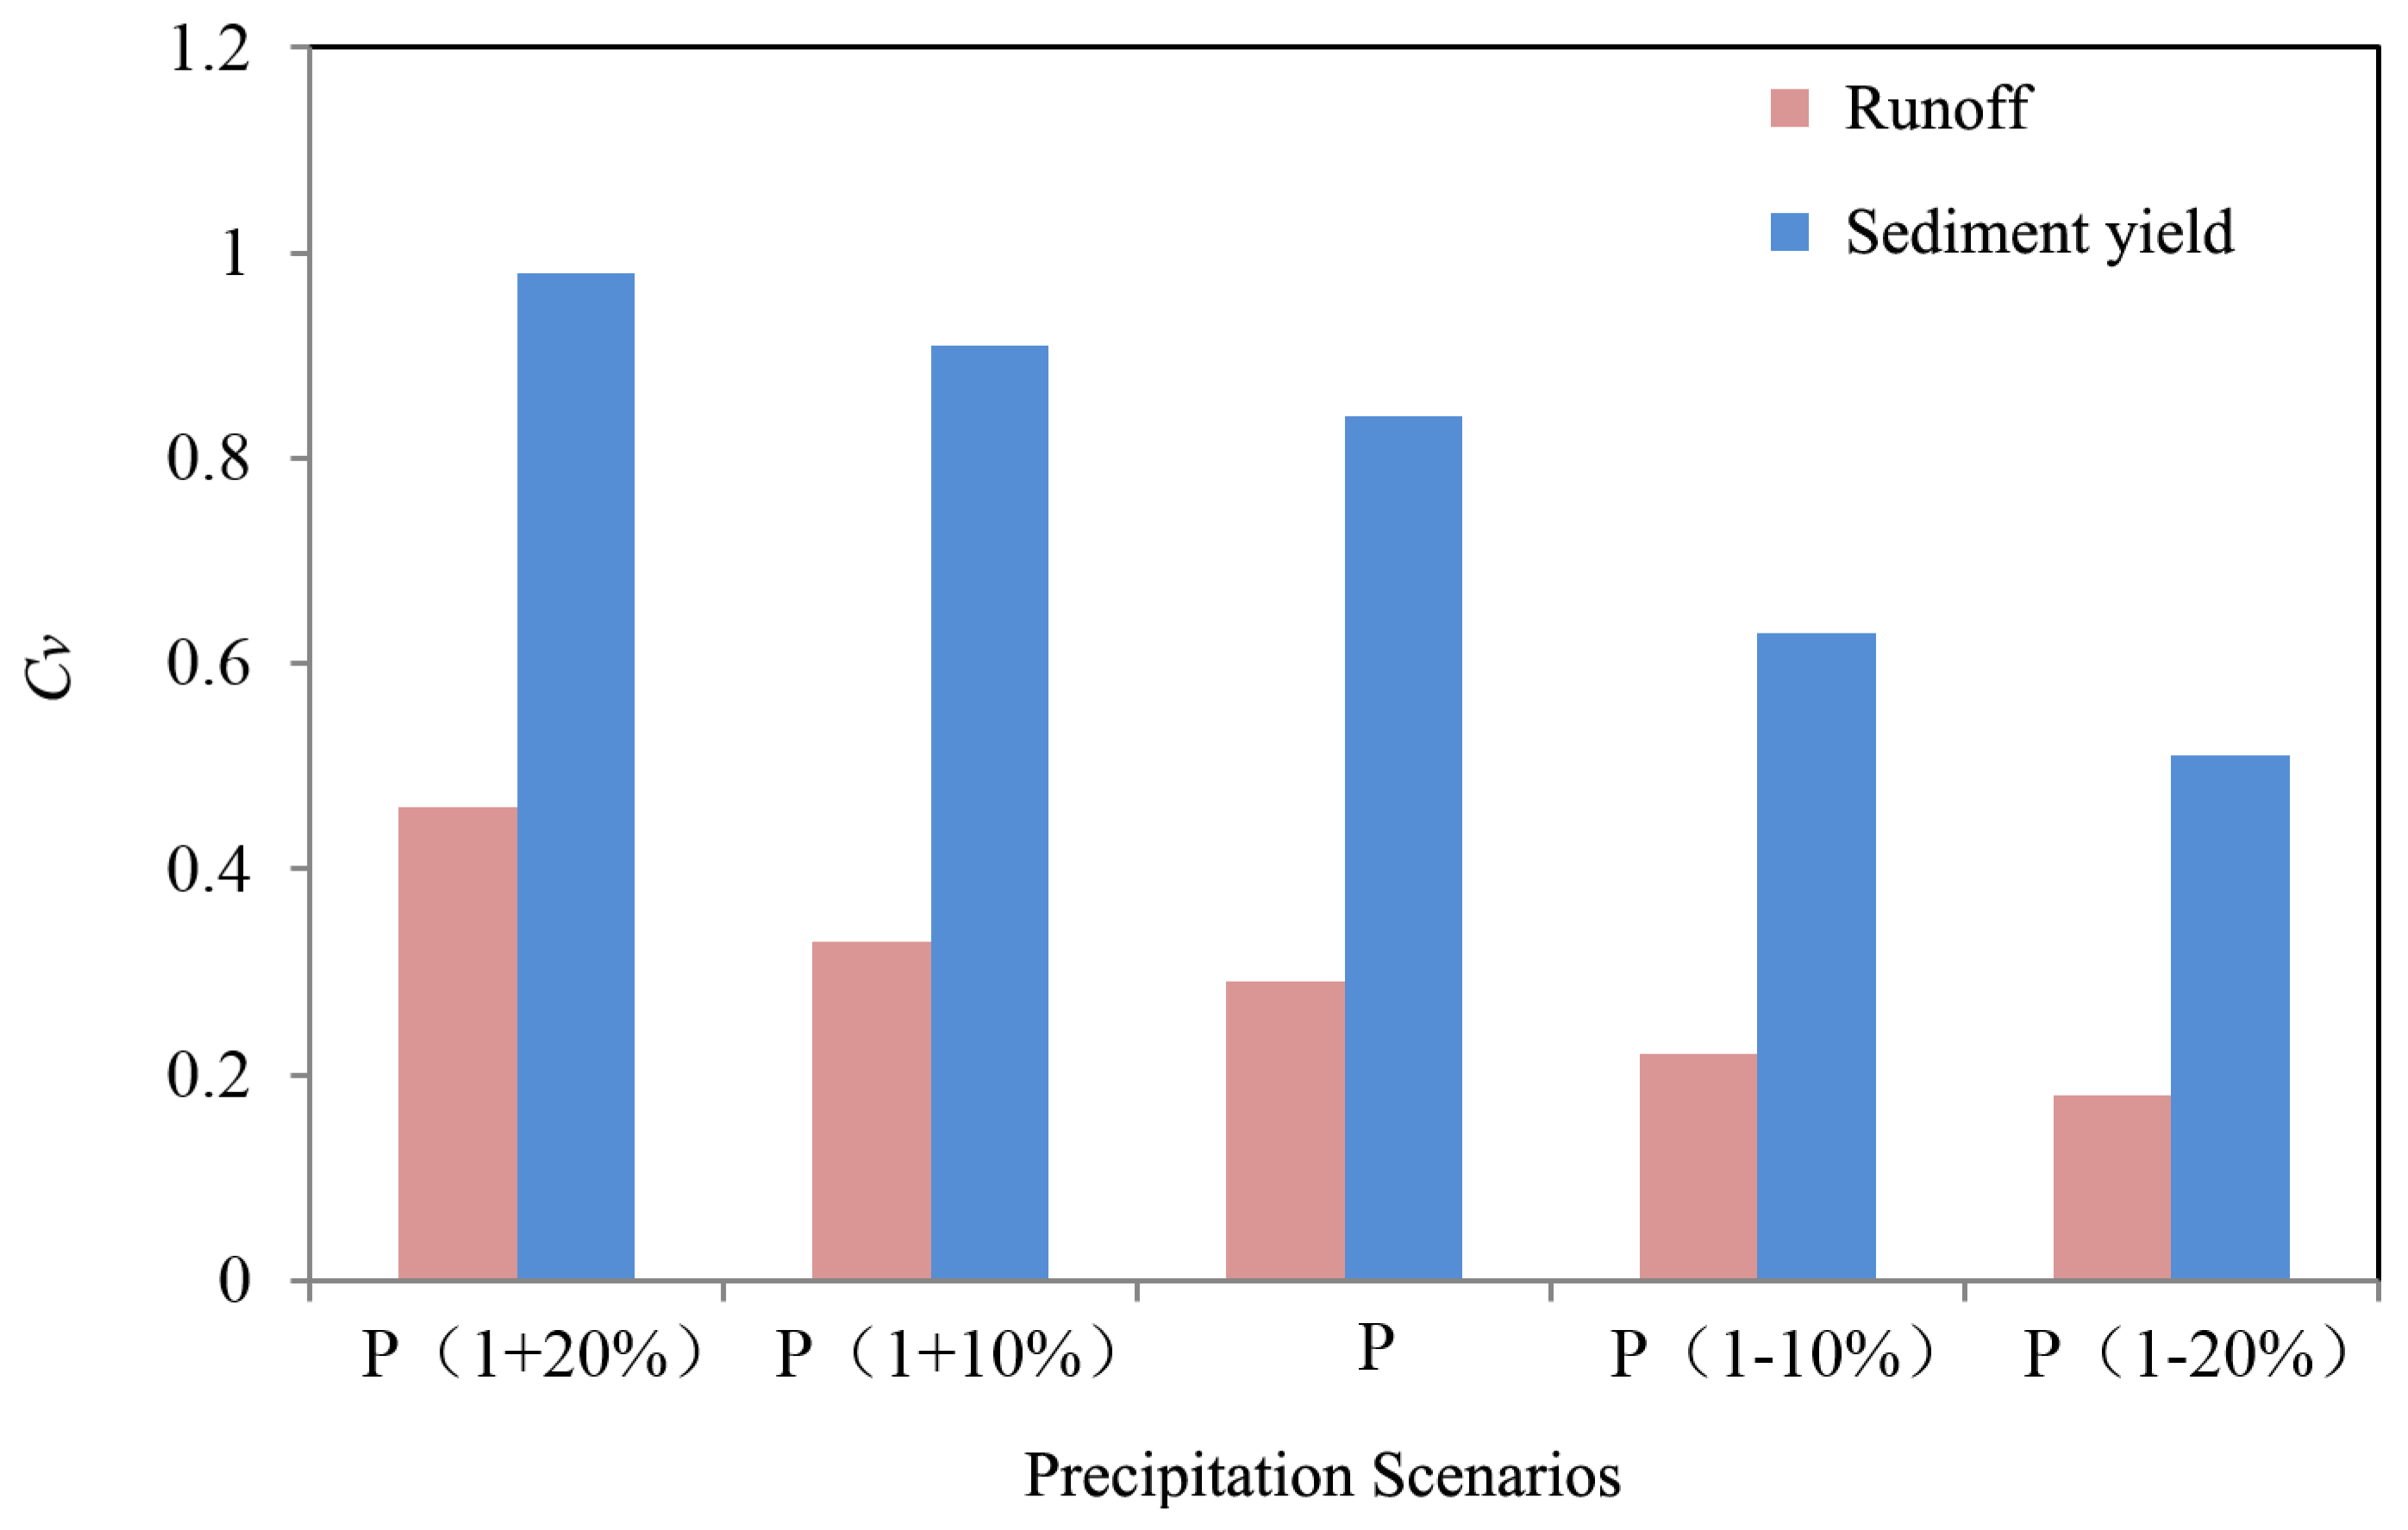
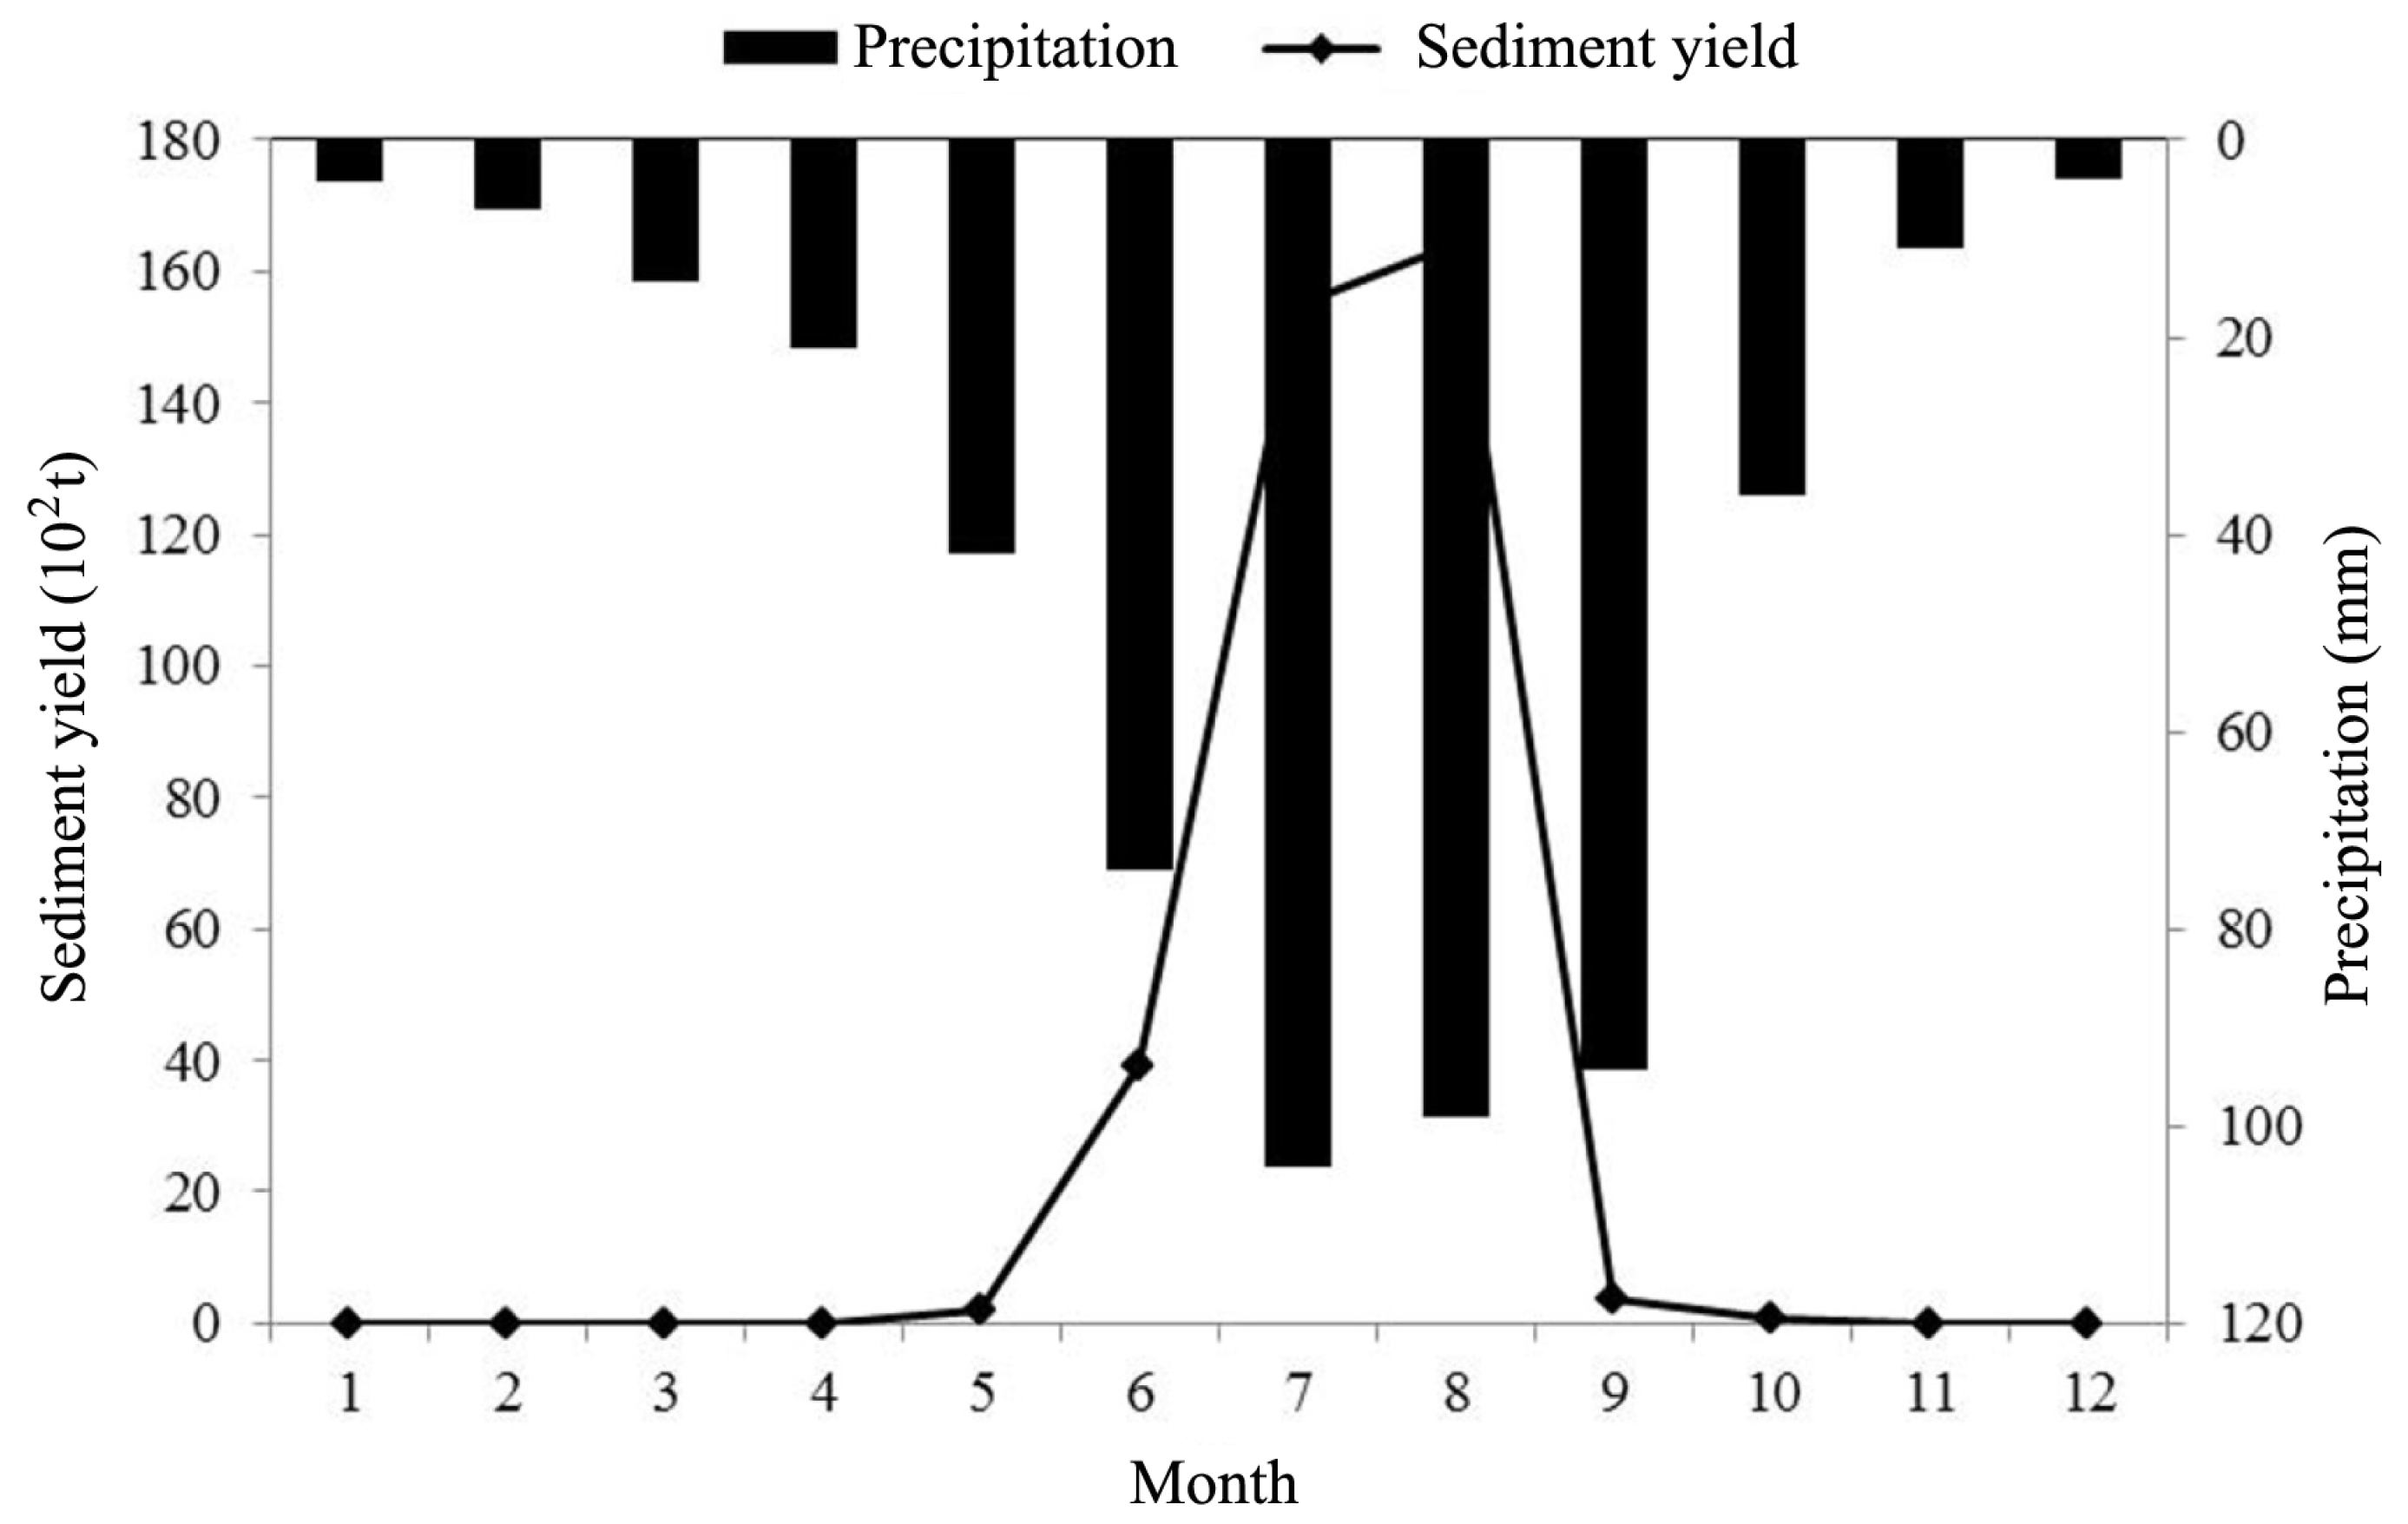
3.1. Characteristics of the Variations of Runoff and Sediment Yield

| Variable | Mean Value | Cv | Maximum Value | Minimum Value | ||
|---|---|---|---|---|---|---|
| Value | Year of Occurrence | Value | Year of Occurrence | |||
| Precipitation | 513.38 mm | 0.13 | 634.30 mm | 2007 | 441.60 mm | 2008 |
| Runoff | 169.04 × 10⁶ m3 | 0.29 | 235.89 × 10⁶ m3 | 2002 | 95.08 × 10⁶ m3 | 2008 |
| Sediment | 1,330.20 × 104 t | 0.84 | 3,161.40 × 104 t | 2002 | 122.70 × 10⁴ t | 2006 |
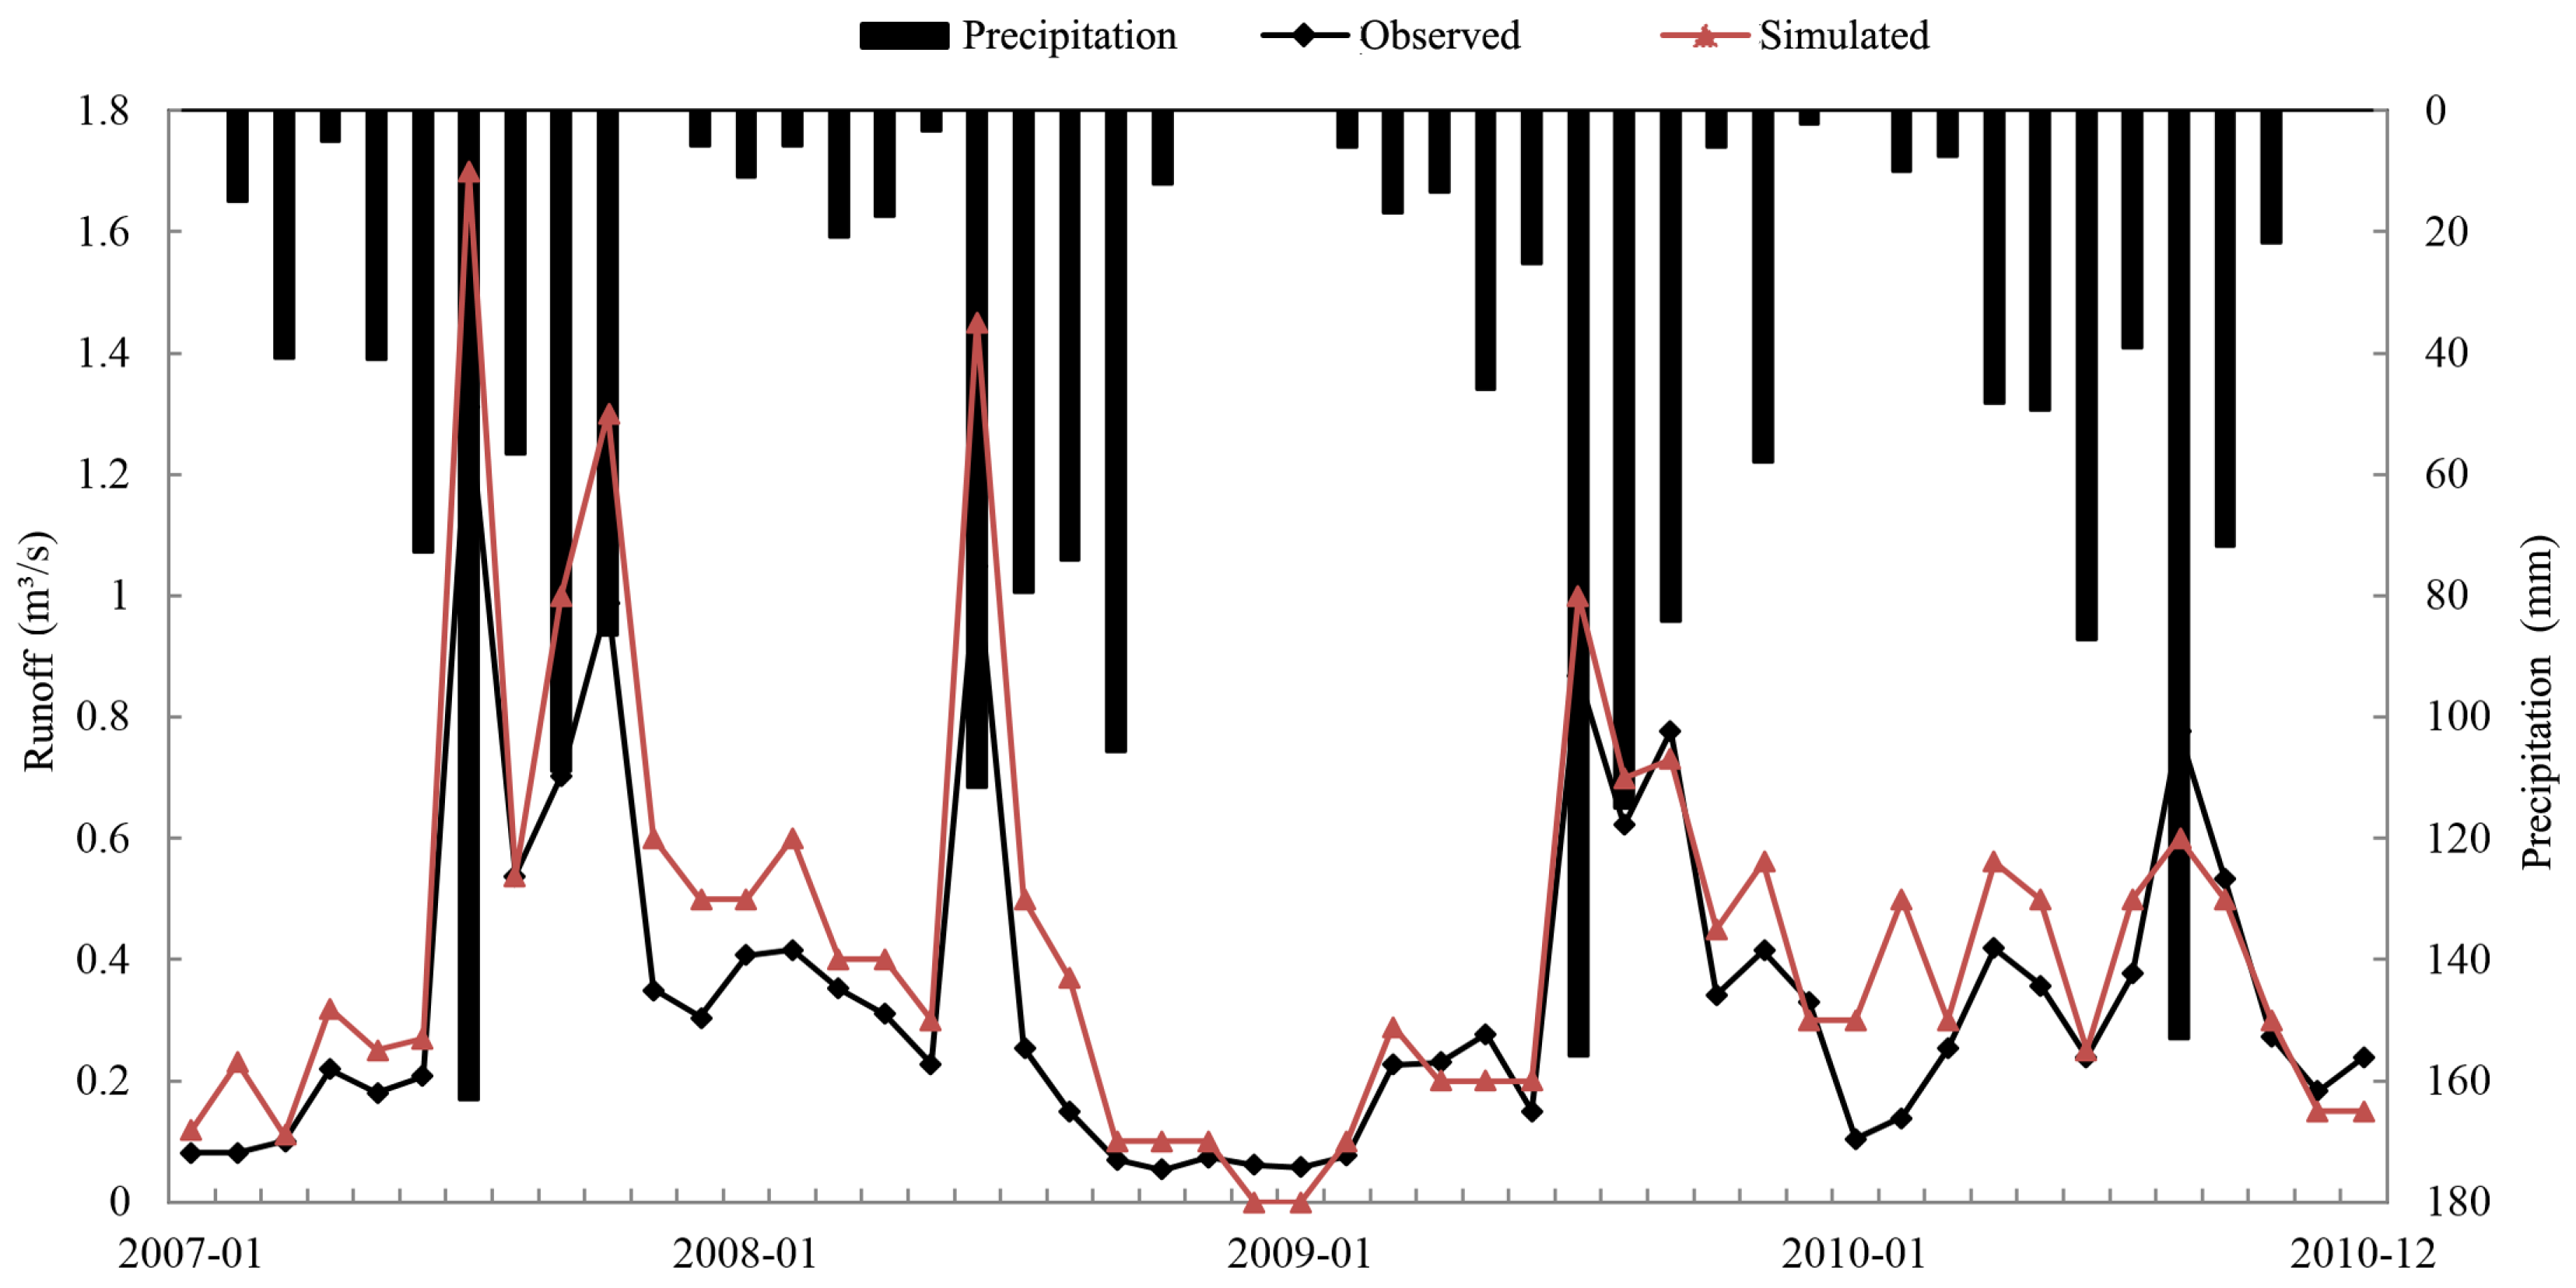
3.2. SWAT Calibration and Validation Results
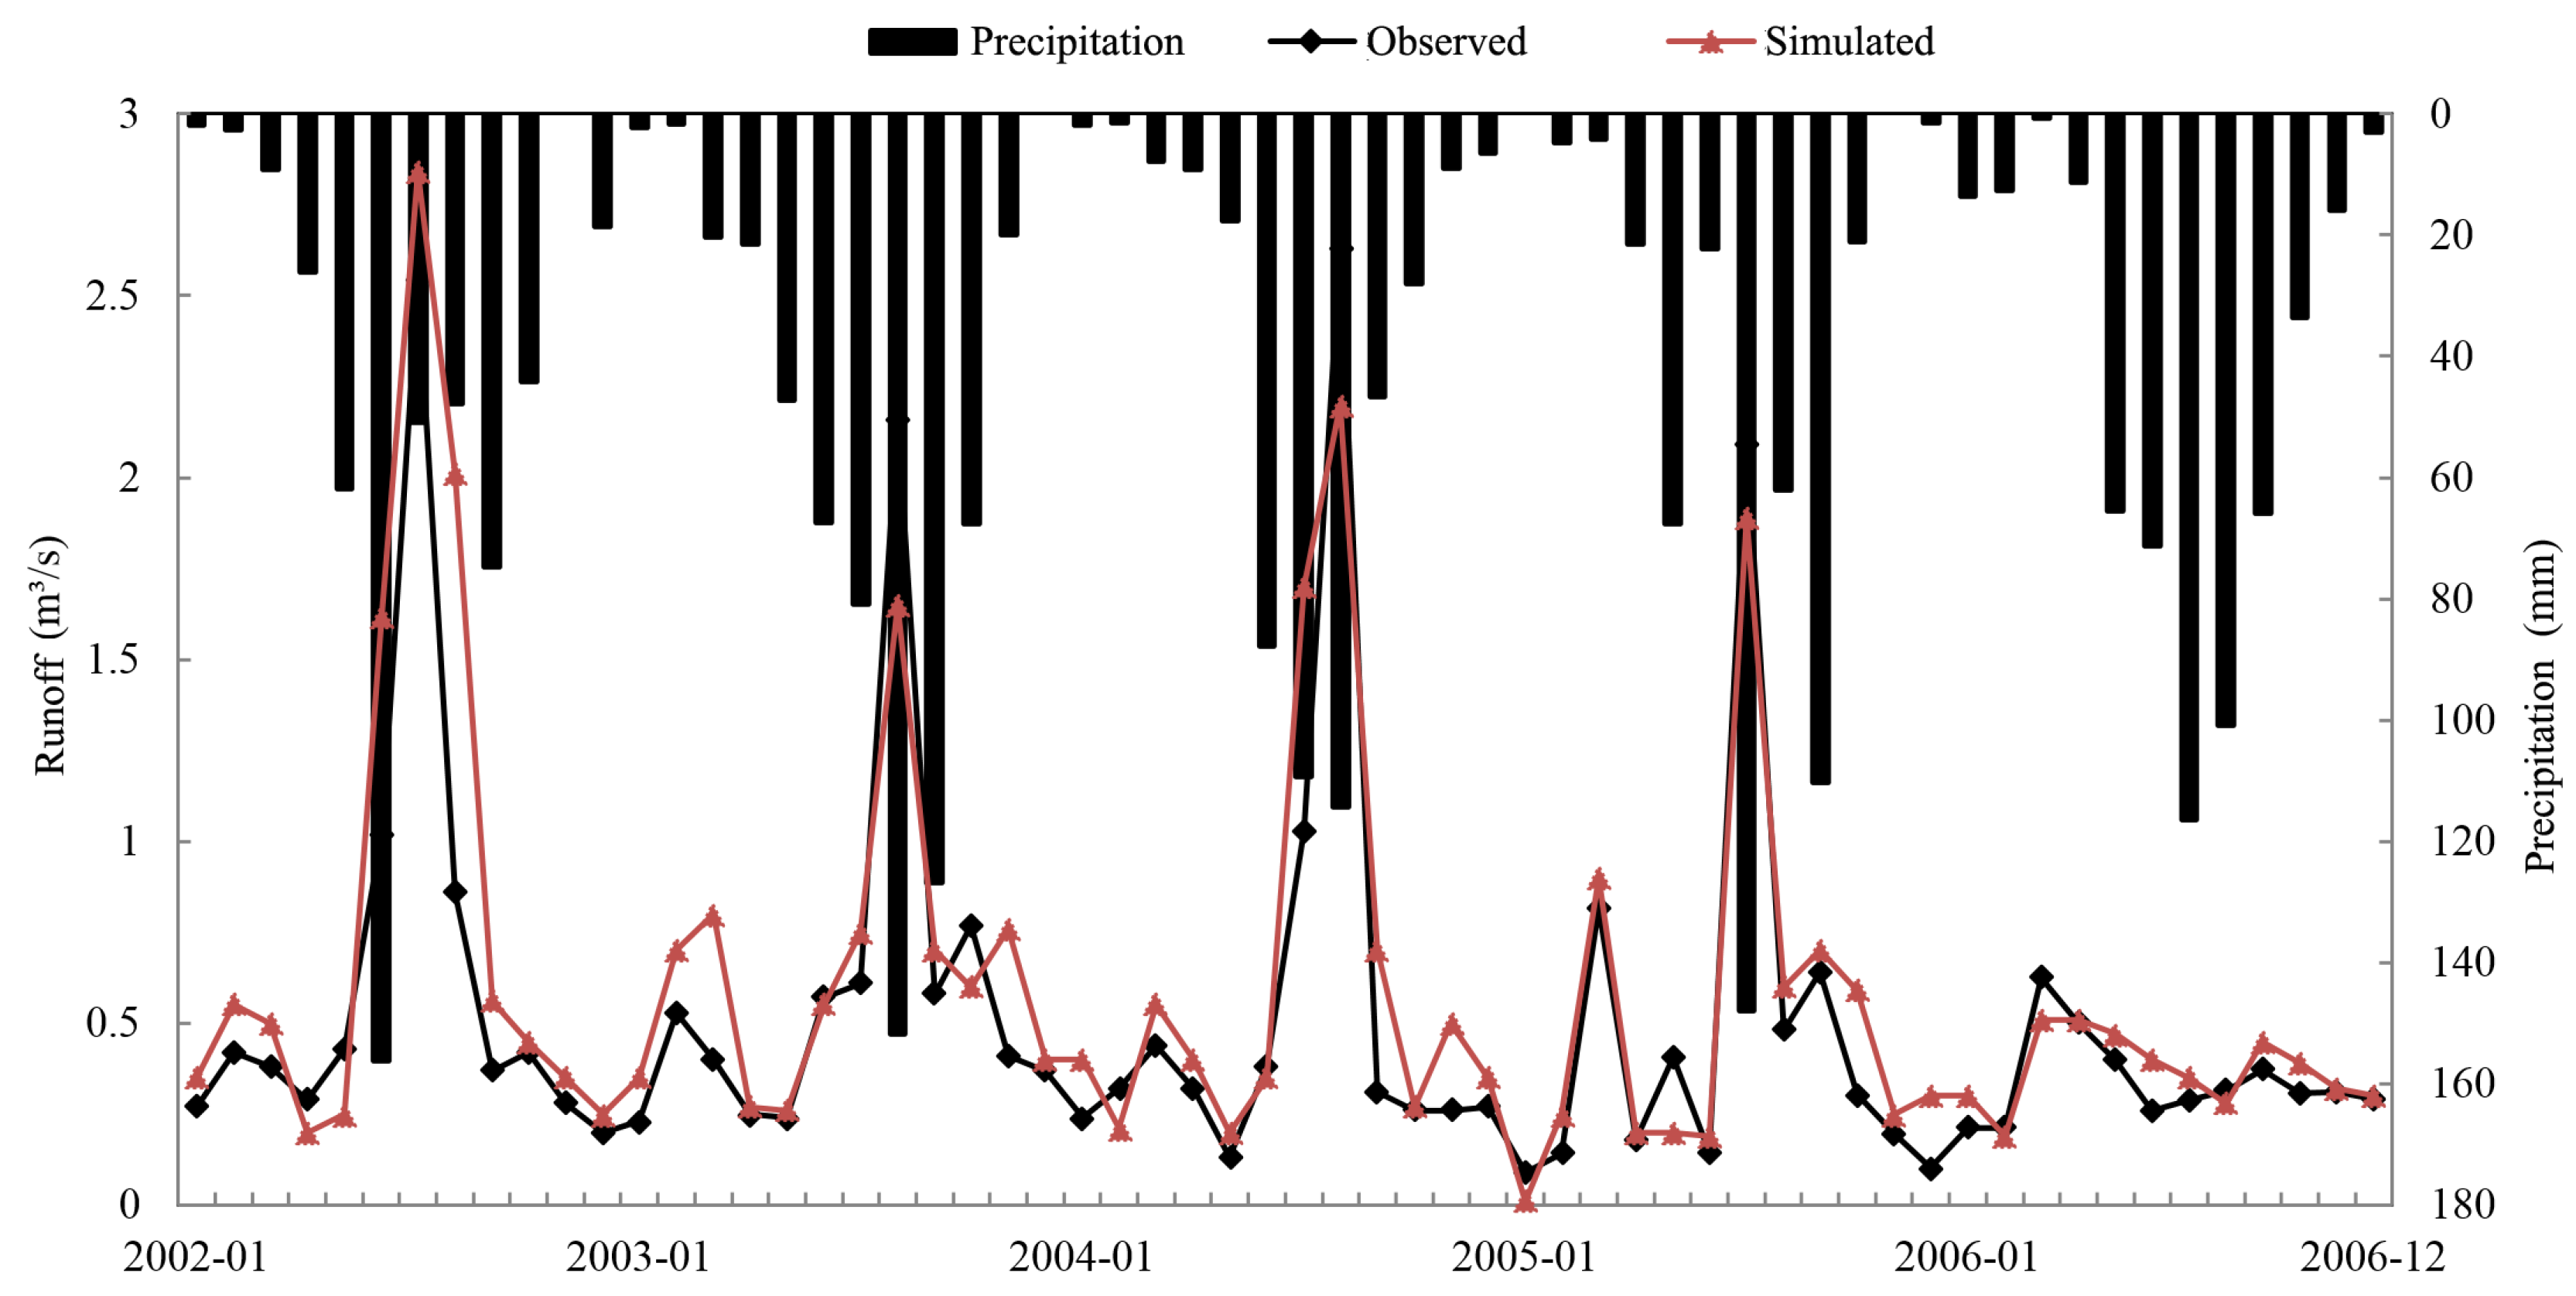
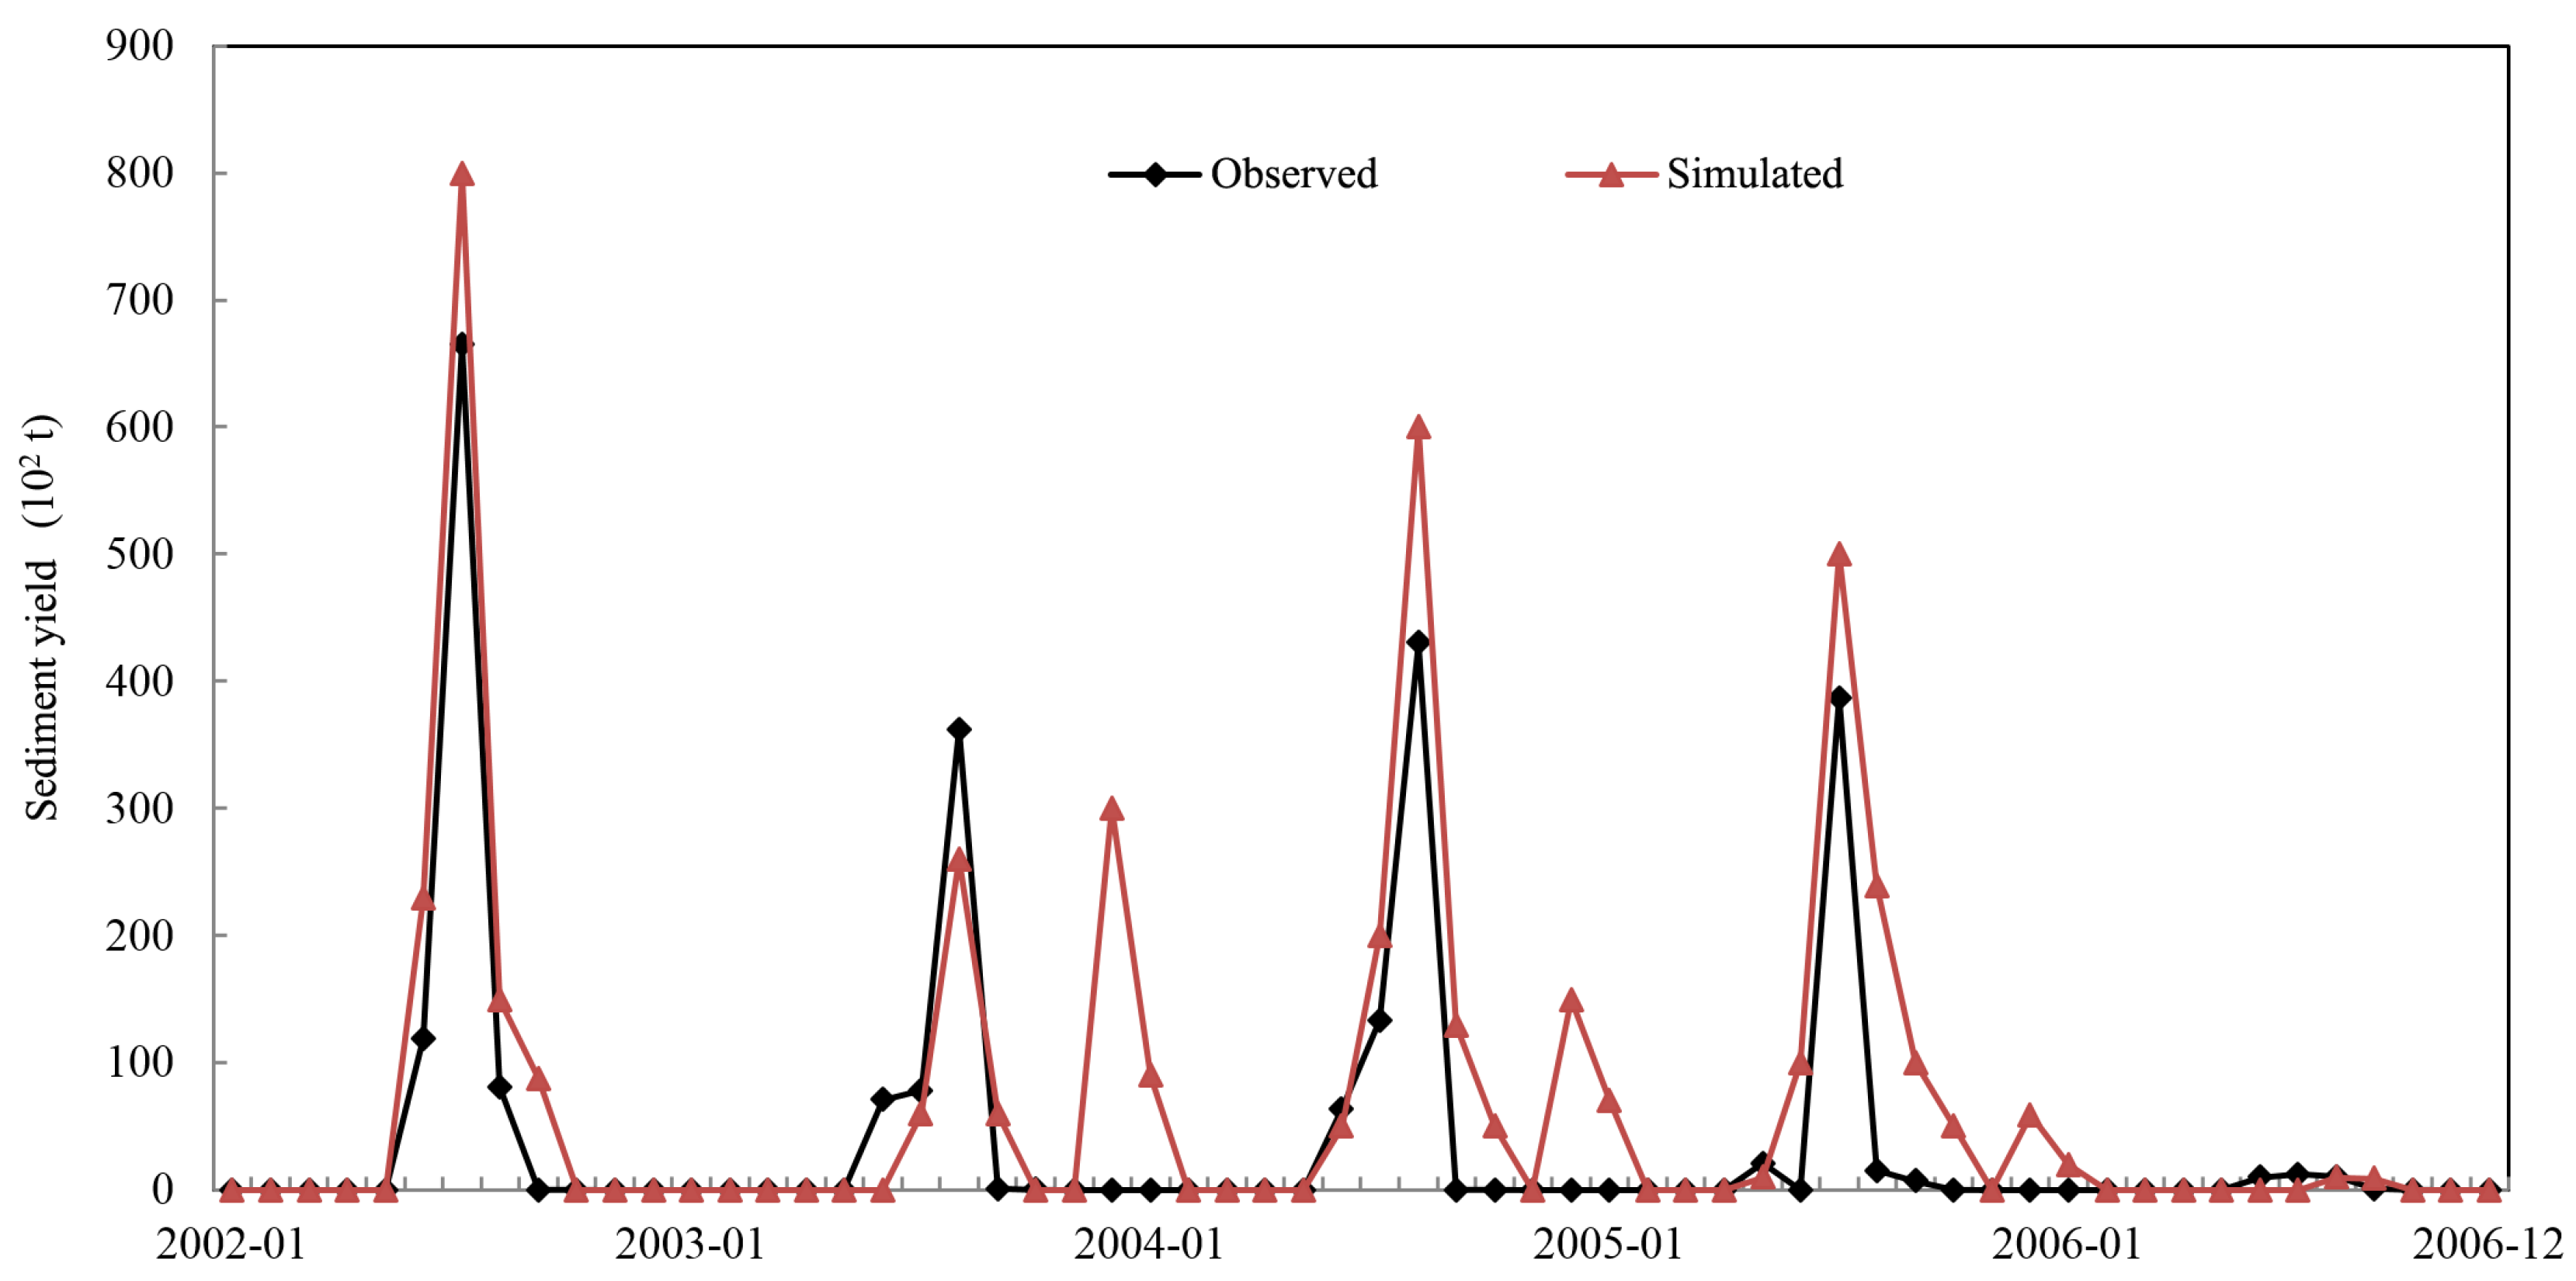

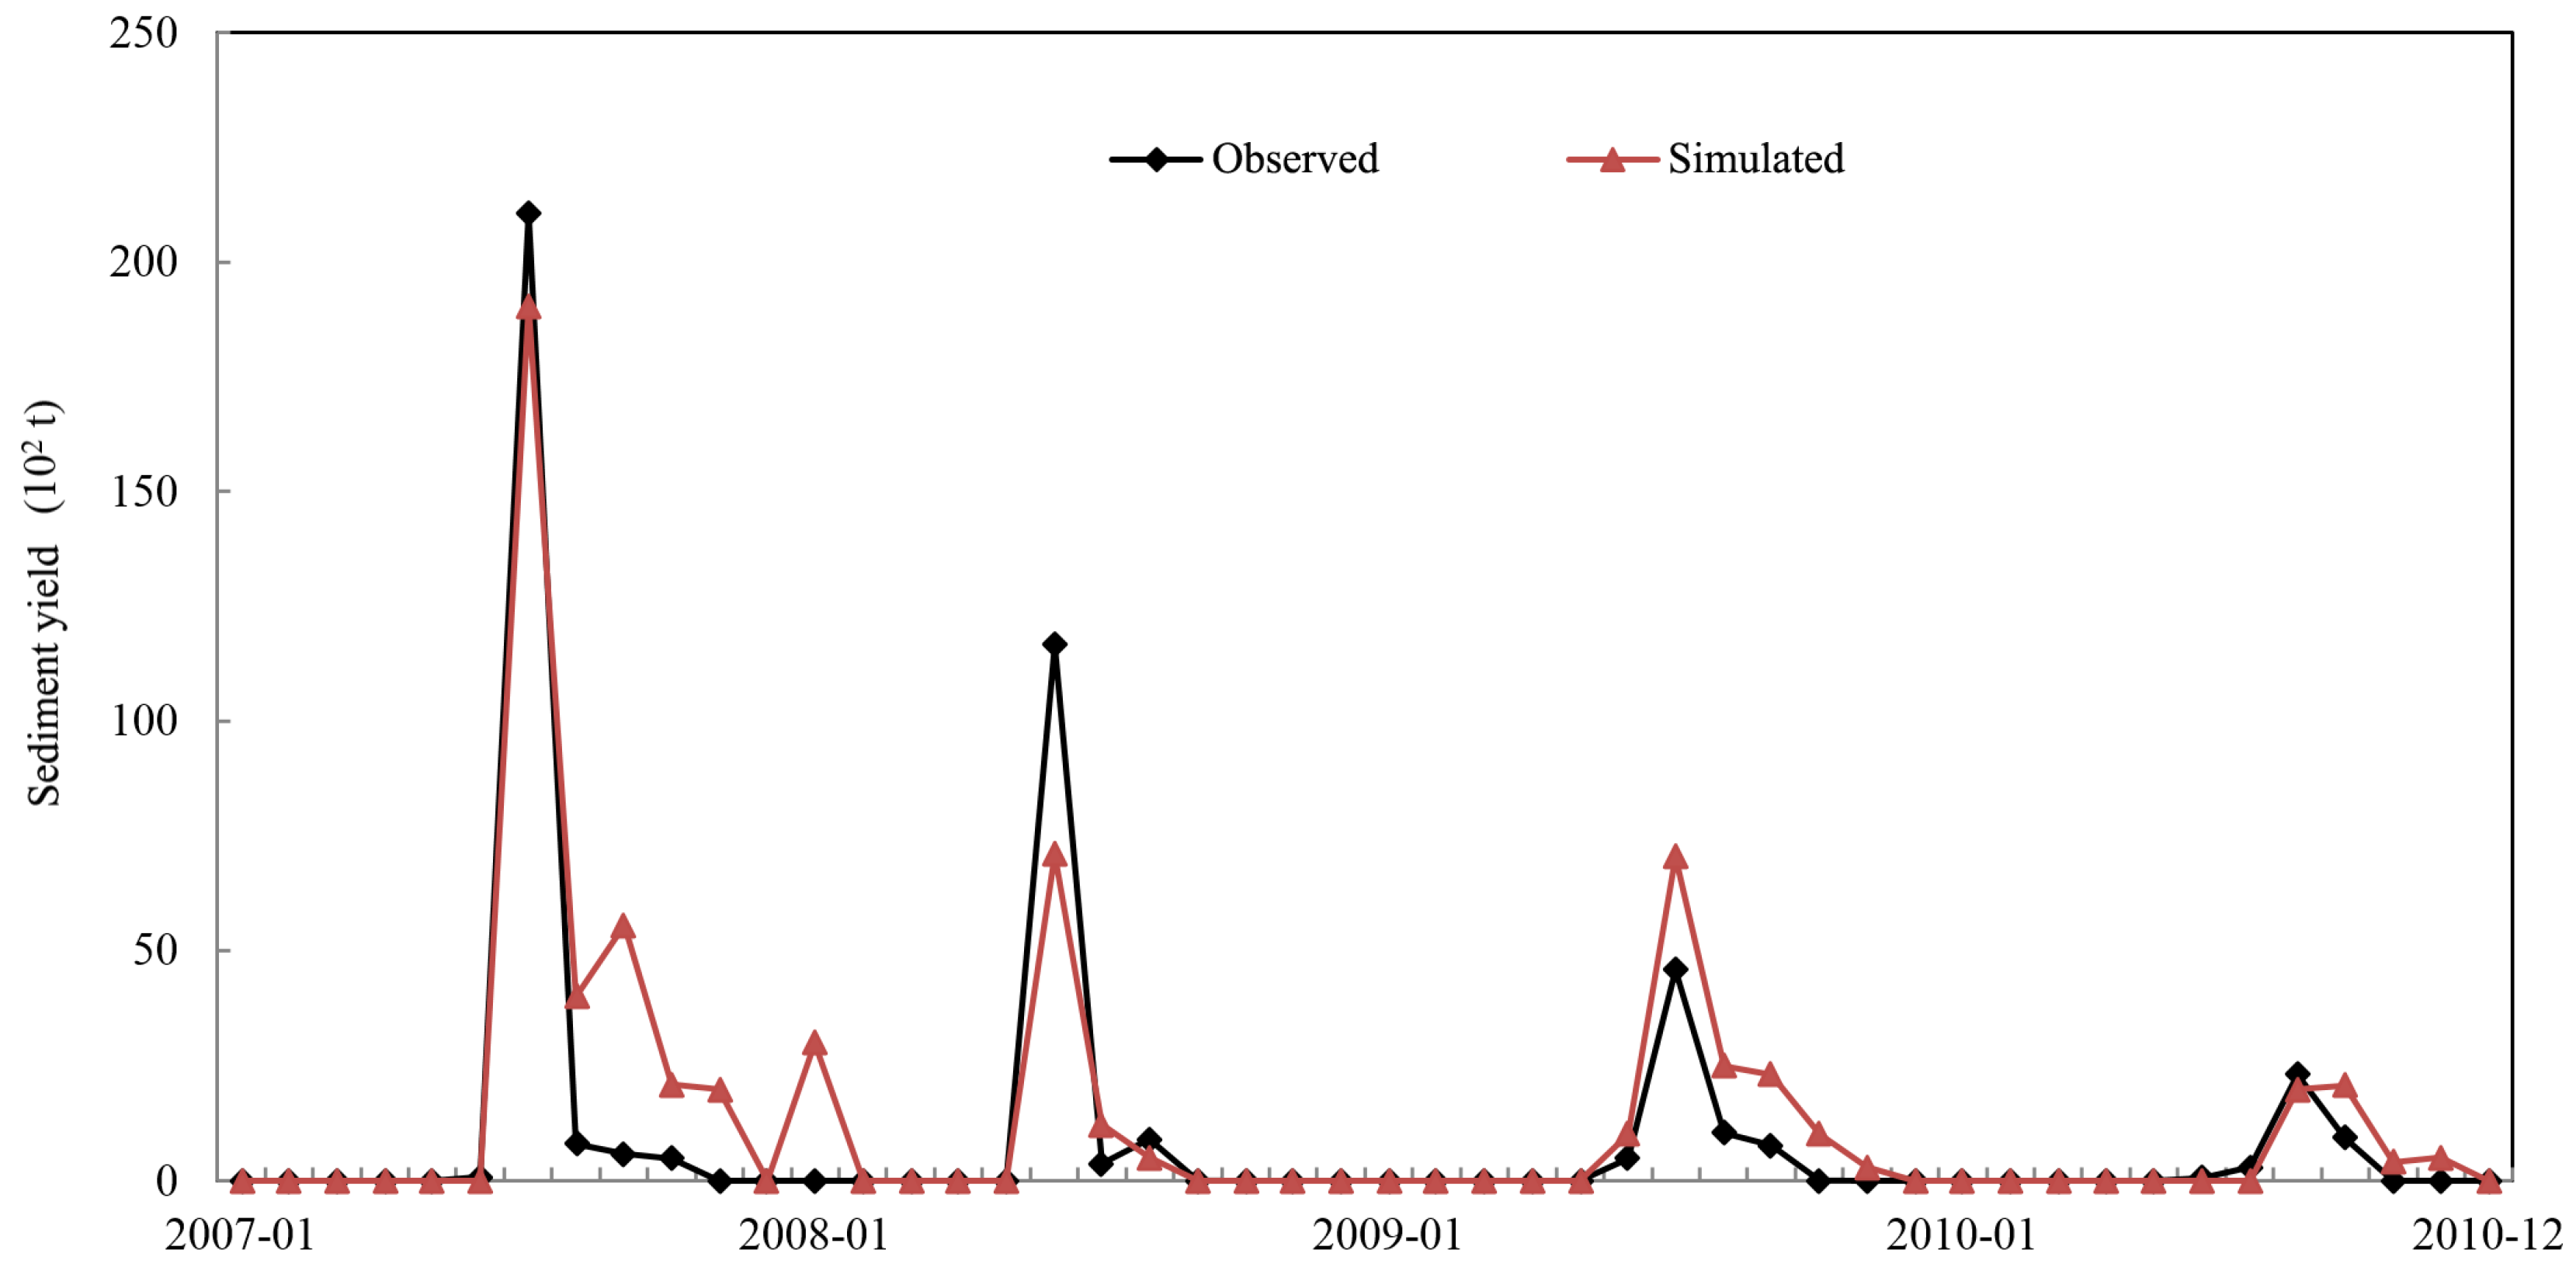
| Simulation Period | Runoff | Sediment Yield | ||||
|---|---|---|---|---|---|---|
| Re | R2 | Ens | Re | R2 | Ens | |
| Calibration (2002–2006) | 9.10% | 0.79 | 0.73 | 14.20% | 0.78 | 0.67 |
| Verification (2007–2010) | 11.20% | 0.88 | 0.82 | 17.50% | 0.83 | 0.71 |
3.3. Responses of Runoff and Sediment Yield to Precipitation Changes
| Simulated Item | Compared Value | P | P (1% + 20%) | P (1% + 10%) | P (1% − 10%) | P (1% − 20%) |
|---|---|---|---|---|---|---|
| Runoff | Simulated value (m3) | 156.14 | 207.20 | 184.81 | 135.28 | 112.58 |
| Sediment yield | Simulated value (104 t) | 101.09 | 120.49 | 112.87 | 90.93 | 85.04 |

- (1)
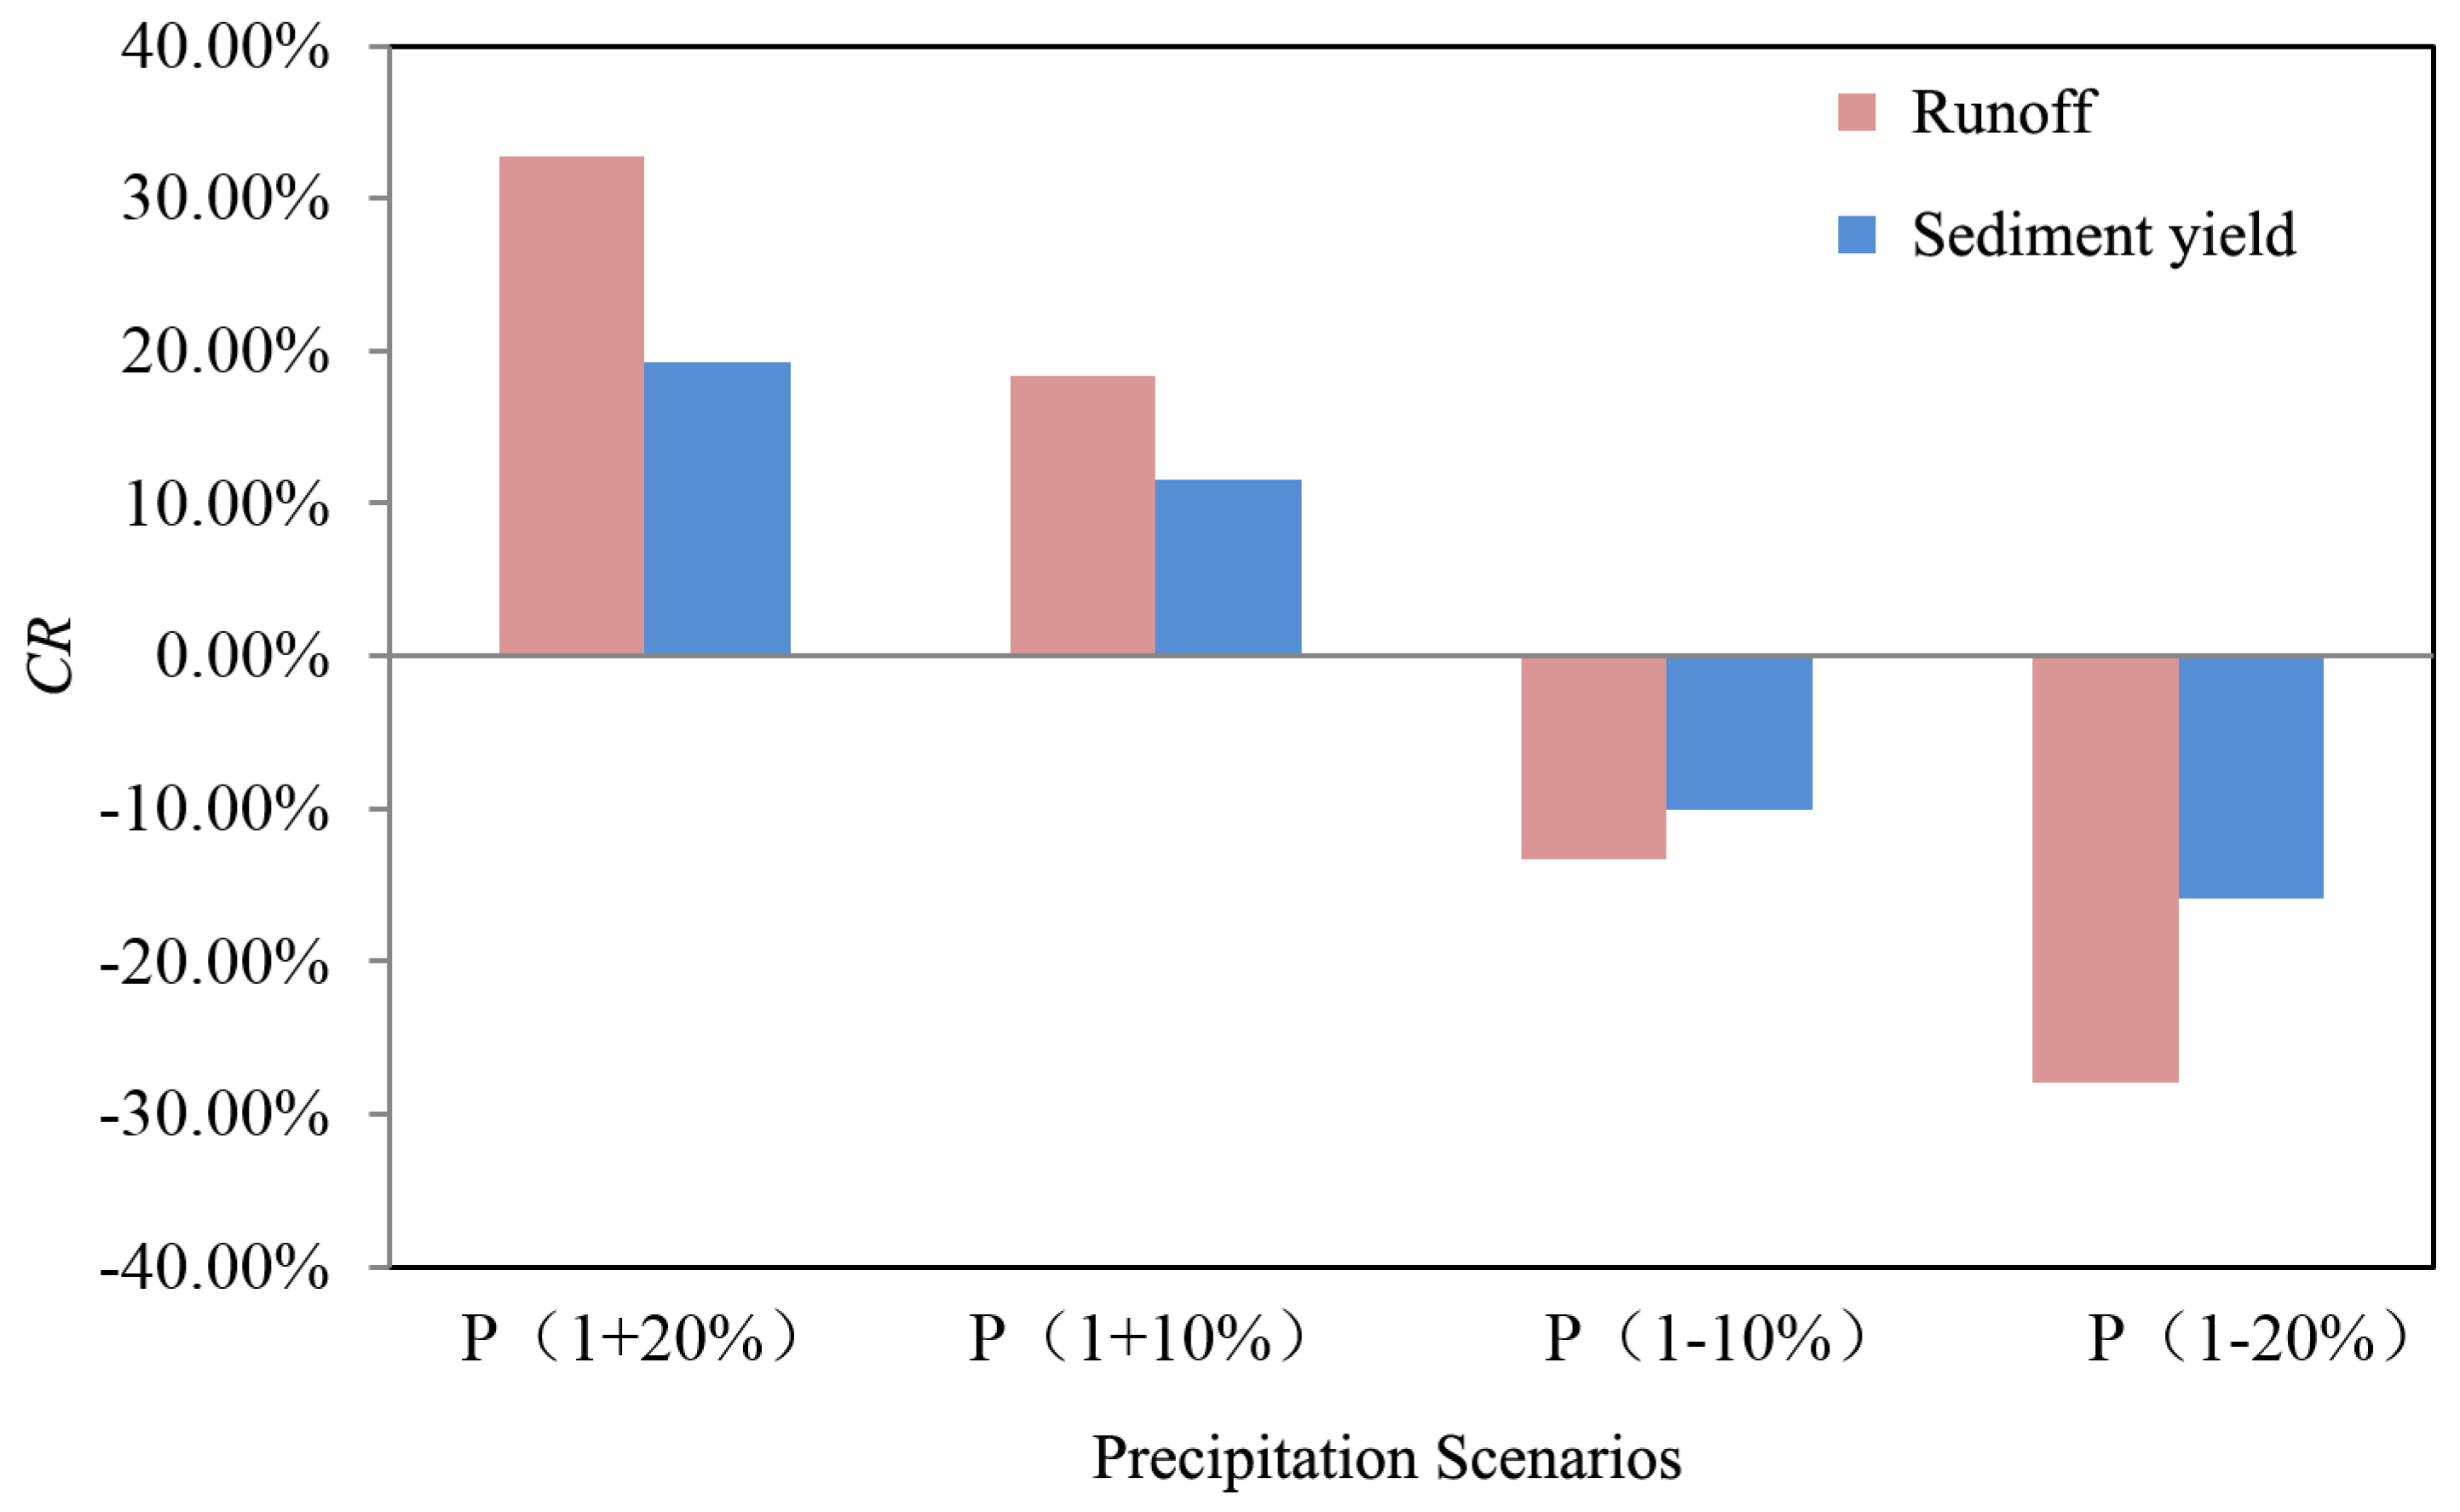
- The runoff and sediment yield increase with increasing precipitation and decrease with decreasing precipitation, which is consistent with the actual situation. Precipitation has a direct impact on runoff, and sediment is transported by runoff. Therefore, the trends of the changes in the precipitation, runoff, and sediment are similar.
- (2)
- When precipitation increases by 10%, the runoff and sediment yield increase by 18.36% and 11.54%, respectively. When precipitation decreases by 10%, the runoff and sediment yield decrease by 13.36% and 10.05%, respectively. The increases in the runoff and sediment yield are greater than the decreases in the runoff and sediment yield. The change in the runoff with precipitation is greater than the change in the sediment yield with precipitation. Therefore, precipitation has a more significant impact on the runoff than the sediment yield. The runoff generated by precipitation is only one of several factors that affect sediment production and sediment production may also be affected by other factors, such as vegetation cover, soil bulk density and land use changes.
- (3)
- When precipitation increases by 20%, the runoff and sediment yield increase by 32.7% and 19.20%, respectively. Thus, water resources will become relatively abundant when the annual precipitation intensity is relatively high, so it will be necessary to focus on preventing floods and sediment loss. When precipitation decreases by 20%, the runoff and sediment yield decrease by 27.9% and 15.88%, respectively. In these cases, water resources will be relatively scarce and it is necessary to take measures to prevent and combat droughts.

4. Discussion
5. Conclusions
Acknowledgments
Author Contributions
Conflicts of Interest
References
- Allen, M.R.; Ingram, W.J. Constrains on future changes in climate and the hydrologic cycle. Nature 2002, 419, 224–232. [Google Scholar] [CrossRef] [PubMed]
- Oki, T.; Kanae, S. Global hydrological cycles and world water resources. Science 2006, 313, 1068–1072. [Google Scholar] [CrossRef] [PubMed]
- Dong, L.H.; Xiong, L.H.; Yu, K.X.; Li, S. Research advances in effects of climate change and human activities on hydrology. Adv. Water Sci. 2012, 2, 278–285. (In Chinese) [Google Scholar]
- Trenberth, K.E. Conceptual framework for changes of extremes of the hydrological cycle with climate change. In Weather and Climate Extremes—Changes, Variations and a Perspective from the Insurance Industry; Springer Netherlands: Dordrecht, The Netherlands, 1999; pp. 327–339. [Google Scholar]
- Zhang, J.Y.; Wang, G.Q. Research on Impacts of Climate Change on Hydrology and Water Resources; Science Press: Beijing, China, 2007. (In Chinese) [Google Scholar]
- Piao, S.L.; Ciais, P.; Huang, Y.; Shen, Z.; Peng, S.; Li, J.; Zhou, L.; Liu, H.; Ma, Y.; Ding, Y.; et al. The impacts of climate change on water resources and agriculture in China. Nature 2010, 467, 43–51. [Google Scholar] [CrossRef] [PubMed]
- Barnett, T.P.; Adam, J.C.; Lettenmaier, D.P. Potential impacts of a warming climate on water availability in snow-dominated regions. Nature 2005, 438, 303–309. [Google Scholar] [CrossRef] [PubMed]
- IPCC. Climate Change 2007: Impacts, Adaptation and Vulnerability Contribution of Working Group 11 to the Fourth Assessment Report of the Intergovernmental Panel on Climate Change; Cambridge University: Cambridge, UK; New York, NY, USA, 2007. [Google Scholar]
- Li, F.P.; Zhang, G.X.; Dong, L.Q. Studies for impact of climate change on hydrology and water resources. Sci. Geogr. Sin. 2013, 4, 457–464. [Google Scholar]
- Song, X.M.; Zhang, J.Y.; Zhan, C.S.; Liu, C.Z. Review for impacts of climate change and human activities on water cycle. China J. Hydrol. 2013, 44, 779–790. (In Chinese) [Google Scholar]
- Xia, J.; Liu, C.Q.; Ren, G.Y. Opportunity and challenge of the climate change impact on the water resources of China. Adv. Earth Sci. 2011, 1, 1–12. [Google Scholar]
- Wang, G.Q.; Zhang, J.Y.; Liu, J.F.; Jin, J.L.; Liu, C.S. The sensitivity of runoff to climate change in different climatic regions in China. Adv. Water Sci. 2011, 3, 307–314. (In Chinese) [Google Scholar]
- Arnold, J.G.; Williams, J.R.; Srinivasan, R.; King, K.W. The Soil and Water Assessment Tool (SWAT) User’s Manual; USDA-ARS: Temple, TX, USA, 1995. [Google Scholar]
- Eckhardt, K.; Ulbrich, U. Potential impacts of climate change on groundwater recharge and streamflow in a central European low mountain range. J. Hydrol. 2003, 284, 244–252. [Google Scholar] [CrossRef]
- Ficklin, D.L.; Luo, Y.Z.; Luedeling, E.; Zhang, M. Climate change sensitivity assessment of a highly agricultural watershed using SWAT. J. Hydrol. 2009, 374, 16–29. [Google Scholar] [CrossRef]
- Xu, Z.X.; Zuo, D.P.; Tang, F.F. Response of Water Cycle to Future Climate Change in Typical Watershed in the Yellow River Basin; Press of Hehai University: Nanjing, China, 2012; pp. 37–49. (In Chinese) [Google Scholar]
- Githui, F.; Gitau, W.; Mutuab, F.; Bauwens, W. Climate change impact on SWAT simulated streamflow in Western Kenya. Int. J. Climatol. 2009, 29, 1823–1834. [Google Scholar] [CrossRef]
- Yu, L.; Gu, J.; Li, J.X.; Zhu, X.J. A Study of hydrologic responses to climate change in medium scale basin based on SWAT. Bull. Water Soil Conserv. 2008, 28, 152–154. (In Chinese) [Google Scholar]
- Bekele, E.G.; Knapp, H.V. Watershed Modeling to Assessing Impacts of Potential Climate Change on Water Supply Availability. Water Resour. Manag. 2010, 24, 3299–3320. [Google Scholar] [CrossRef]
- Zhu, C.H.; Li, Y.K. Long-term hydrological impacts of land use/land cover change from 1984 to 2010 in the Little River Watershed, Tennessee. Int. Soil Water Conserv. Res. 2014, 2, 11–22. [Google Scholar] [CrossRef]
- Nowak, K.; Hoerling, M.; Rajagopalan, B.; Zagona, E. Colorado River Basin Hydro-climatic Variability. J. Clim. 2012, 25, 4389–4403. [Google Scholar] [CrossRef]
- Fan, Y.T.; Chen, Y.N.; Li, W.H.; Wang, H.J.; Li, X.G. Impacts of temperature and precipitation on runoff in the Tarim River during the past 50 years. J. Arid Land 2011, 3, 220–230. [Google Scholar] [CrossRef]
- Cayan, D.R.; Dettinger, M.D.; Kammerdiener, S.A.; Caprio, J.M.; Peterson, D.H. Changes in the onset of spring in the western United States. Bull. Am. Meteorol. Soc. 2001, 82, 399–416. [Google Scholar] [CrossRef]
- Colman, R. A comparison of climate feedbacks in general circulation models. Clim. Dynam. 2003, 20, 865–873. [Google Scholar]
- Liu, Q.; Yang, Z.; Cui, B. Spatial and temporal variability of annual precipitation during 1961–2006 in Yellow River Basin, China. J. Hydrol. 2008, 361, 330–338. [Google Scholar] [CrossRef]
- Lu, X.X. Vulnerability of water discharge of large Chinese rivers to environmental changes: An overview. Reg. Environ. Chang. 2004, 4, 182–191. [Google Scholar] [CrossRef]
- Wei, W.; Chen, L.; Fu, B.; Chen, J. Water erosion response to rainfall and land use in different drought-level years in a loess hilly area of China. Catena 2010, 81, 24–31. [Google Scholar] [CrossRef]
- Miao, C.Y.; Ni, J.R.; Borthwick, A.G.L.; Yang, L. A preliminary estimate of human and natural contributions to the changes in water discharge and sediment load in the Yellow River. Glob. Plenary Chang. 2011, 76, 196–205. [Google Scholar] [CrossRef]
- Miao, C.Y.; Ni, J.R.; Borthwick, A.G.L. Recent changes of water discharge and sediment load in the Yellow River basin, China. Phys. Geogr. 2010, 34, 541–561. [Google Scholar] [CrossRef]
- Ren, Z.P.; Zhang, G.H.; Yang, Q.K. Characteristics of runoff and sediment variation in the Yanhe River Basin in last 50 years. J. China Hydrol. 2012, 32, 81–86. (In Chinese) [Google Scholar]
- Sui, J.; He, Y.; Liu, C. Changes in sediment transport in the Kuye River in the Loess Plateau in China. Int. J. Sediment Res. 2009, 24, 201–213. [Google Scholar] [CrossRef]
- Li, Z.; Liu, W.Z.; Zhang, X.C.; Zheng, F.L. Impacts of land use change and climate variability on hydrology in an agricultural catchment on the Loess Plateau of China. J. Hydrol. 2009, 377, 35–42. [Google Scholar] [CrossRef]
- Luo, H.M.; Li, T.H.; Ni, J.R.; Wang, Y.D. Water Demand for Ecosystem Protection in River with Hyper-concentrated Sediment-laden Flow. Sci. China Ser. E 2004, 47, 186–198. [Google Scholar] [CrossRef]
- Saxton, K.E. Soil Water Characteristics Hydraulic Properties Calculator [EB/OL]. Available online: http://www.bsyse.wsu.edu/saxton/soilwater (accessed on 20 March 2004).
- Saxton, K.E.; Willey, P.H.; Rawls, W.J. Field and pond hydrologic analyses with the SPAW model. In Proceedings of the Annual International Meeting of American Society of Agricultural and Biological Engineers, Portland, OR, USA, 9–12 July 2006; pp. 1–13.
- Gao, Y.; Li, T.H. Responses of runoff and sediment yield to LUCC with SWAT model: A case study in the Xichuan River Basin, China. Sustain. Environ. Res. 2015, 25, 27–35. [Google Scholar]
- Bai, Y.M. Effect of returning farmland to forests to benefit of soil and water conservation in Xichuanhe River basin. J. Water Resour. Water Eng. 2011, 22, 176–178. (In Chinese) [Google Scholar]
- Liu, K.W. River Systems in Yanan City; Press of Yan’An Education College: Yan’an, China, 2000. (In Chinese) [Google Scholar]
- USDA (United States Department of Agriculture). Urban Hydrology for Small Watersheds: TR-55; No. 210-VI-TR-55; Government Printing Office: Washington, DC, USA, 1986.
- Williams, J.; Nearing, M.; Nicks, A.; Skidmore, E.; Valentin, C.; King, K.; Savabi, R. Using soil erosion models for global change studies. J. Soil Water Conserv. 1996, 51, 381–385. [Google Scholar]
- Chiew, F.H.S.; McMahon, T.A. The applicability of Morton’s and Penman’s evapotranspiration estimates in rainfall-runoff modelling. Water Resour. Bull. 1991, 27, 611–620. [Google Scholar] [CrossRef]
- Williams, J.R. Flood routing with variable travel time or variable storage coefficients. Trans. ASAE 1969, 12, 100–103. [Google Scholar] [CrossRef]
- Van Griensven, A.; Meixner, T.; Grunwald, S.; Bishop, T.; Diluzio, M.; Srinivasan, R. A global sensitivity analysis tool for the parameters of multi-variable catchment models. J. Hydrol. 2006, 324, 10–23. [Google Scholar] [CrossRef]
- Nagelkerke, N.J.D. A Note on a General Definition of the Coefficient of determination. Biometrika 1991, 78, 691–692. [Google Scholar] [CrossRef]
- Quinlan, J.R. Learning with continuous classes. In Proceedings of the AI’92, the 5th Australian Joint Conference on Artificial Intelligence, Tasmania, Australia, 16–18 November 1992; Adams, A., Sterling, L., Eds.; World Scientific: Singapore, 1992; pp. 343–348. [Google Scholar]
- Nash, J.E.; Sutcliffe, J.V. River flow forecasting through conceptual models. Part I—A discussion of principles. J. Hydrol. 1970, 10, 282–290. [Google Scholar] [CrossRef]
- Yue, B.J.; Shi, Z.H.; Fang, N.F. Evaluation of rainfall erosivity and its temporal variation in the Yanhe River catchment of the Chinese Loess Plateau. Nat. Hazards 2014, 74, 585–602. [Google Scholar] [CrossRef]
- Fu, B.J.; Wang, Y.F.; Lu, Y.H.; He, C.H.; Chen, L.D.; Song, C.J. The effects of land-use combinations on soil erosion: A case study in the Loess Plateau of China. Prog. Phys. Geogr. 2009, 33, 793–804. [Google Scholar] [CrossRef]
- Zhu, L.Q.; Zhu, W.B. Research on effects of land use/cover change on soil erosion. Adv. Mater. Res. 2012, 433, 1038–1043. [Google Scholar] [CrossRef]
- Zeng, Y.; Wei, L. Impacts of Climate and Land Use Changes on Runoff and Sediment Yield in Sichuan Purple Hilly Area. Bull. Water Soil Conserv. 2013, 33, 1–6. (In Chinese) [Google Scholar]
- Xia, Z.H.; Zhou, Y.H.; Xu, H.M. Water resources responses to climate changes in Hanjiang River basin based on SWAT model. Resour. Environ. Yangtze Basin 2010, 19, 158–163. (In Chinese) [Google Scholar]
© 2015 by the authors; licensee MDPI, Basel, Switzerland. This article is an open access article distributed under the terms and conditions of the Creative Commons Attribution license (http://creativecommons.org/licenses/by/4.0/).
Share and Cite
Li, T.; Gao, Y. Runoff and Sediment Yield Variations in Response to Precipitation Changes: A Case Study of Xichuan Watershed in the Loess Plateau, China. Water 2015, 7, 5638-5656. https://doi.org/10.3390/w7105638
Li T, Gao Y. Runoff and Sediment Yield Variations in Response to Precipitation Changes: A Case Study of Xichuan Watershed in the Loess Plateau, China. Water. 2015; 7(10):5638-5656. https://doi.org/10.3390/w7105638
Chicago/Turabian StyleLi, Tianhong, and Yuan Gao. 2015. "Runoff and Sediment Yield Variations in Response to Precipitation Changes: A Case Study of Xichuan Watershed in the Loess Plateau, China" Water 7, no. 10: 5638-5656. https://doi.org/10.3390/w7105638