
Bayesian Network Modeling to Improve Water Pricing Practices in Northwest China

Abstract
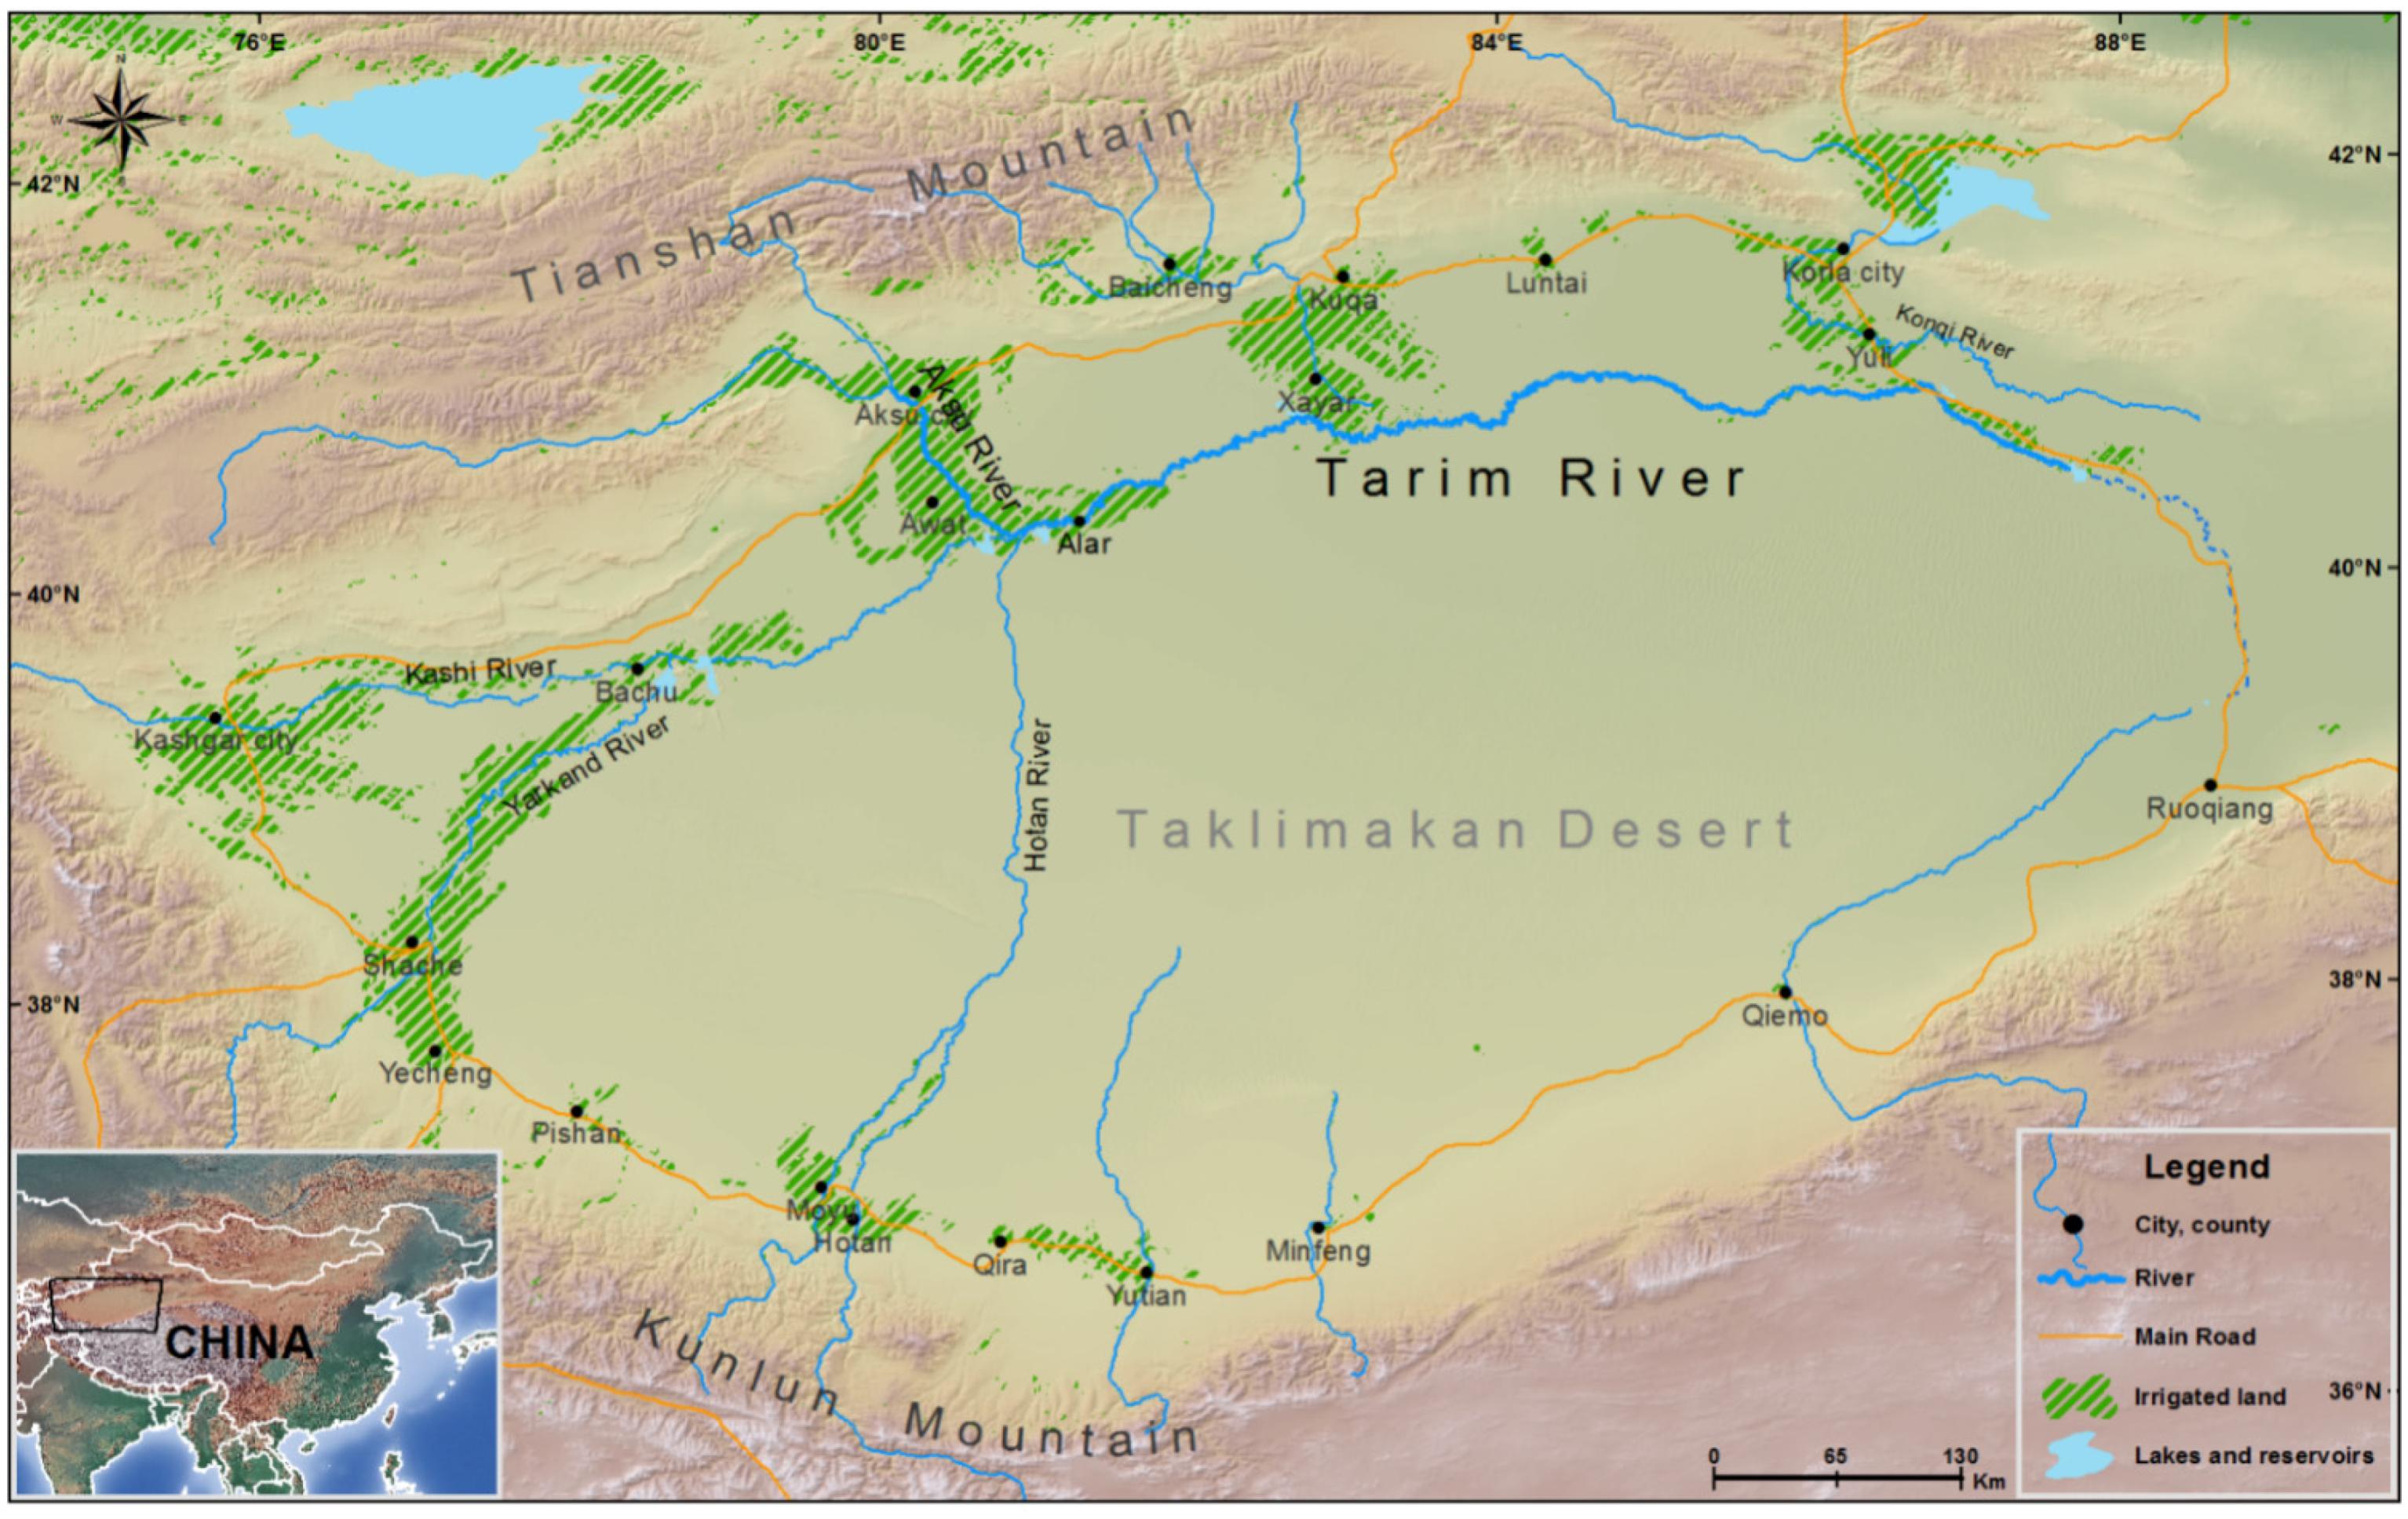
:1. Introduction

2. Materials and Methods
2.1. Bayesian Networks
2.2. Model Development Process

| Modeling Process | Objectives | Date | Format | Participants | No. Participants | Data Type |
|---|---|---|---|---|---|---|
| Define the problem and context |
| July 2011 | Group discussions | Research team | 3 | Expert knowledge |
| Identify the variables and indicators |
| August 2011 | Workshop | Local experts | 13 | Expert knowledge |
| Design the preliminary network |
| August 2012 | Face-to-face interview and workshop | Local experts | 6 + 15 | Expert knowledge |
| Gather relevant data | Collect and analyze the relevant data from all sources | March 2013 | Face-to-face interview | Local experts, water authorities | 17 | Expert knowledge, empirical data |
| Construct and populate the CPT |
| April 2013 | -- | -- | -- | -- |
| Evaluate and validate the network |
| April 2013 | Workshop | Local experts, water authorities | 19 | Expert knowledge |
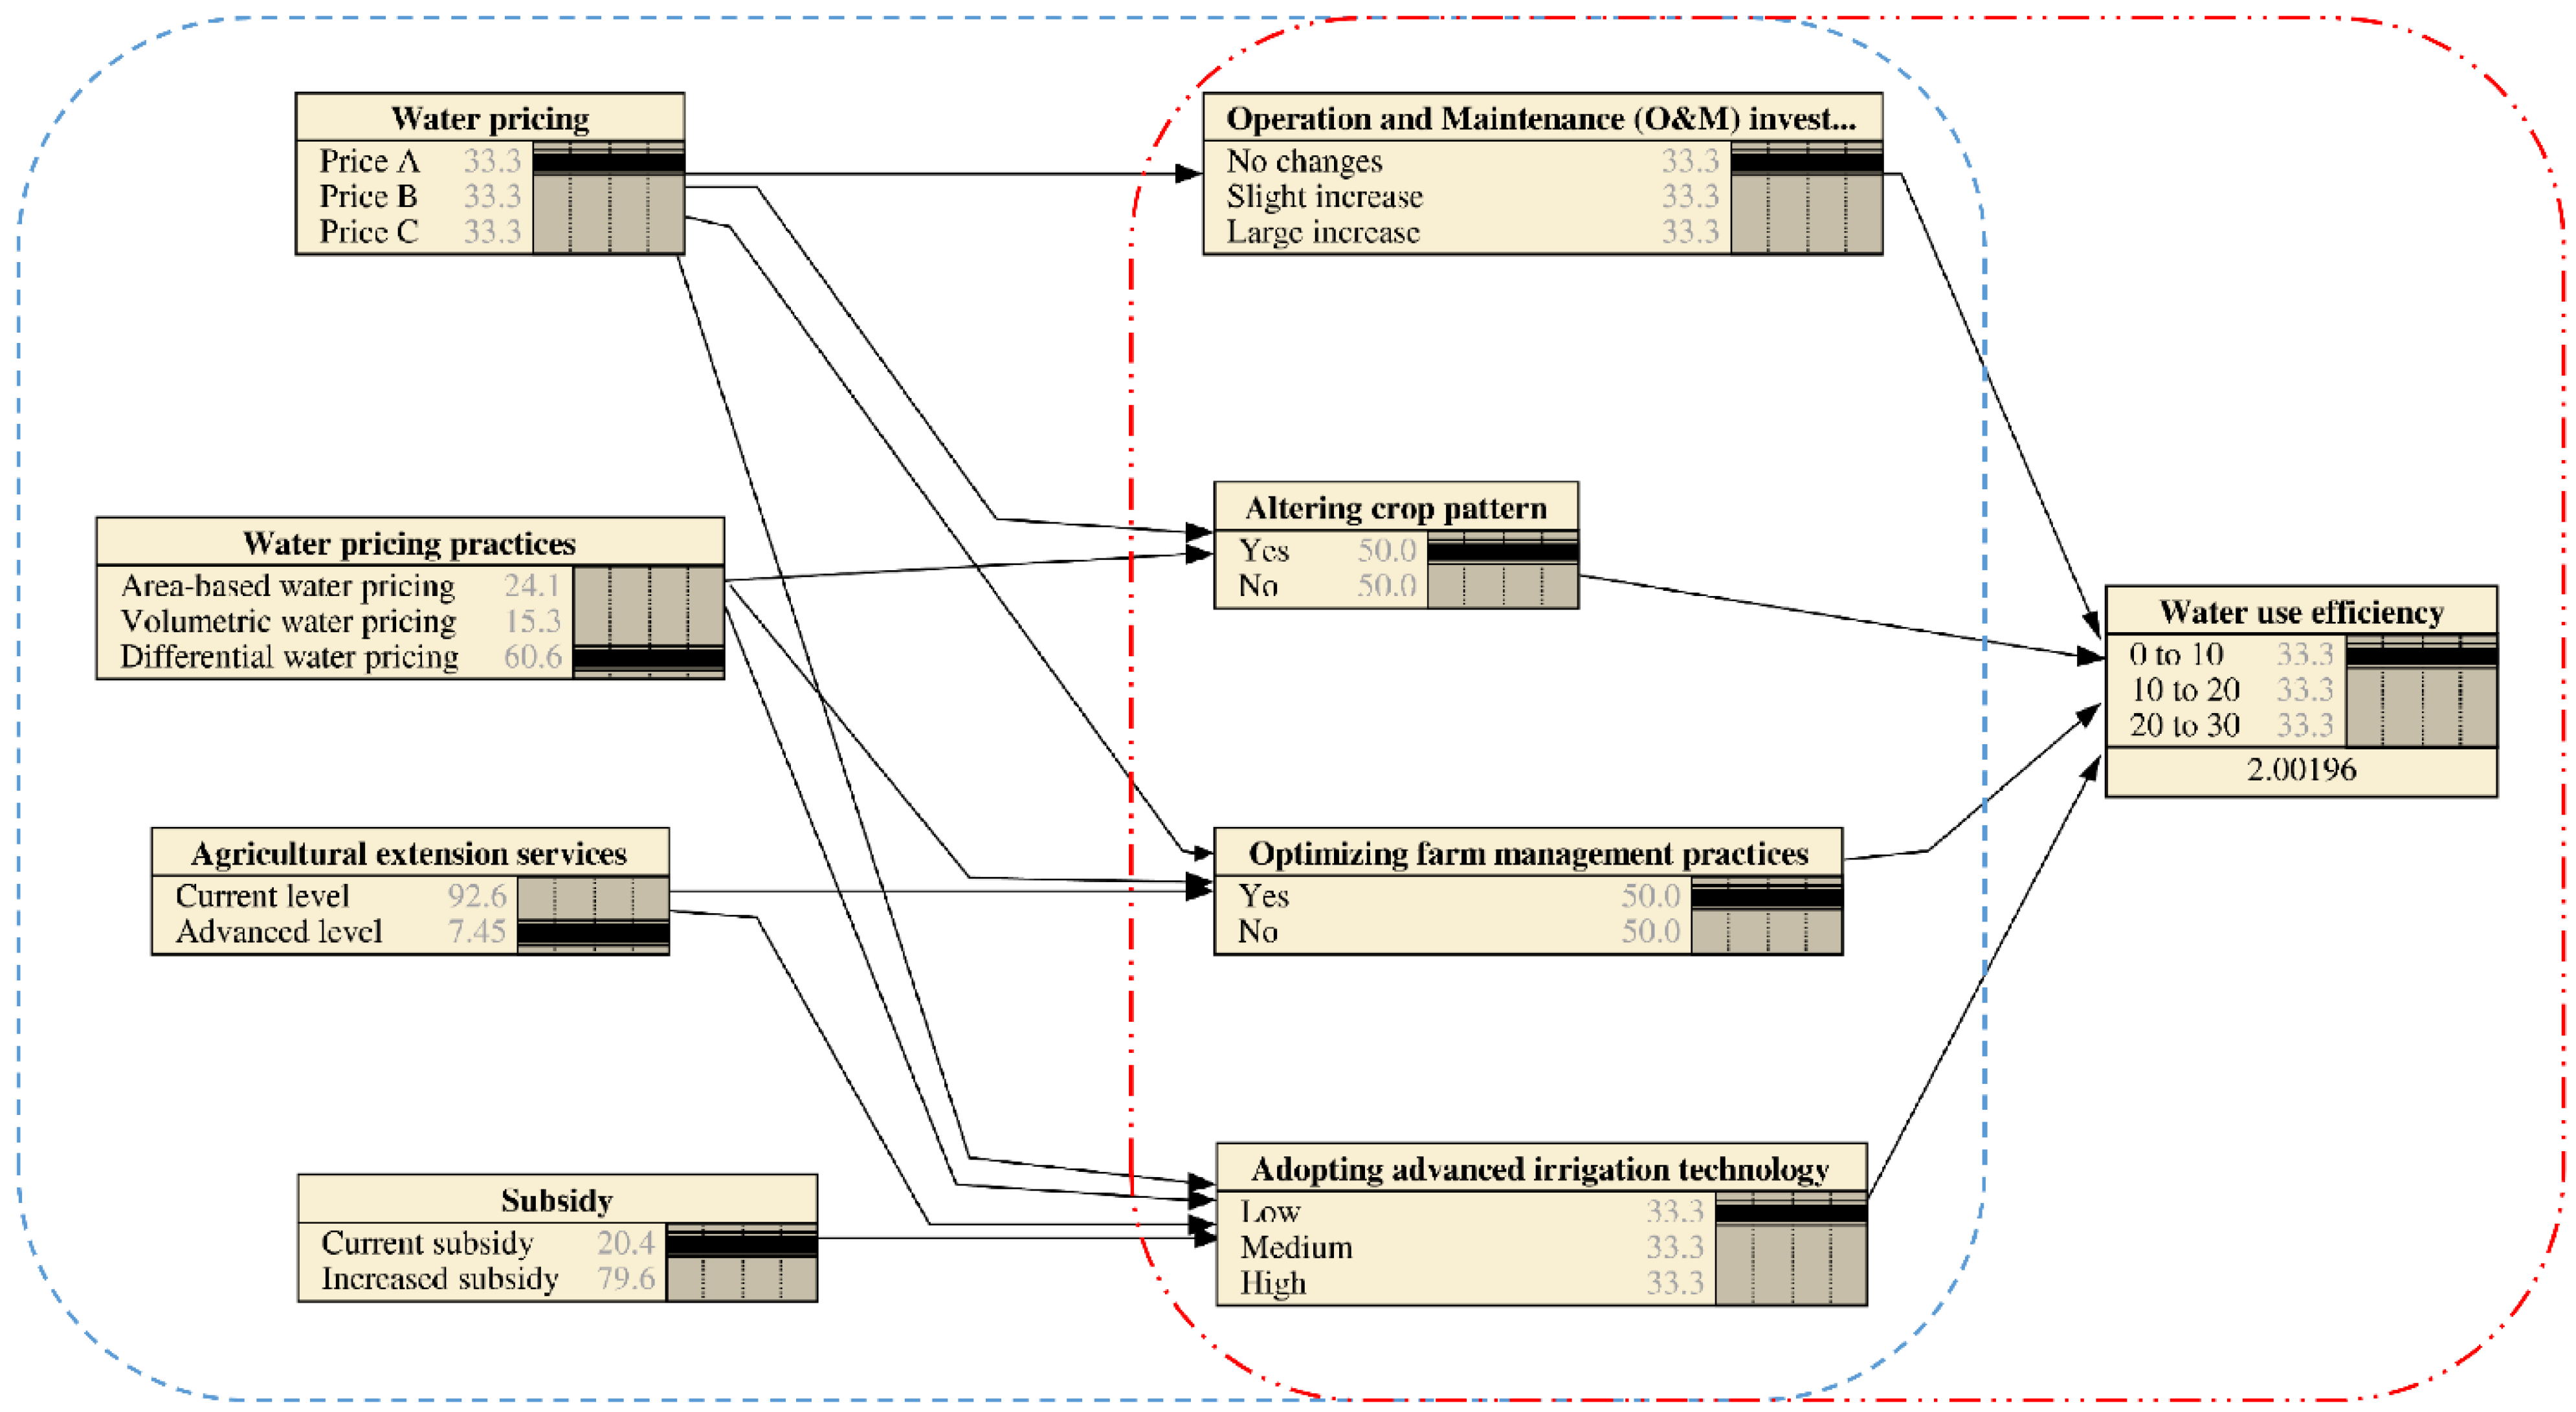
2.3. Construction of Networks

| Variables | States | Description |
|---|---|---|
| Water pricing | Price A (1500 RMB/ha; 0.18 RMB/m3; 0.18 RMB/m3 for standard consumption, 0.36 RMB/m3 for surplus consumption) | Increased water price levels based on the government’s policy documents. Prices listed as follows (area-based water price; volumetric water price; differential water price); Price A equals an increase of 25%, Price B of 50%, Price C of 100%, all compared to current prices. |
| Price B (1800 RMB/ha; 0.22 RMB/m3; 0.22 RMB/m3 for standard consumption, 0.44 RMB/m3 for surplus consumption) | ||
| Price C (2400 RMB/ha; 0.3 RMB/m3; 0.3 RMB/m3 for standard consumption, 0.6 RMB/m3 for surplus consumption) | ||
| Water pricing practices | Area-based water pricing (ABWP) | Water pricing practices determine the methods of charging the water fee; ABWP: per unit irrigated area; VWP: per volume of water used; DWP considers a low price below a certain threshold of water consumption, and a significantly higher WP when the threshold is exceeded. |
| Volumetric water pricing (VWP) | ||
| Differential water pricing (DWP) | ||
| Agricultural extension services | Current level | Training farmers with regards to good crop management practices and advanced technologies to improve yield levels, resource use efficiency and profits. |
| Advanced level | ||
| Subsidy | Current subsidy | Subsidizing agricultural producers for implementing advanced irrigation technology and converting from flood irrigation to sprinkler irrigation or drip irrigation. |
| Increased subsidy | ||
| Operation and Maintenance (O & M) investment | No change | Investments for running the water supply system including planning, construction, monitoring, and repair of water storage and distribution infrastructure as well as planning and distribution of water resources. |
| Slight increase | ||
| Large increase | ||
| Altering crop pattern | Yes | Shifting towards crops with higher water productivity. |
| No | ||
| Optimizing farm management practices | Yes | Improving farm management practices to increase yields and minimize water losses. |
| No | ||
| Adopting advanced irrigation technology | Low | Adapting advanced irrigation technology such as sprinkler irrigation or drip irrigation. |
| Medium | ||
| High | ||
| Water use efficiency | Increased by 0%–10% | WUE in agriculture is defined as the economic yield of crops produced per unit of water; the three states correspond to low, medium, and high levels of increase in WUE. |
| Increased by 10%–20% | ||
| Increased by 20%–30% |
2.4. Data Collection
| Institutions | Institution Type | No. of Participants |
|---|---|---|
| Xinjiang Uyghur Autonomous Region Provincial Department of Water Resources | Regional Government | 2 |
| Xinjiang Institute of Ecology and Geography | Research Institution | 1 |
| Xinjiang Institute of Water Resources and Hydropower Research | Research Institution | 1 |
| Xinjiang Academy of Forestry Sciences | Research Institution | 1 |
| Xinjiang University | University | 2 |
| Xinjiang Agricultural University | University | 4 |
| Xinjiang Financial University | University | 1 |
| Tarim River Basin Management Bureau | River Basin Authority | 2 |
| Tarim River Basin Aksu River Management Bureau | River Basin Authority | 2 |
| Xinjiang Tarim University | University | 3 |
2.5. Scenario Management
| Scenario | Water Pricing | Water Pricing Practices | Subsidy | Agricultural Extension Services | Probability Value for Increase in WUE | Probability Change for Increase in WUE | ||||
|---|---|---|---|---|---|---|---|---|---|---|
| 0%–10% | 10%–20% | 20%–30% | 0%–10% | 10%–20% | 20%–30% | |||||
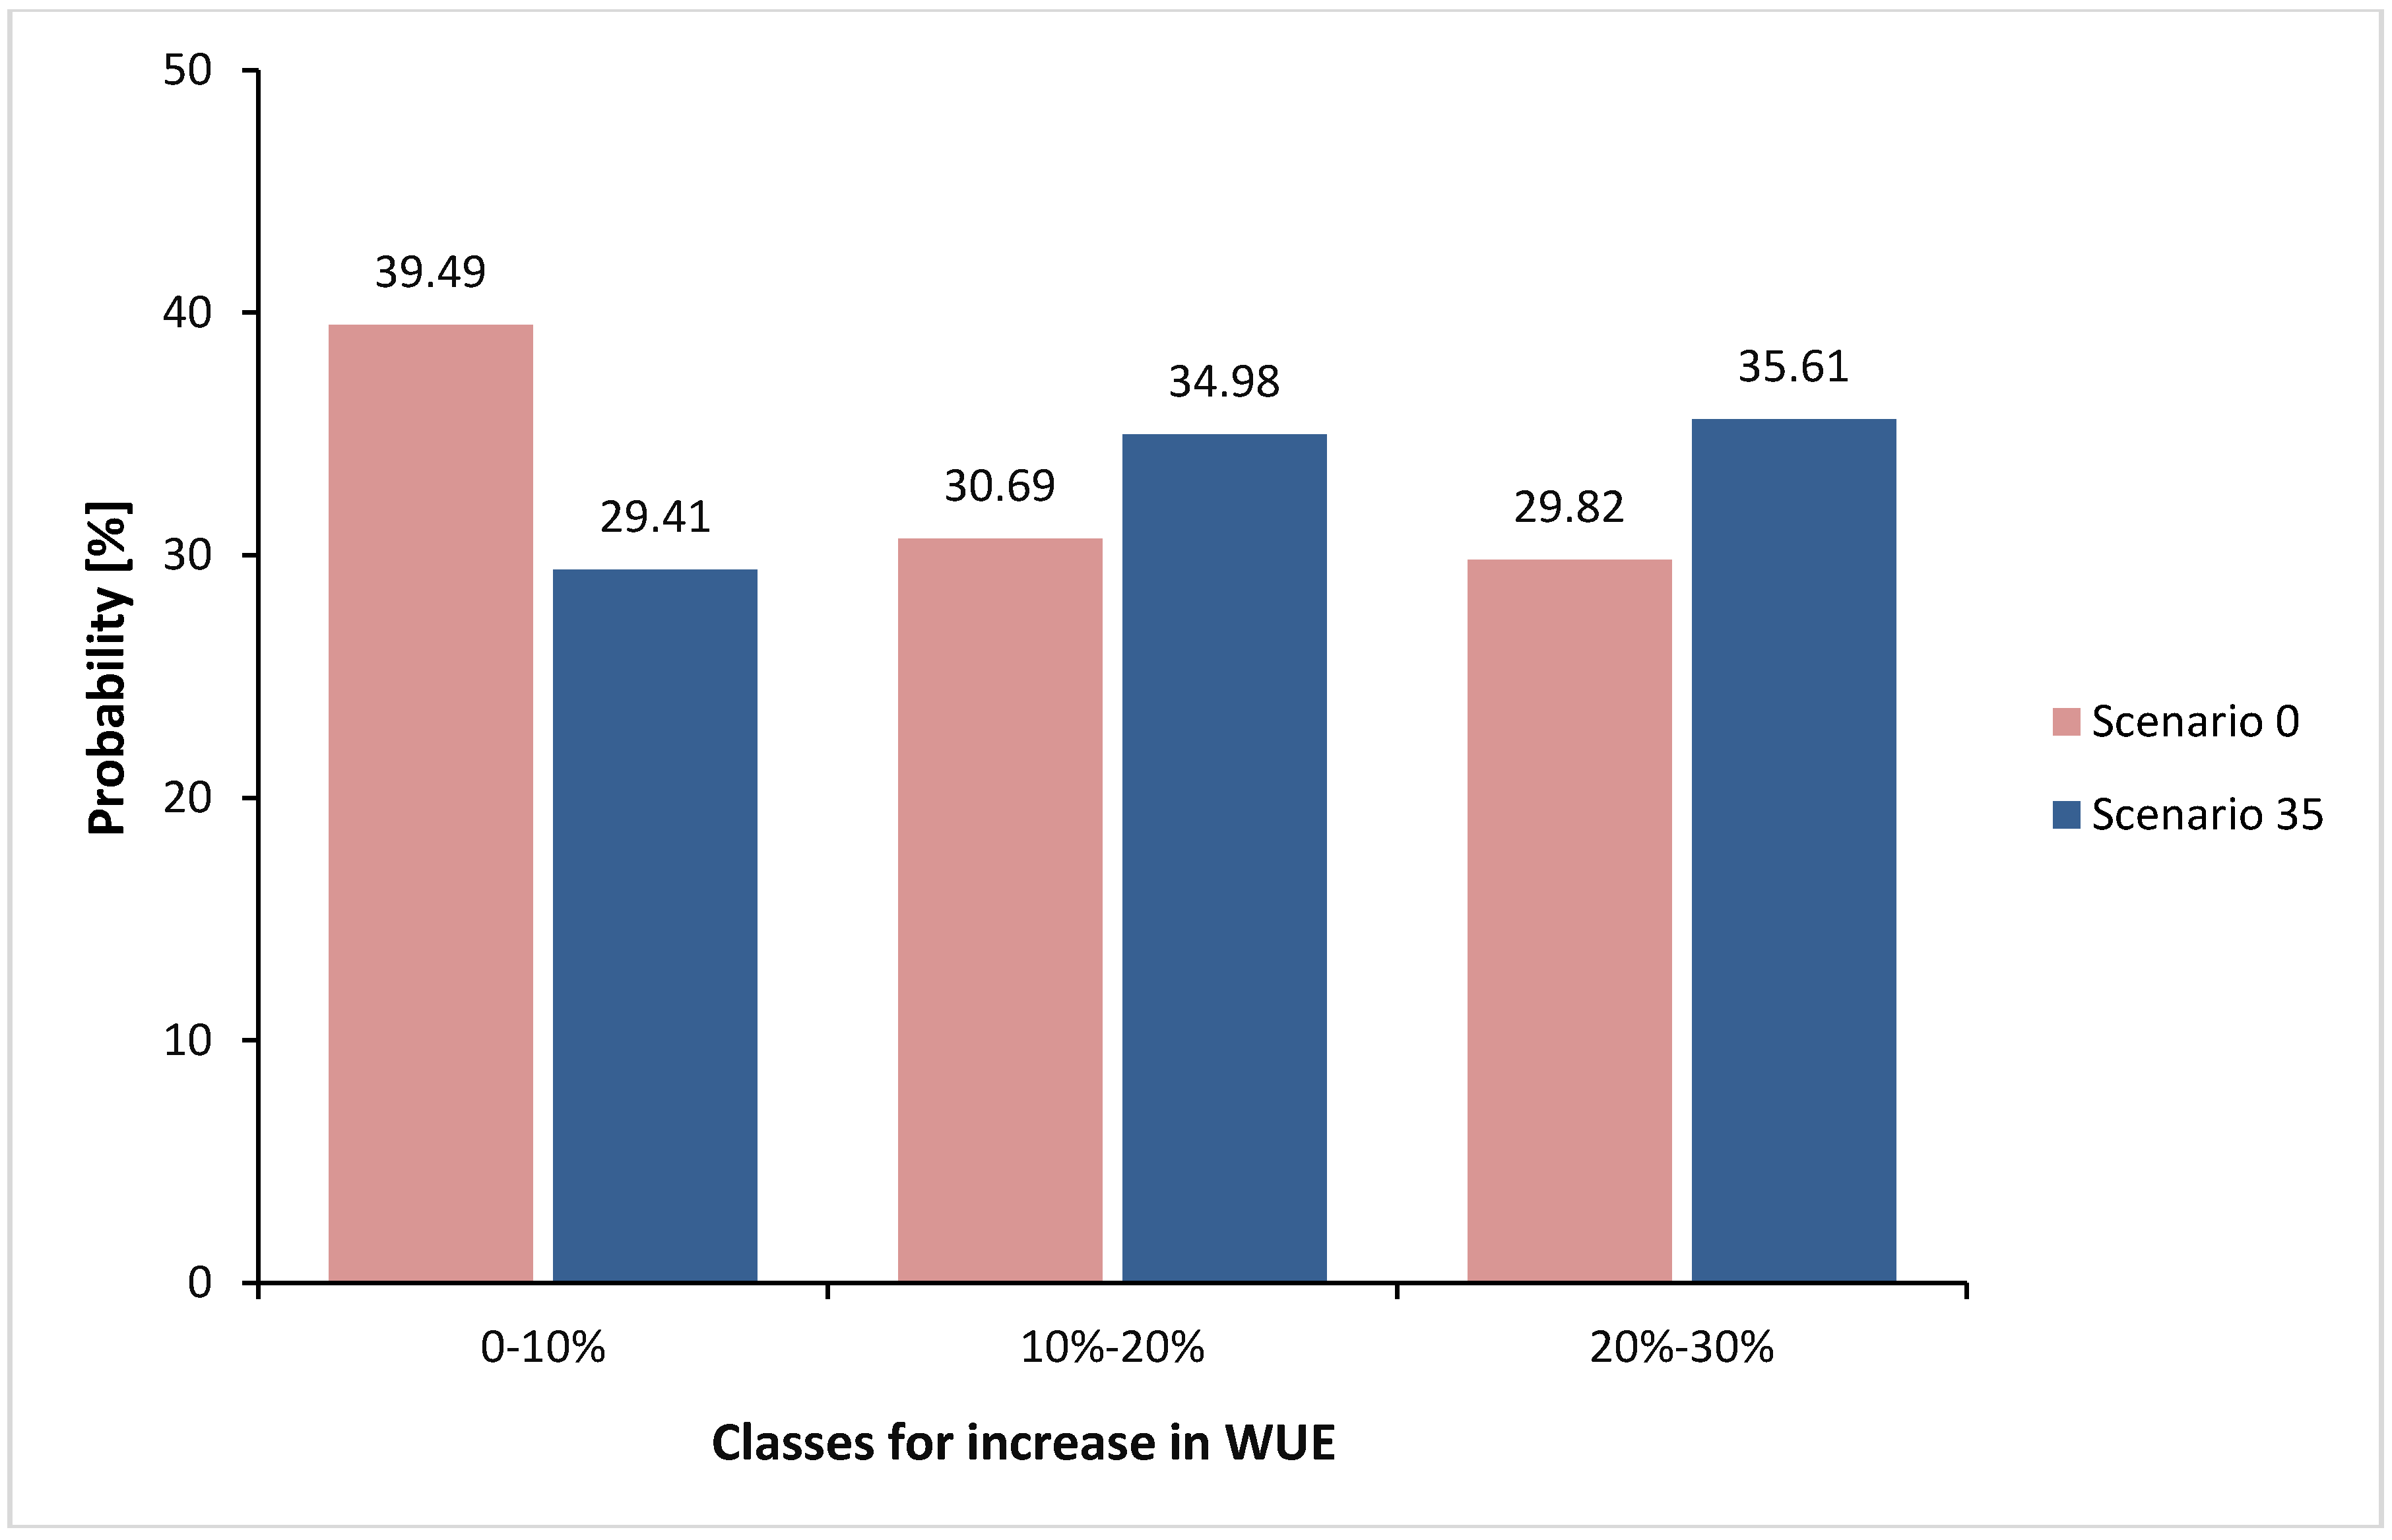
| Scenario 0 | Price A | ABWP | Current subsidy | Current level | 39.49 | 30.69 | 29.82 | -- | -- | -- |
| Scenario 1 | Price B | ABWP | Current subsidy | Current level | 34.20 | 33.73 | 32.07 | −5.29 | 3.04 | 2.25 |
| Scenario 2 | Price C | ABWP | Current subsidy | Current level | 31.19 | 34.70 | 34.11 | −8.3 | 4.01 | 4.29 |
| Scenario 3 | Price A | VWP | Current subsidy | Current level | 37.93 | 31.46 | 30.61 | −1.56 | 0.77 | 0.79 |
| Scenario 4 | Price B | VWP | Current subsidy | Current level | 33.27 | 33.96 | 32.77 | −6.22 | 3.27 | 2.95 |
| Scenario 5 | Price C | VWP | Current subsidy | Current level | 30.80 | 34.68 | 34.52 | −8.69 | 3.99 | 4.7 |
| Scenario 6 | Price A | DWP | Current subsidy | Current level | 37.33 | 31.87 | 30.80 | −2.16 | 1.18 | 0.98 |
| Scenario 7 | Price B | DWP | Current subsidy | Current level | 32.90 | 33.99 | 33.11 | −6.59 | 3.3 | 3.29 |
| Scenario 8 | Price C | DWP | Current subsidy | Current level | 29.83 | 34.96 | 35.21 | −9.66 | 4.27 | 5.39 |
| Scenario 9 | Price A | ABWP | Current subsidy | Advanced level | 37.67 | 31.84 | 30.49 | −1.82 | 1.15 | 0.67 |
| Scenario 10 | Price B | ABWP | Current subsidy | Advanced level | 33.44 | 34.03 | 32.53 | −6.05 | 3.34 | 2.71 |
| Scenario 11 | Price C | ABWP | Current subsidy | Advanced level | 30.84 | 34.96 | 34.20 | −8.65 | 4.27 | 4.38 |
| Scenario 12 | Price A | ABWP | Increased subsidy | Current level | 35.49 | 33.33 | 31.18 | −4 | 2.64 | 1.36 |
| Scenario 13 | Price B | ABWP | Increased subsidy | Current level | 32.53 | 34.60 | 32.87 | −6.96 | 3.91 | 3.05 |
| Scenario 14 | Price C | ABWP | Increased subsidy | Current level | 30.67 | 34.90 | 34.43 | −8.82 | 4.21 | 4.61 |
| Scenario 15 | Price A | ABWP | Increased subsidy | Advanced level | 34.71 | 33.67 | 31.62 | −4.78 | 2.98 | 1.8 |
| Scenario 16 | Price B | ABWP | Increased subsidy | Advanced level | 31.98 | 34.73 | 33.29 | −7.51 | 4.04 | 3.47 |
| Scenario 17 | Price C | ABWP | Increased subsidy | Advanced level | 30.18 | 34.92 | 34.90 | −9.31 | 4.23 | 5.08 |
| Scenario 18 | Price A | VWP | Current subsidy | Advanced level | 36.58 | 32.30 | 31.12 | −2.91 | 1.61 | 1.3 |
| Scenario 19 | Price B | VWP | Current subsidy | Advanced level | 32.82 | 34.15 | 33.03 | −6.67 | 3.46 | 3.21 |
| Scenario 20 | Price C | VWP | Current subsidy | Advanced level | 30.53 | 34.74 | 34.73 | −8.96 | 4.05 | 4.91 |
| Scenario 21 | Price A | VWP | Increased subsidy | Current level | 34.96 | 33.44 | 31.60 | −4.53 | 2.75 | 1.78 |
| Scenario 22 | Price B | VWP | Increased subsidy | Current level | 32.07 | 34.57 | 33.36 | −7.42 | 3.88 | 3.54 |
| Scenario 23 | Price C | VWP | Increased subsidy | Current level | 30.31 | 34.88 | 34.81 | −9.18 | 4.19 | 4.99 |
| Scenario 24 | Price A | VWP | Increased subsidy | Advanced level | 34.50 | 33.61 | 31.89 | −4.99 | 2.92 | 2.07 |
| Scenario 25 | Price B | VWP | Increased subsidy | Advanced level | 31.85 | 34.58 | 33.57 | −7.64 | 3.89 | 3.75 |
| Scenario 26 | Price C | VWP | Increased subsidy | Advanced level | 30.14 | 34.87 | 34.99 | −9.35 | 4.18 | 5.17 |
| Scenario 27 | Price A | DWP | Current subsidy | Advanced level | 36.23 | 32.56 | 31.21 | −3.26 | 1.87 | 1.39 |
| Scenario 28 | Price B | DWP | Current subsidy | Advanced level | 32.60 | 34.08 | 33.32 | −6.89 | 3.39 | 3.5 |
| Scenario 29 | Price C | DWP | Current subsidy | Advanced level | 29.68 | 34.96 | 35.36 | −9.81 | 4.27 | 5.54 |
| Scenario 30 | Price A | DWP | Increased subsidy | Current level | 34.18 | 33.81 | 32.01 | −5.31 | 3.12 | 2.19 |
| Scenario 31 | Price B | DWP | Increased subsidy | Current level | 31.77 | 34.51 | 33.72 | −7.72 | 3.82 | 3.9 |
| Scenario 32 | Price C | DWP | Increased subsidy | Current level | 29.57 | 35.01 | 35.42 | −9.92 | 4.32 | 5.6 |
| Scenario 33 | Price A | DWP | Increased subsidy | Advanced level | 33.95 | 33.77 | 32.28 | −5.54 | 3.08 | 2.46 |
| Scenario 34 | Price B | DWP | Increased subsidy | Advanced level | 31.65 | 34.49 | 33.86 | −7.84 | 3.8 | 4.04 |
| Scenario 35 | Price C | DWP | Increased subsidy | Advanced level | 29.41 | 34.98 | 35.61 | −10.08 | 4.29 | 5.79 |
2.6 Validation of the Model
3. Results and Discussion
3.1. Impacts of Water Pricing on WUE (Scenarios 0–2)
3.2. Impacts of Water Pricing and Changes in Water Pricing Practices on WUE (Scenarios 3–8)
3.3. Impacts of Water Pricing and Agricultural Policy Intervention on WUE (Scenarios 9–14)
3.3.1. Impacts of Advancing Agricultural Extension Services (Scenarios 9–11)
3.3.2. Impacts of Increasing Subsidies (Scenarios 12–14)
3.4. Comparison of Baseline and Most Promising Scenario (Scenarios 0 & 35)
3.5. Challenges and Limitations of the Participatory BN Modeling Approach
4. Conclusions
Acknowledgments
Author Contributions
Conflicts of Interest
References
- Huang, X.; Chen, Y.; Ma, J.; Hao, X. Research of the sustainable development of Tarim River based on ecosystem service function. Procedia Environ. Sci. 2011, 10, 239–246. [Google Scholar] [CrossRef]
- Han, S.; Hu, H.; Yang, D.; Liu, Q. Differences in changes of potential evaporation in the mountainous and oasis regions of the Tarim basin, northwest China. Sci. China Ser. E Technol. Sci. 2009, 52, 1981–1989. [Google Scholar] [CrossRef]
- Thevs, N. Water scarcity and allocation in the Tarim Basin: Decision structures and adaptations on the local level. J. Curr. Chin. Aff. 2011, 40, 113–137. [Google Scholar]
- De La Paix, M.J.; Lanhai, L.I.; Jiwen, G.E.; de Dieu, H.J.; Theoneste, N. Analysis of snowmelt model for flood forecast for water in arid zone: Case of Tarim River in Northwest China. Environ. Earth Sci. 2012, 66, 1423–1429. [Google Scholar] [CrossRef]
- National Bureau of Statistics of China. China’s Statistical Yearbook; China Statistical Press: Beijing, China, 2013. [Google Scholar]
- Feike, T.; Mamitimin, Y.; Li, L.; Doluschitz, R. Development of agricultural land and water use and its driving forces along the Aksu and Tarim River, P.R. China. Environ. Earth Sci. 2014, 73, 517–531. [Google Scholar] [CrossRef]
- Leiwen, J.; Yufen, T.; Zhijie, Z.; Tianhong, L.; Jianhua, L. Water resources, land exploration and population dynamics in arid areas—The case of the Tarim River Basin in Xinjiang of China. Popul. Environ. 2005, 26, 471–503. [Google Scholar] [CrossRef]
- Zhao, R.; Chen, Y.; Zhou, H.; Li, Y.; Qian, Y.; Zhang, L. Assessment of wetland fragmentation in the Tarim River basin, western China. Environ. Geol. 2009, 57, 455–464. [Google Scholar] [CrossRef]
- Rumbaur, C.; Thevs, N.; Disse, M.; Ahlheim, M.; Brieden, A.; Cyffka, B.; Doluschitz, R.; Duethmann, D.; Feike, T.; Frör, O.; et al. Sustainable management of river oases along the Tarim River in North-Western China under conditions of climate change. Earth Syst. Dynam. Discuss. 2014, 5, 1221–1273. [Google Scholar] [CrossRef]
- Peng, H.; Thevs, N.; Ott, K. Water Distribution in the Perspectives of Stakeholders and Water Users in the Tarim River Catchment, Xinjiang, China. JWARP 2014, 6, 543–555. [Google Scholar] [CrossRef]
- Nian, Z. Water Supply Cost Calculation Results and Analysis of Xinjiang Water Conservancy Project in 2010; Xinjiang Uyghur Autonomous Region Provincial Department of Water Resources: Urumqi, China, 2012.
- Xinjiang Uygur Autonomous Region Management Method of Water Supply Price in the Water Conservancy Project, 2002. Available online: http://www.xjdrc.gov.cn/copy_4_copy_10_second.jsp?urltype=news.NewsContentUrl&wbtreeid=11305&wbnewsid=203718 (accessed on 10 December 2014).
- Chen, Y.; Xu, C.; Chen, Y.; Liu, Y.; Li, W. Progress, challenges and prospects of Eco-hydrological studies in the Tarim river basin of Xinjiang, China. Environ. Manag. 2013, 51, 138–153. [Google Scholar] [CrossRef] [PubMed]
- Hailiang, X.; Mao, Y.; Yudong, S. The dynamic variation of water resources and its tendency in the Tarim River Basin. J. Geogr. Sci. 2005, 15, 467–474. [Google Scholar] [CrossRef]
- XUAR People’s Government’s Comments on Promoting the Development of Water Conservation Reform, 2013. Available online: http://www.xjslt.gov.cn/zwgk/flfg/gfxwj/2013/28079.htm (accessed on 10 December 2014).
- Tsur, Y.; Dinar, A. The relative efficiency and implementation costs of alternative methods for pricing irrigation water. World Bank Econ. Rev. 1997, 11, 243–262. [Google Scholar] [CrossRef]
- Abu-Zeid, M.A. Water pricing in irrigated agriculture. Int. J. Water Resour. Dev. 2001, 17, 527–538. [Google Scholar] [CrossRef]
- Dinar, A.; Subramanian, A. Policy implications from water pricing experiences in various countries. Water Policy 1998, 1, 239–250. [Google Scholar] [CrossRef]
- Schoengold, K.; Sunding, D.L.; Moreno, G. Price elasticity reconsidered: Panel estimation of an agricultural water demand function. Water Resour. Res. 2006, 42. [Google Scholar] [CrossRef]
- Molle, F.; Venot, J.P.; Hassan, Y. Irrigation in the Jordan Valley: Are water pricing policies overly optimistic? Agric. Water Manag. 2008, 95, 427–438. [Google Scholar] [CrossRef]
- Tardieu, H.; Préfol, B. Full cost or “sustainability cost” pricing in irrigated agriculture. Charging for water can be effective, but is it sufficient? Irrig. Drain. 2002, 51, 97–107. [Google Scholar] [CrossRef]
- Liao, Y.; Giordano, M.F.; de Fraiture, C. An empirical analysis of the impacts of irrigation pricing reforms in China. Water Policy 2007, 9, 45–60. [Google Scholar] [CrossRef]
- Lohmar, B.; Wang, J.; Rozelle, S.; Huang, J.; Dawe, D. China’s Agricultural Water Policy Reforms: Increasing Investment, Resolving Conflicts, and Revising Incentives; United States Department of Agriculture, Economic Research Service: Washington, DC, USA, 2003.
- Schuck, E.C.; Green, G.P. Conserving one water source at the expense of another: The role of surface water price in adoption of wells in a conjunctive use system. Int. J. Water Resour. Dev. 2003, 19, 55–66. [Google Scholar] [CrossRef]
- Liao, Y.; Gao, Z.; Bao, Z.; Huang, Q.; Feng, G.; Xu, D.; Cai, J.; Han, H.; Wu, W. China’s Water Pricing Reforms for Irrigation: Effectiveness and Impact; International Water Management Institute (IWMI): Colombo, Sri Lanka, 2008. [Google Scholar]
- Moore, M.R.; Gollehon, N.R.; Carey, M.B. Multicrop Production Decisions in Western Irrigated Agriculture: The Role of Water Price. Am. J. Agric. Econ. 1994, 76, 859–874. [Google Scholar] [CrossRef]
- Scheierling, S.M.; Young, R.A.; Cardon, G.E. Determining the price-responsiveness of demands for irrigation water deliveries versus consumptive use. J. Agric. Resour. Econ. 2004, 328–345. [Google Scholar]
- Albiac, J.; Playán, E.; Martínez, Y. Instruments for water quantity and quality management in the agriculture of Aragon. Water Resour. Dev. 2007, 23, 147–164. [Google Scholar] [CrossRef]
- Berbel, J.; Gómez-Limón, J.A. The impact of water-pricing policy in Spain: An analysis of three irrigated areas. Agric. Water Manag. 2000, 43, 219–238. [Google Scholar] [CrossRef]
- Doppler, W.; Salman, A.Z.; Al-Karablieh, E.K.; Wolff, H.P. The impact of water price strategies on the allocation of irrigation water: The case of the Jordan Valley. Agric. Water Manag. 2002, 55, 171–182. [Google Scholar] [CrossRef]
- Frija, A.; Wossink, A.; Buysse, J.; Speelman, S.; van Huylenbroeck, G. Pricing policies and impact on water demand in Tunisia: A DEA-based methodology for estimation of individual input demand functions. J. Environ. Manag. 2011, 92, 2109–2118. [Google Scholar] [CrossRef] [PubMed]
- Stijn, S.; Jeroen, B.; Stefano, F.; Aymen, F.; Marijke, D.; Luc, D. Estimating the impacts of water pricing on smallholder irrigators in North West Province, South Africa. Agric. Water Manag. 2009, 96, 1560–1566. [Google Scholar]
- Mamitimin, Y.; Feike, T.; Seifert, I.; Doluschitz, R. Irrigation in the Tarim Basin, China: Farmers’ response to changes in water pricing practices. Environ. Earth Sci. 2014, 73, 559–569. [Google Scholar] [CrossRef] [Green Version]
- Abu-Madi, M.O. Farm-level perspectives regarding irrigation water prices in the Tulkarm district, Palestine. Agric. Water Manag. 2009, 96, 1344–1350. [Google Scholar] [CrossRef]
- Chellattan Veettil, P.; Speelman, S.; Frija, A.; Buysse, J.; Mondelaers, K.; van Huylenbroeck, G. Price Sensitivity of Farmer Preferences for Irrigation Water-Pricing Method: Evidence from a Choice Model Analysis in Krishna River Basin, India. J. Water Resour. Plan. Manag. 2011, 137, 205–214. [Google Scholar] [CrossRef]
- Garcia, S.; Reynaud, A. Estimating the benefits of efficient water pricing in France. Resour. Energy Econ. 2004, 26, 1–25. [Google Scholar] [CrossRef]
- Uusitalo, L. Advantages and challenges of Bayesian networks in environmental modelling. Ecol. Model. 2007, 203, 312–318. [Google Scholar] [CrossRef]
- Grêt-Regamey, A.; Brunner, S.H.; Altwegg, J.; Bebi, P. Facing uncertainty in ecosystem services-based resource management. J. Environ. Manag. 2013, 127, S145–S154. [Google Scholar] [CrossRef] [PubMed]
- Rositano, F.; Ferraro, D.O. Ecosystem services provided by agroecosystems: A qualitative and quantitative assessment of this relationship in the Pampa Region, Argentina. Environ. Manag. 2014, 53, 606–619. [Google Scholar] [CrossRef] [PubMed]
- Richards, R.G.; Sanò, M.; Roiko, A.H.; Carter, R.W.; Bussey, M.; Matthews, J.; Smith, T. Bayesian belief modeling of climate change impacts for informing regional adaptation options. Environ. Model. Softw. 2013, 44, 113–121. [Google Scholar] [CrossRef]
- Mantyka-Pringle, C.S.; Martin, T.G.; Moffatt, D.B.; Linke, S.; Rhodes, J.R. Understanding and predicting the combined effects of climate change and land-use change on freshwater macroinvertebrates and fish. J. Appl. Ecol. 2014, 51, 572–581. [Google Scholar] [CrossRef]
- Keshtkar, A.R.; Salajegheh, A.; Sadoddin, A.; Allan, M.G. Application of Bayesian networks for sustainability assessment in catchment modeling and management (Case study: The Hablehrood river catchment). Ecol. Model. 2013, 268, 48–54. [Google Scholar] [CrossRef]
- Barton, D.N.; Saloranta, T.M.; Moe, S.J.; Eggestad, H.O.; Kuikka, S. Bayesian belief networks as a meta-modelling tool in integrated river basin management—Pros and cons in evaluating nutrient abatement decisions under uncertainty in a Norwegian river basin. Ecol. Econ. 2008, 66, 91–104. [Google Scholar] [CrossRef]
- Shenton, W.; Hart, B.T.; Chan, T. A Bayesian network approach to support environmental flow restoration decisions in the Yarra River, Australia. Stoch. Environ. Res. Risk Assess. 2014, 28, 57–65. [Google Scholar] [CrossRef]
- Farmani, R.; Henriksen, H.J.; Savić, D.A. An evolutionary Bayesian belief network methodology for optimum management of groundwater contamination. Environ. Model. Softw. 2009, 24, 303–310. [Google Scholar] [CrossRef]
- Portoghese, I.; D'Agostino, D.R.; Giordano, R.; Scardigno, A.; Apollonio, C.; Vurro, M. An integrated modelling tool to evaluate the acceptability of irrigation constraint measures for groundwater protection. Environ. Model. Softw. 2013, 46, 90–103. [Google Scholar] [CrossRef]
- McCann, R.K.; Marcot, B.G.; Ellis, R. Bayesian belief networks: Applications in ecology and natural resource management. Can. J. For. Res. 2006, 36, 3053–3062. [Google Scholar] [CrossRef]
- Landuyt, D.; Broekx, S.; D'Hondt, R.; Engelen, G.B.; Aertsens, J.; Goethals, P.L. A review of Bayesian belief networks in ecosystem service modelling. Environ. Model. Softw. 2013, 46, 1–11. [Google Scholar] [CrossRef]
- Ye, M.; Xu, H.; Song, Y. The utilization of water resources and its variation tendency in Tarim River Basin. Chin. Sci. Bull. 2006, 51, 16–24. [Google Scholar] [CrossRef]
- Song, Y.; Wang, R.; Peng, Y. Water resources and ecological conditions in the Tarim Basin. Sci. China Ser. D Earth Sci. 2002, 45, 11–17. [Google Scholar] [CrossRef]
- Sun, P.; Zhang, Q.; Lu, X.; Bai, Y. Changing properties of low flow of the Tarim River basin: Possible causes and implications. Quat. Int. 2012, 282, 78–86. [Google Scholar] [CrossRef]
- Xu, J.; Chen, Y.; Li, W.; Dong, S. Long-term trend and fractal of annual runoff process in mainstream of Tarim River. Chin. Geogr. Sci. 2008, 18, 77–84. [Google Scholar] [CrossRef]
- Zhao, R.; Chen, Y.; Shi, P.; Zhang, L.; Pan, J.; Zhao, H. Land use and land cover change and driving mechanism in the arid inland river basin: A case study of Tarim River, Xinjiang, China. Environ. Earth Sci. 2013, 68, 591–604. [Google Scholar] [CrossRef]
- Shi, Y.; Wang, R.; Fan, L.; Li, J.; Yang, D. Analysis on land-use change and its demographic factors in the original-stream watershed of Tarim river based on GIS and statistic. Environ. Earth Sci. 2010, 2, 175–184. [Google Scholar] [CrossRef]
- Xu, C.; Chen, Y.; Chen, Y.; Zhao, R.; Ding, H. Responses of surface runoff to climate change and human activities in the arid region of Central Asia: A case study in the Tarim River Basin, China. Environ. Manag. 2013, 51, 926–938. [Google Scholar] [CrossRef] [PubMed]
- Zhang, Q.; Xu, C.; Tao, H.; Jiang, T.; Chen, Y. Climate changes and their impacts on water resources in the arid regions: A case study of the Tarim River basin, China. Stoch. Environ. Res. Risk Assess. 2010, 24, 349–358. [Google Scholar] [CrossRef]
- Zhou, H.; Zhang, X.; Xu, H.; Ling, H.; Yu, P. Influences of climate change and human activities on Tarim River runoffs in China over the past half century. Environ. Earth Sci. 2012, 67, 231–241. [Google Scholar] [CrossRef]
- Sun, Z.; Chang, N.; Opp, C.; Hennig, T.A. Evaluation of ecological restoration through vegetation patterns in the lower Tarim River, China with MODIS NDVI data. Ecol. Inform. 2011, 6, 156–163. [Google Scholar] [CrossRef]
- Chen, Y.; Chen, Y.; Xu, C.; Ye, Z.; Li, Z.; Zhul, C.; Ma, X. Effects of ecological water conveyance on groundwater dynamics and riparian vegetation in the lower reaches of Tarim River, China. Hydrol. Process. 2010, 24, 170–177. [Google Scholar] [CrossRef]
- Xu, H.; Ye, M.; Li, J. The water transfer effects on agricultural development in the lower Tarim River, Xinjiang of China. Agric. Water Manag. 2008, 95, 59–68. [Google Scholar] [CrossRef]
- Nielsen, T.D.; Jensen, F.V. Bayesian Networks and Decision Graphs; Springer Science & Business Media: New York, NY, USA, 2009. [Google Scholar]
- Pearl, J. Probabilistic Reasoning in Intelligent Systems: Networks of Plausible Inference, 2nd ed.; Morgan Kaufmann: San Francisco, CA, USA, 1998. [Google Scholar]
- Koski, T.; Noble, J.M. Bayesian Networks: An Introduction; Wiley: West Sussex, UK, 2009. [Google Scholar]
- Blitzstein, J.K.; Hwang, J. Introduction to Probability; CRC Press/Taylor & Francis Group: Boca Raton, FL, USA, 2015. [Google Scholar]
- Cain, J. Planning Improvements in Natural Resources Management: Guidelines for Using Bayesian Networks to Support the Planning Management of Development Programmes in the Water Sector and beyond; Centre for Ecology and Hydrology: Wallingford, UK, 2001. [Google Scholar]
- Marcot, B.G.; Steventon, J.D.; Sutherland, G.D.; McCann, R.K. Guidelines for developing and updating Bayesian belief networks applied to ecological modeling and conservation. Can. J. For. Res. 2006, 36, 3063–3074. [Google Scholar] [CrossRef]
- Bromley, J. Guidelines for the Use of Bayesian Networks as a Participatory Tool for Water Resource Management; Centre for Ecology and Hydrology: Wallingford, UK, 2005. [Google Scholar]
- Tsur, Y. Economic Aspects of Irrigation Water Pricing. Can. Water Resour. J. 2005, 30, 31–46. [Google Scholar] [CrossRef]
- Easter, K.W. Irrigation Investment, Technology and Management Strategies for Development; Westview Press: Boulder, CO, USA, 1986. [Google Scholar]
- Easter, K.W.; Liu, Y. Cost Recovery and Water Pricing for Irrigation and Drainage Projects; World Bank: Washington, DC, USA, 2005. [Google Scholar]
- Molle, F. Water scarcity, prices and quotas: A review of evidence on irrigation volumetric pricing. Irrig. Drain. Syst. 2009, 23, 43–58. [Google Scholar] [CrossRef]
- Just, R.E.; Netanyahu, S.; Horowitz, J.K. Water pricing and water allocation in Israel. J. Policy Reform 1999, 3, 97–119. [Google Scholar] [CrossRef]
- National Bureau of Statistics of China. XPCC Statistical Yearbook (2001–2012); China Statistical Press: Beijing, China, 2001–2012. [Google Scholar]
- Ministry of Water Resources, China. China Water Conservancy Statistical Yearbook 2010–2012; China Water Conservancy and Hydropower Press: Beijing, China, 2010–2012.
- Li, H.; Li, G.; Tian, C. The research on stint drip irrigation underside film for cotton production in the middle-lower reach of the Tarim river and the Peacock river. Agric. Res. Arid Areas 2006, 24, 82–84. [Google Scholar]
- Amayreh, J.A.; Abdulla, F.A.; Al-Ja’afreh, H. Impact of different water price levels on irrigated agriculture in Northern Jordan Valley. Irrig. Drain. Syst. 2011, 25, 307–321. [Google Scholar] [CrossRef]
- Vasileiou, K.Z.; Mitropoulos, P.; Mitropoulos, I. Optimizing the performance of irrigated agriculture in eastern England under different water pricing and regulation strategies. Nat. Resour. Model. 2014, 27, 128–150. [Google Scholar] [CrossRef]
- Singh, K. Rational pricing of water as an instrument of improving water use efficiency in the agricultural sector: A case study in Gujarat, India. Int. J. Water Resour. Dev. 2007, 23, 679–690. [Google Scholar] [CrossRef]
- Von Wirén-Lehr, S. Sustainability in agriculture—An evaluation of principal goal-oriented concepts to close the gap between theory and practice. Agric. Ecosyst. Environ. 2001, 84, 115–129. [Google Scholar] [CrossRef]
- Siew, T.-F.; Döll, P. Transdisciplinary research for supporting the inte-gration of ecosystem services into land and water management in the Tarim River Basin, Xinjiang, China. J. Arid Land 2012, 4, 196–210. [Google Scholar] [CrossRef]
- Van den Hoek, J.; Baumgartner, J.; Doucet-Beer, E.; Hildebrandt, T.; Robinson, B.E.; Zinda, J.A. Understanding the challenges and rewards of social-ecological research in China: Society & Natural Resources. Soc. Nat. Resour. 2012, 25, 1324–1329. [Google Scholar]
- Pollino, C.A.; Henderson, C. Bayesian Networks: A Guide for Their Application in Natural Resource Management and Policy; Landscape Logic: Tasmania, Australia, 2010; Volume 14. [Google Scholar]
- Duespohl, M.; Frank, S.; Döll, P. A review of Bayesian networks as a participatory modeling approach in support of sustainable environmental management. J. Sustain. Dev. 2012, 5. [Google Scholar] [CrossRef]
- Castelletti, A.; Soncini-Sessa, R. Bayesian networks and participatory modelling in water resource management: Bayesian networks in water resource modelling and management. Environ. Model. Softw. 2007, 22, 1075–1088. [Google Scholar] [CrossRef]
© 2015 by the authors; licensee MDPI, Basel, Switzerland. This article is an open access article distributed under the terms and conditions of the Creative Commons Attribution license (http://creativecommons.org/licenses/by/4.0/).
Share and Cite
Mamitimin, Y.; Feike, T.; Doluschitz, R. Bayesian Network Modeling to Improve Water Pricing Practices in Northwest China. Water 2015, 7, 5617-5637. https://doi.org/10.3390/w7105617
Mamitimin Y, Feike T, Doluschitz R. Bayesian Network Modeling to Improve Water Pricing Practices in Northwest China. Water. 2015; 7(10):5617-5637. https://doi.org/10.3390/w7105617
Chicago/Turabian StyleMamitimin, Yusuyunjiang, Til Feike, and Reiner Doluschitz. 2015. "Bayesian Network Modeling to Improve Water Pricing Practices in Northwest China" Water 7, no. 10: 5617-5637. https://doi.org/10.3390/w7105617