Article

Assessing Nonstationary Spatial Patterns of Extreme Droughts from Long-Term High-Resolution Observational Dataset on a Semiarid Basin (Spain)

by
Sandra G. Garcia Galiano
1,2,*,
Patricia Olmos Gimenez
1 and
Juan Diego Giraldo-Osorio
3
1
Department of Civil Engineering, R&D Group of Water Resources Management, Universidad Politécnica de Cartagena, Paseo Alfonso XIII, 52, Cartagena 30203, Spain
2
Department of Civil and Environmental Engineering, Center for Hydrometeorology & Remote Sensing, University of California, Irvine, CA 92617, USA
3
Departmento de Ingeniería Civil, Grupo de Investigación Ciencia e Ingeniería del Agua y el Ambiente, Facultad de Ingeniería, Pontificia Universidad Javeriana, Carrera 7 No. 40-62, Bogotá, Colombia
*
Author to whom correspondence should be addressed.
Water 2015, 7(10), 5458-5473; https://doi.org/10.3390/w7105458
Submission received: 9 August 2015 / Revised: 1 October 2015 / Accepted: 8 October 2015 / Published: 14 October 2015

Abstract

:
In basins of South-eastern Spain; such as the semiarid Segura River Basin (SRB), a strong decrease in runoff from the end of the 1970s has been observed. However, in the SRB the decreasing trend is not only related with climate variability and change, also with intensive reforestation aimed at halting desertification and erosion, whichever the reason is, the default assumption of stationarity in water resources systems cannot be guaranteed. Therefore there is an important need for improvement in the ability of monitoring and predicting the impacts associated with the change of hydrologic regimes. It is thus necessary to apply non-stationary probabilistic models, which are able to reproduce probability density functions whose parameters vary with time. From a high-resolution daily gridded rainfall dataset of more than five decades (1950−2007), the spatial distribution of lengths of maximum dry spells for several thresholds are assessed, applying Generalized Additive Models for Location Scale and Shape (GAMLSS) models at the grid site. Results reveal an intensification of extreme drought events in some headbasins of the SRB important for water supply. The identification of spatial patterns of drought hazards at basin scale, associated with return periods; contribute to designing strategies of drought contingency preparedness and recovery operations, which are the leading edge of adaptation strategies.

1. Introduction

Global warming has caused changes in rainfall patterns, and thus changes in the frequency and magnitude of extreme water events [1,2,3]. The vulnerability of society is increasing mainly due to several drivers (population growth, land use, and climate variability and change among others), with the consequent increase of water demands in the case of droughts and water scarcity conditions such as in Southern Europe. Hydrometeorological extremes are natural events, but with a social component. The risk associated with droughts (or floods) is the product of regional exposure to the event, as well as the vulnerability of society to it. The exposure of the region to hydrometeorological extremes presents a spatial component, therefore the knowledge about spatial distributions of frequency, severity, and duration of these events is important.
There is a need for improvement in the ability to monitor and predict the impacts associated with the change of hydrological regimes, considering the presumption of hydroclimatic non-stationarity [4]. The hydroclimatic variability implies probability density functions (PDF) whose parameters vary with time. Water management concerns are often focused on the tails of the probability distribution (extremes such as floods and droughts), but the ability to predict or detect change is most effective on the central tendency [5]. In the case of water supply, the lower tail of the PDFs is of interest. In this sense, the GAMLSS (Generalized Additive Models for Location, Scale and Shape) tools, proposed by [6], provide a framework for the non-stationary modelling of a time series.
In the present work, the drought hazard is assessed by the analysis of spatial patterns of maximum dry spells (MDS), or the maximum number of consecutive days with rainfall below a threshold, associated to return periods. The droughts are natural hazards [7], while the drought duration and intensity are directly proportional to the number of days without rainfall [8], or rainfall dry spells. In the present work, the region’s exposure to the drought hazard is evaluated from the spatial distribution of MDS associated to return periods. In the Mediterranean Spain, have established the relationship between the longest dry spells and the total rainfall depth [9]. Several authors [9,10,11], have studied the variability of rainfall and dry spells in the Iberian Peninsula, as well as in other parts of the world [12], applying PDFs in some cases but without considering non-stationary parameters. In some cases, the correlation of detected trends in rainfall time series or drought events was studied with macroclimate indexes such as the North Atlantic Oscillation (NAO) [13], even studying the impacts on water resources [14,15,16,17]. From these studies, the NAO is suggested as one of the main factors controlling the changes in the circulation patterns as well as the trends of rainfall in the Euro-Atlantic area.
The main purpose of the present paper is the assessment of spatial trends based on drought hazard at basin scale, considering non-stationarity modeling, based on long-term historical daily rainfall grids. The vulnerability of semiarid basins of Spain to rainfall variability implies uncertainties in agricultural activities, water supply, industry, energy, but also implies social and environment impacts. Increasing knowledge of plausible trends of drought events at basin scale is needed in order to take appropriate measures both to conserve aquatic ecosystems and to minimize impacts on water uses.

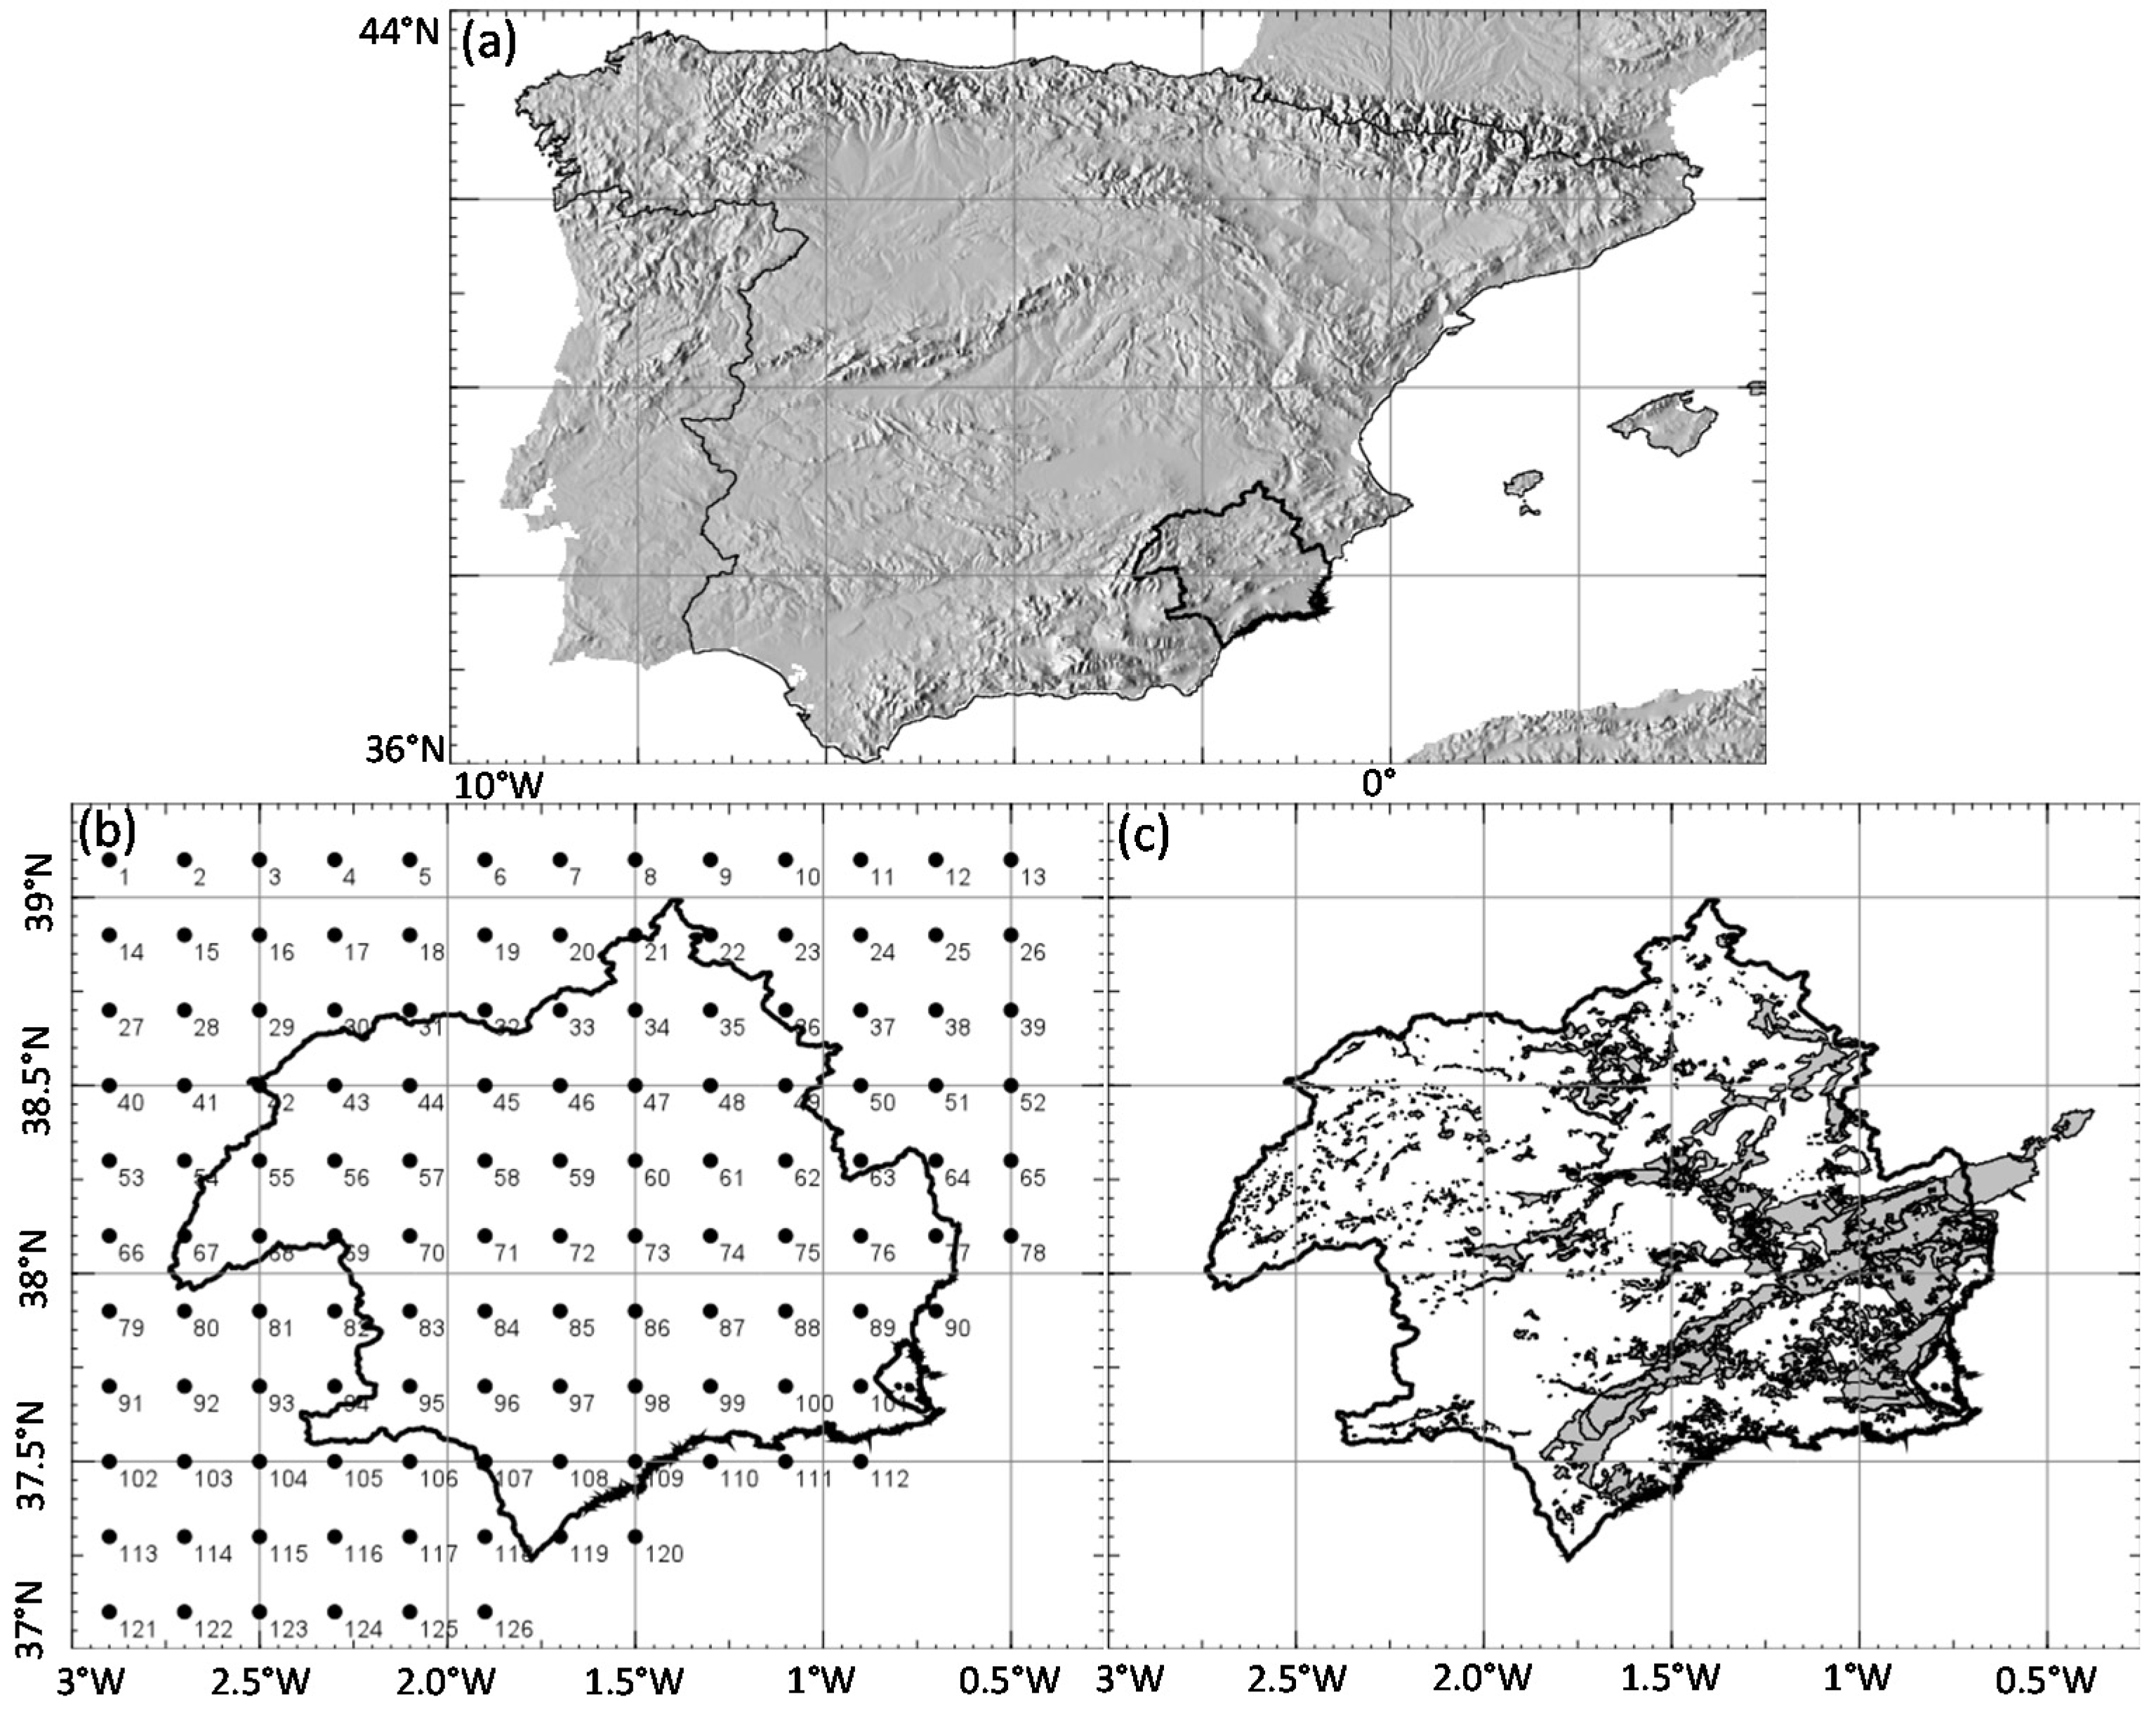
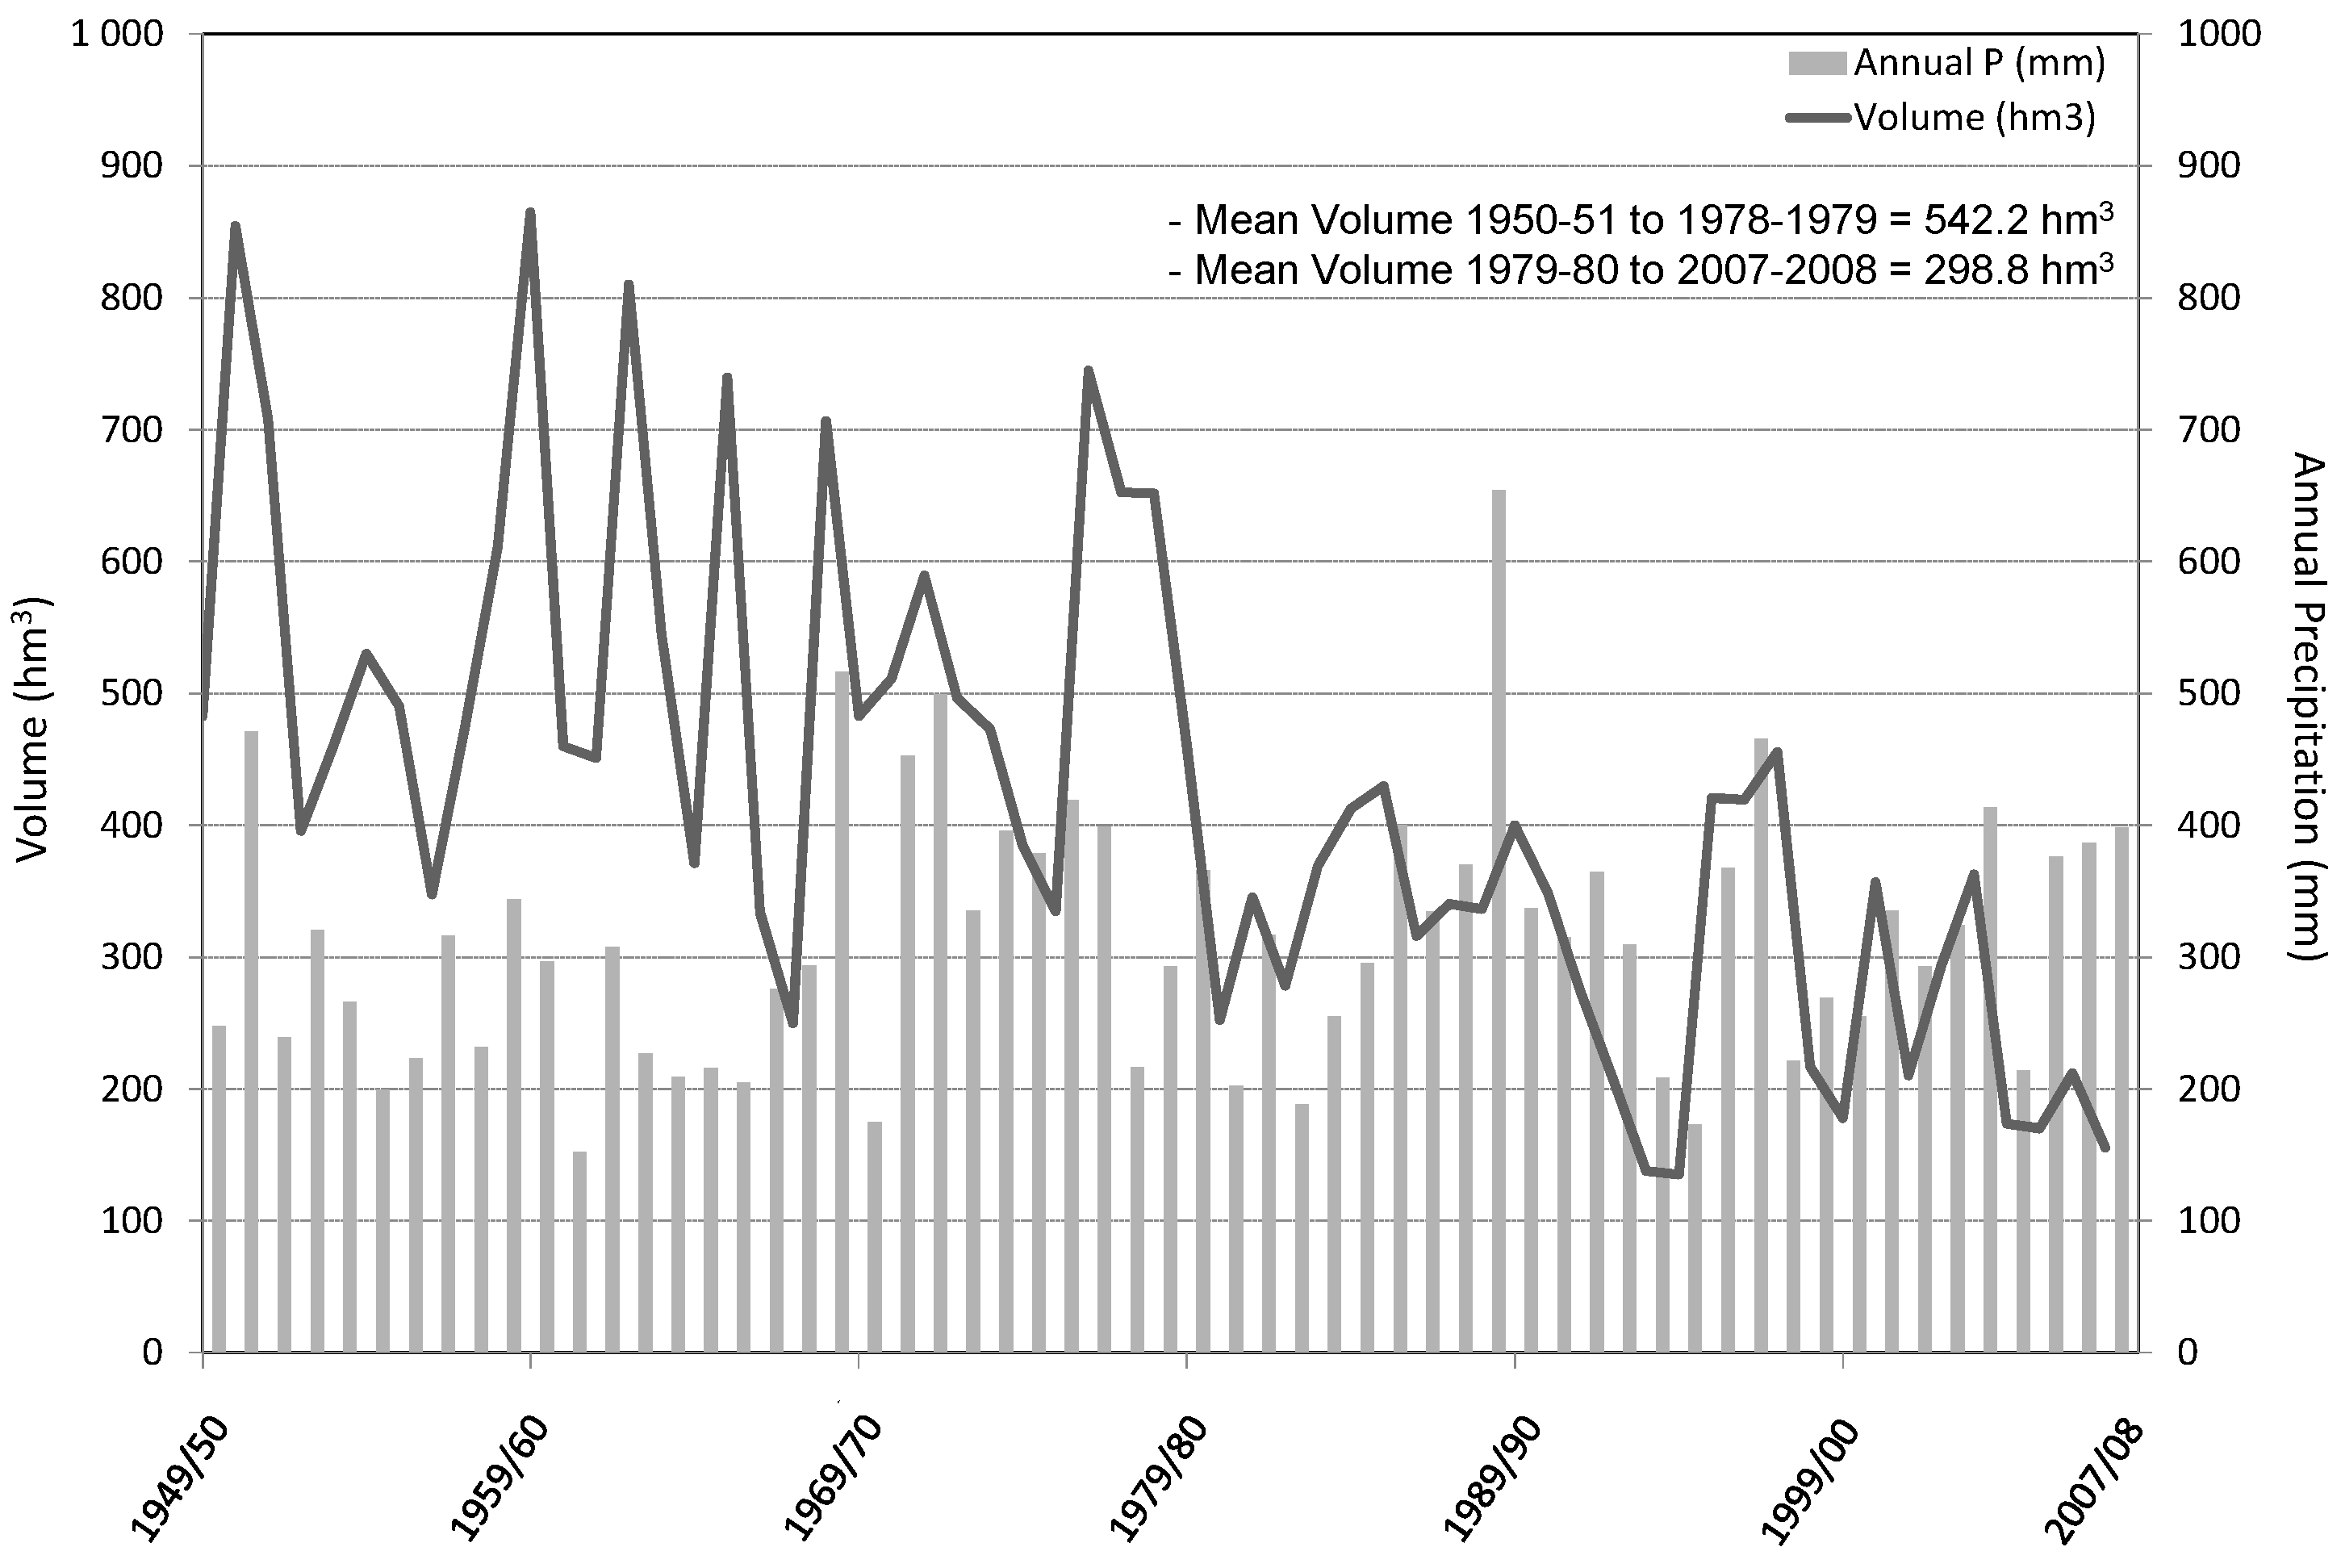
2. Characterization of Study Basin and Dataset

The Segura River Basin (SRB) located in South East Spain (Figure 1), with an area of 18,870 km2, presents the lowest percentage of renewable water resources of all Spanish basins. It has a semiarid climate and is highly regulated, with the main water demand corresponding to agriculture, which has an irrigation surface of 269,000 ha. According with [18], the SBR headwaters underwent intensive reforestation in 1970s with the aim of hampering severe erosion processes. However, the reforestation processes also impacted the hydrological cycle, because it is related with both flood and sediment control [18,19]. Due to reforestation, which forms vegetated areas where the runoff and sediment are trapped, the lateral connection in the basin is disrupted [20], and the flows are relatively lower in low-intensity events, if they are compared with high-intensity events, which saturate the soil, restore the connectivity and increase the flow rate. However, despite the decreasing trend of flow rates in the SRB between 1950 and 2010, the same decreasing pattern is not observed in precipitation, then the relationship in precipitation-flow is much more complicated. In some cases, the longer the dry spells, the greater the evapotranspiration rates from the upper soil layer [21], then the effect of lengthening dry spells is more noticeable on the water cycle.
Figure 1. Study basin: (a) location of the SRB in the Iberian Peninsula; (b) grid-sites for analysis; and (c) irrigated area.
Water 07 05458 g001
Regular daily high-resolution gridded rainfall dataset (named Spain02), for the time period 1950 to 2007, derived from a very dense network of 2756 quality-controlled stations [22], was considered for the analyses. This dataset presents a highly horizontal resolution 0.2°. According to [22], the database is suitable for extreme events analysis, because it correctly mimics key climatological features, especially in the southern Iberian peninsula. The database has been well accepted by scientists, and several works have been issued using the Spain02 database (at the moment of writing this paper, [22] had been cited for more than 50 papers). The sites selected for the analyses (55, 56, 68, and 96 in Figure 1) were defined according to the grid of Spain02 dataset.
In the SRB, the basins with the highest water resources contributions correspond to the headwater of the Segura River (selected sites 55 and 56, Figure 1), including the Taibilla River basin (selected site 68), the Mundo River Basin, and the Guadalentín River Basin (selected site 96). Then the North-East basins (some of them endorreic basins) present lamination reservoirs. Among the relevant rivers of SRB, it is necessary to highlight the Moratalla River, Quípar River, Argos River, and Mula River. However, these basins are not very important from the point of view of the supply of water resources. In the lower basin and coast basins (corresponding to ephemeral channels), wide areas of irrigated agriculture are located, which are vital for the economy of the region (see Figure 1c).
Focusing on the issues of water resources of Southeast Spain, such as the SRB, a sharp decrease of runoff was observed in headwater basins from the late 1970s (Figure 2). The decrease in the mean volume (interannual accumulated runoff) for the whole basin between the periods of hydrological years 1950–1951 to 1978–1979 and 1979–1980 to 2007–2008, was about 240 hm3 for the SRB, as can be observed in Figure 2. As [23] noted, during the last 30 years, the runoff average of the SRB (surface water) has decreased noticeably, increasing the water scarcity problem of the basin. In the period 1950–1951 to 1978–1979 there is not a clear link between rainfall and runoff (Figure 2), while intensive reforestations were developed. From the 80s, the changes induced by land use modifications (intensive reforestation to halt desertification and erosion), as well as climate variability and change, are considered some of the drivers of runoff decreases observed from Figure 2.
Figure 2. Interannual accumulated runoff (in hm3) of the whole SRB, for the hydrological years 1949–1950 to 2007–2008.
Water 07 05458 g002

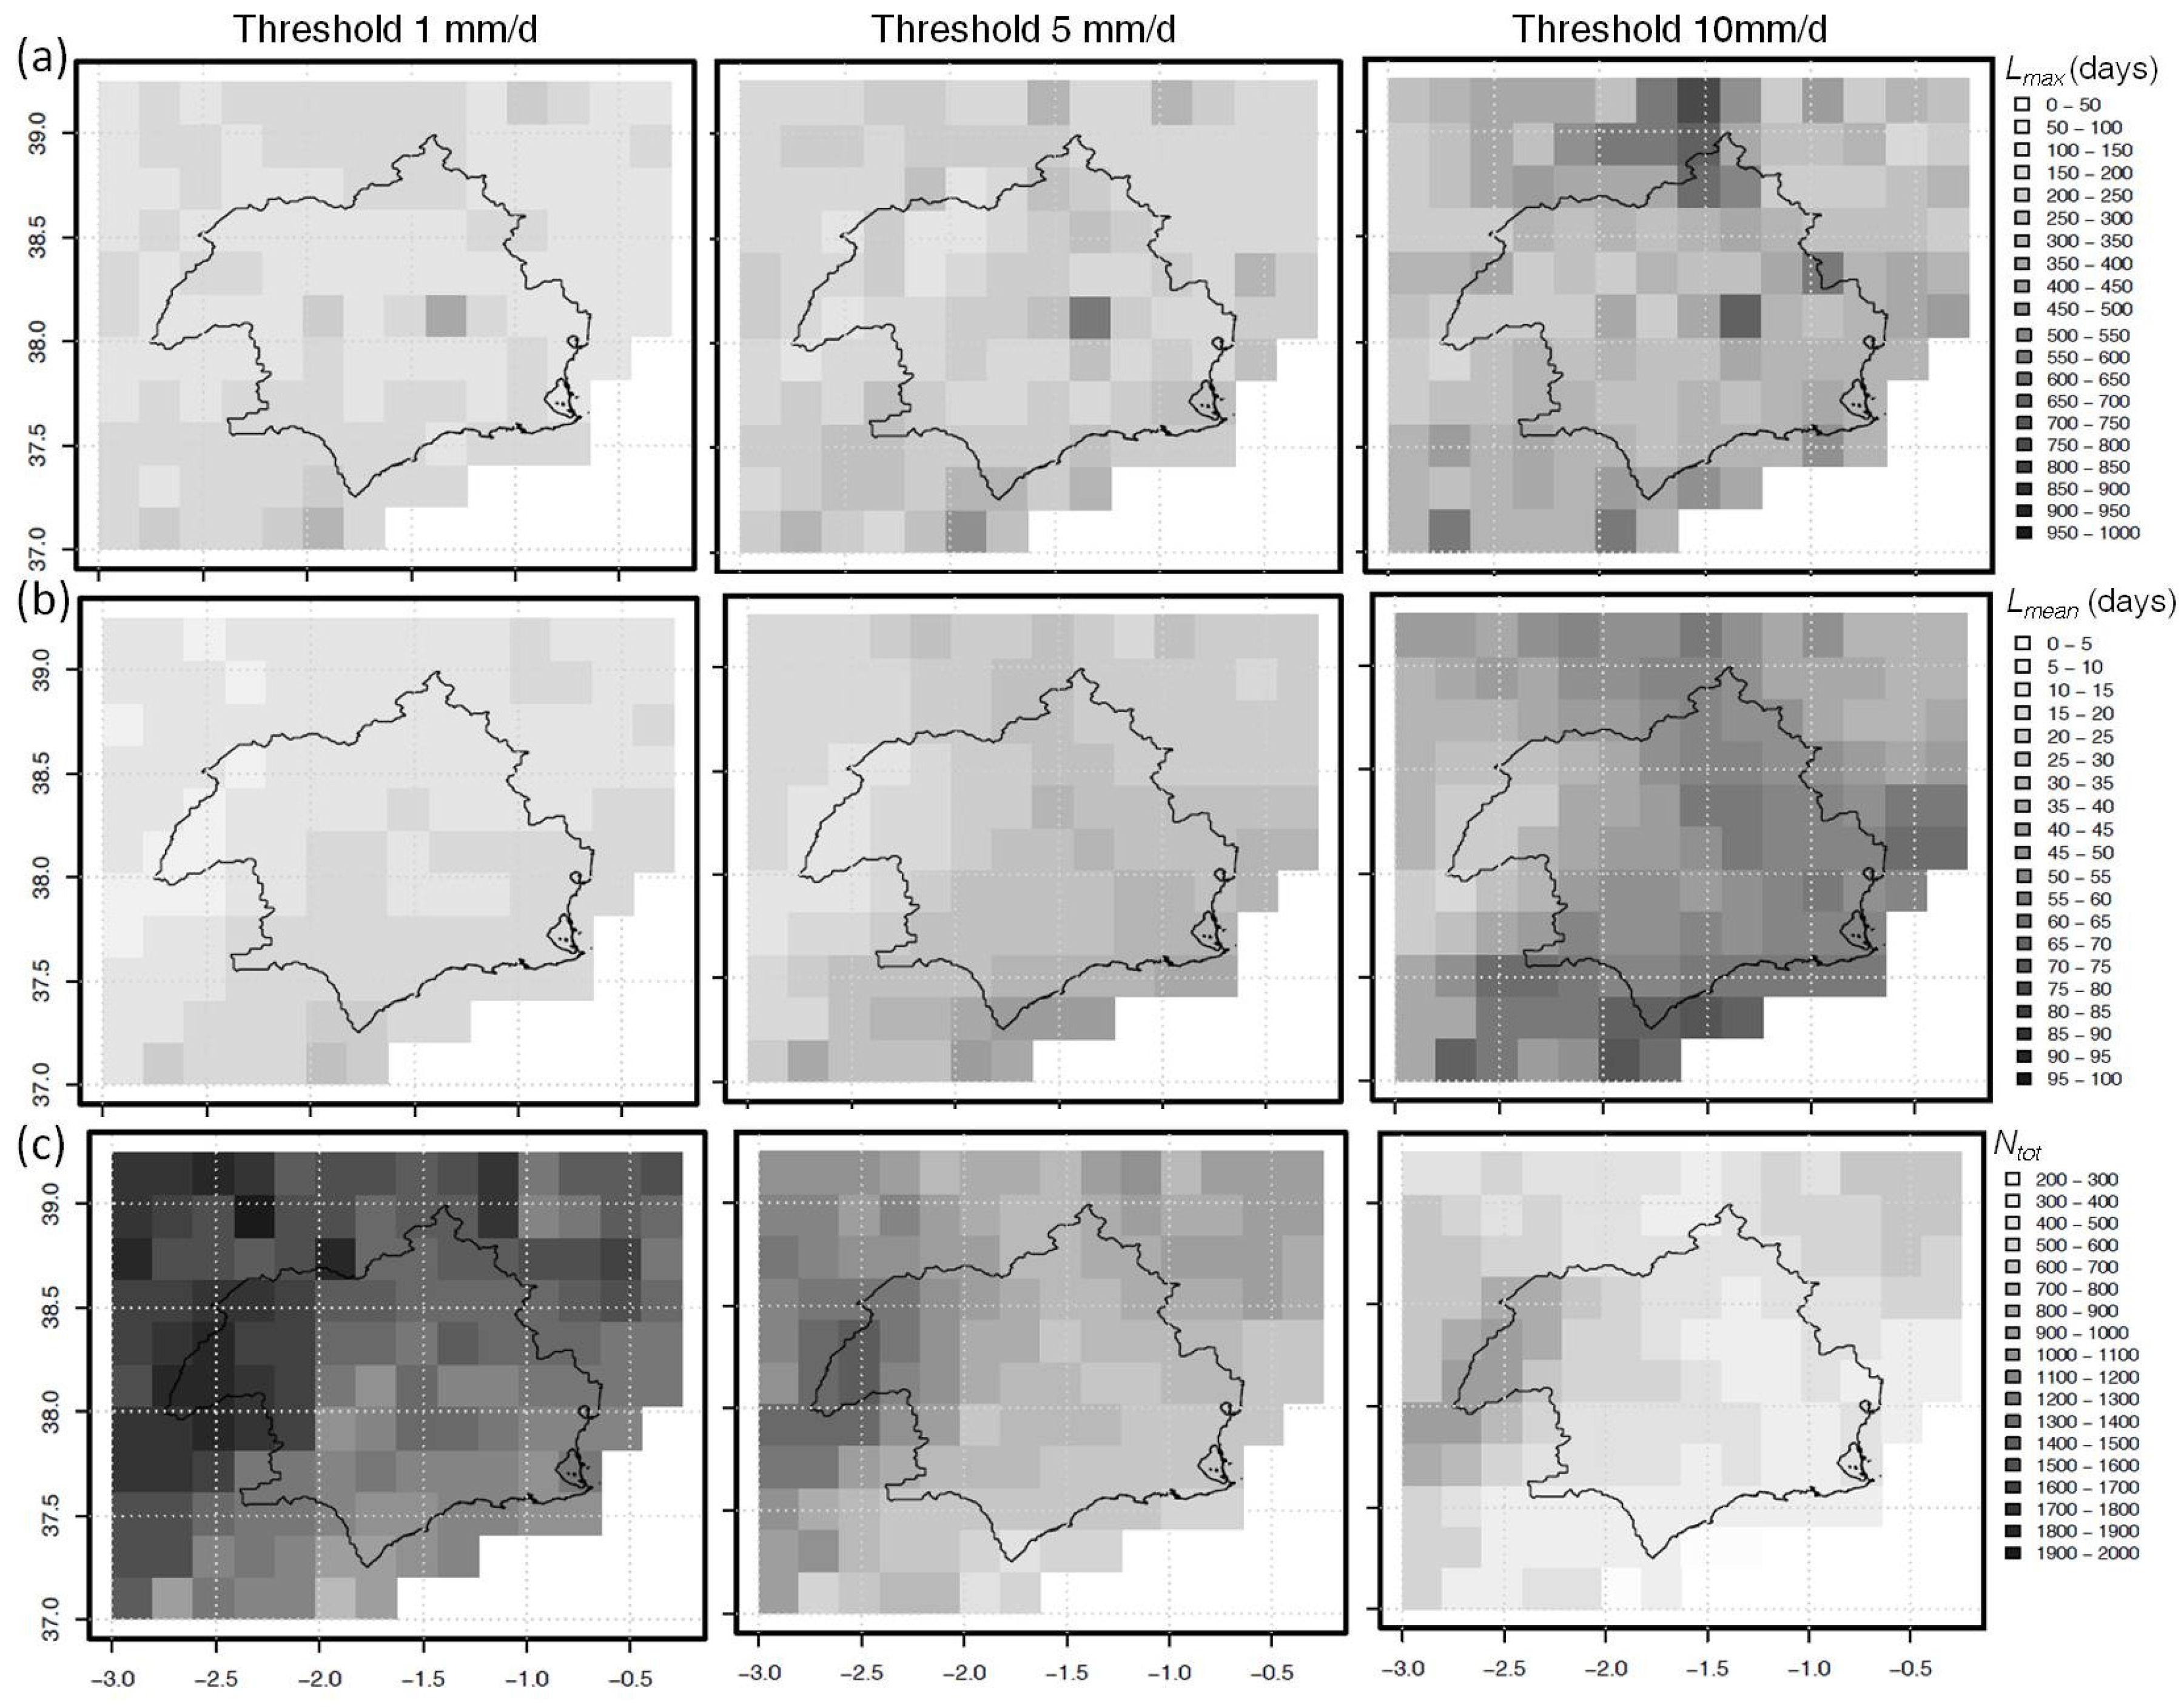
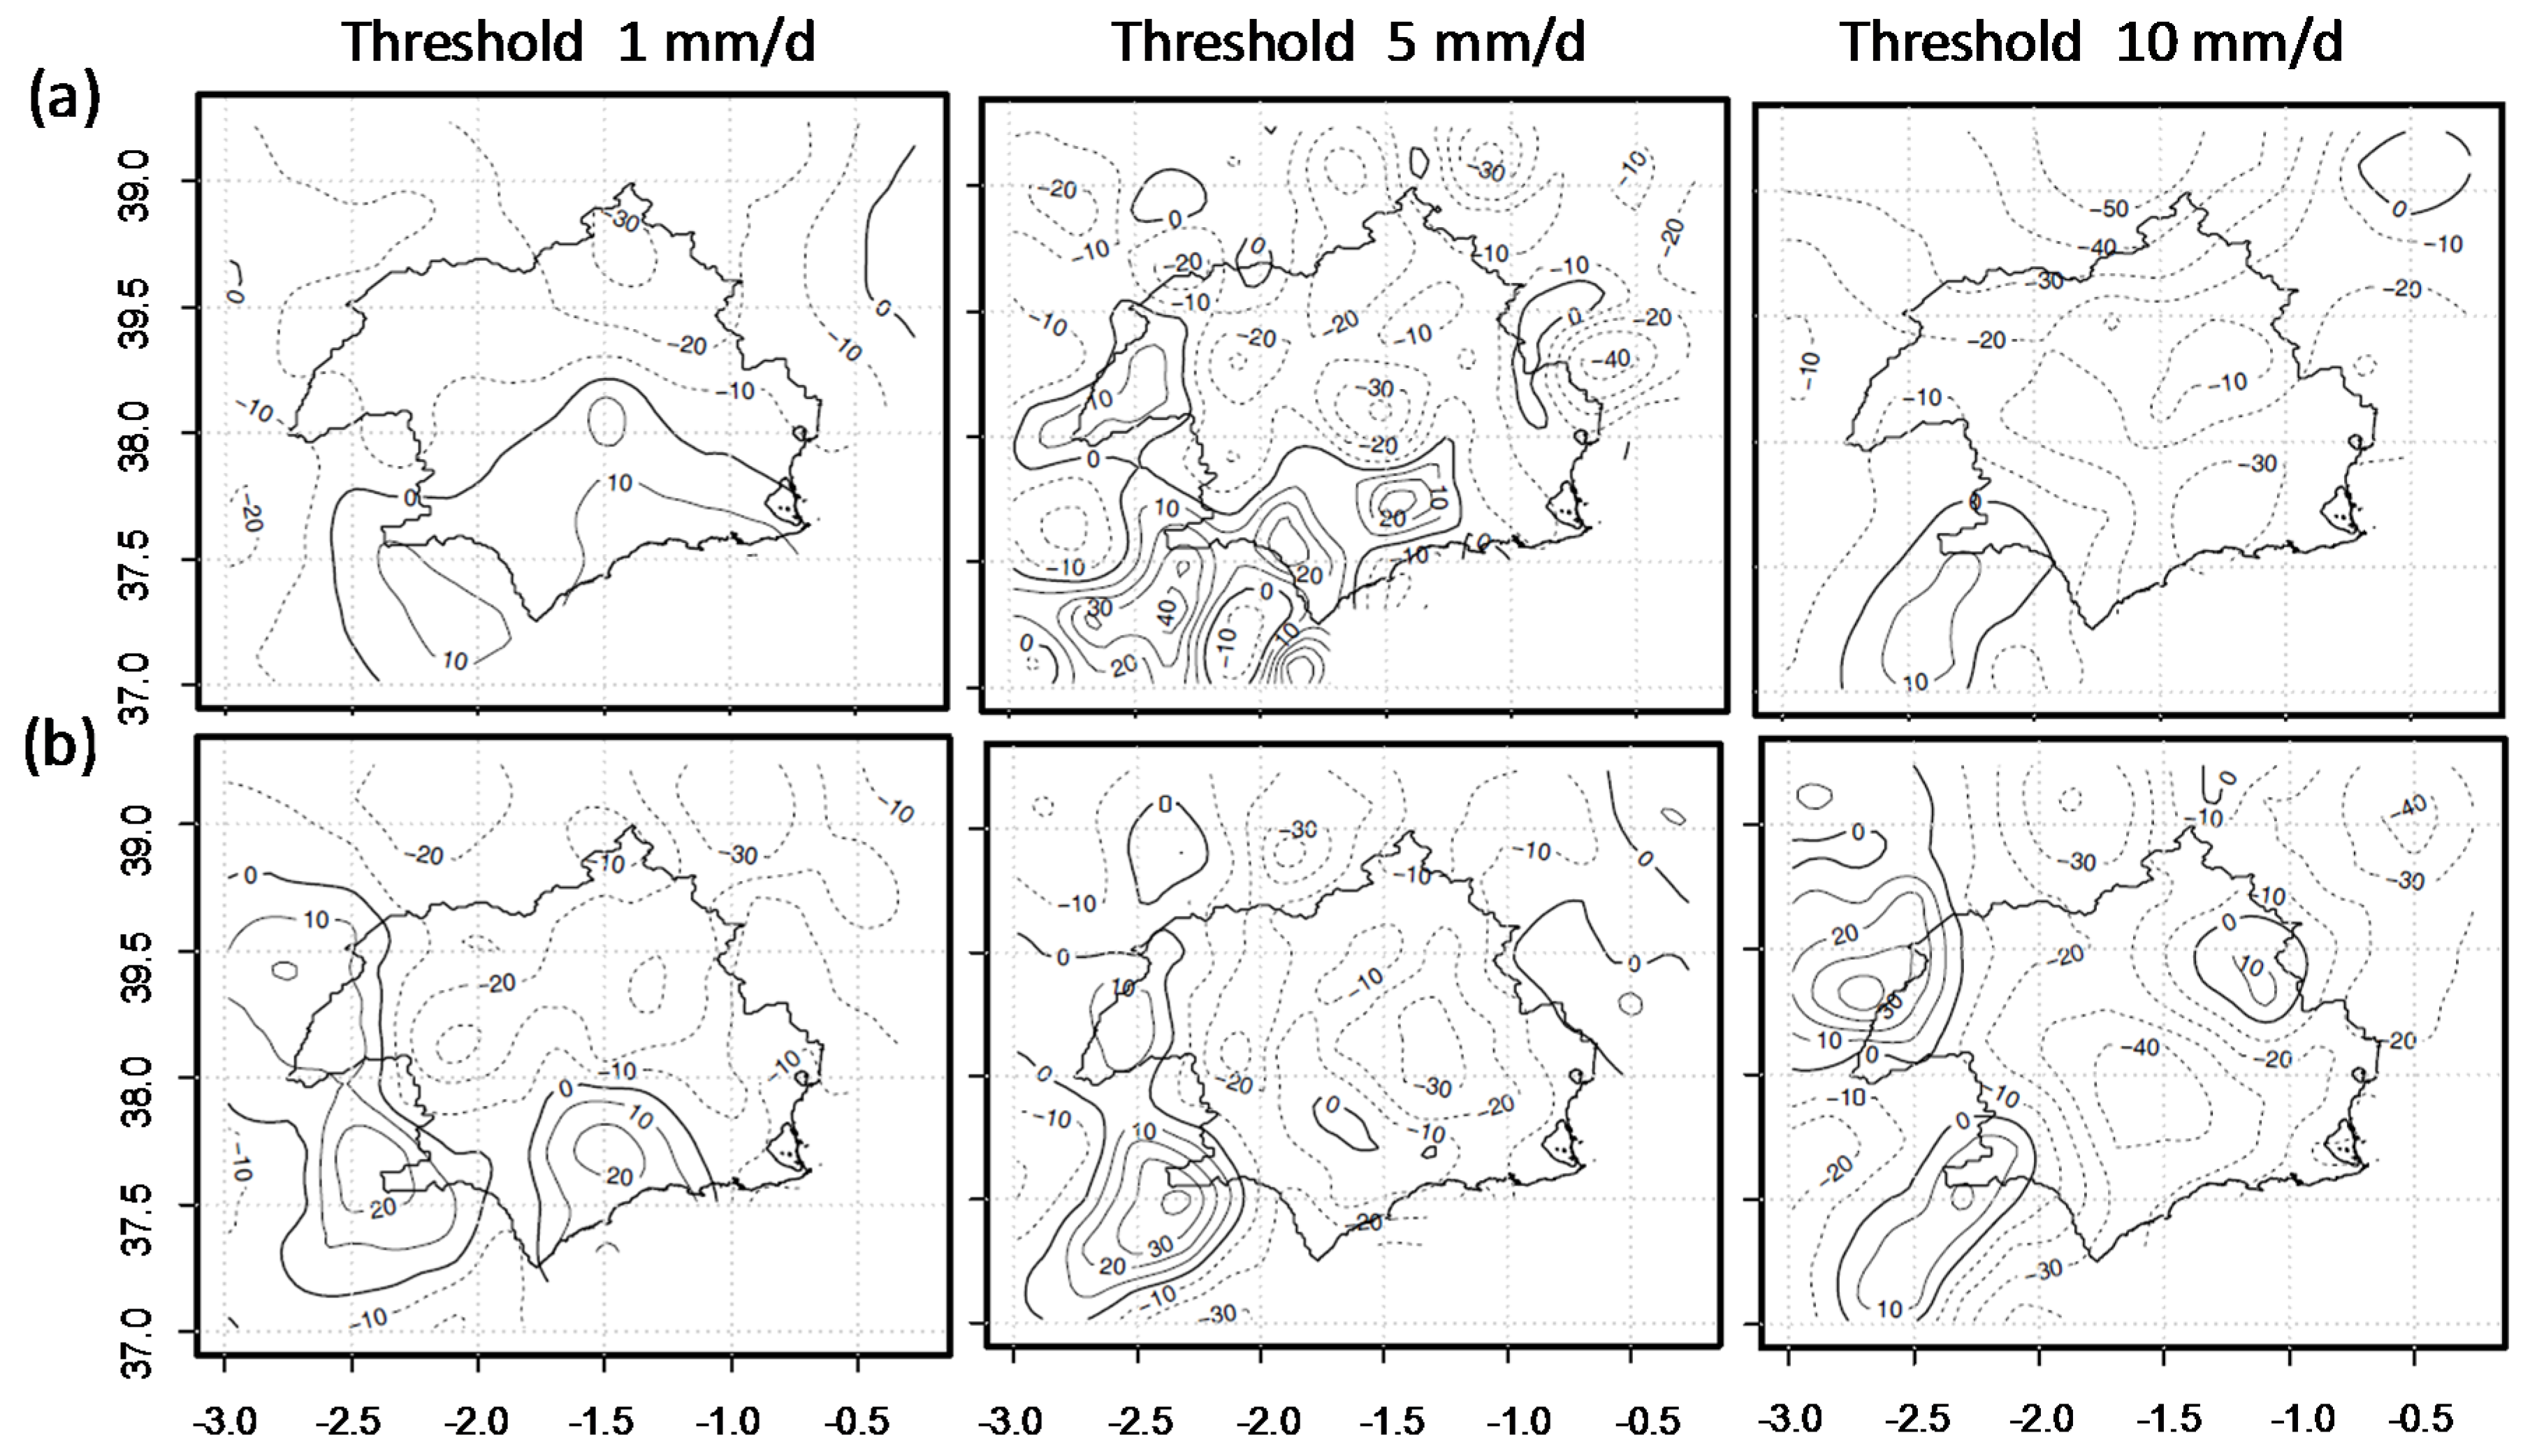
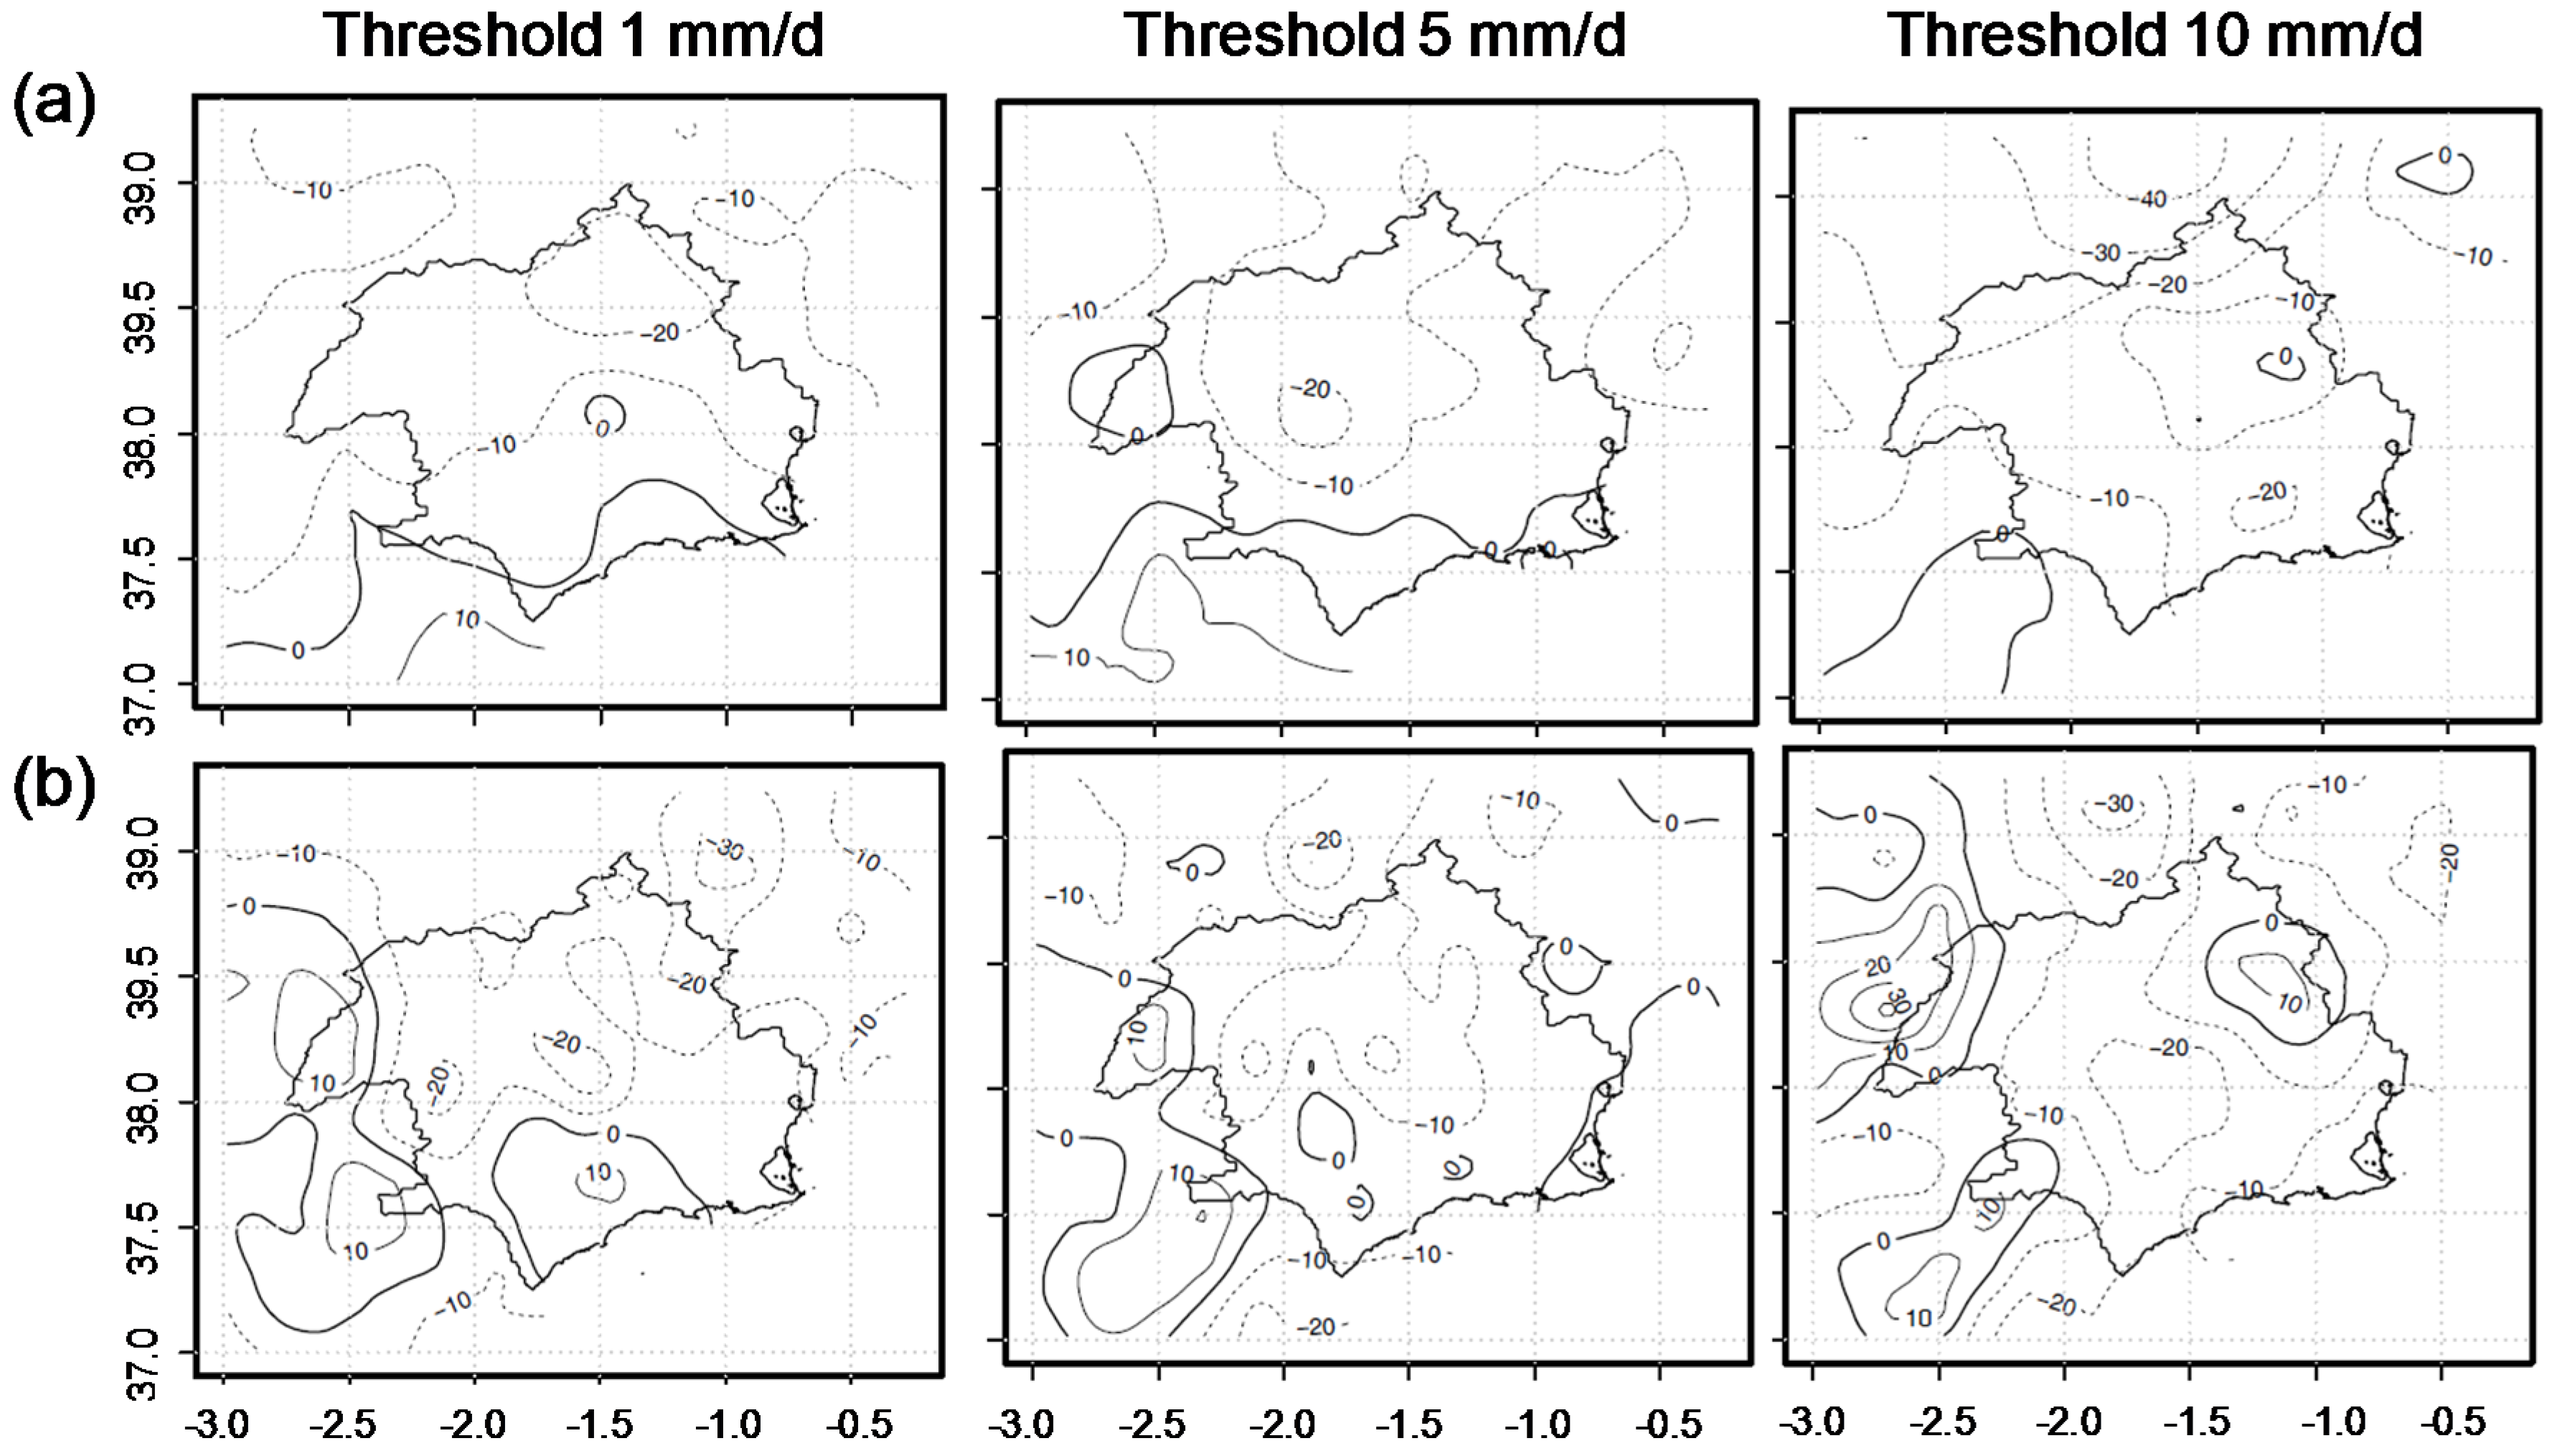
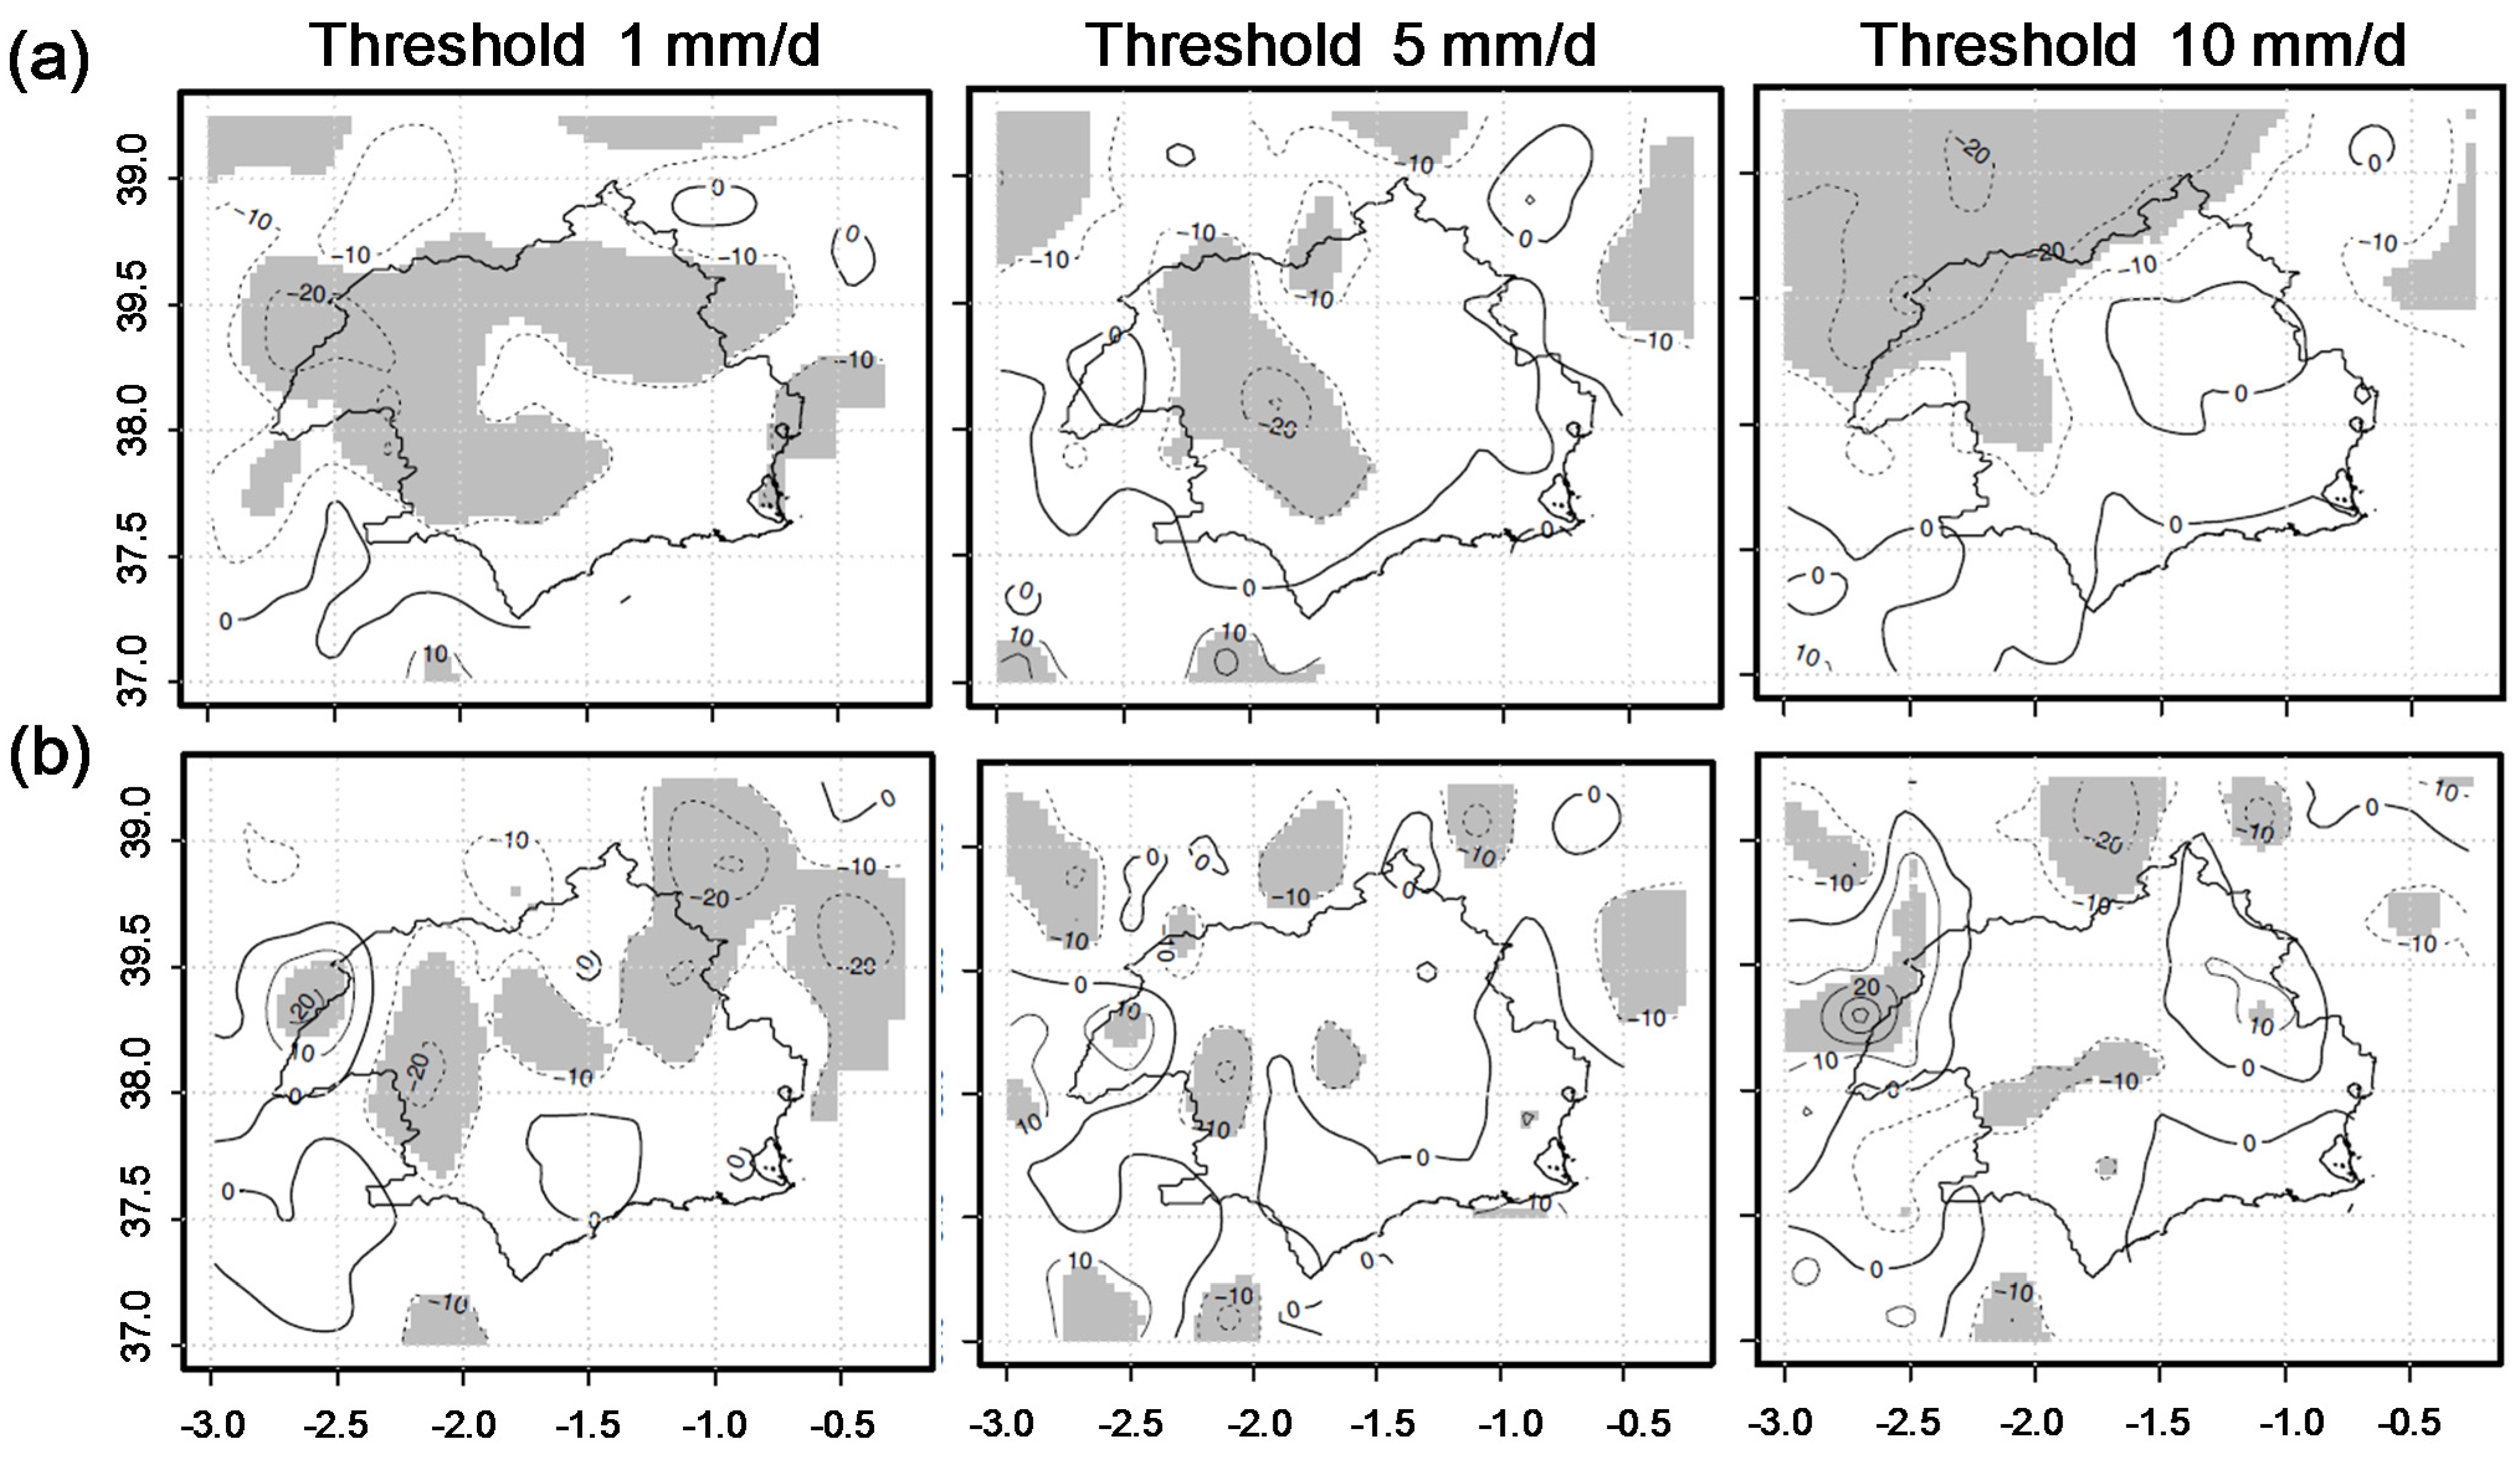
3. Analysis of Spatial Distributions of Length and Number of Dry Spells

For each selected threshold of rainfall (1, 5, and 10 mm/day), the spatial distribution of maximum length (Lmax), mean length (Lmean), and number of dry spells (Ntot) (Figure 3), were estimated from the Spain02 dataset for the whole study period. The threshold selection was looking for a complete depiction of dry spell statistics. The threshold 1 mm/day is a conventional value used for defining dry days. However, the thresholds 5 mm/day and 10 mm/day are related with crop water demands: according to FAO official documents [24], the water demands in semi-arid regions would range between 5 and 10 mm/day, depending on temperatures. Also, the Extreme Climate Indexes defines RR1 (daily precipitation above 1 mm), RR5 (daily precipitation above 5 mm) and RR10 (daily precipitation above 10 mm; heavy precipitation days), which serves to ease the analysis of climate extreme trends [25].
An opposite behavior is observed between Lmax and Lmean, with respect to Ntot. The areas with the highest values of Ntot correspond to the minimum values of Lmax and Lmean, with this correspondence being even clearer with lower thresholds of rainfall. For example, for the threshold of 1 mm/day in the headbasin of the Segura River, the maximum values of the number of dry spells (over 1900 spells), but with the minimum lengths (about 5 days for Lmean and 50 days for Lmax), are observed in Figure 3. For Lmean, and more clearly for Ntot, there is a northwest to northeast gradient.
Figure 3. Spatial patterns of dry spells attributes for thresholds of 1 mm/day, 5 mm/day, and 10 mm/day: (a) maximum length (Lmax) in days; (b) mean length (Lmean) in days; and (c) number of dry spells (Ntot).
Water 07 05458 g003

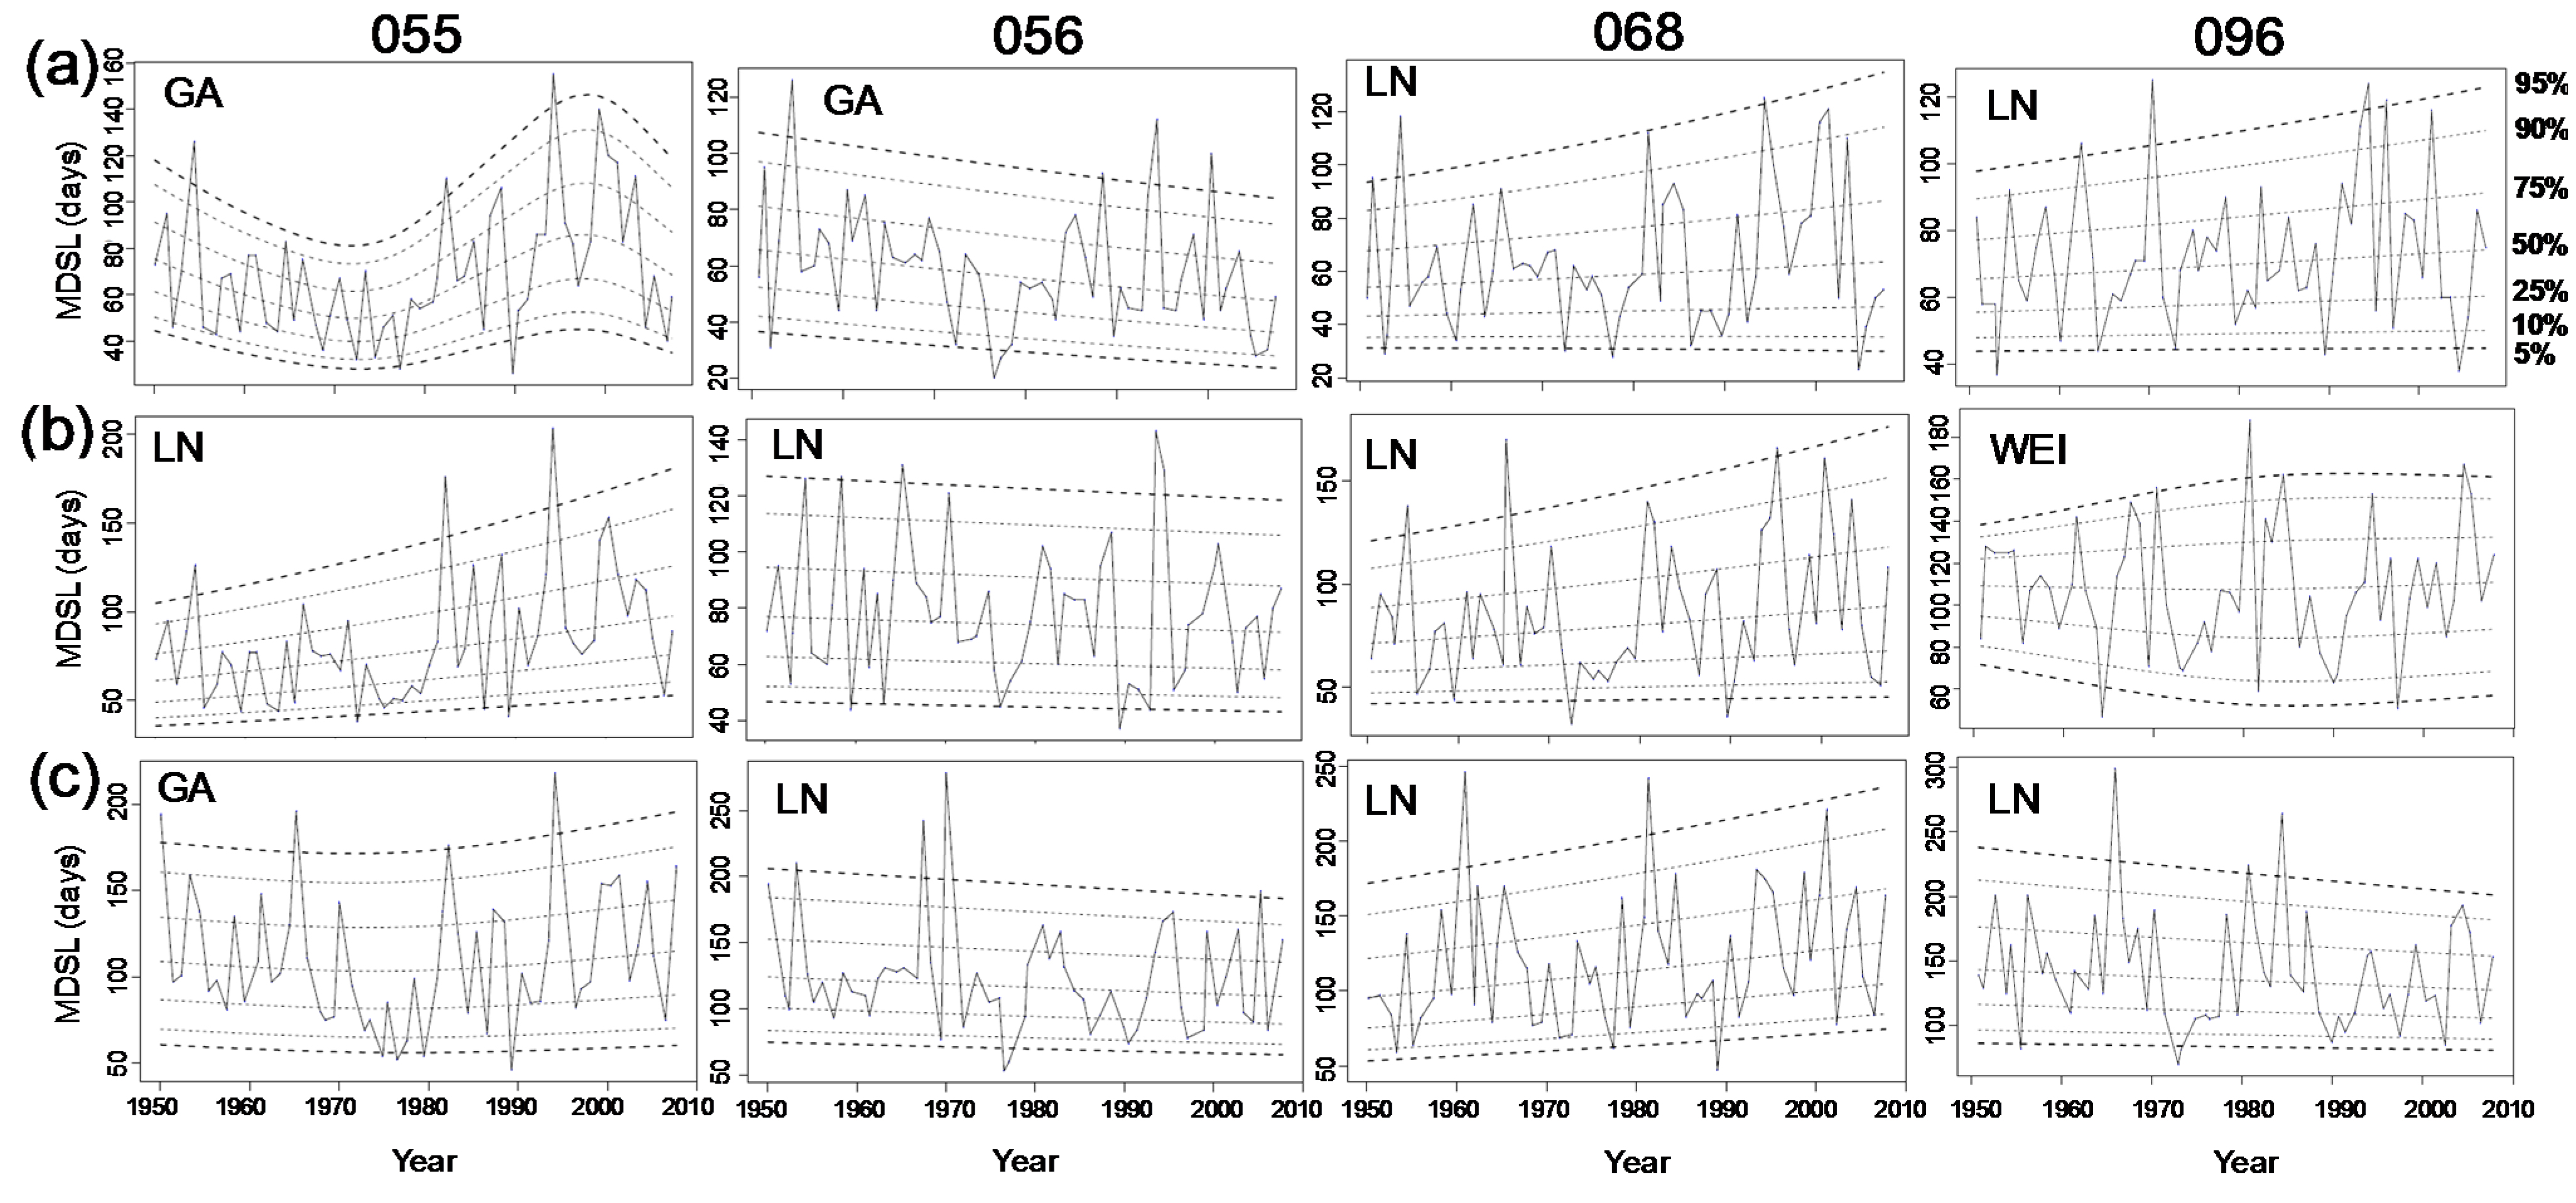
4. Analysis of Time Series: Application of GAMLSS Tools

In the analysis of trends of annual maximum dry spell lengths (MDSL) for the SRB, the GAMLSS (Generalized Additive Models in Location, Scale and Shape) modeling framework was used. These tools consist of semi-parametric regression models, allowing the relation of the parameters of a probability density function (PDF) as a function of an explicative variable through non-parametric smoothing techniques [26]. GAMLSS is a valuable tool for analyzing time series that exhibit non-stationary behavior, such as hydrometeorological series where there are changes and trends in the mean (μ) and variance (σ2) over time.
Several authors [27,28], have successfully applied GAMLSS for the modeling of hydrometeorological extremes. GAMLSS tools present a great variety of PDFs, but in this work three PDFs which are widely applied in hydrology were selected: Lognormal (LN), Weibull (WEI), and Gamma (GA). Models of cubic spline were considered as a smoothing function at site, for the two parameters of the distribution. For the selection of the best model (PDF), and trying to promote the selection of models with few degrees of freedom used in the smoothing, the Schwarz Bayesian criterion (SBC) [29], with penalty 3.5 was considered. In this way, the stability of the algorithm is guaranteed in the processing of the statistical model selection. The SBC is a special case of Generalized Akaike Information Criterion or GAIC (AIC was presented by [30]), which penalizes overfitting of GAMLSS models with smoothing [6]. The properties of the residuals of statistical models were assessed, considering the hypothesis test with Filliben correlation coefficient [31], mean, variance, skewness, kurtosis, and by visual inspections of residuals plots, in particular the qq-plots (not shown) and the worm plot (not shown). The worm plots correspond to the de-trended representation of qq-plots, and the shape of the worm indicates how the data differ from the assumed underlying distribution [32]. A comprehensive discussion on the theory, setting, and model selection is presented by [26].

Analysis of Trends of Annual Maximum Dry Spells Lengths (MDSL)

The GAMLSS tools were applied to the annual MDSL time series at each grid-site, considering thresholds of 1, 5, and 10 mm/day. Figure 4 shows the results of GAMLSS application to MDSL series in the headbasin of the Segura River (055, 056, and 068 grid sites), and Guadalentín River (096 grid site). Increasing trends on site 68 for all thresholds and for site 55 (from 1980 for the thresholds of 1 and 10 mm/day), are observed. However, a negative trend is identified on site 56.
On grid site 096 (Guadalentín River, Figure 4), an increase of MDSL is observed for thresholds of 1 and 5 mm/day, but a decrease for 10 mm/day. In general, increases in the MDSL on the headbasin of the Segura River and Guadalentín River, and negative trends (decreases) in the rest of the basin are identified. Depending on the selected rainfall threshold, a different behavior is observed, where the largest differences correspond to the rainfall threshold of 10 mm/day.
Figure 4. GAMLSS applied to MDSL (days) in the headbasin of the Segura River at grid sites 55, 56, 68, and 96 for thresholds: (a) 1 mm/day; (b) 5 mm/day; (c) 10 mm/day.
Water 07 05458 g004

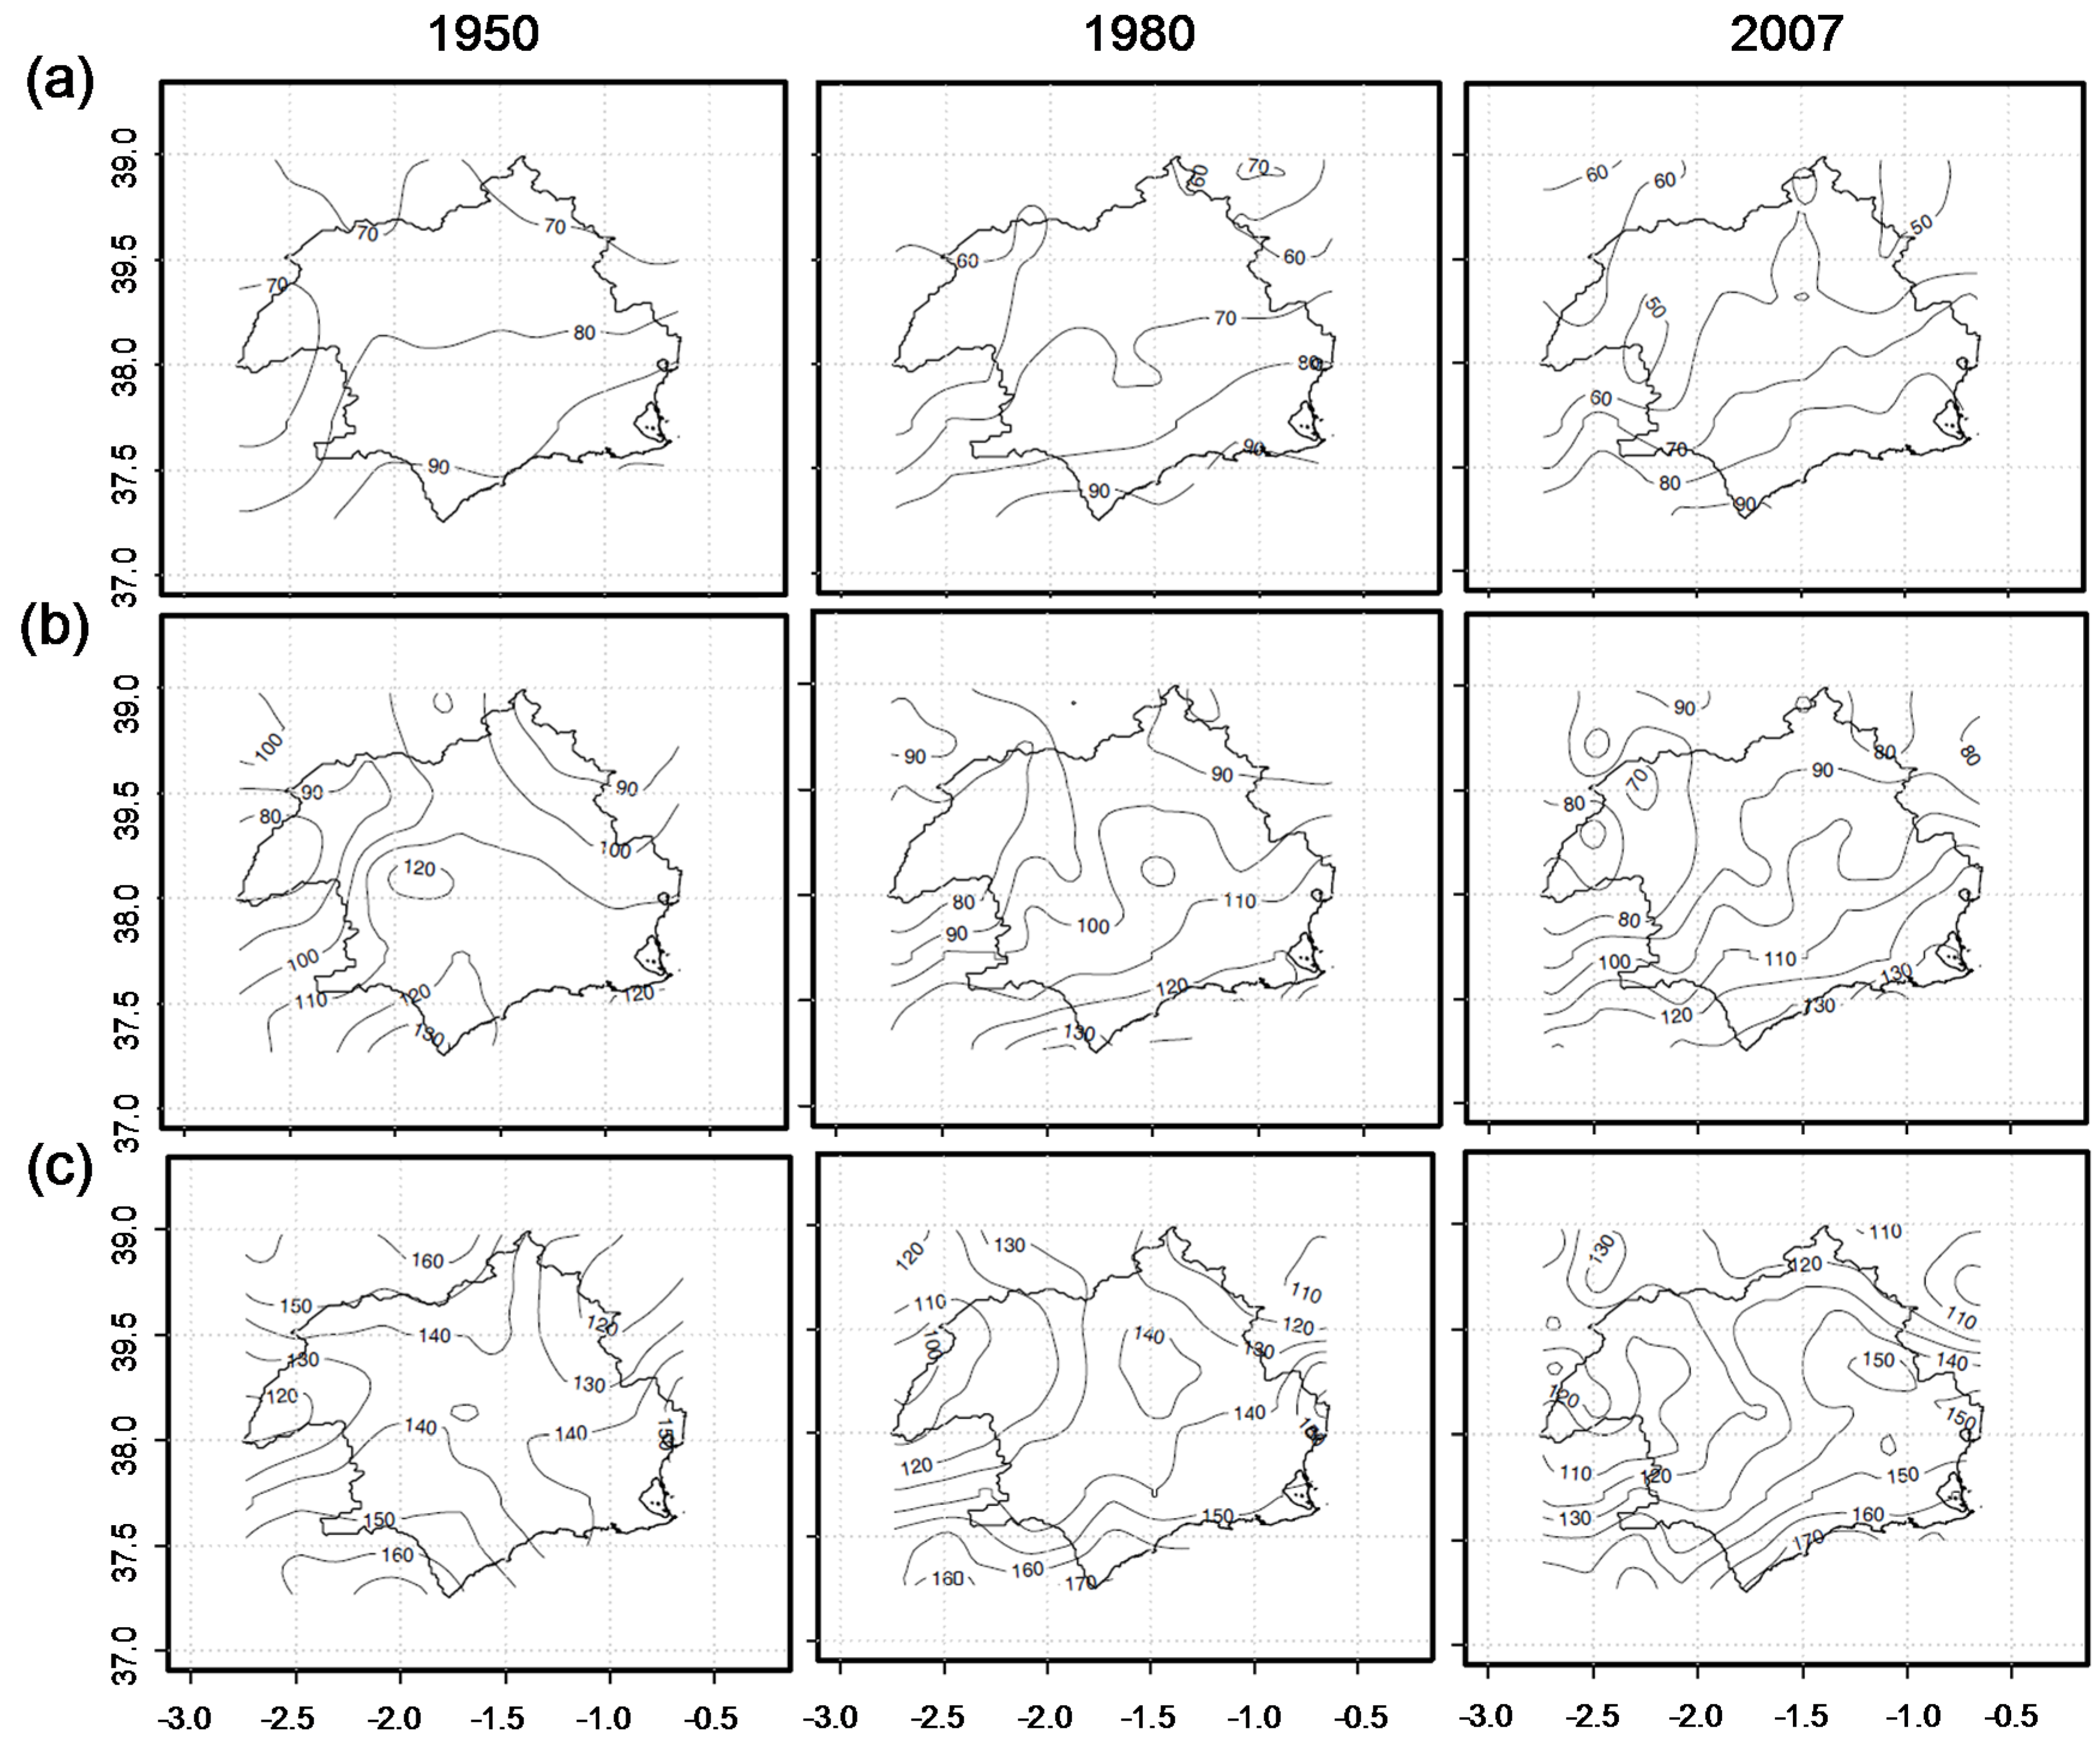
5. Generation of Non-Stationary Spatial Distributions of MDSL

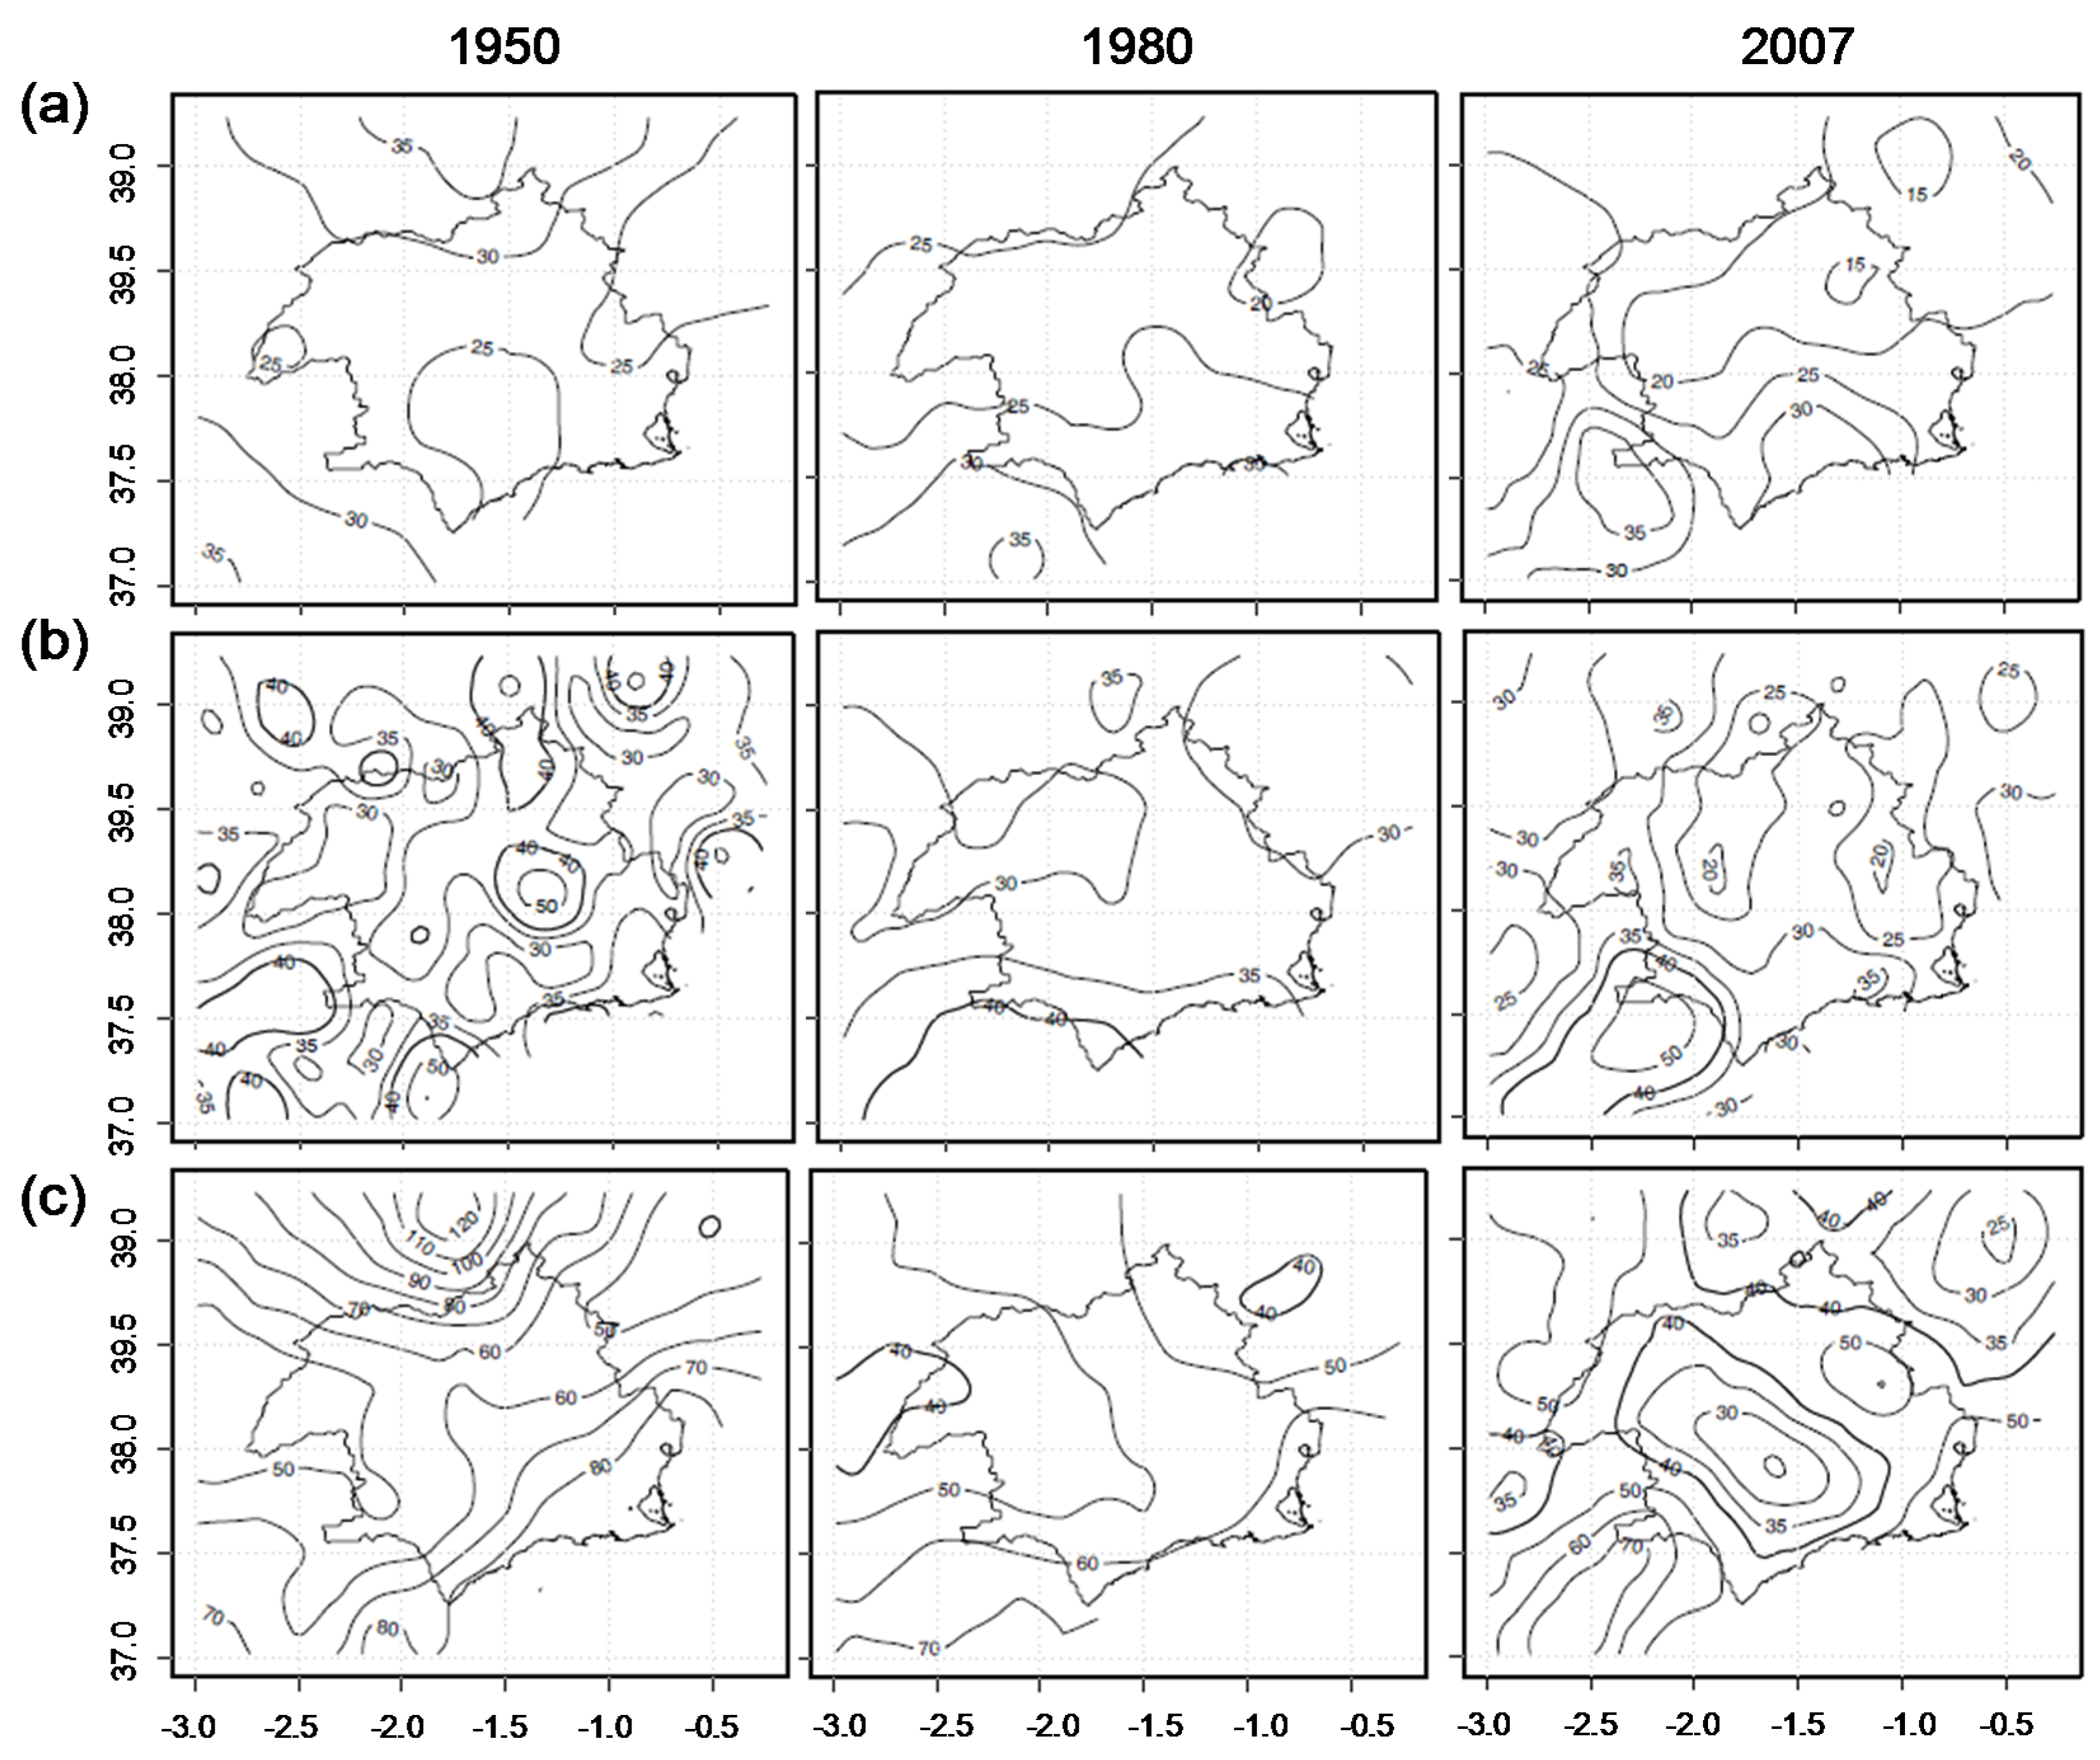
5.1. Spatial Distributions of Mean and Standard Deviations

The spatial distributions of mean (μ, days) and standard deviation (σ, days) of MDSL, were estimated from the application of GAMLSS tools at grid site. A high variability of μ values for years 1950, 1980, and 2007 is observed from Figure 5 (return period Tr 2 years), while the spatial distributions of differences (%) in the μ value for the years 1950, 1980, and 2007 are represented comparatively in Figure 6. Areas with significant differences at 5% (in solid gray for Figure 6), considering a hypothesis test of μ, are identified.
The spatial distributions of the μ of MDSL for 1950 demonstrate the dryness of that year. Several authors [14,33] have reported the severity of that drought event of long duration (several years), for different parts of the Iberian Peninsula. Therefore, if the spatial distributions of 1980 and 1950 are contrasted (Figure 5 and Figure 6a), the decreasing trend of MDSL for 1980 is for almost the entire basin considering rainfall thresholds of 1 and 5 mm/day, except for the headbasin of the Segura River, the headbasin of the Guadalentín River and the coast line for the threshold of 5 mm/day. In the case of the threshold of 10 mm/day, significant decreasing trends are located in the north and northwest of the basin (headwaters of the Segura River and the Mundo River in the north of the SRB).
For the year 2007 with respect to 1980 (Figure 5 and Figure 6b), significant increases of MDSL were observed for the headbasin of the Segura River, reaching 20% in the case of the rainfall thresholds of 1 and 10 mm/day, and 10% for the threshold of 5 mm/day.
Subsequently, the spatial distributions of σ (days) are presented for the years 1950, 1980, and 2007, in Figure 7. In all cases, an increase of threshold generates a rise in the value of the isolines of σ. The percentage differences in the spatial distributions of σ are presented for the year 1980 compared to 1950 in Figure 8a, and for 2007 with respect to 1980 in Figure 8b.
Figure 5. Spatial distribution of μ (days) of MDSL, for years 1950, 1980, and 2007, considering several thresholds for Tr = 2 years: (a) 1 mm/day; (b) 5 mm/day; (c) 10 mm/day.
Water 07 05458 g005
Figure 6. Spatial distributions of differences (Dif %) of μ, for different thresholds and Tr = 2 years: (a) Dif (1980–1950)/1950; (b) Dif (2007–1980)/1980. Significant differences are represented in solid gray, and dashed lines represent negatives values.
Water 07 05458 g006
Figure 7. Spatial distributions of σ (days) of MDSL, for years 1950, 1980, and 2007, considering several thresholds: (a) 1 mm/day; (b) 5 mm/day; (c) 10 mm/day.
Water 07 05458 g007
Figure 8. Spatial distributions of differences (Dif %) of σ, for different thresholds: (a) Dif (1980–1950)/1950; (b) Dif (2007–1980)/1980. Dashed lines represent negatives values.
Water 07 05458 g008
If the year 2007 is compared to 1980 (Figure 7 and Figure 8b, increases in the differences for the headbasin of the Segura River with values around 30% for the threshold 10 mm/day, and 10% for 1 and 5 mm/day, are observed. Thus, the Segura River presents greater increases than the head of the Guadalentín River basin. In the latter case, the Guadalentín River basin, the increase in the values of the σ is around 20% for the thresholds of 1 mm/day and 10 mm/day, reaching 30% for 5 mm/day. Therefore, in accordance with [34], extreme events are more sensitive to changes in variability rather than to changes in central tendency values. The points of change in variance can have a significant impact on increasing or decreasing the extreme scatter in the data [35].

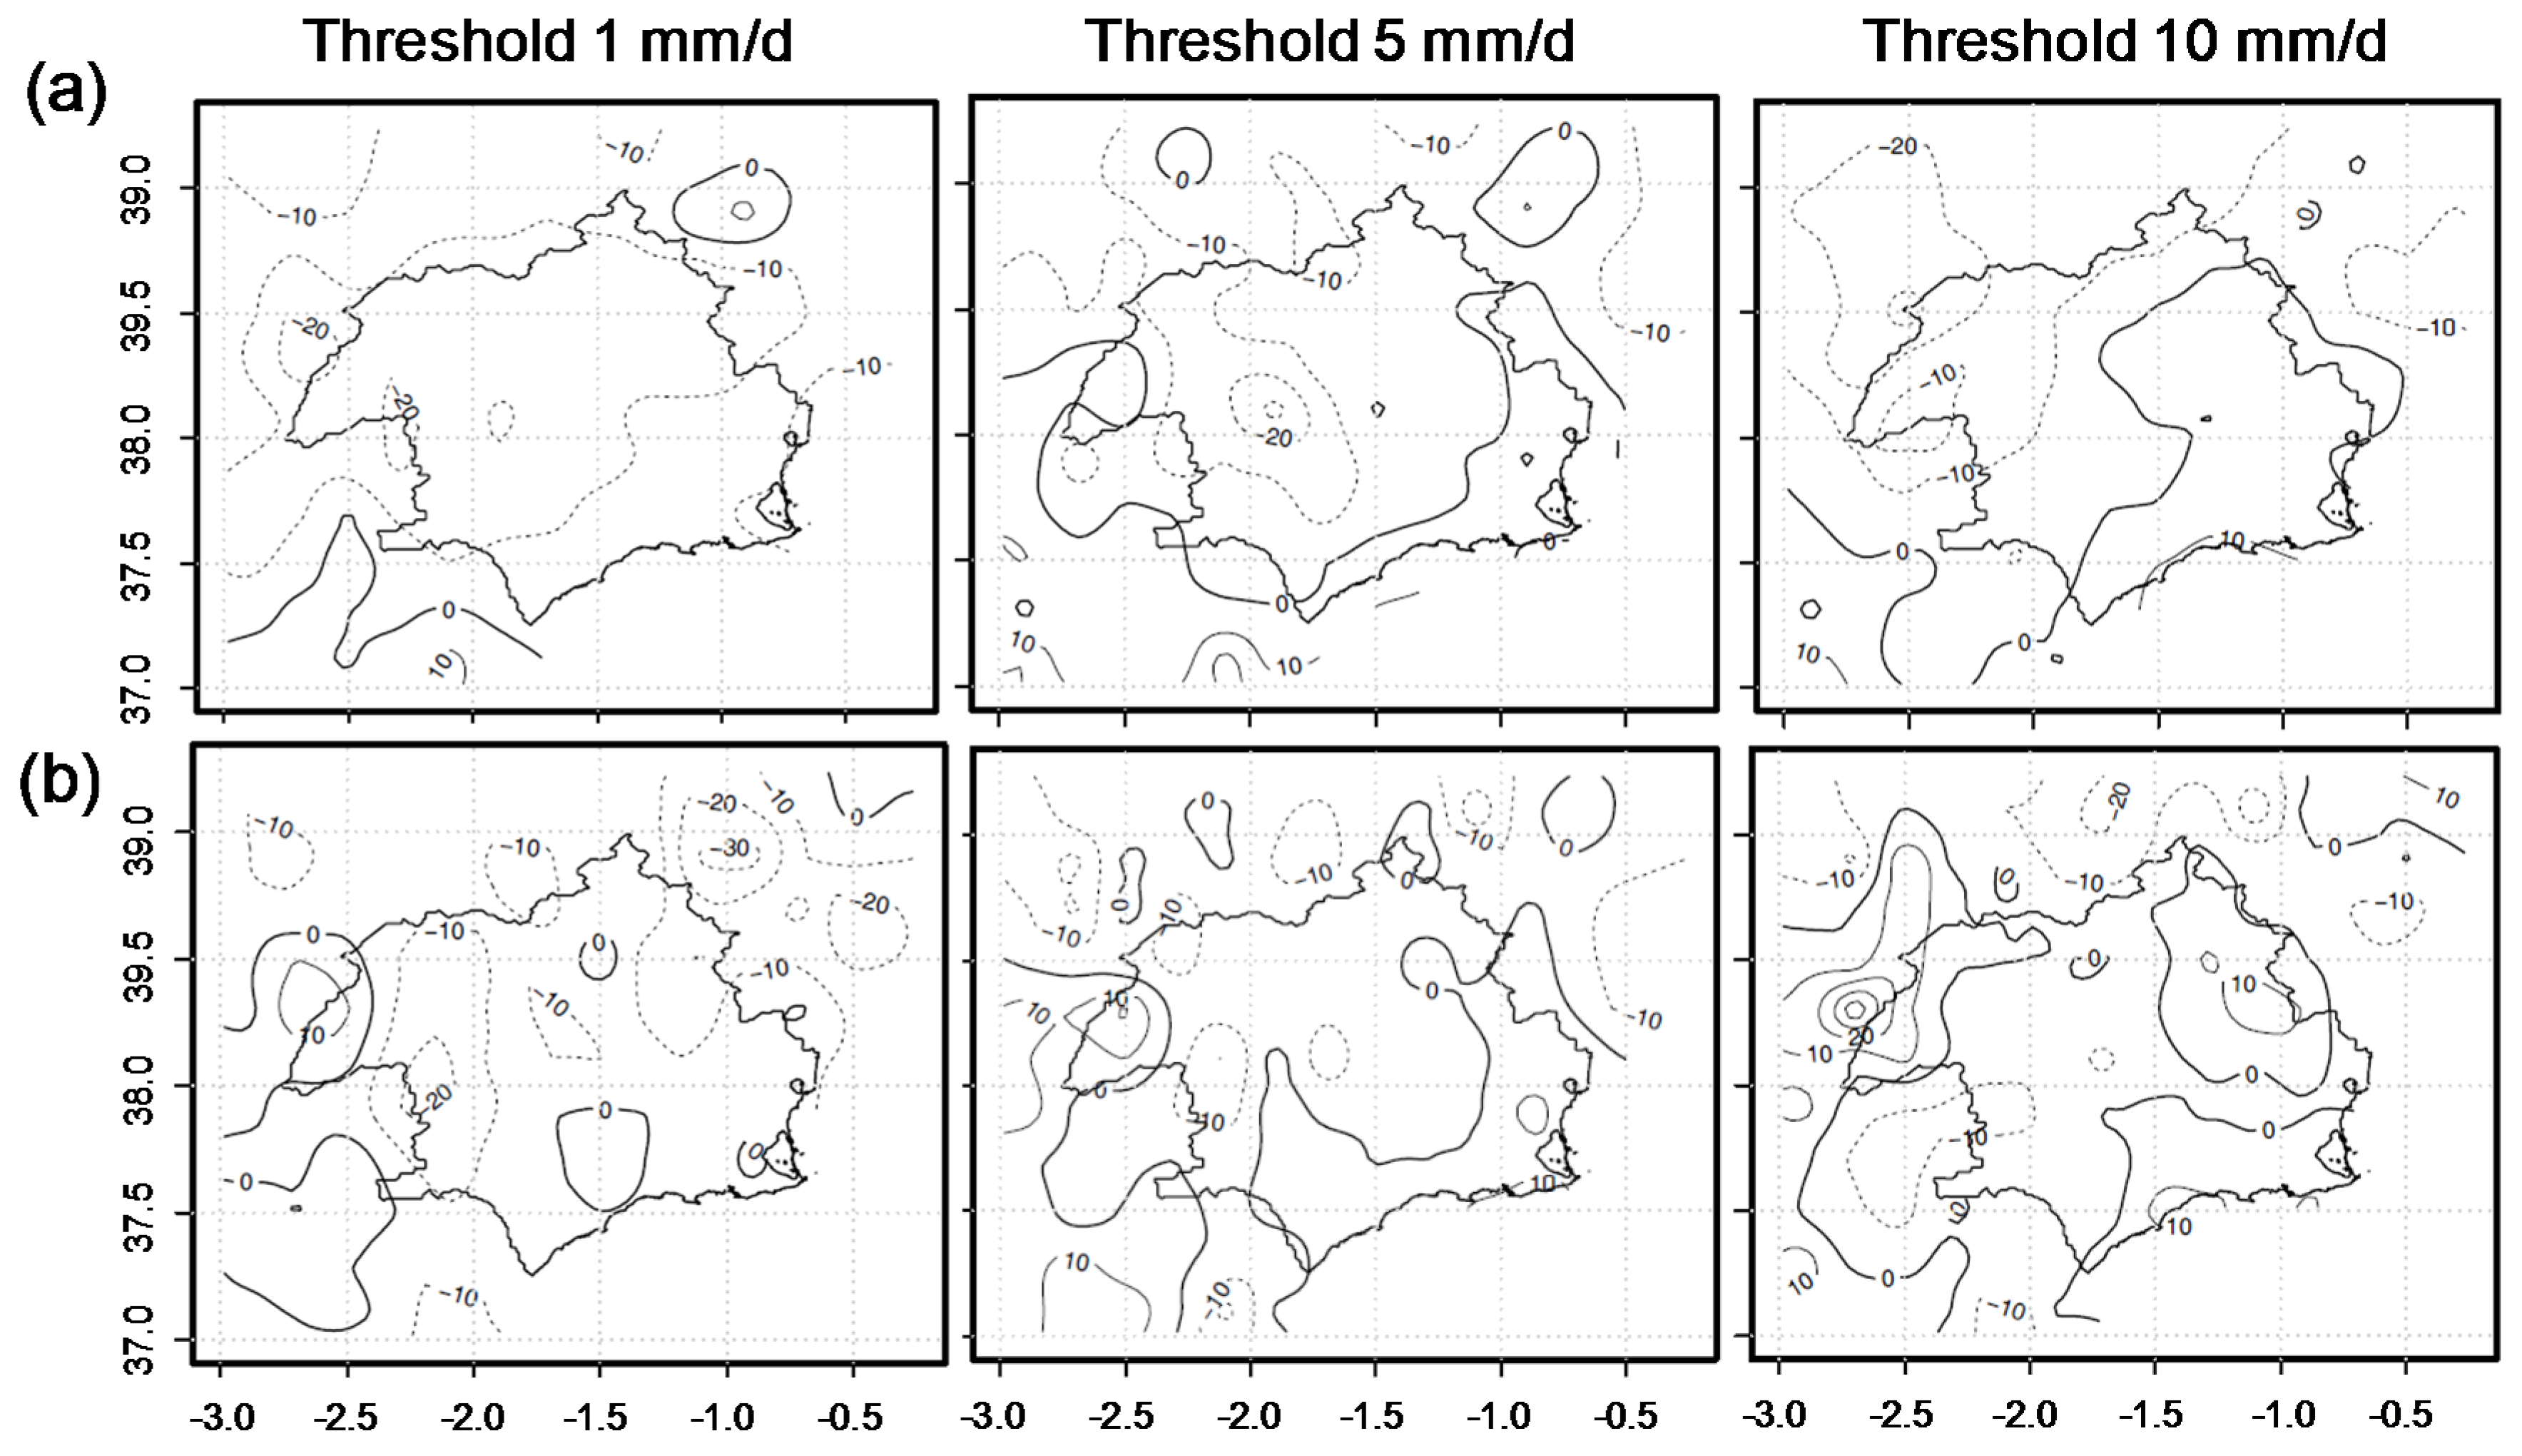
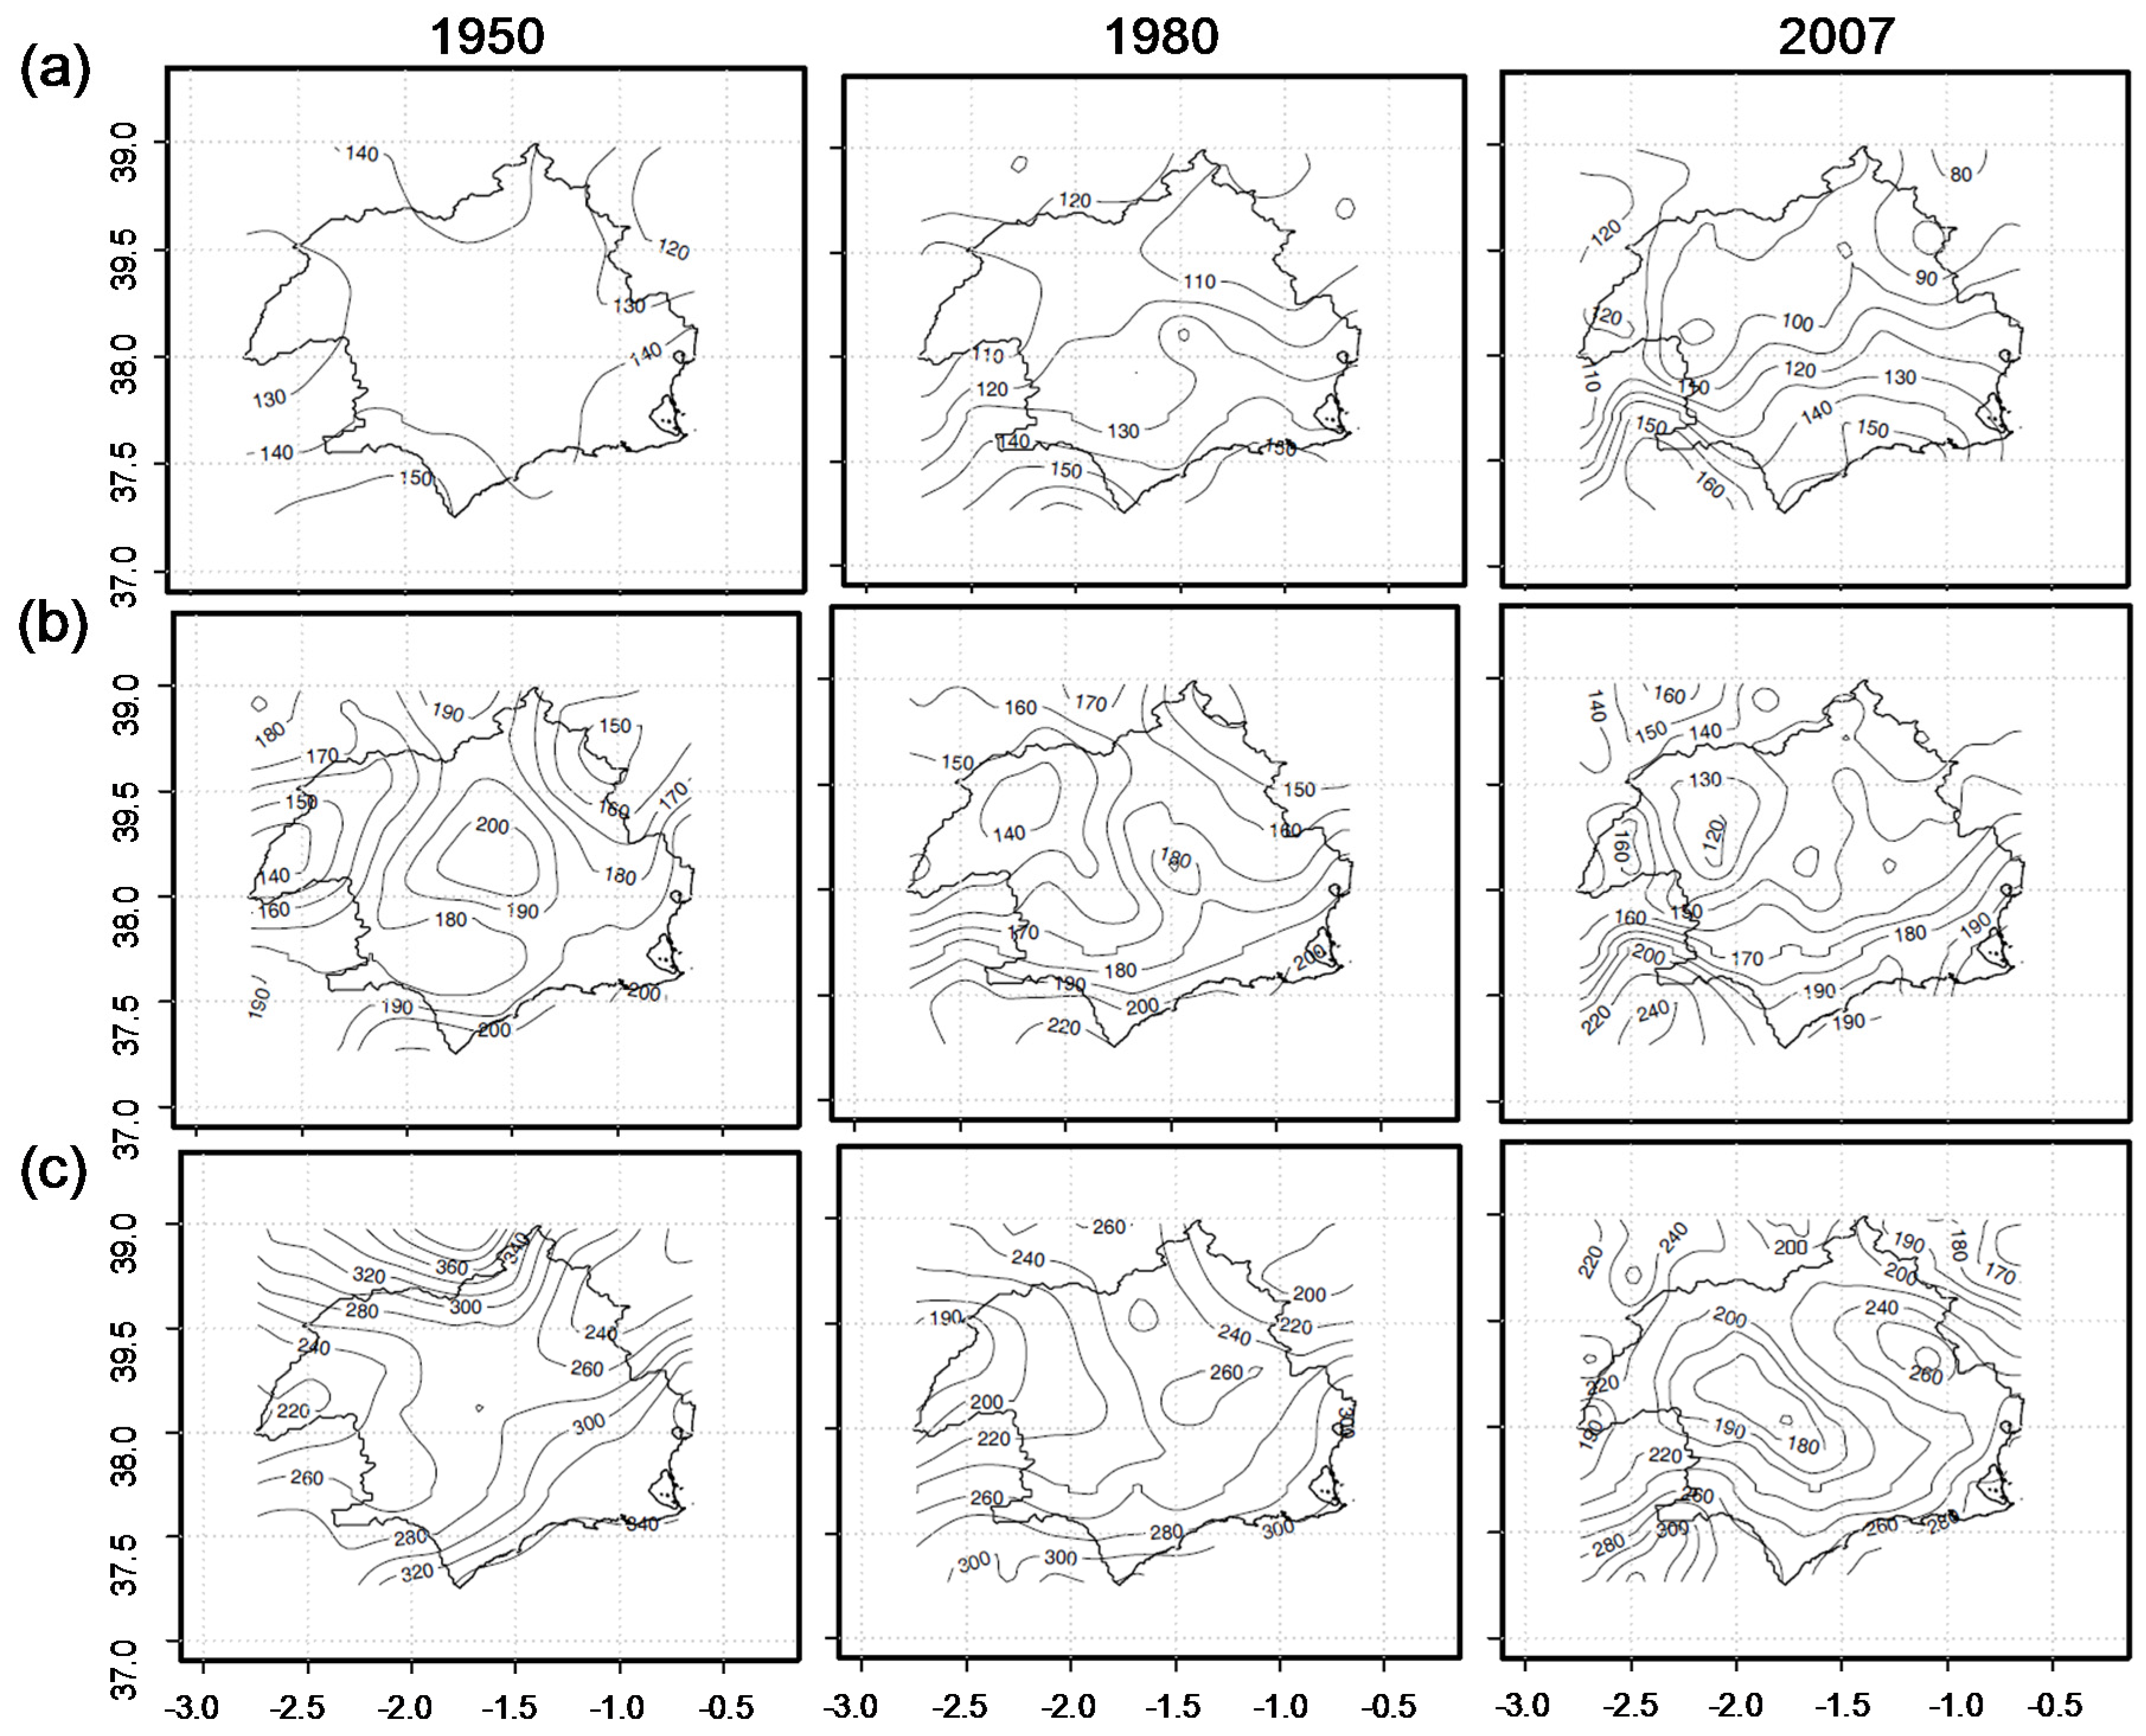
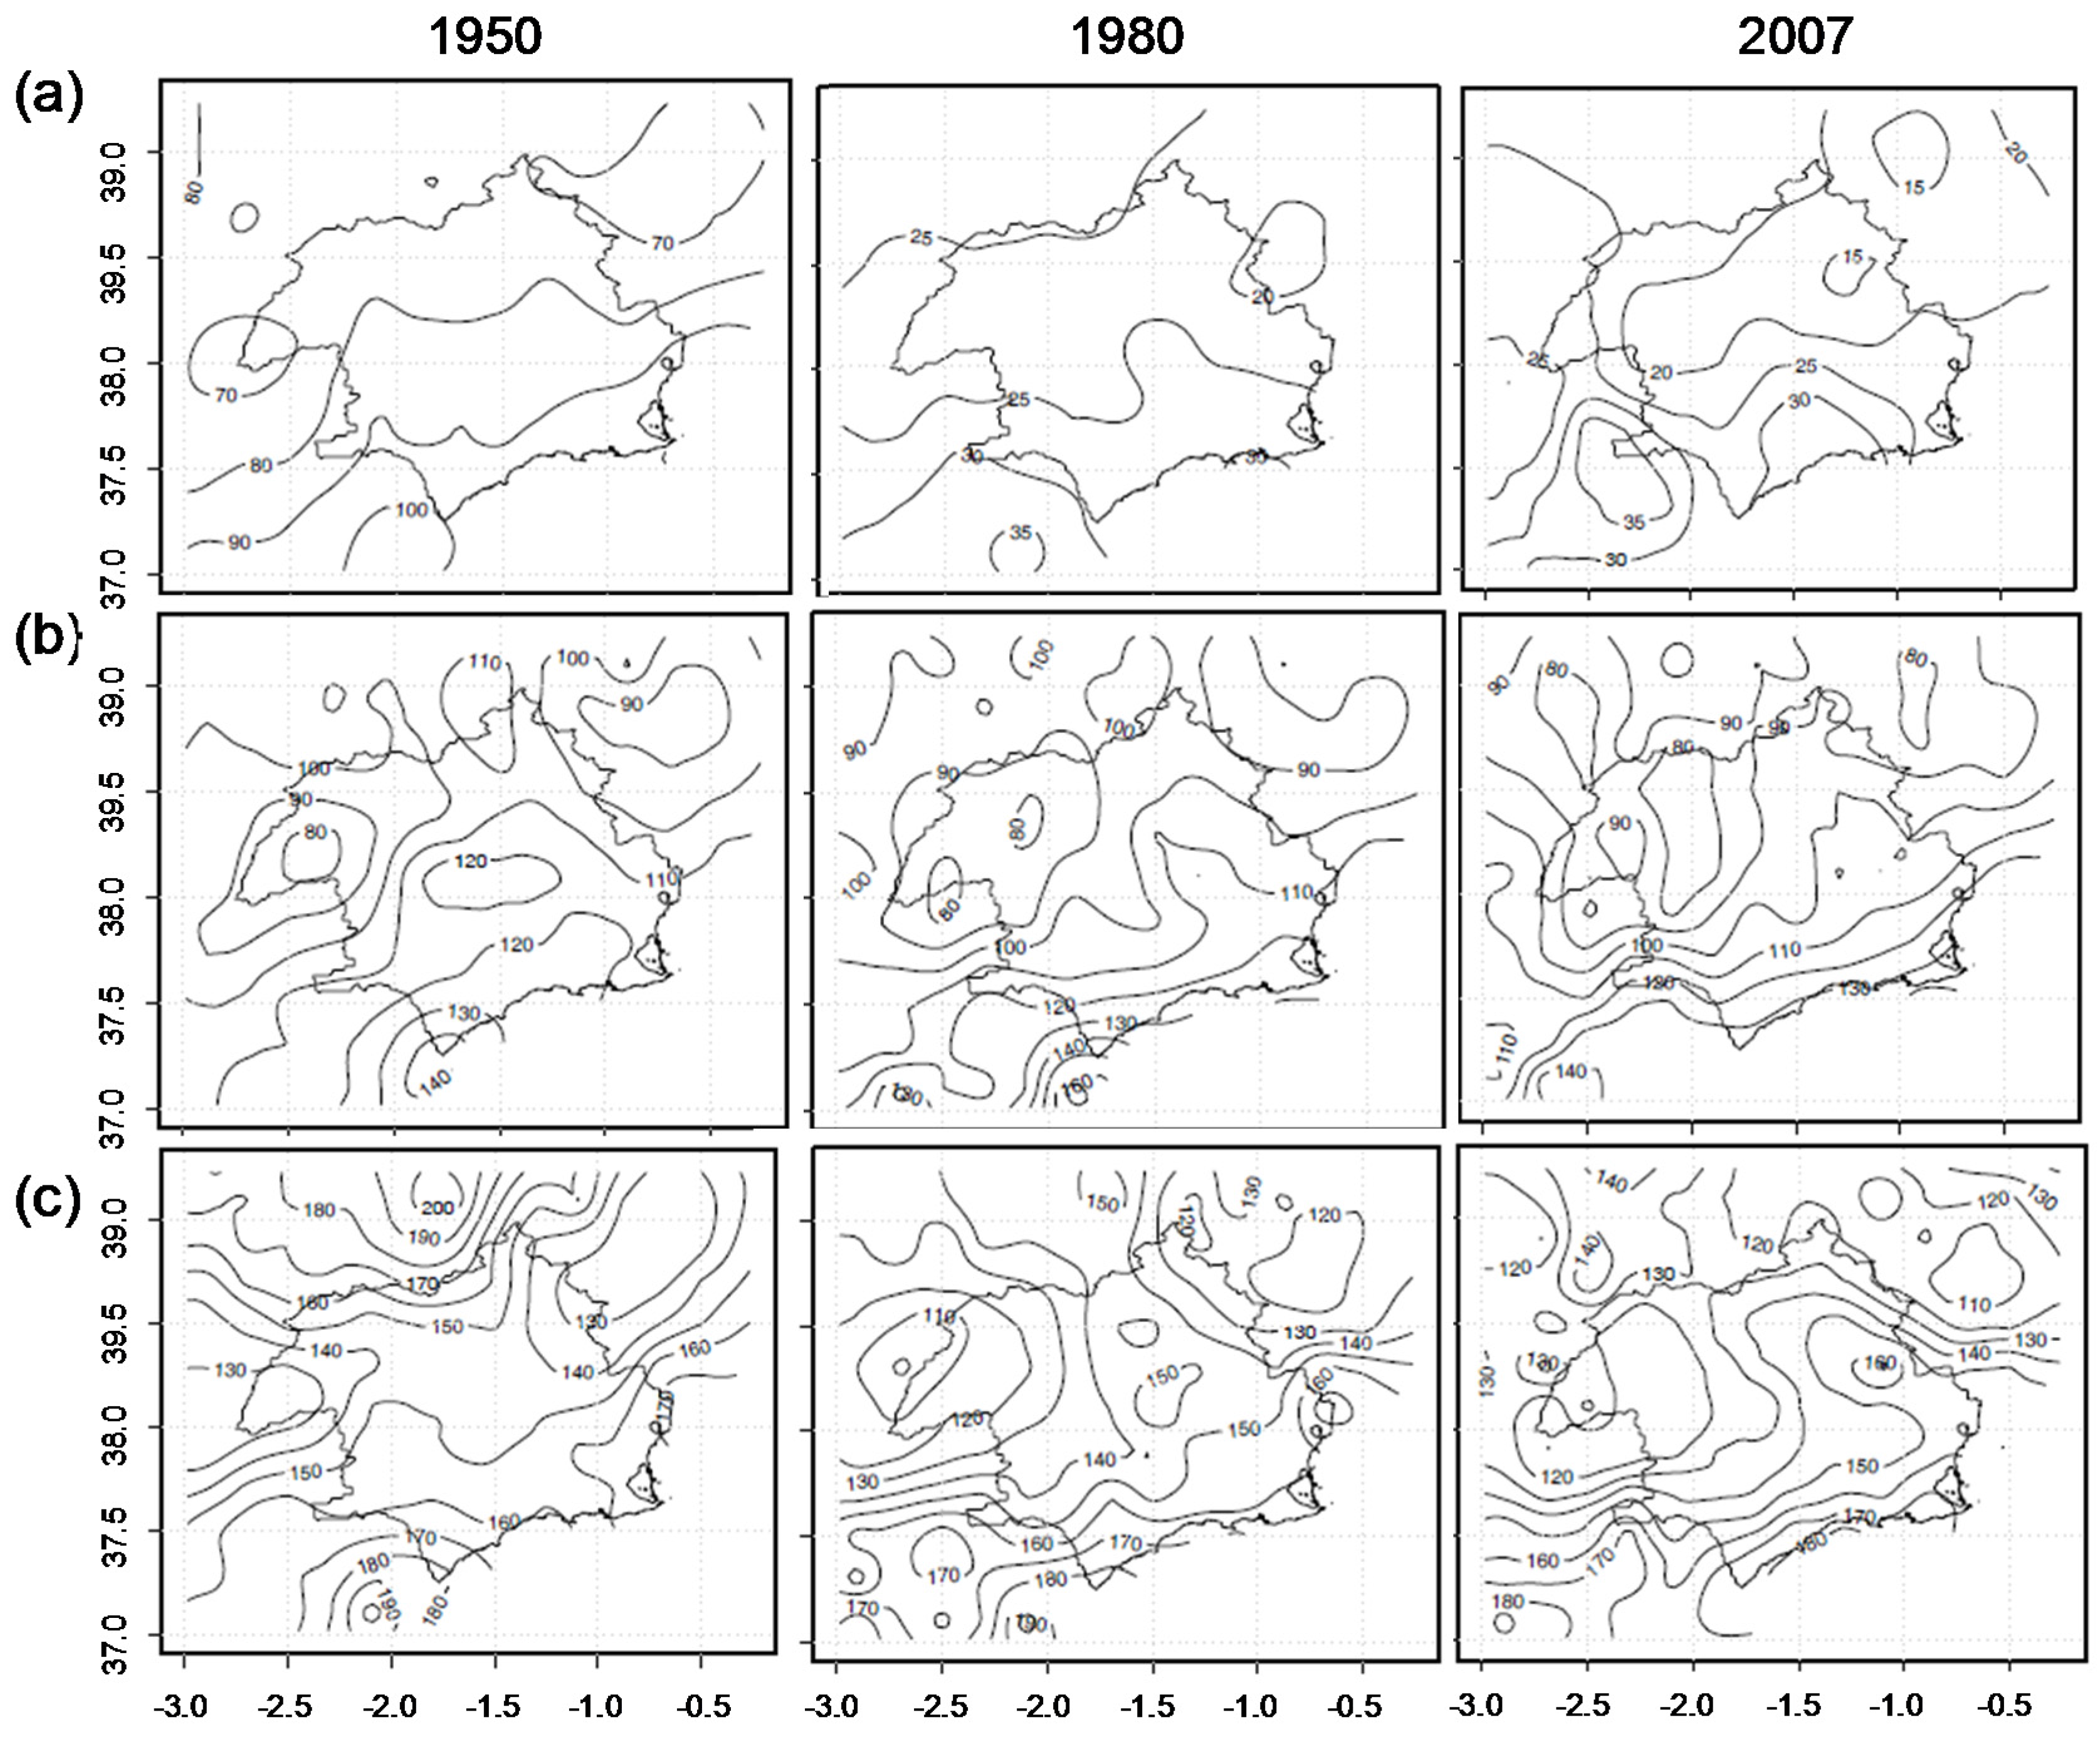
5.2. Spatial Distributions of MDLS Associated to Return Periods (Tr)

From the results obtained by GAMLSS tools for MDSL time series at grid site, the spatial distributions of quantiles for different return periods (Tr = 2, 5, 10, 25, and 50 years) were estimated.
Figure 9 represents the spatial distribution of MDSL (days) associated to Tr = 2 years, obtained from GAMLSS analysis for the years 1950, 1980, and 2007. Then in Figure 10, the spatial distribution of percentage change for 1980 as compared to 1950 (Figure 10a), and for 2007 with respect to 1980 (Figure 10b), are represented for Tr = 2 years. For example, if the year 2007 is analyzed (third column of Figure 9) in the headbasin of the Segura River, the MDSL of 60 days for 1 mm/day increases to 80 days for 5 mm/day, and to 110 days for the threshold of 10 mm/day, respectively.
Figure 9. Spatial pattern of MDSL (days) from GAMLSS analysis on each site for Tr = 2 years and thresholds: (a) 1 mm/day; (b) 5 mm/day; (c) 10 mm/day.
Water 07 05458 g009
Then for 1980 in comparison with 1950 (Figure 10a), decreasing trends of MDSL (%) for the threshold of 1 mm/day are observed for the whole basin. In some areas, the changes are greater than 10%. By increasing the rainfall threshold value, the percentage change decreases, with positive values for the threshold 10 mm/day in the coast area of the SRB. On the other hand, from the contrast of 2007 with 1980 (Figure 10b) for all thresholds considered, an increment of MDSL of 20% was observed in the headbasin of the Segura River for 2007.
From Figure 11, more severe MDSL for Tr = 25 years obtained from GAMLSS analysis on each site (for 1950, 1980, and 2007), are observed. Then, from the analysis of differences or changes (%) of 1980 with respect to 1950 (Figure 12a), decreases of MDSL for practically the whole basin (with the exception of the Guadalentín River) are observed for all the rainfall thresholds considered.
However, from the contrast of spatial distributions for 2007 compared to 1980 (Figure 12b), both in the headbasin of the Segura River and in the headwaters of the Guadalentín River, increases of MDSL of about 10% were observed for all rainfall thresholds considered. In this case, for 2007 (third column Figure 11) in the headbasin of the Segura River, more severe MDSL were observed (about 120 days, to 160 days, and 200 days, for the thresholds of 1, 5, and 10 mm/day, respectively).
In the study basin, the greater differences (%) in the spatial patterns of MDSL are presented with the lower return periods.
Figure 10. Spatial pattern of differences (Dif %) of MDSL, from GAMLSS analysis on each site for Tr = 2 years and thresholds: (a) Dif % (1980–1950)/1950; (b) Dif % (2007–1980)/1980. Dashed lines represent negatives values. Sites in solid gray, represent significant differences.
Water 07 05458 g010
Figure 11. Spatial pattern of MDSL (days) from GAMLSS analysis on each site, for Tr = 25 years and thresholds: (a) 1 mm/day; (b) 5 mm/day; (c) 10 mm/day.
Water 07 05458 g011
Figure 12. Spatial pattern of differences (Dif %) of MDSL, from GAMLSS analysis on each site for Tr = 25 years and thresholds: (a) Dif (1980–1950)/1950; (b) Dif % (2007–1980)/1980. Dashed lines represent negatives values.
Water 07 05458 g012

6. Discussion and Conclusions

This study describes the variability and discontinuities detected in the spatial patterns of drought events (both in length and number of events) in a semi-arid Mediterranean basin of Southeast Spain (Segura River Basin), by non-stationary modeling of time series.
Improving knowledge about expected trends of maximum dry spells is important for the management of water resources for irrigation agriculture, especially in a region where it is essential for socio-economic development and represents 80% of water use. In this basin, one of the driest in Europe, the study of the spatial distribution and recurrence of drought is especially important in the development of contingency plans, which are the leading edge of an adaptive management strategy. To take into account variability over time in drought hazard, time-dependent parameters of the PDFs are employed.
Since MDSL maps are associated with different return periods, constructed by GAMLSS tools applied at grid site, the spatial patterns of MDSL under non-stationary conditions can be assessed. Considering the years 1950, 1980, and 2007 comparatively and a rainfall threshold of 10 mm/day, more severe droughts (longer dry spells) in the header area of the basin (headbasins of the Segura River and Guadalentín River) were observed. However, a decrease of MDSL over coastal areas is identified. In conclusion, an intensification of the hydrological cycle through increases in length and severity of maximum dry spells of rainfall, for 2007 in comparison with 1980, mainly in headbasins of the SRB, was demonstrated.
The intensification of drought events obviously impacts on the components of the water cycle, with negative influences on hydrological series. While trends in precipitation may not directly translate into changes in streamflows, the antecedent soil moisture is a key factor in the response of the basin.
From the late 1970s, a similar pattern of reductions in contributions in headwaters of the Segura River Basin has occurred (for example in Figure 2 for the whole SRB). However, these runoff decreases are not clearly justified by the annual and monthly rainfall trends. The dry spells of rainfall are spread through the hydrological system causing drought in several components (vadose zone, surface runoff, and groundwater runoff).
In any case, the increase of MDSL generates low soil moisture, and therefore less recharge to aquifers and in turn less base flow, among other impacts. These facts, coupled with changes in land use (in this case, reforestation and the abandonment of agricultural land in river headbasins) which causes increases in water demands, and generates non-linear impacts on runoff.
In conclusion, a methodology for the identification of areas prone to drought hazards suitable for its application to other spatial scales (national or European scales, for example), was presented.
The results of this study could be considered by those responsible for decision making in order to improve the adaptive strategy to drought hazards, such as contingency plans. Finally, it is considered necessary for the community, from a multidisciplinary perspective (climatologists, statistical experts, and water resources engineers), to work collaboratively to develop, test, and implement consistent and reproducible consensus methodologies. This will allow to address the problem of non-stationarity of hydrometeorological time series such as that proposed, to achieve adaptive and sustainable management of water resource systems at basin scale.

Acknowledgments

This work has been developed in the framework of R&D Project CGL2012-39895-C02-01 HYDROCLIM, funded by the State Secretary of Research of the Spanish Ministry of Economy and Competitiveness (MINECO) and FEDER funds. The support received from the Spanish Ministry of Education, Culture, and Sport for Mobility Grant of Senior Professors and Researchers (Ref. PRX14/00748), and from Grant No 07.0329/2013/671258/SUB/C1 ASSET project funded by the European Commission, is gratefully acknowledged.

Author Contributions

Sandra G. Garcia Galiano applied and developed algorithms, and wrote the paper. Patricia Olmos Gimenez analyzed datasets and Juan Diego Giraldo Osorio developed algorithms and contributed to writing the paper. The authors contributed in similar dedication to this work.

Conflicts of Interest

The authors declare no conflict of interest.

References

  1. Labat, D.; Goddéris, Y.; Probst, J.L.; Guyot, J.L. Evidence for global runoff increase related to climate warming. Adv. Water Resour. 2004, 27, 631–642. [Google Scholar] [CrossRef] [Green Version]
  2. Huntington, T.G. Evidence for intensification of the global water cycle: Review and synthesis. J. Hydrol. 2006, 319, 83–95. [Google Scholar] [CrossRef]
  3. Kundzewicz, Z.W.; Mata, L.J.; Arnell, N.; Döll, P.; Kabat, P.; Jiménez, B.; Miller, K.; Oki, T.; Sen, Z.; Shiklomanov, I. Freshwater resources and their management. In Climate Change 2007: Impacts, Adaptation and Vulnerability. Contribution of Working Group II to the Fourth Assessment Report of the Intergovernmental Panel on Climate Change; Parry, M.L., Canziani, O.F., Palutikof, J.P., van der Linden, P.J., Hanson, C.E., Eds.; Cambridge University Press: Cambridge, UK, 2007; pp. 173–210. [Google Scholar]
  4. Milly, P.C.D.; Betancourt, J.; Falkenmark, M.; Hirsch, R.M.; Kundzewicz, Z.W.; Lettenmaier, D.P.; Stouffer, R.J. Stationarity is dead: Whither water management? Science 2008, 319, 573–574. [Google Scholar] [CrossRef] [PubMed]
  5. Hirsch, R.M. A perspective on nonstationarity and water management1. J. Am. Water Resour. Assoc. 2011, 47, 436–446. [Google Scholar] [CrossRef]
  6. Rigby, B.; Stasinopoulos, M.; Akantziliotou, C. Generalized additive models for location, scale and shape. Appl. Stat. 2005, 54, 507–554. [Google Scholar] [CrossRef]
  7. Mishra, A.K.; Singh, V.P. Drought modeling—A review. J. Hydrol. 2011, 403, 157–175. [Google Scholar] [CrossRef]
  8. Dracup, J.A.; Lee, K.S.; Paulson, E.G. On the definition of droughts. Water Resour. Res. 1980, 16, 297–302. [Google Scholar] [CrossRef]
  9. Martin-Vide, J.; Gomez, L. Regionalization of peninsular Spain based on the length of dry spells. Int. J. Climatol. 1999, 19, 537–555. [Google Scholar] [CrossRef]
  10. Paredes, D.; Trigo, R.M.; Garcia-Herrera, R.; Trigo, I.F. Understanding precipitation changes in Iberia in early spring: Weather typing and storm-tracking approaches. J. Hydrometeorol. 2006, 7, 101–113. [Google Scholar] [CrossRef]
  11. Vicente-Serrano, S.M.; Cuadrat-Prats, J.M. Trends in drought intensity and variability in the middle Ebro valley (NE of the Iberian Peninsula) during the second half of the twentieth century. Theor. Appl. Climatol. 2006, 88, 247–258. [Google Scholar] [CrossRef]
  12. Wet and Dry Spell Analysis Using Copulas. Available online: http://onlinelibrary.wiley.com/doi/10.1002/joc.4369/abstract;jsessionid=7114E4C372F3FEE469EDBF7D9646077C.f01t02?userIsAuthenticated=false&deniedAccessCustomisedMessage= (accessed on 5 October 2015).
  13. García-Herrera, R.; Hernández, E.; Barriopedro, D.; Paredes, D.; Trigo, R.M.; Trigo, I.F.; Mendes, M.A. The outstanding 2004/05 drought in the Iberian Peninsula: Associated atmospheric circulation. J. Hydrometeorol. 2007, 8, 483–498. [Google Scholar] [CrossRef]
  14. Estrela, M.J.; Peñarrocha, D.; Millán, M. Multi-annual drought episodes in the Mediterranean (Valencia region) from 1950–1996. A spatio-temporal analysis. Int. J. Climatol. 2000, 20, 1599–1618. [Google Scholar] [CrossRef]
  15. Vicente-Serrano, S.M.; López-Moreno, J.I. Hydrological response to different time scales of climatological drought: An evaluation of the standardized precipitation index in a mountainous Mediterranean basin. Hydrol. Earth Syst. Sci. 2005, 9, 523–533. [Google Scholar]
  16. López-Moreno, J.I.; Beguería, S.; Vicente-Serrano, S.M.; García-Ruiz, J.M. Influence of the North Atlantic Oscillation on water resources in central Iberia: Precipitation, streamflow anomalies, and reservoir management strategies. Water Resour. Res. 2007, 43, W09411. [Google Scholar] [CrossRef]
  17. Lorenzo-Lacruz, J.; Vicente-Serrano, S.M.; López-Moreno, J.I.; Beguería, S.; García-Ruiz, J.M.; Cuadrat, J.M. The impact of droughts and water management on various hydrological systems in the headwaters of the Tagus River (central Spain). J. Hydrol. 2010, 386, 13–26. [Google Scholar] [CrossRef] [Green Version]
  18. Boix-Fayos, C.; Barberá, G.G.; López-Bermúdez, F.; Castillo, V.M. Effects of check dams, reforestation and land-use changes on river channel morphology: Case study of the Rogativa catchment (Murcia, Spain). Geomorphology 2007, 91, 103–123. [Google Scholar] [CrossRef]
  19. González del Tánago, M.; Bejarano, M.D.; García de Jalón, D.; Schmidt, J.C. Biogeomorphic responses to flow regulation and fine sediment supply in Mediterranean streams (the Guadalete River, southern Spain). J. Hydrol. 2015, 528, 751–762. [Google Scholar] [CrossRef]
  20. Rodríguez-Caballero, E.; Cantón, Y.; Lazaro, R.; Solé-Benet, A. Cross-scale interactions between surface components and rainfall properties. Non-linearities in the hydrological and erosive behavior of semiarid catchments. J. Hydrol. 2014, 517, 815–825. [Google Scholar] [CrossRef]
  21. Ibrahim, B.; Karambiri, H.; Polcher, J. Hydrological impacts of the changes in simulated rainfall fields on Nakanbe Basin in Burkina Faso. Climate 2015, 3, 442–458. [Google Scholar] [CrossRef]
  22. Herrera, S.; Gutiérrez, J.M.; Ancell, R.; Pons, M.R.; Frías, M.D.; Fernández, J. Development and analysis of a 50-year high-resolution daily gridded precipitation dataset over Spain (Spain02). Int. J. Climatol. 2012, 32, 74–85. [Google Scholar] [CrossRef] [Green Version]
  23. Urrea Mallebrera, M.A.; Mérida Abril, A.; García Galiano, S.G. Segura River Basin: Spanish pilot river basin regarding water scarcity and droughts. In Agricultural Drought Indices. Proceedings of the WMO/UNISDR Expert Group Meeting on Agricultural Drought Indices; Mannava, V.K.S., Motha, R.P., Wilhite, D.A., Wood, D.A., Eds.; World Meteorological Organization: Geneva, Switzerland, 2011. [Google Scholar]
  24. Brouwer, C.; Heibloem, M. Irrigation Water Management, Training Manual 3: Irrigation Water Needs. Available online: http://www.fao.org/docrep/s2022e/s2022e00.HTM (accessed on 15 September 2015).
  25. Karl, T.R.; Nicholls, N.; Ghazi, A. Clivar/GCOS/WMO workshop on indices and indicators for climate extremes workshop summary. Clim. Chang. 1999, 42, 3–7. [Google Scholar] [CrossRef]
  26. Stasinopoulos, M.; Rigby, R.A. Generalized additive models for location scale and shape (GAMLSS) in R. J. Stat. Softw. 2007, 23, 1–46. [Google Scholar] [CrossRef]
  27. Villarini, G.; Smith, J.A.; Serinaldi, F.; Bales, J.; Bates, P.D.; Krajewski, W.F. Flood frequency analysis for nonstationary annual peak records in an urban drainage basin. Adv. Water Resour. 2009, 32, 1255–1266. [Google Scholar] [CrossRef]
  28. Giraldo Osorio, J.D.; García Galiano, S.G. Building hazard maps of extreme daily rainy events from PDF ensemble, via REA method, on Senegal River Basin. Hydrol. Earth Syst. Sci. 2011, 15, 3605–3615. [Google Scholar] [CrossRef]
  29. Schwarz, G. Estimating the dimension of a model. Ann. Stat. 1978, 6, 461–464. [Google Scholar] [CrossRef]
  30. Akaike, H. A new look at the statistical model identification. IEEE Trans. Autom. Control 1974, 19, 716–723. [Google Scholar] [CrossRef]
  31. Filliben, J.J. The probability plot correlation coefficient test for normality. Technometrics 1975, 17, 111–117. [Google Scholar] [CrossRef]
  32. Van Buuren, S.; Fredriks, M. Worm plot: A simple diagnostic device for modelling growth reference curves. Stat. Med. 2001, 20, 1259–1277. [Google Scholar] [CrossRef] [PubMed]
  33. López Bustos, C. Contribución al estudio del régimen de precipitaciones de Ciudad Real y su provincia. In Cuadernos de Estudios Manchegos; Publicaciones del Instituto de Estudios Manchegos: Ciudad Real, Spain, 1958; pp. 55–71. (In Spanish) [Google Scholar]
  34. Katz, R.W.; Brown, B.G. Extreme events in a changing climate: Variability is more important than averages. Clim. Chang. 1992, 21, 289–302. [Google Scholar] [CrossRef]
  35. Villarini, G.; Smith, J.A. Analysis of the stationarity of floods peaks in the United States. In Workshop of Nonstationarity, Hydrologic Frequency Analysis, and Water Management; Olsen, J.R., Kiang, J., Waskom, R., Eds.; Colorado Water Institute: Boulder, CO, USA, 2010; pp. 81–97. [Google Scholar]

