4. Need for River Water Treatment and Potential of Natural Treatment Systems
4.1. Current Use of Untreated River Water for Irrigation
Hyderabad has the capacity to treat only about half of its sewage (
Table 1). Most of it was implemented only recently [
12], whereby treatment still is not at full capacity [
13]. Although industrial wastewater should be treated at two Common Effluent Treatment Plants, many small industries are still not connected.
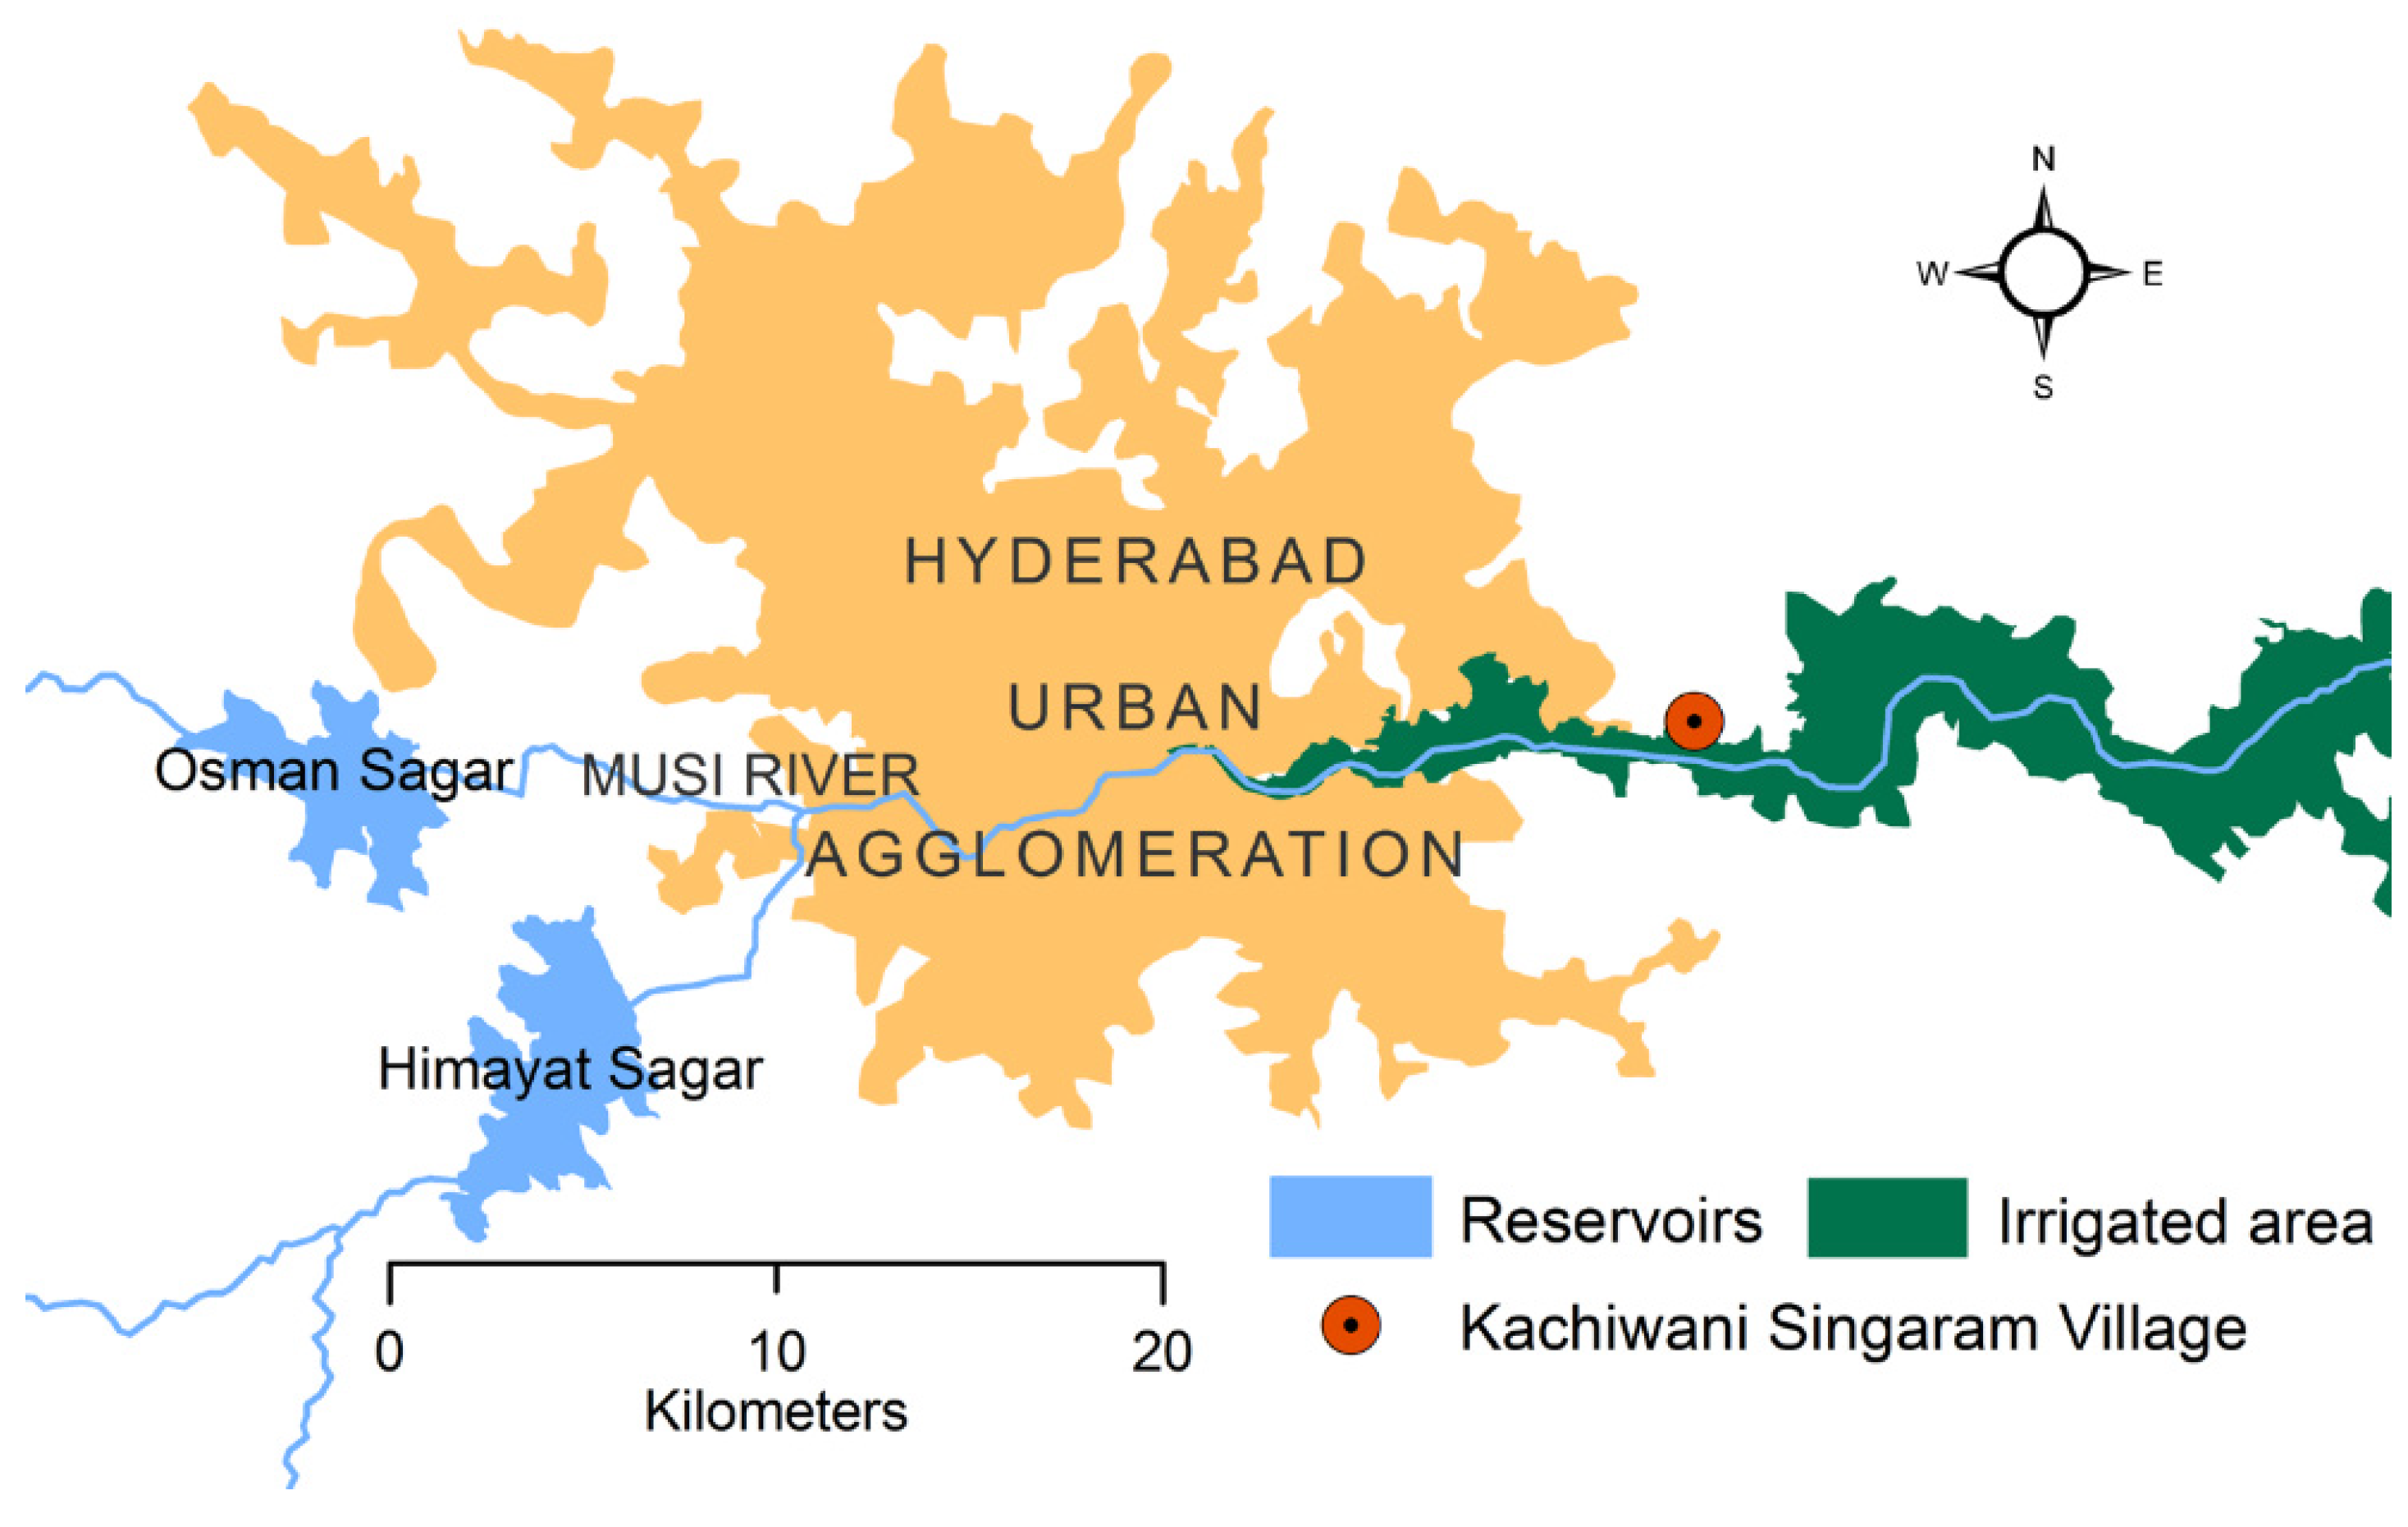
Water from the Musi River is used downstream of the city for growing rice, vegetables and para-grass (
Urochloa mutica) for fodder. The irrigated areas are shown in
Figure 1. It is estimated that the Musi River irrigates around 100 hectares (ha) of para-grass [
14]. Downstream river water is diverted to irrigation canals on both sides. The natural slope (gravity flow) and lift irrigation allow for the irrigation of land 1–2 km away from the river [
15]. Different studies have estimated that about 9309 ha [
16], 15,974 ha [
17], or 40,600 ha [
18] are being irrigated. In addition, farmers extract groundwater from bore wells and open wells [
15].
The peri-urban village Kachiwani Singaram (
Figure 1) was studied in detail. It is located 15 km downstream of the city center in the eastern direction of Hyderabad city along the northern bank of the Musi River between the rural villages of Parvatapuram and Qutbullapur in the Ranga Reddy district. The climate is semi-arid with average annual rainfall of 783 mm [
19]. Monthly average rainfall ranges from 5.9 mm in December to 178.7 mm in August. About 74% of the total rainfall (828.5 mm) occurs between June and September. Minimum and maximum mean temperatures range from 14.5 to 28 °C in December and from 26.2 to 39 °C in May [
20]. As to the cropping pattern [
15,
21], vegetables and para-grass grow during all seasons (Khariff = monsoon crop from July to October, Rabi = winter crop from October to March, and Zaid = summer crop from March to July). Rice is grown during Khariff and Rabi, whereby rice fields may be used for vegetables during Rabi and Zaid. For irrigation, both groundwater and polluted river water are used.
Table 1.
Current wastewater treatment capacity of sewage treatment plants and systems associated with lakes.
Table 1.
Current wastewater treatment capacity of sewage treatment plants and systems associated with lakes.
| Treatment Plants in Italics | Value (MLD) | Source of Information |
|---|
| Sewage (80% of water supply to the city) | 1250 | Hyderabad Water Supply and Sewerage Board |
| Amberpet | 339.0 |
| Nagole | 172.0 |
| Nallacheruvu | 30.0 |
| Attapur | 51.0 |
| Hussain Sagar | 20.0 | Greater Hyderabad Municipal Corporation |
| Patel Cheruvu | 2.5 | Hyderabad Metropolitan Development Authority |
| Pedda Cheruvu | 10.0 |
| Durgam Cheruvu | 5.0 |
| Mir Alam Cheruvu | 10.0 |
| Saroor Nagar Lake | 2.5 |
| Safil Guda Lake | 0.6 |
| Langer Houz Lake | 1.2 |
| Noor Mohammad Kunta | 4.0 |
| Ranghadhamini Lake | 5.0 |
| Treatment capacity | 652.8 | Sum |
| Untreated | 597.2 | Sewage minus treatment capacity |
Figure 1.
Irrigated areas in and downstream of Hyderabad city [
22].
Figure 1.
Irrigated areas in and downstream of Hyderabad city [
22].
4.2. Resulting Risks to Human Health and the Environment
The risk assessment was based on [
23] and own research conducted in the course of the project Saph Pani (see acknowledgments). The following risks were identified for the Musi River water and for groundwater (assessing water use for irrigation respectively for drinking):
Fecal coliforms: Contamination was evident in the post monsoon season. Indicator levels above 1600 MPN/100 mL were observed (MPN: most probable number method to count bacteria), whereas 1000 MPN/100 mL is the Indian discharge standard for land application according to the National River Conservation Directorate Guidelines for Fecal Coliforms;
cf. the WHO (World Health Organization) discussion [
24]. Indications of pathogenic bacteria (
E. coli of serotype O157:H7) were found only in well samples (post monsoon). While the presence of microbial contamination was highly variable, the risk of using contaminated water for irrigation cannot be over emphasized, since
E. coli in irrigation water may enter the food chain via leafy green vegetables (
cf. [
25]). Native groundwater pollution was evident but risk to aquifer was rated uncertain due to insufficient data.
Maximum fluoride concentration (1.78 mg/L in some groundwater samples) was above WHO guideline values for both drinking water and irrigation, and above Indian guideline value (1.5 mg/L).
Certain vegetables, e.g., onions, are known to absorb heavy metals, such as chromium [
26]. Cadmium, zinc and lead were found in soil and plants, but in concentrations below the EU (European Union) maximum permissible level; they were rated as low risk to human endpoints. Reactive metals were present but risk was rated uncertain due to limitations in data.
High source water salinity, flood irrigation practice and arid climate conditions have caused high salinity risks from canal water. (Electrical conductivity measured in canal water was as high as 1510 μS/cm; for some groundwater samples 2480 μS/cm.) Sodium and salinity hazard was scored as high (Wilcox diagram), which affects all types of vegetables and paddy rice grown in this area. Sodium and chloride in canal water posed a toxicity risk to plants.
Total dissolved solids (TDS) in one well were rated as high risk for drinking water. TDS of 1331 mg/L exceeded the national guideline value, 500 mg/L, and the WHO guideline value, 600 mg/L.
Nitrogen and phosphorus concentration in several samples were above recommended guideline values for human (nitrate) and environmental endpoints. While plants have a high nitrogen demand during initial growth stages, this demand decreases during flowering and maturation. Phosphorus may result in a zinc deficit in rice and decrease rice yield. However, it has to be assessed against the fertilizer value of phosphorus in water, other fertilizer inputs, the retention capacity of the soil as well as plant growth and associated reactions with trace elements.
No guideline values or data exist for organic carbon in irrigation water, but it plays an important role in redox reactions (iron and manganese dissolution) and can induce biological clogging.
Six water samples were positive for pesticides: 4-4-dichlordiphenyldichlorethen (a breakdown product of dichlorodiphenyltrichloroethane (DDT)), alpha to delta-hexachlorocyclohexane (HCH), atrazine, malathion, and parathion. In particular, values for one domestic well were above drinking water guidelines for alpha and beta-HCH. This water was rated a high risk. Environmental risk for aquifer and soil were rated uncertain as these pesticides are very persistent, and their current use was not assessed. However, the amount that can persist on top of leaves after irrigation or that can be ingested through aerosol inhalation will be very low, thus not posing a risk to any of the ingestion end points (crop and spray).
4.3. Potential of Natural Treatment Systems
The Hyderabad Metropolitan Water Supply and Sewerage Board is expected to provide 100% treatment of the city’s wastewater before it is discharged into the Musi River (legal issues: [
27]). As shown above, only about 50% of the wastewater is partially treated at secondary level and an augmentation of the capacity to 100% through construction of new wastewater treatment plants may not be realistic given the urban growth and population increases. Hence, it is prudent to plan for treatment of the river water before it is used for irrigation, as it can be expected that farmers would continue to use the water for irrigation of food crops, and this proposition could be an intermediate solution. To keep the costs and operational efforts low, and making it affordable for farmers, natural treatment systems such as constructed wetlands is viewed as a suitable option. Treatment may be decentralized, on the plot of interested farmers, or centralized, where farmers feed their channels with treated river water.
Typically, engineered constructed wetlands (CWs) are designed to achieve removal of organics, pathogens, heavy metals, and nutrients. As follows from a global review [
28], all types of constructed wetlands are very effective in removing organics and suspended solids, whereas removal of nitrogen and phosphorous is lower, unless special media are used.
A key issue for the present project is the improvement of the microbiological quality of treated wastewaters in terms of pathogen reduction. Other problems, such as salinity or overuse of fertilizers and pesticides, are important, too, but they were not addressed (see the end of
Section 6.2 for pertinent recommendations).
The removal of pathogens has been widely studied using enteric indicator organisms, such as total coliforms, fecal coliforms,
E. coli, or bacteriophages. A wide range of studies have recently been conducted on the effects of various configurations and different operating parameters of constructed wetlands on the removal of pathogens [
29,
30,
31,
32] and modeling of pathogen removal [
33,
34,
35,
36]. Based on the experience gained through the systematic survey of constructed wetlands in India as well as the results obtained from the experiments being conducted in the present research, for properly operated real-life systems a number concentration reduction of pathogen in the range of 3 to 4 log-units may be expected.
4.4. Summary of the Technical Design
For the Musi River water treatment, horizontal subsurface-flow (because of mosquitoes) constructed wetlands were considered, which are typically employed for treatment and reuse of treated sewages and sometimes even for treatment of industrial effluents. Such wetlands include “reed beds” and “root-zone” treatment methods [
37] devised to obtained environmental duty from the macrophytes cultivated in trenches or on beds saturated with sewages or wastewaters. The wetland is normally a shallow bed, about 0.3 to 0.8 m deep, filled with layers of gravel (<15 mm) and sand (or sandy loam) of porosity around 42%. In certain situations, formation of the root-zone needs to be selectively created by mixing finer fraction with sandy soil or compost with local soil.
The bed could be of any geometric shape, preferably having a four to five times longer flow path when compared with the distance between two parallel edges. In several situations, an impervious layer is needed (with hydraulic conductivity of 10
–8 to 10
–9 m/s [
38]).
The inlet and outlet zones of wetland are important for maintaining a desirable hydraulic flow regime and for ensuring uninterrupted operation. Therefore, these zones are filled with larger gravels (50 to 100 mm). A water level regulation chamber is also normally devised before final discharge. There is a baffle in the exit chamber (see [
38] for all engineering details); its adjustable height helps in fine-tuning (e.g., loss of head).
Two important aspects are to be kept in mind for design: removal parameters and hydraulic flow considerations.
Table 2 depicts design norms in the context of treating raw domestic wastewaters. Thereby, compared to systems operating in temperate climate, in the Indian context higher inactivation rates could be observed [
36], allowing building smaller treatment systems with shorter retention times. Further, national standards may differ considerably, making treatment less costly in India. For instance, the USA standard NSF 41 (non-liquid saturated treatment systems) states that the liquid end products shall not contain fecal coliforms in excess of 200 MPN per 100 mL, rather than 1000 MPN, as in India (National River Conservation Directorate Guidelines for Fecal Coliforms) or South Africa (South African Wastewater Services Incentive-based Regulation).
Table 2.
Design parameters for constructed wetlands for domestic wastewaters (adapted from [
38]).
Table 2.
Design parameters for constructed wetlands for domestic wastewaters (adapted from [38]).
| Parameter | Unit | Sample Values from Literature and Recommendations |
|---|
| Europe | India |
|---|
| Area requirement | m2/person | 2–5 | 1–3 |
| BOD5 loading rate (biological oxygen demand over 5days) | g·m−2·day−1 | 7.5–12.0 | 17.5–35.0 |
| Retention (residence) time, T | Day | 2–7 | 1–5 |
| Hydraulic loading rate | mm/day | Must not exceed hydraulic conductivity of bed |
| Depth of bed,
H | m | 0.25–0.75 | 0.3–0.8 |
| Porosity of packed bed, η | % (100% = open water) | 25%–50% or 0.25–0.5 | 30%–70% or 0.3–0.7 |
| Reaction rate constant, e.g., K = KBOD | day−1 | seasonal (temperature) | 0.17–0.30 |
| Evapo-transpiration losses | mm/day | 10–15 | 10–30 |
The estimation of the design parameter needed to achieve a prescribed treatment performance may be approximated by a model of first-order, plug flow kinetics [
38]. The methodology given below exemplifies the removal of BOD
5 (similarly: nitrification, inactivation of pathogens).
The following model equations are used:
In Equation (1), T is the hydraulic retention time (day), K is the reaction constant, e.g., K = KBOD (day−1) for removal of BOD5, and C0 and CT are the inlet and the desired outlet BOD5 concentrations (mg/L), respectively. In Equation (2), V is the volume of the wetland bed (m3), which includes water and media volumes, Q is the average flow of wastewater to the system (m3/day) and η is the porosity of the packed bed (dimensionless fraction of volumes or %). In Equation (3), A is the plan area of the bed (m2) and H the (average) depth (m) of the wetland bed.
These formulas are applied to estimate the size of a constructed wetland suitable to treat Q = 100 m3 of Musi river water per day, based on Indian water quality requirements for safe irrigation water. For a farmer, the needed wetland size is then adapted proportionally to the maximal daily irrigation requirement Q of that farm (or that cluster of farms, if farmers cooperate in river water treatment). As outlined later, for a typical farmer in the vicinity of the Musi River, with 1/4 acre land holding, merely about 5% of the flow assumed in this computation would be required.
Musi River water is essentially a mixture of untreated sewage, diluted by partially treated sewage, generated by the City of Hyderabad, whereby over the distance of 15 km (between Hyderabad and Kachiwani Singaram) water quality in the Musi River improves by the virtue of natural treatment in the ecosystem. With respect to fecal coliforms, river water quality was found to be fairly low. Hence in this case study,
C0 = 1600 CFU/100 mL (colony forming units CFU, whereby MPN of
Section 4.2 is a probability estimate for CFU) was assumed to be the quality of water subjected to the treatment; the desirable quality of irrigation water was assumed to be
CT = 1000 CFU/100 mL. This level has been recommended by WHO and adopted by India for irrigation of vegetables to be cooked [
24]. With an exponential inactivation rate in Equation (1) of
K = 0.025 to 0.062 per hour (seasonal variability for dark control in [
35]/
Table 2), a reduction of fecal coliforms by 45%–74% could be achieved with
T ≤ 24 h, which would suffice. Based on these estimations, for farmers in Kachiwani Singaram, it could, therefore, be recommended that a day’s retention-time would be adequate for achieving a desirable extent of treatment. This hydraulic retention time of
T = 1 day is still within the range recommended for treatment of domestic sewages, as shown in
Table 2.
From Equation (2) it shows that for one day retention time the needed wetland bed volume is about
V = 238 m
3 (using porosity η = 0.42). Assuming that
H = 0.8 m (
Table 2), from Equation (3) it follows that the needed area would work out to be
A = 298 m
2. If one takes also into account evaporation losses of 30 mm in one day (maximum in
Table 2), a slightly larger inflow is needed to ensure an output of 100 m
3 treated water for irrigation; an inflow of
Q = 104 m
3 would suffice. (The computation can be done in a spreadsheet, using goal-seek.) Accordingly, the site area has to be adjusted to
A = 309 m
2.
It is interesting to note that the water quality in the Musi River varies in fair and dry seasons and may deteriorate in years to come due to rising pressure of population on the peri-urban communities surrounding the Metropolis of Hyderabad. Clearly, it would be prudent to adopt a conservative approach while planning and designing the treatment facilities for the farmers around the Musi River. Assuming a ten times higher pollution load of 16,000 CFU/100 mL and assuming the same range of inactivation rates, then a retention time of two to five days would be recommended. The required site area would be
A = 392 m
2 (assuming a free water surface constructed wetland with
K ≥ 0.1 per hour [
35],
T = two days,
H = 0.8 m, η = 0.75, evaporation = 30 mm/day).
4.5. Cost Estimation
The following cost estimation is based on a constructed wetland with plan area A = 200 m2. The actual size will be adapted proportionally to the needs of a typical farmer in the vicinity of the Musi River. The amount of wastewater treated in 200 m2 area depends on the pollution (e.g., coliforms, BOD) and the extent of treatment considered desirable by the community, as is evident from the above model Equation (1). Two cost components are important for constructed wetlands, namely the capital cost for the construction and the operation and maintenance (O&M) costs.
The capital costs include various civil works for establishment of the primary settling tank, wetland bed, treated water collection unit and the costs associated with media (and plants) to be filled in the bed. For estimation of capital costs, information from rural India was available [
39], which demonstrated that capital costs may vary from place-to-place due to variation in material costs, labor charges and transportation costs of construction material to the construction site. Other factors within the same village were specific needs for a given location, e.g., underlain strata, need for specific leak-proofing method and the extent of primary treatment. Further, costs are double in Indian cities as compared with smaller towns and villages. In the present exercise, only construction costs have been taken into consideration because the land costs are highly variable and it is impossible to incorporate them in the cost estimates.
Taking these caveats into account, in a rural setting the construction costs for a 200 m2 constructed wetland comprised of the wetland bed, sludge bed, sewage settling tank and fencing was estimated to be about 1,000,000 Indian Rupees INR (ca. 12,000 €); i.e., about 5000 INR/m2.
The typical operation and maintenance activities are regular cleaning of primary treatment units, cutting and pruning of vegetation grown in the wetland bed and managing the treated water for further use. In addition, unskilled persons can handle this, whereby the number of persons required depends upon the size of treatment systems. Based on experience from India [
39], to operate systems with a capacity of up to 150 m
3 sewage per day, one unskilled person suffices. Compared to mechanized systems, this is a major advantage of constructed wetlands.
5. Results of the Surveys
5.1. Interests of Stakeholders
Several governmental stakeholders have an interest in reuse of treated wastewater and natural wastewater treatment systems. Their interest is directly linked to the mandate. At the national level these are (see [
27,
40] for their mandates and interests).
Central Pollution Control Board: In order to prevent and control environmental pollution, it defines standards and prepares manuals, codes and guidelines relating to treatment and disposal of sewage. For the present project, it has interests in the protection of the Musi River and the groundwater against pollution.
Ministry of Environment and Forests: It is responsible for the funding under the National River Conservation Plan. About 3 billion INR (39 million Euros) are earmarked to improve Musi River water quality. Amongst the relevant interests are the protection of rivers, aquatic biodiversity, and prevention and abatement of pollution.
Ministry of Water Resources: It formulates the National Water Policy, which is favorable towards the use of treated wastewater for irrigation, and has interest in the development and management of water resources.
Ministry of Urban Development: It formulates the National Urban Sanitation Policy and has interest in the management of urban wastewater and service delivery.
At the state level, Hyderabad is the capital of two states, Telananga and Andhra Pradesh. Both states have interests in cleaning up the Musi River.
Pollution Control Board: The tasks include the analysis of river water quality, control of discharge (of industries) to the river and awareness for the development of technology. As for the Central Pollution Control Board, the interest is in the protection of the river and the ground water.
Government: The “old” Andhra Pradesh state has been involved with a 30% share in the funding of the Musi River Conservation Plan. The state governments have interest in the protection of the river and the groundwater in order to provide water services (drinking water, irrigation, industry) also downstream of Hyderabad.
Water Resources Development Corporation: It is responsible for pollution prevention of river water used for irrigation and the implementation of irrigation and drinking water supply projects. Thus, the relevant interests are in the protection of water bodies from pollution and the provision of water supply infrastructure.
Water, Land and Trees Authority: It regulates exploitation of surface and groundwater and promotes water conservation. As its national counterpart, it is interested in the protection of water resources and water saving.
Institutions at the municipal level are directly involved in the project:
Greater Hyderabad Municipal Corporation: This is the city government and it is responsible for all types of urban development activities and services through its multiple wings. It has thus also interest in the protection of water resources.
Hyderabad Metropolitan Water Supply and Sewerage Board: It is responsible for the water supply of the city, its wastewater treatment and the operation of systems. It has interest in the provision of adequate water services (water supply, wastewater collection and treatment) to consumers.
Hyderabad Metropolitan Development Authority: It prepares the Master Plan for Hyderabad. It has interests in economic development and this may be in conflict with goals of the preservation of natural habitats.
In addition, various institutions of civil society or special interest groups in and around Hyderabad have interests in the project.
Forum for a Better Hyderabad and similar civil society organizations: They work for a better environment and therefore have interest in protecting the water resources.
Research institutions (IWMI, Osmania University, Hyderabad Central University, the Ronald Ross Institute of Tropical Diseases, Center for Economic and Social Studies and the University of Hyderabad): They study river water quality, urban agriculture, water pollution, etc. and provide the public with scientific background information. They have an interest in awareness rising for the problems studied.
Health institutions: They monitor the health of the population and have an interest in improving it, in particular concerning farmers (who handle polluted water), residents (who may be exposed to drinking water from polluted groundwater wells) and consumers (who may be exposed to heavy metals or pathogens in the food chain).
Industry: There are twofold interests, as those discharging wastewater to the Musi River want do this at low costs, while those using river water have an interest in clean water.
Farmers’ associations, such as Bhagya Nagar Kisan Sangh of urban farmers, have an interest in protecting and representing the farmers’ interests, in particular with respect to irrigation.
Farmers within Hyderabad (ca. 250 farmers) and downstream: They use river water for irrigation of rice, vegetables and para-grass (in Hyderabad only para-grass) and have contradictory interests in the use of river water: On the one hand, cleaner irrigation water is in the interest of their health. On the other, many think that untreated water would be beneficial for its nutrient content, allowing them to safe expenses for fertilizers.
City residents: On the one hand they have an interest in keeping their sewerage charges low. On the other, they benefit from water treatment by a cleaner environment along the Musi River (e.g., recreation). Further, there are health benefits for consumers, if irrigation water is treated and thus heavy metals and pathogens are less likely to enter the food chain.
5.2. Perception of Stakeholders
A survey identified the views of representatives of institutional stakeholder, who were interested in the natural wastewater treatment of irrigation water and took part at a stakeholder workshop about this topic. Following the POSAF (project-oriented sustainability assessment framework) approach [
2], their preferences were inquired in the context of two development scenarios: environmental preservation or economic development. The use of development scenarios has also been successfully applied in the context of peri-urban Mexico City [
41].
The scenario for economic development would be people-centric. Thus, it would be acceptable to people, whose livelihoods it supports. Environmental benefits would be low on the priority agenda, unless landscaping, i.e., beautification of river fronts, were undertaken as part of development. Thereby, indirect health benefits could be expected (e.g., the mosquito nuisance and associated diseases may be addressed).
The participants of the workshop came from institutions that had an environmental agenda. Therefore, the analysis was based on the assumption that the common interest of the stakeholders was in the scenario “environmental preservation”, i.e., preservation of the habitat. Respondents were aged 27 to 60, a third of them women; 14 came from academia, 7 from government and 4 from other institutions (non-governmental organizations, water user associations).
Urbanization was perceived as a key issue: The large majority of the respondents expected the Musi catchment to become urbanized within the next decade, but instead they wished to preserve it as a natural habitat for future generations. They were optimistic about solutions to water pollution and felt that irrigation with untreated water should stop (as foreseen by the law). To this end, they supported the use of treated water for irrigation and considered constructed wetlands or similar solutions as suitable.
Table 3 displays their views. However, with regard to the questions about who should be responsible for the planning of a natural wastewater treatment system, who should be in charge of the operation (and also water quality monitoring, maintenance), and who should pay, there was no clear preference: For planning and operation respondents mentioned Hyderabad Metro Water Supply and Sewerage Board, the Irrigation & Command Area Development Department, but also diverse other government departments, water user associations, or private agencies. Similarly, respondents had diverse ideas for financing.
Table 3.
Confidence interval for the stakeholder views about environmental preservation
Table 3.
Confidence interval for the stakeholder views about environmental preservation
| Inquired View | Agree | Lower | Upper |
|---|
| Urbanization is expected | 80% | 62% | 92% |
| Catchment ought to be preserved | 100% | 89% | 100% |
| Pollution is solvable | 88% | 71% | 97% |
| Irrigation with untreated water should end | 88% | 71% | 97% |
| Irrigation with treated water would be beneficial | 100% | 88% | 100% |
| Constructed wetlands are suitable for this purpose | 96% | 82% | 100% |
Stakeholder representatives were also interviewed about their motivation, both specifically for each question, and generally, about the importance of key criteria for technology selection to them, asking them about the relative importance of pollution control, costs, acceptance by users, efforts (ease of operation, other institutional issues), and safety for health. This resulted in two clusters, cost-conscious and health-conscious respondents (
Table 4).
The first cluster (C) refers to a smaller group of four respondents, all in academia, to whom costs mattered (criterion ranked as first or second most important), whereas health was not so important (ranked third to fifth).
The second cluster (H) refers to a larger group of 15 respondents, for whom health mattered (criterion ranked as first or second most important), whereas costs were not so important (ranked third to fifth).
As for other respondents (O), two stated no preferences and four others put pollution or ease of use (2 respondents each) in number-one position.
As described in
Section 3 for the methods, using AHP quantitative criteria weights for technology selection were computed from the stakeholder responses, see
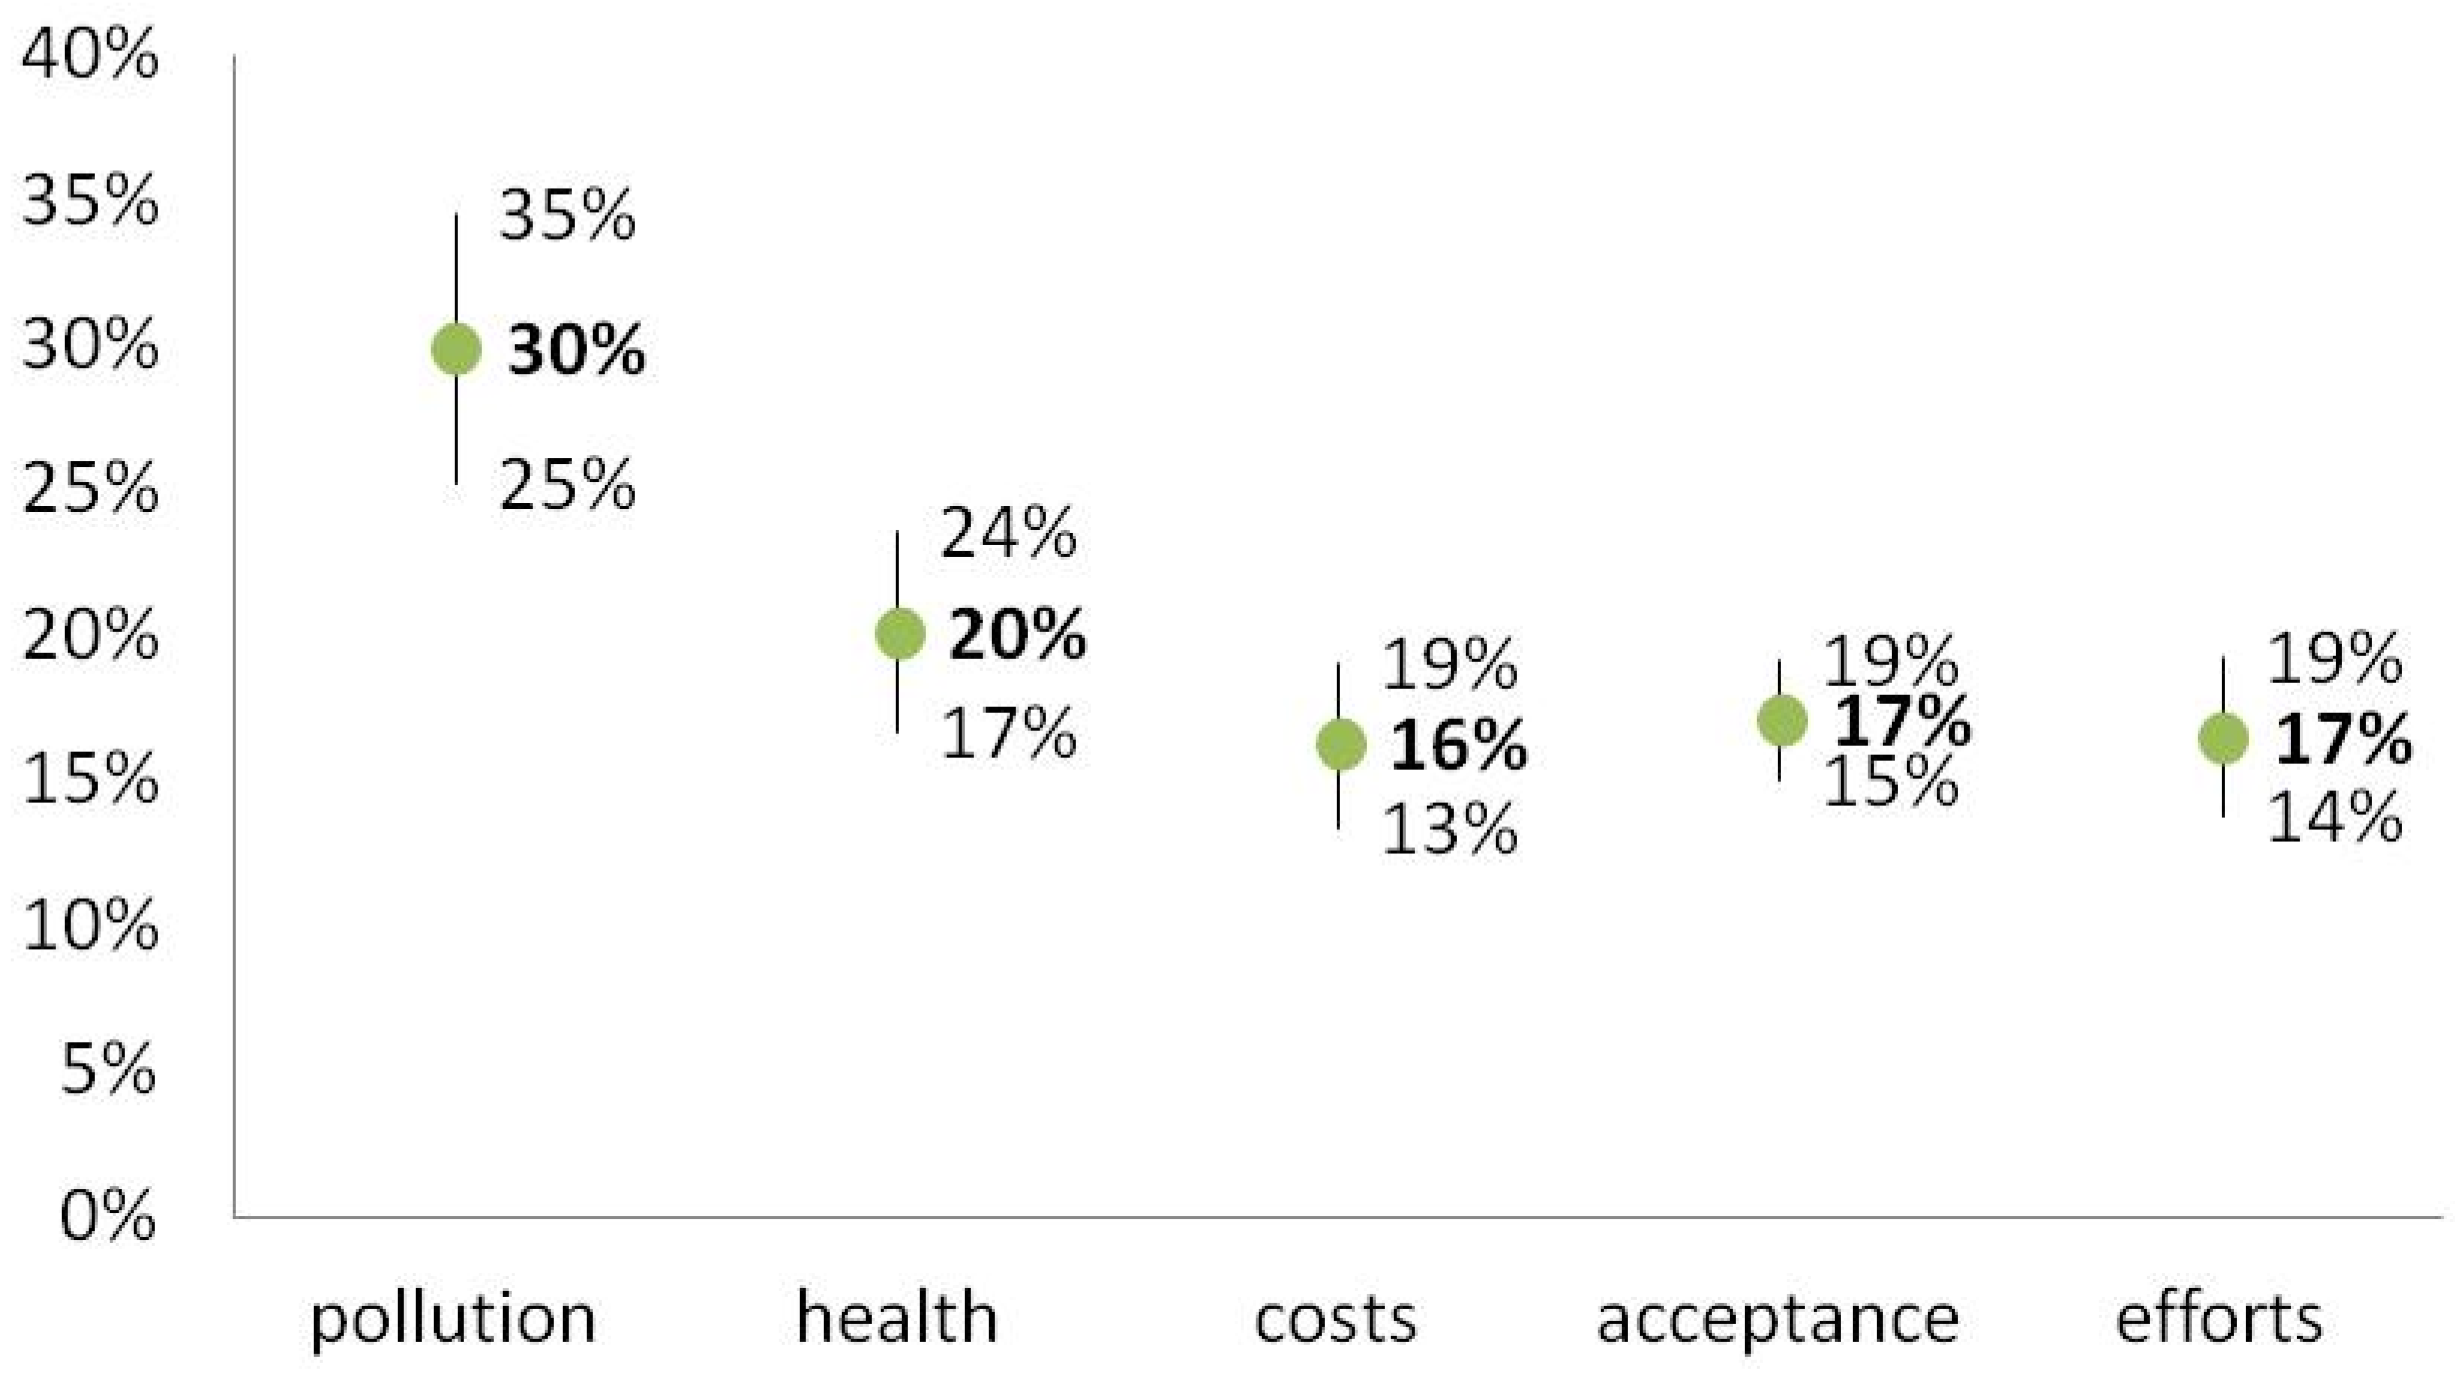
Table 4. Again, in the average of the full data set of 25 responses, pollution had the highest weight, followed by health and the other criteria weights (costs, acceptance, and efforts)).
Figure 2 and Milton Friedman’s non-parametric test confirmed at 95% significance (with a Bonferroni correction of the significance level) that the weight for pollution was significantly higher than the other criteria weights. Using the non-parametric Mann-Whitney test (95% level of significance), health conscious respondents had significantly lower criteria weights for costs (average 14%), than the cost conscious respondents (average 19%), but there was no significant difference with respect to the criteria weights for the two key criteria pollution or health.
Table 4 is used later (
Section 6.1) to explain the rationale for the approval of irrigation water treatment: It demonstrates (“vote”) that for all respondents, but one (respondent 7), the sum of the weights for pollution and health (benefits) exceeded the weight for the costs. Thus, estimating conservatively (Clopper–Pearson confidence interval) with 95% confidence for a majority (at least 82%) of respondents of a survey amongst stakeholders from similar institutions, costs would be dominated by health plus environment. The same is true for, if only coherent responses would be considered (for at least 76% costs would be dominated).
Table 4.
Stakeholder representatives’ characteristics, clustering, and criteria weights.
Table 4.
Stakeholder representatives’ characteristics, clustering, and criteria weights.
| Respondent Characteristics | Stated Ranks (1 = Most Important) to Define Clusters | Cluster (from Stated Ranks) | AHP Criteria Weights in % (sum = 100%) | Vote: Health + Pollution > Costs | Quality of Responses |
|---|
| No. | Institution | Gender | Pollution | Costs | Acceptance | Efforts | Health | Pollution | Costs | Acceptance | Efforts | Health | CR in % | Coherent |
|---|
| 1 | O | F | 1 | 5 | 2 | 3 | 4 | O | 32 | 12 | 14 | 14 | 28 | Y | 1 | N |
| 2 | A | M | 1 | 5 | 4 | 2 | 3 | O | 27 | 18 | 21 | 13 | 21 | Y | 89 | N |
| 3 | G | M | 1 | 4 | 3 | 5 | 2 | H | 29 | 9 | 19 | 19 | 25 | Y | 3 | Y |
| 4 | O | M | 1 | 5 | 3 | 4 | 2 | H | 20 | 18 | 26 | 17 | 18 | Y | 37 | N |
| 5 | O | M | 2 | 3 | - | - | 1 | H | 40 | 16 | 20 | 14 | 10 | Y | 3 | N |
| 6 | A | M | 4 | 1 | 5 | 2 | 3 | C | 22 | 22 | 11 | 22 | 22 | Y | 0 | Y |
| 7 | A | M | 5 | 3 | 4 | 1 | 2 | H | 11 | 31 | 19 | 27 | 12 | N | 7 | N |
| 8 | G | M | - | - | - | - | - | O | 57 | 25 | 11 | 5 | 2 | Y | 44 | N |
| 9 | A | F | 1 | 4 | 5 | 3 | 2 | H | 45 | 9 | 5 | 15 | 26 | Y | 18 | N |
| 10 | A | F | 1 | 2 | 4 | 3 | 5 | C | 41 | 13 | 11 | 13 | 21 | Y | 5 | Y |
| 11 | A | F | 2 | 1 | 3 | 5 | 4 | C | 17 | 23 | 20 | 23 | 17 | Y | 3 | N |
| 12 | A | F | 1 | 5 | 3 | 4 | 2 | H | 25 | 9 | 22 | 19 | 25 | Y | 5 | Y |
| 13 | A | F | 1 | 3 | 4 | 5 | 2 | H | 49 | 11 | 12 | 9 | 19 | Y | 3 | Y |
| 14 | G | F | 2 | 5 | 3 | 4 | 2 | H | 37 | 13 | 13 | 13 | 24 | Y | 13 | N |
| 15 | A | M | 2 | 4 | 1 | 5 | 3 | O | 31 | 16 | 22 | 9 | 23 | Y | 12 | N |
| 16 | A | F | 1 | 5 | 4 | 3 | 2 | H | 30 | 15 | 25 | 12 | 19 | Y | 6 | Y |
| 17 | G | M | 5 | 4 | 3 | 1 | 2 | H | 19 | 22 | 19 | 29 | 11 | Y | 2 | N |
| 18 | G | M | 5 | 4 | 1 | 2 | 3 | O | 12 | 26 | 14 | 32 | 16 | Y | 7 | N |
| 19 | G | M | 1 | 5 | 4 | 3 | 2 | H | 23 | 7 | 20 | 18 | 32 | Y | 7 | Y |
| 20 | G | M | 2 | 5 | 4 | 3 | 1 | H | 25 | 11 | 14 | 21 | 29 | Y | 5 | Y |
| 21 | A | M | - | - | - | - | - | O | 28 | 29 | 19 | 12 | 12 | Y | 18 | N |
| 22 | A | M | 1 | 2 | 5 | 3 | 4 | C | 27 | 19 | 17 | 22 | 15 | Y | 7 | Y |
| 23 | A | M | 2 | 4 | 3 | 5 | 1 | H | 24 | 8 | 17 | 9 | 42 | Y | 8 | Y |
| 24 | A | M | 1 | 5 | 3 | 4 | 2 | H | 39 | 9 | 17 | 12 | 23 | Y | 3 | Y |
| 25 | O | M | 2 | 3 | - | - | 1 | H | 36 | 16 | 21 | 16 | 11 | Y | 3 | N |
As to the quality of the answers, eleven responses were coherent, i.e., all relevant questions were answered, there was no reversal of stated and computed preferences, and the answers were consistent. For coherent respondents, pollution had highest weight in average (mean 30.4%), followed by health (mean 24.7%). Three of the coherent respondents were cost-conscious and eight health-conscious. Of them the seven health-conscious respondents weighed costs at below 11.9%, two cost-conscious respondents weighed costs with 16.8% or more, and one respondent of each cluster had weights for costs in between. Summarizing for coherent responses, their preferences were similar to the full sample, but stated more clearly. This confirms that lack of coherence did not compromise the survey.
Figure 2.
Confidence intervals for AHP criteria weights: Mean values (boldface) and upper and lower 95%-confidence limits (based on the normal distribution) for the mean values of AHP criteria weights.
Figure 2.
Confidence intervals for AHP criteria weights: Mean values (boldface) and upper and lower 95%-confidence limits (based on the normal distribution) for the mean values of AHP criteria weights.
5.3. Perceptions of Consumers
A consumer survey was conducted to verify the validity of the findings of an earlier survey [
42]. The earlier survey explored the willingness to pay (WTP) of 275 residents relative to three levels of river water improvements: boat-able (
i.e., added recreational value by reduction of smell), fishable (suitable for irrigation) and swimmable (best level: bathing water quality). Respondents were asked about what increases of the water and sewerage taxes would be acceptable (base level: 36 INR/month sewerage tax plus 90 INR/month water tax per household). This was related to the household income, the proximity to the river, the number of years the household lived in Hyderabad, and the individual perceived importance of controlling water pollution.
Thereby more than 90% of respondents supported the goal of pollution control, but 155 (56% of 275 or with 95% significance at least 51%) outright rejected to pay anything. Only 11 (4%) were willing to pay in average up to 204 INR/month and household for the best level, while 81 (29%) were satisfied with the boat-able level; they were willing to pay in average up to 104 INR/month and household. 28 (10%) respondents of that study were concerned about better food and were willing to pay in average up to 185 INR/month and household.
In comparison to [
42], the present study asks for the willingness to pay for better food (fishable level), only. The interviews were conducted on Uppal market, which is in the vicinity of government research institutions and software companies, where it was likely to find respondents interested in cleaner food production. Further, the interviews were conducted in a context, where food production mattered. In addition, for this reason respondents were expected to have interest in the issue. Thus, the survey was expected to give an upper bound for the willingness to pay.
The respondents (
Table 5) were of age 24 to 55, 83% (20 of 24) were men, 63% (15 of 24) had earned an academic degree (only one respondent was illiterate) and they lived typically (median) in a four person household. Thus, as expected, the present sample was atypical, as it was drawn from an educated minority. (In turn, with 86% literacy rate, Hyderabad is atypical for India.) Further, all respondents had interest in cleaner food production, as they were willing to pay more for their vegetables, if clean water would be used for irrigation. However, they differed in respect to how much they would be willing to pay more in relation to present expenses (possible answers ranging from “little, less than 10%” to “more than double”). Thereby, 63% (15 of 24) of the respondents visited that market four to five times per month to buy vegetables, for which they spent in average 1031 INR (1000 INR = 12 €).
As to the motivation for the willingness to pay, the percentage of accepted price increases was contingent on health issues (95% significance, Fisher exact test). For, of 12 respondents willing to pay up to 10%, only two considered that using untreated river water for irrigation would be unhealthy and such vegetables should not be sold, while of 12 respondents willing to pay more than 10%, eight were of this opinion. Further, those with health concerns stated a stochastically higher percentage of accepted price increases (95% significance, Mann-Whitney test). This is confirmed by the used criteria: For 96% (23 of 24) respondents, safety for health was the most important criterion for buying vegetables, followed by environmental concerns (no pollution of groundwater) for 71% (17 of 24), while the price was least important for 75% (18 of 24). Vegetables irrigated with treated river water would in general meet these criteria, as 63% (15 of 24) respondent would have no concerns.
Further, the paper applied a new notion of “genuine willingness to pay” (GWTP), whereby the willingness to pay was tested by additional question for the motivation to avoid overly optimistic estimations. For, why should consumers pay for better irrigation, if it does not benefit them?
In order to single out respondents with a genuine reason for paying more, their motivation was inquired. For 67% (16 of 24) of respondents, no reason to pay more could be identified and “genuine willingness to pay” was defined to be nil: GWTP = 0. For those with reasons to pay more, their maximal acceptable percentage was assumed (e.g., “willing to pay up to 10% more” was GWTP = 10% and “willing to pay little, not more than 10%” was GWTP = 0%), unless they stated a lower maximal willingness to pay (respondent 5).
The assessment of genuine willingness to pay was as follows (
Table 5; boldface entries highlight these reasons): In order to identify respondents with GWTP > 0, respondents were asked, if they thought that at the market, where the interview was conducted, vegetables might be sold that have been irrigated with polluted water. 42% of respondents were not interested in this question or they thought to have safe sources at the present market. For them, GWTP = 0, as there was no compelling reason to pay more than at their allegedly safe sources (where perhaps they think to pay already more.
Table 5.
Elaborating on consumers’ genuine willingness to pay for using cleaner irrigation water.
Table 5.
Elaborating on consumers’ genuine willingness to pay for using cleaner irrigation water.
| Consumer Characteristics with Respect to Purchase of Vegetables at This Market and General | WTP for Cleaner Produced Vegetables | Test for Genuine WTP: Consumers’ Reasons to Spend more for Cleaner Produced Vegetables | Genuine WTP (INR/Month, Computed) for Cleaner Produced Vegetables |
|---|
| No | Gender | Age | Education | Household size | How often here | Vegetables here (INR/month) | Vegetables total (INR/month) | Maximum WTP (in % more, Stated) | Computed WTP (INR/Month) | Safe Source Available | Unhealthy to Irrigate with polluted Water | Quality & Taste Better or worse? |
|---|
| 1 | M | 27 | S | 5 | 10 | 2000 | 3500 | <25% | 875 | NO | NO | T/+ | 0 |
| 2 | M | 32 | U | 6 | 8 | 2200 | 3000 | <10% | 300 | NO | NO | G/+ | 0 |
| 3 | M | 24 | U | 6 | 10 | 2000 | 2500 | <100% | 2500 | YES | C | NE | 0 |
| 4 | M | 52 | S | 7 | 15 | 3000 | 3000 | <25% | 750 | YES | NO | G/+ | 0 |
| 5 * | M | 35 | U | 4 | 5 | 1000 | 1500 | <25% | 375 | NO | YES | NE | 300 |
| 6 + | M | 43 | S | 4 | 4 | 600 | NA | <50% | 300 | NI | UN | NE | 0 |
| 7 | M | 44 | U | 4 | 4 | 1500 | 1500 | <50% | 750 | NO | YES | T/− | 750 |
| 8 | M | 52 | U | 6 | 5 | 400 | 1500 | <25% | 375 | NO | YES | UN | 375 |
| 9 + | M | 27 | U | 4 | 4 | 1000 | NA | <10% | 100 | YES | NO | UN | 0 |
| 10 | M | 27 | U | 5 | 4 | 1000 | 1000 | <10% | 100 | YES | NO | T/+ | 0 |
| 11 | F | 28 | S | 4 | 3 | 200 | 1000 | >0% | >0 | YES | NO | UN | 0 |
| 12 | M | 44 | S | 4 | 5 | 200 | 1000 | >0% | >0 | YES | NO | G/+ | 0 |
| 13 + | M | 55 | S | 4 | 4 | 300 | NA | <10% | 30 | UN | NO | NE | 0 |
| 14 | M | 48 | U | 3 | 4 | 250 | 1000 | >0% | >0 | NO | NO | G/+ | 0 |
| 15 + | M | 32 | U | 5 | 4 | 600 | NA | <10% | 60 | YES | NO | NE | 0 |
| 16 | M | 30 | U | 3 | 5 | 700 | 1200 | <10% | 120 | UN | YES | T/− | 120 |
| 17 | M | 28 | U | 5 | 5 | 1000 | 1500 | <10% | 150 | UN | YES | G/+ | 150 |
| 18 | M | 33 | NO | 4 | 6 | 1500 | 2000 | <25% | 500 | UN | YES | UN | 500 |
| 19 | F | 31 | U | 2 | 8 | 1000 | 1500 | <25% | 375 | YES | YES | UN | 0 |
| 20 | M | 39 | S | 4 | 4 | 800 | 2000 | <10% | 200 | UN | NO | NE | 0 |
| 21 | F | 28 | U | 4 | 2 | 500 | 1500 | <25% | 375 | NO | YES | T/− | 375 |
| 22 | M | 45 | U | 5 | 5 | 1500 | 2000 | <25% | 500 | UN | YES | UN | 500 |
| 23 | F | 36 | S | 4 | 4 | 1000 | 1500 | <10% | 150 | UN | NO | NE | 0 |
| 24 | M | 32 | U | 2 | 3 | 500 | 1000 | <25% | 250 | YES | YES | T/− | 0 |
Further, respondents were asked about their opinion with respect to health, if vegetables were irrigated with polluted water. 50% (12 of 24) were of the opinion that there was no negative impact on health. They were also asked about their opinion with respect to quality. 58% (14 of 24) were of the opinion that polluted water had no negative impact on quality. Combined, 42% were of the opinion that polluted water would neither impact health nor quality; for them GWTP = 0.
There remained 8 (33% of 24) respondents with a genuine interest in using cleaner water for irrigation. Of them, all were willing to pay up to 10% higher vegetable prices; namely 63% (5 of 8) up to GWTP = 25%, two up to GWTP = 10% and one up to GWTP = 50%. Estimating the confidence interval conservatively (Clopper–Pearson method), one could expect with 95% confidence that at least 18% (and at most 52%, i.e., 35% ± 17%) of the customers of upscale markets (like Uppal market) would be genuinely willing to pay 10% higher prices and at least 11% would pay 25% higher prices. Applying GWTP to their overall expenditures for vegetables, in average GWTP for households with a genuine interest in cleaner food production was 384 INR/month (4.61 €).
This outcome is better than that reported in [
42]. (A confidence interval of 35% ± 17% willing to pay for better food, rather than 10%, and for the Uppal sample this was in average 384 INR/month rather than 185 INR/month.)
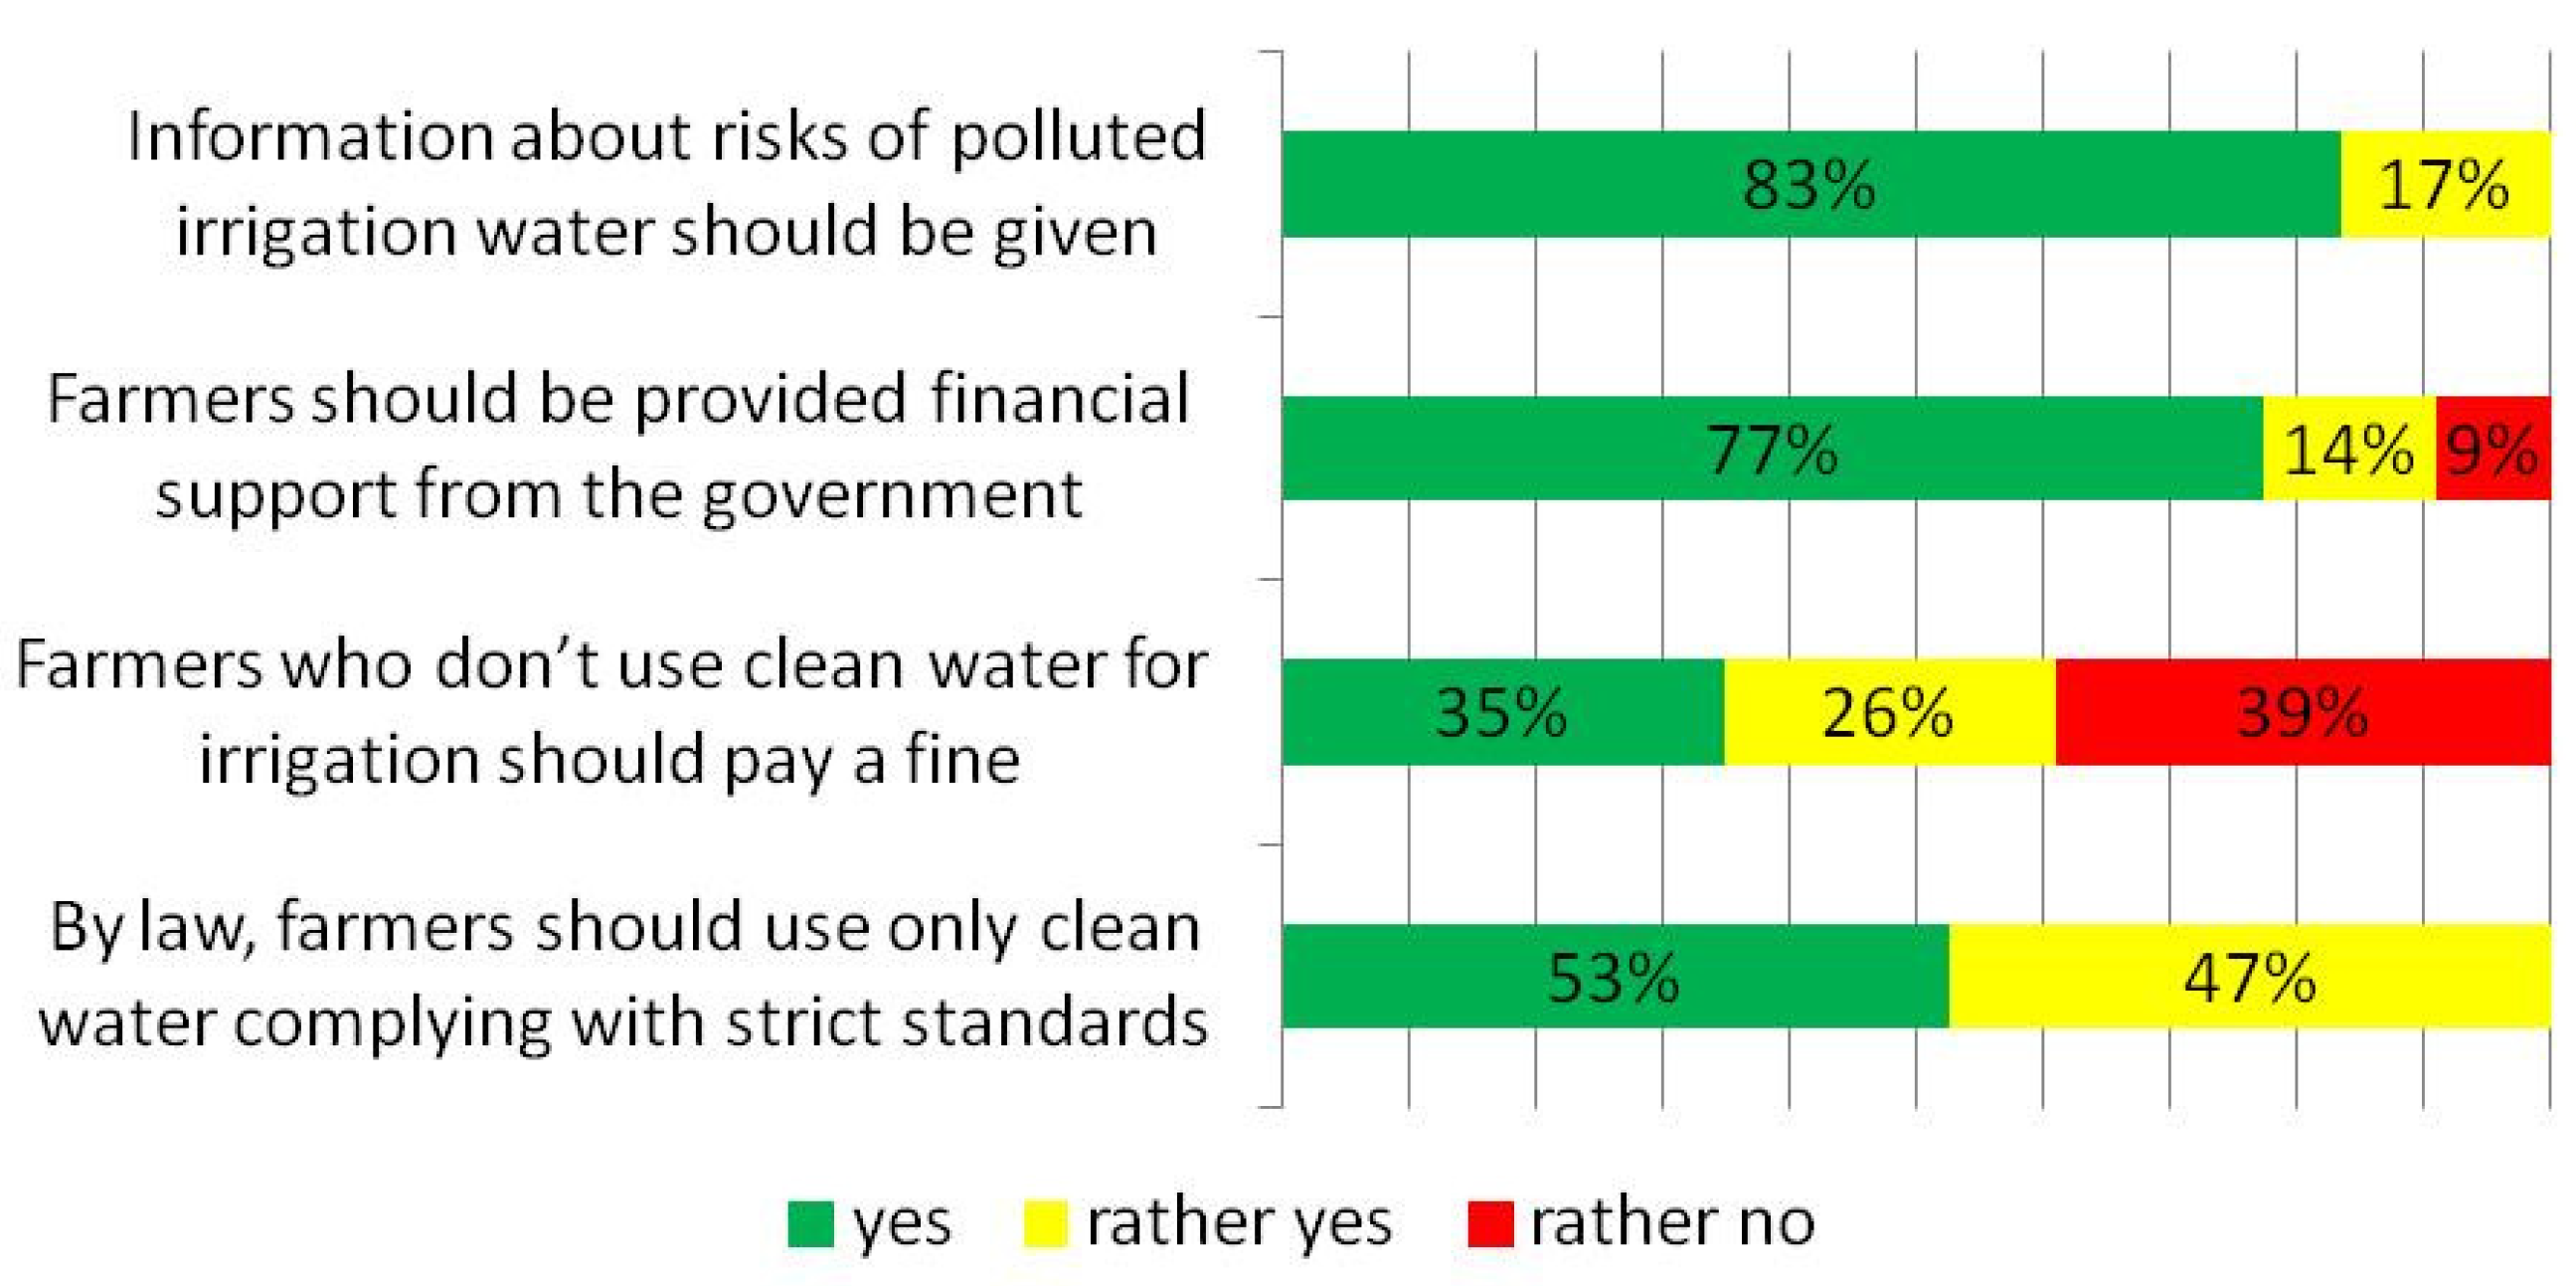
Most respondents (67%, 16 of 24) considered that treatment of irrigation water would be mostly in the interest of consumers. Accordingly, amongst policies to implement water treatment of river water prior to irrigation, there are clear preferences (
Figure 3).
Figure 3.
Views of consumers on policies to promote irrigation with cleaner water. Respondents had the choice between yes, rather yes, rather no, or no. (For cultural reasons, an outright “no” may have been avoided.).
Figure 3.
Views of consumers on policies to promote irrigation with cleaner water. Respondents had the choice between yes, rather yes, rather no, or no. (For cultural reasons, an outright “no” may have been avoided.).
Seventy-one percent (17 of 24) considered that government support for the farmers in setting up the needed infrastructure would be suitable. 33% (8 of 24) ranked this policy approach first.
Sixty-three percent (15 of 24) considered information (e.g., health risks for farmers handling river water) as suitable; 33% (8 of 24) ranked it first or second.
Laws commanding the use of cleaner water for irrigation was suitable for 42% (10 of 24) respondents; 21% (5 of 24) ranked it second or third.
For 38% (9 of 24) respondents, fining farmers for using untreated river water was rather unsuitable and 33% (8 of 24) ranked it last or third.
5.4. Perceptions of Farmers
Farmers were interviewed (see
Table 6 and
Table 7) to confirm the findings of a previous study [
22], according to which farmers were aware of the health risks of using untreated river water, but they (
i.e., eight farmers working with river water) considered this as an acceptable payoff for the nutrient content of wastewater. Nevertheless, disgust and the mosquito-problem let them to consider paying a small amount for using treated river water instead, in that study 100–200 INR/month. For the present study, 15 respondents were men and 6 women, they were of age 30 to 58 (median 34), 48% were illiterate and they irrigated typically a small piece of land (median 1/4 acre, about 1000 m2), which for all respondents was leased. Annual farm incomes were way below 0.2 million INR (this is the poverty line for household incomes: “low income group”).
Table 6.
Farmers’ genuine willingness to pay (GWTP) for treatment of river water.
Table 6.
Farmers’ genuine willingness to pay (GWTP) for treatment of river water.
| Farmer Characteristics | Stated WTP for CW | Test for Genuine WTP Farmers’ Reasons to Pay for CW | Genuine WTP (Costs of CW) |
|---|
| No. | Gender | Age | Literacy | WTP in Principle | WTP: Initial Investment | WTP O&M/year | Who Should pay? | Provide Land for CW? | Quality River Water | Eat own vegetables |
|---|
| 1 | F | 58 | NO | YES | NA | NA | govt | YES | C | YES | 0 |
| 2 | F | 36 | NO | NO | 0 | 0 | NA | NO | B | YES | 0 |
| 3 | M | 52 | NO | YES | 0 | 2400 | NA | UN | B | YES | 0 |
| 4 | M | 30 | NO | YES | 0 | 4800 | govt | YES | C | YES | 0 |
| 5 | M | 30 | YES | YES | 0 | 2400 | govt | UN | B | YES | 0 |
| 6 | F | 30 | YES | YES | 1000 | 3600 | NA | YES | B | YES | 0 |
| 7 | M | 32 | YES | YES | 0 | 3600 | govt + owner | UN | B | YES | 0 |
| 8 | F | 38 | NO | YES | NA | 2400 | NA | UN | C | YES | >0 |
| 9 | M | 36 | NO | NO | 0 | 0 | govt | UN | C | YES | 0 |
| 10 | M | 32 | YES | NA | 0 | 2400 | govt + owner | YES | B | YES | 0 |
| 11 | M | 34 | YES | YES | 0 | 1200 | govt | NO | C | YES | 0 |
| 12 | F | 36 | NO | YES | 0 | 2400 | NA | UN | C | YES | >0 |
| 13 | M | 31 | YES | NO | 0 | 0 | govt | UN | B | YES | 0 |
| 14 | M | 54 | YES | YES | 500 | 1200 | local | YES | B | YES | 0 |
| 15 | F | 30 | YES | YES | 0 | 1200 | NA | YES | A | YES | 0 |
| 16 | M | 51 | NO | NO | 0 | 0 | govt | UN | B | YES | 0 |
| 17 | M | 33 | YES | YES | 0 | 2400 | govt | YES | C | NA | 0 |
| 18 | M | 32 | YES | YES | 0 | 1200 | govt + local | YES | B | YES | 0 |
| 19 | M | 30 | YES | YES | 1500 | 2400 | govt + owner | YES | C | YES | >0 |
| 20 | M | 50 | NO | YES | 0 | 2400 | govt | UN | D | YES | 0 |
| 21 | M | 41 | NO | YES | NA | NA | govt | NO | D | YES | 0 |
Table 7.
Economic situation of the farms in the study area and impact of irrigation costs.
Table 7.
Economic situation of the farms in the study area and impact of irrigation costs.
| Current Economic Situation of Farms | Costs (Land Use, Investment) for CW | Unit Costs |
|---|
| No. | Crops/year | Land Area (Acres) | Lease (as Stated) INR per Year | Cultivation Costs INR/Year | Profit (as Stated) INR/Year | Sales (Computed) INR/Year | CW: Reduced Sales (Land Use) INR/Year | CW: Capital Costs as Annuity: INR/Year | CW: Reduced Profit INR/Year | Fair Compensation (for CW) INR/Year | Fair Price Increase % | Volumetric Treatment Costs INR/m3 |
|---|
| 1 | 7 | 0.40 | 14,400 | 56,400 | 72,000 | 142,800 | 140,480 | 5200 | 65,396 | 6604 | 5 | 2.20 |
| 2 | 10 | 1.50 | 84,000 | 84,000 | 96,000 | 264,000 | 259,710 | 19,500 | 73,575 | 22,425 | 9 | 2.00 |
| 3 | 8 | 0.25 | 18,000 | 60,000 | 60,000 | 138,000 | 135,758 | 3250 | 55,483 | 4518 | 3 | 2.41 |
| 4 | 8 | 0.15 | 36,000 | 28,800 | 92,400 | 157,200 | 154,646 | 1950 | 88,364 | 4037 | 3 | 3.59 |
| 5 | 7 | 0.15 | 6000 | 24,000 | 60,000 | 90,000 | 88,538 | 1950 | 56,978 | 3023 | 3 | 2.69 |
| 6 | 10 | 0.25 | 12,000 | 26,800 | 60,000 | 98,800 | 97,195 | 3250 | 55,580 | 4420 | 5 | 2.36 |
| 7 | 10 | 0.20 | 7200 | 60,000 | 60,000 | 127,200 | 125,133 | 2600 | 56,308 | 3692 | 3 | 2.47 |
| 8 | 9 | 0.20 | 24,000 | 16,350 | 84,000 | 124,350 | 122,329 | 2600 | 79,645 | 4355 | 4 | 2.91 |
| 9 | 9 | 0.25 | 30,000 | 72,000 | 84,000 | 186,000 | 182,978 | 3250 | 78,898 | 5103 | 3 | 2.73 |
| 10 | 9 | 0.30 | 36,000 | 72,000 | 108,000 | 216,000 | 212,490 | 3900 | 101,760 | 6240 | 3 | 2.78 |
| 11 | 9 | 0.10 | 4800 | 18,000 | 12,000 | 34,800 | 34,235 | 1300 | 10,427 | 1573 | 5 | 2.10 |
| 12 | 9 | 0.25 | 12,000 | 36,000 | 36,000 | 84,000 | 82,635 | 3250 | 31,970 | 4030 | 5 | 2.15 |
| 13 | 9 | 0.30 | 14,400 | 60,000 | 60,000 | 134,400 | 132,216 | 3900 | 54,891 | 5109 | 4 | 2.27 |
| 14 | 9 | 0.20 | 12,000 | 48,000 | 60,000 | 120,000 | 118,050 | 2600 | 56,230 | 3770 | 3 | 2.52 |
| 15 | 9 | 0.20 | 12,000 | 54,000 | 60,000 | 126,000 | 123,953 | 2600 | 56,230 | 3770 | 3 | 2.52 |
| 16 | 9 | 0.25 | 12,000 | 15,850 | 40,800 | 68,650 | 67,534 | 3250 | 36,692 | 4108 | 6 | 2.19 |
| 17 | 10 | 0.20 | 12,000 | 48,000 | 60,000 | 120,000 | 118,050 | 2600 | 56,230 | 3770 | 3 | 2.52 |
| 18 | 10 | 0.20 | 12,000 | 54,000 | 60,000 | 126,000 | 123,953 | 2600 | 56,230 | 3770 | 3 | 2.52 |
| 19 | 10 | 0.22 | 12,000 | 60,000 | 60,000 | 132,000 | 129,855 | 2860 | 55,970 | 4030 | 3 | 2.45 |
| 20 | 10 | 2.00 | 30,000 | 96,000 | 120,000 | 246,000 | 242,003 | 26,000 | 91,563 | 28,438 | 12 | 1.90 |
All interviewed farmers used river water for irrigation (one both river water and groundwater). 52% (11 of 21) interviewed farmers considered that river water was of good or very good quality, referring to the nutrient content. They had also no concerns with their products; all eat their own vegetables (one without answer). Consequently, 19% (4 of 21) were not willing to pay at all for cleaner irrigation water. However, 71% were willing to pay 100 to 400 INR/month for using treated water for irrigation; average: 200 INR/month. Thus, although farmers leased the land and water provision is part of the lease, they were willing to pay for treated water (directly or via higher lease). However, only 43% (9 of 21) would provide land for a constructed wetland; most of the others were not sure about the land-owner’s opinion. Further, only 14% (3 of 21) were willing to contribute to the construction costs of a river water treatment system: 57% (12 of 21) hold the government or local agencies responsible for providing infrastructure for cleaner irrigation water.
A question arises as to which of the farmers might be actually willing to pay, if wastewater treatment is implemented? To this end, the notion of ‘genuine willingness to pay’ (GWTP) was adapted to farmers: GWTP = 0 for those (see
Table 6), who did not want to pay, who stated that others (government, local agency) should pay, or who considered that river water was of a good or very good quality (whence there was less reason to pay for a change). After removing them, there remained three farmers (14% of 21), each with genuine willingness to pay 200 INR/month. As such, the response to an implementation is rather negative: With 95% confidence, most (67% to 96%) farmers would actually be unwilling to pay (conservative estimate using Clopper–Pearson confidence intervals).
5.5. Economic Analysis: Decentralized Wastewater Treatment for Irrigation of Vegetables
All the farmers surveyed leased their land, whereby leases varied with proximity to roads and markets between 15,000 and 240,000 INR/acre. It was therefore impossible to reduce the economic analysis to an “average farmer”. Despite high costs, growing vegetables was profitable, with up to 10 crops harvested per year, when compared to growing paddy rice or para-grass (
Table 7).
As noted above, farmers had positive views about untreated river water for irrigation (nutrient content), but they had also positive views about treatment, expecting higher market value for their vegetables. Indeed, certain consumers were willing to pay 10% more for vegetables irrigated with cleaner water. Thus, it may be concluded that similar to organic food marketing, farmers irrigating with cleaner water could achieve a higher price from a certain segment of consumers. The observed willingness to pay of these upscale consumers would suffice to cover the costs of farmers for water treatment on their own plot, as is demonstrated below.
An analysis of the income situation of farms allows assessing the feasibility of financing water treatment of irrigation water for vegetables by farmers and consumers. Thereby, an analysis on the situation of an “average farm” is avoided, as the high variability of lease costs per acre would make the computation of average land use costs for constructed wetlands problematic. The authors therefore first assessed the economic situation of each farm in the sample (outlined in
Table 7) and only then made statistical inferences.
As for the peak water needs, typically a farm with 1/4 acre of land spends 1/2 h per week for pumping irrigation water. Based on a pumping rate of 20 L/s, the annual use of irrigation water is estimated at 7488 m
3 for an ace;
i.e., 21 m
3 per day and acre (5.25 L/m
2·day). As power is available only at three to four days a week, a holding well is used for storage. For this demand of treated water, a constructed wetland area of 65 m
2 per acre would suffice (using
Section 4.4 for a demand of 100 m
3). It would cost 325,000 INR (about 3900 €); see
Section 4.5.
If each farmer would treat his own water, financing it without support, roughly the following capital and operation costs would accrue: Distributing costs over an assumed lifetime of 25 years for the wetland, and yearly costs (annuities) of 13,000 INR per acre would result. This is proportionally adapted to the actual plot sizes. As operation and maintenance could be done by the farmer, no costs are assumed for the additional work.
As to land use costs, the farmer would still pay the full lease, but could use only ca. 98% of the land, which reduces the sales accordingly. However, also costs for seeds and pesticides would be ca. 2% lower. The concern of farmers, that they would need more fertilizers, if they used treated water, is questionable, as first, nutrient load of river water is too high (contributing also to soil salinity, which may hinder growth), and second, the retention time is short, whence treated water remains rich in nutrients. Therefore ca. 2% cost reduction for fertilizers is assumed for the reduced cropping area.
In sum,
Table 7 (fair compensation) shows that farmers would face a reduction of profits by up to 28,000 INR/year (median 4072 INR), which exceeds the willingness of farmers to pay; compare with
Table 6. Thereby, in the median, the land use costs would amount to
ca. 29% of profit reduction.
If farmers could increase the price of vegetables to compensate for the costs and lost profits, then by
Table 7 price increases between 3% and 12% would suffice (median 3.4%), whereby 95% of farmers (all except one with relatively low lease/acre) could remain at or below 10% price increase. Thus, estimated conservatively (Clopper–Pearson confidence interval), with 95% confidence at least 78% of farmers in similar situations could do well with 10% price increases, which increase with 95% confidence also at least 18% of upscale consumers were genuinely willing to pay.
As an alternative check for this conclusion the virtual water content of vegetables may be used to estimate the added costs for irrigation. For instance, for 1 kg tomatoes between 75 [
43] and 97 L [
44] irrigation water are used and market prices in Hyderabad range between 20 and 40 INR/kg. By
Table 7, the volumetric water treatment costs (computed from the lost profits) would range between 1.9 and 3.6 INR/m
3, median 2.5 INR/m
3, whence for tomatoes additional irrigation costs would range between 0.14 and 0.35 INR/kg. This price increase of 0.4%–1.75% was embedded in the amount that the eight respondents with GWTP > 0 were willing to pay for treatment of irrigation water.
It follows that farmers wishing to serve consumers interested in cleaner production could start water treatment on their own initiative, and the needed price changes would be acceptable for a certain segment of upscale consumers with interest in cleaner production (
Section 5.3). Further reductions of the costs are possible in the case of a cooperation of several farmers, as the wetland could be constructed on land with lowest use costs, or if a centralized system were constructed by the government, as no private land would be used. This conclusion would remain valid under the assumption of a ten times higher pollution load in river water. (Based on the design parameters of
Section 4.4 for the larger constructed wetlands, for the present sample the median fair compensation would be 5137 INR/year, corresponding to a median price increase by 4.3% and median treatment costs of 3.1 INR/m
3 irrigation water).
On the basis of
Table 7, the financing of 90% of capital costs by the government was also assessed: In this case, in the median annual treatment costs (lost profits) would be 1476 INR/year (in the median 81% for land use), and in the median this would be financed by 1.2% price increase. For 50% of the interviewed farmers, or with 95% confidence for at least 30% of farmers (Clopper–Pearson intervals), these costs would be within their stated willingness to pay (
Table 6, WTP per year). Thus, a combination of public support, moderate price increases for consumers and affordable contributions by farmers could finance large-scale water treatment for vegetables.
However, these considerations apply only to vegetable farming, as consumers would face no health risks from the irrigation of rice or para-grass with untreated river water [
24]. The willingness of consumers to pay more for the cleaner production of rice would be based on motives not investigated here. Moreover, for rice (1.7 m
3/kg virtual water for paddy rice, resulting in 2.5 m
3/kg virtual water for white rice [
45], which during Khariff comes mostly from monsoon, but during Rabi from irrigation; market price in Hyderabad of 40–50 INR/kg), a ten percent price increase might not suffice to finance irrigation water treatment.
6. Discussion of Policy Issues
6.1. Rationale for Treating Irrigation Water Prior to Its Use
Referring to the stakeholder analysis it follows that the surveyed representatives of institutional stakeholders displayed strong preferences for environmental issues (pollution control and health), which was compatible with the mandate of their respective institutions. This resulted in a high level of agreement about the possible approaches to address environmental issues in the Musi River catchment.
In the overall assessment the most important criteria for the stakeholders were pollution and health. The other criteria, in particular costs, need to be considered, too. For the importance of costs, minor discrepancies between two stakeholder groups occurred, a cost conscious minority and the health conscious majority, but even for the cost-conscious respondents the criteria weights for costs were not dominant.
Health benefits can be expected, as treatment can only improve the situation caused by pathogens, such as
E. coli (
Section 4.2).
As noted in
Section 4.3, treating river water prior to its use for irrigation is beneficial for the environment, as it reduces pollution, even if the planned treatment will not and is not intended to solve all environmental problems observed (e.g., soil salinity). The selected type of wetland ensures that treatment does not generate a new problem (mosquitoes).
As follows from
Section 4.5,
Section 5.3, and
Section 5.4, full cost recovery linked to treatment cannot be expected, if mass scale treatment of irrigation water is implemented. A smaller group of consumers interested in safe food production would be willing to pay enough for vegetables to cover the costs of treated water (
Section 5.5). Thus, pilot treatment plants for vegetable farms could be financed from higher prices. However, it is not clear, if these consumers would also pay for the cleaner production of rice or fodder, which has no benefits for consumers. Further, considering genuine willingness to pay, a majority of consumers would not be willing to pay. In addition, the majority of farmers would not be willing to pay. Both groups would rather expect the government to pay.
With respect to the criterion “efforts” about institutional issues, water treatment systems based on constructed wetlands are easy to maintain, when compared with conventional systems, and (
Section 5.1) the Indian Water Policy is favorable towards recycle and reuse.
With respect to acceptance, unless asked to pay for it, no one would oppose the treatment of river water and the use of the treated water for irrigation. (Farmers not willing to pay stated that they would give it a try.) However, the use of river water is informal, and it is ongoing: Farmers are using untreated river water and by
Section 5.4 some prefer it for its nutrient content, which for them seems to outweigh the health risks and disgust of using dirty water. In addition, consumers buy these products and in view of
Section 5.3, many do not care about cleaner production or they think that they are not affected.
In order to understand, for what reasons the considered stakeholders would support river water treatment, the above partial assessments in terms of the individual criteria were aggregated to an overall assessment: As the expected costs for the public and the health and environmental benefits could not be quantified with sufficient accuracy, only such aggregations could be used, that remain meaningful with ordinal data [
46]. Therefore a simple outranking method, weighted voting, was used. It amounts to comparing each two alternatives (here: treating river water or remain inactive) by adding up the weights of the pros and subtracting the weights of the cons: This can be done individually, for each stakeholder respondent, and it can be done for the group with the average weights.
As was observed in
Section 5.2, based on
Table 4 for all respondents, except one (and thus with 95% confidence for at least 82% of stakeholders with water related interests), the sum of the criteria weights for pollution and health (“pros”) were larger than the weight of costs (“con”). The same is true for the average weights (interpreting them as societal preferences). In this respect, on the basis of the three key criteria environment, health and costs, treating river water prior to irrigation would be recommendable. Using also the remaining criteria acceptance and efforts (
i.e., institutional issues) reinforces this conclusion.
6.2. Approaches to Implement Irrigation Water Treatment
In an attempt to fully understand how policies might work in practice, towards the implementation of water treatment for irrigation in the locality, some conceptual approaches were considered. Thereby, the choice of the proper mix of policies is also a question of environmental justice (
cf. [
47]): Why should small-scale farmers with low income and the poor segment of the local population dependent on their vegetables from local sources bear the burden of river water pollution that they have not caused? Rather, authorities should implement the regulatory measures already formulated to prevent and control pollution and in case of damages, the polluter should be made to pay (e.g., Supreme Court of India with respect to water polluting industries, [
48]).
Imposing fines for using unsafe water for irrigation appears appealing and beneficial towards providing safe food for consumers, but considering poverty of farmers, implementation may not be viable. Fines would put upon farmers (and indirectly, via higher prices, on consumers) the burden for the past failures of the city and state governments to keep the Musi River clean. Fines become only meaningful, when enough cleaner irrigation water has been made available and unfair competition between farmers paying for treated water and those, using free, but polluted, river water, is addressed.
The current laws ask for use of cleaner irrigation water, but in view of the informal character of the use of untreated river water, this administrative measure has not been effective. Current water pollution demonstrates that also laws commanding treatment of industrial and domestic wastewater were largely ignored. Nevertheless, laws requiring use of cleaner water for irrigation and similar administrative measures might be helpful. Such laws can be used to argue for more support for farmers using cleaner irrigation water.
Charging farmers for treated irrigation water and letting consumers pay more for vegetables irrigated with cleaner water is a market-based instrument that would work with upscale consumers. For, in principle farmers would be willing to pay for cleaner irrigation water and upscale consumers would be willing to pay higher vegetable prices. However, in terms of genuine willingness to pay, only a minority of them would pay enough to fully finance a treatment system. This would not resolve the large scale pollution. However, market-based instruments can partially contribute to cost sharing.
Farmers and consumers approved of financial incentives, e.g., government support for the construction of water treatment infrastructure, as in their views, the government should be made responsible. Further, a centralized system would be easier to implement, if done by the municipality. For then farmers would not need to ask the landlords to obtain approval for the construction of a constructed wetland on their plot, and they would not loose arable land. (Instead, they would buy treated river water and pump it into their channels.) Water quality monitoring by the municipality would be easier, too, and it would help to build trust that the treated water is indeed cleaner. However, such a centralized constructed wetland requires huge land space, which is only feasible, if there is a suitable natural wetland system, as in the study area.
Further, awareness rising may provide information about the risks of irrigation with river water; it may improve the willingness to pay more for cleaner produced food. Although awareness rising is merely a “soft” instrument, consumers consider provision of information as suitable. Indeed, only if farmers become convinced that the nutrient content of river water is not a benefit that outweighs their health risks, they would use treated water for irrigation, even if it has some costs. In addition, only then consumers could trust that the more costly vegetables were irrigated with cleaner water.
However, current pollution levels of the Musi River are so high that treating river water for irrigation would not absolve the city and state governments from their obligation to ensure 100% treatment of domestic and industrial wastewaters, before they are discharged into the Musi River. Additional measures may be needed for resolving the problems of soil salinity and nutrient accumulation in soil: Drip-irrigation of vegetable cultures would reduce water consumption (beneficial, if farmers have to pay for treated water), reduce evapo-transpiration and avoid sprinkling irrigation water with coliforms on the edible parts of vegetables. Rainwater harvesting may be used to reduce salinity of irrigation water by blending it with rain water. Farmers should also apply an adequate fertilizer management according to plant growth stages and season. Further, excess rainwater from monsoon could be applied to leach soil.
7. Conclusions
Subsequent discussions (directly and at a workshop) with high level decision makers, governmental stakeholders and researchers (Special Commissioner, representatives from the Central Groundwater Board, state government and from the municipality, and scientists from Osmania University and various research institutions) to validate the above findings showed that the concerned government institutions are aware of the health problems for farmers and consumers of vegetables, caused by using untreated river water for the irrigation. They want to end this unlawful practice.
Even if, finally, domestic sewage and industrial discharges will be treated, as required by the law, there remain risks (e.g., the illegal disposal of wastewater). Therefore they approve of the idea to treat river water prior to irrigation. Yet, for the implementation some issues need to be resolved: If water shall be treated, the use of treated water should be prescribed by the law, respectively existing law should be effectively implemented. Further, farmers and consumers should be made aware about the risks of using untreated river water. In view of the industrial discharges in river water, a continuous quality monitoring of treated water would be required. In addition, the high level decision makers are skeptical about fining farmers, who currently have no other choice than using river water.
As to financing, government should support farmers in setting up treatment (constructed wetlands), but farmers (and indirectly consumers through higher vegetable prices) should take responsibility (pay) for the operation and maintenance. Thereby, a co-financing from the “National Vegetables Initiative for Urban Clusters” is feasible. This initiative is sponsored by the Government of India and it aims at the provision of vegetables at sustainable prices, considering that in cities vegetable consumption in average is way below the recommendations for a healthy life.


