Article

Reliability and Cost Analysis of a Rainwater Harvesting System in Peri-Urban Regions of Greater Sydney, Australia

1
School of Engineering, University of Duhok, 38 Zakho Street, Duhok, Kurdistan Region 1006 AJ, Iraq
2
School of Computing, Engineering and Mathematics, University of Western Sydney, Locked Bag 1797, Penrith, NSW 2751, Australia
*
Author to whom correspondence should be addressed.
Water 2014, 6(4), 945-960; https://doi.org/10.3390/w6040945
Submission received: 10 December 2013 / Revised: 1 April 2014 / Accepted: 2 April 2014 / Published: 14 April 2014

Abstract

:
In large cities, rainwater tanks are used to save mains water, but in peri-urban and rural areas, rainwater tanks are used as a sole water supply for many households, as these regions often do not have any other means of water supply. This paper investigates the performance of a rainwater harvesting system (RWHS) in peri-urban regions of Greater Sydney, Australia. Considering the daily rainfall data over the entire period of record at ten different locations, it has been found that a 5 kL tank can meet 96% to 99% of the demand for toilet and laundry use depending on the location in Greater Sydney regions. However, in the driest year, a 5 kL tank can meet 69% to 99% of toilet and laundry demand depending on the location. Based on the results of life cycle cost analysis, it has been found that a 5 kL tank has the highest benefit–cost ratio (ranging from 0.86 to 0.97) among the eight possible tank sizes examined in this study. Interestingly, for a 5 kL tank, with a combined use (i.e., toilet, laundry and irrigation), the current water price in Sydney needs to be increased by 3% to 16% to achieve a benefit–cost ratio exceeding one. A set of regression equations are developed which can be used to estimate reliability using the average annual rainfall data at any arbitrary location in the peri-urban regions of Greater Sydney. The method presented in this paper can also be applied to other Australian states and other countries to estimate water savings and reliability of a RWHS using daily rainfall data.

1. Introduction

Rainwater harvesting is an alternative water supply method that has become popular in recent years in Australia [1]. This is due to greater environmental awareness among the general public, a long-lasting drought in the last decade, and subsidization provided by various government authorities in Australia to install a rainwater harvesting system (RWHS) [2]. In urban areas, where mains water supply is present, a RWHS is used to save mains water. This also provides greater flexibility in water use during the time of water restrictions, as rainwater can be used for non-potable purposes such as gardening and the washing of cars and hard surfaces. However, in rural and peri-urban regions of Australia where mains water is not available, rainwater tanks are used as water source for a variety of purposes such as drinking, washing and gardening. Peri-urban regions are defined as areas having a metropolitan area on their inner boundary and a rural area on their outer boundary. In the case of peri-urban regions, a RWHS should be designed to have a higher reliability, i.e., a RWHS should be able to meet the desired demand on most days in a year.
It is worth mentioning that the design of a RWHS is concerned with determining the storage capacity required to maintain enough water in the tank to ensure water supply for the intended purposes. In this regard, reliability can be defined as the proportion of days when a RWHS is likely to meet the required demand. An unnecessarily large RWHS is a misuse of resources and space; on the other hand, a RWHS which is too small cannot serve its intended purposes and there is likely to be a shortage of water from the RWHS on a regular basis. Hence, a RWHS should be designed according to the needs of the household, and a common size cannot meet the demand at optimum level at different locations and households in a large city like Greater Sydney. There have been many studies demonstrating the benefit of having a RWHS in the house and also on design and performance criteria of a RWHS [3,4,5,6,7,8].
Domenech and Sauri [9] examined the efficiency of a RWHS for the two main types of buildings prevalent in the metropolitan area of Barcelona (Spain) by analyzing users’ practice and perception, drinking water savings and economic costs. They carried out the financial viability analysis of the RWHS in single and multi-family buildings and found that in single-family households, an expected payback period would be between 33 and 43 years depending on the tank size, and for a multi-family, building a payback period would be as high as 61 years for a 20 m3 tank. In Australian studies by van der Sterren et al. [10,11,12], it was found that although RWHS would be very useful in providing required water in peri-urban regions of Sydney, water quality would not always meet the required standard in relation to heavy metals and pathogens.
Kus et al. [13] compared the water quality with The Australian Guidelines for Water Recycling [14]. They used eleven rainwater tanks located in Sydney metropolitan regions and five rainwater tanks located in peri-urban regions of Sydney. They demonstrated that simple yet effective treatments could bring the water quality to desired standards for non-potable purposes.
Campisano et al. [15] examined the performance of a domestic RWHS for toilet flushing in 44 Italian sites by using a non-dimensional approach characterized by a demand and storage fraction. Regression curves were developed to describe the relationship between the water-saving efficiency and the modified storage fraction that allowed the RWHS systems to be sized based on the desired water-saving performance level. The results showed that the system performance was dependent on climatic zones and the intra-annual characteristics of the precipitation regimes.
Rahman et al. [16] examined the water-savings potential, reliability of water supply, financial benefits and the adequacy of the current government subsidy for a RWHS in a detached house at ten different locations in Greater Sydney, Australia. It was found that the average annual water-saving from a RWHS was strongly correlated with the average annual rainfall. Palla et al. [17] investigated the performances of a RWHS based on 46 sites within the European territory, equally distributed among five main climate zones based on the Koppen–Geiger classification. A behavioral model was implemented and non-dimensional parameters were used to suitably compare the system performance under various environmental (i.e., hydrologic characteristics) and operational (storage capacity) conditions. They found that the antecedent dry weather period was the main hydrologic parameter affecting the system behavior, while rainfall event characteristics (including event rainfall depth, intensity and duration) had weak correlations.
Ghisi and Schondermark [18] presented an investment feasibility analysis of a RWHS for the residential sector for five towns in Santa Catarina State, Southern Brazil. They observed that the ideal tank capacity would be conservative for high rainwater demands and in such cases an investment feasibility analysis should be carried out in order to obtain a more appropriate tank capacity. It was noted that rainwater use would be economically feasible for most cases and the higher the rainwater demand, the higher the feasibility. In a study in Iran, Mehrabadi et al. [19] assessed the applicability and performance of a RWHS to supply non-potable water. They found that in a humid climate, it was possible to supply about 75% of non-potable water demand by storing rainwater from larger roof areas. Sample et al. [20] assessed the performance of a RWHS in Richmond, Virginia (USA), using storage volume, roof area, irrigated area and an indoor non-potable demand. Results indicated that land uses that provided larger demands, such as offices, commercial sites and high-density residential sites, would be better suited than lower-density residential blocks where a RWHS was more commonly employed.
This study investigates the water-savings potential and financial viability of a RWHS in peri-urban regions of Greater Sydney in Australia where semi-rural and rural properties generally depend on a RWHS to meet all their household water needs. Here, reliability of a RWHS is quite important as there is no mains water to supplement the RWHS. In this case, if a RWHS cannot meet the demand, water is to be bulk supplied into the tank and/or self-imposed restriction needs to be exercised so that the supply does not run out.

2. Method

To simulate the performance of a RWHS, a water-balance simulation model on daily time step was built in FORTRAN. This model accounted for various factors for a RWHS, such as tank size, daily rainfall, losses, daily water demand, mains top up and tank spillage. The spillage indicated the overflow from the tank if the tank capacity was exceeded. The adopted approach was very similar to Su et al. [21] and Rahman et al. [16]. It should be noted here that a behavioral model (yield-before-spillage type) was adopted in this study to simulate the long-term water balance of a RWHS. However, a yield-after-spillage model could have been adopted. A yield-before-spillage type model generally provides 10%–15% overestimation of water savings compared with a yield-after-spillage model.
In the adopted model, the rainfall was regarded as inflow and the release and possible spillage as outflow. The release was estimated based on the following equations:
Rt = Dt; if It + St−1Dt
Rt = It + St−1; if It + St−1 < Dt
where Dt is the daily demand (m3) on day t; St−1 is the tank storage at the end of the previous day (m3); Rt is release from rainwater tank (m3) and It is inflow (m3). Spill (SPt) (m3) was calculated from the following equations:
SPt = It + St−1DtSMAX; if It + St−1Dt > SMAX
SPt = 0; if It + St−1 DtSMAX
where SMAX is the design storage capacity (m3).The tank storage St at the end of day t was calculated using the following equations:
St = SMAX; if SPt > 0
St = St−1 + ItRt; if SPt = 0
The reliability of the RWHS was calculated as the ratio of the number of days when the intended demand was met fully by the available rainwater and the total number of simulated days.
Life cycle cost analysis (LCCA) is the method of assessing the cost of a product over its life cycle or portion thereof [22]. Life cycle cost is the sum of acquisition and ownership costs of a product over its life span. All past, present and future cash flows identified in the LCCA are converted to present-day value. This study uses the concept of nominal cost (the expected price that will be paid when a cost is due to be paid, including estimated changes in price due to factors such as changes in efficiency, inflation/deflation and technology) and a nominal discount rate (the rate to use when converting nominal costs to discounted costs). To convert a nominal cost (CN) to discounted cost (CD), the following equation was used [22]:
Water 06 00945 i001
where dn is the nominal discount rate per annum and y is the appropriate number of years.

3. Study Area and Data

In this study, ten different locations in the Greater Sydney regions of Australia were considered (Figure 1). Nine of these ten locations are situated in the peri-urban regions of Greater Sydney, which are Campbelltown, Hornsby, Penrith, Richmond, Castlereagh, Wallacia Post Office, West Pennant Hills, Moss Valeand Cataract Dam. The other location (Parramatta) is situated in the approximate center of Greater Sydney, which is used to compare the water use in peri-urban and metropolitan Sydney regions. The daily rainfall data at the selected locations were obtained from the Australian Bureau of Metrology (Table 1). The data lengths were in the range of 37 to 110 years, with an average of 67 years. The average monthly rainfall distribution in Greater Sydney regions is shown in Figure 2, which shows that July to September are the lowest rainfall months, which are also the winter season requiring very little irrigation due to insignificant gardening activity in this region, as residents do not grow many vegetables and flowers during the winter.
Figure 1. Ten selected locations in the Greater Sydney regions.
Water 06 00945 g001
Table 1. Study locations and details of selected daily rainfall data.
LocationRainfall stationPeriod of rainfall recordAverage annual rainfall (mm)
Campbelltown0680071900–2009743
Hornsby0661581936–20091325
Parramatta0661241966–2009964
Penrith0670841970–2009940
Richmond0670211902–2003801
Castlereagh0670021950–2010802
Wallacia Post Office0670291946–2010870
West Pennant Hills0670981946–20051076
Moss Vale0681951972–20081104
Cataract Dam0680161936–20091108
Figure 2. Average monthly rainfall in the Greater Sydney region.
Water 06 00945 g002
In this study, three different combinations of water use were considered: (i) toilet and laundry; (ii) irrigation; and (iii) a combination of toilet, laundry and irrigation (combined use). The feasibility of 8 different rainwater tank sizes (1, 2, 3, 5, 7, 10, 15 and 20 kL) was initially examined. A hypothesized new development was considered at each of the study locations with a single household having 4 occupants. A total site area of 450 m2 was considered with a roof, lawn and impervious areas of 200 m2, 150 m2 and 100 m2, respectively. It should be noted here that in peri-urban areas of Sydney, block size generally varies from 400 m2 to 600 m2; with 450 m2 as the most typical size in new development projects [16]. The adopted different roof, lawn and impervious areas reflect the commonly adopted choices in the design of houses by various residents in Sydney regions. Also, the number of occupants per household in Sydney generally varies from 2 to 6, reflecting small and large families. The rainwater tank was considered to be located above ground.
It should be noted that typical 5 kL, 10 kL and 20 kL tanks would occupy about 2.5%, 3.3% and 6% of the lawn area, respectively (assuming a lawn area of 150 m2 for a 450 m2 block), which seems to be quite reasonable; however, a 50 kL tank would take about 15% of the lawn area. In peri-urban regions, the block sizes are generally larger than 450 m2 and hence bigger tanks could be adopted.
To assess the performance of a RWHS under different plausible conditions, the tank size, block size and number of occupants were varied. It was done by (i) varying the tank size to 12 different values (i.e., 1, 2, 3, 5, 7, 10, 15, 20, 25, 30, 40 and 50 kL); (ii) changing the block size (from 450 m2 to 600 m2); (iii) changing the number of occupants from 4 to 2 and 6; and (iv) by changing the frequency of toilet use from 3 to 5 times per person per day.
The water demand data for toilet, laundry and irrigation use for residential properties were obtained from Sydney Water. The toilet considered in the study was a 6-litre AAA (the higher the As, the more water efficient the device is) rated dual flush toilet, and a frequency of toilet use of three times per person per day was assumed, which was equivalent to 0.018 kL per person per day. The washing machine considered in this study was rated 4A. It was assumed that the washing machine had a volume of 50 L and it would be used three times per week, which was equivalent to 0.0215 kL/day of water use. The irrigation demand per square meter of lawn area was assumed to be 10 mm per day as per Sydney Water recommended value in the region. In the adopted model, if the daily rainfall exceeded 10 mm, irrigation demand was kept at zero on that day, and after a heavy rainfall event (daily rainfall exceeding 50 mm), irrigation demand was kept at zero for a number of subsequent days (one day for each 25 mm of rainfall).
To carry out the life cycle cost analysis (LCCA), necessary data on the capital and operating costs for the RWHS were obtained from rainwater tank suppliers in Sydney. The capital costs included the cost for the rainwater tank, concrete base, pump, first flush, pump to tank connection kit, electrical and plumbing supplies and all the necessary labor costs. A maintenance cost of AUD20 per year was adopted in the LCCA. The tank was considered to be made of polyethylene (poly tank round shape). The capital costs of installing the RWHS in Sydney regions are found to be AUD 1360, 1743, 1882, 2114, 3005, 3461, 5040 and 6850 for 1, 2, 3, 5, 7, 10, 15 and 20 kL tanks, respectively. In the LCCA, the current water price in Sydney (AUD 2.13/kL) was adopted. The base year for LCCA was assumed to be 2013. The life of the RWHS was assumed to be 40 years and a discount rate of 3% was considered in undertaking LCCA. The reasons for selecting these values was that it is generally assumed that a RWHS has a design life of 40 years in Australian conditions, and a 3% discount rate is close enough to the Australian consumer price index value of 2.7% for the year 2013 [23].

4. Results

4.1. Reliability and Water Savings

Initially, the reliability and water savings considering the daily rainfall data of all the years on record were determined for the roof top, lawn and impervious areas of 200 m2, 150 m2 and 100 m2, respectively. The reliability of rainwater tanks of different sizes and water use for these cases are shown in Figure 3, Figure 4 and Figure 5. 
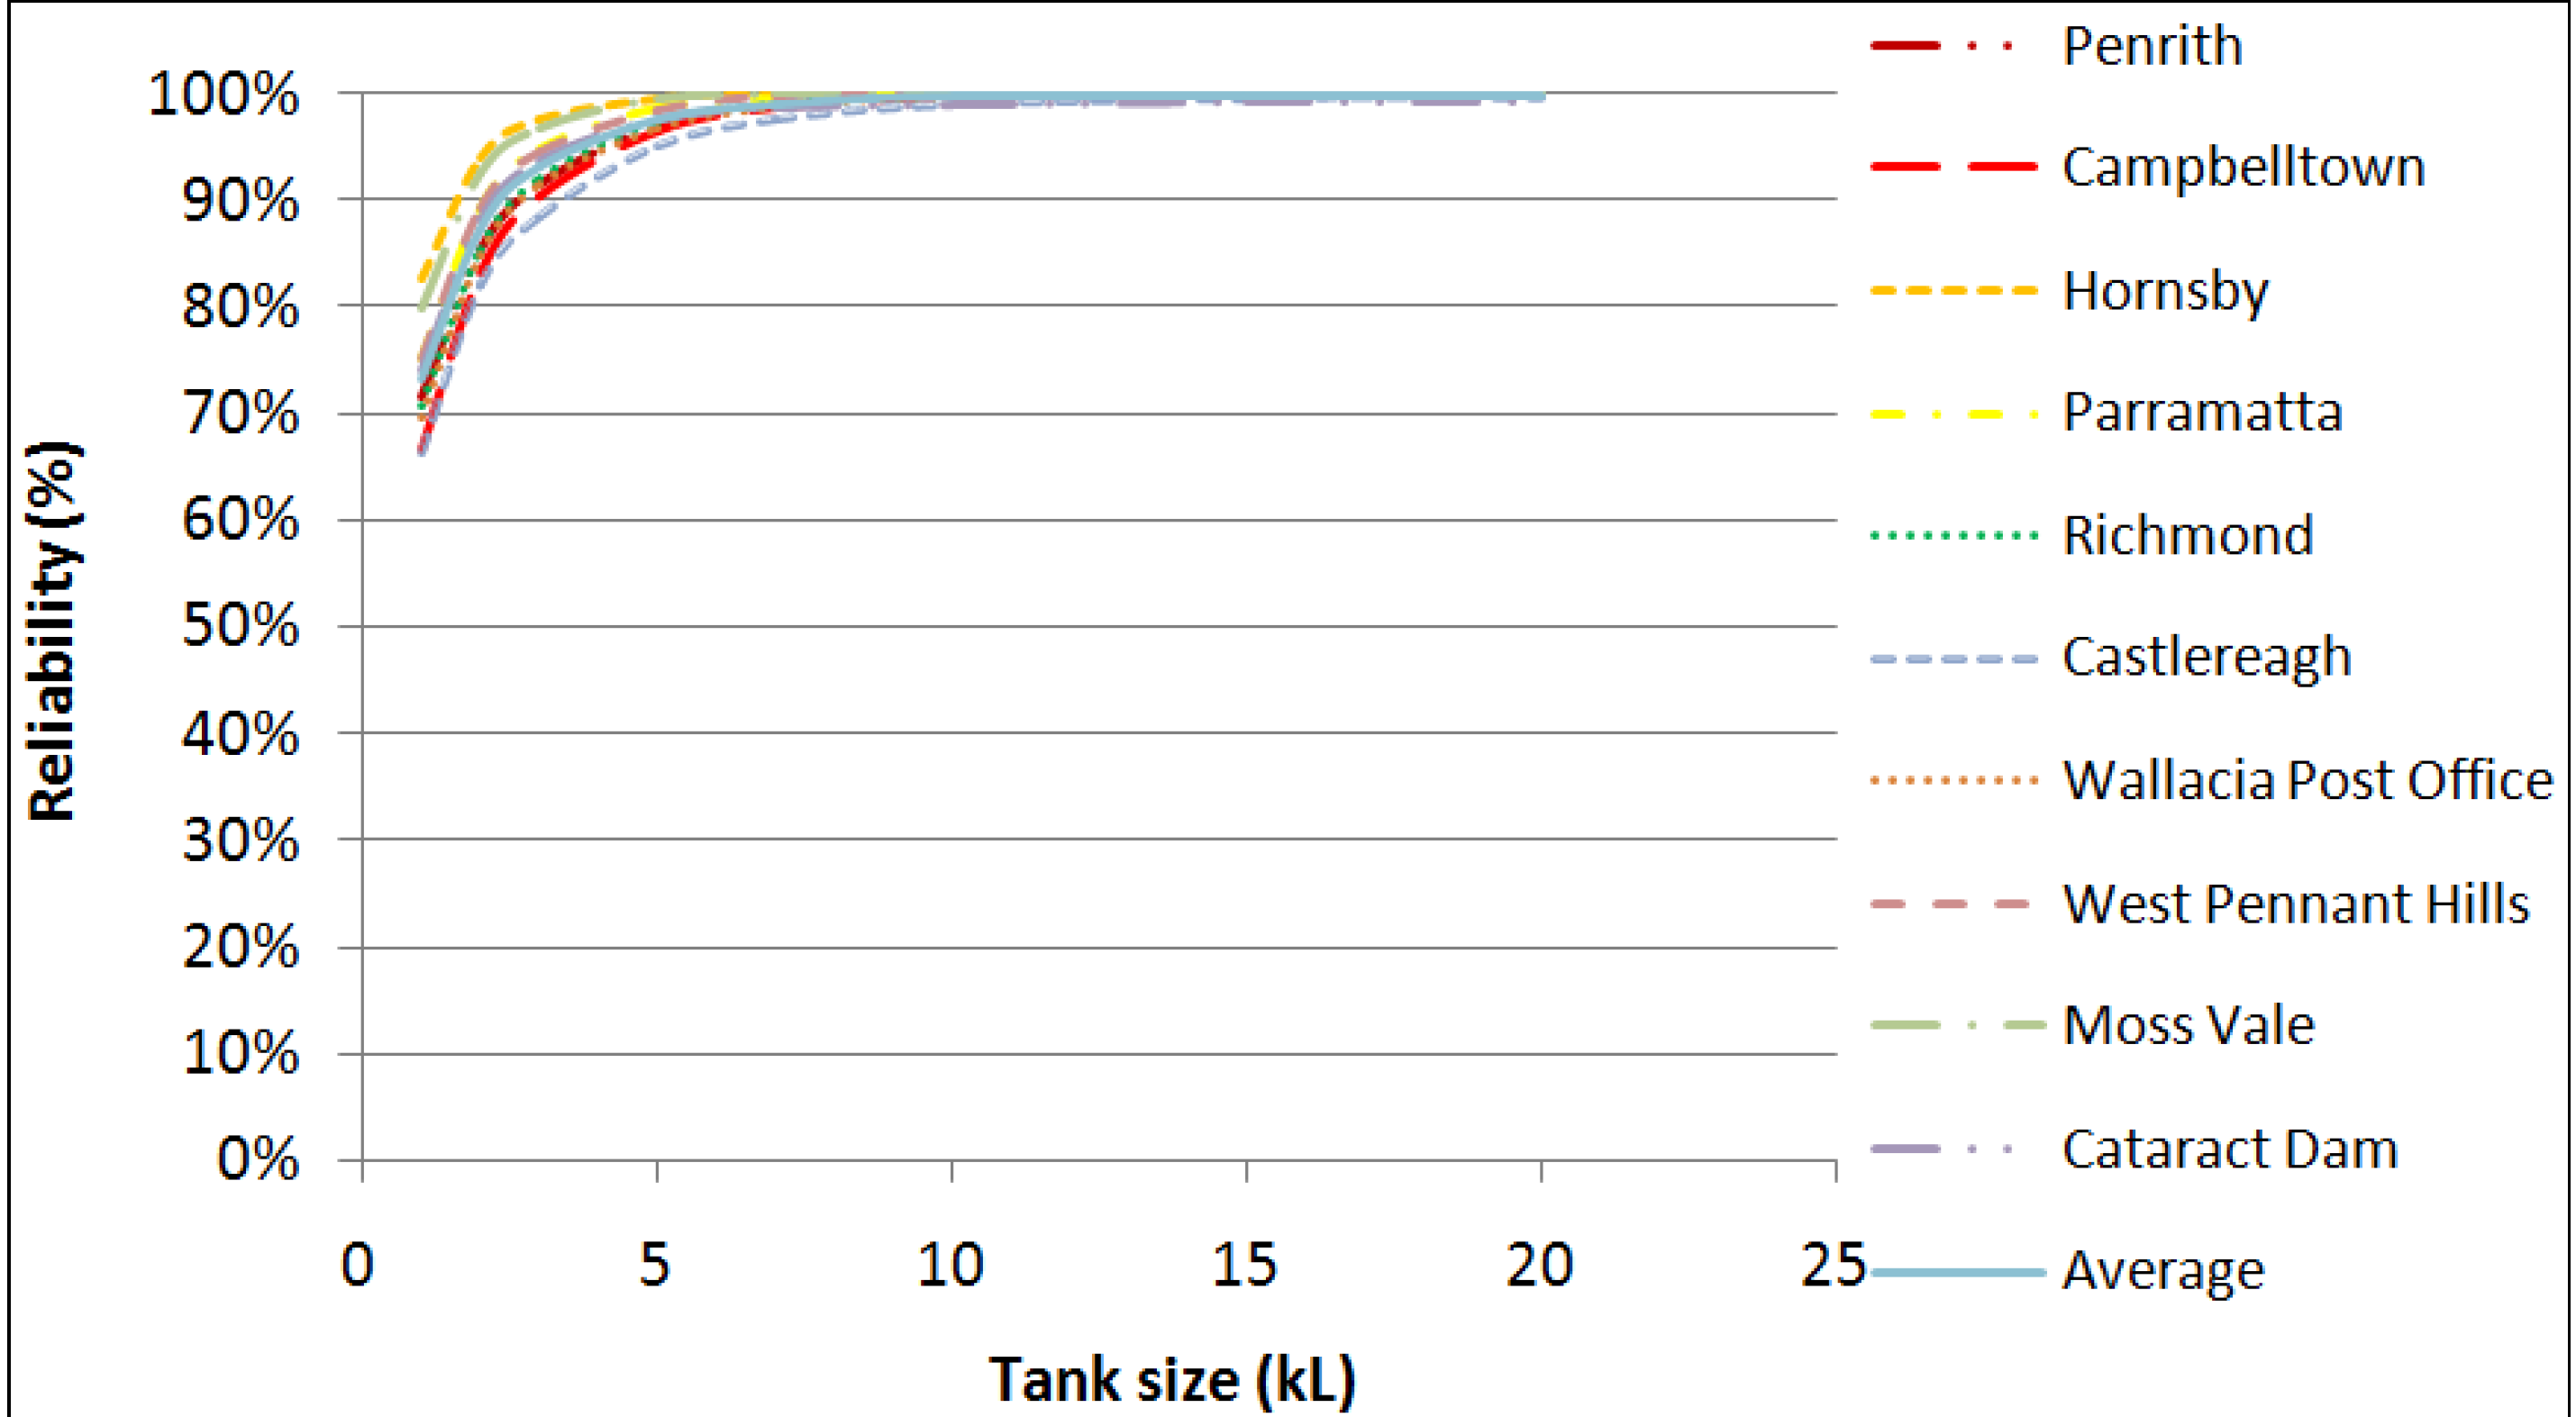
Figure 3 shows that, on average, a 1 kL rainwater tank can meet the demand for toilet and laundry use for 73% of the days in a year, which increases to 98% for a 5 kL tank size and 99% for a 20 kL tank. Among the ten locations, Hornsby has the highest reliability (99% for a 5 kL tank) and Campbelltown has the lowest (96% for a 5 kL tank). This reliability is well related with the average annual rainfall values at these two locations (1325 mm and 743 mm for Hornsby and Campbelltown, respectively). Figure 3 also shows that the differences in reliability across different locations reduce as the tank size increases and a rainwater tank of 5 kL size can meet the demand for toilet and laundry use with a reliability of greater than 96% at all the ten locations.
Figure 3. Reliability of RWHS at ten selected locations using rainwater for toilet and laundry use (considering the daily rainfall data of all the years on record).
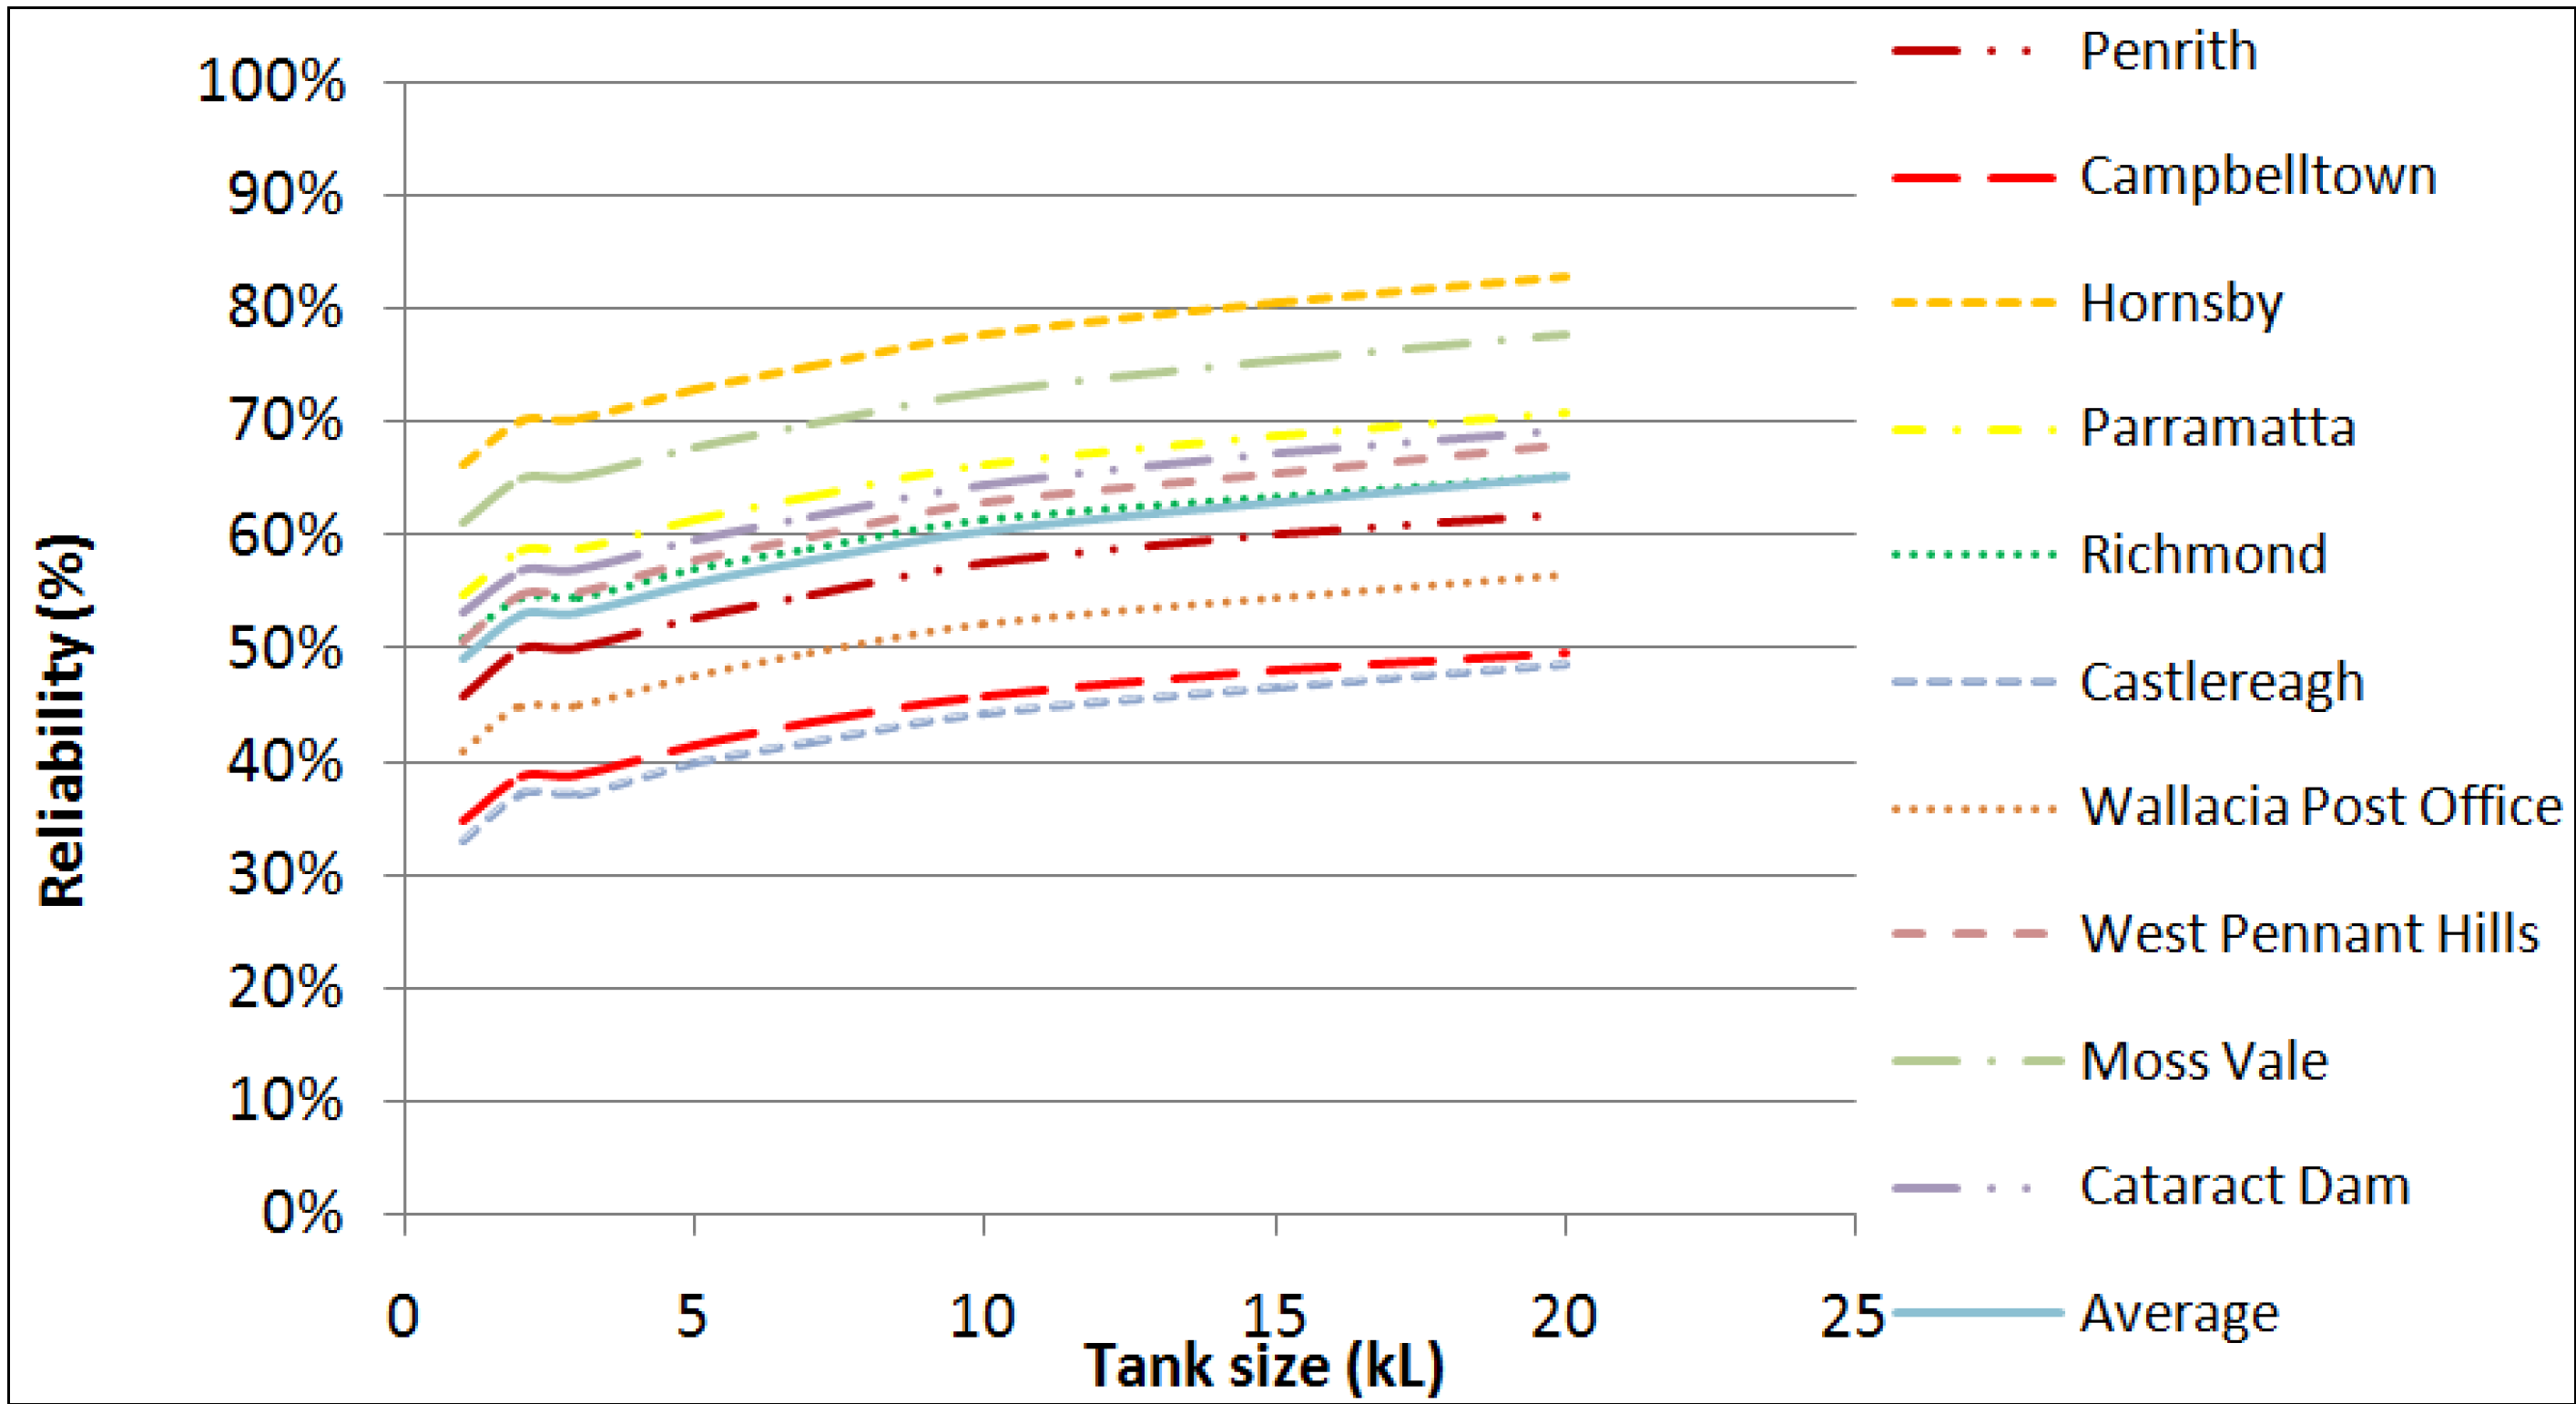
Water 06 00945 g003
As can be found in Figure 4, the reliability for irrigation use at all ten locations is smaller than for toilet and laundry use (shown in Figure 3). For a 5 kL tank, the reliability values for Hornsby and Campbelltown are 73% and 41%, respectively. This result shows that the reliability varies significantly at these two locations, which is well related with the average annual rainfalls of these locations. The average reliability for the ten locations is very close to the reliability of Richmond. These results highlight that even with a 20 kL rainwater tank, the reliability of 99% cannot be achieved for irrigation use at any of the ten locations. This is due to the fact of the high irrigation demand in Greater Sydney regions, which is characterized by periods of drought spells lasting over weeks and even months in almost every year.
Figure 4. Reliability of RWHS at ten selected locations using rainwater for irrigation use (considering the daily rainfall data of all the years on record).
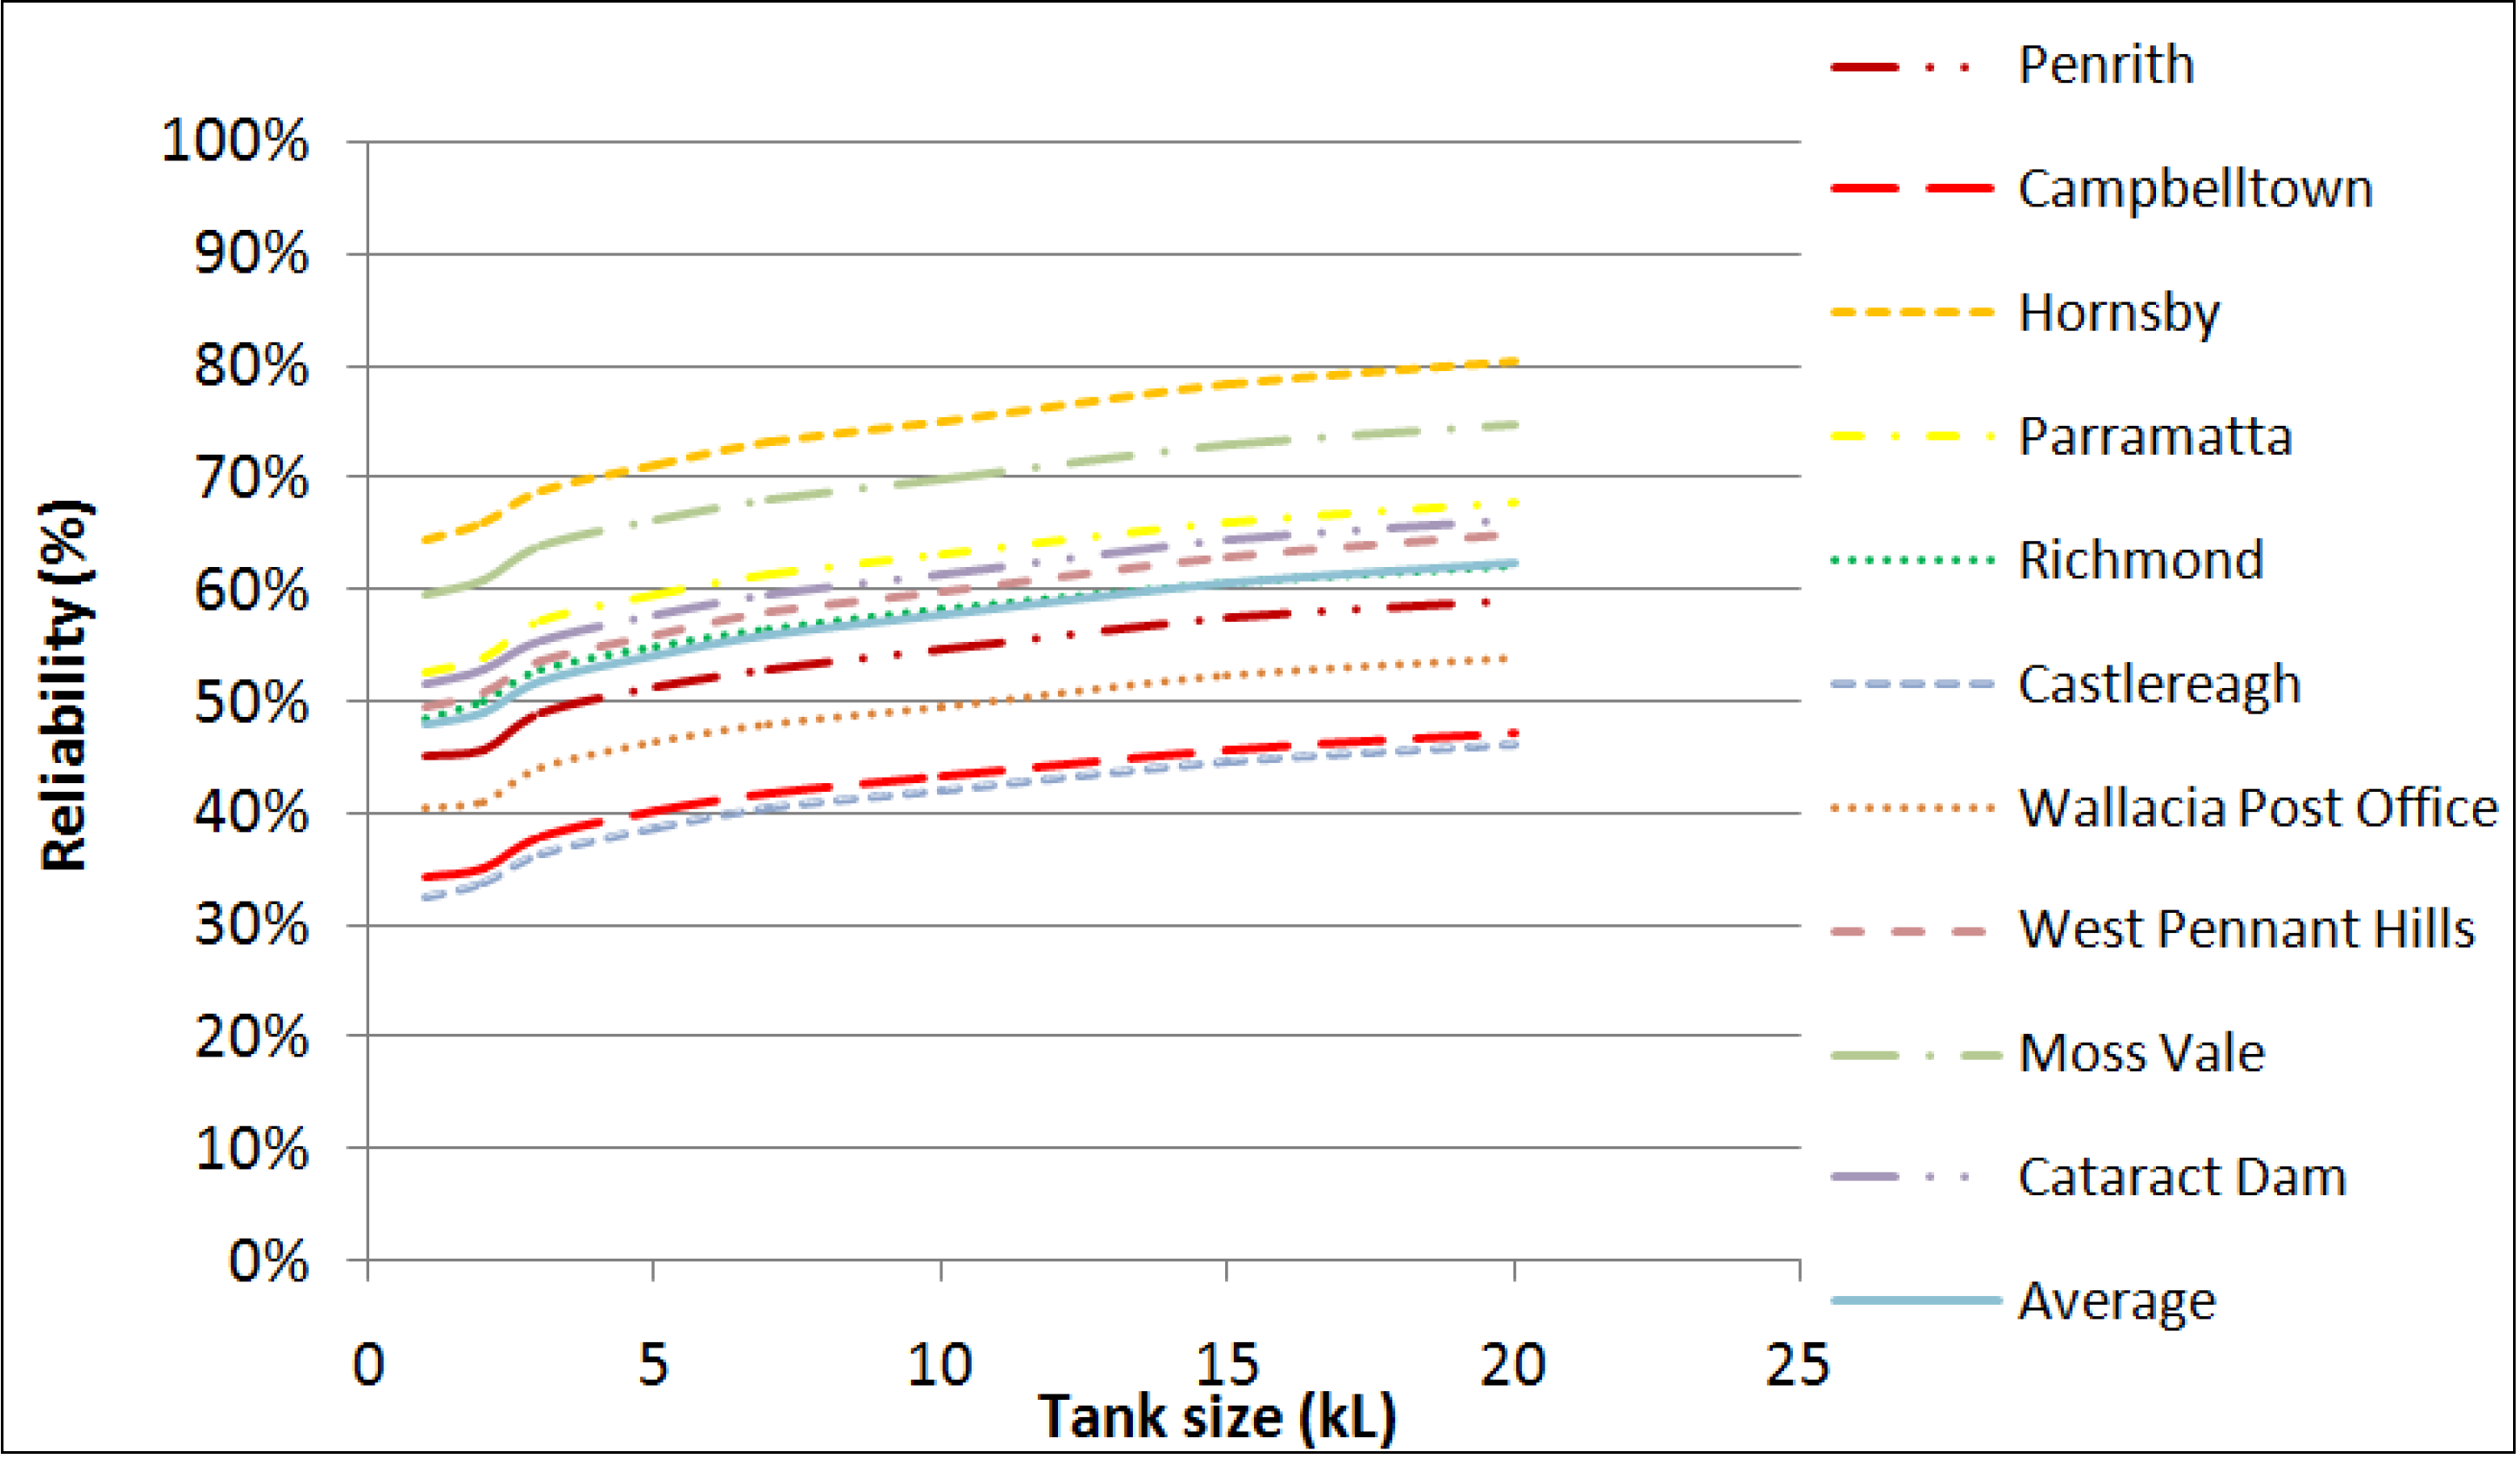
Water 06 00945 g004
Figure 5. Reliability of RWHS at the ten selected locations for utilization of rainwater for combined use (considering the daily rainfall data of all the years on record).
Water 06 00945 g005
Figure 5 presents reliability values for the toilet, laundry and irrigation use (combined use). It is found that the reliability increases with the increasing rainwater tank size as expected. The highest and lowest reliability values for a 5 kL tank were found to be for Hornsby (71%) and Campbelltown (40%) respectively. The average reliability over the ten locations is very close to the reliability for Richmond as can be seen in Figure 5. The reliability for combined use does not reach 99% for any of the ten locations, not even for a 20 kL tank. Also, there is a notable difference in reliability across different locations in Greater Sydney, which suggests that a common tank size is not appropriate for Greater Sydney regions.
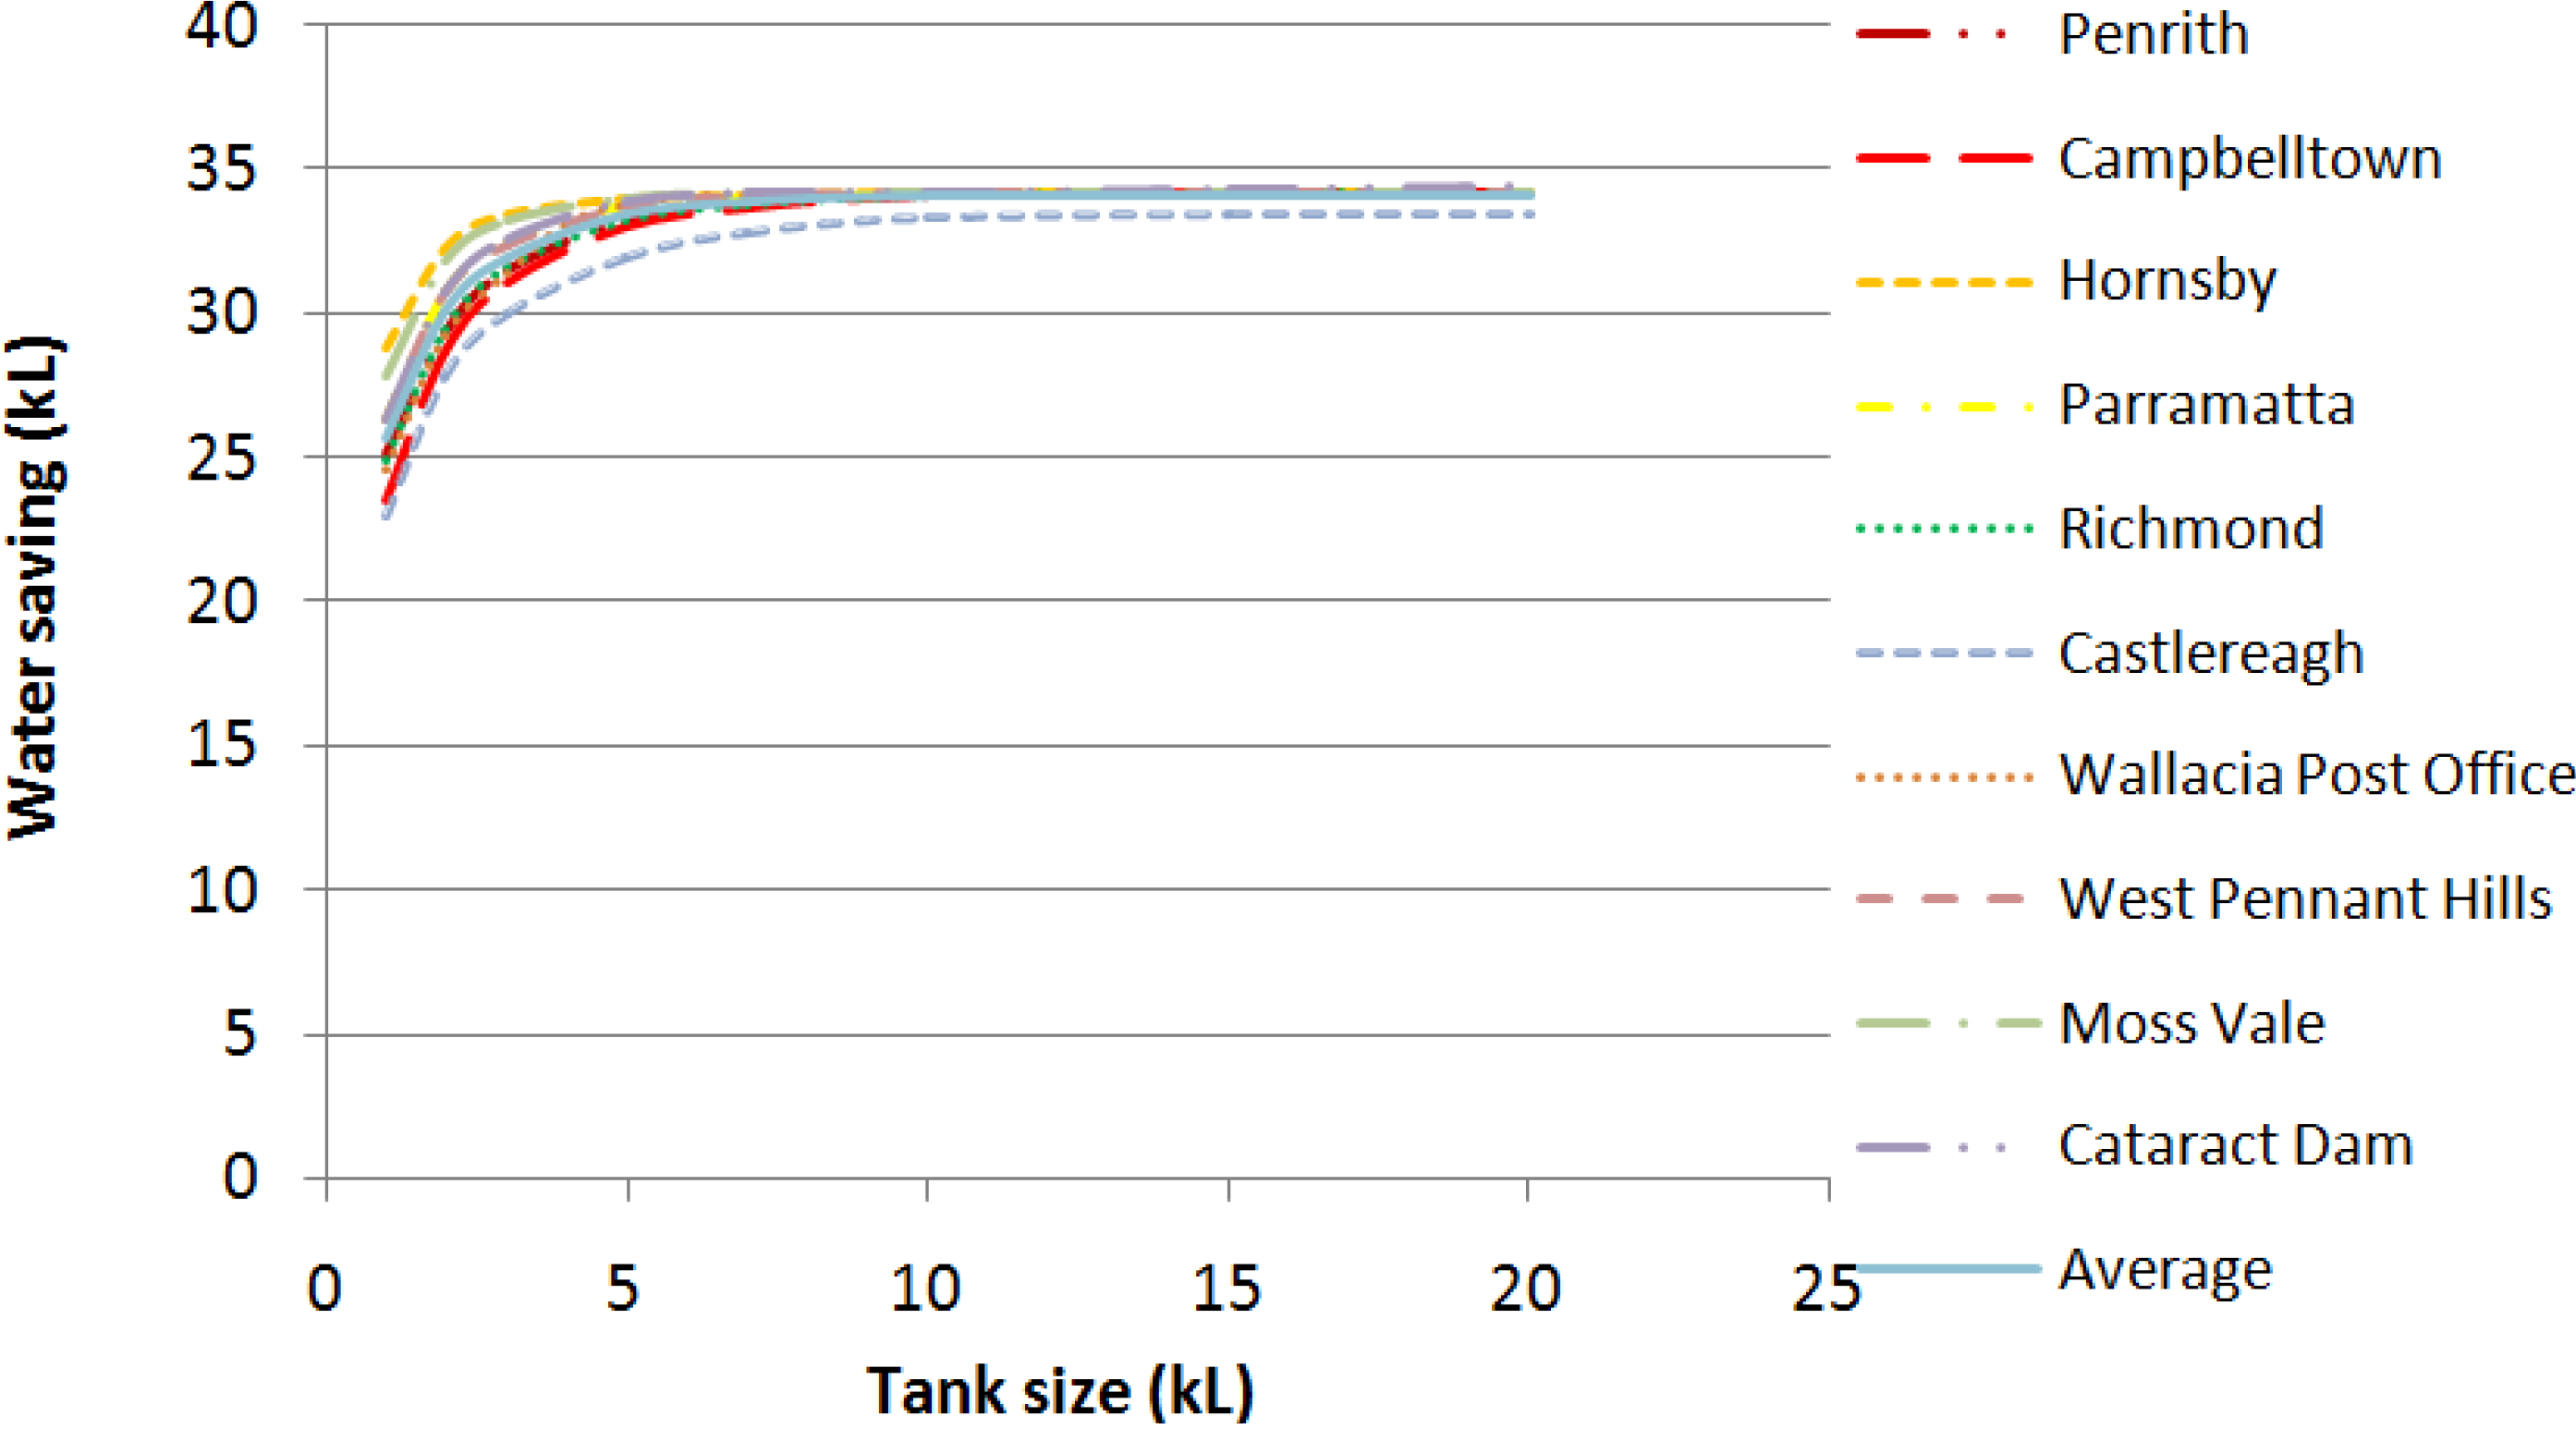
Figure 6 shows the water savings for toilet and laundry use. It can be seen that after about a 7 kL tank size, the water savings become nearly constant for all ten locations. This is due to the fact that water utilization from a tank largely depends on the number of users in the house; for a larger tank, if the number of users is not increased, the water savings would not increase as a significant portion of the harvested water would remain unutilized. For a 5 kL tank, the average annual water-savings range is from 34 kL (Hornsby) to 33 kL (Campbelltown) with a mean value of 33 kL over all the ten locations, which suggests a smaller variation across the ten locations with respect to water savings for toilet and laundry use.
Figure 6. Water savings from a RWHS for toilet and laundry use (considering the daily rainfall data of all the years on record).
Water 06 00945 g006
Figure 7 shows that water savings for irrigation use increase with increasing rainwater tank size as expected. For a 5 kL tank, the average annual water-savings range from 46 kL (Richmond) to 54 kL (Penrith), with the mean value for the ten locations being 51 kL.
Figure 7. Water savings from a RWHS for irrigation use (considering the daily rainfall data of all the years on record).
Water 06 00945 g007
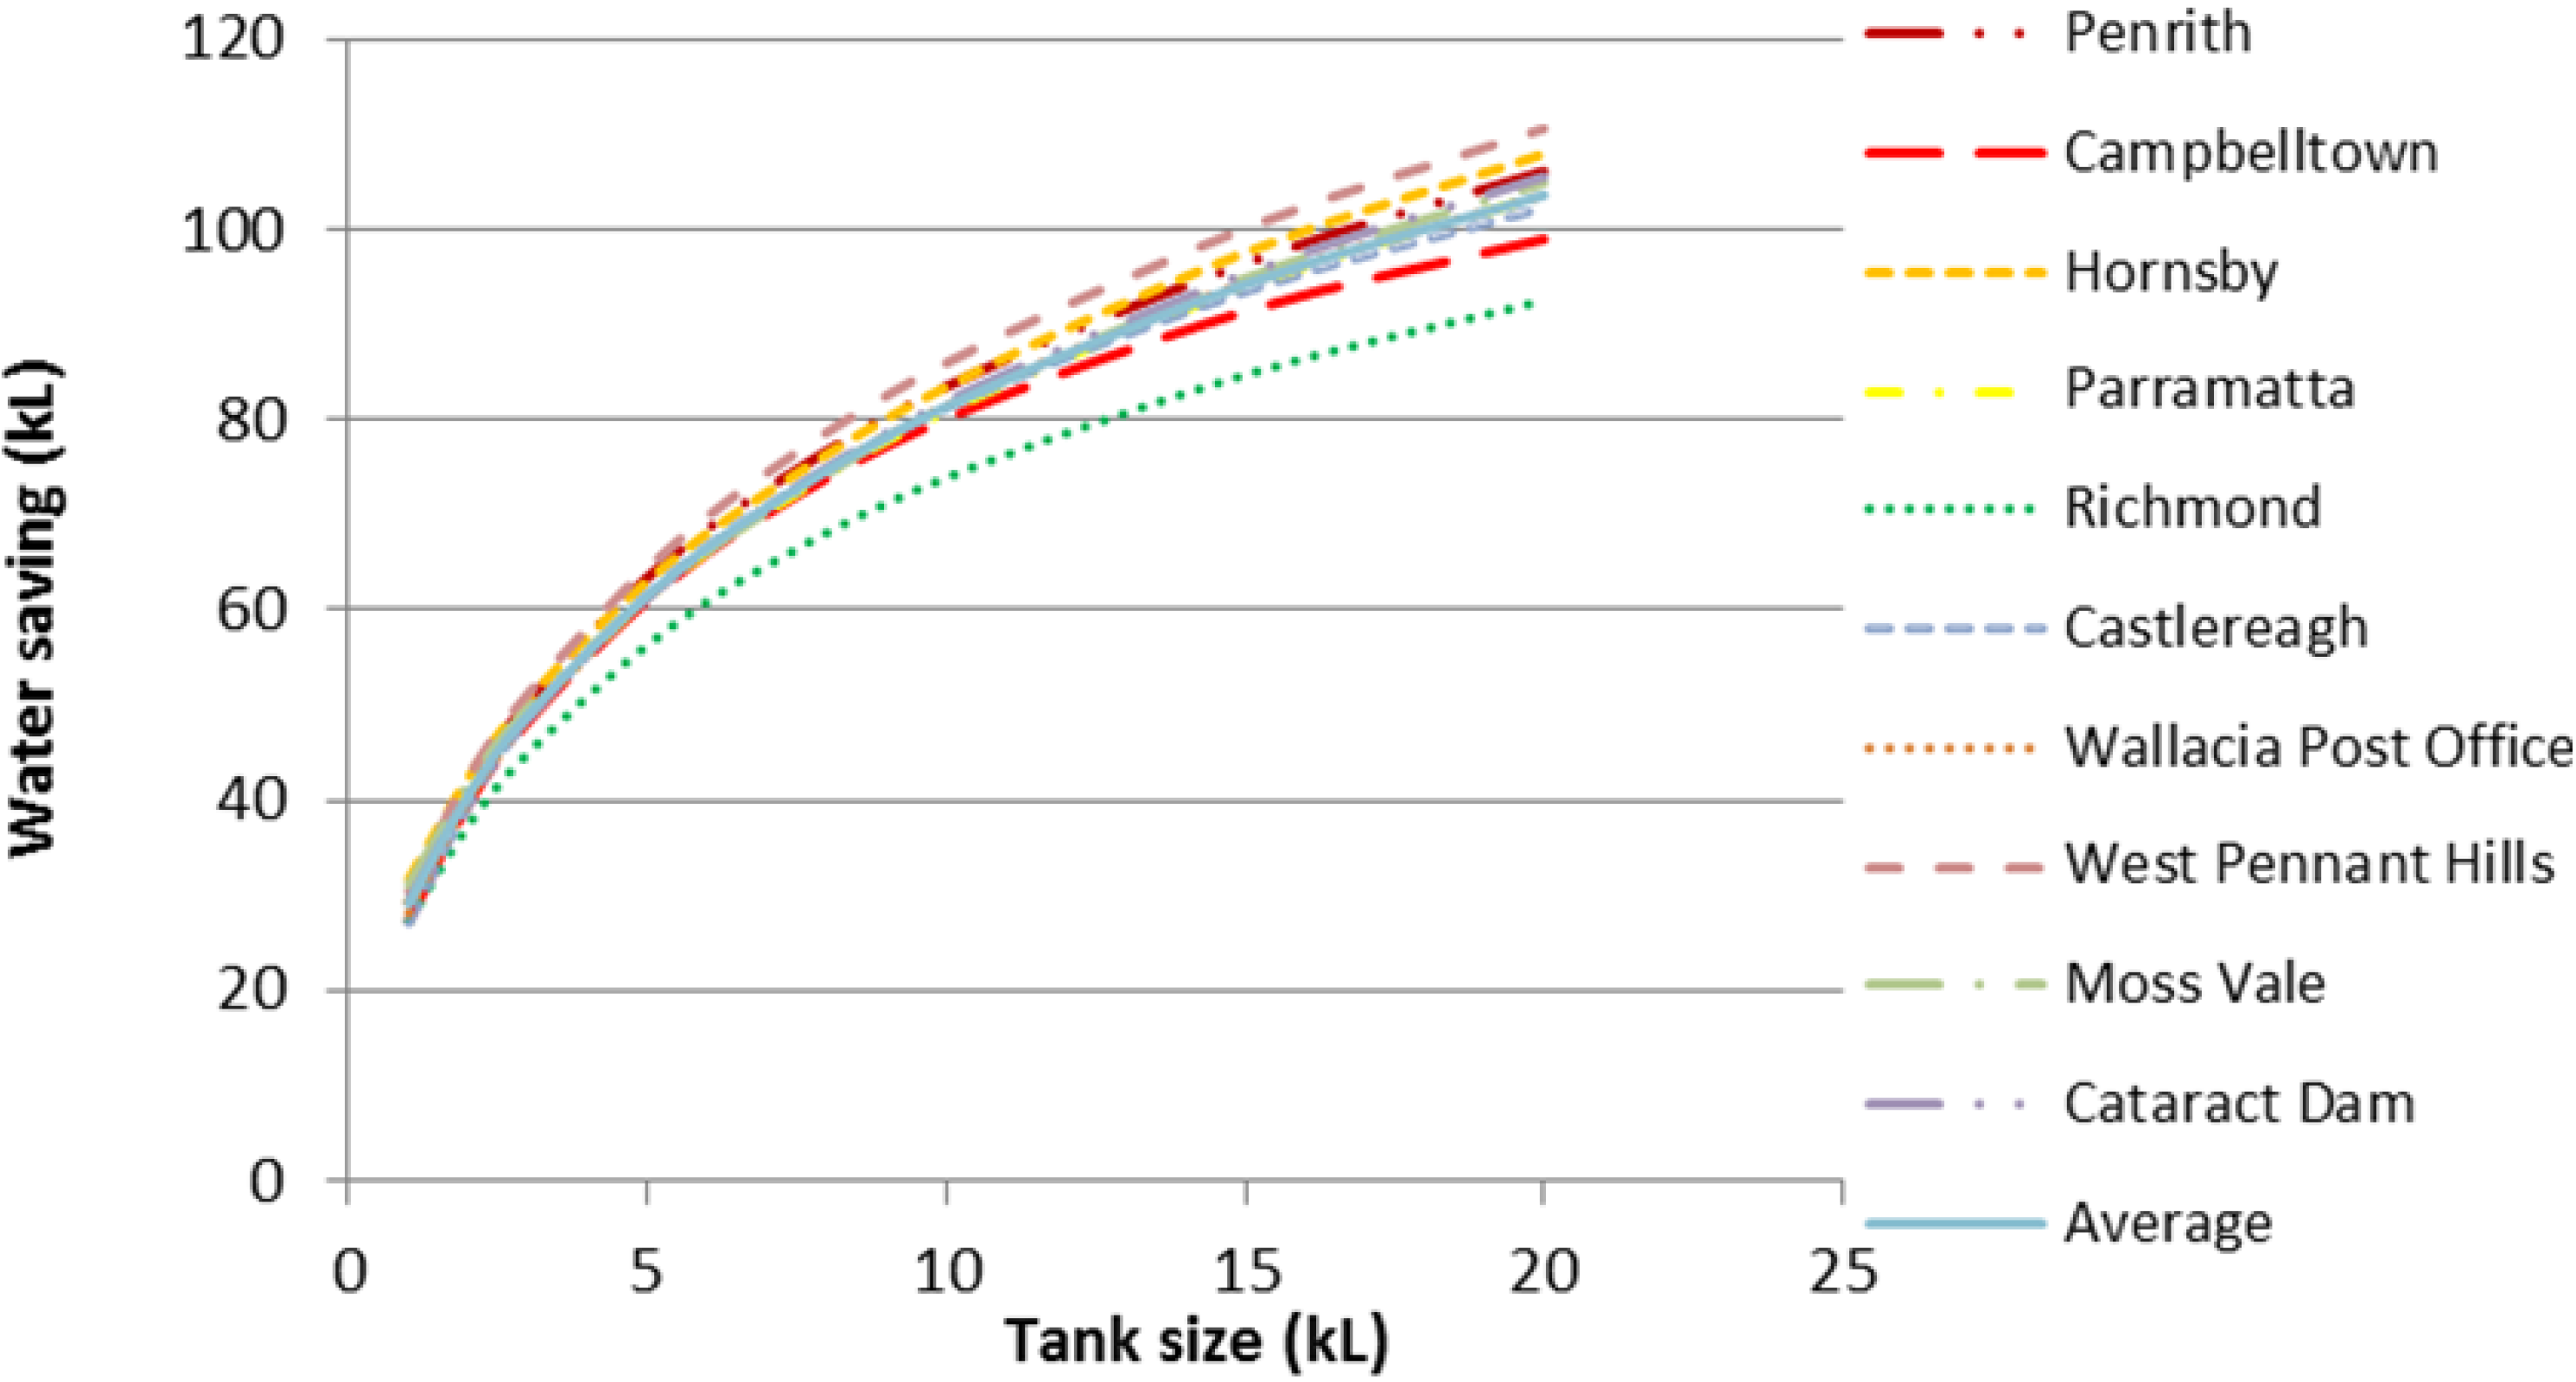
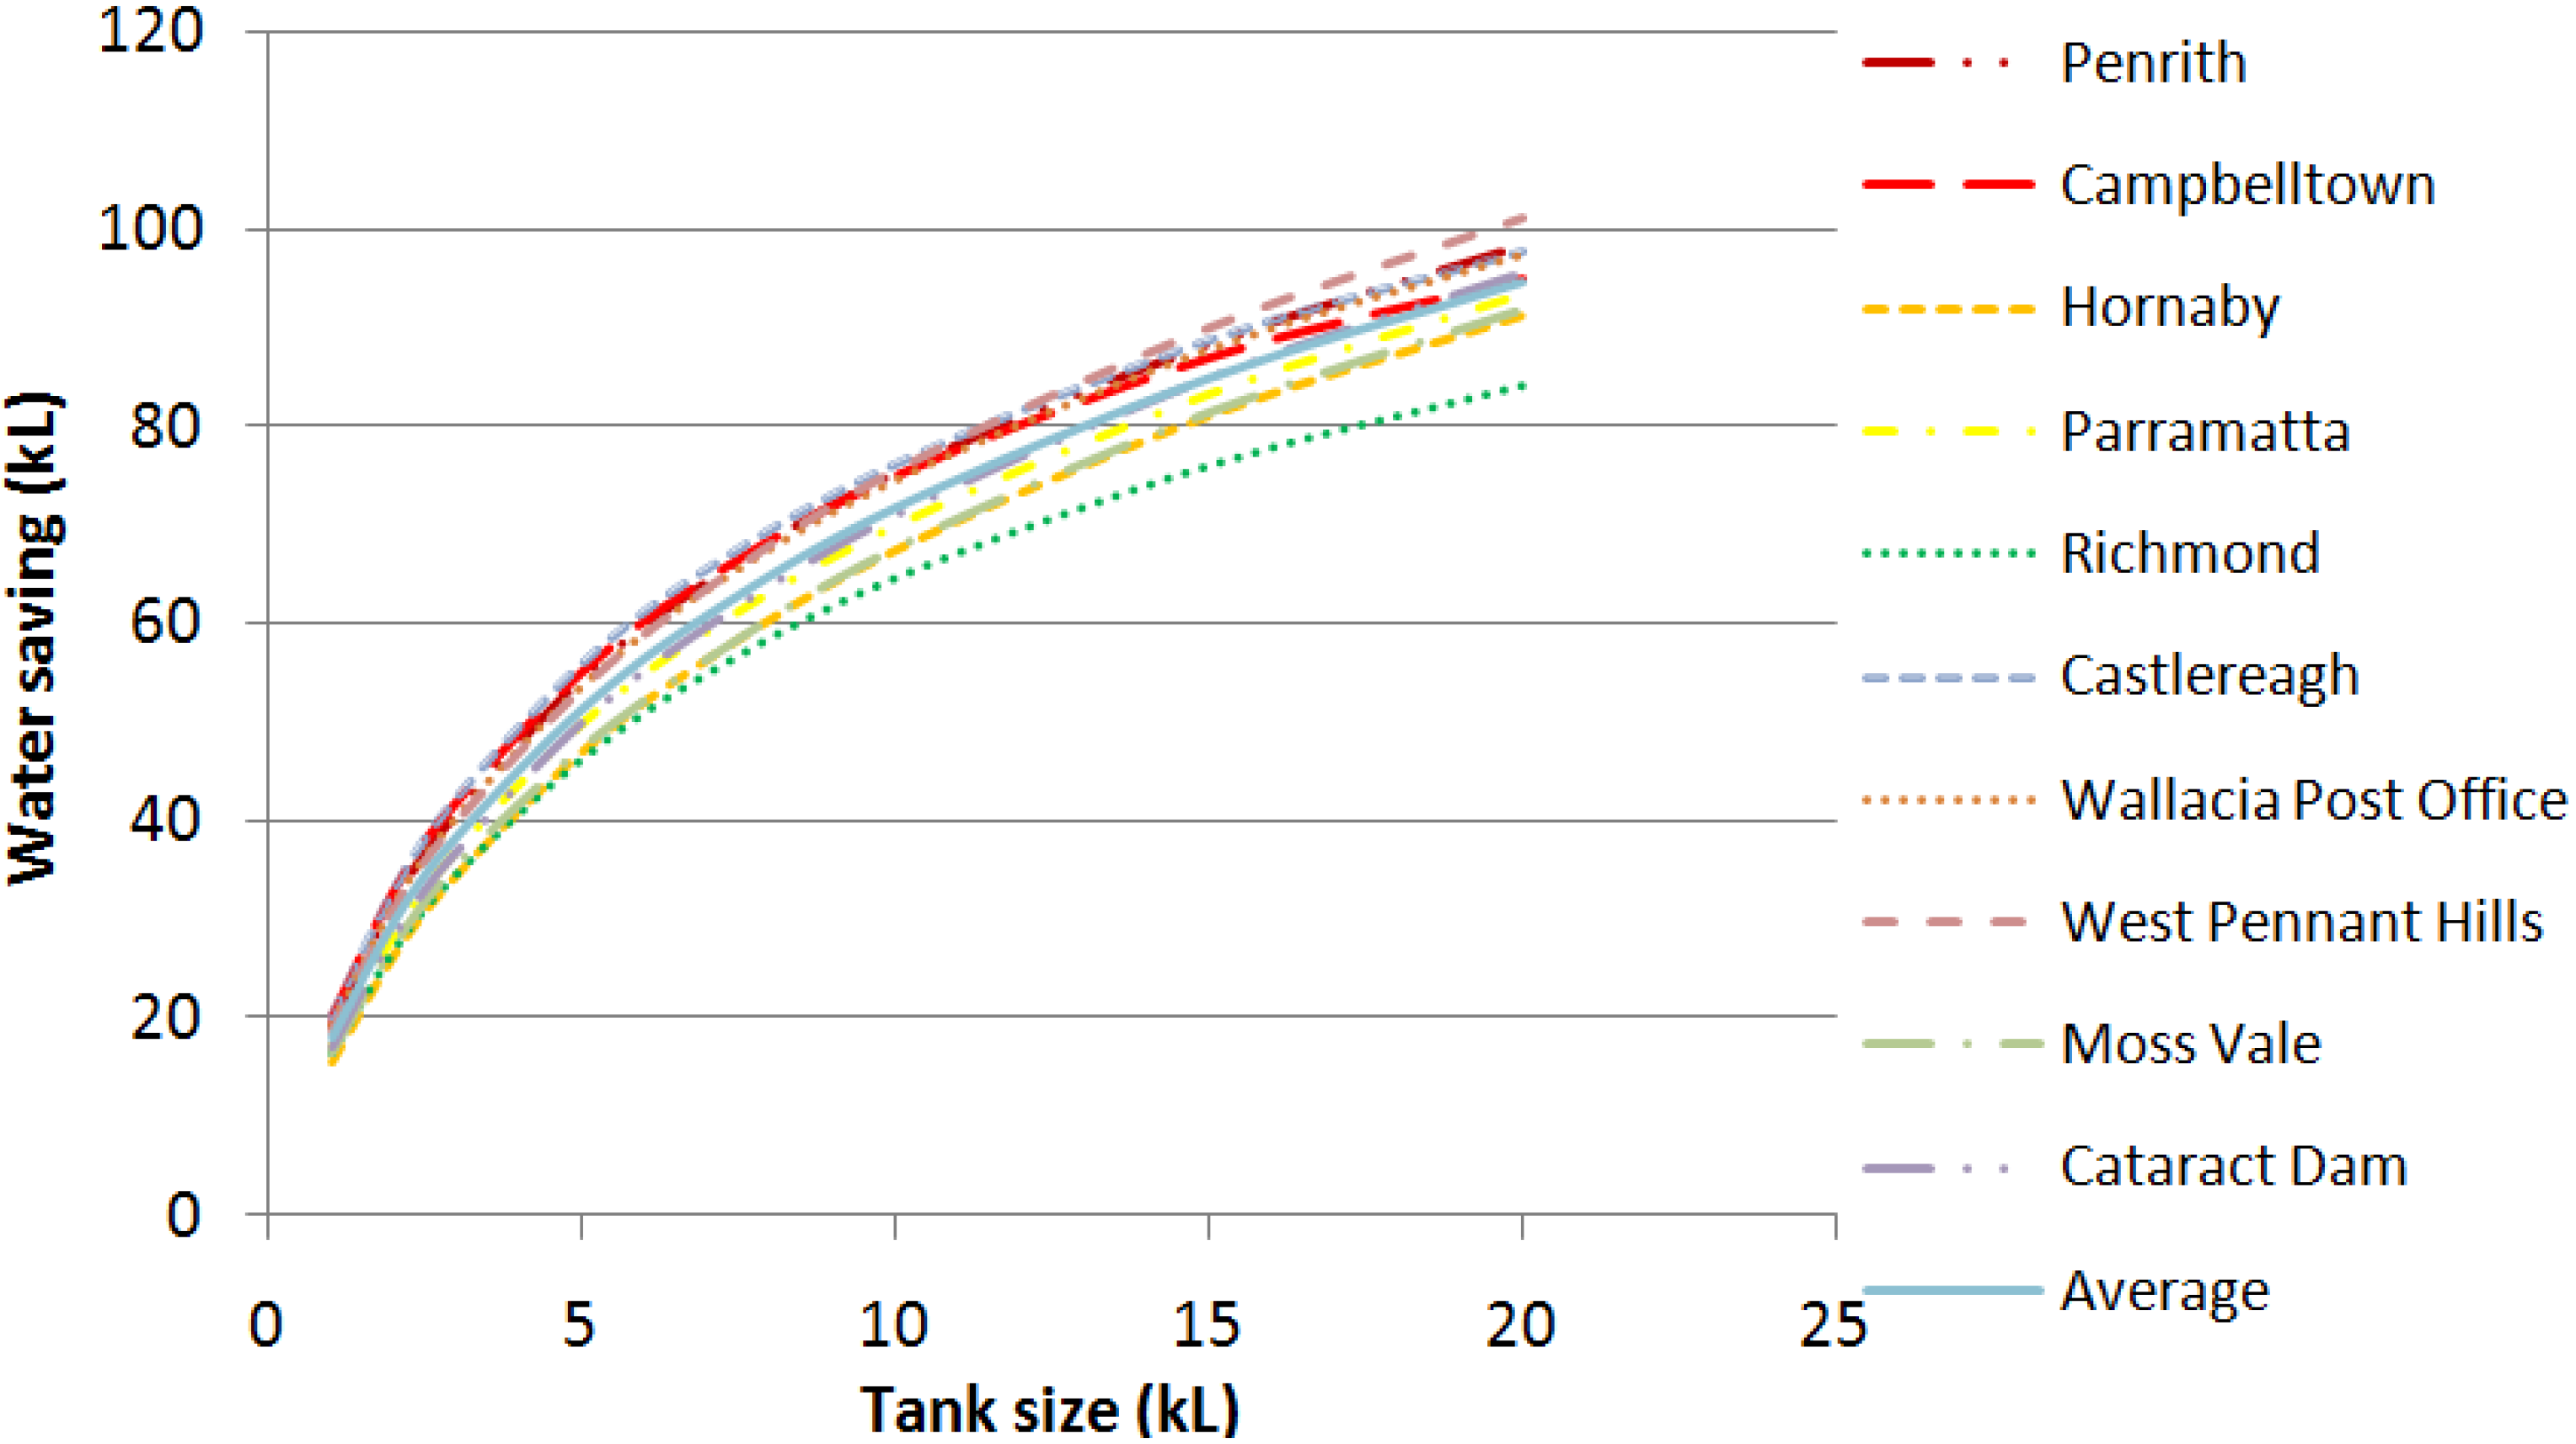
Figure 8 shows that the differences in water savings for combined use for the ten different locations reduce as the size of rainwater tank decreases. The water saving increases with the increasing rainwater tank size as expected. For a 5 kL tank, Penrith has the highest average annual water savings (62 kL), Richmond has the lowest annual water savings (56 kL) and Parramatta corresponds very well to the average annual water savings over the ten locations (61 kL).
Figure 8. Water savings from a RWHS for combined use (considering the daily rainfall data of all the years on record).
Water 06 00945 g008
Table 2 shows the correlation coefficients of the relation between (i) reliability vs. tank size; and (ii) water savings vs. tank size. Table 2 shows that Hornsby and Campbelltown have the lowest and highest correlation coefficients for toilet and laundry use, and irrigation use. Moreover, the combined use over all the ten locations exhibits a strong correlation between the reliability and tank size, and water savings and tank size.
Table 2. Correlation coefficients between (i) reliability vs. tank size and (ii) water saving vs. tank size.
LocationsToilet and laundryIrrigationCombined use
ReliabilityWater savingsReliabilityWater savingsReliabilityWater savings
Campbelltown0.910.910.990.990.980.99
Hornsby0.930.910.990.990.990.99
Parramatta0.830.830.980.990.990.99
Penrith0.870.870.980.990.990.99
Richmond0.900.910.990.990.990.99
Castlereagh0.930.930.990.990.990.99
Wallacia Post Office0.910.910.990.990.980.99
West Pennant Hills0.880.880.980.990.980.99
Moss Vale0.840.840.980.990.990.99
Cataract Dam0.880.880.980.990.990.99
For a 5 kL rainwater tank in the ten selected locations in Greater Sydney regions, the reliability of a RWHS was found to be moderately correlated with the average annual rainfall (AAR) as shown by the following equations:
R1 = 0.562 + 0.060 × ln(AAR), R2 = 0.65
R2 = −2.733 + 0.478 × ln(AAR), R2 = 0.76
R3 = −2.764 + 0.473 × ln(AAR), R2 = 0.76
where R1, R2, R3 are reliabilities (%) for (i) toilet and laundry (ii) irrigation and (iii) combined use, respectively, and AAR is average annual rainfall (mm) and R2 is the coefficient of determination.
Figure 9 and 
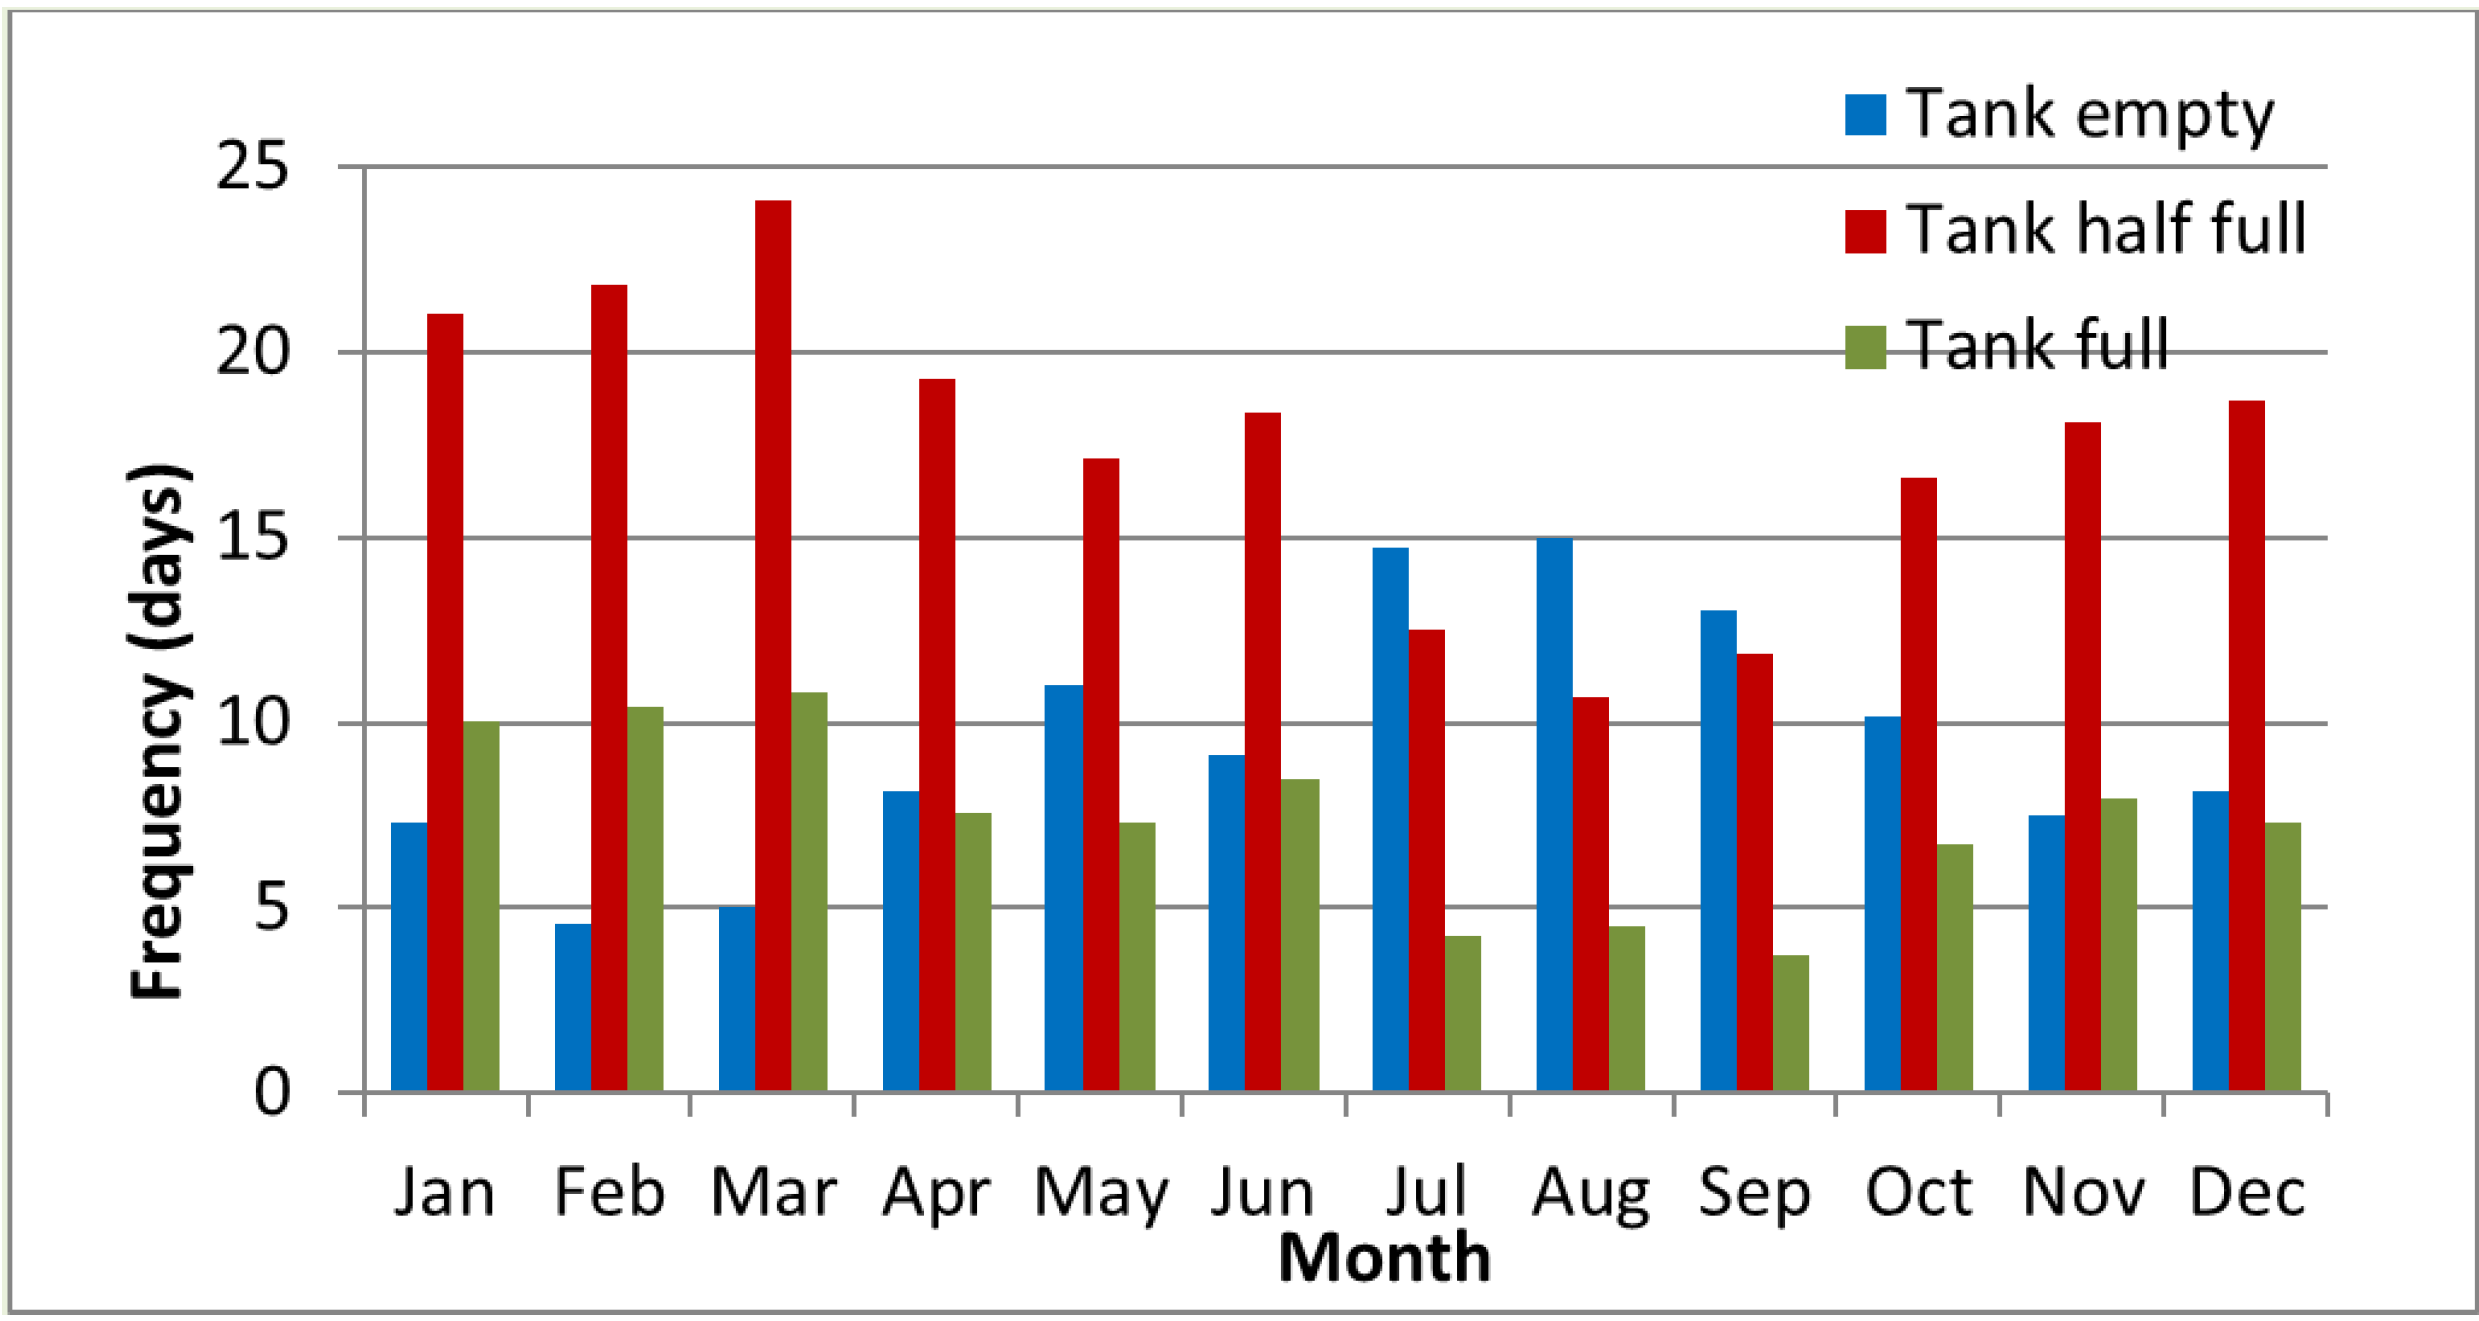
Figure 10 give a summary of the monthly performance of a 5 kL rainwater tank in Hornsby and Campbelltown locations, which have the highest and lowest average annual rainfalls among the ten selected locations. From Figure 9 it can be seen that a 5 kL rainwater tank in Hornsby remains empty, more than half-full, and full for 114, 211 and 88 days of the year on average, respectively. 
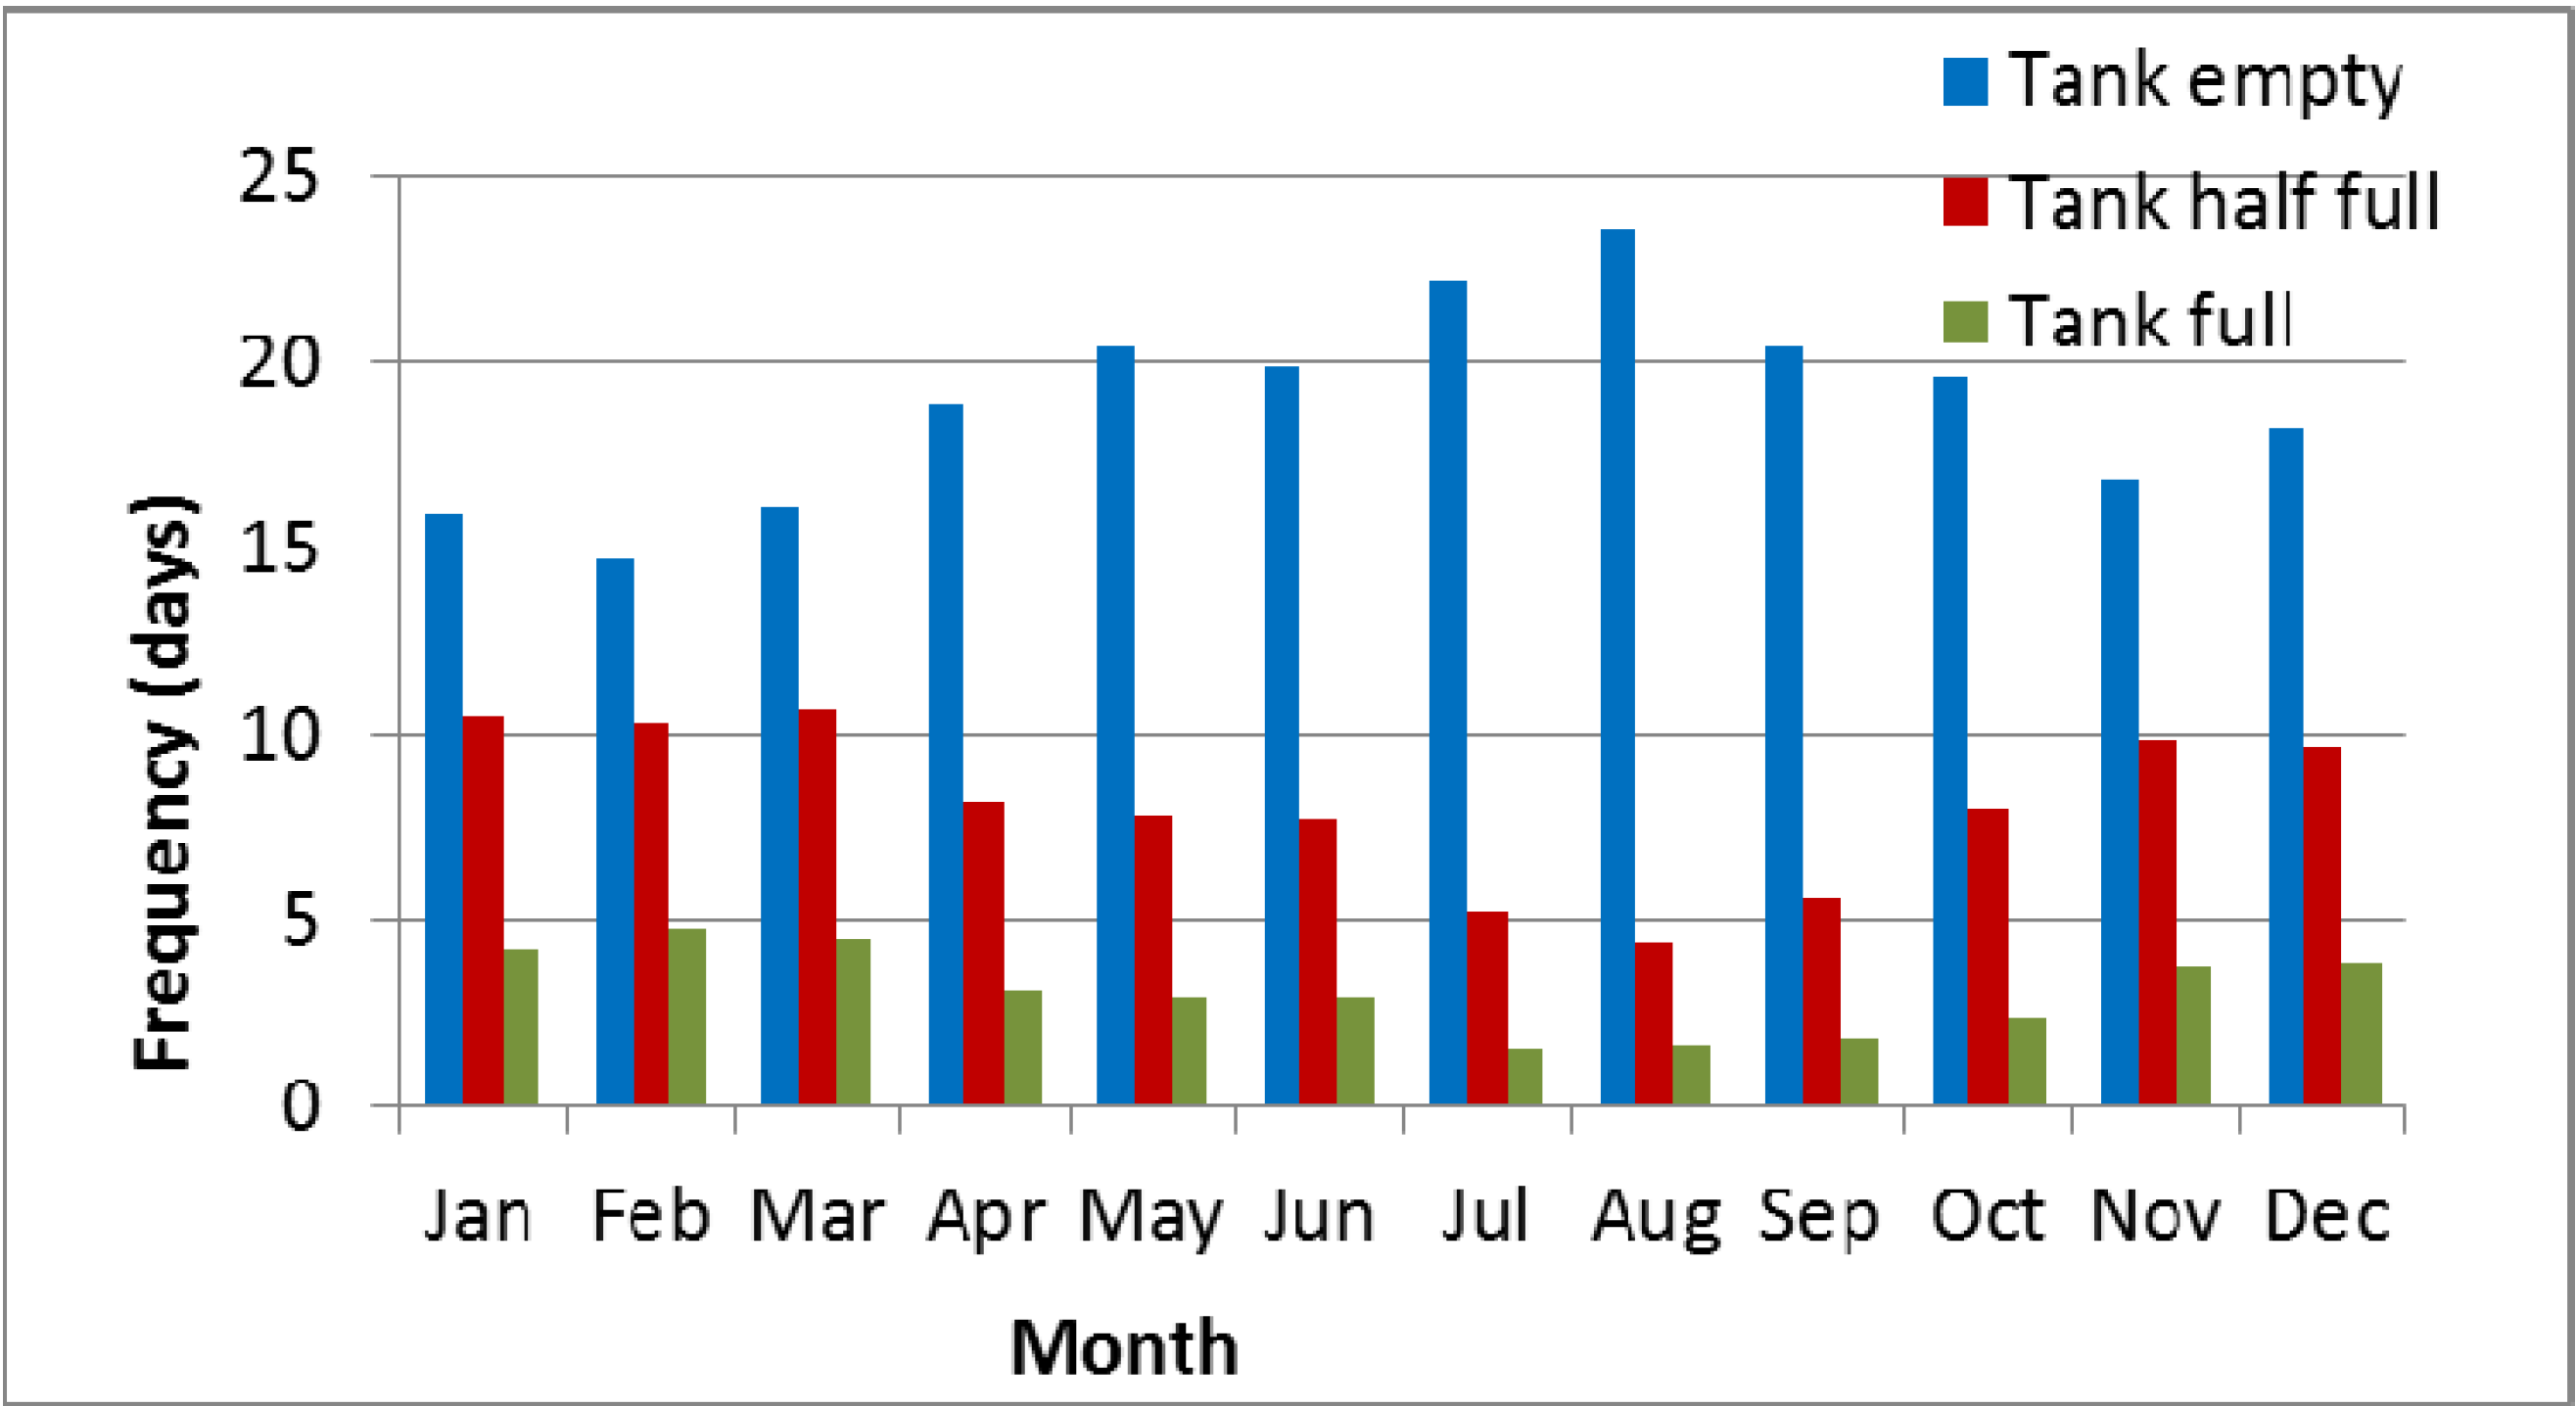
Figure 10 shows that a 5 kL rainwater tank at Campbelltown location remains empty for 227 days per year and full for only 38 days per year on average. A comparison of Figure 9 and Figure 10 highlights the differences in the effectiveness of a RWHS over different months of the year, with tanks remaining full and half-full at Hornsby on a greater number of days (1.5 to 2 times higher) than that of Campbelltown. At both the locations, rainwater tanks remain empty on the highest number of days during July to September i.e., during winter. At Hornsby, during October to June, the tank remains half full 15 to 24 days per month on average, which is only 7 to 11 days in the case of Campbelltown.
Figure 9. Frequency of tank being full, half-full and empty at Hornsby (considering the daily rainfall data of all the years on record).
Water 06 00945 g009
Figure 10. Frequency of tank being full, half-full and empty at Campbelltown (considering the daily rainfall data of all the years on record).
Water 06 00945 g010
The reliability and water savings of the wettest, driest and average years on record were then determined. The wettest and driest years on record were identified as the years having the lowest and highest total yearly rainfall values during the period of data availability at the selected location as noted in Table 1. The average year at a given location was selected as the year that has the total yearly rainfall closest to the average annual rainfall value at that location. Table 3 shows the driest, wettest and average years on record and the corresponding total yearly rainfall for the ten selected locations. Based on the daily rainfall data of the identified driest, wettest and average years on record, the reliability and water savings at three locations (Campbelltown, Hornsby and Richmond) for a 5kL RWHS were determined as shown in Table 4, Table 5 and Table 6. For toilet and laundry use, the reliability is 99% in the wettest year on record for all the three locations. In contrast, for the driest year, the reliability ranges from 69% to 99%. For the average year, the reliability ranges from 90% to 97% for toilet and laundry use. For irrigation use and combined use, reliability values for the driest year were quite smaller (29% to 66%). For the wettest year, reliability for irrigation use and combined use were found to be very similar at each of the three locations (ranging from 63% to 96%) as can be seen in Table 5 and Table 6. Among the three locations, Hornsby has the highest reliability values for all the three water uses.
Table 3. Annual total rainfalls (ATR) in the wettest, driest and average years on record for the ten locations.
LocationDriest yearATR (mm)Wettest yearATR (mm)Average yearATR (mm)
Campbelltown1907320195016491954746
Hornsby19417581950254119641323
Parramatta1979527199017121970962
Penrith2006525197815191976949
Richmond1944277195017392001797
Castlereagh1944230195016771953799
Wallacia Post Office1944355195020321978871
West Pennant Hills20054391950225319721080
Moss Vale19806071978211220011128
Cataract Dam20081971950228219831103
Table 4. Reliability and water savings at Campbelltown, Hornsby and Richmond for a 5 kL rainwater tank for toilet and laundry use for the driest, wettest and average years on record.
LocationDriest yearWettest yearAverage year
Reliability (%)Water savings (kL)Reliability (%)Water savings (kL)Reliability (%)Water savings (kL)
Campbelltown8329100349031
Hornsby10034100349733
Richmond6939100349533
In the sensitivity analysis, it was found that in the case of toilet and laundry use and combined use, the case of 2 occupants increased the reliability and reduced the quantity of water savings compared with the case of 4 occupants. On the other hand, the case of 6 occupants reduced the reliability and increased the water savings compared with the 4 occupants. For example, in the case of 2 occupants, for toilet and laundry use, for a 5 kL tank, reliability and water savings were found to be 99% and 21 kL, respectively. While in the case of 6 occupants, for a 5 kL tank, reliability and water-saving values were found to be 91% and 43 kL, respectively. In the case of irrigation use, the reliability and water savings remained very similar for the number of occupants of 2, 4 and 6. The change of frequency of toilet use from 3 to 5 times per person per day resulted in a reduction of reliability by 2% to 3% for a 5 kL tank.
Table 5. Reliability and water savings at Campbelltown, Hornsby and Richmond for a 5 kL rainwater tank for irrigation use for the driest, wettest and average years on record.
LocationDriest yearWettest yearAverage year
Reliability (%)Water savings (kL)Reliability (%)Water savings (kL)Reliability (%)Water savings (kL)
Campbelltown314364603953
Hornsby667496205861
Richmond313783547437
Table 6. Reliability and water savings at Campbelltown, Hornsby and Richmond for a 5kL rainwater tank for combined use for the driest, wettest and average years on record.
LocationDriest yearWettest yearAverage year
Reliability (%)Water savings (kL)Reliability (%)Water savings (kL)Reliability (%)Water savings (kL)
Campbelltown29%4663%7339%60
Hornsby63%8295%5156%68
Richmond30%3980%7467%52
The impact of land size on the performance of a RWHS was investigated by increasing the block size from 450 m2 to 600 m2. For 600 m2 block size, the roof, lawn and impervious areas of 250 m2, 200 m2 and 150 m2, respectively, were considered. Here, there was a minor increase in the reliability and water-saving values for all the three types of water uses as compared to the case of total site area of 450 m2 (with a roof, lawn and impervious areas of 200 m2, 150 m2 and 100 m2, respectively). In general, for both the block sizes (450 m2 and 600 m2), for toilet and laundry use, the reliability in the case of 2 occupants reached 99% for a 5 kL tank; in the case of 4 occupants, reliability reached 99% for a 15 kL tank; and in the case of 6 occupants, it reached 99% for a 25 kL tank. This implies that as the number of occupants increases, a bigger tank is needed. However, it seems that one does not need a tank greater than 25 kL (for 6 occupants) in the peri-urban regions of Greater Sydney.

4.2. Life Cycle Cost Analysis

Life cycle cost analysis (LCCA) of the RWHS was undertaken at three of the ten locations: Hornsby, Campbelltown and Richmond. Here, Hornsby and Campbelltown had the highest and lowest average annual rainfall values among the ten selected locations. Richmond had the average annual rainfall value which was closest to the average annual rainfall value across the ten selected locations. Table 7 shows the benefit–cost ratio values for different tank sizes for Hornsby. It was found that the benefit–cost ratio values varied over the tank size, location and water use. However, none of the benefit–cost ratio values reached one indicating that RWHS was not financially viable. Nevertheless, a 5 kL tank showed the highest benefit–cost ratio considering all the three locations and three water uses. For combined use and a 5 kL tank, the benefit–cost ratio values ranged from 0.86 to 0.97 across the three locations. Also, the benefit–cost ratio values for toilet and laundry use were generally much smaller than the combined use. This result suggests that a 5 kL tank when used for combined purpose (i.e., toilet, laundry and irrigation) presented the best financial scenario.
Table 7. Benefit–cost ratio values at Hornsby (based on current Sydney water price of AUD 2.13/kL).
Tank size (kL)Toilet and laundry useIrrigation useCombined use
10.6140.3730.666
20.5780.5240.749
30.5650.6430.846
50.5270.7950.966
70.3990.7000.839
100.3550.7400.861
150.2560.6340.728
200.1940.5350.612
The current Sydney Water price (AUD 2.13/kL) appeared to be too low to achieve a benefit–cost ratio greater than one for a RWHS under most of the scenarios examined in this study. An increase in water price as shown in Table 8 would give a benefit–cost ratio above one. Interestingly, for a 5 kL tank and for combined use, the water price should be in the range of AUD 2.21/kL to AUD 2.48/kL (which represents 3% to 16% increase over the current water price).
The results show that a RWHS is not financially viable under the current water price in Sydney and hence the water authorities should provide a subsidy to the home owners for installation of a RWHS, which will enhance the use of a RWHS.
Table 8. Increased water price to achieve a benefit–cost ratio (BCR) close to 1.00 (Hornsby).
Tank size (kL)Toilet and laundry useIrrigation useCombined use
Water price (AUD/kL)BCRWater price(AUD/kL)BCRWater price (AUD/kL)BCR
13.481.0015.721.0023.201.001
23.691.0014.071.0012.851.002
33.771.0013.321.0022.521.001
54.051.0022.671.0012.211.003
75.371.0013.021.0042.541.001
106.011.0022.881.0012.481.003
158.321.0013.371.0012.931.002
2010.971.0013.991.0013.491.002

5. Conclusions

This paper investigates the performance of a rainwater harvesting system (RWHS) in peri-urban regions of Greater Sydney, Australia. Considering the daily rainfall data over the entire period of record at ten different locations, it has been found that a 5 kL tank can meet 96% to 99% of the demand for toilet and laundry use depending on the location in Greater Sydney regions. It has been found that even in the driest year, a 5 kL tank can meet 69% to 99% of the toilet and laundry demand. Based on the results of life cycle cost analysis, it has been found that a 5 kL tank has the highest benefit–cost ratio (ranging from 0.86 to 0.97) among the 8 different tank sizes considered in this study. Interestingly, for a 5 kL tank, with a combined use (i.e., toilet, laundry and irrigation), the current water price in Sydney needs to be increased by 3% to 16% to achieve a benefit–cost ratio exceeding one. A set of regression equations are developed which can be used to estimate the reliability of a RWHS using the average annual rainfall data at any arbitrary location in the peri-urban regions of Greater Sydney. The method presented in this paper can be applied to other Australian states and countries to estimate water savings and reliability of a RWHS.

Acknowledgments

The authors would like to acknowledge the Australian Bureau of Meteorology and Sydney Water for providing data for this project and the two anonymous reviewers whose comments and suggestions have improved the paper remarkably.

Author Contributions

Evan Hajani wrote FORTRAN codes to carry out the data analysis and prepared the first draft of the paper. Ataur Rahman proposed the conceptual framework of the paper, checked the results and enhanced the writings of the paper.

Conflicts of Interest

The authors declare no conflict of interest.

References

  1. Imteaz, M.A.; Mekanik, F.; Ahsan, A.; Rahman, A. Modelling stormwater treatment systems using music: Accuracy. Resour. Conserv. Recycl. 2013, 71, 15–21. [Google Scholar]
  2. Coombes, P.J.; Kuczera, G.; Kalma, J.D. Economic water quantity and quality impacts from the use of a rainwater tank in the inner city. Aust. J. Water Resour. 2003, 7(2), 25–36. [Google Scholar]
  3. Tam, V.W.Y.; Tam, L.; Zeng, S.X. Cost effectiveness and trade off on the use of rainwater tank: An empirical study in Australian residential decision-making. Resour. Conserv. Recycl. 2009, 54, 178–186. [Google Scholar]
  4. Ghisi, E.; da Fonseca, T.; Rocha, V.L. Rainwater harvesting in petrol stations in Brasilia: Potential for potable water savings and investment feasibility analysis. Resour. Conserv. Recycl. 2009, 54, 79–85. [Google Scholar] [CrossRef]
  5. Kyoungjun, K.; Chulsang, Y. Hydrological modelling and evaluation of rainwater harvesting facilities: Case study on several rainwater harvesting facilities in Korea. J. Hydrol. Eng. 2009, 14, 545–561. [Google Scholar] [CrossRef]
  6. Rahman, A.; Dbais, J.; Imteaz, M. Sustainability of rainwater harvesting systems in multistorey residential buildings. Am. J. Eng. Appl. Sci. 2010, 1, 889–898. [Google Scholar]
  7. Eroksuz, E.; Rahman, A. Rainwater tanks in multi-unit buildings: A case study for three Australian cities. Resour. Conserv. Recycl. 2010, 54, 1449–1452. [Google Scholar] [CrossRef]
  8. Imteaz, M.A.; Shanableh, A.; Rahman, A.; Ahsan, A. Optimisation of rainwater tank design from large roofs: A case study in Melbourne, Australia. Resour. Conserv. Recycl. 2011, 55, 1022–1029. [Google Scholar] [CrossRef]
  9. Domenech, L.; Sauri, D.A. Comparative appraisal of the use of rainwater harvesting in single and multi-family buildings of the metropolitan area of Barcelona (Spain): Social experience, drinking water savings and economic costs. J. Clean. Prod. 2010, 11, 1–11. [Google Scholar]
  10. Van der Sterren, M.; Rahman, A.; Shrestha, S.; Barker, G.; Ryan, G. An overview of on-site retention and detention policies for urban stormwater management in the greater Western Sydney region in Australia. Water Int. 2009, 34, 362–372. [Google Scholar] [CrossRef]
  11. Van der Sterren, M.; Rahman, A.; Dennis, G.R. Implications to stormwater management as a result of block scale rainwater tank systems: A case study in Western Sydney, Australia. Water Sci. Technol. 2012, 65, 1475–1482. [Google Scholar] [CrossRef]
  12. Van der Sterren, M.; Rahman, A.; Dennis, G. Quality and quantity monitoring of five rainwater tanks in Western Sydney, Australia. J. Environ. Eng. 2013, 139, 332–340. [Google Scholar] [CrossRef]
  13. Kus, B.; Kandasamy, J.; Vigneswaran, S.; Shon, H.K. Water quality in rainwater tanks in rural and metropolitan areas of New South Wales, Australia. J. Water Sustain. 2011, 1, 33–43. [Google Scholar]
  14. Natural Resource Management Ministerial Council, Environmental Protection and Heritage Council and National Health and Medical Research Council. Australian Guidelines for Water Recycling: Stormwater Harvesting and Reuse. Document No. 23; Biotext: Canberra, Australia, 2009. [Google Scholar]
  15. Campisano, A.; Gnecco, I.; Modica, C.; Palla, A. Designing domestic rainwater harvesting systems under different climatic regimes in Italy. Water Sci. Technol. 2013, 67, 2511–2518. [Google Scholar] [CrossRef]
  16. Rahman, A.; Keane, J.; Imteaz, M.A. Rainwater harvesting in Greater Sydney: Water savings, reliability and economic benefits. Resour. Conserv. Recycl. 2012, 61, 16–21. [Google Scholar] [CrossRef]
  17. Palla, A.; Gnecco, I.; Lanza, L.G.; Barbera, P.L. Performance analysis of domestic rainwater harvesting systems under various European climate zones. Resour. Conserv. Recycl. 2012, 62, 71–80. [Google Scholar] [CrossRef]
  18. Ghisi, E.; Schondermark, P.N. Investment feasibility analysis of rainwater use in residences. Water Resour. Manag. 2013. [Google Scholar] [CrossRef]
  19. Mehrabadi, M.H.; Saghafian, B.; Fashi, F.H. Assessment of residential rainwater harvesting efficiency for meeting non-potable water demands in three climate conditions. Resour. Conserv. Recycl. 2013, 73, 86–93. [Google Scholar] [CrossRef]
  20. Sample, D.; Liu, J.; Wang, S. Evaluating the dual benefits of rainwater harvesting systems using reliability analysis. J. Hydrol. Eng. 2013, 18, 1310–1321. [Google Scholar] [CrossRef]
  21. Su, M.; Lin, C.; Chang, L.; Kang, J.; Lin, M. A probabilistic approach to rainwater harvesting systems design and evaluation. Resour. Conserv. Recycl. 2009, 53, 393–399. [Google Scholar] [CrossRef]
  22. Joint Technical Committee OB/11, Life Cycle Costing. Life Cycle Costing-An Application Guide. AS/NZS 4536:1999; Standards Australia: Homebush, Australia; Standards New Zealand: Wellington, New Zealand; 1999. [Google Scholar]
  23. Australian Bureau of Statistics. Available online: http://www.abs.gov.au/ausstats/[email protected]/mf/6401.0 (accessed on 3 October 2013).

