Article

Modeling Flood Inundation Induced by River Flow and Storm Surges over a River Basin

1
National Science and Technology Center for Disaster Reduction, New Taipei City 23143, Taiwan
2
Department of Civil and Disaster Prevention Engineering, National United University, Miaoli 36003, Taiwan
3
National Applied Research Laboratories, Taiwan Typhoon and Flood Research Institute, Taipei 10093, Taiwan
*
Author to whom correspondence should be addressed.
Water 2014, 6(10), 3182-3199; https://doi.org/10.3390/w6103182
Submission received: 11 August 2014 / Revised: 19 September 2014 / Accepted: 14 October 2014 / Published: 21 October 2014

Abstract

:
Low-lying coastal regions and their populations are at risk during storm surge events and high freshwater discharges from upriver. An integrated storm surge and flood inundation modeling system was used to simulate storm surge and inundation in the Tsengwen River basin and the adjacent coastal area in southern Taiwan. A three-dimensional hydrodynamic model with an unstructured grid was used, which was driven by the tidal elevation at the open boundaries and freshwater discharge at the upriver boundary. The model was validated against the observed water levels for three typhoon events. The simulation results for the model were in reasonable agreement with the observational data. The model was then applied to investigate the effects of a storm surge, freshwater discharge, and a storm surge combined with freshwater discharge during an extreme typhoon event. The super Typhoon Haiyan (2013) was artificially shifted to hit Taiwan: the modeling results showed that the inundation area and depth would cause severe overbank flow and coastal flooding for a 200 year return period flow. A high-resolution grid model is essential for the accurate simulation of storm surges and inundation.

1. Introduction

Typhoons frequently cause major damage in Taiwan and can combine with storm surges and river flows to produce coastal flooding. Storm surges correspond to abnormal variations in the free ocean surface that are driven by atmospheric forcing from extra-tropical storms and typhoons [1]. The largest damages in populated and low-lying coastal areas, including the loss of human life and the destruction of property and infrastructure, are usually associated with storm surges and subsequent flooding rather than direct wind effects, particularly if the surge occurs at high tide [2,3].
Coastal flooding is a growing public concern. Extreme cases, such as the super Typhoon Haiyan (2013) in the Philippines, the Xynthia storm (2010) in France, and hurricanes Katrina (2005) and Sandy (2012) in the United States, were dramatic indicators that better preparation and mitigation measures are needed to handle coastal flooding. Rising sea levels and growing storminess in coastal regions increase the probability of catastrophic inundations [4]. Accurate predictions using numerical models of the interaction between storm surges and river flows in coastal river systems have been shown to aid in disaster planning and mitigation and in coastal management.
Taiwan is located on the west side of the Pacific Ocean (Figure 1). Taiwan is often subjected to severe sea states that are induced by typhoons during the summer and winter seasons in either the South China Sea or the northwest Pacific Ocean near the Philippine Islands, resulting in the extensive loss of life and property. Taiwan is hit by three to four typhoons annually on average. Typhoons affect the east coast more severely than the west coast because typhoons typically approach Taiwan Island from the east. The strong winds and low atmospheric pressure of a typhoon approaching Taiwan often cause storm surges that can severely damage coastal areas, especially the low-lying lands near river mouths because of the dual effect of river flooding from typhoon-brought rains and backward uplifting seawater floods from storm surges [5]. Therefore, a reliable model needs to be developed to predict the coastal inundation from the interaction between typhoon-induced storm surges and river flows to facilitate coastal management and hazard mitigation.
Numerous numerical models have been developed and applied to simulate hurricane/typhoon-induced storm surges [6,7,8,9,10,11,12,13,14]. Sheng et al. [15] reported that the accuracy of a storm surge simulation depends on many factors including the input data (e.g., bathymetry, topography, and wind/pressure fields), the representation of important processes (e.g., flooding and drying and bottom friction), the model grid resolution, and the open boundary conditions. Simulating inundation is an important aspect of storm surge modeling. Coastal morphological features, such as barrier islands, inlets, and the shoreline configuration, can significantly affect inundation predictions. The accuracy of overland flood prediction depends on the model resolution. Lots of storm surge model construct model resolution on the order of hundreds of meters or kilometers, which are not sufficient to represent small topographic features [16,17].
Several researchers have applied different numerical models to simulate the coastal inundation that is induced by storm surges, but few studies have been conducted on the coastal inundation caused by the interaction between storm surges and river flows in coastal river systems. For example, Shen et al. [18] adopted an unstructured tidal, residual, intertidal mudflat (UnTRIM) hydrodynamic model to simulate storm surges and inundation for Hurricane Andrew in 1992. Peng et al. [19] configured a storm surge and inundation model for Charleston Harbor, South Carolina and its adjacent coastal region to study the response of the harbor to hurricanes. The hydrodynamic component of the modeling system was based on the Princeton Ocean Model, and a scheme with a multiple inundation speed option was embedded in the model for the inundation calculation. Sheng et al. [15] investigated the effect of waves on storm surges, currents, and inundation in the Outer Banks, North Carolina and the Chesapeake Bay during Hurricane Isabel in 2003 by making a detailed comparison between the observed wind, wave, surge, and inundation data and the results from an integrated storm surge modeling system. Xie et al. [20] used a three-dimensional storm surge model to study the effect of the asymmetric structure of a hurricane wind field on the storm surge and the inundation extent. Krestenitis et al. [13] used a two-dimensional hydrodynamic model to investigate coastal flooding resulting from storm surge events around the northeastern Mediterranean coastal zone. Lewis et al. [21] developed a computationally inexpensive inundation model from freely available data sources to estimate the flood risk from storm surges in the northern Bay of Bengal.
The primary objective of this study was to apply a three-dimensional hydrodynamic model with an unstructured grid to simulate inundation patterns in the Tsengwen River basin and the coastal region in southern Taiwan resulting from the interaction between a storm surge and the river flow during typhoon events. The high-resolution model was validated using the observed water levels for three typhoon events. The validated model was then used to analyze the inundation depth and extent that were induced by the storm surge, the river flow, and the storm surge combined with the river flow for the Tsengwen River basin and the adjacent coastal region.
Figure 1. Map of study area shown with dashed line: the land, the coastal sea, and the Tsengwen River are included in the model domain. Cyan color and white color represent the ocean and land, respectively.
Water 06 03182 g001

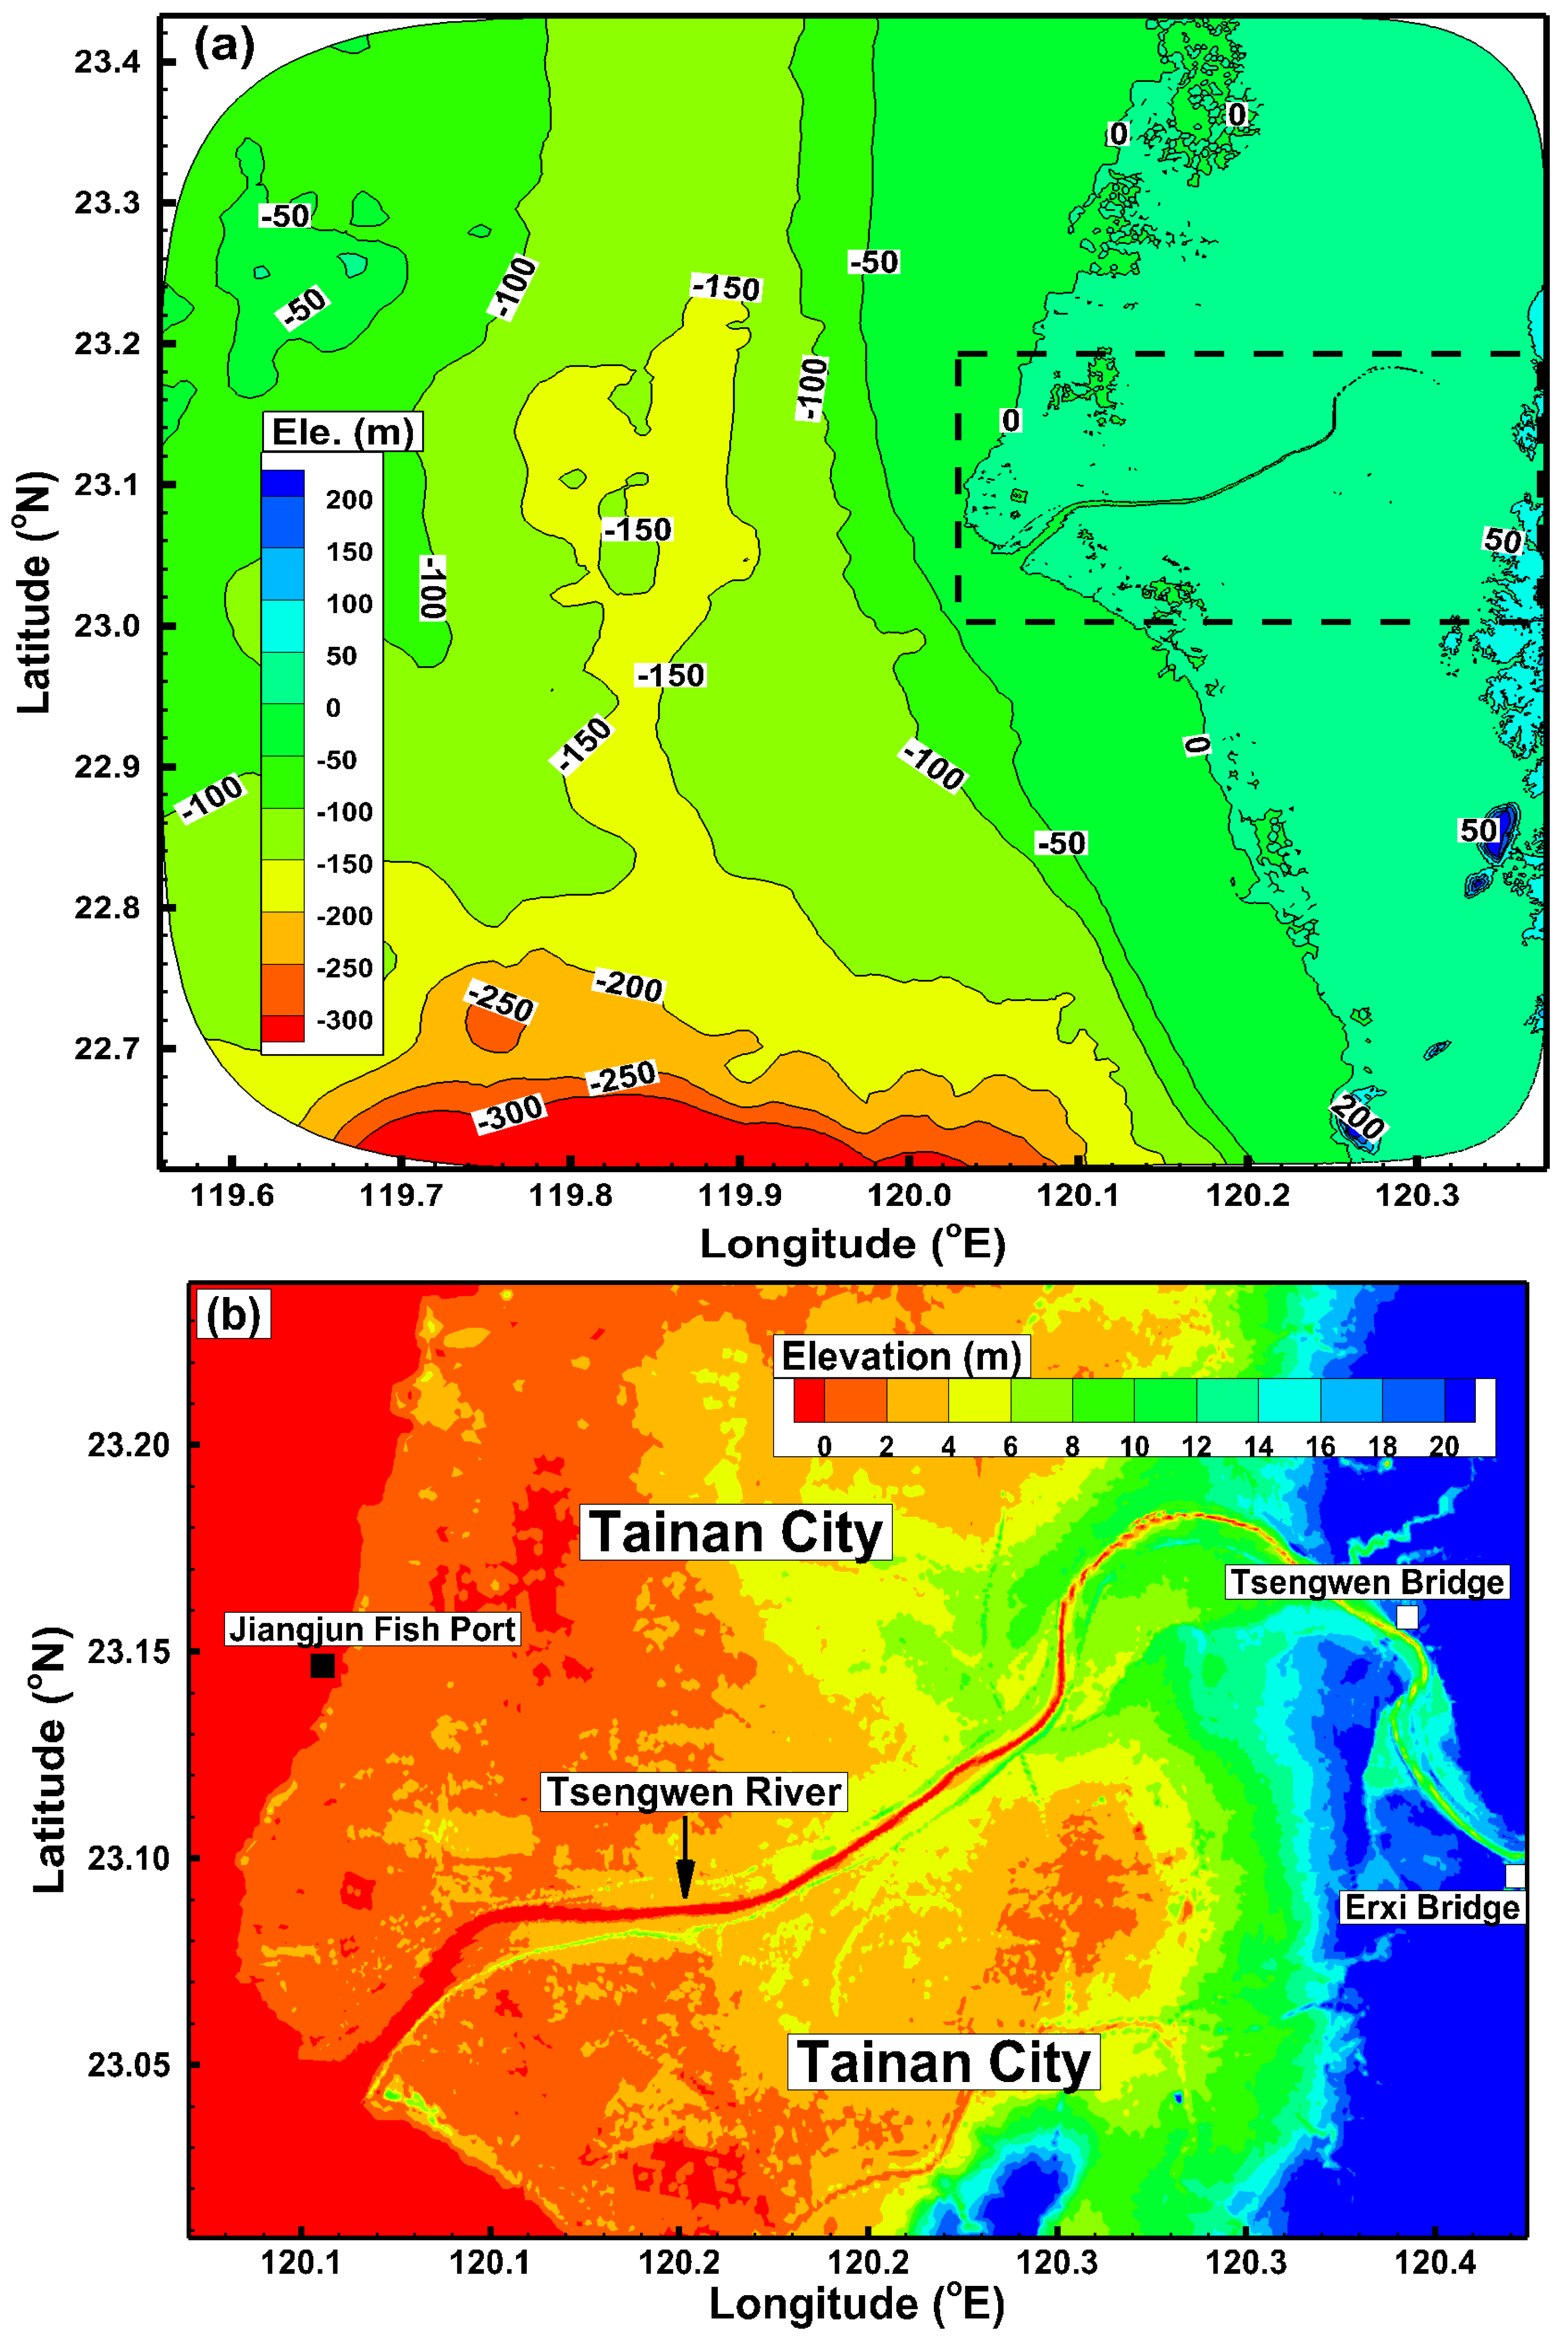
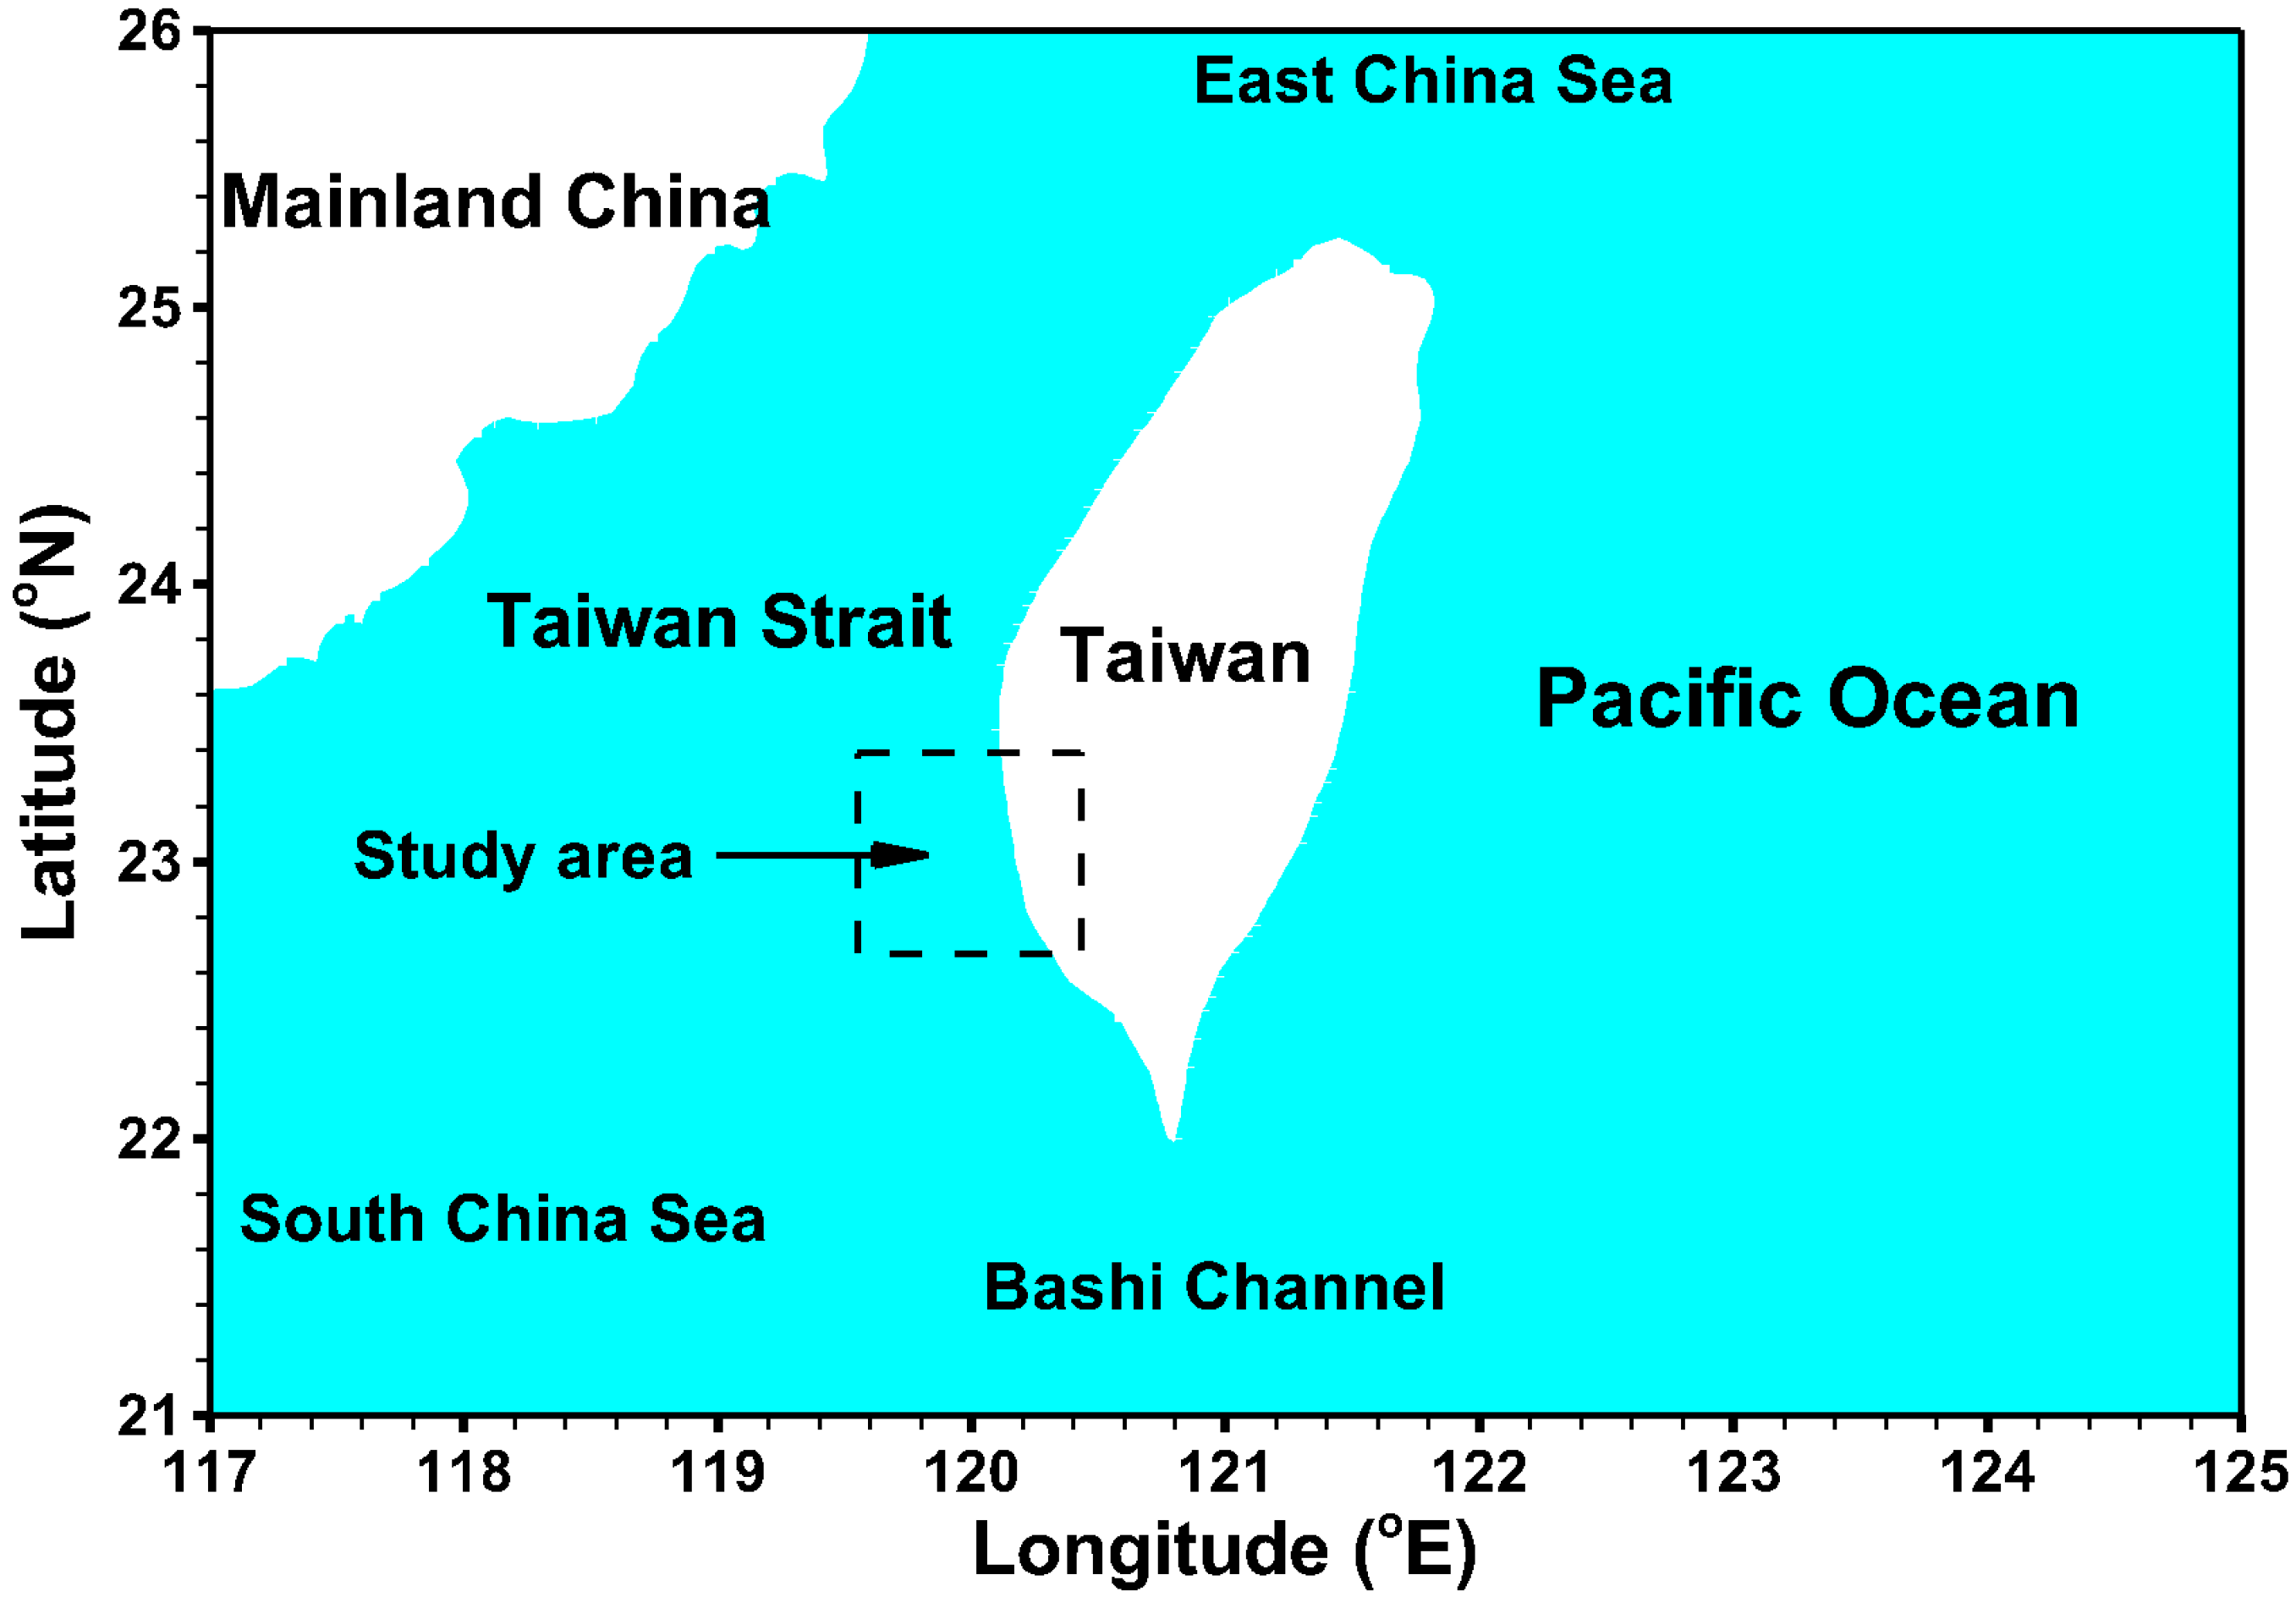
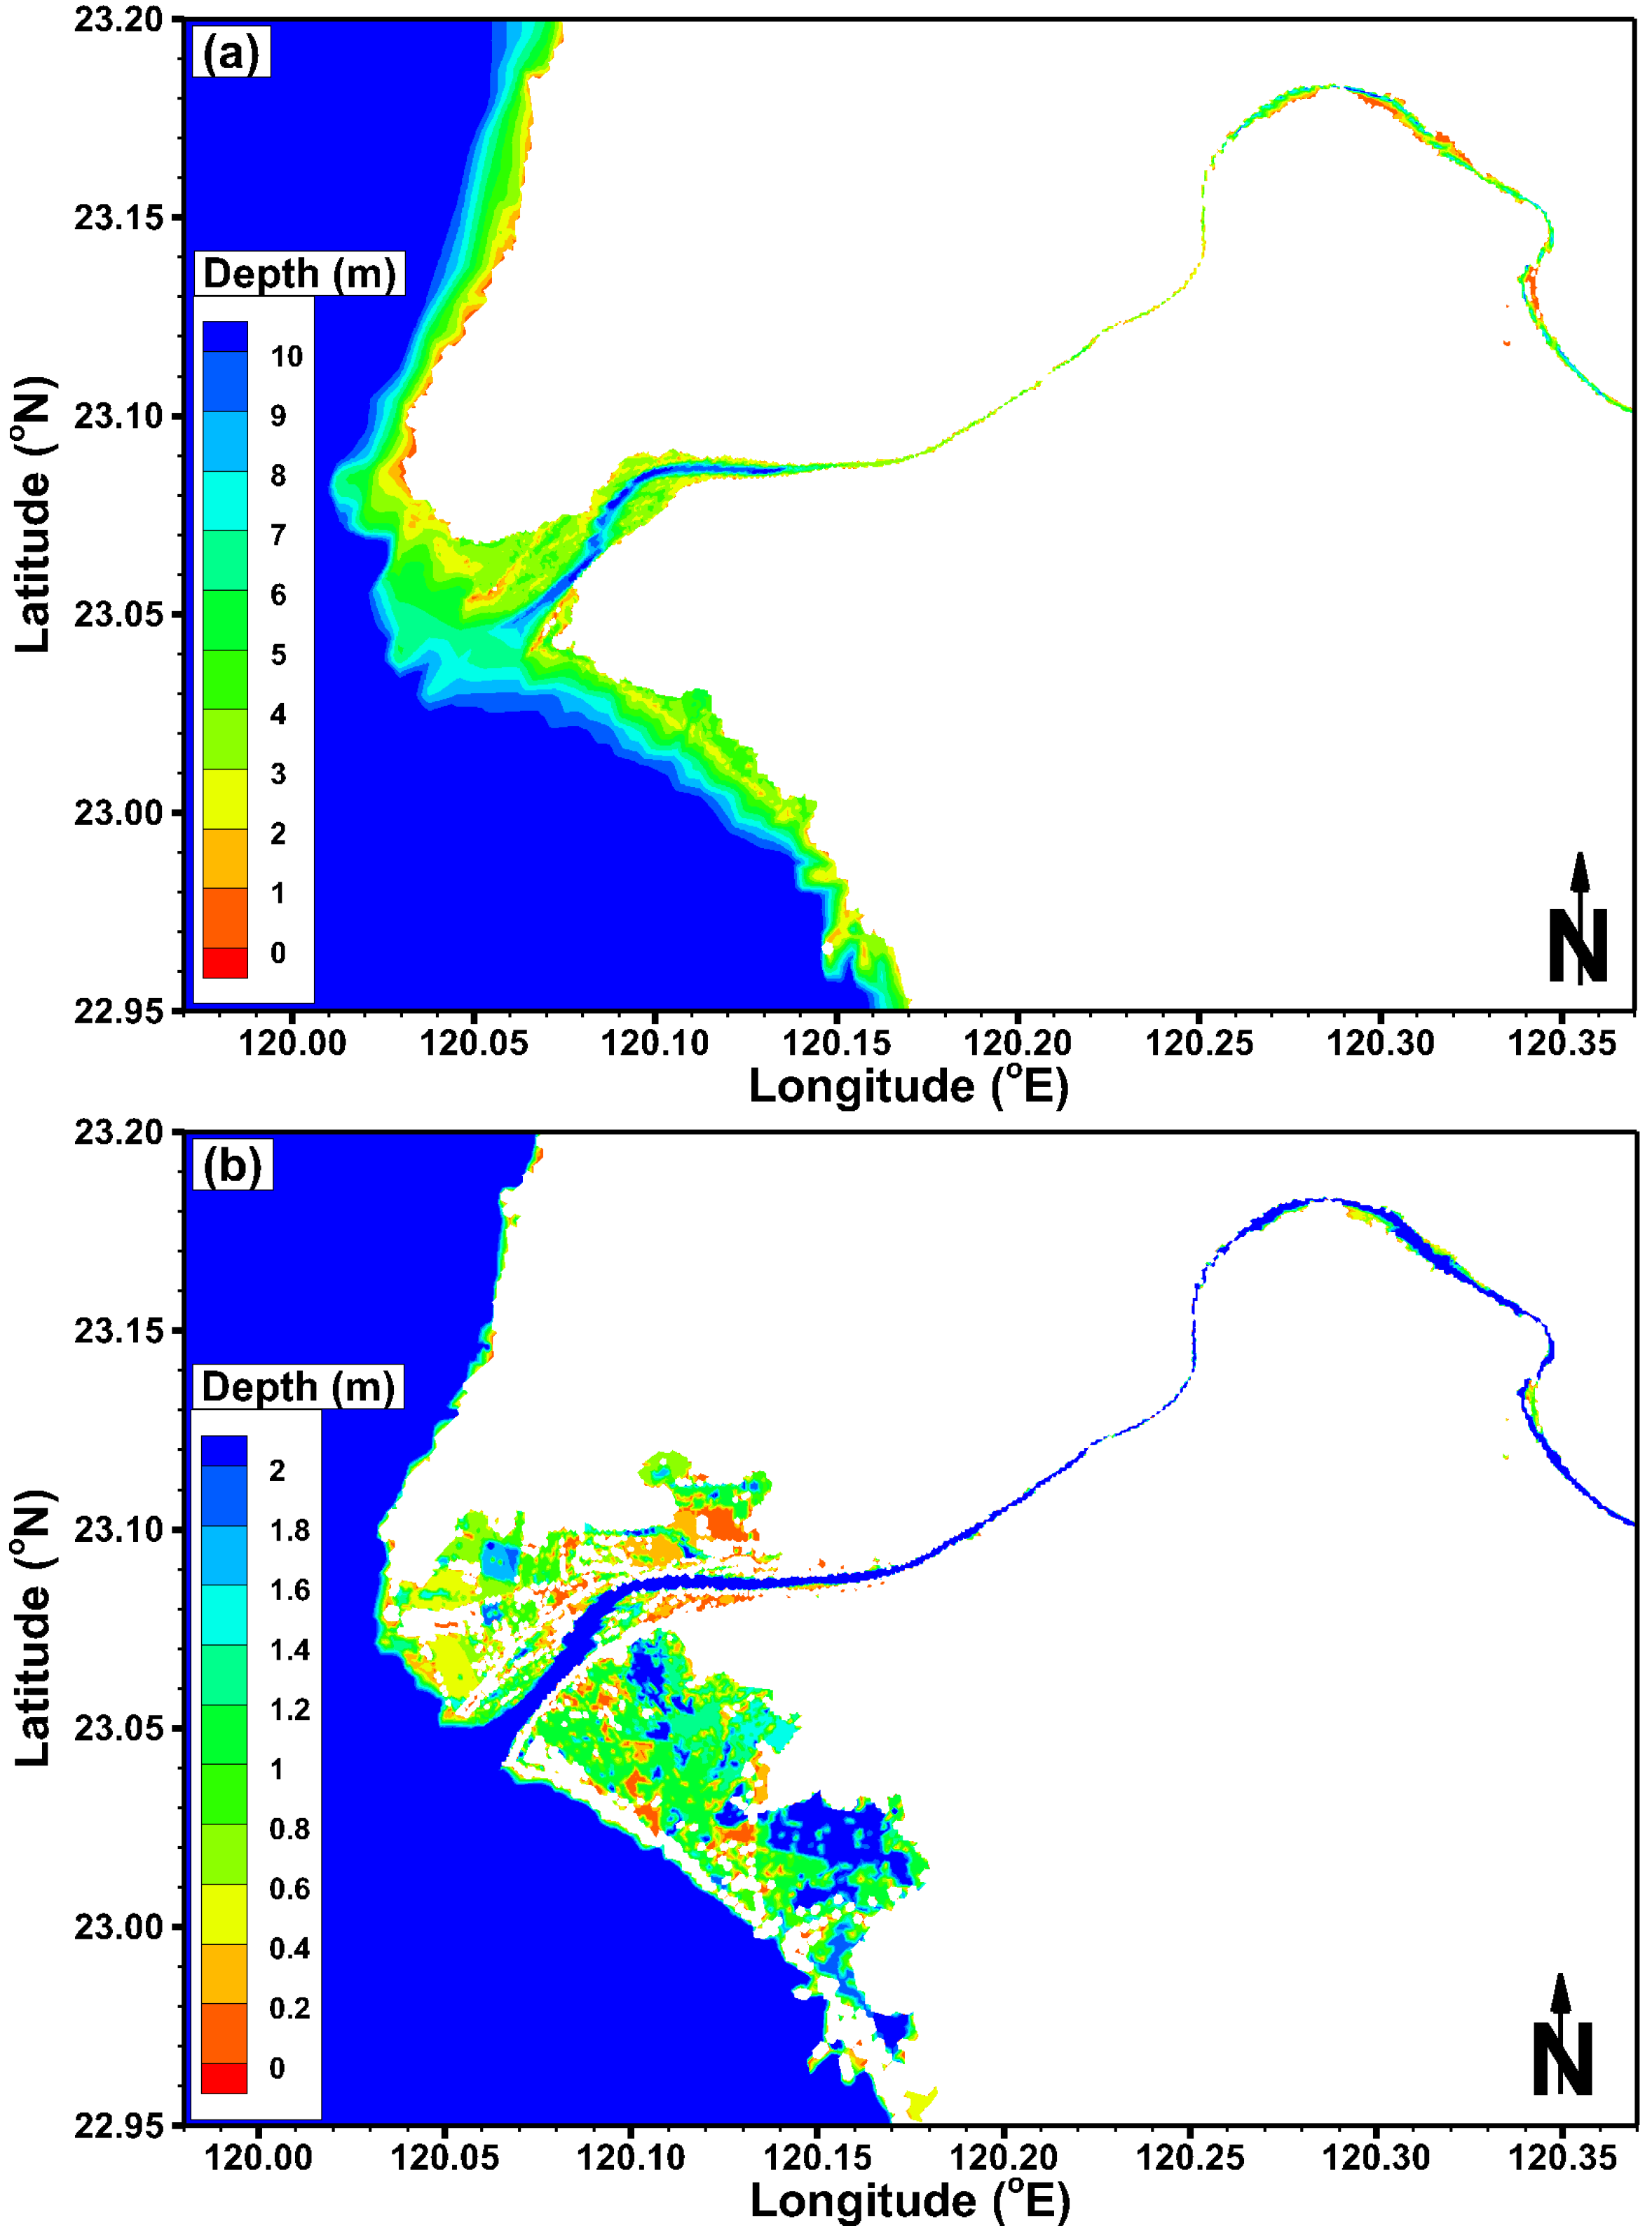
2. Description of Study Area

The Tsengwen River is the second largest river in Taiwan and drains into the southern Taiwan Strait (Figure 2). The drainage basin has an area of 1177 km2, which includes part of the southwestern rugged foothills and fertile coastal plains. In the past, the Tsengwen River continuously carried abundant sediments that were deposited onto its floodplain. The annual sediment load is estimated at 31 million metric tons. The M2 tide is the primary tidal constituent at the river mouth and has a mean tidal range below 1 m. Based on the tidal classification [22], the Tsengwen River mouth can be classified as a microtidal estuary. The estuarine zone is approximately 10 km to 25 km from the river mouth, depending on the river discharge. Therefore, the estuarine area ranges from 2 km2 in the flood season to 3 km2 in the wet season and 4 km2 in the dry season. The average annual rainfall for the drainage basin is 2643 mm, with a contrasting rainfall pattern between dry and wet seasons. The dry and wet seasons are October–April and May–September, respectively. Thus, the river discharge varies seasonally with a high discharge of 411 × 103 m/day in the wet season and a low discharge of 14 × 103 m/day in the dry season. In the wet season, episodic flooding from heavy monsoon rains and typhoons are not unusual and critically affect the water discharge and the suspended load [23].
Figure 2. Bathymetry and topography for (a) entire model domain and (b) zoom of Tengwen River.
Water 06 03182 g002

3. Model Descriptions

3.1. Governing Equations

In this study, a semi-implicit Eulerian-Lagrangian finite element model (SELFE) was modified and implemented to calculate the storm surge and inundation areas. SELFE is a three-dimensional hydrodynamic model that was developed at the Center for Coastal Margin Observation and Prediction as an open source community model [24]. A semi-implicit finite element Eulerian-Lagrangian algorithm is used in SELFE to solve the three-dimensional shallow-water equations with the hydrostatic and Boussinesq approximations. The barotropic mode is only used to simulate the water level, and SELFE solves for the primary variables of the free-surface elevation and the three-dimensional water velocity. The forces include the tides and the river flow. The equations in the Cartesian frame of reference are given below:
u z + v z + w z = 0
η t + x h η u d z + y h η v d z = 0
D u D t = f v x { g ( η α ψ ^ ) + P A ρ 0 } g ρ 0 z η ρ x d z + x ( μ u x ) + y ( μ u y ) + z ( ν u z )
D v D t = f u y { g ( η α ψ ^ ) + P A ρ 0 } g ρ 0 z η ρ y d z + x ( μ v x ) + y ( μ v y ) + z ( ν v z )
where η (x, y, t) is the free-surface elevation; h (x, y) is the bathymetric depth; u (x, y, z, t) and v (x, y, z, t) are the horizontal velocity in x, y direction, respectively; w (x, y, t, z) is the vertical velocity; f is the Coriolis factor; g is the acceleration due to gravity; ψ ^ is the earth’s tidal potential; α is the effective earth elasticity factor; ρ is the density of water; ρ0 is reference density of water; PA (x, y, t) is the atmospheric pressure at the free surface; v is the vertical eddy viscosity; and μ is the horizontal eddy viscosity.
The vertical boundary conditions for the momentum equation, especially the bottom boundary condition, play an important role in the formulation of the numerical SELFE model. The balance between the internal Reynolds stress and the applied shear stress at the water surface is enforced in SELFE:
ν u z = τ s ,   at   z = η
where τs is the wind stress, which can be expressed as
τ s x = ρ a C s ( U a u ) 2 + ( V a v ) 2 ( U a u )
τ s y = ρ a C s ( U a u ) 2 + ( V a v ) 2 ( V a v )
where Ua and Va are the x and y components, respectively, at a 10-m height wind speed, W, which is generated from the prototypical typhoon model; ρa is the air density; and Cs is the wind drag coefficient that depends on the wind speed. The wind drag coefficient, Cs, is given by Large and Pond [25] and Powell et al. [26].
C s = { 0.00114 , W 10 m / s ( 0.49 + 0.0065 W ) * 0.003 , W > 38   m / s 10 3 ,   10   m / s <W 38   m / s
The bottom boundary layer is typically not well described in ocean models; thus, the no-slip condition at the sea or river bottom is replaced by a balance between the internal Reynolds stress and the bottom frictional stress:
ν u z = τ b ,   at   z = h
where τb is the bottom stress. The bottom friction stress is given by a quadratic drag law:
τ b x = ρ C b u 2 + v 2 u
τ b y = ρ C b u 2 + v 2 v
where Cb is the drag coefficient.

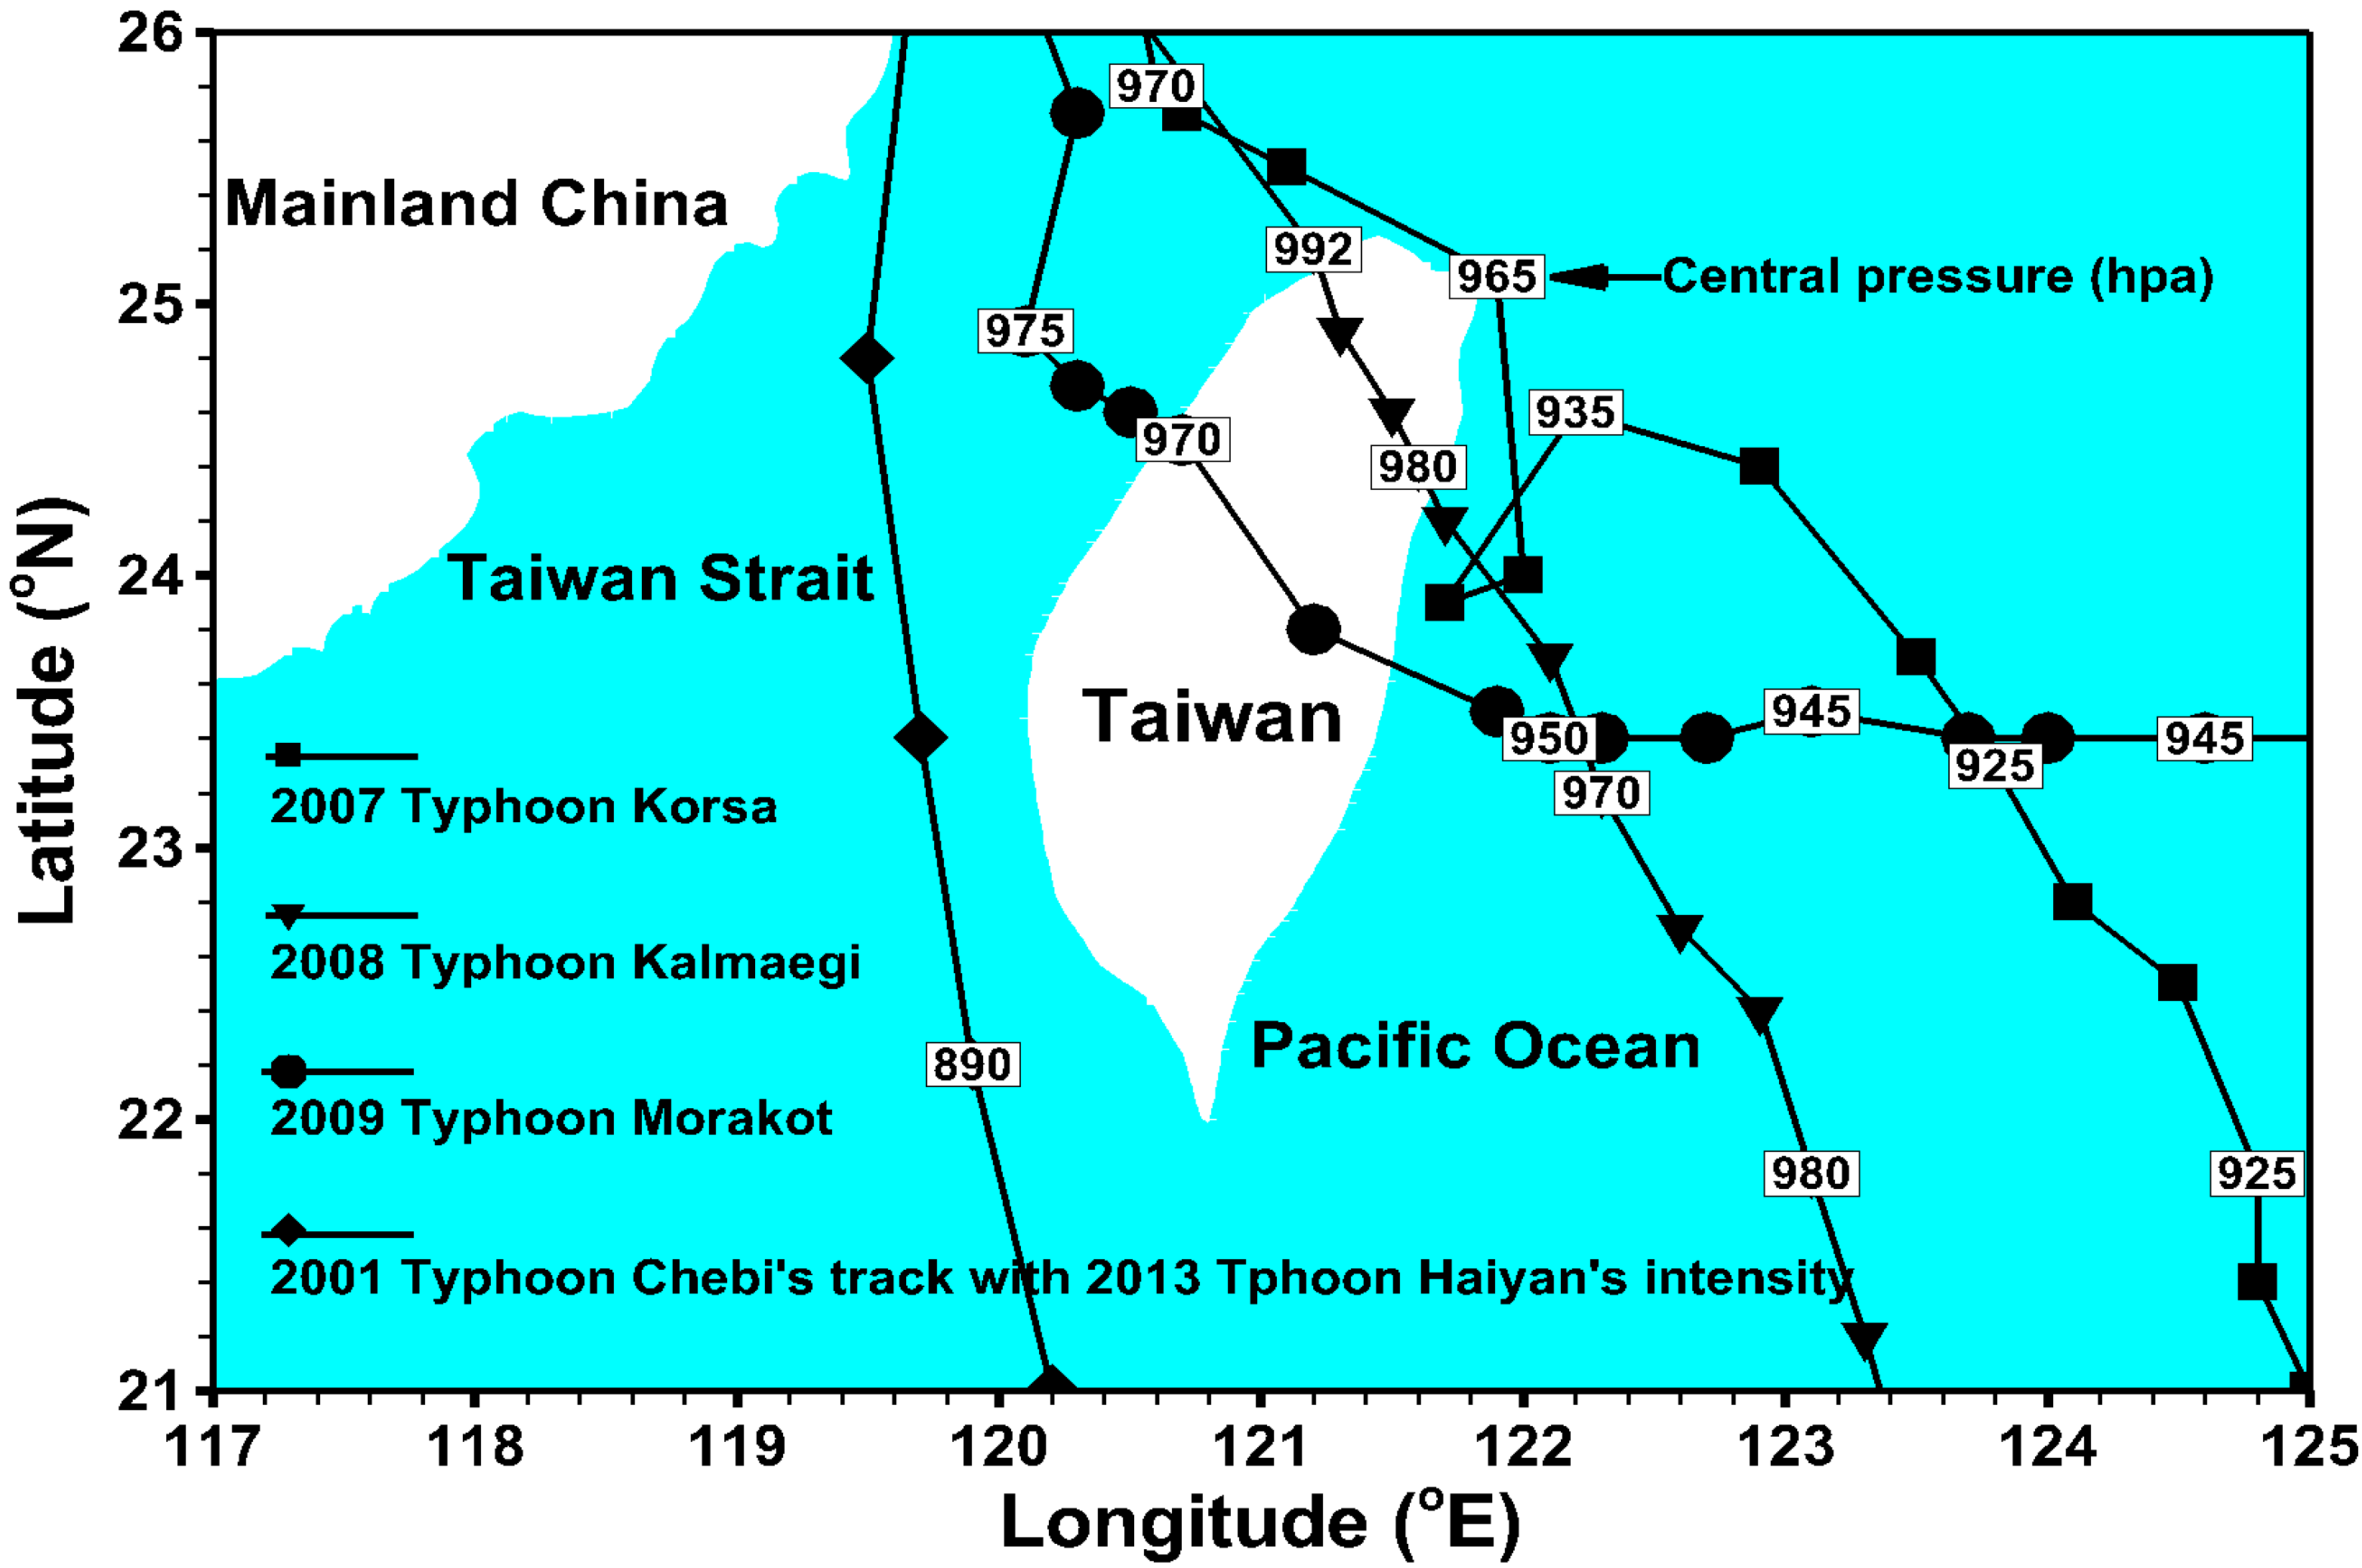
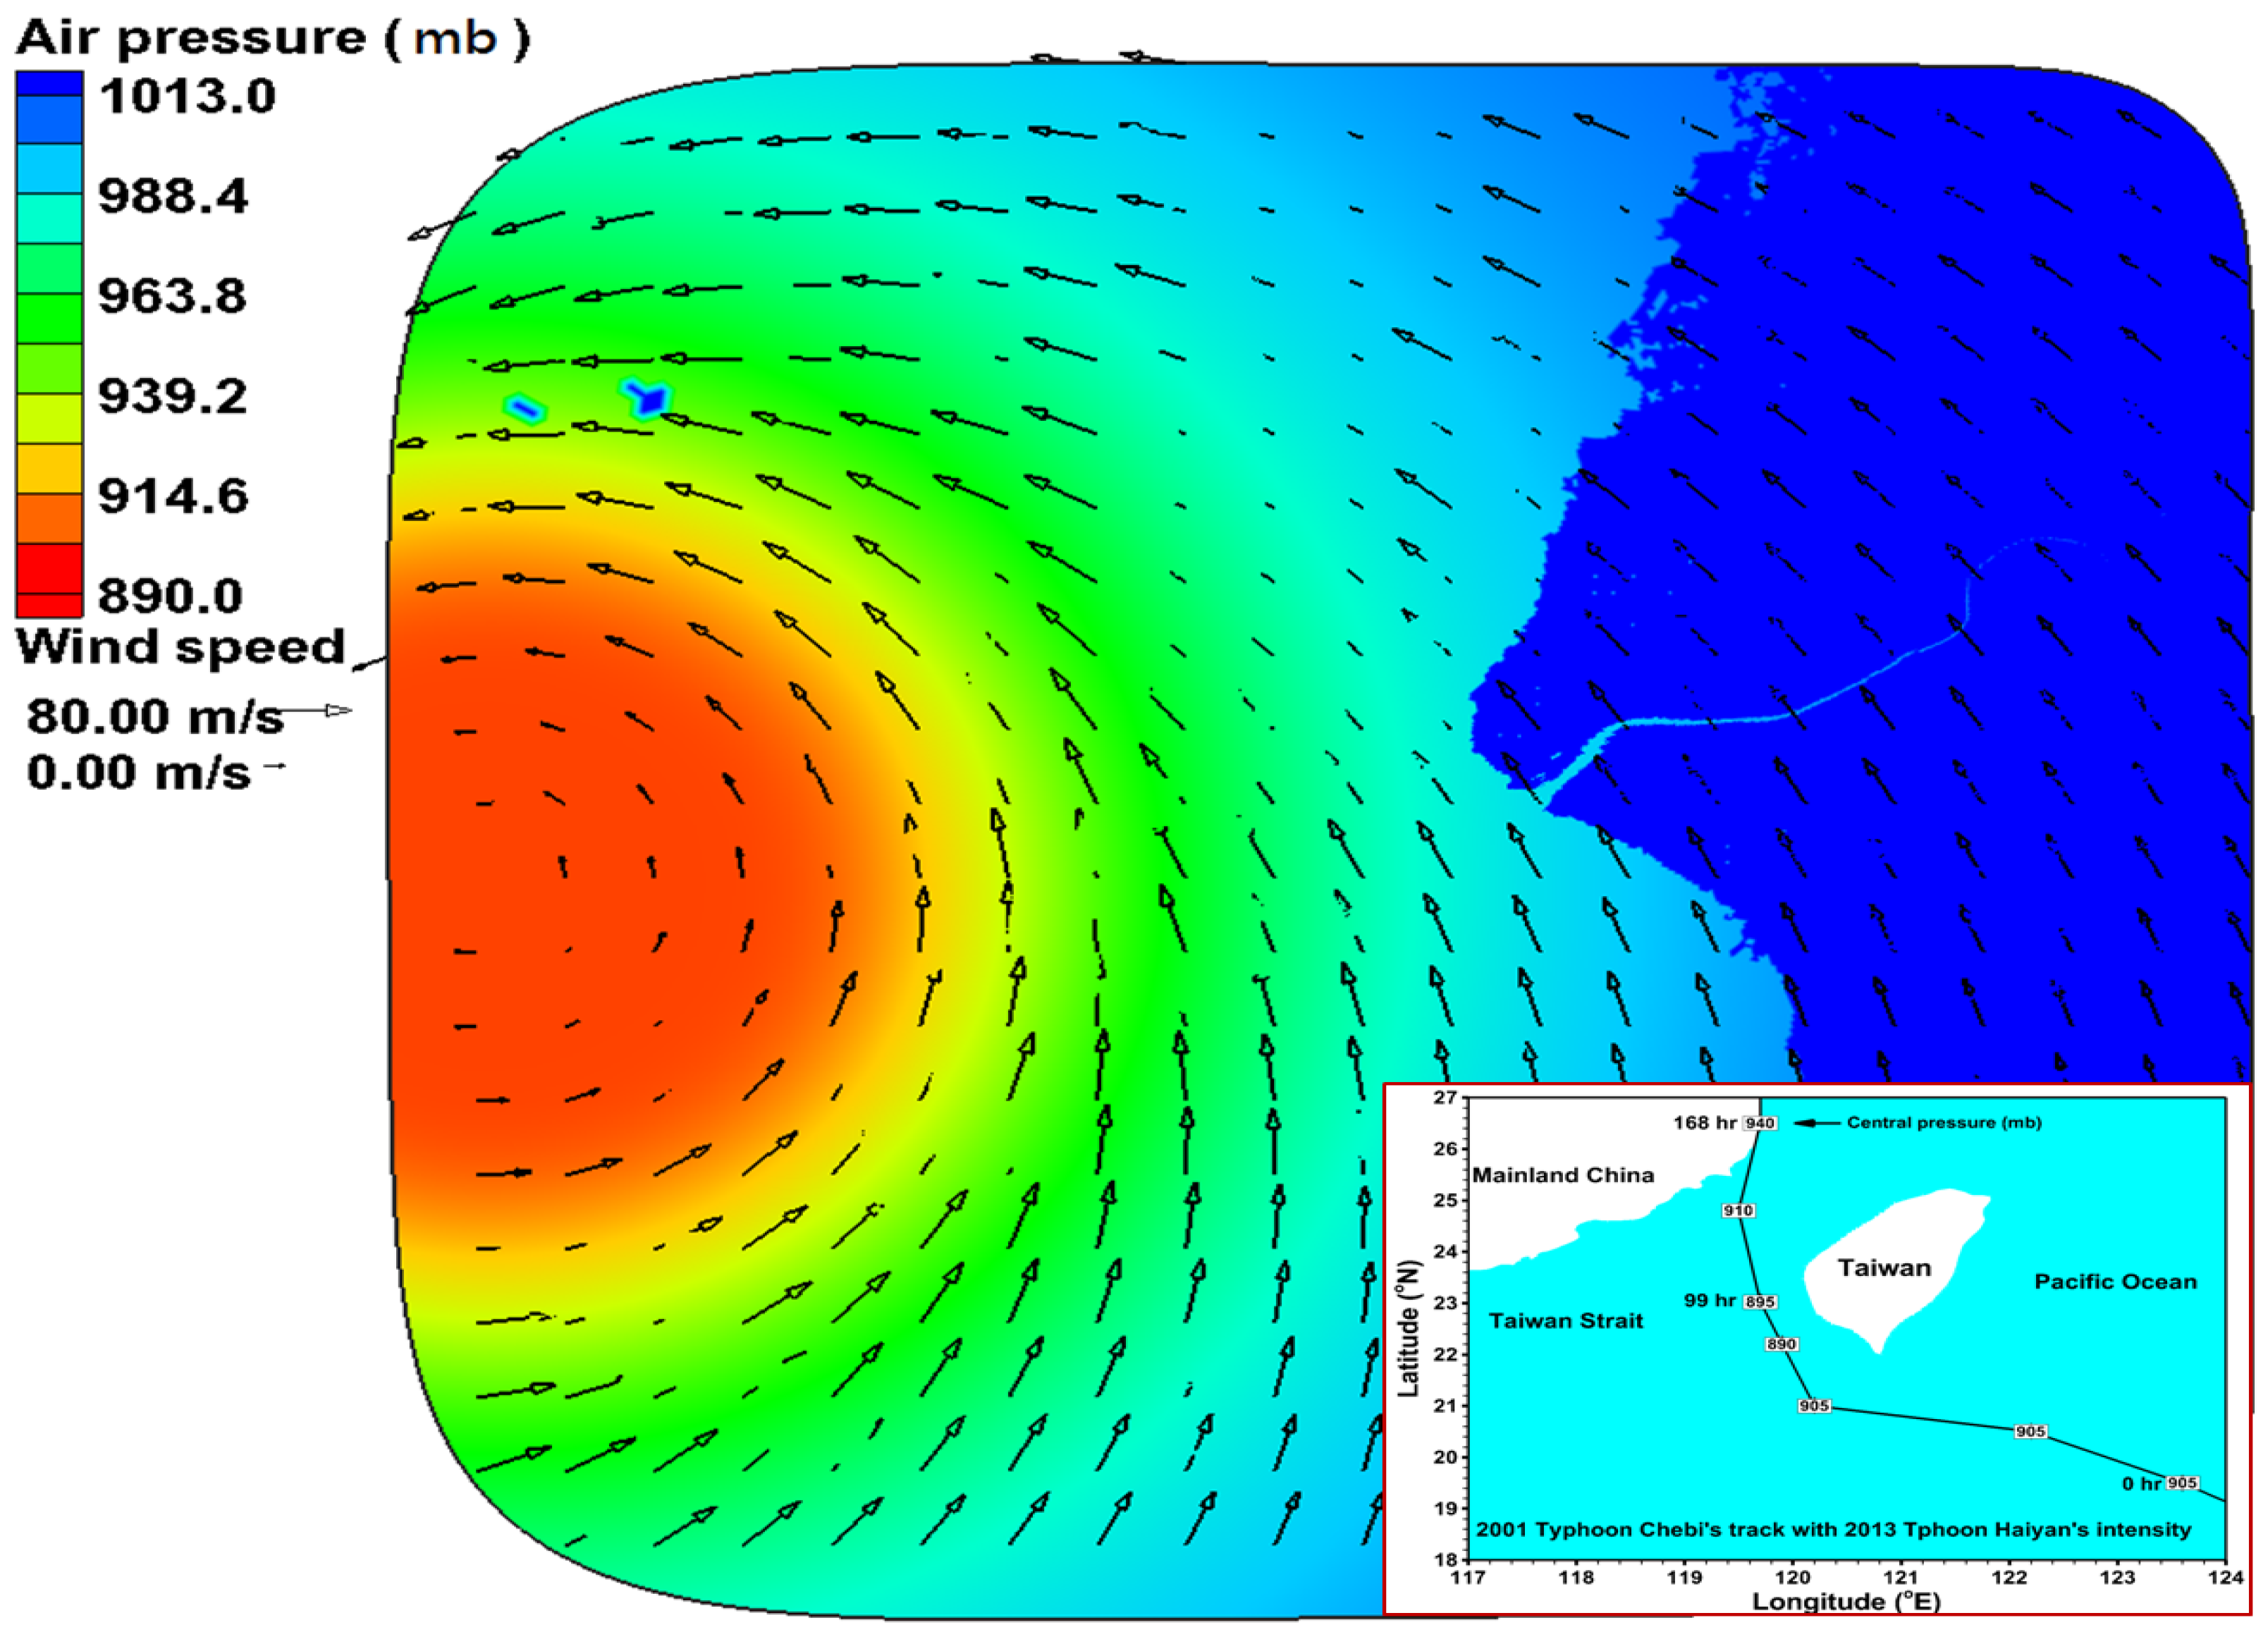
3.2. Prototypical Typhoon Model

The meteorological driving forces for storm surges are the wind stress and the atmospheric pressure gradient. Therefore, it is essential to determine the wind field and the pressure field of a tropical cyclone in cyclone surge calculations. For the prototypical typhoon storm surge responses that are investigated here, the radial distributions of the wind and the atmospheric pressure relative to the storm center and the maximum wind speed are specified following Holland [27]:
P A = P c + ( P n P c ) exp [ ( R max r ) B ]
W = B ( P n P c ) ρ a ( R max r ) B exp ( R max r ) B , [ W x W y ] = [ W sin θ W cos θ ]
where Pn and Pc are the ambient pressure and the central air pressure of the typhoon, respectively; Rmax is the maximum wind radius; r is the radial distance from the typhoon center; W is wind speed; Wx, Wy are wind speed in x, y components, respectively; θ is the azimuthal angle with respect to the typhoon’s eye; and B is a parameter that characterizes the scale of the typhoon. We adopted the formula of Hubbert et al. [28], i.e., B = 1.5 + (980 − Pc)/120.

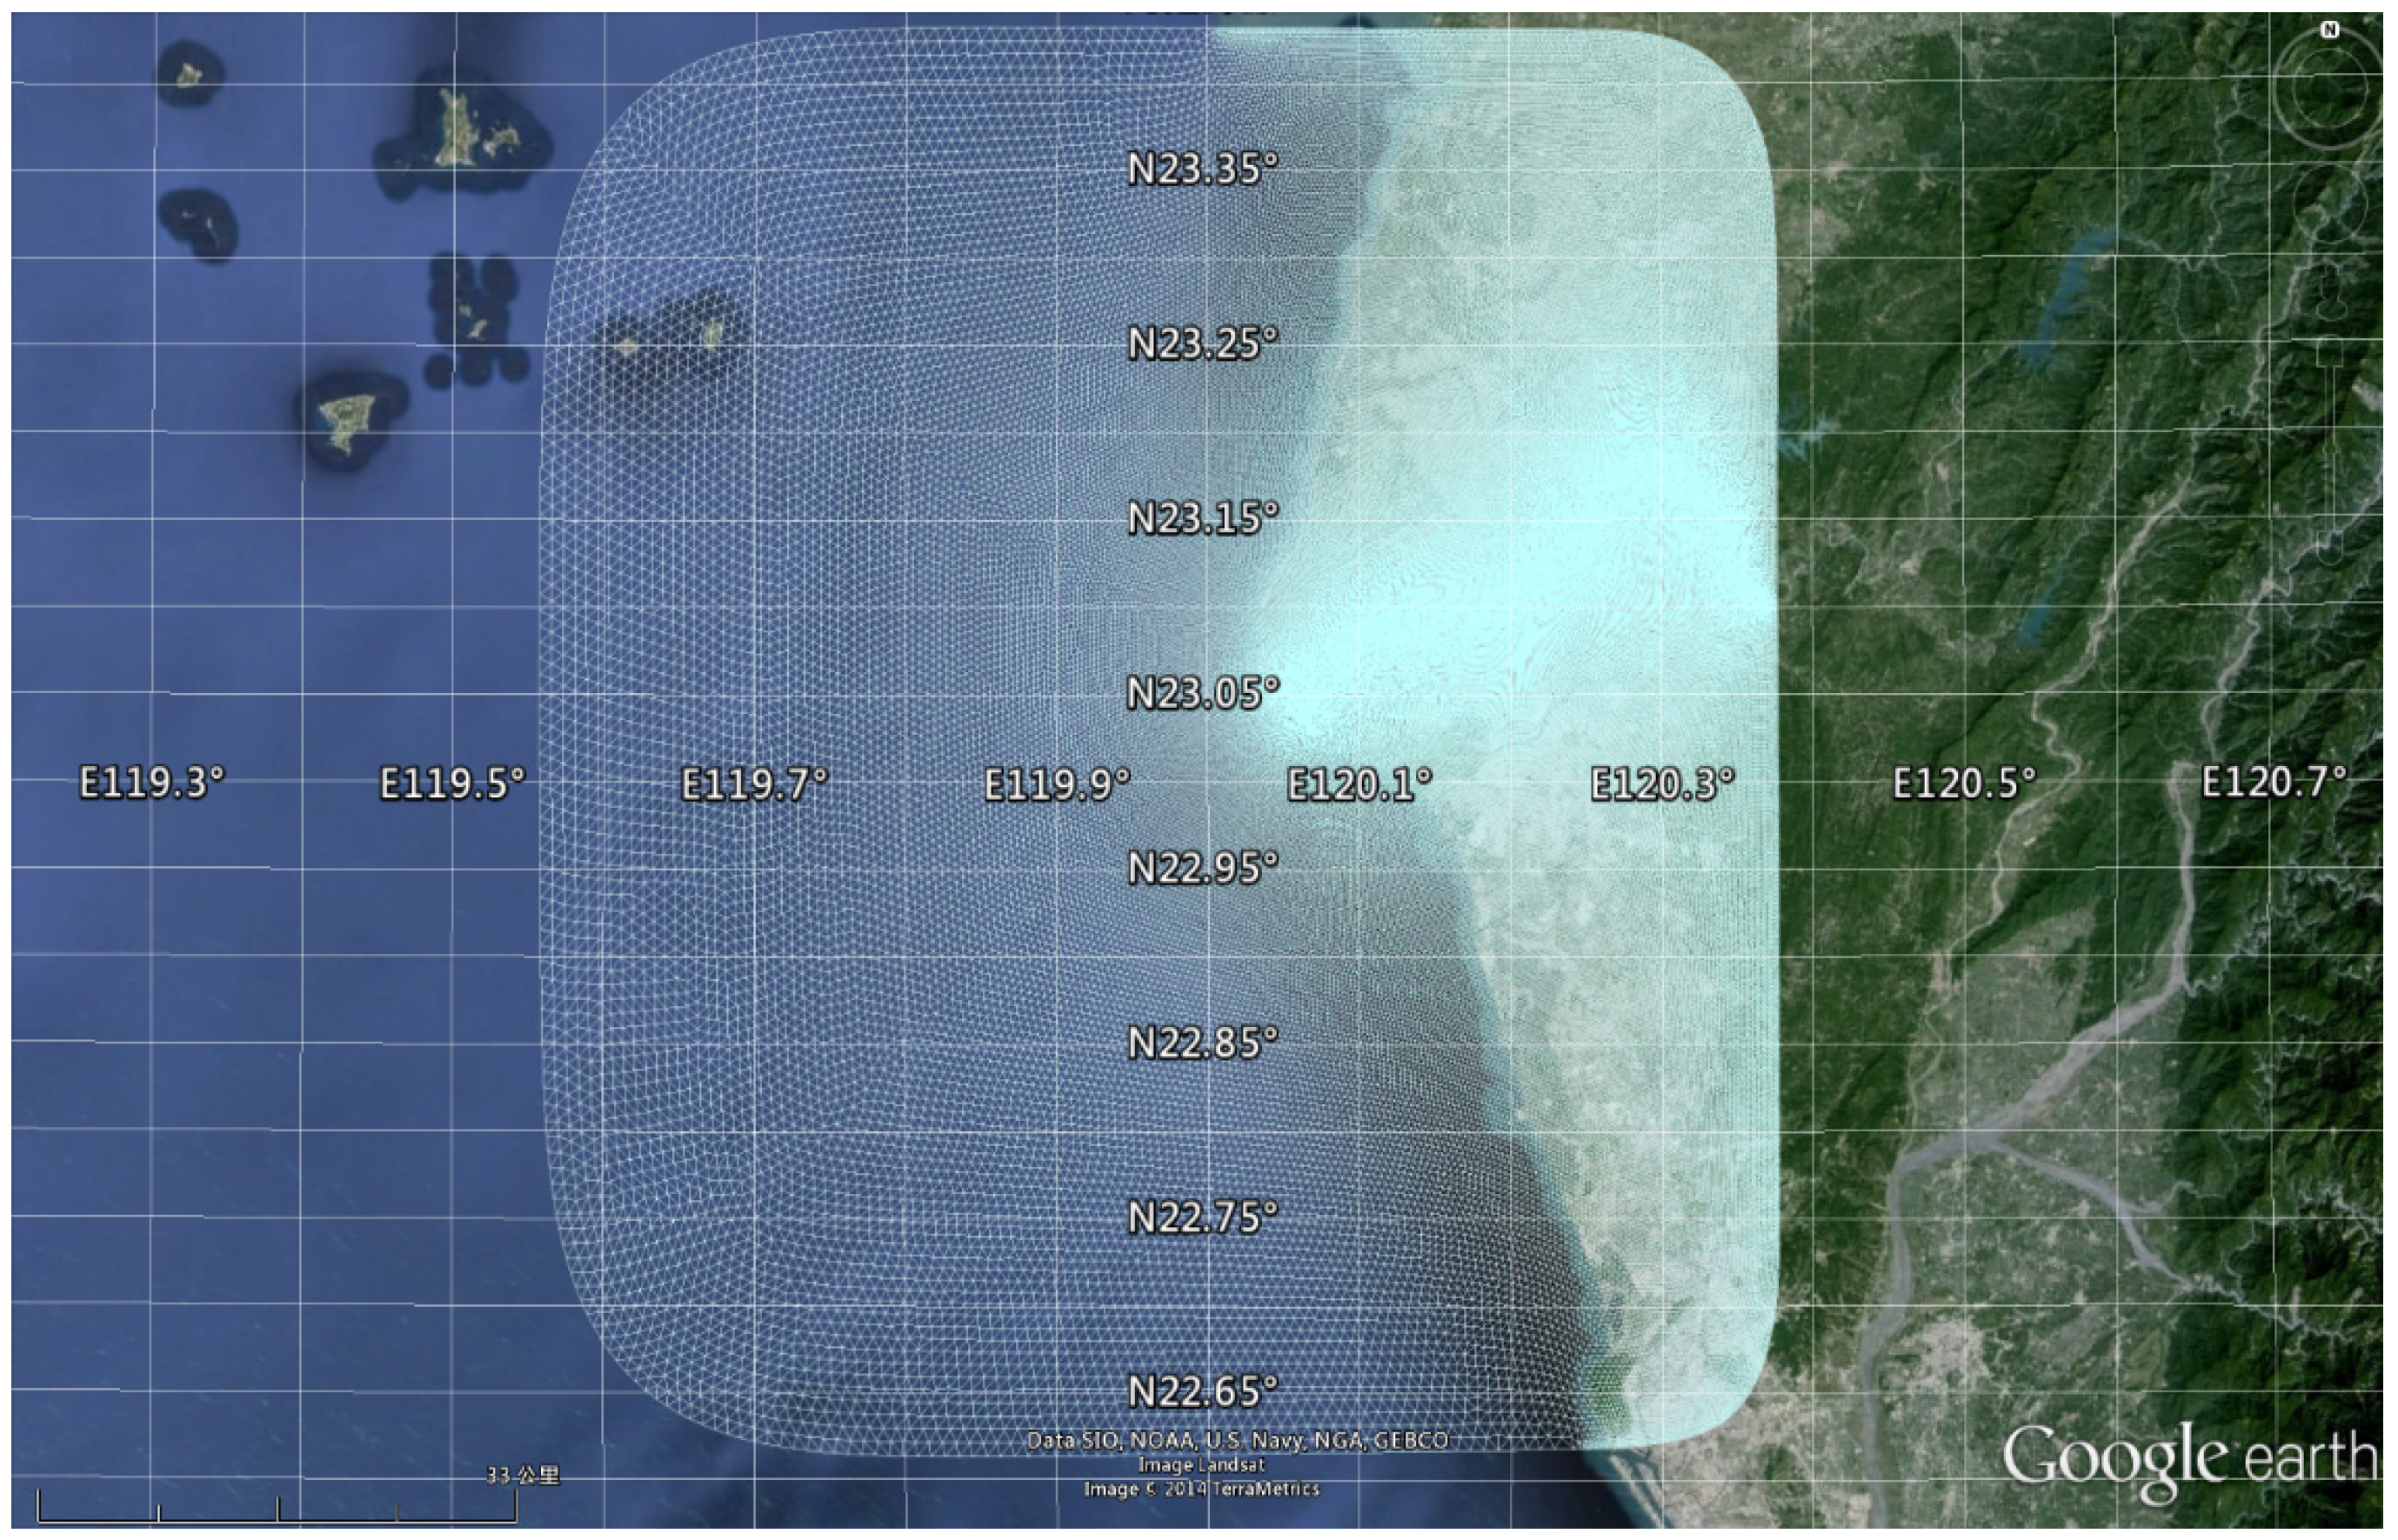
3.3. Model Implementation

An accurate representation of the bottom topography by the model grid is the most important and fundamental requirement for a successful modeling study. The model grid must accurately represent the characteristics of the model domain of the Tsengwen River basin and the adjacent coastal sea and the land.
The bathymetry and topography data of the Taiwan Strait and Tsengwen River basin (Figure 2) were obtained from the Ocean Data Bank and Water Resources Agency, Taiwan. The model grid consisted of 271,326 elements and 136,165 nodes in the horizontal direction and five uniform layers in the vertical direction (Figure 3). The entire model domain covered the Taiwan Strait, the Tsengwen River channel, and the land of the Tsengwen River basin. The model grid resolution ranged from 1000 m to 40 m in the Taiwan Strait and the Tsengwen River. A digital elevation model (DEM) with a resolution of 5 m × 5 m and measured data for the cross-section of the river channel were incorporated into the model grids to accurately represent the topography of the levees and the seawalls in the model. Once model meshes were generated, the Inverse Distance Weighting (IDW) method was adopted for interpolating raw data to each model grid. A minimum depth of 0.01 m was used to delineate the wetting and drying processes [29]. A five-second time step was used in the simulations without any signs of numerical instability.
Figure 3. Unstructured grids for entire modeling domain including the Taiwan Strait, the Tsengwen River channel, and the land of the Tsengwen River basin.
Water 06 03182 g003

3.4. Indices of Simulation Performance
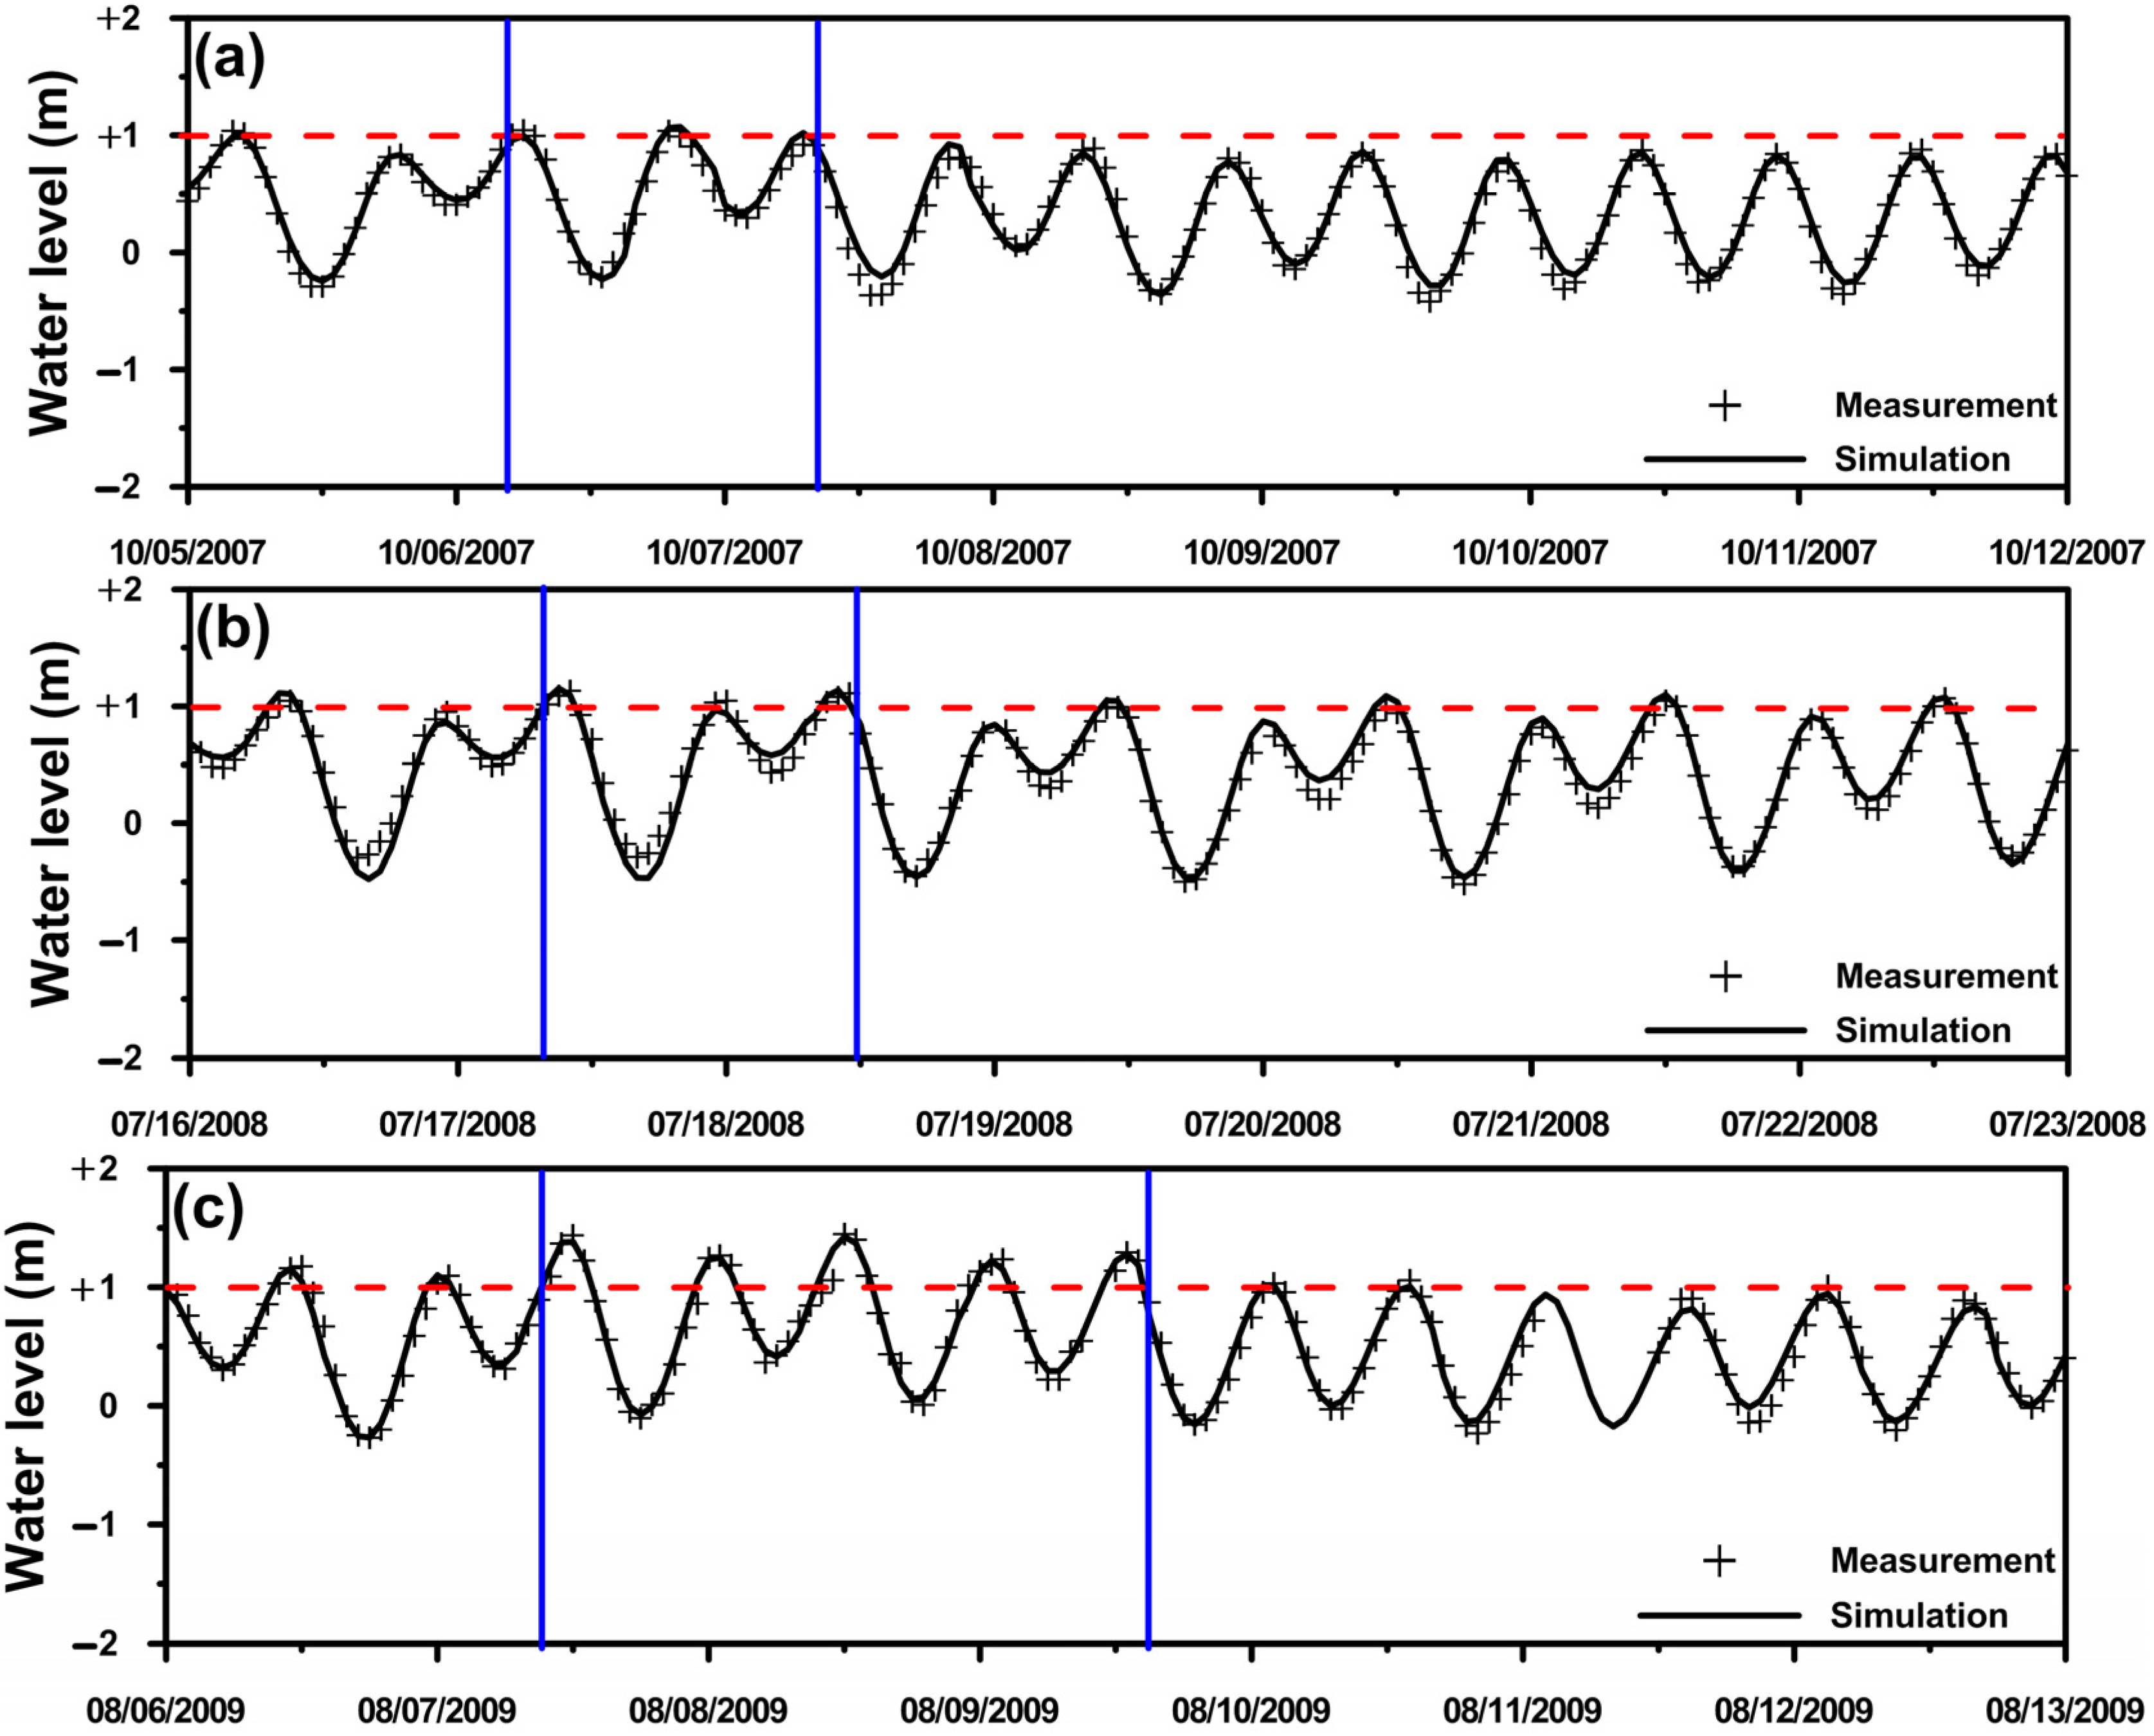
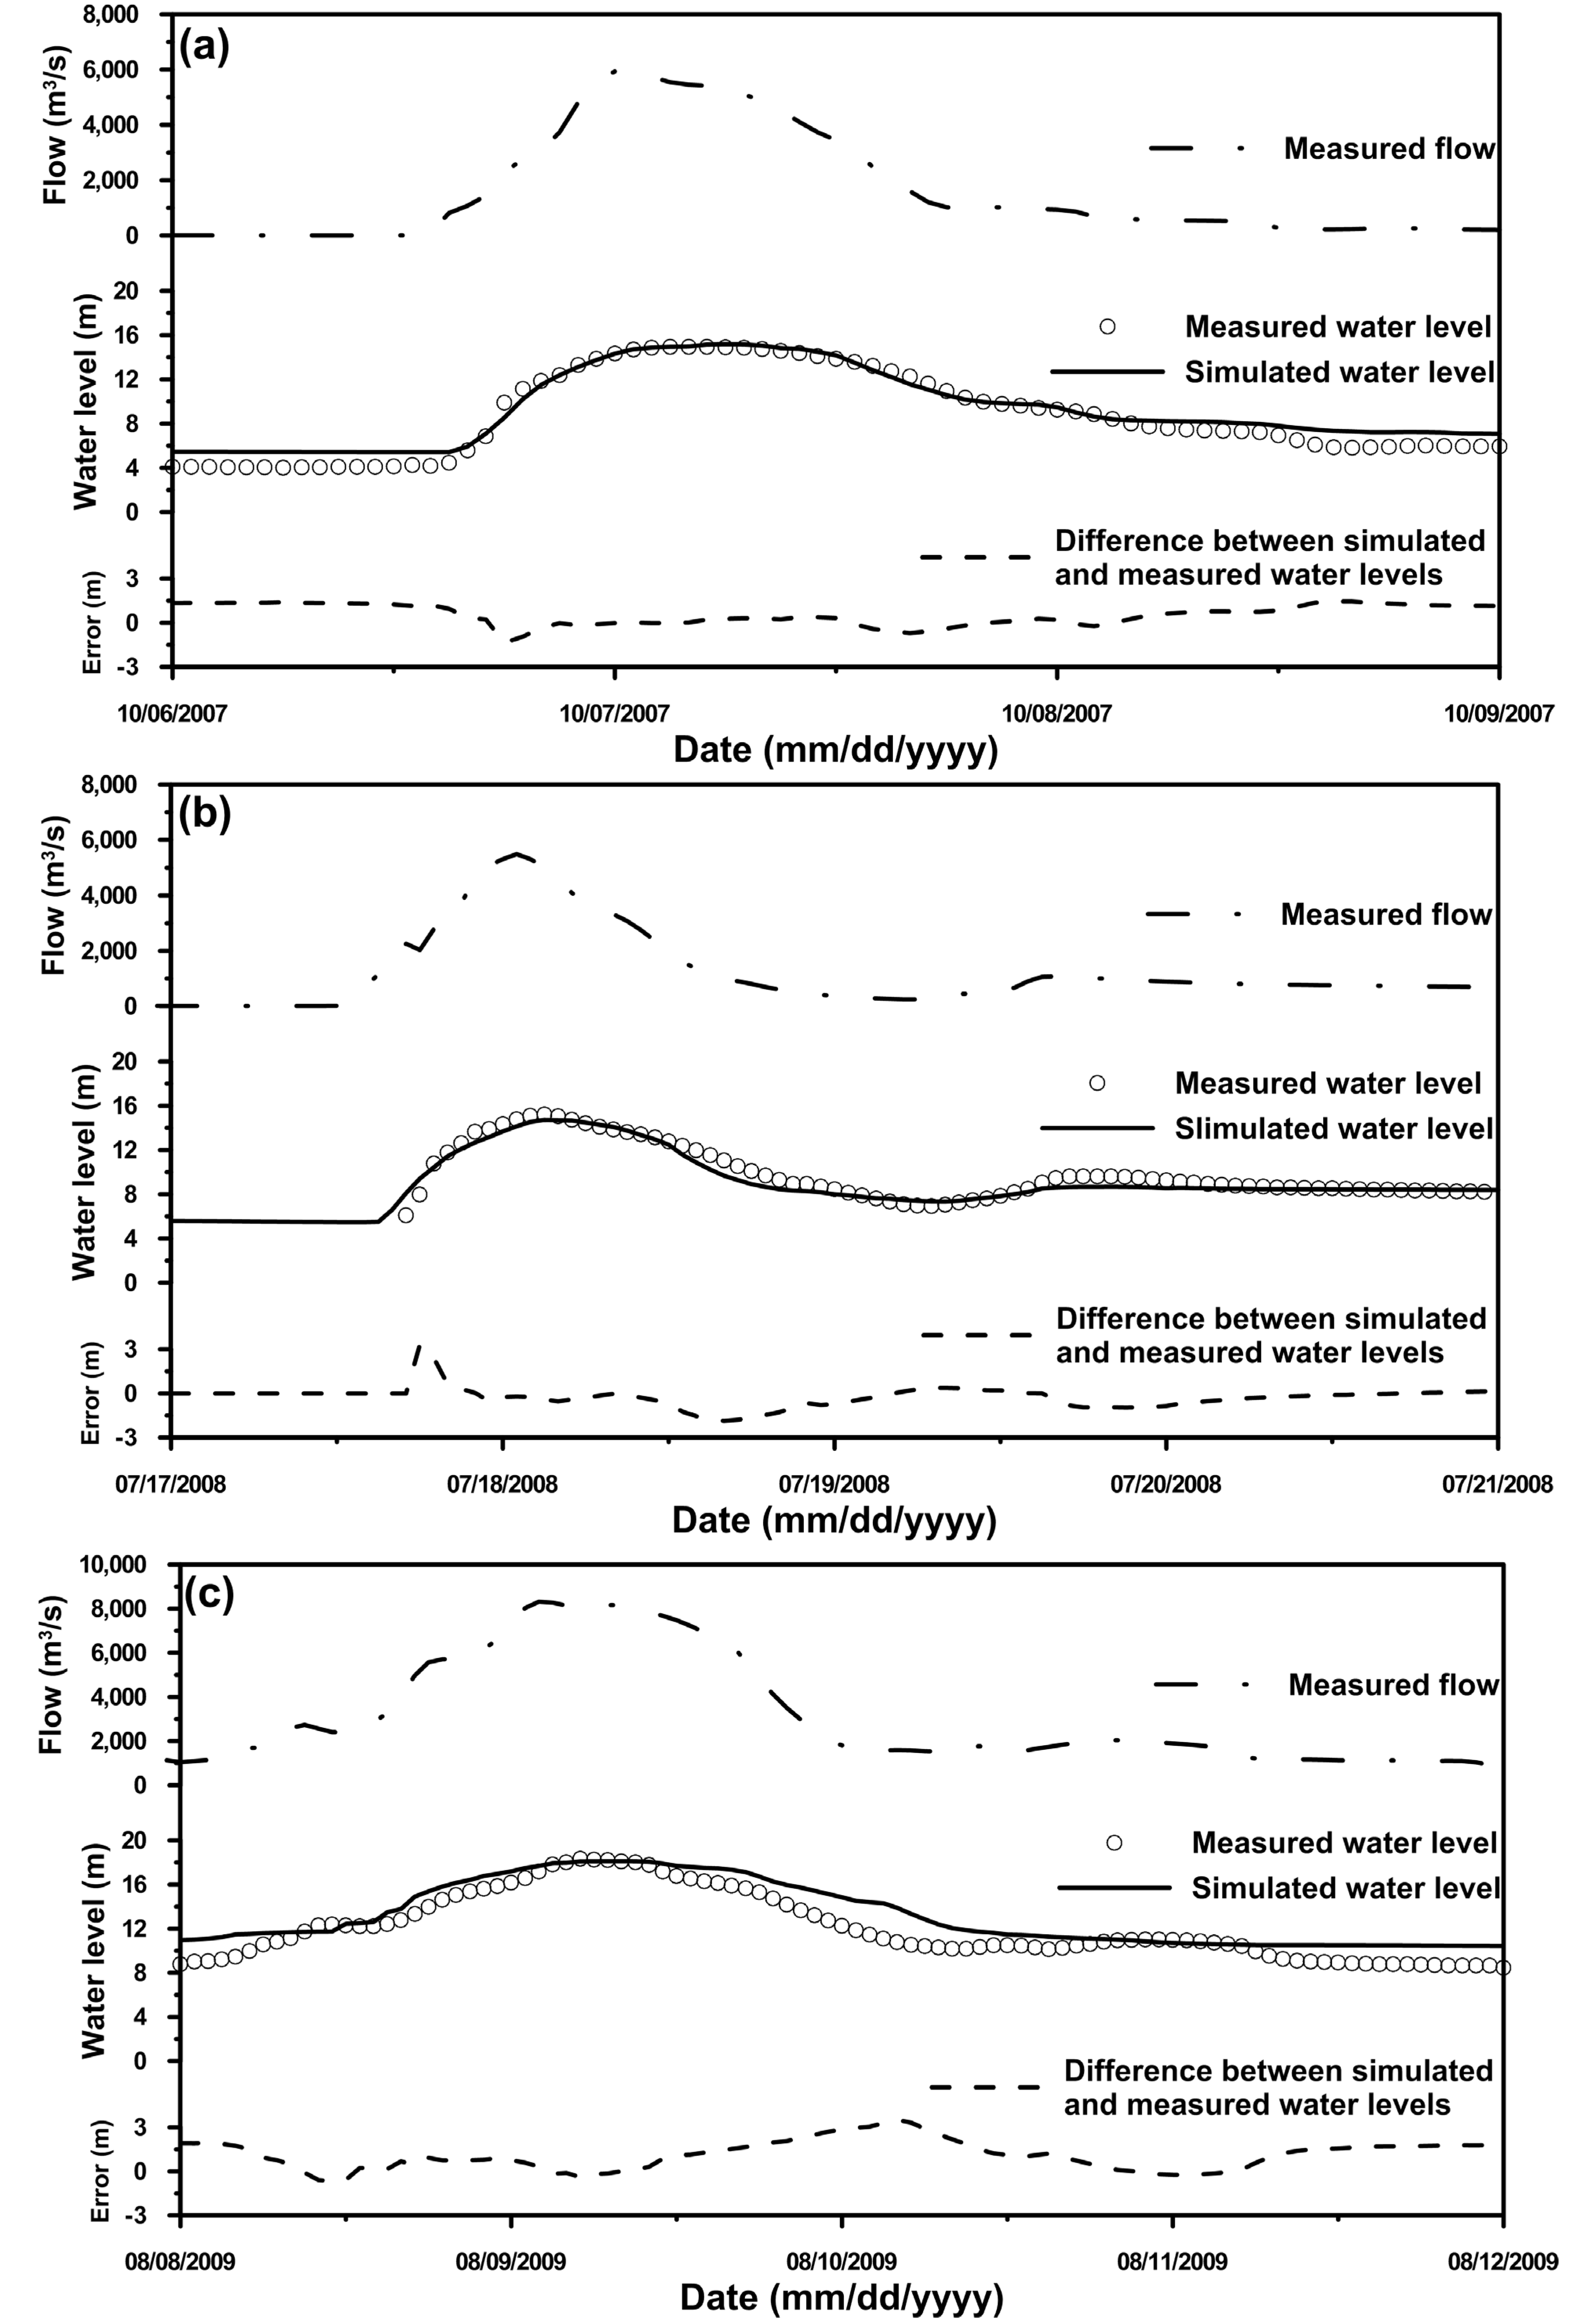
The performance of the three-dimensional hydrodynamic model was evaluated using three criteria to compare the predicted results and the observational data: the mean absolute error (MAE), the root mean square error (RMSE), and the sum of relative error (SRE). These criteria are defined by the following Equations:
M A E = 1 N i = 1 N | ( Y m ) i ( Y o ) i |
R M S E = 1 N i = 1 N [ ( Y m ) i ( Y o ) i ] 2
S R E = i = 1 N | ( Y m ) i ( Y o ) i | i = 1 N | ( Y o ) i | × 100 %
where N is the total number of data; Ym is the predicted water level; and Yo is the observational water level.

4. Model Validation

We used three sets of observational data to determine the accuracy of the model in practice and to validate its predictive capabilities. Three typhoon events including Typhoon Krosa (2007), Typhoon Kalmagei (2008), and Typhoon Morakot (2009) were used for the model validation. Figure 4 presents the tracks for these typhoon events. The number in the figure shows the month and date of typhoon’s track.
Figure 4. Typhoon tracks for model validation (Typhoon Krosa, Typhoon Kalmagei, and Morakot) and model application (Typhoon Chebi). The value in the typhoon track represents center pressure (mb). Cyan color and white color represent the ocean and land, respectively.
Water 06 03182 g004
The tidal elevation along the ocean boundaries was driven using the regional tidal prediction model for the South China Sea [30]. The freshwater discharge at the upstream boundary, which is located at the Erxi Bridge (i.e., 50 km from the Tsengwen River mouth) in the Tsengwen River, was specified using hourly observational data that was collected from the Water Resources Agency, Taiwan. The observational water levels that were used for the model validation were obtained from the Central Weather Bureau and the Water Resources Agency, Taiwan.
The model results for the water level for different typhoon events at the Jiangjun Fish Port and the Tsengwen Bridge shown in Figure 5 and Figure 6, respectively, are indicated after model validation. The Jiangjun Fish Port station is located in a coastal region; therefore, the water level is affected by tide and storm surges (Figure 5). The model reasonably simulated both the spatial and temporal patterns of the tide and the storm tide. According to the measured data collected from the Central Weather Bureau (CWB), Taiwan, annual average high tide does not exceed 1 m at the Jiangjun Fish Port. Therefore high tides over 1 m could be considered as storm tide. Figure 6 shows the measured freshwater discharge at the upstream boundary located at the Erxi Bridge (see Figure 2b) and compares the simulated and observed water levels at the Tsengwen Bridge over the Tsengwen River. The error value in Figure 6 is the difference between computed and measured water levels. The water level of the Tsengwen Bridge was significantly affected by the freshwater discharge at the upstream boundary during the typhoon events. Overall, the model results were in good agreement with the observations. Table 1 shows the statistical errors for the difference between the simulated and the observed water levels for the model validation. The MAE, RMSE, and SRE values for the results at the Jianjun Fish Port were below those at the Tsengwen Bridge because of the effect of the high freshwater discharge input during the typhoon events. The average MAE, RMSE, and SRE values of three typhoon events are 0.067 m, 0.087 m, 1.41% at the Jianjun Fish Port, while they are 0.70 m, 0.87 m, 7.59% at the Tsengwen Bridge, respectively. Through the model validation procedure, the bottom drag coefficients are set to be 0.0025 for ocean, 0.0050 for river, and 0.0075 for land.
Figure 5. Comparison of model predictions of water level with observation results at the Jianjung Fish Port for (a) Typhoon Krosa (2007); (b) Typhoon Kalmaegi (2008); and (c) Typhoon Morakot (2009). The blue interval represents the period of storm surge.
Water 06 03182 g005
Figure 6. Comparison of model predictions of water level with observation results at the Tsengwen Bridge for (a) Typhoon Krosa (2007); (b) Typhoon Kalmaegi (2008); and (c) Typhoon Morakot (2009). The flow represents the measured freshwater discharge at the upstream boundary (Erxi Bridge).
Water 06 03182 g006
Table 1. Model performance for predicting water levels during three typhoon events at different stations.
TyphoonJianjun Fish PortTsengwen Bridge
MAE (m)RMSE (m)SRE (%)MAE (m)RMSE (m)SRE (%)
Typhoon Krosa (2007)0.060.081.410.710.878.72
Typhoon Kalmaegi (2008)0.070.091.550.470.634.14
Typhoon Morakot (2009)0.070.091.260.911.109.90

5. Model Applications and Discussion

The validated model was then used to investigate the coastal inundation that was induced by the effects of a storm surge, a high freshwater discharge, and a storm surge combined with a high freshwater discharge.

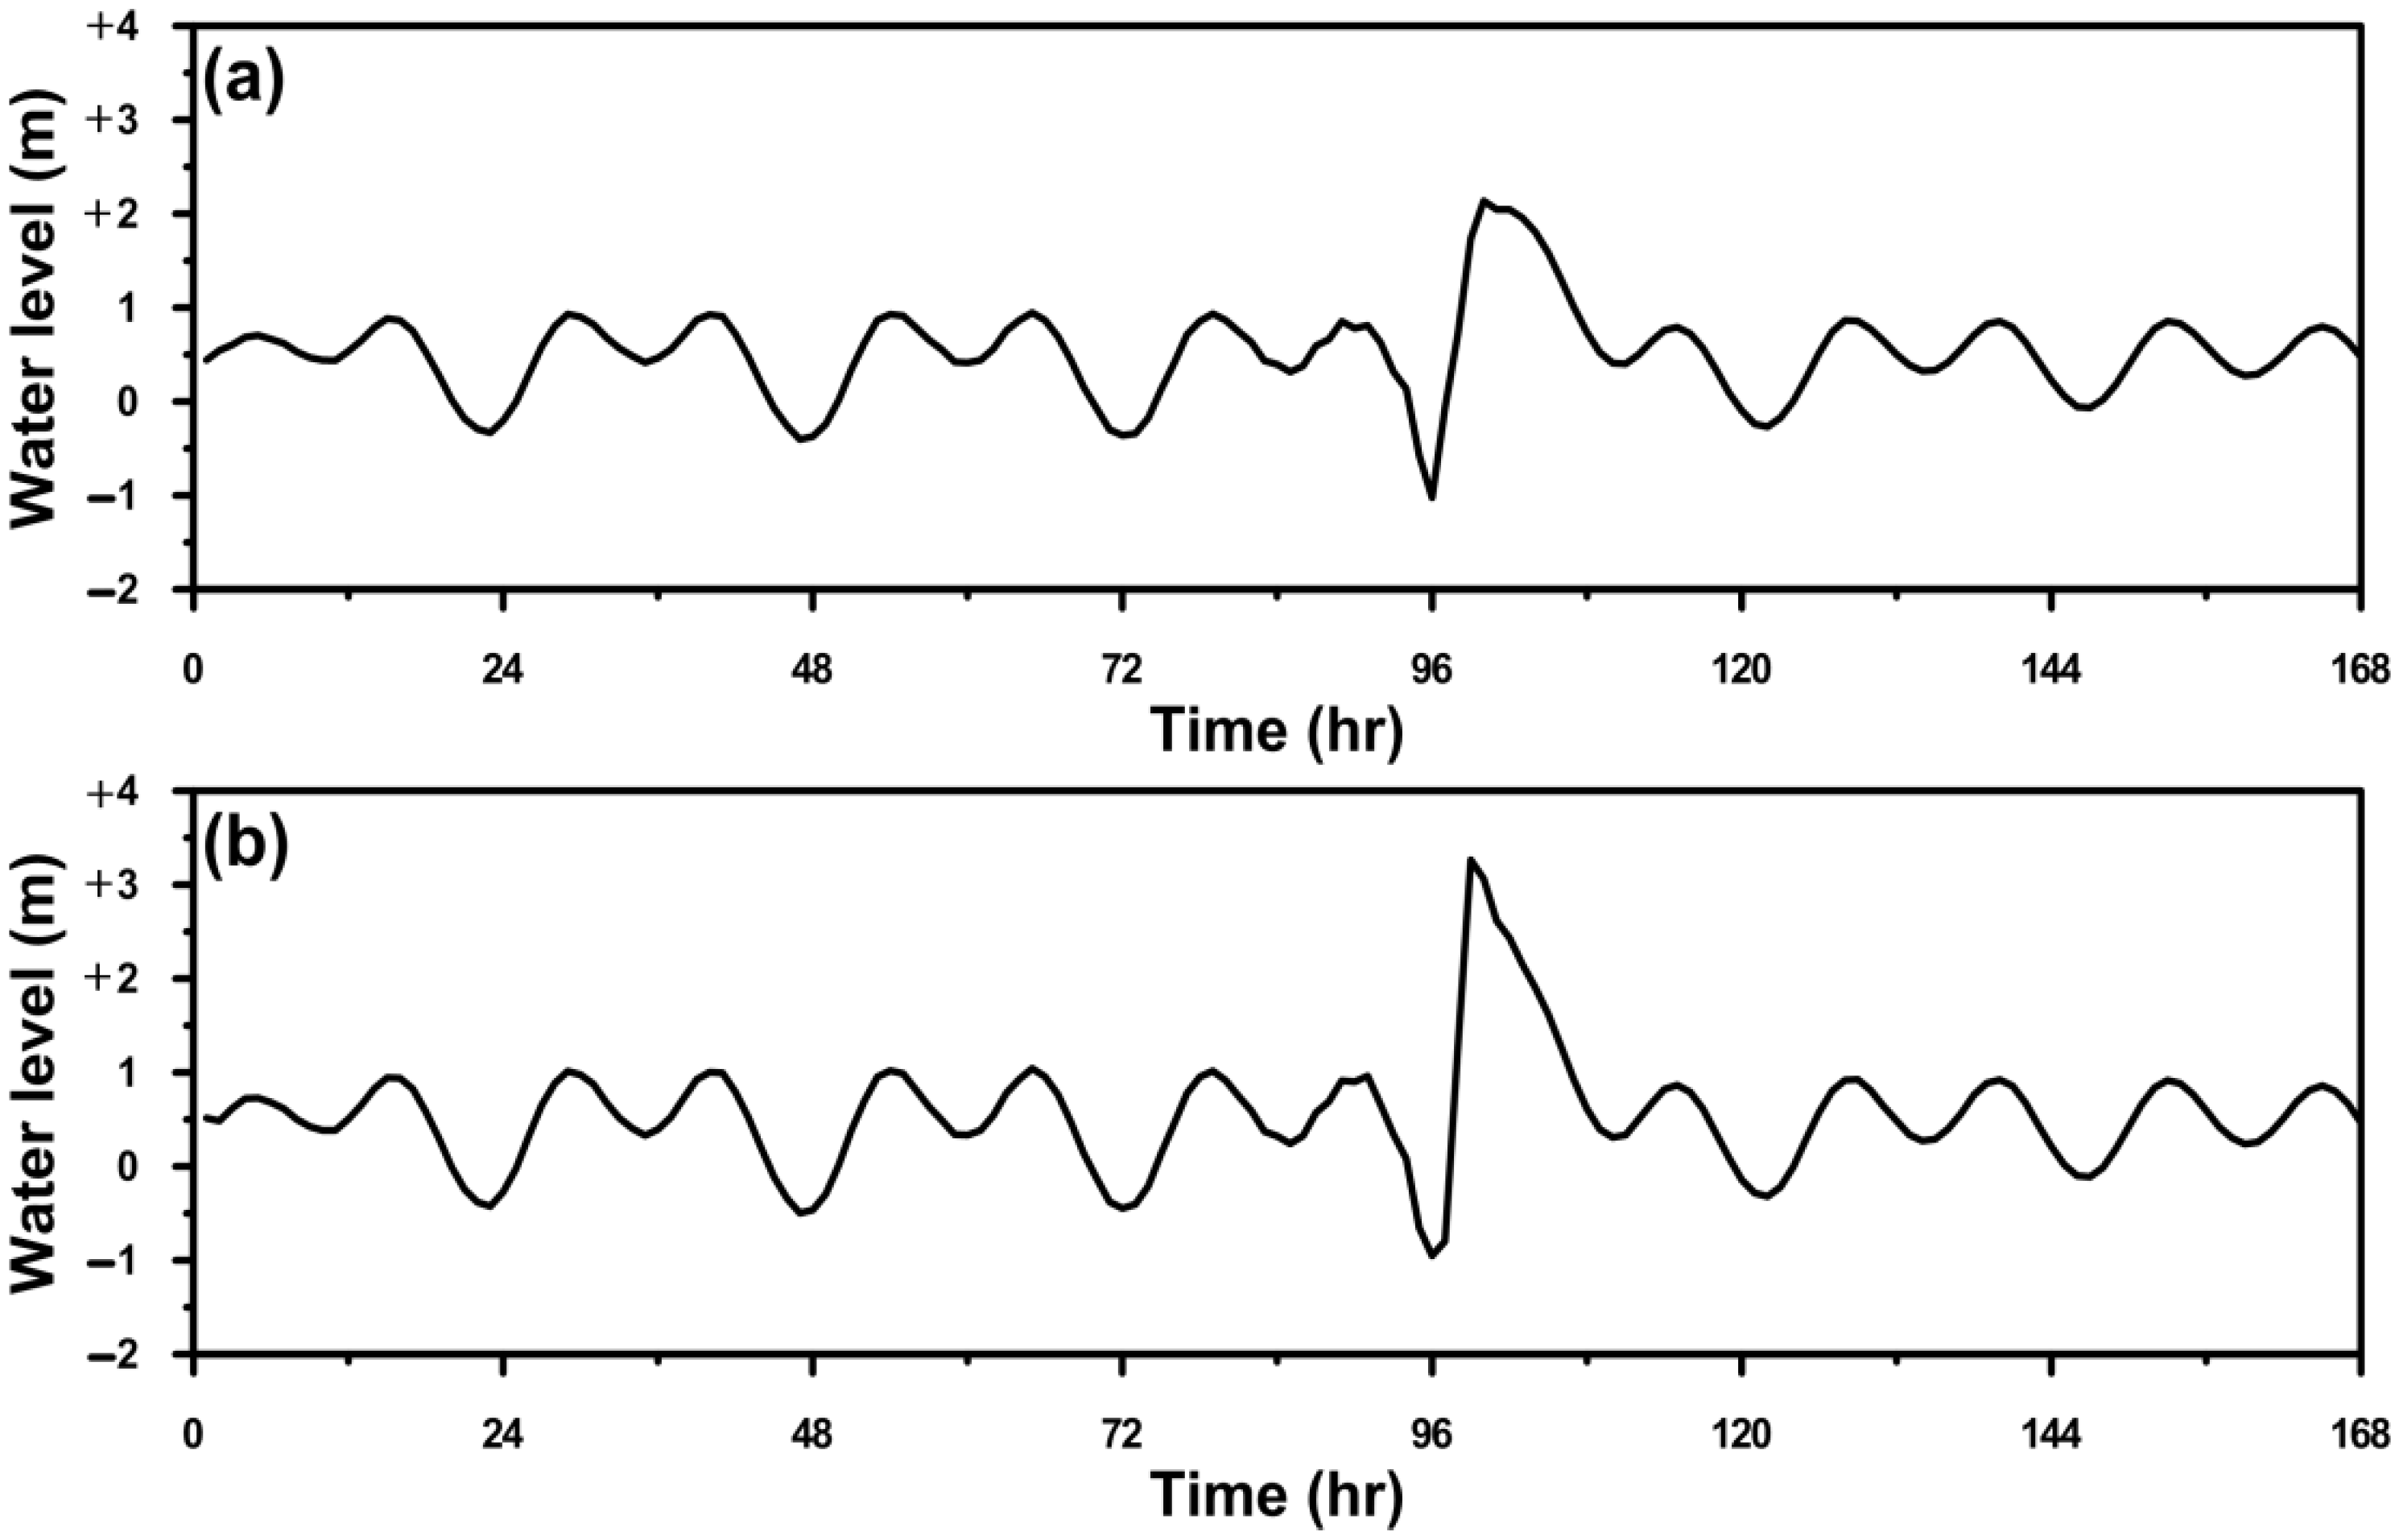
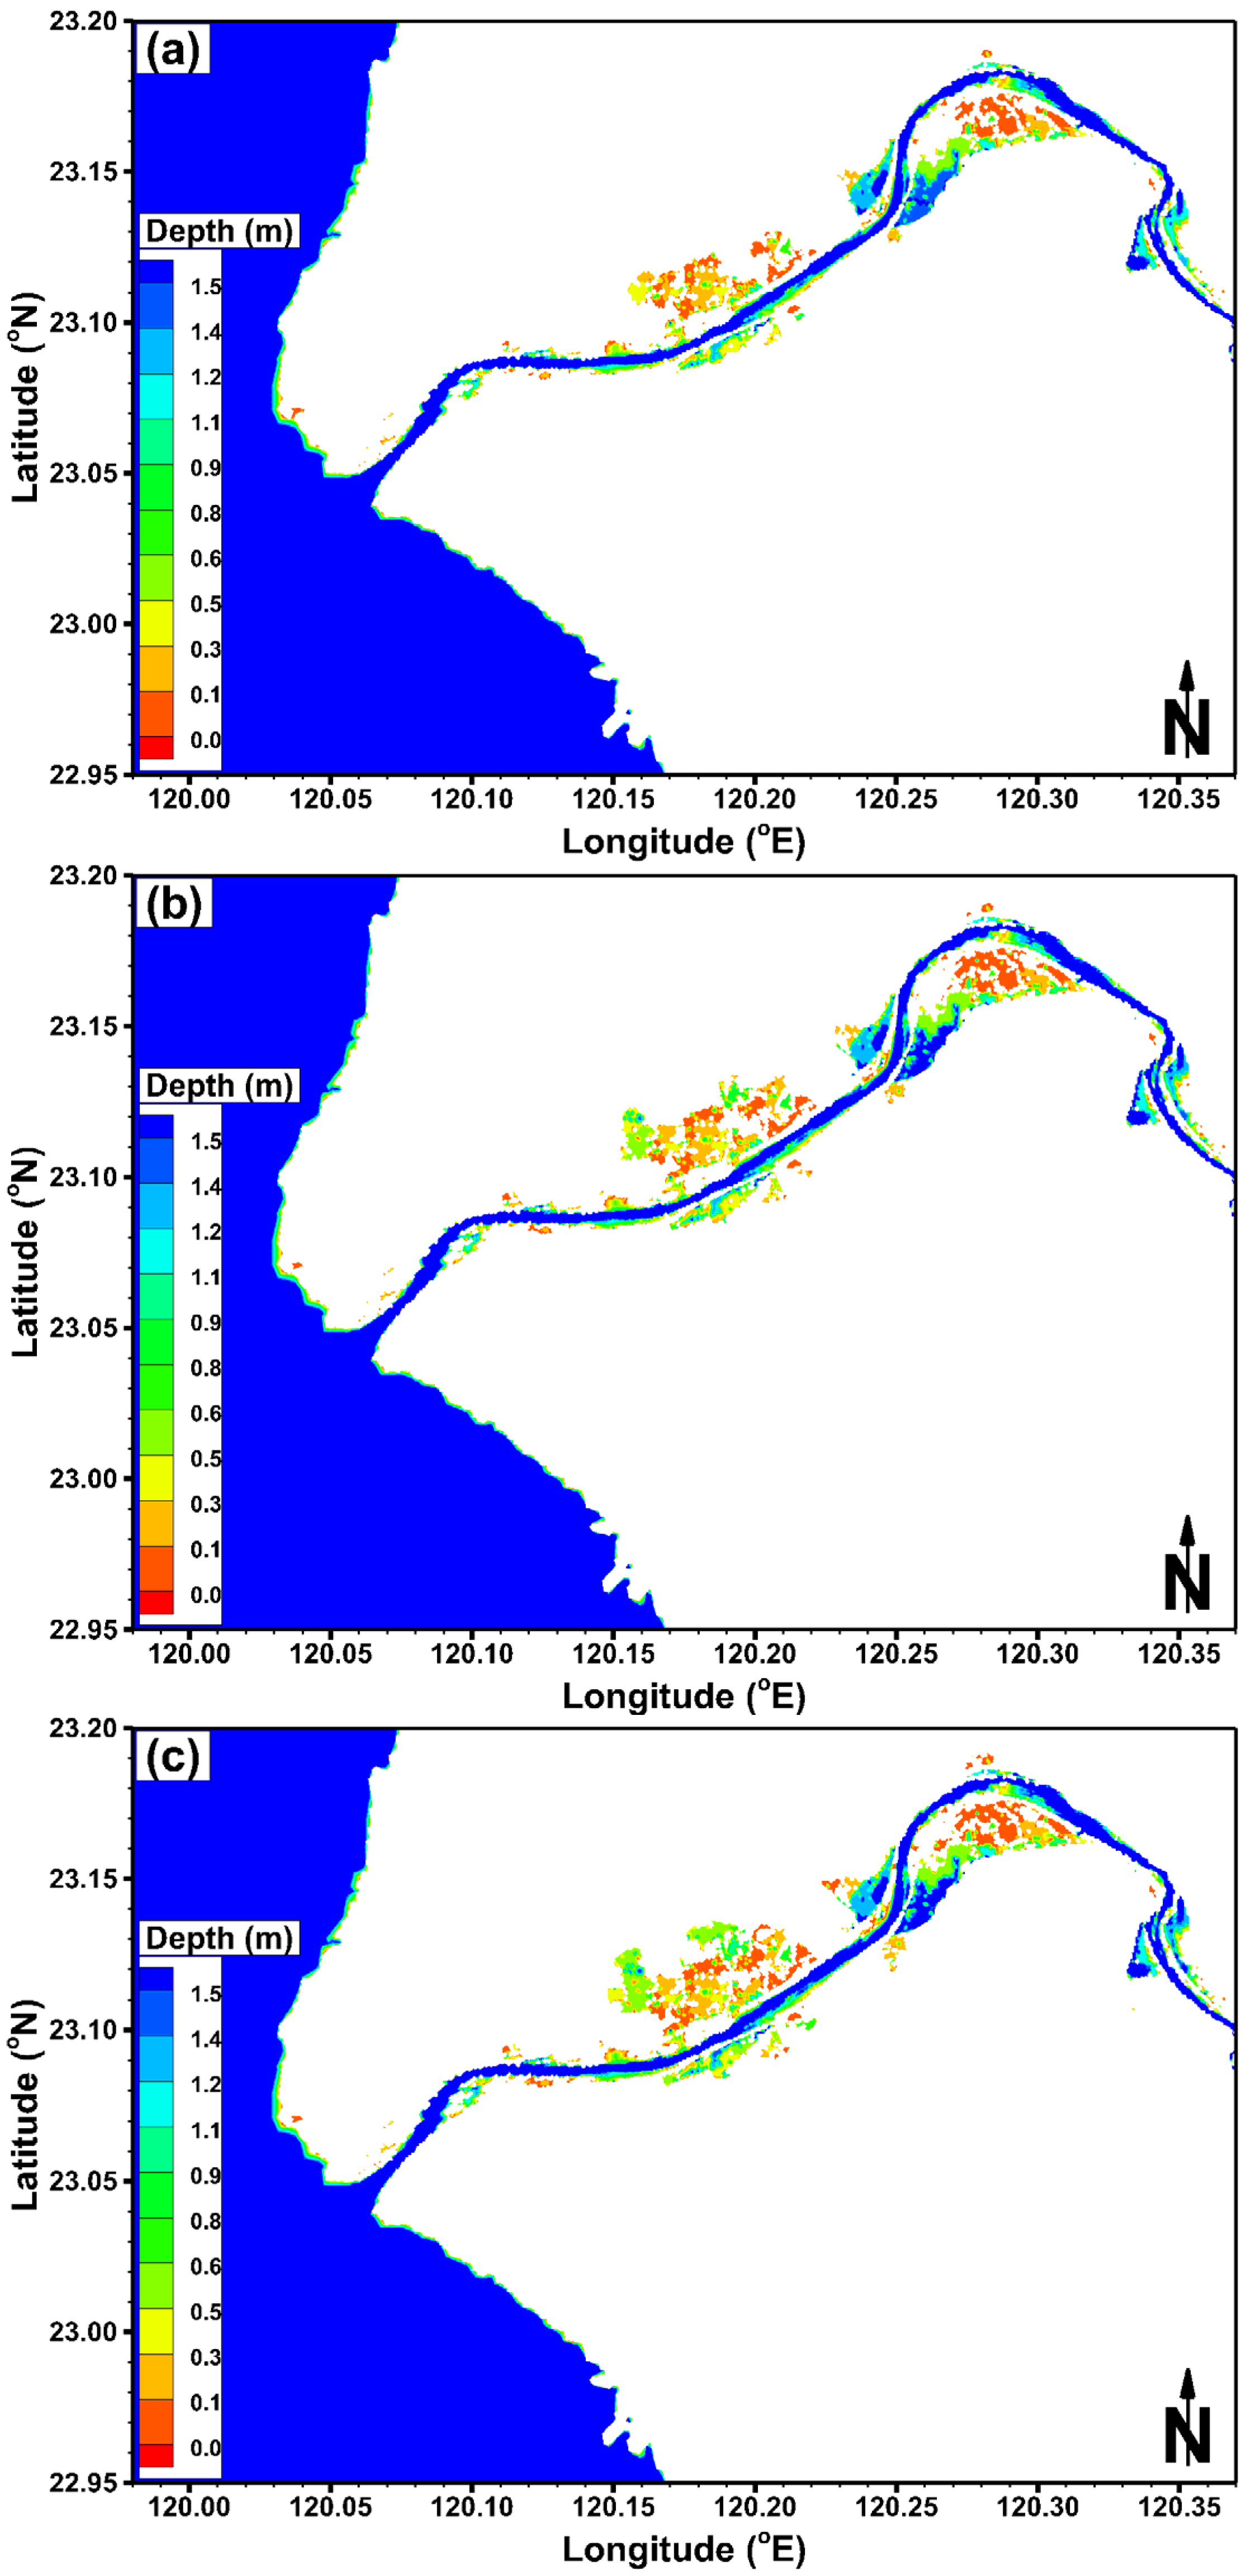
5.1. Effect of Storm Surge

To predict potentially severe inundation induced by a storm surge, the super Typhoon Haiyan (2013) that occurred in the Philippines was shifted to hit Taiwan. The pathway of the typhoon was assumed to be same as that of Typhoon Chebi (2001), which is shown in Figure 4.
The air pressure and the wind field that were generated from the prototypical typhoon model are shown in Figure 7. The figure shows that the minimum air pressure and the maximum wind speed were 890 mb and 83 m/s, respectively. The air pressure and the wind field were included in the model simulation to predict the storm surge and the inundation extent. A mean flow of 74.9 m3/s was used as the upstream boundary condition. Figure 8 shows the predicted time series water levels at the Jiangjun Fish Port and the Tsengwen River mouth. We found that the maximum storm surges at the Jiangjun Fish Port and the Tsengwen River mouth were 2.1 m and 3.26 m, respectively. This extremely high water level at the Tsengwen River mouth would have resulted in inundation. Figure 9 shows the predicted inundation depth and extent induced by a storm surge only. Figure 9a shows the instantaneous inundation pattern when the storm surge height reached its maximum value. This pattern indicates that the seawater rushed into the Tsengwen River estuary, thereby increasing the water depth up to 10 m in height. Figure 9b presents the inundation depth and extent at a simulation time of 168 h. The inundation area was 60 km2, and the maximum inundation depth was 1.98 m (see Table 2). Thus, the artificial super typhoon would have resulted in an extreme storm surge and produced severe inundation in the coastal region.

5.2. Effect of Freshwater Discharge

To comprehend the influence of freshwater discharge on coastal inundation, a three-dimensional hydrodynamic model was used to directly predict the inundation resulting from river flooding from high freshwater discharge at the upstream boundary. Three scenarios with 50-, 100-, and 200-year return periods were adopted to drive the upstream boundary in the Tsengwen River. The peak flows for the 50-, 100-, and 200-year return periods were 8640, 8920, and 9830 m3/s, respectively [31]. The observed hourly discharge at the upstream boundary in the Tsengwen River during Typhoon Krosa (2007) was used to calculate the discharge hydrograph for the different return periods that were used in the model simulation.
Figure 10 shows the inundation extent and depth for different return periods during the peak flow condition. Overtopping caused inundation at both banks of the river. Table 2 shows the inundation area and the maximum inundation depth for different return periods. For the 200-year return period, the inundation area and the maximum inundation depth were 30 km2 and 1.58 m, respectively. The inundation area and the maximum inundation depth for 200-year return period flow only are smaller than those for the effect of storm surge (Table 2).
Figure 7. Distribution of air pressure and wind speed generated from the prototypical typhoon model used in a numerical experiment (using tracks of Typhoon Chebi in 2001 and intensity of Typhoon Haiyan in 2013). The center pressure and time of typhoon track show in the small frame.
Water 06 03182 g007
Figure 8. Time series for water level induced by a typhoon of similar intensity as Typhoon Haiyan in 2013 at (a) Jiangjun Fish Port and (b) Tsengwen River mouth.
Water 06 03182 g008
Figure 9. Inundation extent and depth induced by a storm surge at simulation times of (a) 99 h and (b) 168 h.
Water 06 03182 g009
Figure 10. Inundation extent and depth induced by a freshwater discharge only during peak flows for (a) 50 year; (b) 100 year; and (c) 200 year return periods.
Water 06 03182 g010
Table 2. Inundation area and maximum inundation depth under different conditions.
Inundation ConditionEffect of Storm SurgeEffect of Freshwater Discharge
Return Period
50 Year100 Year200 Year
Inundation area (km2)60212530
Maximum inundation depth (m)1.981.531.561.58

5.3. Effect of Storm Surge Combined with Freshwater Discharge

When a storm surge occurs at the Tsengwen River mouth and meets the high water level in the river, the water cannot drain into the coastal ocean, resulting in severe flood inundation in the lowland region [32]. To evaluate this extreme inundation condition, the peak flow for a 200-year return period was used at the upstream boundary condition: the storm surge condition is illustrated in Figure 7.
Figure 11 shows the water level profile along the Tsengwen River mouth and the inundation extent and depth for a 200-year return period during the peak flow and the extreme storm surge condition. The maximum water level profile along the Tsengwen River mouth is shown in Figure 11a. The figure shows that the water level at 2 km to 8 km from the Tsengwen River mouth was higher than that at the river mouth because of the narrow cross-sections of these river reaches. The water level at 14 km to 24 km from the Tsengwen River mouth increased because of the high freshwater discharge input. The inundation area increased compared to that shown in Figure 10c because of the storm surge that produced coastal flooding (Figure 11b). The inundation area and the maximum inundation depth were 96 km2 and 1.97 m, respectively. Thus, the extreme storm surge combined with high freshwater discharge increased the severity of the flooding.
Figure 11. (a) Water level profile along Tsengwen River; and (b) inundation extent and depth induced by storm surge and freshwater discharge for 200-year return period.
Water 06 03182 g011

6. Conclusions

A high-resolution three-dimensional hydrodynamic model with an unstructured grid was used to simulate a storm surge and flood inundation. To obtain high resolution, fine grids were generated for the model simulation to fit the coastline boundary, the land topography, and the river channel. The tidal elevation along the ocean boundaries was driven using the data from a regional tidal prediction model for the South China Sea. The upstream boundary at the Erxi Bridge in the Tsengwen River was forced by the freshwater discharge. The meteorological driving forces for the storm surges were the wind stress and the atmospheric pressure gradient for a prototypical typhoon model. Three typhoon events, Typhoon Krosa (2007), Typhoon Kalmaegi (2008), and Typhoon Morakot (2008), were used for the model validation. The performance of the hydrodynamic model was determined using three criteria (i.e., the mean absolute error, MAE, the root mean square error, RMSE, and the sum of relative error, SRE) to evaluate the model results and the observational data.
We found that the hydrodynamic model could satisfactorily describe the tide level at the Jiangjun Fish Port, which is affected by astronomical tides and storm surges, and reproduced the water level at the Tsengwen Bridge in the Tsengwen River, which is affected by the freshwater discharge at its upstream boundary. The validated model was then applied to investigate the effects of an extreme storm surge only, a freshwater discharge only, and an extreme storm surge combined with a freshwater discharge input. The modeling results revealed that the inundation area and depth for the super Typhoon Haiyan (2013) that was artificially shifted to hit Taiwan were higher than for a peak flow with a 200-year return period. Thus, the predicted air pressure and wind field were similar to those of the super Typhoon Haiyan (2013) and would have severely damaged the Tsengwen River basin. If the typhoon with intensity similar to super Typhoon Haiyan (2013) induced an extreme storm surge, which occured simultaneously with a 200-year return period flow, the modeling results revealed that severe inundation would occur at the coastal of the Tsengwen River.
The effect of precipitation plays an important role in inundation, especially in low-lying regions. In a future study, we will include the rainfall factor in the model to predict the extent and depth of inundation more accurately.

Acknowledgments

This project was funded by the National Science Council (NSC), Taiwan, grant No. 102-2625-M-239-002. The authors would like to thank the Taiwan Center Weather Bureau and the Water Resources Agency for providing the observational data.

Author Contributions

Wen-Cheng Liu supervised the progress of National Science Council project and served as a general editor. Wei-Bo Chen executed the model simulations and discussed the results with Wen-Cheng Liu.

Conflicts of Interest

The authors declare no conflict of interest.

References

  1. Flather, R.A. Storm surges. In Encyclopaedia of Ocean Science; Steele, J., Thorpe, S., Turekian, K., Eds.; Academia: San Diego, CA, USA, 2001; pp. 2882–2892. [Google Scholar]
  2. Bertin, X.; Bruneau, N.; Breilh, J.; Fortunato, A.B.; Karpytchev, M. Importance of wave age and resonance in storm surges: The case Xynthia, Bay of Biscay. Ocean Model. 2012, 42, 16–30. [Google Scholar]
  3. Turner, A.B.; Colby, J.D.; Csontos, R.M.; Batten, M. Flood modeling using a synthesis of multi-platform LiDAR data. Water 2013, 5, 1533–1560. [Google Scholar]
  4. Forunato, A.B.; Rodrigues, M.; Dias, J.M.; Lopes, C.; Olivera, A. Generating inundation maps for a coastal lagoon: A case study in the Ria de Aveiro (Portugal). Ocean Eng. 2013, 64, 60–71. [Google Scholar] [CrossRef]
  5. Chen, W.B.; Liu, W.C.; Hsu, M.H. Predicting typhoon-induced storm surge tide with a two-dimensional hydrodynamic model and artificial neural network model. Nat. Hazards Earth Sys. Sci. 2012, 12, 3799–3809. [Google Scholar] [CrossRef]
  6. Dietsche, D.; Hagen, S.C.; Bacopoulos, P. Storm surge simulation for Hurricane Hugo (1989): On the significance of inundation areas. J. Waterw. Port Coast. Ocean Eng. 2007, 133, 183–191. [Google Scholar] [CrossRef]
  7. Jones, J.E.; Davis, A.M. Storm surge computations for the west coast of Britain using a finite element model (TELEMAC). Ocean Dynam. 2008, 58, 337–363. [Google Scholar] [CrossRef] [Green Version]
  8. Weisberg, R.H.; Zheng, L. Hurricane storm surge simulations comparing three-dimensional with two-dimensional formulaitons based on an Ivan-like storm over the Tampa Bay, Florida region. J. Geophs. Res. 2008, 113. [Google Scholar] [CrossRef]
  9. Xia, M.; Xia, L.; Pietrafesa, L.J.; Peng, M. A numerical study of storm surge in the Cape Fear River Estuary and adjacent coast. J. Coast. Res. 2008, 24, 159–167. [Google Scholar] [CrossRef]
  10. Rego, J.L.; Li, C. Storm surge propagation in Galveston Bay during Hurricane Ike. J. Mar. Syst. 2010, 82, 265–279. [Google Scholar] [CrossRef]
  11. Xu, H.; Zhang, K.; Shen, J.; Li, Y. Storm surge simulation along U.S. Ease and Gulf Coasts using multi-scale numerical model approach. Ocean Dynam. 2010, 60, 1597–1619. [Google Scholar] [CrossRef]
  12. You, S.H.; Lee, W.J.; Moon, K.S. Comparison of storm surge/tide predictions between a 2-D operational forecast system, the regional tide/storm surge model (RTSM), and the 3-D regional ocean modeling system (ROMS). Ocean Dynam. 2010, 60, 443–459. [Google Scholar] [CrossRef]
  13. Krestenitis, Y.N.; Androulidakis, Y.S.; Kontos, Y.N.; Georgakopoulos, G. Coastal inundation in the north-eastern Mediterranean coastal zone due to storm surge events. J. Coast. Conserv. 2011, 15, 353–368. [Google Scholar] [CrossRef]
  14. Orton, P.; Georgas, N.; Blumberg, A.; Pullen, J. Detailed modeling of recent severe storm tides in estuaries on the New York City region. J. Geophys. Res. 2012, 117. [Google Scholar] [CrossRef]
  15. Sheng, Y.P.; Alymov, V.; Paramygin, V.A. Simulation of storm surge, wave, and inundation in the Outer Banks and Chesapeake Bay during Hurricane Isabel in 2003: The importance of waves. J. Geophy. Res. 2010, 115. [Google Scholar] [CrossRef]
  16. Vested, H.J.; Jensen, H.R.; Petersen, H.M.; Jorgensen, A.; Machenhauer, B. An operational hydrographic warning system for the North Sea and Danish Belts. Cont. Shelf Res. 1992, 12, 65–81. [Google Scholar] [CrossRef]
  17. Li, Y.S.; Zhang, M.Y. Dynamic coupling of wave and surge models by Eulerian-Lagrangian method. J. Waterw. Port Coast. Ocean Eng. 1997, 123, 1–7. [Google Scholar] [CrossRef]
  18. Shen, J.; Zhang, K.; Xiao, C.; Gong, W. Improved prediction of storm surge inundation with a high-resolution unstructured grid model. J. Coast. Res. 2006, 22, 1309–1319. [Google Scholar] [CrossRef]
  19. Peng, M.; Xie, L.; Pietrafesa, L.J. A numerical study of storm surge and inundation in the Croatan-Albemarle-Pamlico Estuary System. Estuar. Coast. Shelf Sci. 2004, 59, 121–137. [Google Scholar] [CrossRef]
  20. Xie, L.; Kiu, H.; Liu, B.; Bao, S. A numerical study of the effect of hurricane wind asymmetry on storm surge and inundation. Ocean Model. 2011, 36, 71–79. [Google Scholar] [CrossRef]
  21. Lewis, M.; Bates, P.; Horsburgh, K.; Neal, J.; Schumann, G. A storm surge inundation model of the northern Bay of Bengal using publicly available data. Quart. J. Roy. Meteor. Soc. 2013, 139, 358–369. [Google Scholar] [CrossRef]
  22. Dyer, K.R. Estuaries: A Physical Introduction; Wiley: New York, NY, USA, 1997. [Google Scholar]
  23. Hong, E.; Huang, T.C.; Yu, H.S. Morphology and dynamic sedimentology in front or the retreating Tsengwen Delta, Southwestern Taiwan. Terre. Atmos. Ocean. Sci. 2004, 15, 565–587. [Google Scholar]
  24. Zhang, Y.L.; Baptista, A.M. SELFE: A semi-implicit Eulerian-Lagrangian finite-element model for cross-scale ocean circulation. Ocean Model. 2008, 21, 71–96. [Google Scholar] [CrossRef]
  25. Large, W.G.; Pond, S. Open ocean momentum flux measurements in moderate to strong winds. J. Phys. Oceanogr. 1981, 11, 324–336. [Google Scholar] [CrossRef]
  26. Powell, M.D.; Vickery, P.J.; Reinhold, T.A. Reduced drag coefficient for high wind speeds in tropical cyclones. Nature 2003, 422, 279–283. [Google Scholar] [CrossRef] [PubMed]
  27. Holland, G.J. An analytical model of the wind and pressure profiles in hurricanes. Mon. Weather Rev. 1980, 108, 1212–1218. [Google Scholar] [CrossRef]
  28. Hubbert, G.D.; Holland, G.J.; Leslie, L.M.; Manton, M.J. A real-time system for forecasting tropical cyclone storm surges. Weather Forecast. 1991, 6, 86–97. [Google Scholar] [CrossRef]
  29. Medeiros, S.C.; Hagen, S.C. Review of wetting and drying algorithms for numerical tidal flow models. Int. J. Numer. Method. Fluid. 2012, 71, 473–487. [Google Scholar] [CrossRef]
  30. Zu, T.; Gana, J.; Erofeevac, S.Y. Numerical study of the tide and tidal dynamics in the South China Sea. Deep Sea Res. I Ocean. Res. Pap. 2008, 55, 137–154. [Google Scholar] [CrossRef]
  31. Water Resources Agency. The Analysis of Storm Rainfall and River Discharge during the Typhoon Morakot in 2009; Technical Report; Water Resources Agency: Taipei, Taiwan, 2009. [Google Scholar]
  32. Condon, A.J.; Sheng, Y.P. Evaluation of coastal inundation hazard for present and future climates. Nat. Hazards 2012, 62, 345–373. [Google Scholar] [CrossRef]

