Article

Inter-Event Time Definition Setting Procedure for Urban Drainage Systems

1
Division of Architecture, Civil & Landscape, Jeonbuk Science College, Jeongeupsaro, Jeongeup 580-712, Korea
2
Department of Civil Engineering, Hanbat National University, San 16-1, Duckmyoung-dong, Yuseong-gu, Daejeon 305-719, Korea
3
School of Civil, Environmental and Architectural Engineering, Korea University, Anam-dong Seongbuk-Gu, Seoul 136-713, Korea
4
Department of Civil Engineering, Seoul National University of Science and Technology, 172 Gongreung 2-dong, Nowon-Gu, Seoul 139-743, Korea
5
Department of Civil Engineering, Dongseo University, San 69-1, Churye 2-dong, Sasang-gu, Pusan 617-716, Korea
*
Author to whom correspondence should be addressed.
Water 2014, 6(1), 45-58; https://doi.org/10.3390/w6010045
Submission received: 10 October 2013 / Revised: 4 November 2013 / Accepted: 16 December 2013 / Published: 27 December 2013
(This article belongs to the Special Issue Flood Estimation and Analysis in a Variable and Changing Environment)

Abstract

:
Traditional inter-event time definition (IETD) estimate methodologies generally take into account only rainfall characteristics and not drainage basin characteristics. Therefore, they may not succeed in providing an appropriate value of IETD for any sort of application to the design of urban drainage system devices. To overcome this limitation, this study presents a method of IETD determination that considers basin characteristics. The suggested definition of IETD is the time period from the end of a rainfall event to the end of a direct runoff. The suggested method can identify the independent events that are suitable for the statistical analysis of the recorded rainfall. Using the suggested IETD, the IETD of the Joong-Rang drainage system was determined and the area-IETD relation curve was drawn. The resulting regression curve can be used to determinate the IETD of ungauged urban drainage systems, with areas ranging between 40 and 4400 ha. Using the regression curve, the IETDs and time distribution of the design rainfall for four drainage systems in Korea were determined and rainfall-runoff simulations were performed with the Storm Water Management Model (SWMM). The results were compared with those from Huff's method which assumed a six-hour IETD. The peak flow rates obtained by the suggested method were 11%~15% greater than those obtained by Huff’s method. The suggested IETD determination method can identify independent events that are suitable for the statistical analysis of the recorded rainfall aimed at the design of urban drainage system devices.

1. Introduction

Real rainfall events have several characteristics such as rainfall volume, duration, average intensity, inter-event time (IET), peak intensity, and number of peaks. These characteristics are utilized in the analysis and design of hydraulic structures through some statistical procedures. For example, the statistics of the rainfall events are indispensable in the research on the parameter estimation of rainfall generation models, the analytical design of urban sewer networks or storage reservoirs, and the urban nonpoint source pollutant estimation by event mean concentration [1,2,3,4,5]. To obtain useful statistical characteristics from real rainfall data, independent events are identified from the observed data. However, it is difficult to identify the independent rainfall events from rainfall records, which are made up of sequential pulses. A typical criterion is an IET definition (IETD), which is the minimum dry period between two rainfall pulses. An erroneous identification of the events may cause invalid statistical results, leading to flawed design and analysis. Adams et al. [6] showed how the statistics of the rainfall event characteristics (volume, intensity, duration, and IET) were varied by the various IETDs. The several proposed methods offering a suitable determination of the IETD can be largely divided into three types: those using the autocorrelation coefficient of the rainfall pulses to determine the IETD [7,8,9], those using the variation of the average annual number of rainfall events according to variable IETs [10,11], and those using the coefficient of variation of IETs. For the last type, Restrepo-Posada and Eagleson [12] showed that a probability density function (pdf) of the IETs was represented by an exponential distribution. Based on the results, they determined the IETD which produced a coefficient of IET variation of one. However, IETD determination should be governed by the characteristics of the basins or purpose of the application [13,14,15].
In general, a shorter IETD is more appropriate for small catchments with small storage reservoirs and quick response times, while a longer IETD is more appropriate for large basins [16]. However, only meteorological characteristics are utilized to determine the IETD in the three traditional methods not considering the basin characteristics. This paper suggests an IETD determination methodology that also considers the characteristics of the urban drainage systems.

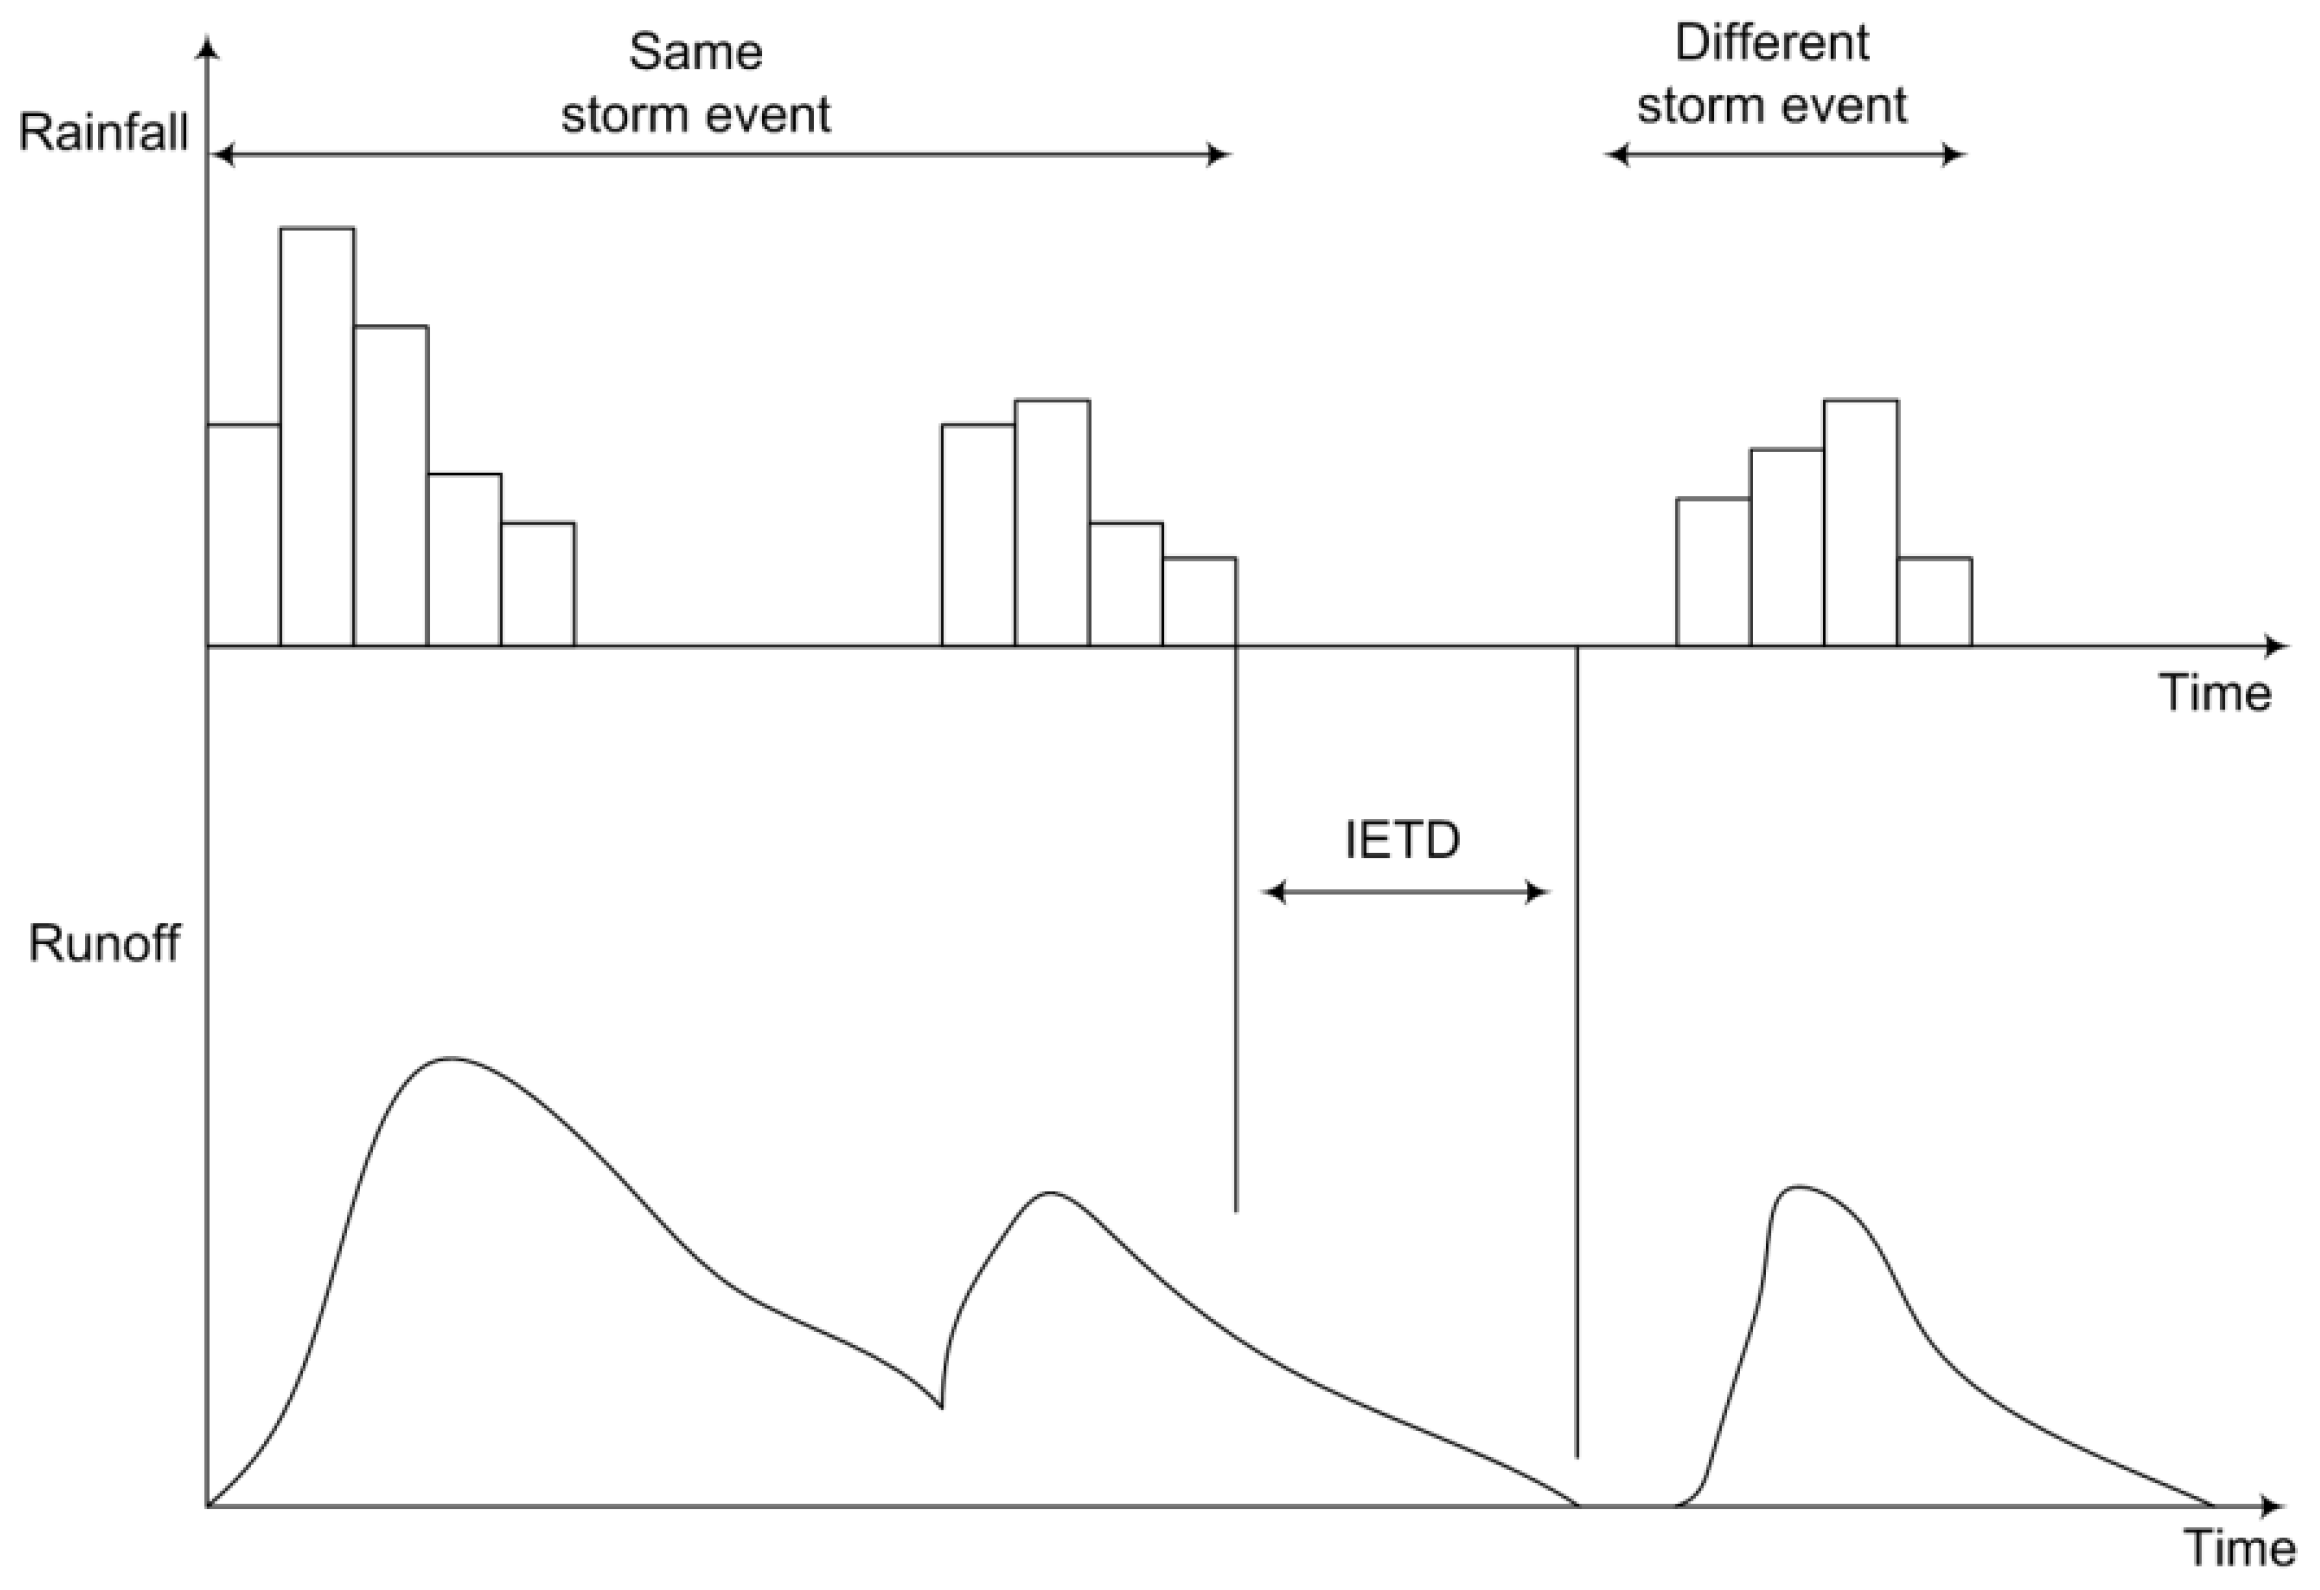
2. IETD Determination in Urban Drainage Systems

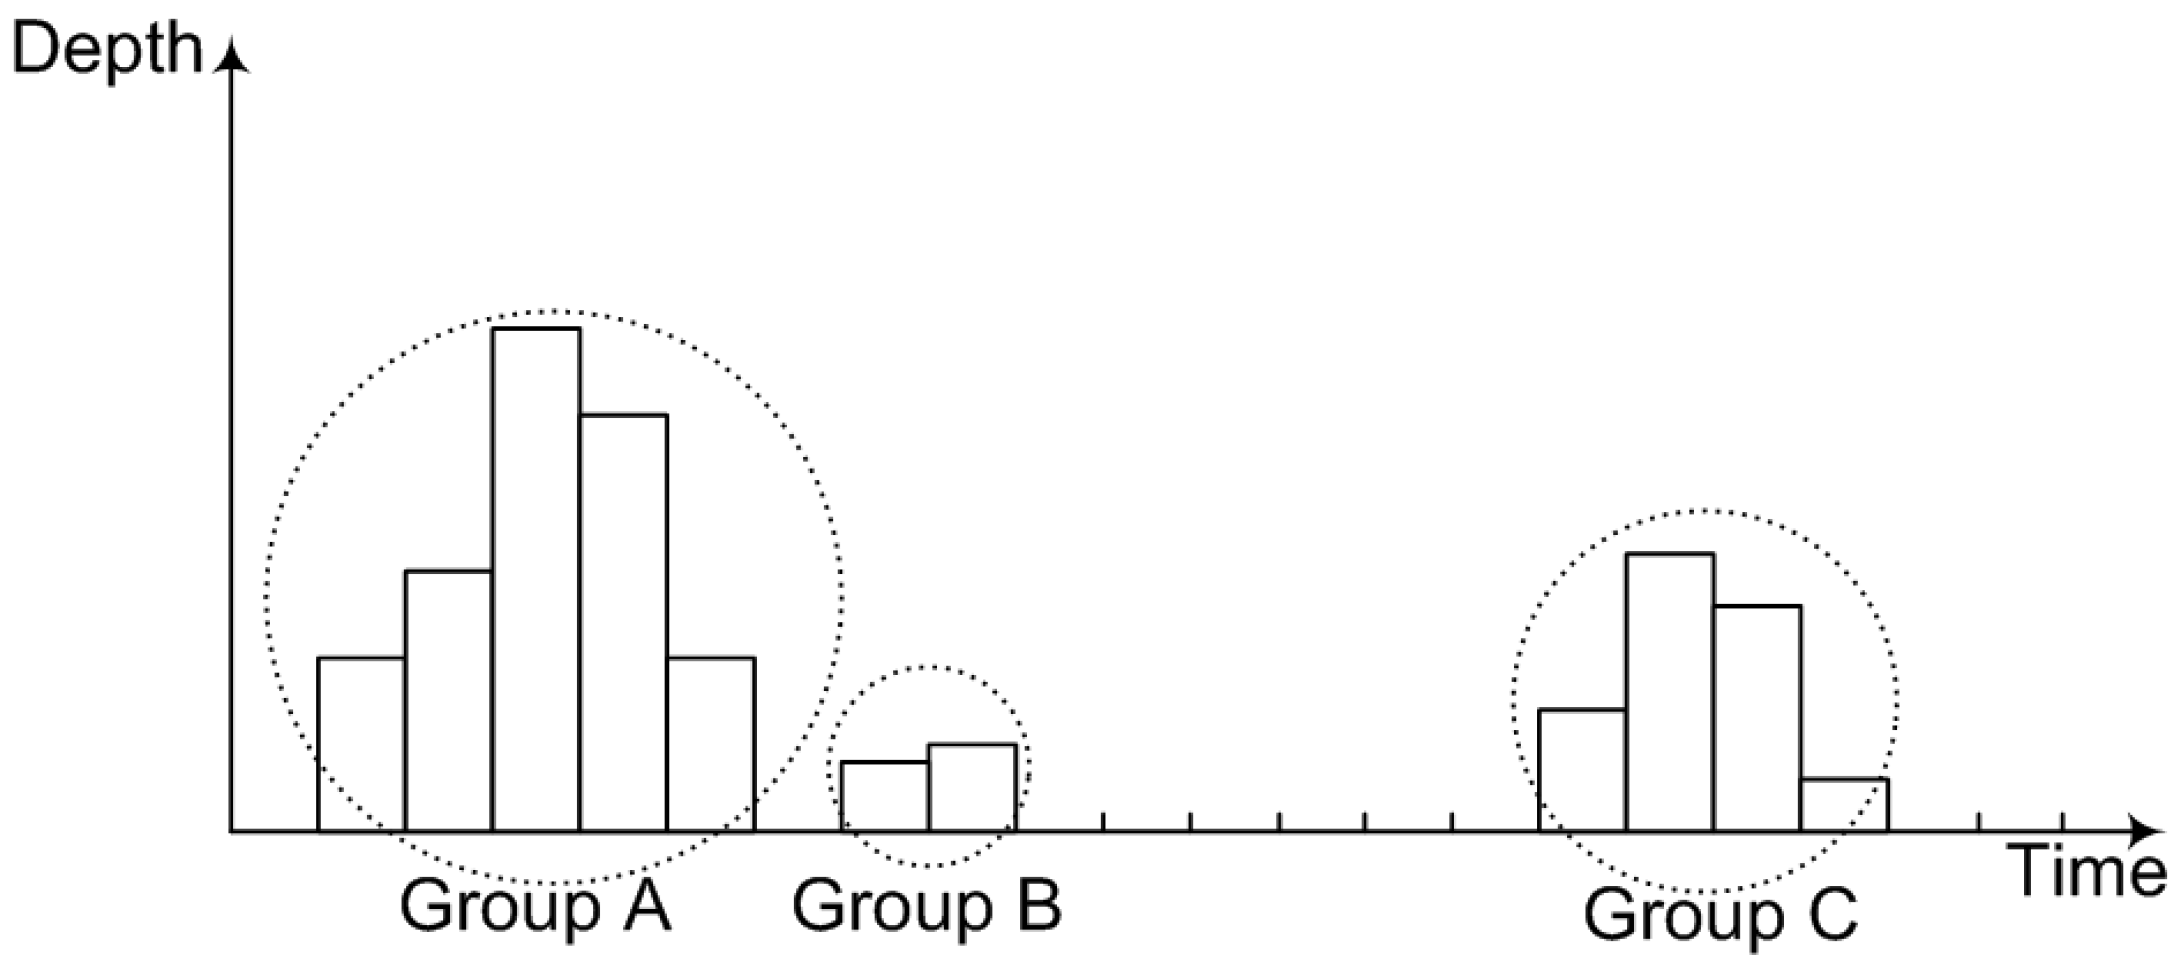
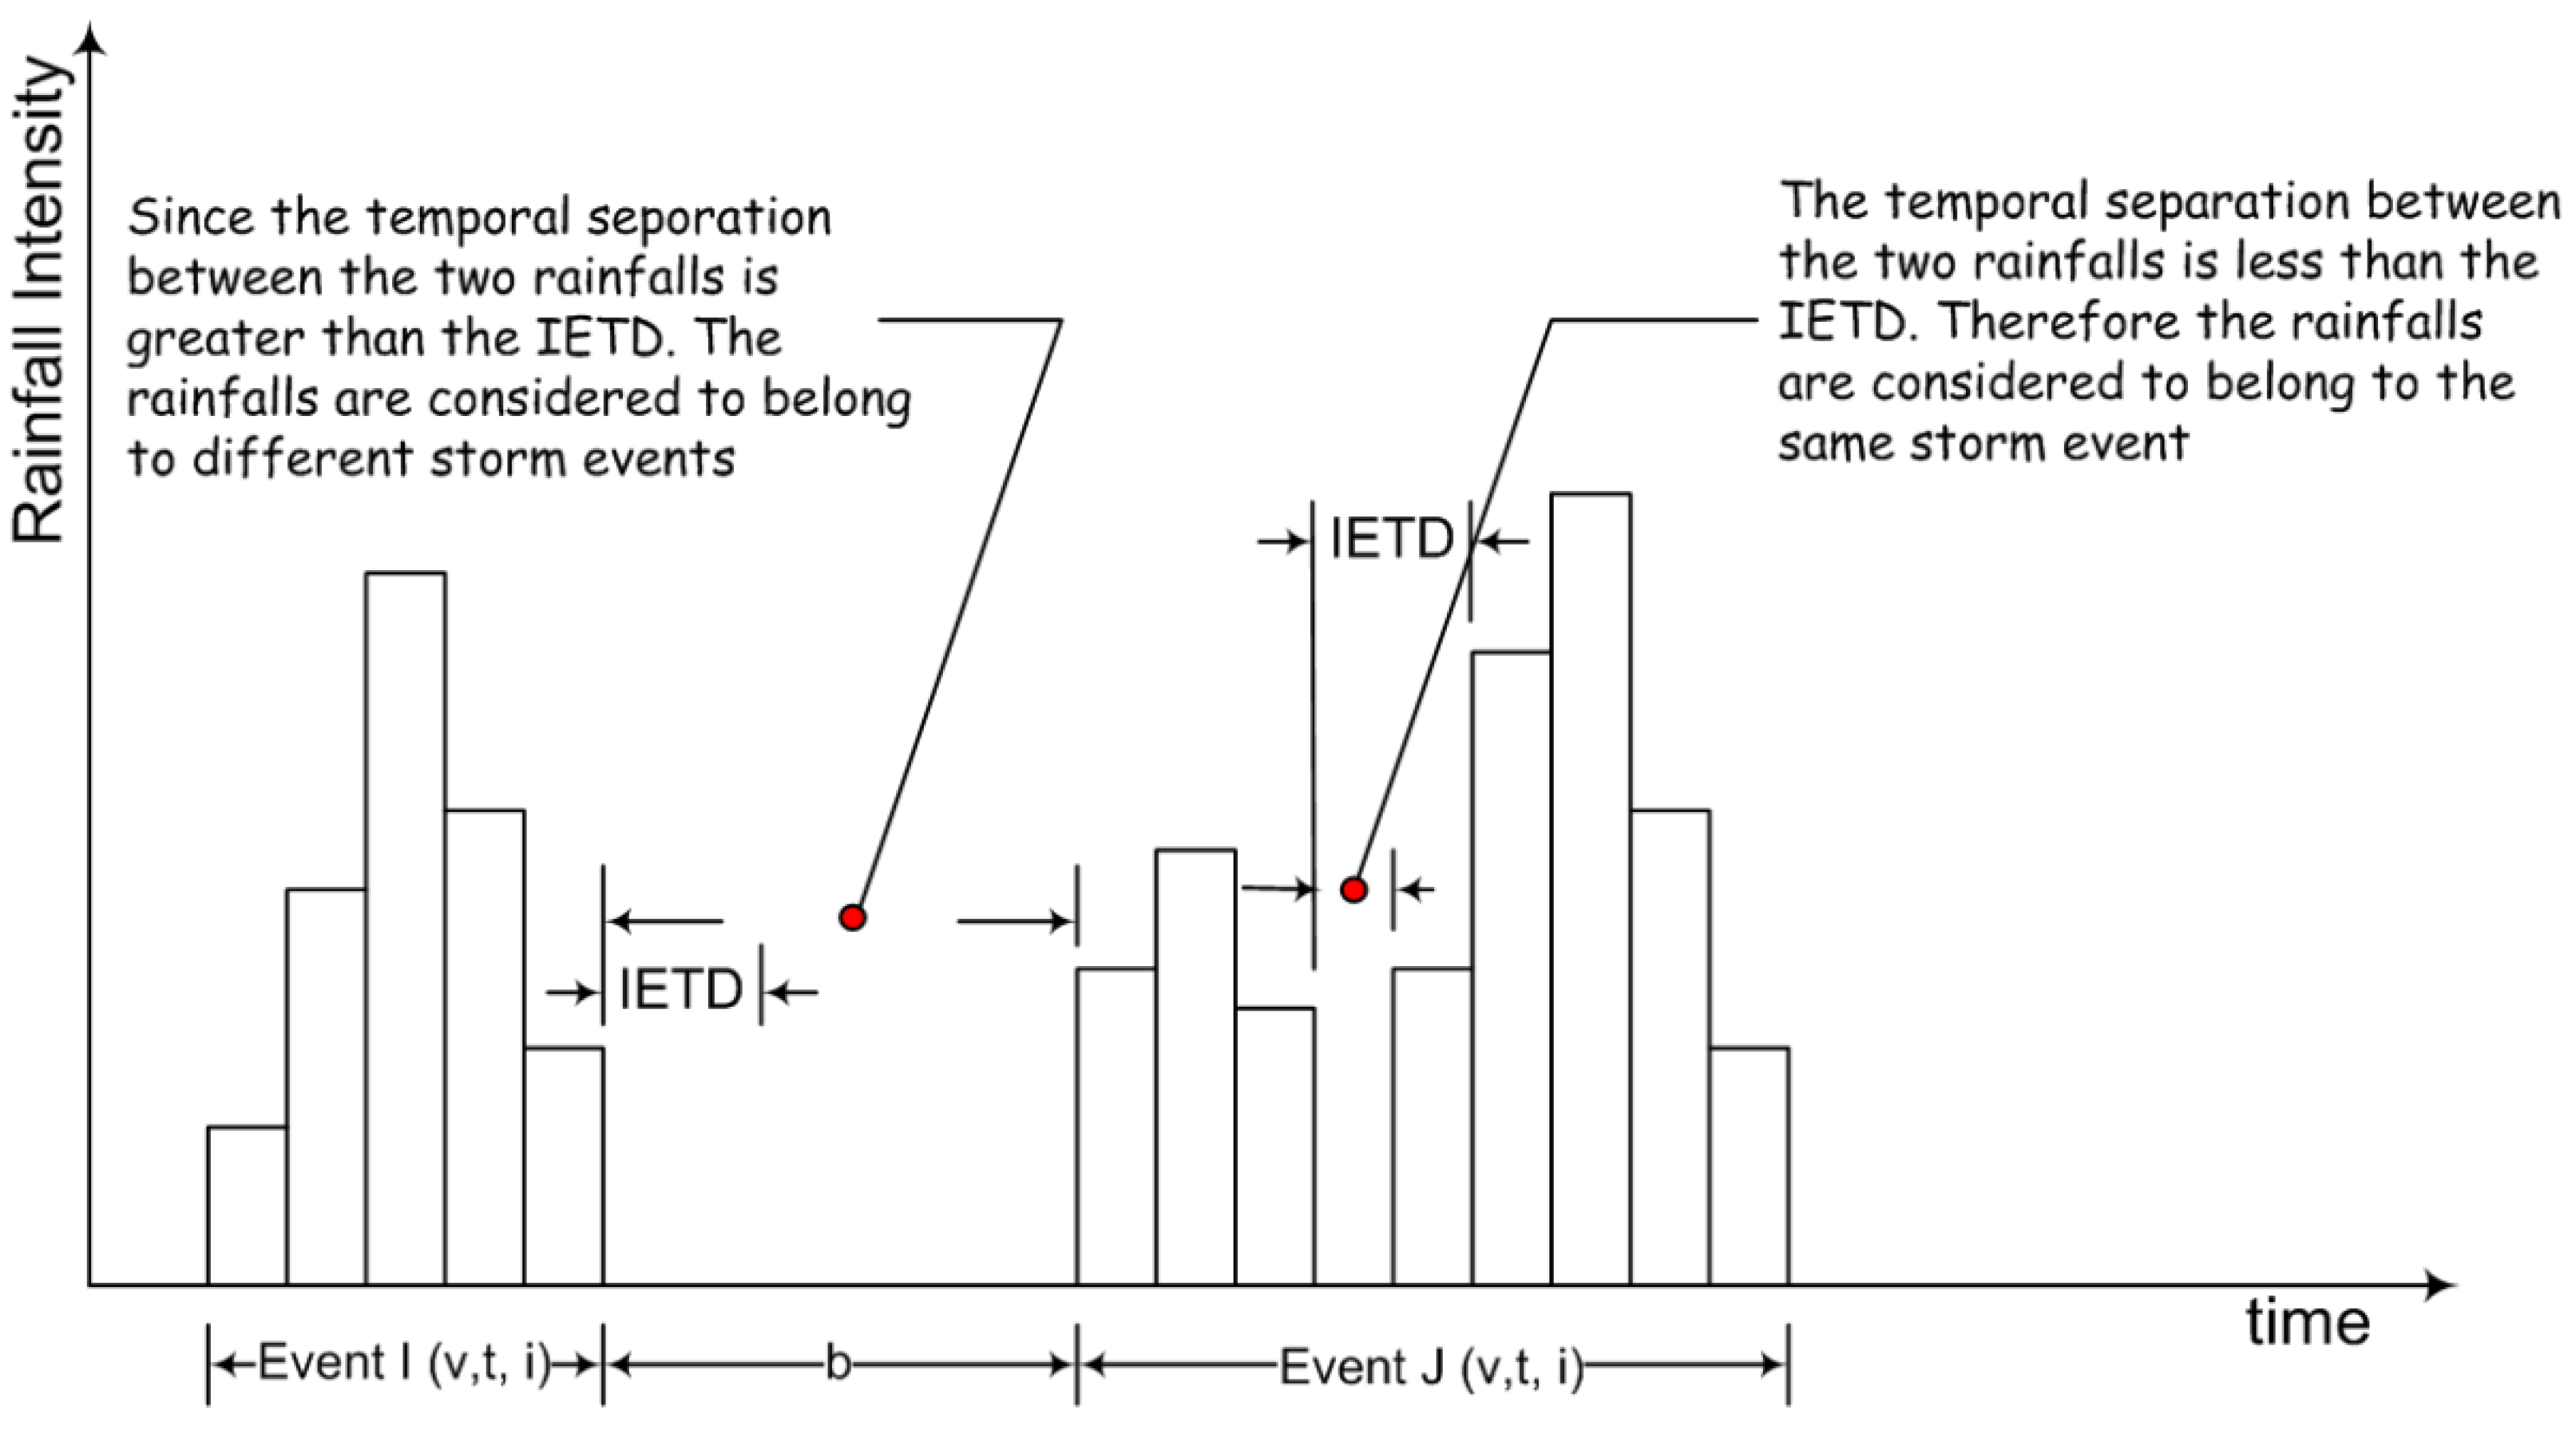
2.1. Traditional IETD Determination Methods

Precipitation consists of many water drops and the synthesis of several drops is recorded with a pulse. A series of recorded pulses can be identified into independent groups on the basis of homogeneity and it is an independent event which is utilized in the statistical analysis of rainfall. Separating independent events from continuously recorded data may rely on subjective interpretation. For example, in Figure 1, groups A and B together can be considered to be an event and group C to be another. On the other hand, groups A, B and C, all together, may belong to one event, or each group can be considered to be an independent one. Therefore, a criterion for identifying independent events from the recorded data can be useful in statistical hydrologic data analyses. The IETD is defined as the minimum dry period between two independent events. If the IET between two rainfall pulses is longer than the IETD, as shown in left-hand corner of the Figure 2, the two groups are considered as two independent events. Otherwise, as shown in right side of the Figure 2, the two groups are considered as one independent rainfall event [15]. Therefore, the present study focuses on how to determine the IETD.
Figure 1. Observed rainfall records which are made up of sequential pulses.
Water 06 00045 g001
Figure 2. Separation of independent rainfall event using IETD [16].
Water 06 00045 g002
Three methods have been used to determine the IETD: autocorrelation analysis, average annual number of events analysis, and coefficient of variation analysis. In the first, IETD is defined as the lag time where the autocorrelation coefficient of rain pulses converges to zero. This method is based on the statistical independence of rain pulses, not rain events. As the IETD increases, the average annual number of events decreases. In the second, the appropriate IETD is determined as the point where increasing IETD does not change the number of rainfall events significantly [15]. This method is very subjective and there is no physical relation between IETD and the average annual number of events. In the third, IETD is determined as the IET whose coefficient of variation equal to unity based on the assumption that the pdf of IETs is represented by an exponential distribution.
Moreover, the three methods produce a wide range of IETD values for the same rainfall data. Figure 3 shows a set of graphs for the three methods of IETD determination at Seoul, Korea. Hourly rainfall data from a 42-year period from 1961 to 2002 were utilized in the analysis. As shown in Figure 3a, even if the individual variation in subjective interpretation is considered, the IETD can be determined to be between 15 and 20 h by autocorrelation analysis. In the analysis of the average annual number of rainfall events (Figure 3b), IETD can be determined as five to 10 h. In the coefficient of variation analysis (Figure 3c), the IETD is determined as 10 h. These results demonstrate the wide variation in the determined IETDs.
Only meteorological characteristics are considered for determining the IETDs in the three traditional methods and the basin characteristics are not considered. The IETD is governed by the basin characteristics and IETD values between one and six hours are suggested for most urban areas. The IETDs determined by traditional methods were largely estimated in Seoul, Korea, which was an overcrowded city, as shown in Figure 3. In the classic urban catchments and rural basins in Korea, the IETDs were determined by the coefficient of variation analysis. Table 1 reveals that the considered methods cannot reflect the urbanization degree and the IETDs in the all urban catchments were more than 10 h. The existing IETD determination methods are not suitable for the urban catchments, although they remain useful for the rural basins.
Figure 3. IETD determination at Seoul, Korea. (a) Autocorrelation analysis; (b) Average annual number of rainfall event analysis; (c) Coefficient of variation analysis.
Water 06 00045 g003
Table 1. IETD comparison between urban and rural basins.
Basin typeCityObservation periodPopulation density (person/km2)IETD by coefficient of variation (h)
Urban catchmentSeoul1961–200216,22110
Busan1961–20004,609.415
Daegu1961–20002,786.512
Daejeon1969–20002,673.012
Rural basinSokcho1968–2000803.813
Jinju1969–2000465.312
Jeongeup1973–2000187.512
Buyeo1973–2000134.011
Cheorwon1988–200053.714
Hongcheon1973–200035.511

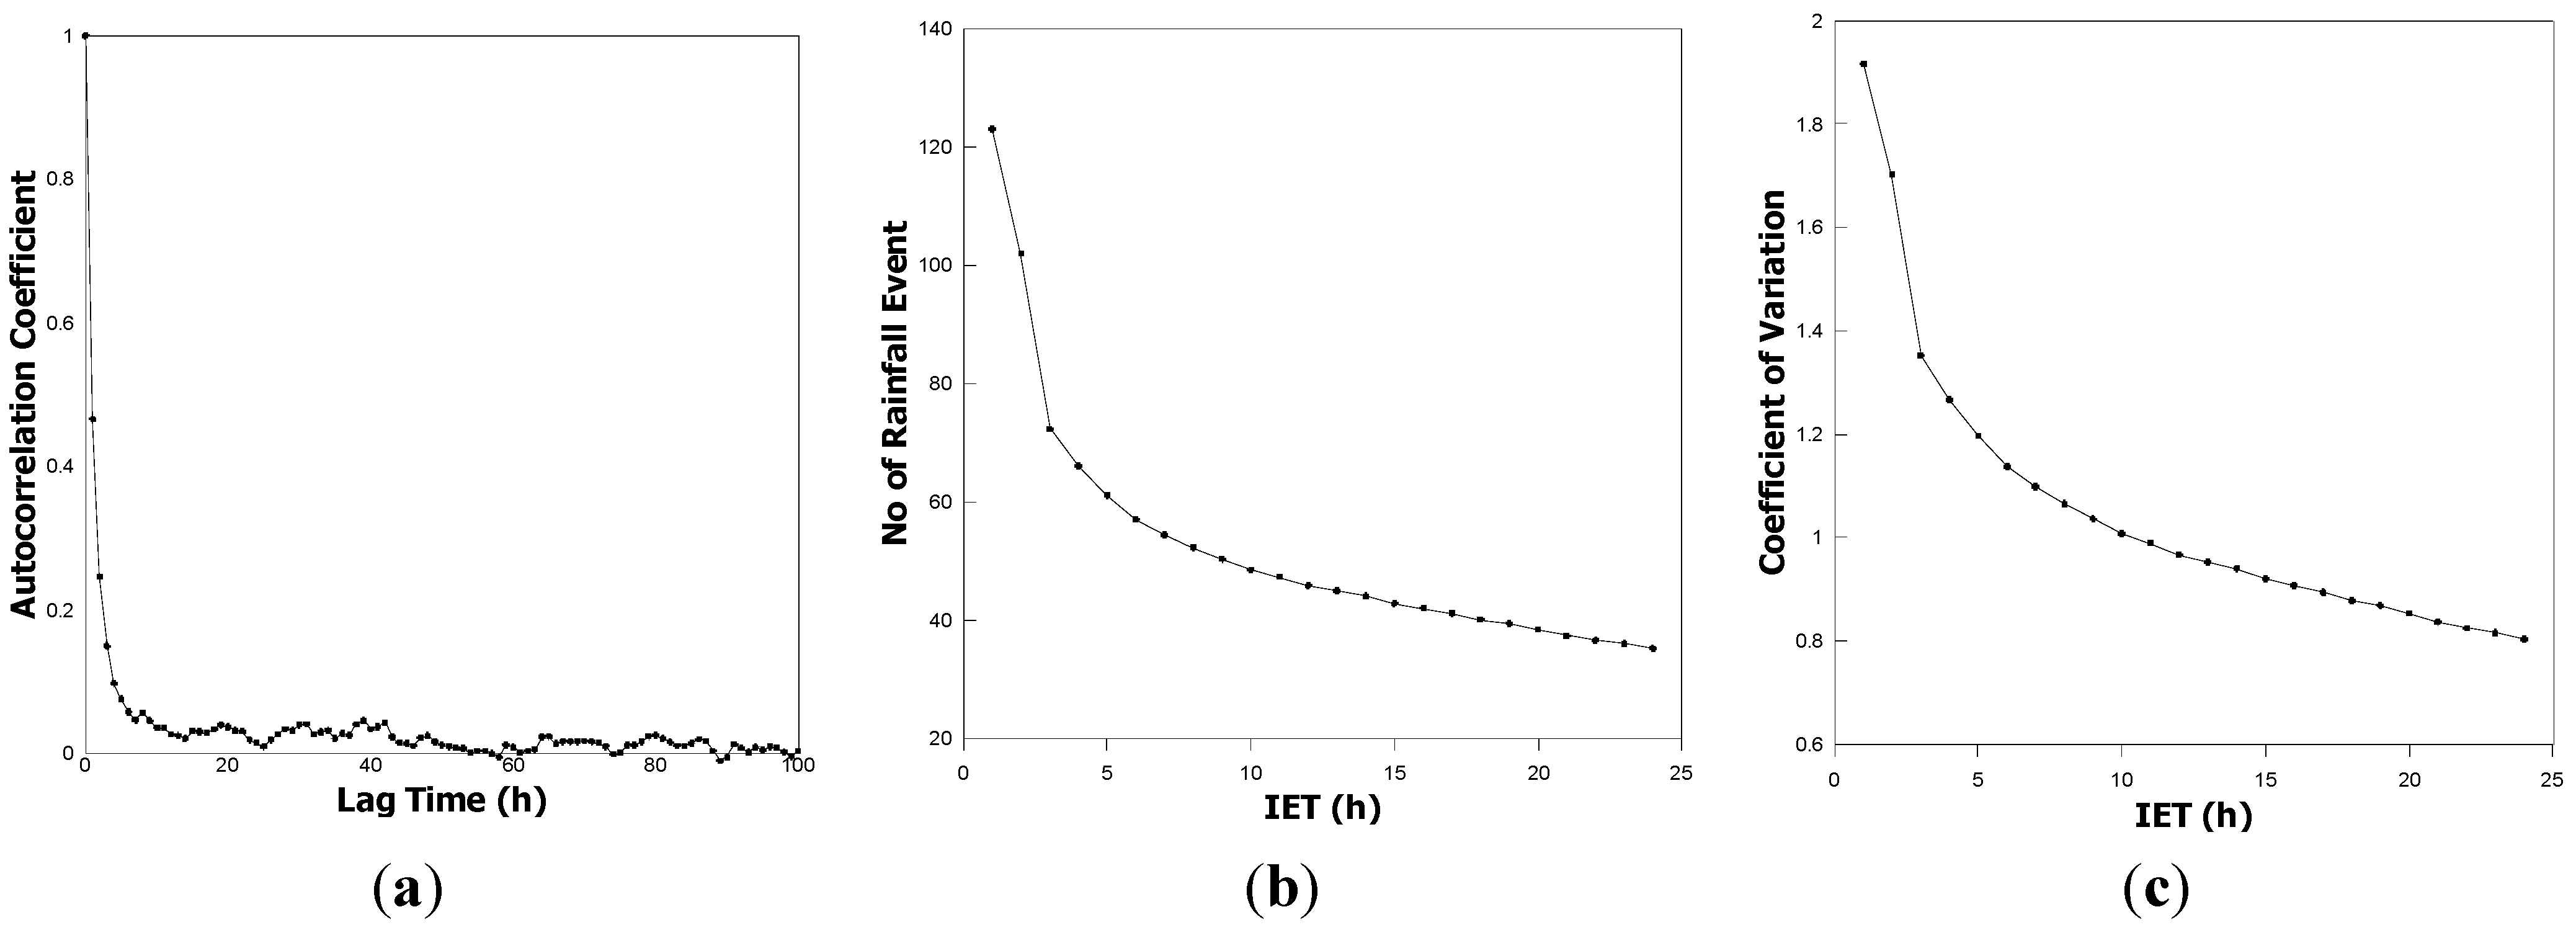
2.2. Development of an IETD Determination Method for Urban Watersheds

Urban drainage systems generally have small areas, high imperviousness, and dense sewer networks. About 68% of pumping stations in Seoul have basin areas smaller than 200 ha and only 14% have areas larger than 500 ha, as shown in Figure 4. In these urban drainage systems with short times of concentration, runoff rates increase drastically and end rapidly during the rainfall event, which weakens the relation between the runoff characteristics of two neighboring events. Based on these runoff properties, this study proposes a new IETD determination method.
Figure 4. Basin areas of pumping stations in Seoul.
Water 06 00045 g004
The IETD is a criterion for classifying an independent event from continuous rainfall record. In other words, the IETD is determined by the presence or absence of any relationship between neighboring events. When the runoff from antecedent precipitation does not have a significant impact on the runoff from later precipitation, i.e., the runoff hydrographs from the two rainfall events do not superimpose, the two events should be identified as independent rainfall events. On the contrary, if the start of the later runoff occurs before the end of the antecedent runoff, then the two rainfall pulses can be considered to comprise one independent event. Figure 5 shows the new concept of IETD considering the runoff characteristics of urban watersheds. Under this hypothesis, IETD can be defined as the minimum time period in which the antecedent runoff does not influence the runoff by the later precipitation. That is, IETD is determined as the time period from the end of the rainfall event to the end of the direct runoff.
Figure 5. Definition of IETD considering runoff characteristics.
Water 06 00045 g005

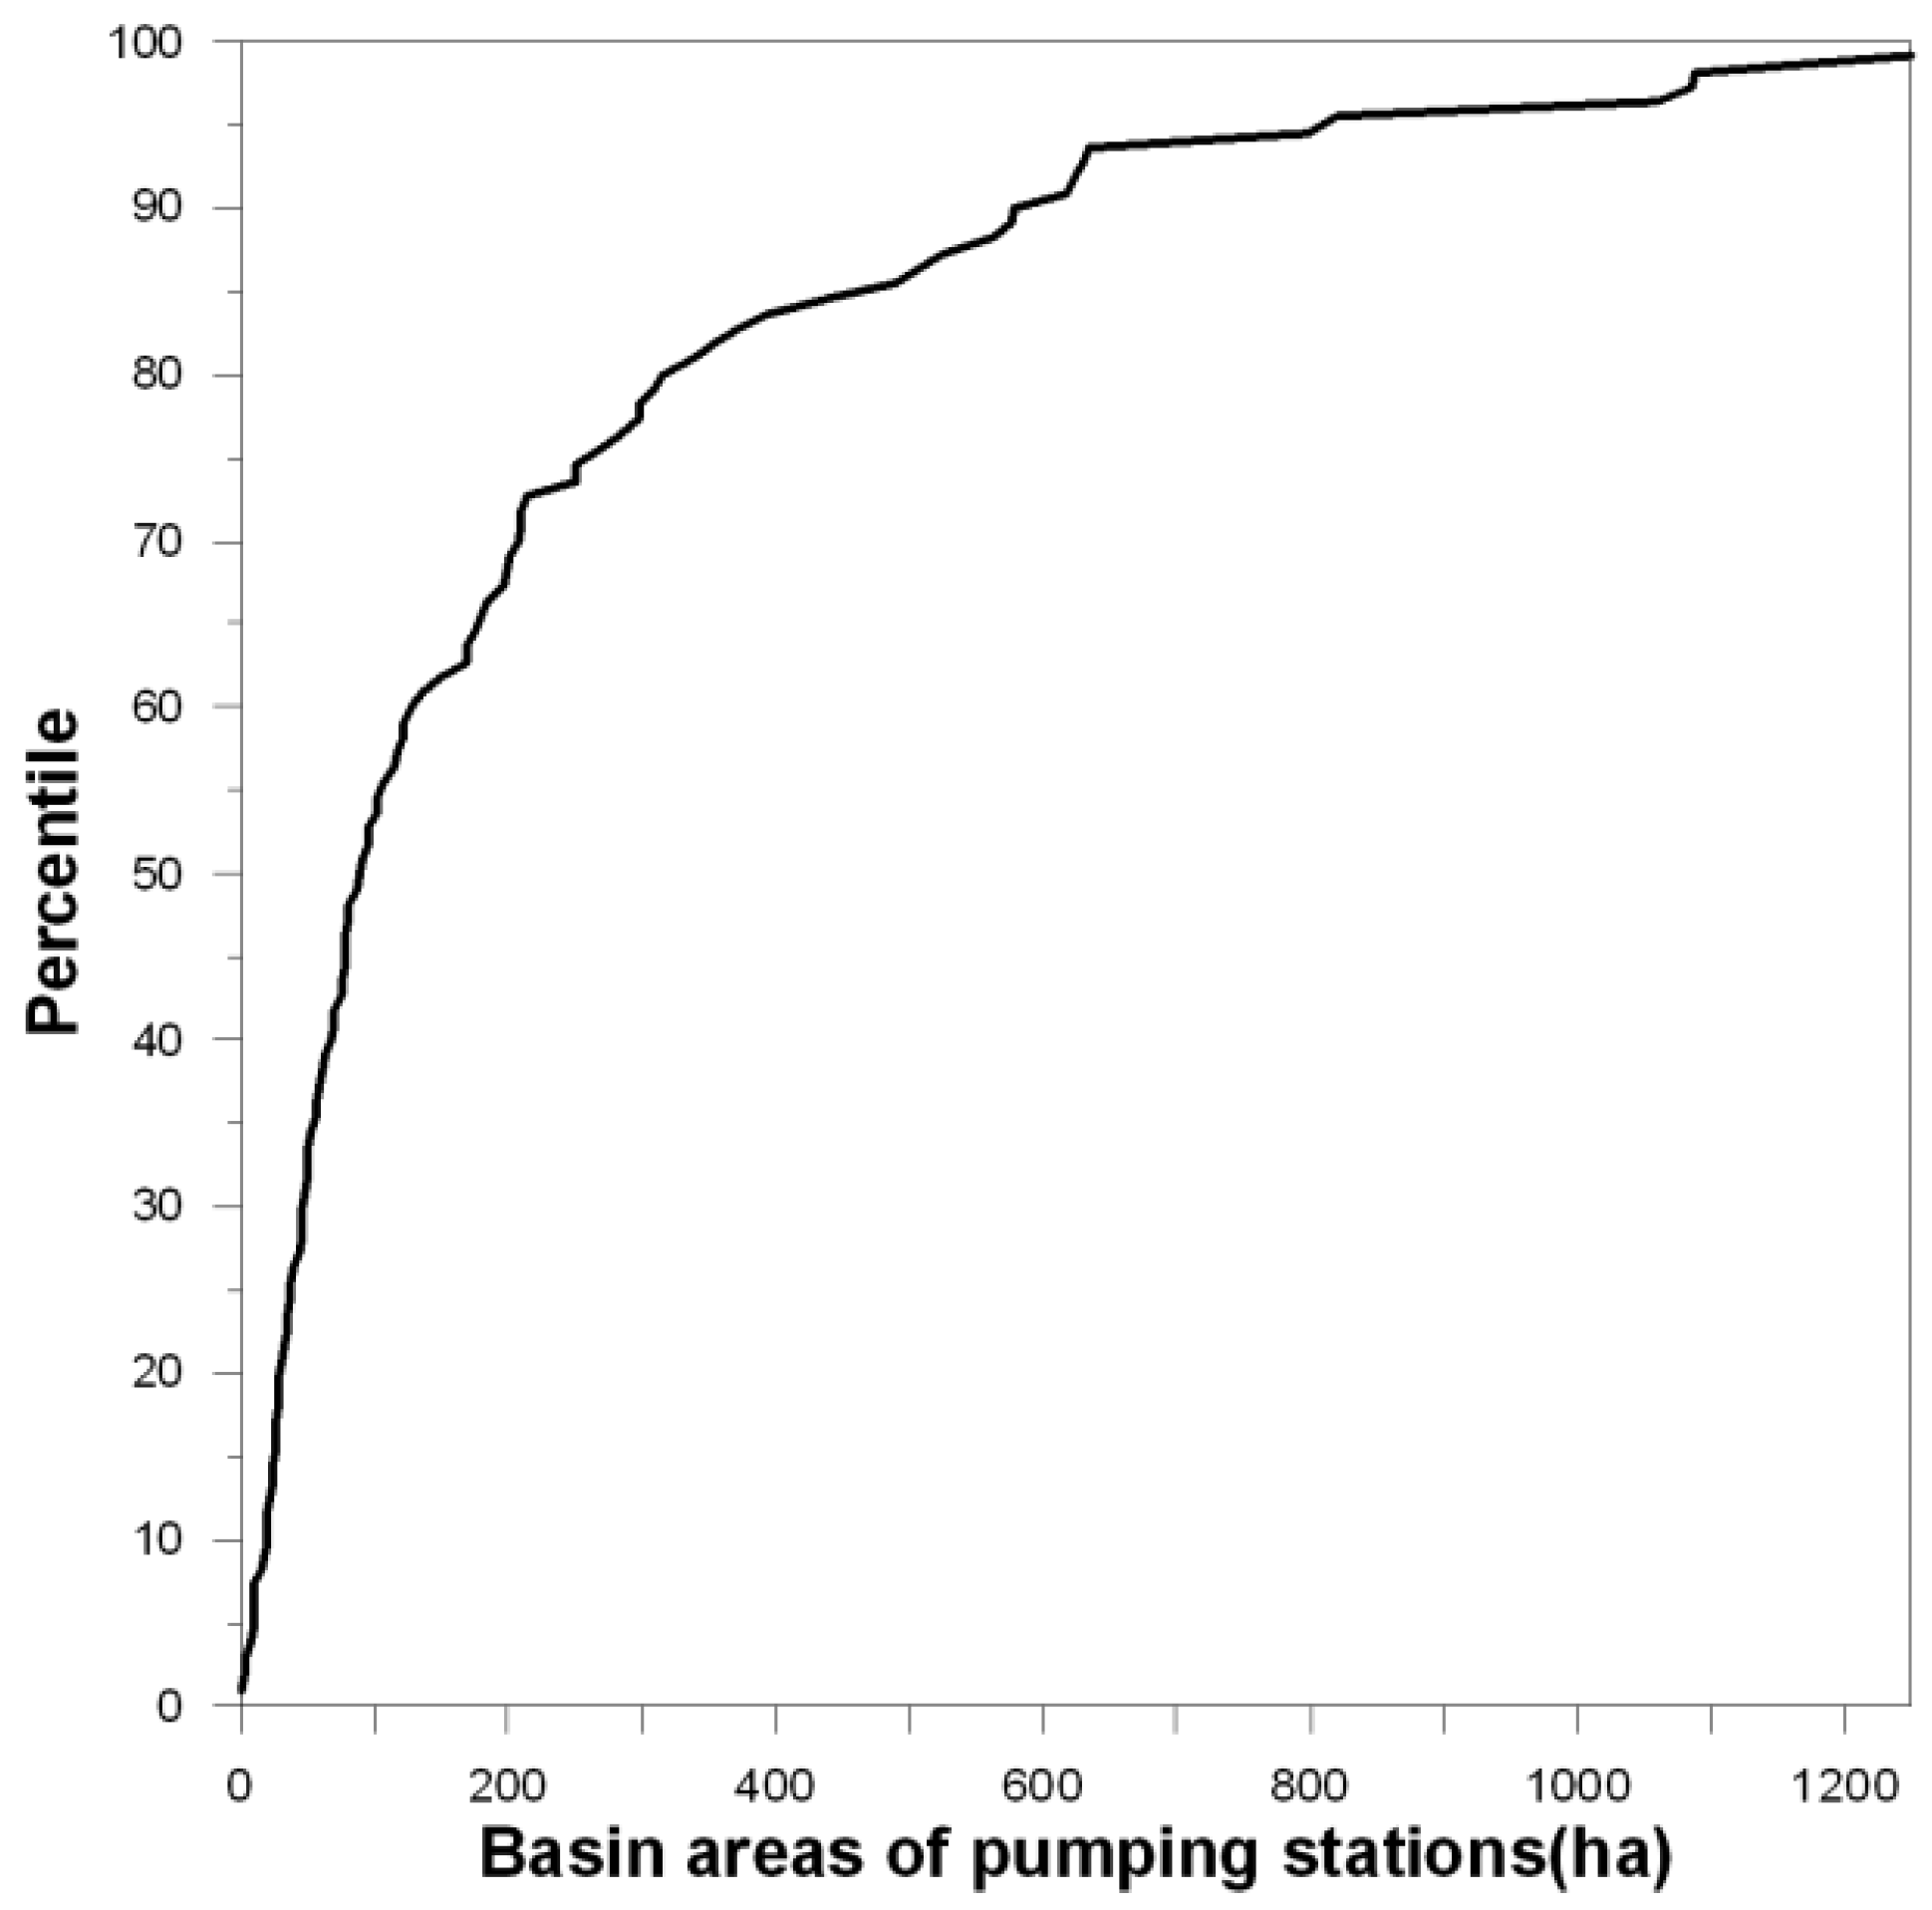
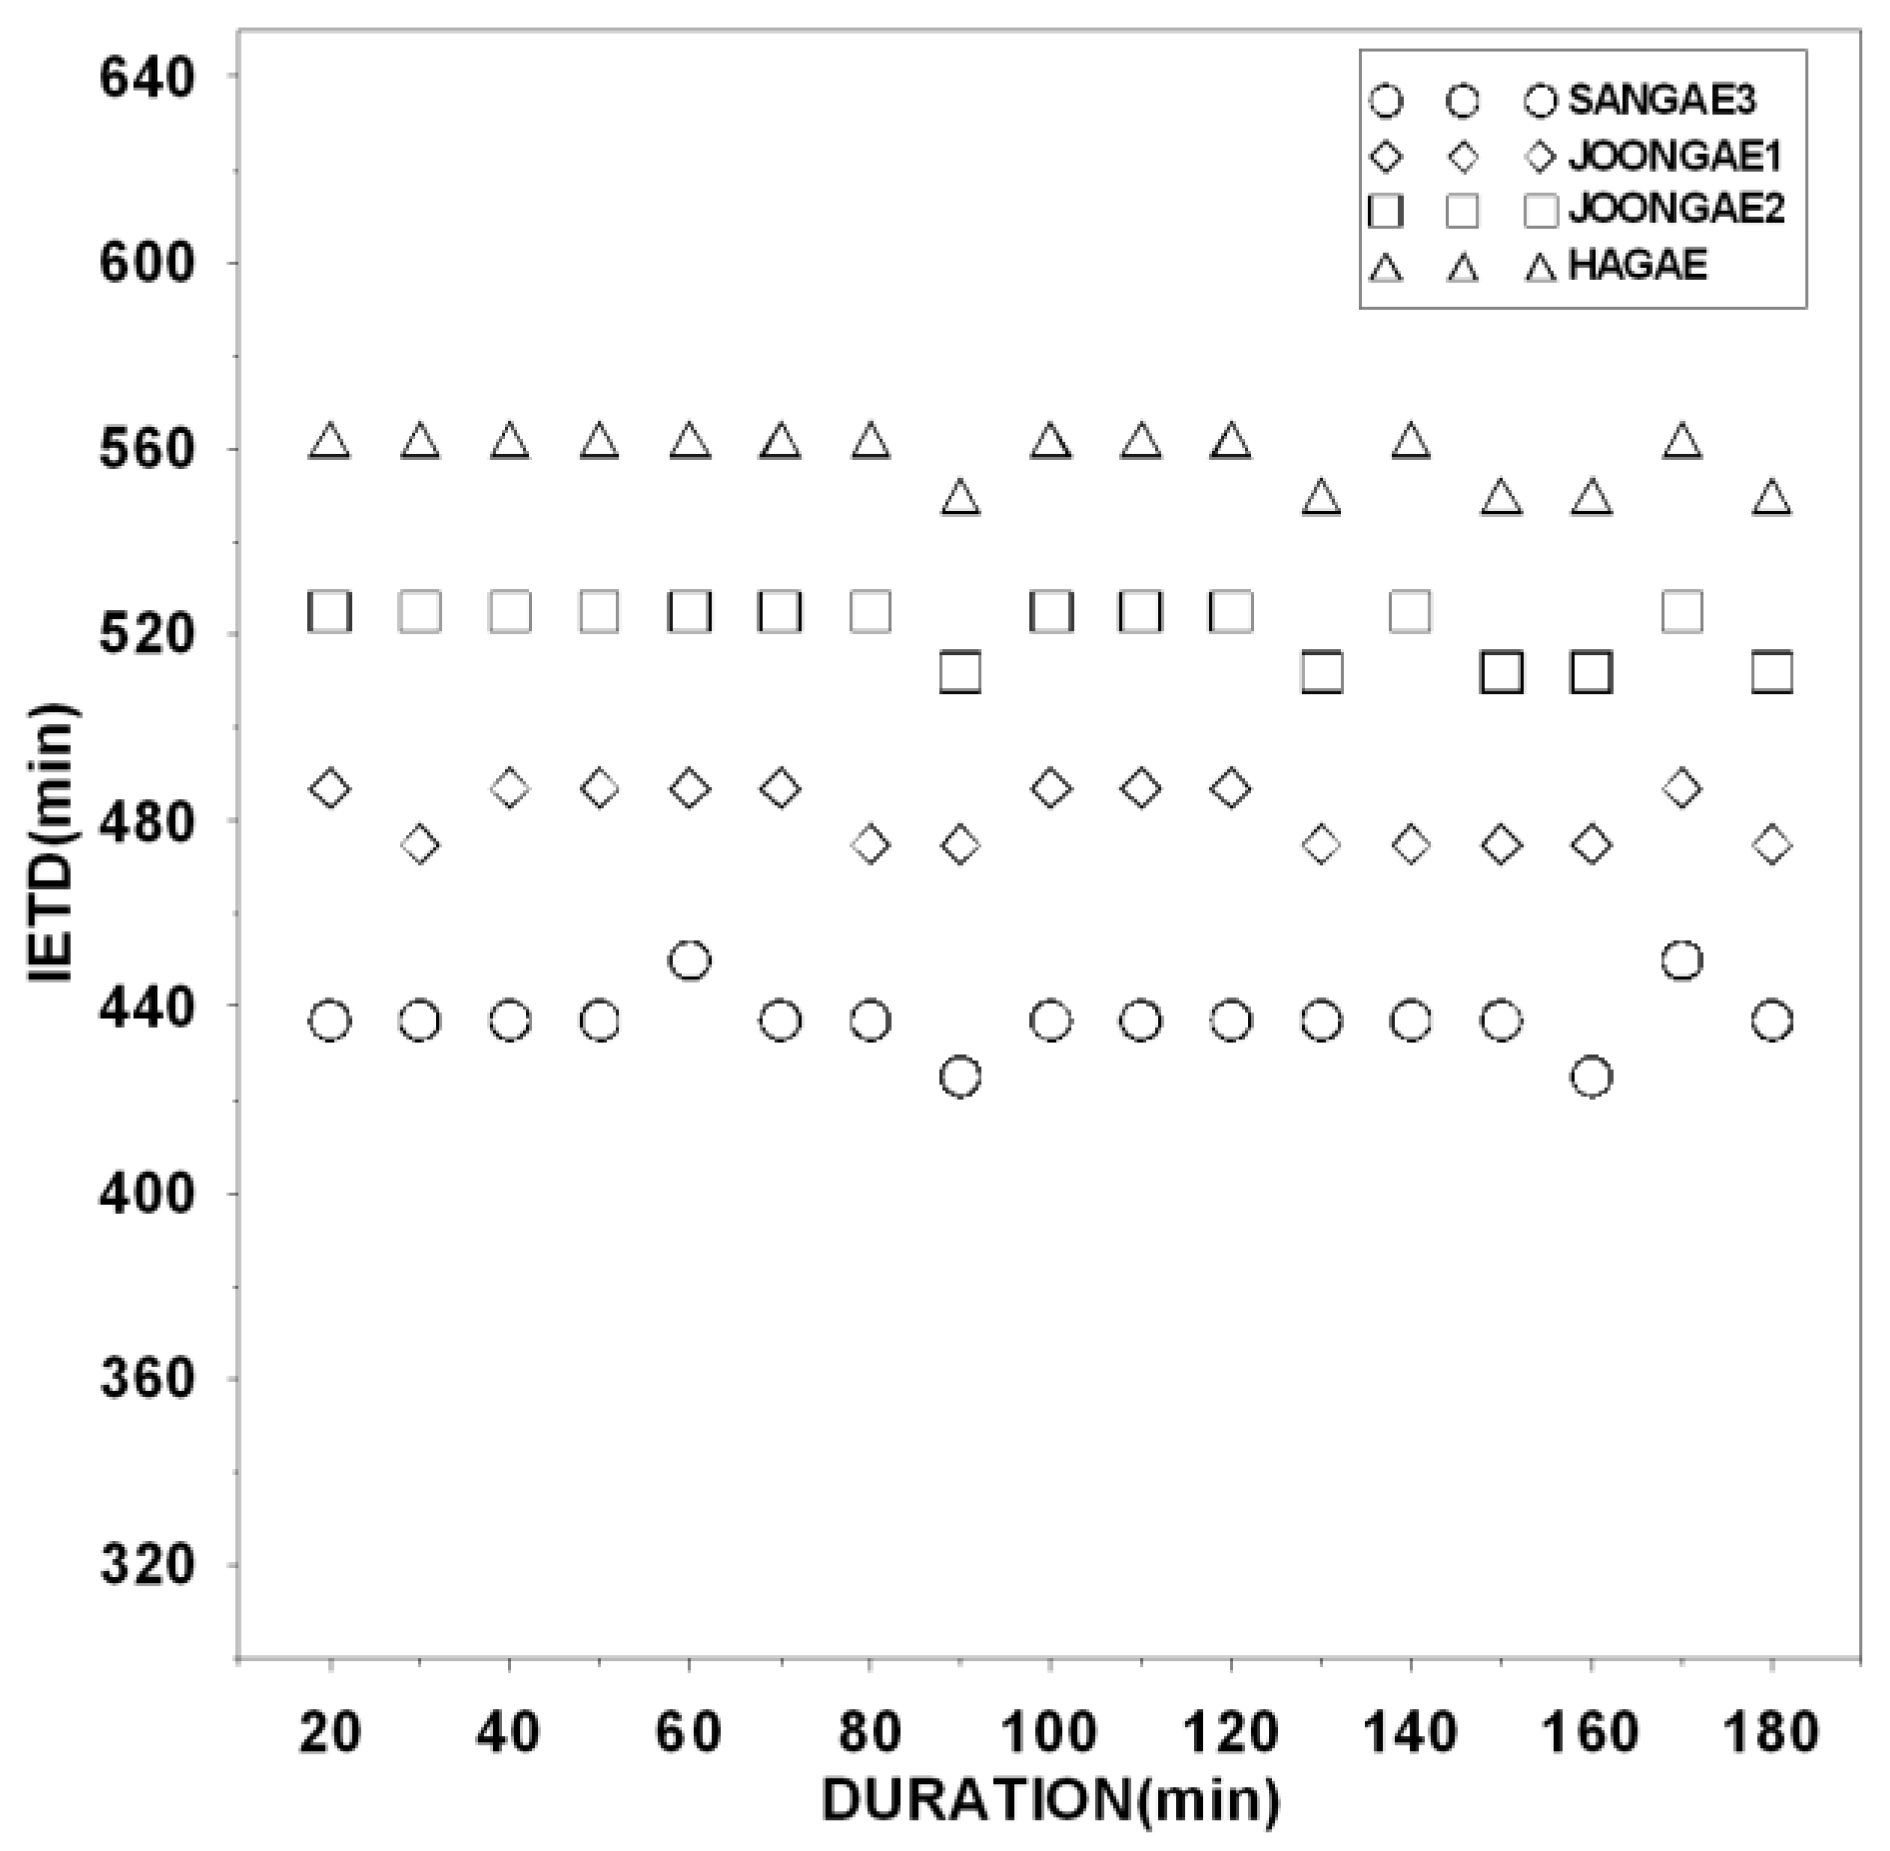
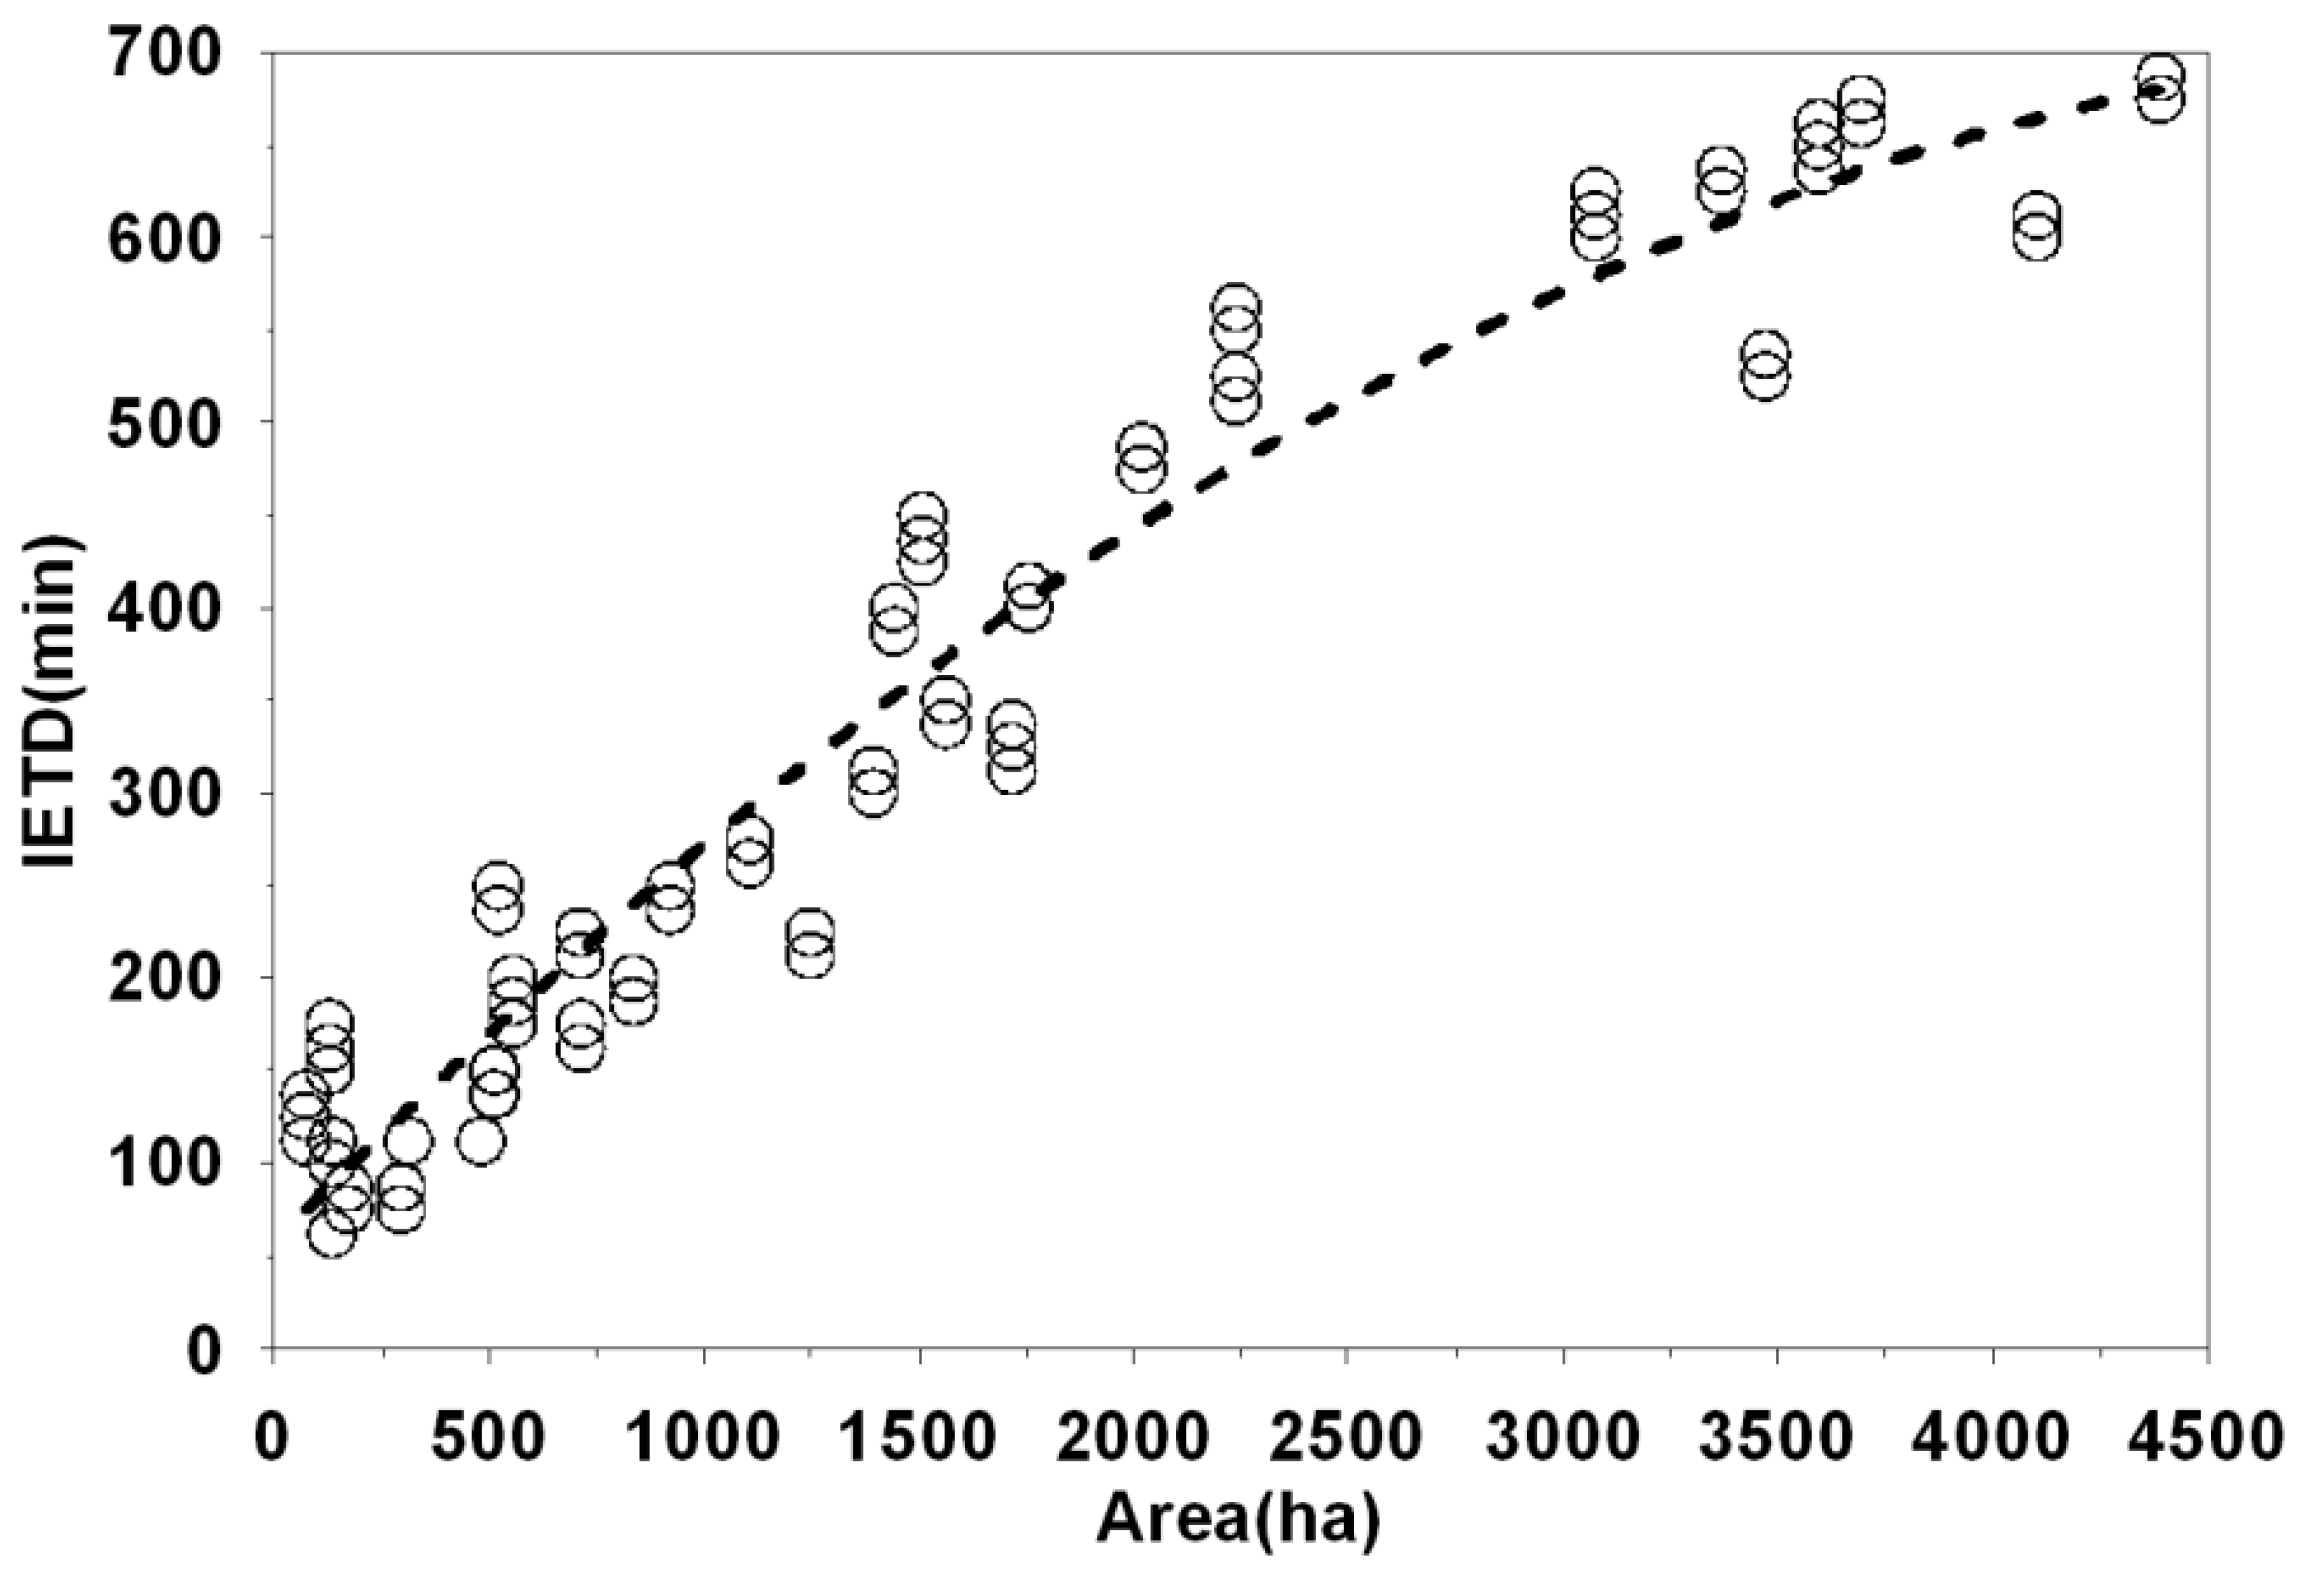
2.3. Application of the Suggested IETD Determination Method

To determine the IETD with the suggested method, a rainfall-runoff simulation is necessary to define the direct runoff and ending time of the runoff. Among the various rainfall-runoff simulation models that have been developed for urban drainage systems, the Storm Water Management Model (SWMM) [17] was selected due to its acceptance by many researchers and wide practical application for urban drainage systems in Korea. Nevertheless, other models could be used for other regions if more applicable. The simulated runoff by SWMM was used and a runoff rate of less than 0.05 m3/s was considered as the end of the runoff, as this rate is small enough to be considered as the end of runoff in urban drainage area, where runoff decreases rapidly after the end of rainfall event. According to a number of tests, basin width, Manning’s n value, depth of depression storage, and percentage of pervious area do not significantly affect the time of runoff under 0.05 m3/s.
Using the suggested method, the IETD was determined for the Joong-Rang drainage basin in Seoul, Korea (Figure 6). This drainage basin, located in the north-west of Seoul, consists of 32 sub-drainage basins with 217 sub-catchments and is a typical urban catchment with an impervious area ratio of 72.2%. The total basin area is 5430 ha and the average slope is 0.017. The maximum and minimum infiltration rates used in the SWMM simulation for the Horton method were 12 mm/h and 6 mm/h, respectively. Roughness coefficients of 0.02, 0.05, and 0.013 were used for impervious areas, pervious areas and conduits.
The independent rainfall events having durations ranging from 20 to 180 min were classified from the minutely rainfall data in Seoul. The events were collected for the wet period (June to October) from 1985 to 2000, except for 1986. Table 2 shows the characteristics of the events classified into seventeen groups depending on the rainfall duration. Representative events were obtained for each group by arithmetic mean. Figure 7 shows six of the seventeen representative events by duration.
Figure 6. Joong-Rang drainage districts.
Water 06 00045 g006
Table 2. Statistical characteristics of rainfall events according to duration.
Duration (min)Rainfall EventsMean Depth (mm)Mean Intensit (mm/h)
NumberPercent (%)Cumulative Percent (%)
11~20798.878.8710.7732.32
21~309010.1018.9712.1324.27
31~40829.2028.1716.7525.13
41~50899.9938.1623.6028.32
51~60697.7445.9036.3836.38
61~70637.0752.9729.5725.35
71~80596.6259.6035.7826.09
81~90465.1664.7621.7114.47
91~100455.0569.8156.5833.95
101~110333.7073.5136.5419.93
111~120485.3978.9039.0219.51
121~130414.6083.5017.958.29
131~140323.5987.0924.6610.57
141~150242.6989.7918.697.48
151~160333.7093.4927.6310.36
161~170283.1496.6337.6113.27
171~180303.37100.0023.497.83
Total891
Hydrographs from the Joong-Rang drainage basin catchments were obtained by running SWMM with the 17 representative rainfall events. IETDs of the Joong-Rang drainage basin catchments were determined from the hydrographs according to the time period from the end of the rainfall event to the end of the runoff. Figure 8 shows IETDs according to rainfall durations. No relationship was found between IETD and rainfall duration. That is, the IETD determined by the suggested method was not affected by rainfall durations.
The suggested IETD is intimately related with concentration time, and, of course, the IETD is related with the fraction of the impervious area and slope. However, it is very difficult that the fraction of the impervious area and average slope of the catchment are correctly estimated during the initial stage of design. On the other hand, estimation of area is relatively easy. Therefore, area-IETD relationship was suggested in this study to easily apply in practice.
The results presented in Figure 9 revealed a positive relationship between IETDs and area. IETD increased linearly with increasing area up to 2500 ha. However, the increasing rate decreased as the area exceeded 2500 ha, due to the confluence of three streams (Joongrang chun, Wooii chun, Mockdong chun). The area of the basin increased suddenly, but the travel time did not increase at this point.
Figure 7. Representative rainfall events by durations. (a) 30 min; (b) 60 min; (c) 90 min; (d) 120 min; (e) 150 min; (f) 180 min.
Water 06 00045 g007
Figure 8. IETD for different durations in the Joong-Rang drainage system.
Water 06 00045 g008
Figure 9. IETDs with different areas in the Joon-Rang drainage district.
Water 06 00045 g009
The relationship between the catchment area and the IETD from the data in Figure 9 was determined as Equation (1) using polynomial regression. Equation (1) can be used in the IETD determination for ungauged urban drainage systems. However, since the equation was derived from simulated data for subbasin areas ranging from 40 to 4400 hectare (ha), any use of the equation to subbasins beyond this range needs careful application.
Y = −2.12 × 10−5 X2 + 0.23X + 57.52; R2 = 0.94
where, X: area (ha), Y: IETD (min).

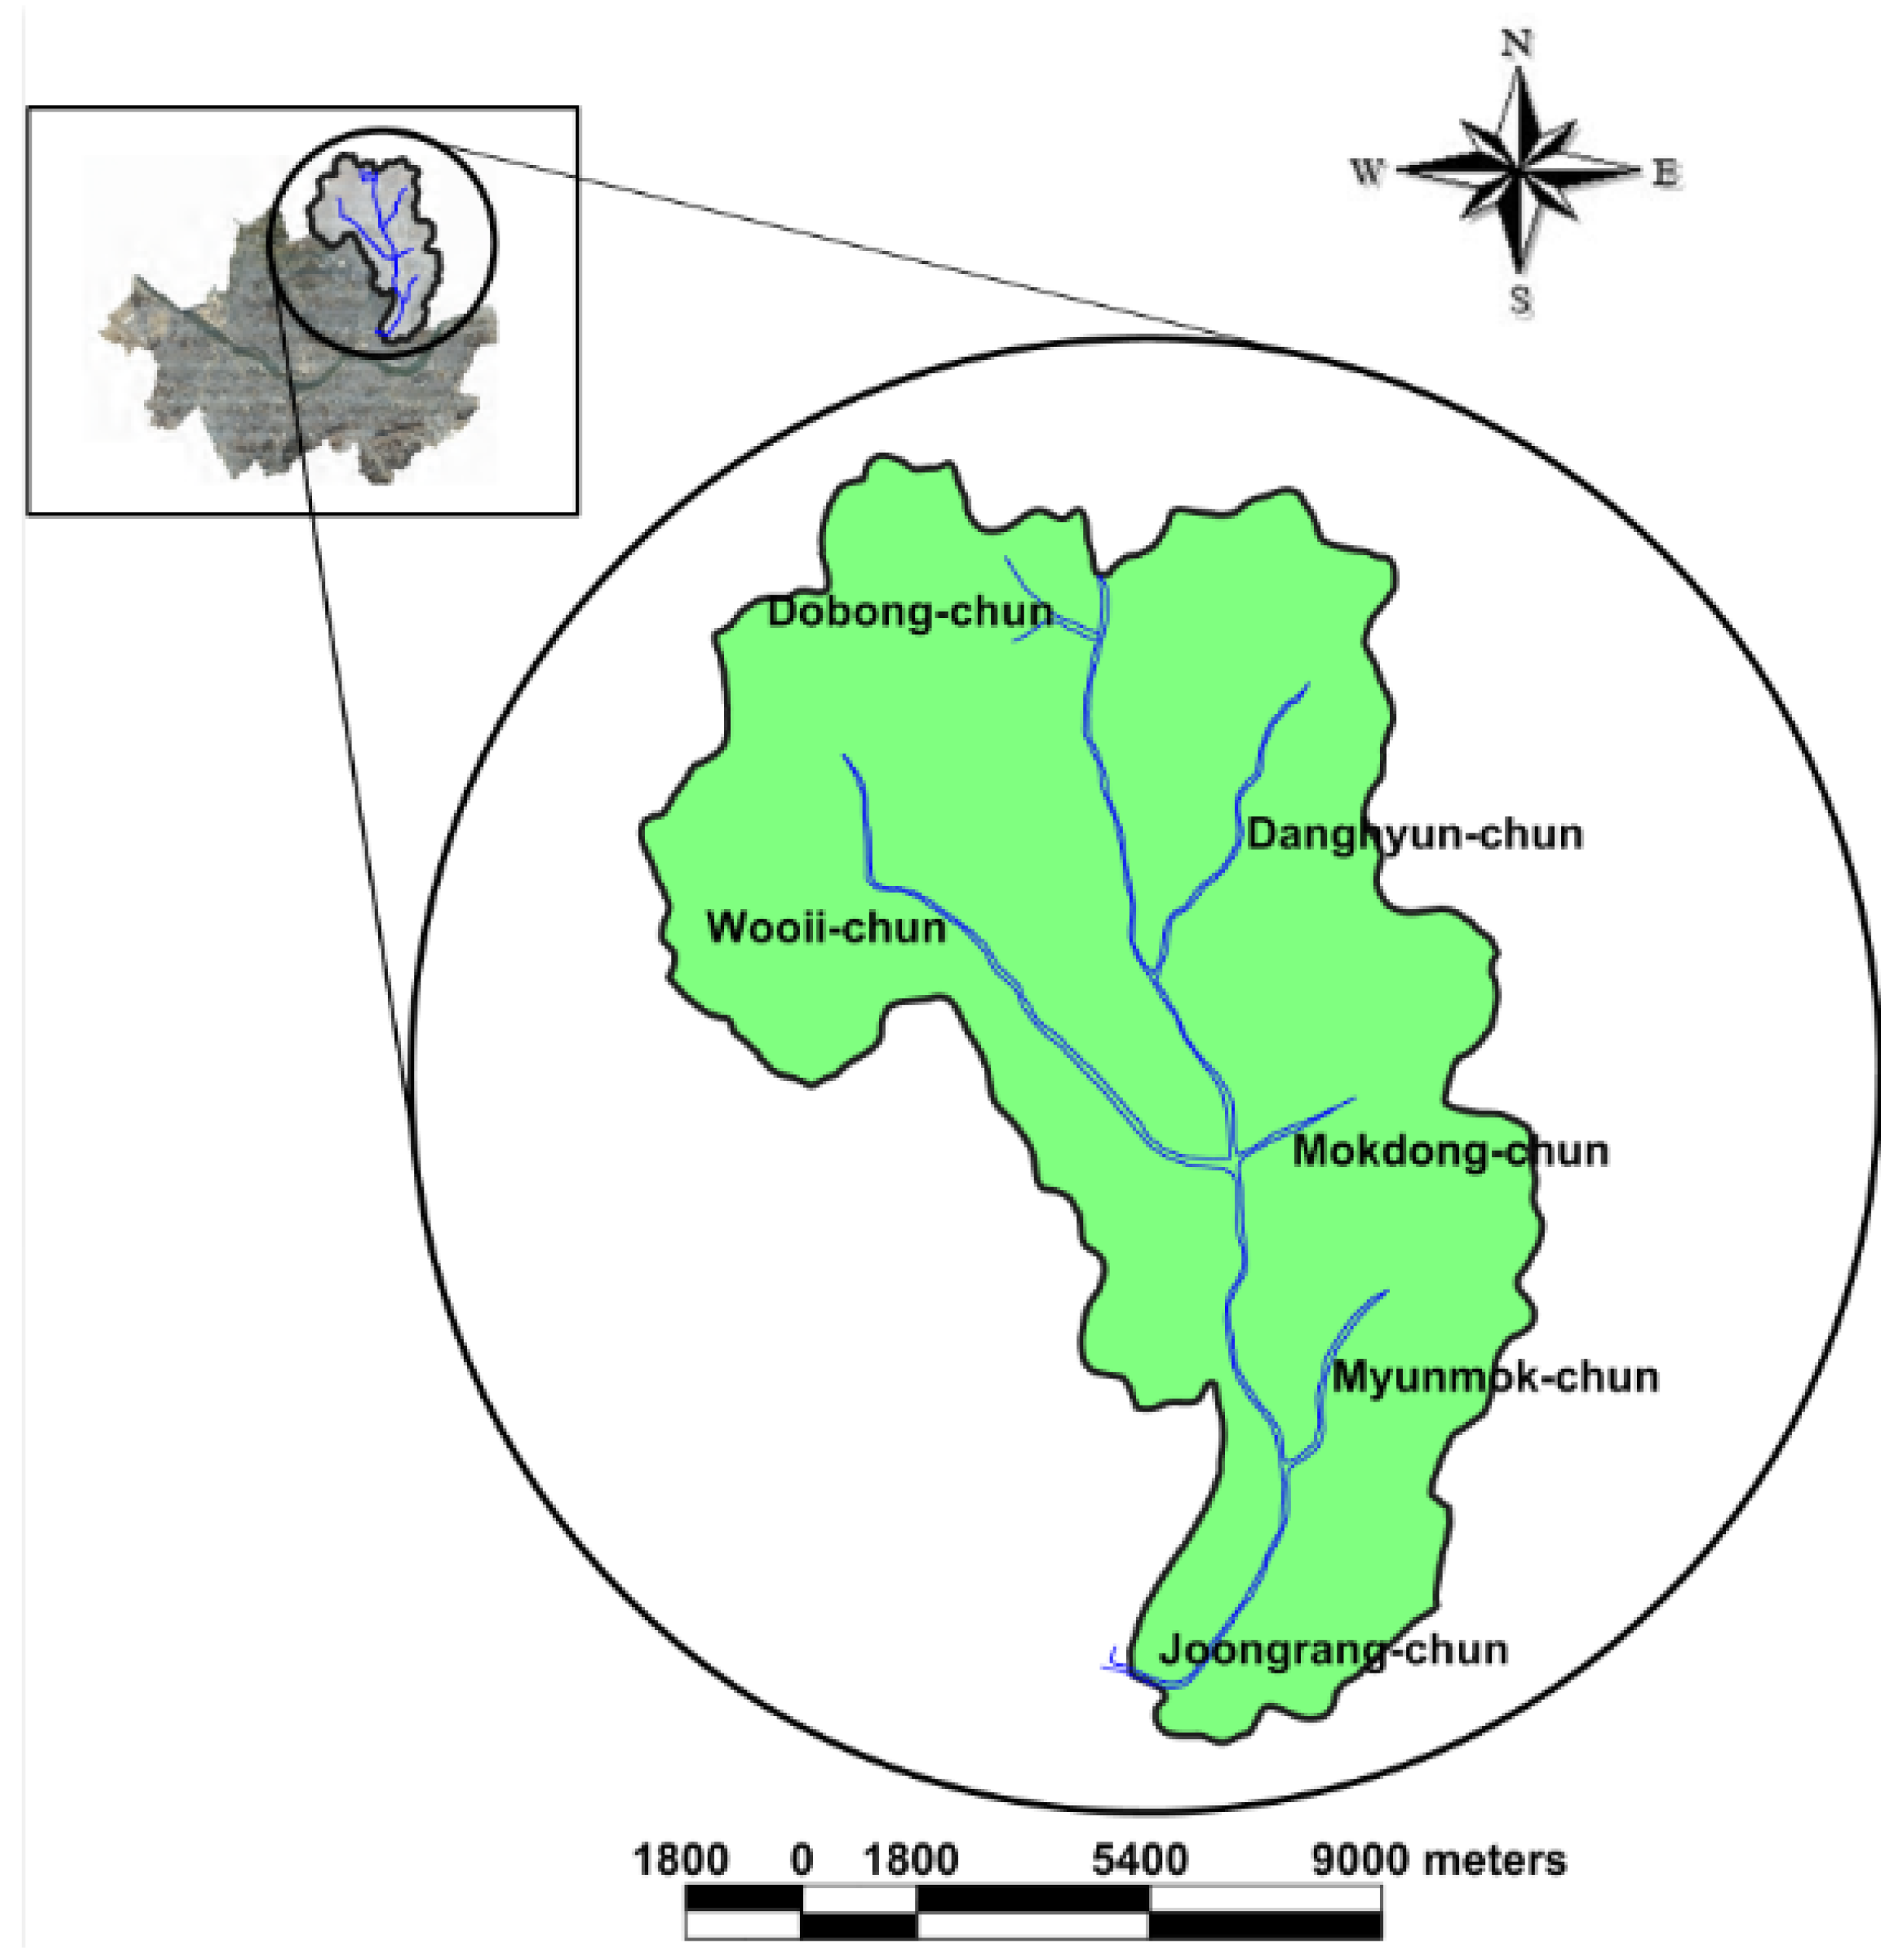
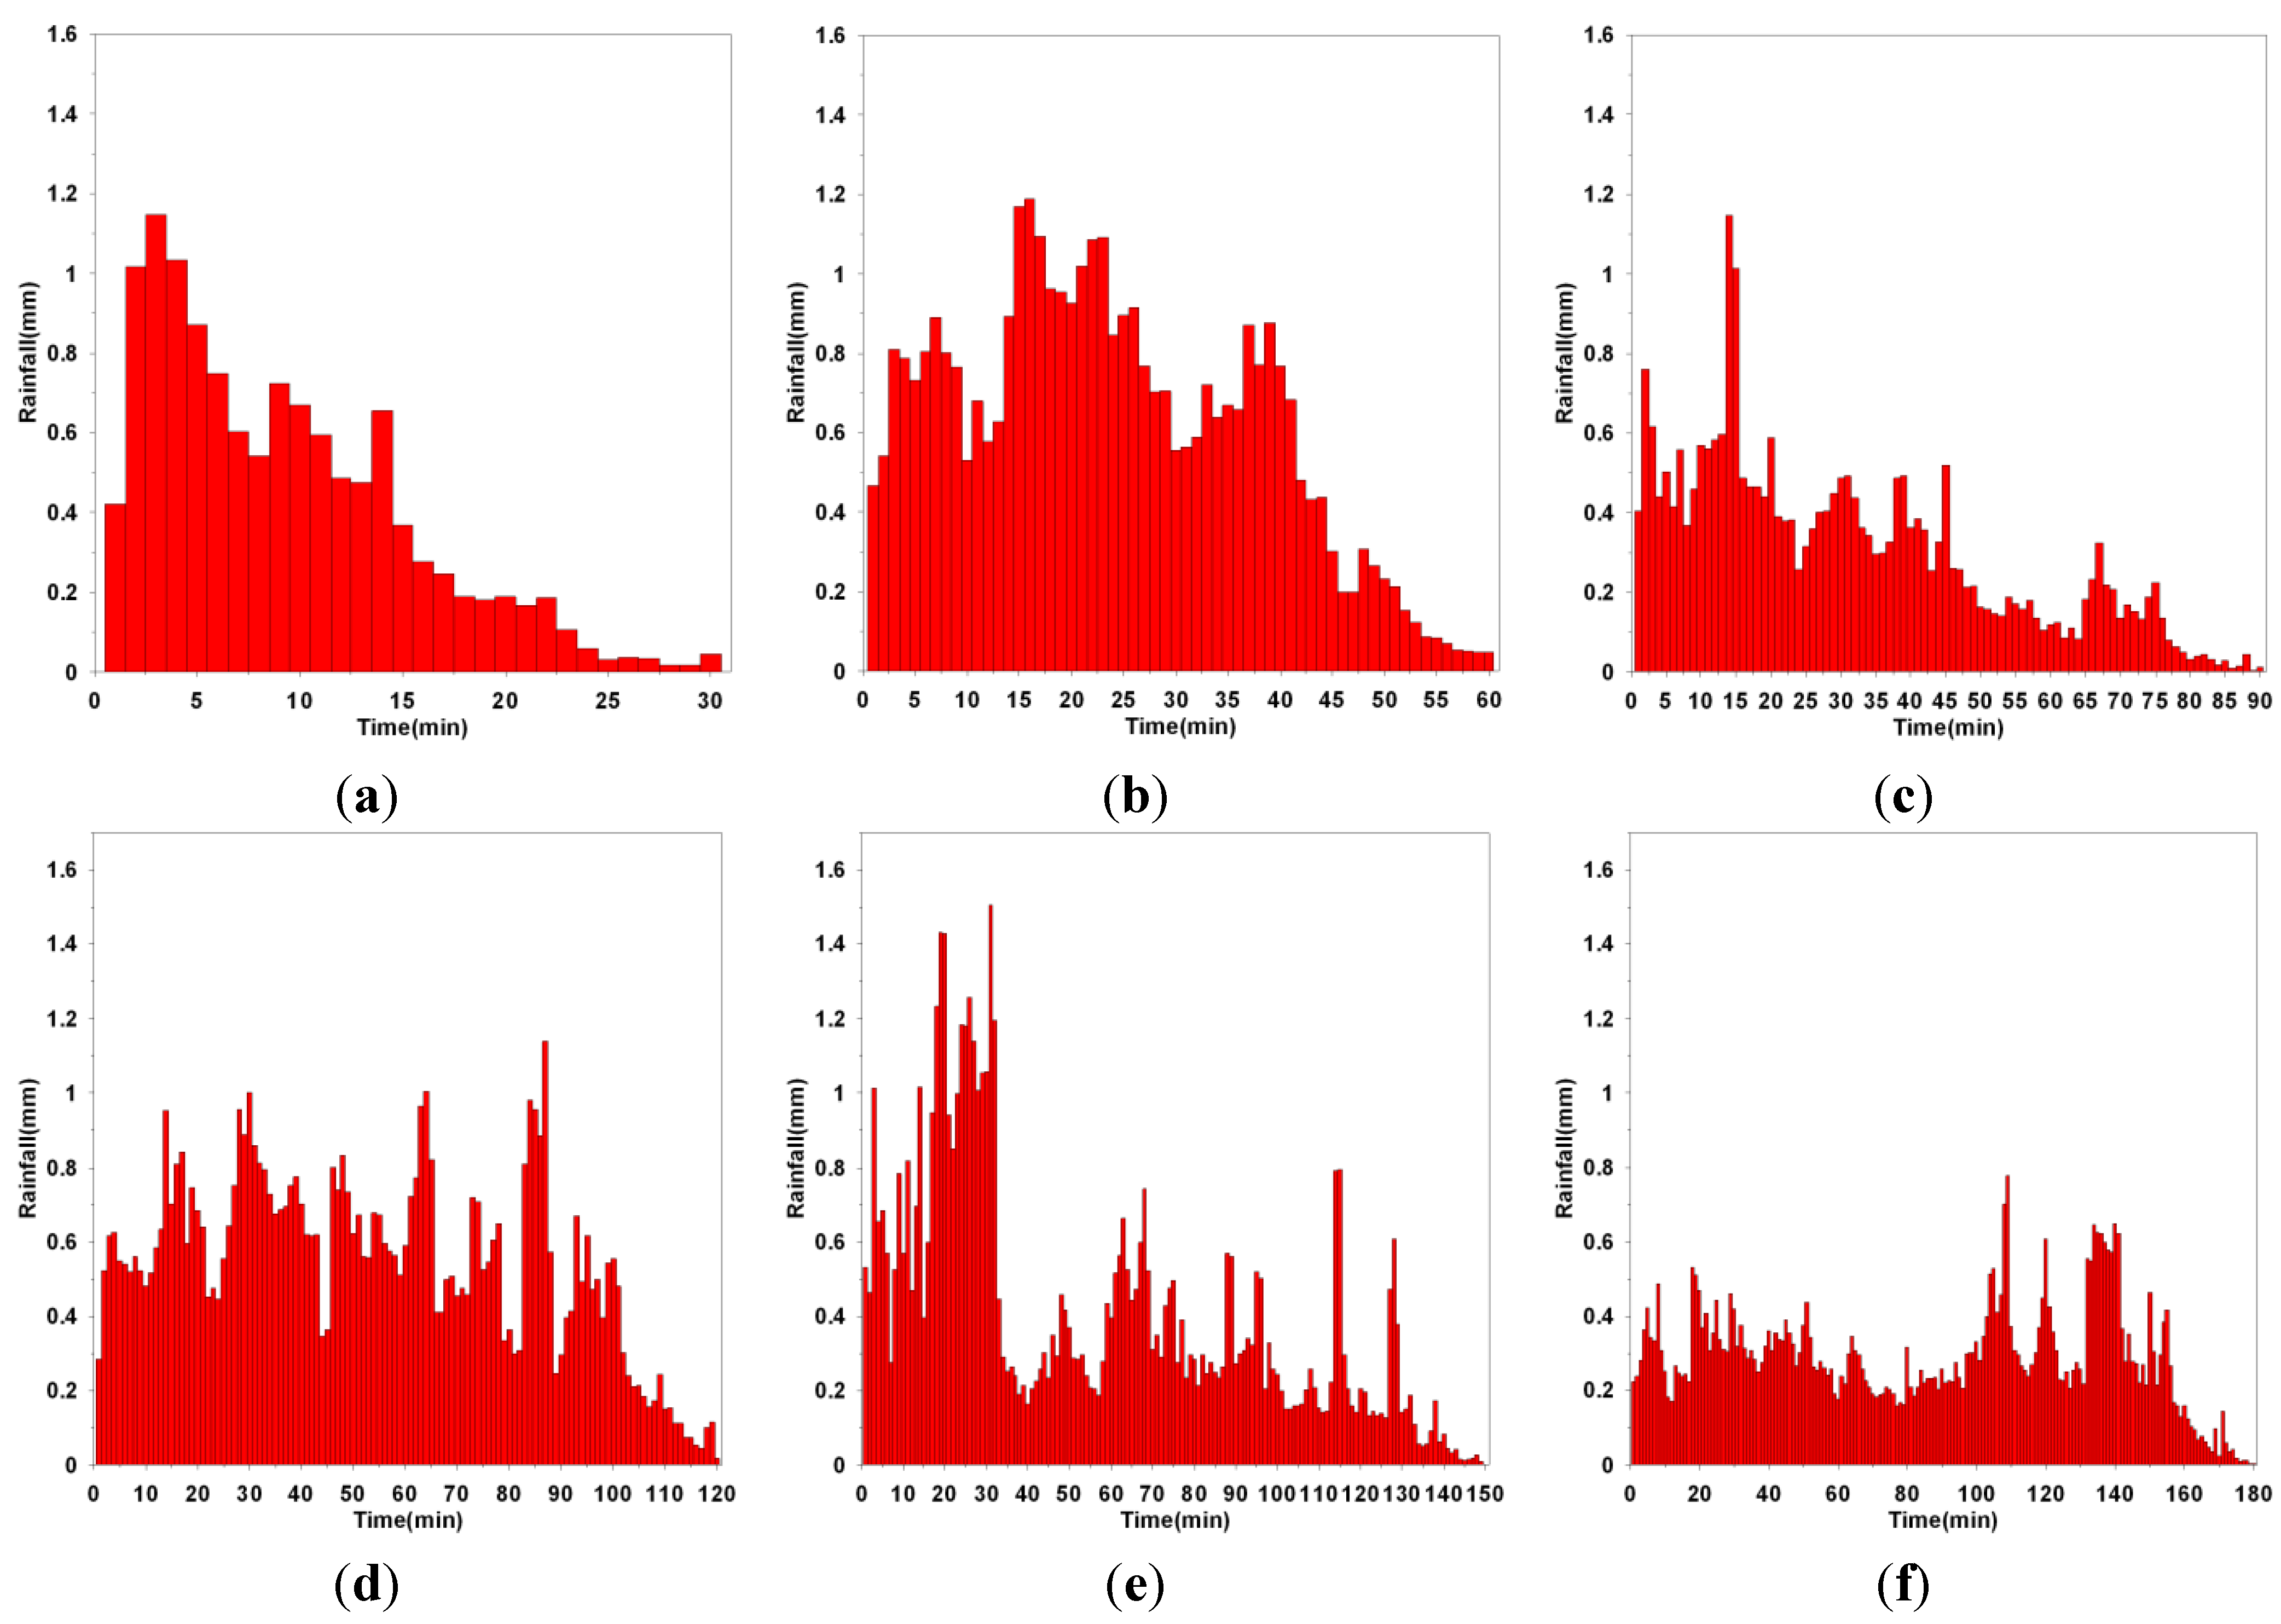
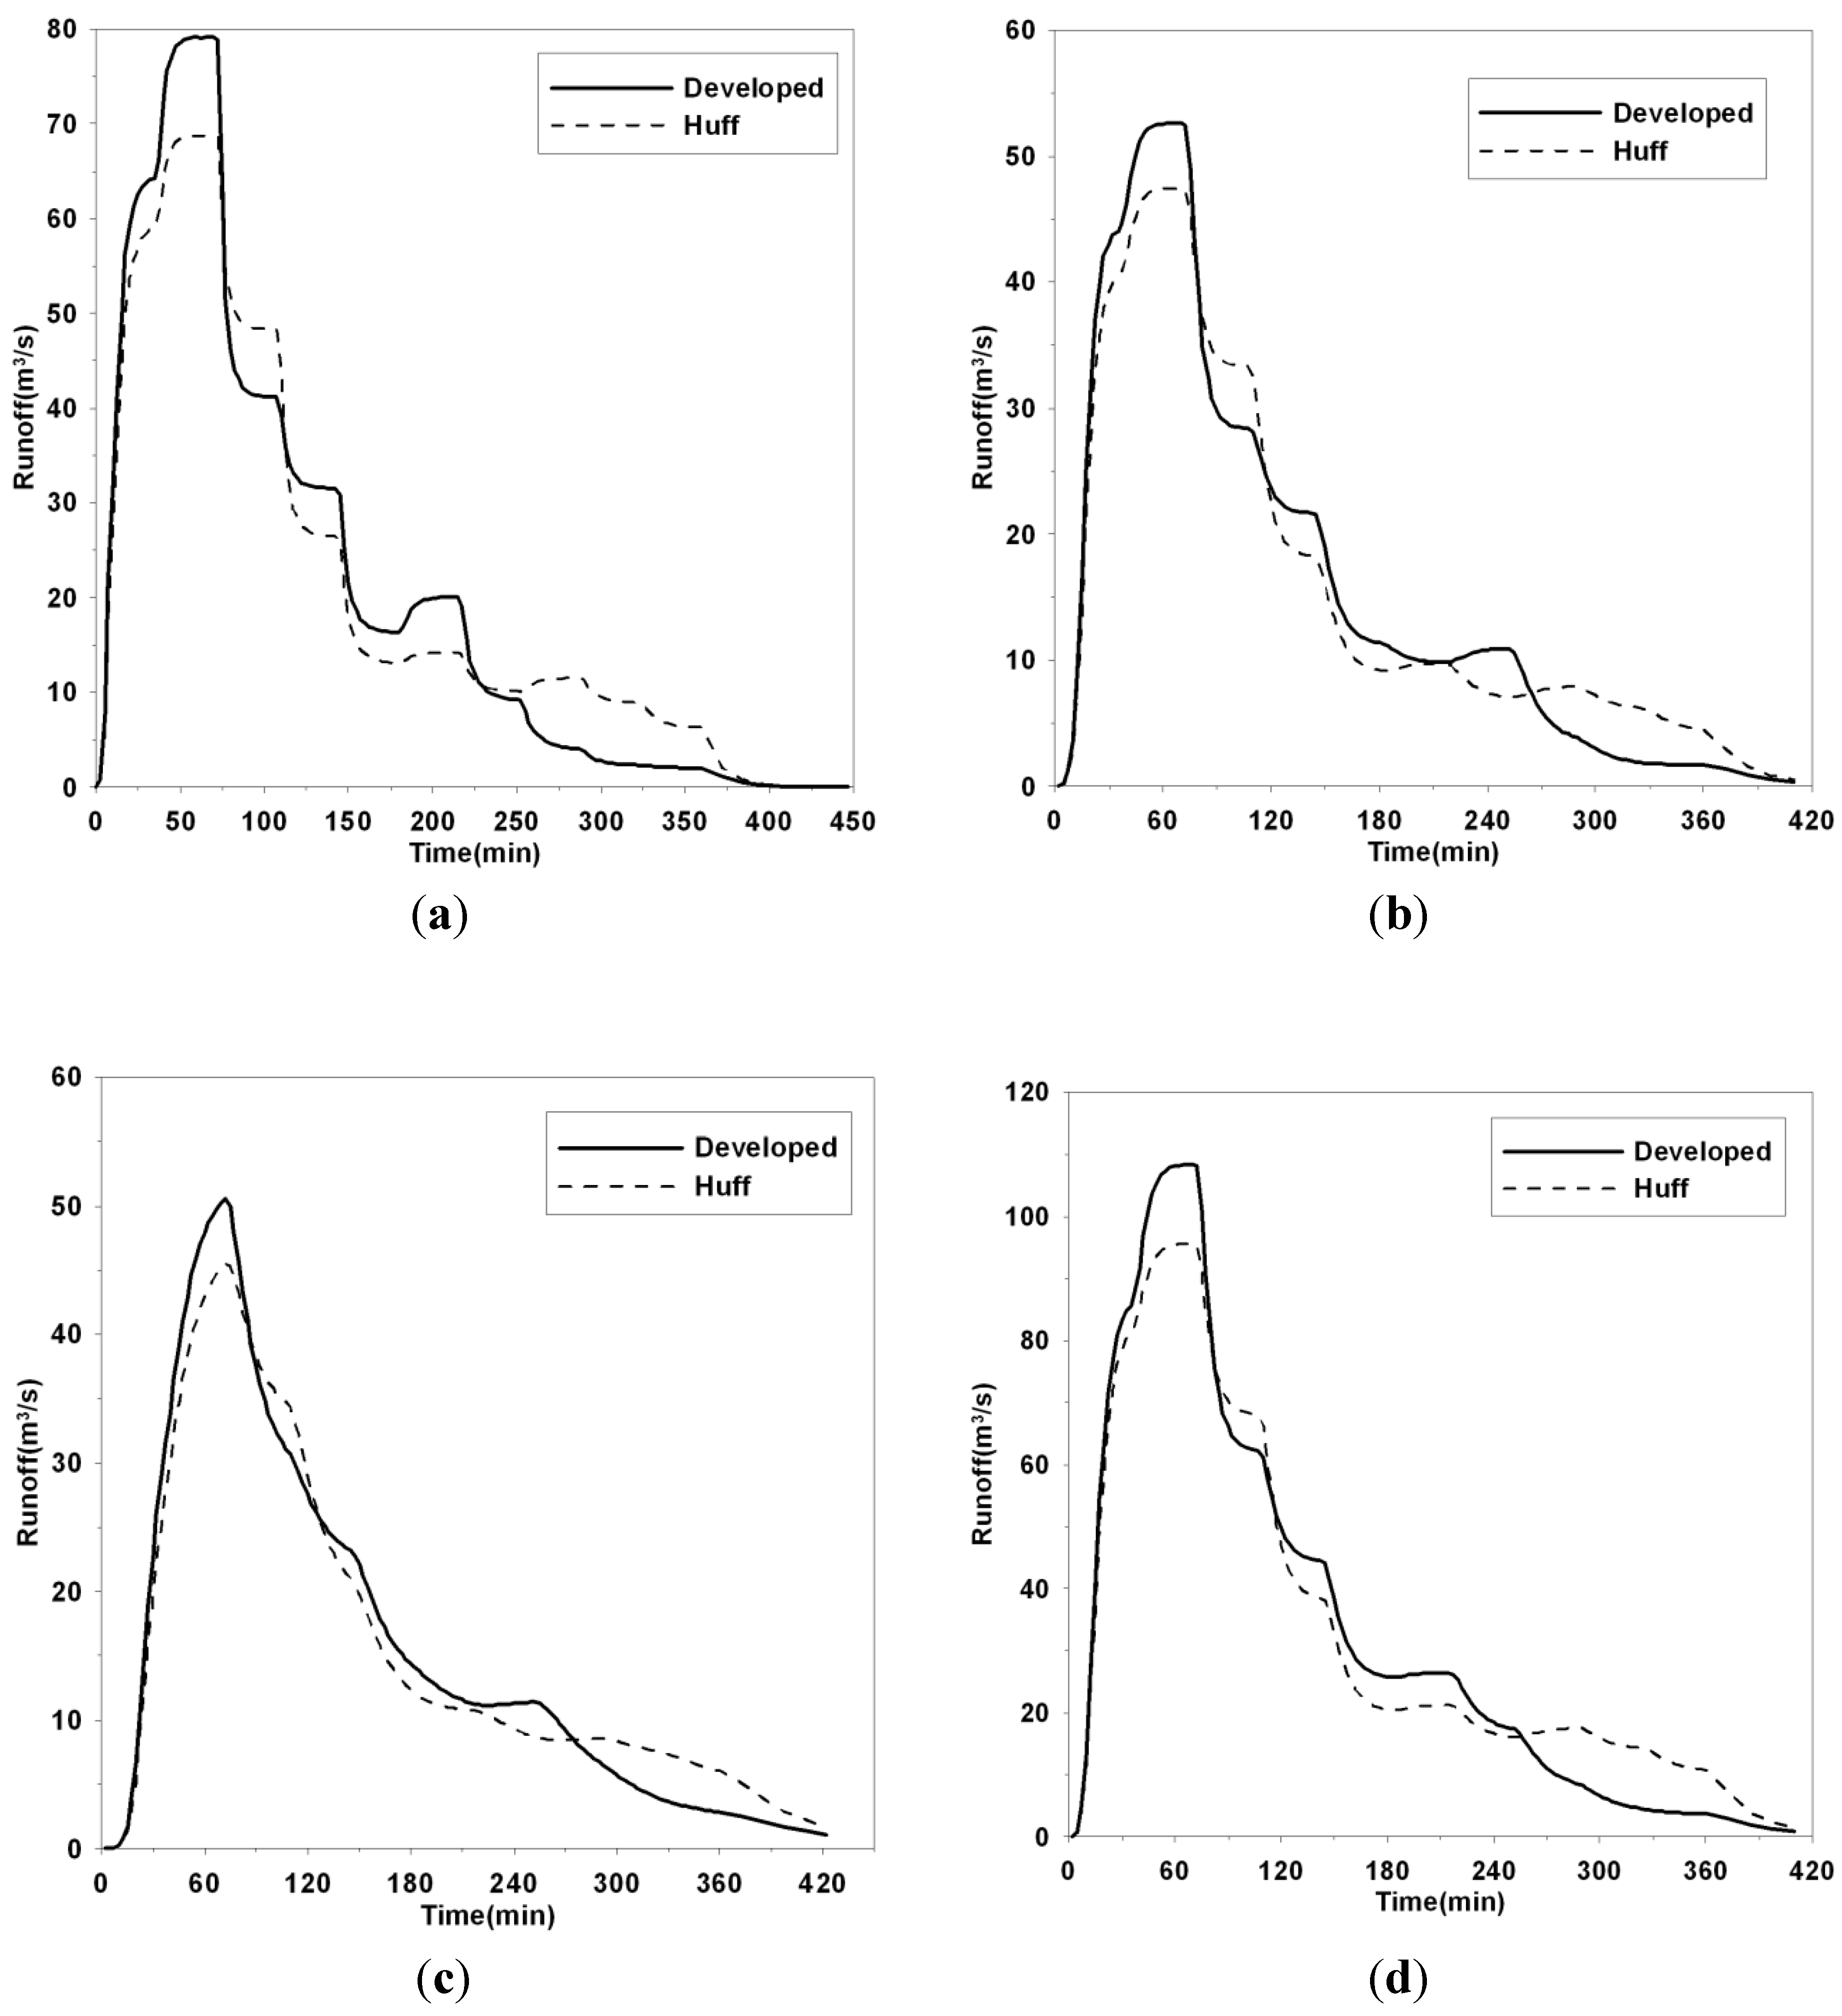
3. Temporal Distribution of Rainfall Using the Suggested IETD for Urban Drainage Systems

The temporal distribution of rainfall may change the runoff peak flow rate and alter the shape of a runoff hydrograph. Therefore, knowing how the time distribution of the design rainfall is determined is important, and methods have been developed to determine the time distribution for a design storm by the following researchers: [18,19,20,21]. Of these, the Huff method is widely used in Korean engineering practice. Huff [19] separated independent rainfall events from the observed data by a six-hour IETD and classified all the intensity distributions into four groups depending on whether the maximum intensity occurred in the first, second, third, or fourth quarter of the storm duration. In the present study, the time distribution characteristics of rainfall events are checked by applying a range of IETDs from 30 min to six hours. The dimensionless cumulative rainfall curves plotted for each IETD in Figure 10 reveal that the time distribution characteristics of rainfall events are slightly affected by the IETD.
Using the regression Equation (1), IETDs were calculated for four drainage systems (Sang-Gea, Joong-Gok, Jang-An, and Soo-Yu), and their areas and IETDs are shown in Table 3. Using the two types of IETD, i.e., the suggested IETD and the existing six-hour IETD, independent rainfall events were separated from observed rainfall data, and dimensionless cumulative rainfall curves were determined. For a hypothetical, six-hour rainfall event with an intensity of a 10-year frequency event, hyetographs were derived from the dimensionless cumulative curves. In Seoul, the total depth of rainfall for a 10-year return, six-hour rainfall is 150 mm. For most short-duration storms in Seoul, Korea, the maximum intensity occurs in the first or second quarter of duration. Table 4 shows the rainfall time distributions of the study areas using the suggested IETDs and Huff’s six-hour-IETD. Huff dimensionless hyetograph for maximum intensity occurring in the first quartile was used to build the cumulative rainfall curve for a six-hour-IETD.
Figure 10. Dimensionless cumulative rainfall curve by IETDs.
Water 06 00045 g010
Table 3. Characteristics of target watersheds.
Name of drainage zoneSang-GeaJoong-GokJang-AnSu-Yoo
Area (ha)427.4294.8286.5583.1
Stream NameDang-HyunJoong-RangJoong-RangWoo-I
IETD (min)150120120180
Table 4. Time distribution of rainfall (mm) according to watershed (10-year return period, six-hour duration, maximum intensity occurring in the first quartile for Huff hyetograph).
Time (%) Method102030405060708090100sum
This study (mm)Sang-Gea34.0841.5322.3117.469.7411.666.123.351.991.76150
(22.72)(27.69)(14.87)(11.64)(6.49)(7.77)(4.08)(2.23)(1.33)(1.17)(100%)
Joong-Gok34.0840.0822.3017.409.758.689.543.942.072.16150
(22.72)(26.72)(14.87)(11.60)(6.50)(5.79)(6.36)(2.63)(1.38)(1.44)(100%)
Jang-An34.0840.0822.3017.409.758.689.543.942.072.16150
(22.72)(26.72)(14.87)(11.60)(6.50)(5.79)(6.36)(2.63)(1.38)(1.44)(100%)
Su-Yoo33.1341.0323.7617.1810.1210.617.073.571.801.72150
(22.09)(27.35)(15.84)(11.45)(6.75)(7.07)(4.71)(2.38)(1.20)(1.15)(100%)
Huff (mm)31.5036.3025.9514.858.108.706.607.356.004.65150
(21.00)(24.20)(17.30)(9.90)(5.40)(5.80)(4.40)(4.90)(4.00)(3.10)(100%)
Using the above information, the hydrographs were simulated by SWMM for the four drainage systems. The peak flows obtained from the suggested method were 11%~15% higher than those obtained from the existing six-hour IETD. Table 5 and Figure 11 show the results.
Table 5. Comparison of peak flow rates.
SubbasinThis studyHuffRatio of peak flow by suggested and Huff methods (A/B) (%)
IETD (min)Peak flow rate (cm) (A)Peak time (min)IETD (min)Peak flow rate (cm) (B)Peak time (min)
Sang-Gea15079.15736068.857115
Joong-Gok12052.66036047.565111
Jang-An12050.67236045.572111
Su-Yoo180108.46736095.770113
Figure 11. Comparison of hydrograph (First quartile, 50% frequency). (a) Sang-Gea; (b) Joong-Gok; (c) Jang-An; (d) Su-Yoo.
Water 06 00045 g011

4. Summary and Conclusions

IETD is a criterion for classifying independent rainfall events from observed data. The traditional methods use only the rainfall characteristics so that the same IETD is generated for both urban and rural areas. IETDs longer than 10 h were obtained by the methods for some areas in Korea, including urban ones. However, such a long IETD is not suitable for the analysis in urban areas. Appropriate IETD determination is important because the statistics of rainfall event characteristics are affected by any variation in IETD.
This study suggests an improvement to traditional methodologies for the IETD determination, in which not only meteorological characteristics but also basin characteristics should be considered. In this study, IETD is defined as the time period from the end of the rainfall event to the end of the direct runoff. The proposed IETD was determined to be between 60 and 680 min in the Joong-Rang basin, depending on the basin characteristics of the subcatchments. Simulated peak flow obtained for some subcatchments using the software SWMM and the suggested IETD were shown to be 10%–15% higher than those obtained with traditional IETD estimates.
The IETD determination can be utilized in the statistical analysis and design of urban drainage systems such as the parameter estimation of rainfall generation models, the analytical design of urban sewer networks or storage reservoirs, and the urban nonpoint source pollutant estimation by event mean concentration.

Acknowledgments

This research was supported by a grant “The Integrated flood prevention technique and Optimal operation system for Urban drainage network” (NEMA-NH-2011-42) from the Natural Hazard Mitigation Research Group, National Emergency Management Agency of Korea.

Conflicts of Interest

The authors declare no conflict of interest.

References

  1. Chen, J.; Adams, B.J. Analysis of storage facilities for urban stormwater quantity control. Adv. Water Resour. 2005, 28, 377–392. [Google Scholar] [CrossRef]
  2. Behera, P.K.; Adams, B.J.; Li, J.Y. Runoff quality analysis of urban catchments with analytical probabilistic models. J. Water Resour. Plan. Manag. ASCE 2006, 132, 4–14. [Google Scholar] [CrossRef]
  3. Nguyen, T.A.; Grossi, G.; Ranzi, R. Design Storm Selection for Mixed Urban and Agricultural Drainage Systems: A Case Study in the Northern Delta-Vietnam. In Proceedings of 11th International Conference on Urban Drainage, Edinburgh, UK, 31 August–5 September 2008.
  4. Guo, Y.; Liu, S.; Baetz, B.W. Probabilistic rainfall-runoff transformation considering both infiltration and saturation excess runoff generation processes. Water Resour. Res. 2012, 48. [Google Scholar] [CrossRef]
  5. Balistrocchi, M.; Bacchi, B. Modelling the statistical dependence of rainfall event variables by a trivariate copula function. Hydrol. Earth Syst. Sci. Discuss. 2011, 8, 429–481. [Google Scholar] [CrossRef] [Green Version]
  6. Adams, B.J.; Hugh, G.F.; Charles, D.D.; Sami, M.H. Meteorological data analysis for drainage system design. J. Environ. Eng. 1986, 112, 827–848. [Google Scholar] [CrossRef]
  7. Grace, R.A.; Eagleson, P.S. A Model for Generating Synthetic Sequences of Short-Time-Interval Rainfall Depths. In Proceedings of the International Association Hydrologic Science Symposium, Fort Collins, CO, USA, 6–8 September 1967; pp. 268–276.
  8. Sariahmed, A.; Kisiel, C.C. Synthesis of Sequences of Summer Thunderstorm Volumes for the Atterbury Watershed in the Tucson Area. In Proceedings of the International Association Hydrologic Science Symposium on Use of Analog and Digital Computers in Hydrology, Tucson, AZ, USA, 1968; pp. 439–447.
  9. Howard, C.D.D. Theory of storage and treatment-plant overflows. J. Environ. Eng. Div. 1976, 102, 709–722. [Google Scholar]
  10. Heaney, J.P.; Huber, W.C.; Medina, M.A.; Murphy, M.P.; Nix, S.J.; Hasan, S.M. Nationwide Assessment of Combined Sewer Overflows and Urban Stormwater Discharges: Volume II, Cost Assessment and Impacts; U.S. Environment Protection Agency: Cincinnati, OH, USA, 1977. [Google Scholar]
  11. Nix, S.J. Urban Stormwater Modeling and Simulation; Lewis Publishers: Boca Raton, FL, USA, 1994. [Google Scholar]
  12. Restrepo-Posada, P.J.; Eagelson, P.S. Identification of independent rainstorms. J. Hydrol. 1982, 55, 303–319. [Google Scholar] [CrossRef]
  13. Joo, J.G.; Lee, J.H.; Jun, H.D.; Kim, J.H.; Jo, D.J. A New Approach to Determine IETD Considering Runoff Characteristics of Urban Watersheds. In Proceedings of the Asia Oceania Geosciences Society 3rd Annual Meeting & Exhibition (AOGS2006), Singapore, 9–14 July 2006.
  14. Balistrocchi, M.; Grossi, G.; Bacchi, B. An analytical probabilistic model of the quality efficiency of a sewer tank. Water Resour. Res. 2009, 45. [Google Scholar] [CrossRef]
  15. Balistrocchi, M.; Grossi, G.; Bacchi, B. Deriving a practical analytical-probabilistic method to size flood routing reservoirs. Adv. Water Resour. 2013, 62, 37–46. [Google Scholar] [CrossRef]
  16. Adams, B.J.; Papa, F. Urban Stormwater Management Planning with Analytical Probabilistic Models; John Wiley Sons: New York, NY, USA, 2000. [Google Scholar]
  17. Huber, W.; Dickinson, R.E. Storm Water Management Model, Version 4: User’s Manual; United States Environmental Protection Agency: Athens, GA, USA, 1988. [Google Scholar]
  18. Keifer, C.J.; Chu, H.H. Synthetic storm pattern for drainage design. J. Hydraul. Div. 1957, 83, 1–25. [Google Scholar]
  19. Huff, F.A. Time distribution of rainfall in heavy storms. Water Resour. Res. 1967, 3, 1007–1019. [Google Scholar] [CrossRef]
  20. Soil Conservation Service (SCS). Engineering Field Manual. Available online: http://directives.sc.egov.usda.gov/viewerFS.aspx?hid=21429 (accessed on 23 December 2013).
  21. Yen, B.C.; Chow, V.T. Feasibility Study on Research of Local Design Storms; U.S. Department of Transportation, Federal Highway Administration: Washington, DC, USA, 1977. [Google Scholar]

