Article

Are Public-Private Partnerships a Source of Greater Efficiency in Water Supply? Results of a Non-Parametric Performance Analysis Relating to the Italian Industry

by
Corrado Lo Storto
Department of Industrial Engineering, University of Naples Federico II, Piazzale V. Tecchio n. 80, Naples 80125, Italy
Water 2013, 5(4), 2058-2079; https://doi.org/10.3390/w5042058
Submission received: 27 September 2013 / Revised: 11 November 2013 / Accepted: 28 November 2013 / Published: 11 December 2013

Abstract

:
This article reports the outcome of a performance study of the water service provision industry in Italy. The study evaluates the efficiency of 21 “private or public-private” equity and 32 “public” equity water service operators and investigates controlling factors. In particular, the influence that the operator typology and service management nature - private vs. public - has on efficiency is assessed. The study employed a two-stage Data Envelopment Analysis methodology. In the first stage, the operational efficiency of water supply operators is calculated by implementing a conventional BCC DEA model, that uses both physical infrastructure and financial input and output variables to explore economies of scale. In the second stage, bootstrapped DEA and Tobit regression are performed to estimate the influence that a number of environmental factors have on water supplier efficiency. The results show that the integrated water provision industry in Italy is characterized by operational inefficiencies of service operators, and scale and agglomeration economies may have a not negligible effect on efficiency. In addition, the operator typology and its geographical location affect efficiency.

1. Background

The measurement of operational efficiency of public services provision and the identification of optimal operational and business models have become major concerns of policy-makers and scholars over the last twenty years. These issues are particularly relevant in the water supply, sewerage and wastewater treatment industry because of its large size and the amount of financial resources involved [1]. In Italy, for instance, the annual turnover of the water service industry in 2009 was about €6.5 billion, for about 5.5 billion cubic meters of water distributed, while according to some estimates, the water service supply industry will need about €65 billion of investment in the next thirty years, most of which will be needed to keep the operating infrastructure efficient. The infrastructure obsolescence and the scarce amount of network recovery work done in the past mean that the public sector has to allocate in the future budgeting plans a great amount of financial resources to deal with unplanned maintenance of the water service supply assets. It is clear that, in this context in which the necessary investment is greater than the available public resources, and the regulatory framework is extremely articulated and still evolving, it is important to stimulate and support the entrance into the water service supply industry of private actors, adopting new participative models more oriented to competition and the market. In terms of production technology, the provision of drinking water is dependent on a distribution infrastructure, the construction and maintenance of which represent the major costs, and all relevant stages of the service value chain—captation, treatment, distribution and waste water collection—are supported by this infrastructure. In theory, all these activities can be performed by single operators according to the principle of unbundling. However, the possibility to exploit complementarities and scope economies urged the Italian legislator to adopt—as the prevailing business model—the integrated supply of all services related to water management (drinking water, waste collection and depuration, and sewerage). As a consequence, the technical efficiency of the water service supply has become a major issue in this industry, much more than in other industries, and the identification of the technical and organizational solutions that minimize unit cost and the optimal plan of the type and size of plants are important goals. The improvement of the efficiency and quality of service provision, investment in technological innovation, reduction of operational costs, and the availability of resources from the financial markets may well be perfectly consistent with the need to preserve the nature of water as a public good. The entrance into the market of private actors might be the most effective (and, probably, the only) way to increase management efficiency and the amount of financial resources available for investment. The survey presented in a recent Blue Book by ANEA [2] on the water service in Italy has indeed shown that the amount of investment is lower in those cases in which water service is provided through in-house management as a consequence of the difficult search for financial resources. In the same way, the Blue Book data show that investment is greater in the case of public-private companies, which, however, adopt a higher tariff regime.
However, in Italy the integrated water service still remains scarcely appealing to private providers for several reasons, i.e., the legal and regulatory uncertainty, the steadiness of the tariff regime, the still unsolved conflict of interest between the in-house providers and the local water authorities, and the unclear risk allocation in which private providers do not have to support demand uncertainty risks. Since 1994 when an in depth restructuring process of the industry was started with the Law No. 36/1994 (the so called Galli Law), the number of water service providers—both municipal departments, under direct municipal management (gestione in economia) and specialized firms—decreased from 7826 to 3351 in 2009, with a noticeable increase of the number of concessions for the supply of the integrated water service assigned to private providers (i.e., full private equity companies or mixed private-public equity companies established for the purpose). However, data show that the number of entirely private equity or mixed public-private equity companies is not growing as was estimated when the Government approved the Galli Law in 1994. Furthermore, given the public nature of good water and the diffused prejudice related to the involvement of private bodies in the provision of public services, several local municipalities are reluctant to let out on contract the urban water and sewage service to non public providers believing that a private nature of the management of service is associated with increased tariff, high and not justified profit, low efficiency, etc. So, the Galli Law was disregarded for many years because of the inertia and difficulty to transfer duties and responsibilities from a huge number of administrative bodies (e.g. number of municipalities) to 93 only (e.g., the number of ATO, Optimal Territorial Areas assumed as geographical and administrative reference units), and the first tender to involve private actors in the management of the service was held only in the second half of 2002. Now, a complex and variegated contractual framework characterizes the integrated water provision industry, and the integrated water service is still managed by a plethora of small companies operating either on the basis of the in-house rule, or as regimes of local exceptions, and several kinds of contractual agreements for the supply of integrated water services co-exist together, with the involvement of different bodies.
Evaluating the operational efficiency of the water supply service both at the industry and the company level, and assessing the influence that the typology of contracts regulating water supply and the nature of service operators have on efficiency is henceforth an interesting field of research for the implications related to the design of policy measures and public finance concerns. This paper reports the results of a performance study that adopts Data Envelopment Analysis (DEA) as a non-parametric technique to measure the operational efficiency of a sample of water service operators and investigate if there is an association between their operational efficiency and their characteristics in terms of management and equity ownership. Both financial and physical data are used as input and output variables, while conventional and bootstrapped DEA approaches are used to measure efficiency. The investigated sample includes 53 Italian water service operators, 21 private or public-private, and 32 public equity companies. The article is organized as follows. In Section 2 major literature contributions on the topic of private vs. public ownership and management are discussed, while Section 3 illustrates the study setting. The results of the efficiency study are shown in Section 4, and in Section 5 some concluding remarks are presented.

2. Private vs. Public Ownership and/or Management of Water Provision Assets: Major Literature Contributions

Several scholars have focused their effort to understand what influence the typology of ownership and/or management—public vs. private—may have on efficiency or, more generally, on performance of the water service provision industry [3,4,5,6,7]. An in-depth literature review conducted by Berg and Marques [8] reveals that the topic of the influence of water utilities ownership and management on performance and cost efficiency is one of the most studied by scholars. In fact, Saal and Parker ([5], p. 66) claim: “[…] public ownership is usually associated with political and economic goals that may conflict with the efficient use of factor inputs […] at the same time, however, the extent of performance improvement resulting from privatization depends, at least in part, upon shareholders ability to monitor management effort in the pursuit of effecting gains […].”In the same way, Vinnari and Hukka ([9], p. 86) point out: “Since the beginning of the 1990s, the international discussion on the management of water and wastewater undertakings has largely focused on the public-private partnership (PPPs) as a method of improving water services delivery, within the wider framework promoting the expansion of private sector participation in the sector. The main assumption underlying this approach has been a critique of public sector utilities, which were deemed unable to expand coverage and improve the quality of the services without the financial and technical inputs of the private sector.” In many countries, the entrance of private actors in the water supply industry has failed to achieve the expected goals of greater efficiency and, for this reason, the involvement of the private sector in the provision of the service has been subject to increasing criticism. The large number of empirical studies conducted from across the US, Europe and developing countries that used different methodologies such as econometric or multiple case studies, provided results that are often ambiguous and contradictory, even showing that privatization does not necessarily provide better cost service delivery [10,11]. Kirkpatrik and Parker [12] even found that, in some cases the private sector participation in the water provision industry caused the cancellation of some services or an increase of water tariffs to the detriment of some consumer groups. The “privatization” concept itself remains often ambiguous, sometimes indicating the transfer of the asset ownership to a private body, other times only the award of a contract for the provision of water services to a private company, or even both of them. After reviewing 51 case-studies and 22 empirical tests, Pérard [4] suggested that the involvement per se of the private sector in water supply does not systematically have a significantly positive effect on efficiency. The in depth survey of many econometric studies which focused on the privatization issue in the water service supply industry since the early 1970s, and which was carried on by Bel and Warner [13], is also unable to provide the hypothesis that privatization leads to reduced costs with acceptable justification. Indeed, only five of the eighteen studies discovered systematic cost savings with privatization. In the conclusion of their paper, the scholars emphasize that “[…] because there is no systematic optimal choice between public and private delivery, […] managers should approach the issue in a pragmatic way” ([13], p. 1343). Given the natural monopoly characteristic of the water supply, “[…] the benefits from privatization would be expected to erode over time” ([13], p. 1339).
Some scholars also found that the relationship between ownership and efficiency may be moderated by a number of factors, i.e., the output amount and size of operations (henceforth, scale economies) [14], or the regulatory regime of the waters supply industry [15]. The weight of these factors on efficiency may be even more important than ownership, and to achieve an acceptable efficiency rate an appropriate combination of incentives, governance mechanisms and penalties is necessary [16].
When a country-focused perspective is adopted, the findings of the studies relative to the impact of the ownership and management typology on efficiency also remain ambiguous and contradictory. Several studies conducted in the US, Canada and the countries of Latin America since the 1970s did not discover any discernible difference between publicly and privately owned firms entrusted of service provision, either in terms of costs or efficiency [17,18,19]. Using data collected from the American Water Workers Association, a number of studies that implemented either parametric or non-parametric techniques failed to ascertain whether private operators are more efficient than public ones. For instance, Mann and Mikesell [20] found that private operator owned utilities had higher costs than government utilities, and findings from many empirical studies support the idea that public providers are more efficient than private ones [21,22,23]. However, a different stream of studies showed that—on the contrary—public operators are less efficient, having higher costs than private ones [15,24,25]. An empirical study related to the case of the water supply concessions in the district of Buenos Aires reveals that “[…] privatization of water supply services was motivated by a general discontent with the public sector performance as revealed by under investment, sluggish system expansion, poor service quality and long-standing operating deficits. Private sector involvement is aimed at overcoming government difficulties to impose service coverage […] [while] […] the remarkable increase in profits were originated almost exclusively by tariff increases, as the contribution of total factor productivity improvements and of input process have been negligible” ([26], pp. 245–246). The results of multiple case study research relative to water service providers in Argentina carried on by Rais et al. [27] supports the idea that that the introduction of the private sector in the water service supply has a negative impact on the overall industry performance. As to the water and sewerage industry operators in Brazil, Sabbioni [28] compared the operators that provide at the local (municipal) level. The scholar found that operations’ costs were associated with the legal status of the provider and in particular, that local public providers which had an organization similar to that of a corporate firm were more cost efficient than local public providers which were operated as not-for-profit organizations. His study also showed that privately-equity firms were highly efficient. On the contrary, da Silva e Souza et al. [29] estimated the relative efficiency of Brazilian publicly and private owned water utilities by implementing a stochastic cost frontier approach but no significant differences emerged between the two types of operators. Seroa da Mota and Moreira [30] also found that ownership has no effect on efficiency gains in the provision of local municipal services, even though, after privatization, the local private operators have moved faster than public ones towards the efficient frontier.
Conflicting results have also emerged from empirical research conducted in Asia, Africa and Pacific regions. Estache and Rossi [31] found that both public and private water operators achieve comparable efficiency rates. Dumol [32] also found similar results analyzing multiple cases in the Philippines. Recently Wang et al. [33] performed an econometric study of the private sector participation in China urban water supply and found that the involvement of the private sector significantly improved the production capacity of urban water operators and water coverage rate of the water supply industry in the developed eastern cities, but there was no significant effect in the less developed central and western cities. Moreover, their study also showed that the participation of the private sector has no significant effect on the fixed asset investment. After implementing statistical parametric techniques, Estache and Kouassi [34] found that private operators are more efficient than public ones in Africa, but, adopting both parametric and non-parametric techniques and using a larger sample, Kirpatrick et al. [12] showed that the public sector service providers perform better in terms of efficiency.
Empirical research conducted in Europe produced confusing results, too. Ashton [35] showed that privatization positively influences the efficiency rate of the industry, but, on the contrary, Saal and Reid [36] were unable to discover significant differences between operators belonging to the public and private sectors in terms of productivity and efficiency. Shaoul [37] came to the same conclusion by performing financial analysis of water industry operators in England and Wales. The comparison between the experiences of the UK and France in the privatization process in the water supply industry does not provide any empirical evidence that the private sector has an advantage over the public sector in achieving higher efficiency levels [38]. According to Dore et al. ([38], p. 49): “[…] although water quality improvements were associated with privatization, there is no demonstrable evidence that privatization resulted in lower prices. In fact, the evidence in both countries indicates higher prices because of privatization. It should be noted that the experience in both countries is similar to the privatization of local hydro utilities in the Province of Ontario, Canada, where costs increased significantly due to a similar private sector tenet of maximizing shareholder value. It seems that the regulated system in England and France did not work satisfactorily. With natural monopolies in water, private production requires adequate regulation. In the two countries examined, it is not possible to find that the private sector demonstrated absolute efficiency advantage.” In Spain, Garcia-Sanchez [39] found no differences between public and private owned firms measuring efficiency of the municipal water services. In Portugal, Carvalho and Marques [10] investigated the influence of environment factors on efficiency for sixty-six water utilities without finding any significant impact of asset ownership on efficiency. Rather, findings related to ownership resulted ambiguously. However, in a study conducted by Marques [40], water services under private management were found to be outperforming and more productive when compared with the public ones. Finally, Vinnari and Hukka [9] studied the influence of the Tallin water supply privatization in Finland; their study showed that the major effect induced by privatization was an increase of the water service tariff which decreased social efficiency for users.
In most of the empirical studies, it is taken for granted that the private sector is naturally more efficient than the public one. Indeed, it is assumed that private operators have demonstrated their greater performance, and it is well accepted that the market—according to theory—is superior to the bureaucracy of the public sector organizations that are under political control. As a consequence, in the light of these assumptions, a large part of the debate related to policy-making on infrastructure and the supply of services in the water drinking industry considers the private management of the facilities as a desirable goal. However, as the International Monetary Fund claims ([41], p. 14) “[…] Much of the case for PPPs rests on the relative efficiency of the private sector. While there is an extensive literature on this subject, the theory is ambiguous and the empirical evidence is mixed. But if a common theme emerges, it relates to the importance of competition as a source of efficiency in both the private and public sectors.” It is evident that a lot of ambiguity about the influence that the private sector involvement may have on the operational efficiency of the water supply industry still remains, and further research on this subject is necessary.

3. Efficiency Analysis

3.1. Method

The efficiency study was implemented adopting a two-stage DEA approach. In the first stage, a conventional Data Envelopment Analysis (DEA) model was used to evaluate the water service operator efficiency, while in the second stage the influence of environmental factors on efficiency was investigated implementing a bootstrapped DEA procedure [42]. Since its introduction by Charnes et al. [43], Data Envelopment Analysis as a non-parametric technique has been extensively used for measuring efficiency in the public utilities sector to identify and design policy measures (see, for instance [44,45,46,47,48,49,50].
In the last twenty years, several papers more specifically focusing on the water provision industry have been published [31,51,52,53,54,55,56,57,58,59,60,61,62,63,64,65,66,67,68,69]. Cooper et al. [70] offer a systematic introduction to DEA and the different models used for evaluating efficiency in a variety of contexts.

3.1.1. DEA—First Stage

Here, a conventional BCC DEA model has been implemented to calculate water service operators’ efficiency [71], with the assumption of variable returns to scale and input orientation (minimization). This choice is justified by the great variance of operators, the size of service provided, and the goal of the analysis typical of this kind of study which is generally oriented towards cost reduction, as the demand that operators are facing remains almost stable.
An input-oriented BCC DEA model is defined as:
Water 05 02058 i001
In this formulation, it is assumed that there exist n water service providers to be evaluated. Each provider consumes varying amounts of m different inputs in order to produce p different outputs. In particular, the provider “j” consumes amounts xij of inputs (xij with i = 1,…, m), and produces amounts ykj of outputs (ykj with k = 1,…, p). x0 ≡ (x10,…, xm0) and y0 ≡ (y10,…, yp0) indicate amounts of inputs and outputs of the provider “0” that is under evaluation. X and Y respectively denote the m × n input and the p × n output matrices for the n providers. Finally, ԑ is a small positive number and 1 ≡ (1,…, 1) is a unit vector.
In order to investigate the existence and nature of scale economies, the CCR DEA that assumes constant returns to scale [43] and NIRS DEA that assumes non increasing returns to scale [72] were also calculated. Particularly, scale efficiency (SEF) was measured by dividing the CCR DEA total technical efficiency by BCC DEA pure technical efficiency as suggested by Coelli et al. [73], while the typology of returns to scale was qualified following the method suggested by Fare et al. [72].

3.1.2. DEA—Second Stage

In the second stage DEA efficiency estimates were regressed against a set of environmental factors which take into account characteristics of the context of the water service providers that are out-of-control. These environmental factors as contextual variables characterize the operational conditions in which integrated water service is supplied [74]. As in conventional DEA all deviations from the efficiency frontier are attributed to pure inefficiency, and its deterministic nature does not take into account any measurement errors and statistical fluctuations, efficiency scores calculated in the first stage have been bootstrapped as suggested in the literature [75,76]. The bootstrapping procedure allows greater robustness in the results, corrected for serial correlation of DEA efficiencies, and constructed bias-corrected efficiency estimates of the unobserved efficiencies, providing a feasible means to perform statistical inference [76]. Both categorical and continuous variables were considered in the regression analysis, while no prior assumption regarding the sign of the coefficients and direction of influence of environmental variables was done. As the distribution of efficiency scores is between 0 and 1, the two-limit Tobit regression model was implemented [74].

3.2. Sample

Fifty-three water service operators were considered for the study. Information relative to operators was retrieved from technical reports issued by the Government Water Service Supervision Commission [77,78] and the Foundation ANEA [2,79]. The sample includes 21 operators classified as “private/mixed private-public” and 32 classified as “only public”. Specifically, mixed private-public equity companies in which the private partner has been chosen by tender or full private equity companies selected by a public tendering procedure (even quoted on the Italian Stock Exchange) are included in the first group, while companies which are fully owned by the regional or municipal administrations that provide the integrated water management service “in-house” (i.e., without no competitive tender to select them) belong to the second group [80]. Indeed, in Italy the provision of water services (distribution of drinking water, waste water treatment, sewage) can be awarded to public or public-private and private companies through concession contracts. The service operator is always subject to regulation and has to set price to users that are consistent with the production costs. Further, the company has to make an investment to improve the quality of water distribution, reducing water losses, against the acknowledgement of an adequate capital revenue for the investment [81].
As implementing DEA requires an accurate set of data to measure input and output variables, a major effort was necessary to control data consistency and the size of sample used was necessarily kept small to have only reliable data. The selected sample is well representative. Indeed, operators supply water to 42% of Italian municipalities, while the water aqueduct network managed is about 57% of the total Italian network length.

3.3. Data

Both physical (i.e., network length, number of municipalities served) and financial data (i.e., revenues, total production cost) were collected from several sources, as is common in similar studies [82]. In particular, financial data were retrieved from the company income and financial statements, while physical data were collected from technical literature, company websites, and the annual company management report included in the balance sheet documents. The following data were finally collected for each company: (a) Aqueduct network length (AQ_NET); (b) Sewerage network length (SEW_NET); (c) Number of municipalities served (MUN); (d) Number of connections (CON); (e) Revenue from service delivered (REV); (f) Total production cost (PC) [83]; (g) Population served (POP); (h) Water service provider geographical location (GEO); (i) Water service operator typology (TYPE).

3.3.1. Variables in the First Stage Analysis

The conventional DEA model includes three inputs (Aqueduct network length; Sewerage network length; Total production cost) and one output (Revenue from service delivered). Table 1 presents the descriptive statistics of sample input and output variables. Two operators do not provide full service but only water provision, and for this reason their sewerage length is 0 km. The average length of aqueduct and sewerage networks is 3678 km and 1863 km, respectively. As Table 1 shows, the sample used in the performance analysis is extremely differentiated including both small and large operators. Pearson correlations were also calculated to investigate associations between inputs and outputs (see Table 2). In general, there are strong and positive correlations between variables.
Table 1. Descriptive statistics of input and output variables.
VariableTypeMeanMinMaxStd.dev.
Aqueduct network length (AQ_NET)Input3,67824021,0003,823
Sewerage network length (SEW_NET)Input1,863011,0002,188
Total production cost (PC)Input62,455,4821,864,220386,358,92678,580,168
Revenue from service delivered (REV)Output61,472,0074,167,788442,338,54584,196,945
Table 2. Pearson correlations between input and output variables.
Variable[1][2][3][4]
[1] Aqueduct network length (AQ_NET)1.00
[2] Sewerage network length (SEW_NET)0.931.00
[3] Total production cost (PC)0.850.871.00
[4] Revenue from service delivered (REV)0.820.840.991.00
Note: Values ≥ 0.35 are significant at p < 0.05.
The t-test was used to test for differences between the “private or public-private” and “public” groups of water service providers as to the input and output variables (see Table 3). The two groups are homogeneous, as no significant differences resulted.
Table 3. ANOVA between the “private or public-private” and “public” groups to test for differences regarding inputs and outputs.
Variable(Private or public-private)(Only public)t-valuep
meanstd.dev.meanstd.dev.
Aqueduct network length (AQ_NET)3,365.223,316.653,883.194,160.59−0.479 0.634
Sewerage network length (SEW_NET)1,738.371,747.561,945.442,458.07−0.3340.740
Total production cost (PC)63,839,451.8184,239,664.4661,547,251.6376,009,078.930.1030.918
Revenue from service delivered (REV)65,744,944.5296,376,476.6658,667,891.1976,670,847.610.2970.768

3.3.2. Variables in the Second Stage Analysis

Table 4 and Table 5 display statistics relative to environmental factors. In Table 4 the last two variables were developed as ratios in order to have density measurements of the water service provided by operators. Particularly, CON_NET was developed as the ratio of the amount of connections to the total network length, while CON_MUN as the ratio of the amount of connections to the number of municipalities served by the service provider. The first variable may be considered as a linear density measurement, while the second one as an area density measurement for the service delivered. The average number of municipalities (MUN) to which each operator provides water services is 64, while the average number of connections (CON) is 181,359 and population amount (POP) that benefits the service is on average 693,954 [84].
Table 4. Descriptive statistics of environmental (continuous) factors.
VariableMeanMinMaxStd. dev.
Number of municipalities (MUN)64337772
Number of connections (CON)181,3595,013998,000177,557
Population (POP)693,95412,6434,000,000894,769
Number of connections/total network length (CON_NET)39.116.5118.720.5
Number of connections/number of municipalities (CON_MUN)4,370.1641.230,840.55,114.5
Note: total network length = aqueduct network length + sewerage network length.
Table 5. Descriptive statistics of environmental (dichotomic) factors.
VariableVariable statesNumber of operators
GEOCentral or Southern Italy (0)28
Northern Italy (1)25
TYPEFull private or public-private equity (0)21
Full public equity (1)32
Both measurements of service density show great variability. Means are respectively 39.1 for CON_NET and 4,370.1 for CON_MUN. In addition, two dummy variables were also used in this stage, GEO that qualifies the geographical location of the water service provider and TYPE that qualifies the water service operator typology (see Table 4). In particular, GEO is 0 when the operator is located in Central or Southern Italy and 1 when it is in Northern Italy; TYPE is 0 for full private or public-private equity operators, and 1 for full public operators. The amount of full public equity service operators is larger than the amount of private or public-private equity operators. This is consistent with the Italian water supply industry. As to the geographical location, the service providers are almost well distributed between North and Central-Southern Italy.

4. Results

4.1. First Stage Analysis: The Water Service Providers’ Operational Efficiency

The outcome of conventional DEA is presented in Table 6. Water service operators have been split in two groups, the first one including public equity operators and the second one including private or public-private equity operators. Three efficiency scores have been calculated, the CCR total technical efficiency, the BCC pure technical efficiency, and the SEF scale efficiency. In both groups, two service providers achieve 100% total technical efficiency; the number of 100% efficient providers increases to four when the pure technical efficiency is calculated [85]. However, while in the first group (public operators) the minimum CCR efficiency is only at 36%, this efficiency score is at 51% in the second group. Groups slightly differ in terms of mean total technical and pure technical efficiencies which are a little higher for private/public-private operators (71% vs. 64%, and 80% vs. 71% respectively). In both groups average scale efficiency is at 90%. Particularly, in the first group there are seven operators that are 100% scale efficient and 10 operators that have a scale efficiency equal or higher than 95%. In the second group, three operators are 100% efficient, while eight operators have scale efficiency equal or higher than 95% The analysis of single efficiency scores show that there is a great variance in each group, and the Italian integrated water provision industry is characterized by significant operational inefficiencies of service operators. Focusing attention on the type of returns to scale, some differences emerge between the two groups. In particular, in the first group 19 service providers operate under decreasing returns to scale, six under increasing returns to scale and only seven under constant returns to scale. One of these latter companies, ABC, does not provide integrated water service as required by the Galli Law, but only the supply of drinking water. In the second group, ten service providers operate under decreasing returns to scale, eight under increasing returns to scale, and three under constant returns to scale. Decreasing returns to scale (i.e., dis-economies of scale) implies that a water service operator is too large to take full advantage of scale of production operations and presents a supra-optimum scale size. On the contrary, an operator that experiences increasing returns to scale (i.e., economies of scale) is too small for its scale of operations and, as a consequence, operates at a sub-optimum scale size. Finally, all the water service providers that are scale efficient (SEF = 1) operate at constant returns to scale. According to these data, most public operators might become more efficient by reducing the size of their operations, while, on the contrary, a certain amount of private and public-private operators may become more efficient by increasing the size of their operations. For instance, in the first group Polesine Acque, that is inefficient at 70%, might improve its efficiency by decreasing the size of its operations, while in the second group AM.TER might become more efficient by increasing the scale of its operations. These data suggest that scale economies may have a significant effect on efficiency, while it is likely that a greater territorial concentration of connections might positively contribute to improve efficiency rates. Anyway, from the analysis of the efficiency scores there is no evidence of homogeneous behavior as to the relationship between returns to scale typology and the efficiency measures.

4.2. Second Stage Analysis: The Effect of Environmental Factors on Efficiency

Figure 1 shows a graphical illustration of the average bias-corrected estimates of BCC DEA efficiencies with their 95%-confidence intervals that were obtained generating 2000 bootstrap samples. The bootstrapped mean efficiency score was used as the dependent variable in the Tobit regression.
Table 7 presents the results of the two-limit Tobit regression of the bootstrapped efficiency on the environmental factors. In the model, a positive sign of the coefficient denotes a favorable environmental factor on efficiency, while a negative sign denotes an unfavorable environment on efficiency. The Log likelihood function value of 46.62 and the DECOMP fit measure for the Tobit model of 0.492 indicate that the model specifications chosen are acceptable. Both the dummy variables for the typology of service operator and for its localization significantly influence the efficiency estimate. In particular, the negative sign of the TYPE coefficient reveals that the public operators are less efficient than private or public-private operators, while the positive sign for GEO reveals that the operators that are located and provide water service in the Northern area of Italy are more efficient than the operators in the Central and Southern areas. Finally, the positive coefficient of CON_MUN indicates that a high ratio of connections to the number of municipalities positively affect the estimated efficiency score, supporting the insight that the economies of agglomeration or density may increase the operator efficiency.
Table 6. Efficiency scores.
Public equity operatorsFull private or public-private equity operators
service operatorCRSVRSSEFRTSservice operatorCRSVRSSEFRTS
ALTO CALORE SERVIZI0.710.720.98dACEA ATO 50.520.590.88d
ACQUEDOTTO POIANA0.570.590.95iACQUAENNA0.680.740.92i
ACQUA NOVARA VCO0.550.720.76dACQUE DI CALTANISSETTA0.560.570.99i
CAFC0.460.600.77dSAI 80.520.540.97d
SAL—SOCIETA’ ACQUA LODIGIANA0.610.611.00cGIRGENTI ACQUE0.640.660.98i
SMAT0.710.890.81dACQUE TOSCANE0.931.000.93i
ACQUEDOTTO VALTIGLIONE0.640.690.93iSII del Biellese e Vercellese1.001.001.00c
ACQUEDOTTO DELLA PIANA0.841.000.84iTEA ACQUE0.700.710.99i
UNIACQE0.550.730.75dACQUE0.680.790.86d
ACQUE VICENTINE0.660.661.00cPUBLIACQUA0.650.850.77d
BAS SII0.850.851.00cNUOVE ACQUE0.660.790.83d
POLESINE ACQUE0.590.700.85dACQUEDOTTO DEL FIORA0.570.850.68d
ACQUE VERONESI0.640.770.83dUMBRA ACQUE0.510.780.65d
ACQUE DEL CHIAMPO0.900.901.00cS.I.I. SCPA–Ato20.710.750.95d
IRISACQUA0.600.601.00cACQUALATINA0.840.880.96d
ACAM ACQUE0.730.740.99dGORI0.660.661.00c
CADF0.490.510.97dGEAL0.790.820.96i
GAIA0.580.670.86dIDROTIGULLIO0.921.000.92i
SOCIETA' TENNACOLA0.360.370.99iAM.TER0.650.990.66i
CIIP0.440.460.97dACEA ATO 21.001.001.00c
GRAN SASSO ACQUA0.390.390.99iBRIANZACQUE0.770.780.99d
ACA0.840.850.99d
RUZZO RETI0.530.660.81d
ACQUEDOTTO LUCANO0.400.590.68d
ABBANOA0.580.750.78d
ACDA0.470.490.96d
IDROLARIO0.620.700.88d
PADANIA ACQUE GESTIONI0.991.000.99i
ABC1.001.001.00c
AMAP1.001.001.00c
AMIACQUE0.530.670.79d
AQP0.680.850.80d
mean0.640.710.90mean0.710.800.90
st.dev.0.180.170.10st.dev.0.150.150.12
min0.360.370.68min0.510.540.65
Notes: i = increasing returns to scale; d = decreasing returns to scale; c = constant returns to scale.
Figure 1. Bootstrapped efficiency scores.
Water 05 02058 g001
Table 7. Two-limit Tobit estimates of the stage 2 analysis of water provision operators on factors affecting efficiency.
FactorCoefficientzProb. |z| > Z*Partial effect
constant0.62360 ***16.710.0000
TYPE−0.11895 ***−3.540.0004−0.11888 ***
GEO0.10567 ***3.050.00230.10561 ***
MUN0.167241.340.17920.16714
CON0.051400.390.69550.05137
POP0.000041.150.24960.00004
CON_NET0.072210.870.38240.07217
CON_MUN0.22193 **1.970.04900.22180 **
Sigma0.10040 ***10.300.0000
Log likelihood function46.62068
ANOVA based fit measure0.003528
DECOMP based fit measure0.492241
Notes: ** indicates significant at the five percent and *** significant at the one percent level. Partial derivatives of expected values with respect to the vector of characteristics are computed at the explanatory variable sample means.

5. Discussion and Conclusions

5.1. Result Analysis

In terms of contribution to the literature about the weight that the private sector has on the improvement of the operational performance of the water supply industry in Italy, the findings of this study support the idea that greater efficiency can be associated with the involvement of private operators or the establishment of public-private partnerships, even though they do not indicate a preferential strategy [86]. The Galli Law has the merit of having introduced important changes and innovation in the Italian water supply industry such as an industrial management approach to the production process and the service provision adopting as a business reference an extended territorial area supposed to be optimal (the so called ATO, or Territorial Optimal Area), the adoption of selection mechanisms of the operators based on market competition, the full covering of production costs by tariff revenues, and the regulation task carried on by a local public authority. Furthermore, the Government has made an attempt to set a legal and regulatory framework to stimulate the creation of public-private operators that would have been a good compromise between the traditional in-house water service management of the public sector and the complete service liberalization with the public sector acting only as the regulatory body. Following the orientation of the European Commission, the aim was to stimulate a greater collaboration among different actors providing services in the public utilities industry, public authorities, and private companies to share and collect together the experience and the managerial capabilities necessary to develop, renovate, and manage infrastructure assets and supply water services at an acceptable quality standard. In this new framework, the adoption of an in-house mechanism to award water services would have been pursued only exceptionally, when particular economical, social, environmental, geological or orographic constraints made the market demand unappealing to private operators.
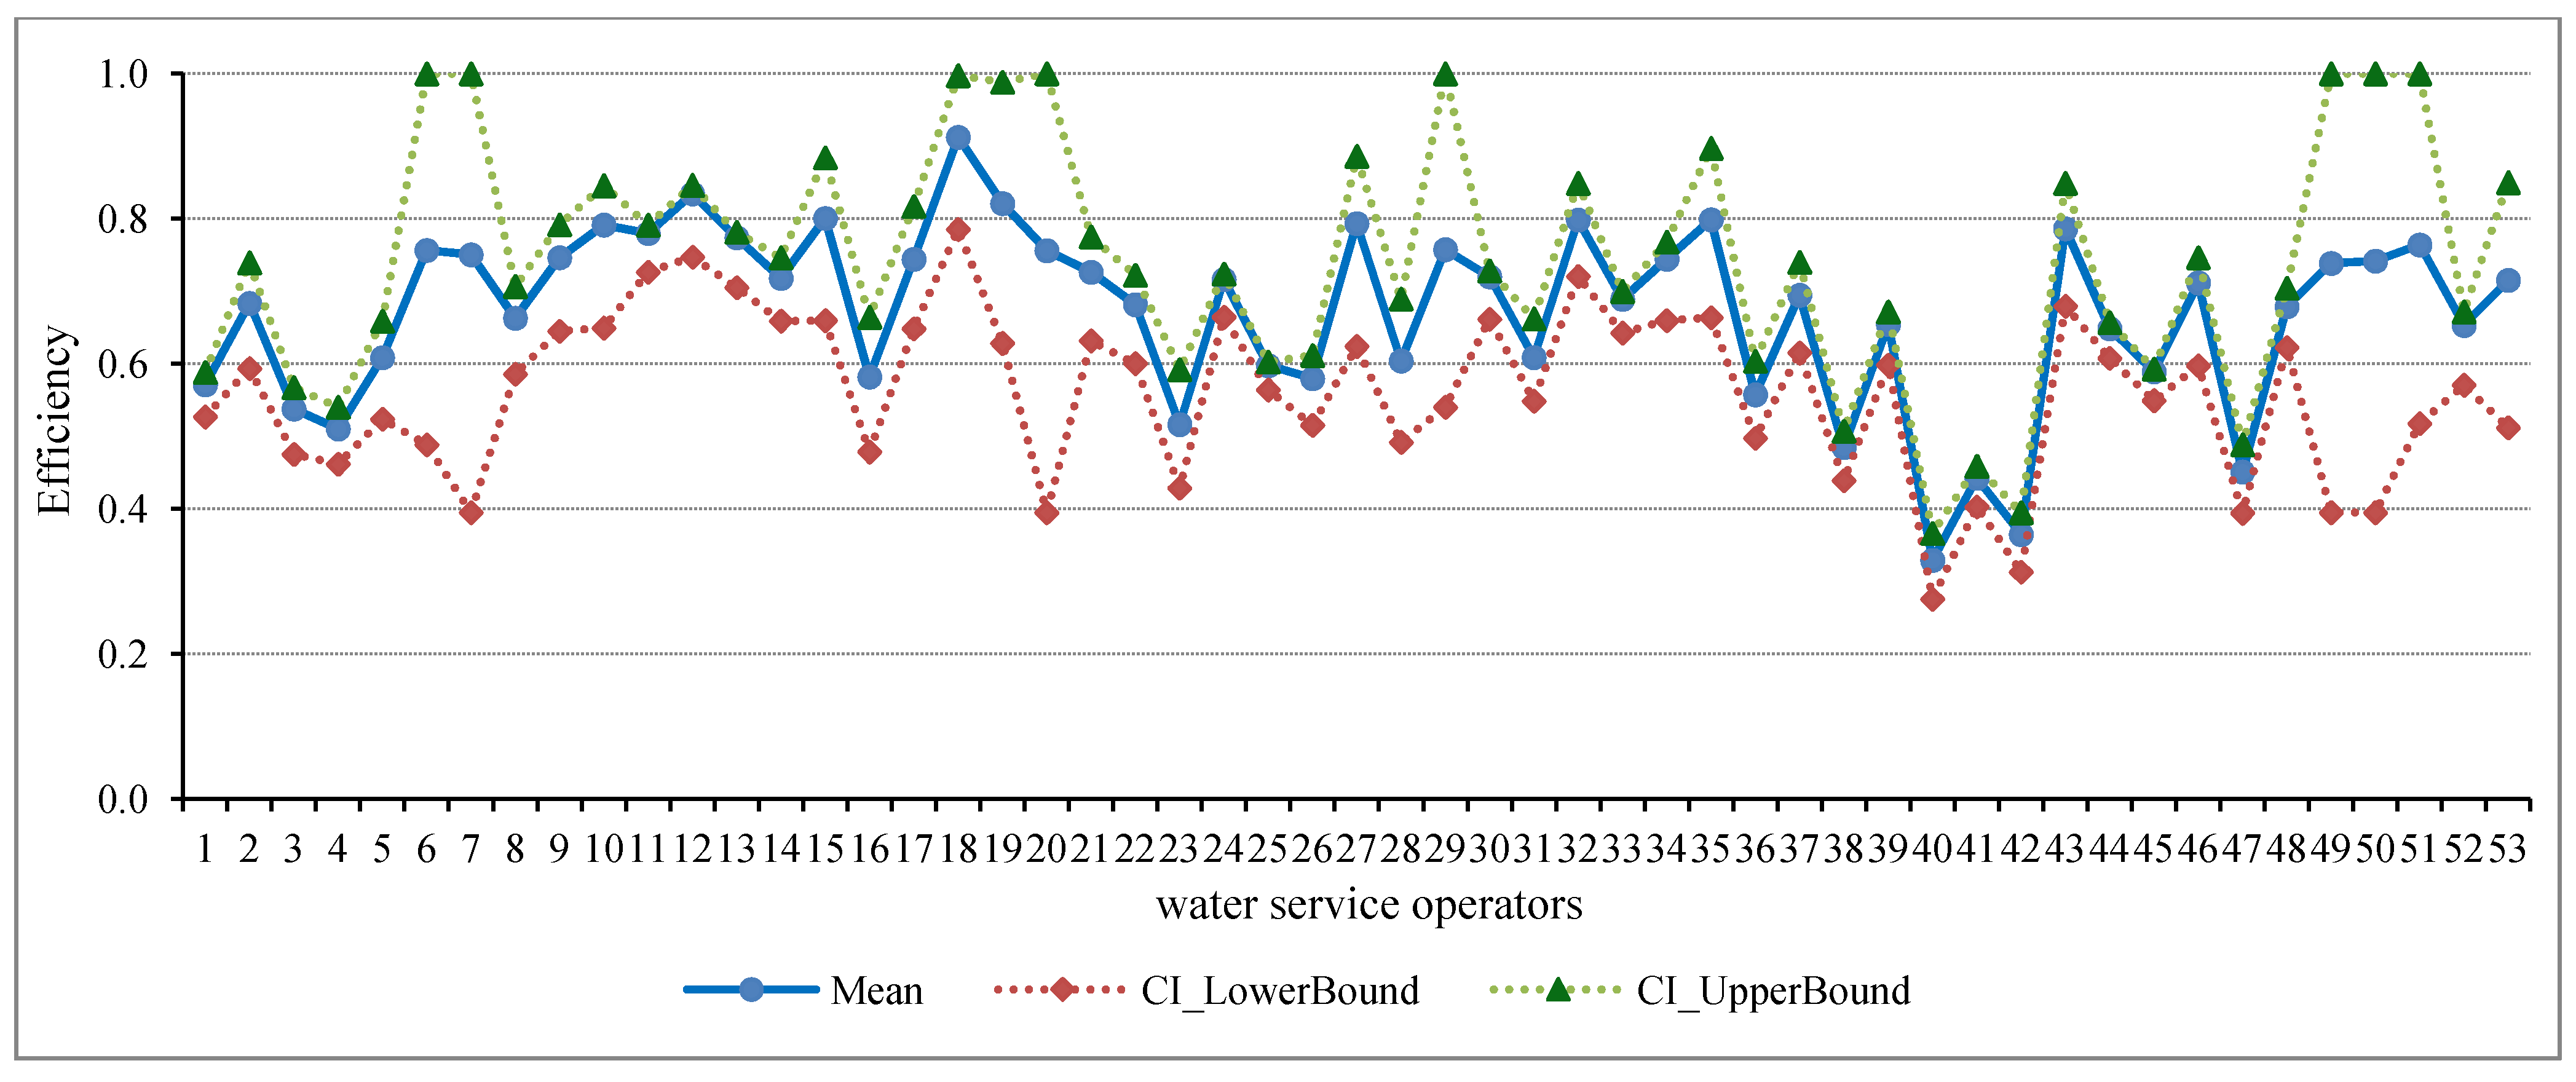
However, the performance study presented in this paper shows that the Italian integrated water supply industry is still characterized by operational inefficiencies of service operators. Thus a major problem is the amount of input used for a certain amount of output delivered. These inefficiencies are common to private or public-private and public operators. The conventional average BCC DEA efficiency for the private or public-private equity operators and the public equity operators are respectively 79.7% and 71.0%, while the corresponding bootstrapped BCC DEA efficiencies are 71.7% and 64.4%. Scale inefficiencies are a major concern in both groups, and scale dis-economies (=decreasing returns to scale) are dominant among public operators. Only a small amount of water suppliers operate at an optimal scale, seven in the public operators group and three in the private/public-private group. The efficiency measures disavow the assumption that in order to achieve an acceptable efficiency and exploit scale economies for every ATO only one operator should be awarded the concession of service. In addition, they question the present size of the ATO. The analysis of the effect of the environmental factors on efficiency has shown that the economies of agglomeration or density can be as important as economies of scale in the search for better organizational design and management setting to improve performance. These findings raise a number of concerns in terms of policy implications.

5.2. Policy Implications

On the one hand, the findings of this study shed light on the debate about the effect that the particular nature of the water service concessionaire and management of the infrastructure assets has on the operational efficiency, and suggest that the involvement of the private sector alone or as a partner of the public sector may be a possible way to increase efficiency. On the other hand, they bring up further questions related to, for instance, the choice of the optimal scale of operations and the target demand amount (i.e., number of connections or water volume) that the single operator should satisfy according to the service contract, the boundary delimitation of the area where the service will be economically delivered, and the consequent identification of the infrastructure sections to be allotted to the operator, and so on. Indeed, the Galli Law has often given privilege to either political or rigid administrative criteria to portion out the total demand of water service to be awarded to different concessionaires, rather than pure economical criteria. The study has shown that large scale is not always associated with cost savings and, consequently, to efficiency improvement, and in particular, a great number of public providers operate at a scale that is above the optimal one. However, often several contextual factors set physical constraints and economical opportunities that cannot be left out from the decision-making process yielding territorial and assets allotment. There is no doubt that the territorial characteristics influence the costs associated with the supply of water. For instance, the origin of the abducted water affects the water purification costs, while the orography, urban agglomeration, population density are all factors that influence the infrastructure network length and articulation, and, as a consequence, determine the cost of using it (for instance, the energy cost to move the water mass). Furthermore, many urban settlements have very obsolete water distribution and sewage networks, with high dispersion rates that in the worst cases are about at 40%. All such issues should be taken into consideration when plans and decisions are made relative to the optimal allotment of areas and infrastructure assets among potential service providers. On the contrary, decision-making might be biased and lead to unacceptable social and economical consequences. The performance analysis has showed how the research question relative to the impact on efficiency of the kind of management approach (public vs. private) in the provision of the water service even though correct might be irrelevant. Indeed, there are public and private providers that may be equally high efficient and, at the same time, there are public and private providers that are unable to achieve acceptable efficiency scores. The true question should be henceforth under what conditions can both public and private operators can become more efficient? The water service has peculiar characteristics that require the adoption of business and management models that differ from those used in other industries, as the public sector has to guarantee full access to service to all citizens under conditions of efficiency and effectiveness and, at the same time, environment protection. The outcome of this study points out that there is no unique efficient business and management model in the Italian water industry. Therefore, the way the business and management models for water supply are identified has to be assessed with great attention to take into account contingent needs and contextual characteristics. For instance, the public-private partnership model might be implemented when the financial resources of the public sector are scarce, and keeping the water network infrastructure in operation needs a large amount of investment from the private sector. The drinking water industry is a capital intensive sector because of the huge amount of investment and long depreciation time, and for these reasons high economical efficiency may be achieved by reducing the cost of capital. The cost of debt in the private sector is generally higher in comparison to that in the public sector. Moreover, investment is irreversible as there are no alternative uses for the infrastructure assets allowing the borne costs to be covered. The underground arrangement of 70%–80% of the infrastructure assets makes any estimation about the state of the network infrastructure difficult and costly; that makes investment by the private sector very risky and accomplishable only if high revenue rates are guaranteed by the tariff system, public subsidies, and the eventual re-negotiation of the contract. Finally, access to good water has to be assured to citizens whatever their income. Transferring subsidies to concessionaires may therefore be necessary to keep tariffs low.
The non-parametric efficiency estimation emphasizes a remarkable variance of the technical efficiency score across the single water providers, leaving room for the implementation of benchmarking practices and adoption of a (yardstick) comparative competition. The regulatory authority would stimulate competition in the market in order to select ex-ante the more efficient providers to be awarded the service within a circumscribed territorial area. In addition, the adoption of benchmarking practices and yardstick competition that stimulate the improvement of the operational performance and quality standards might favorably influence the behavior of water suppliers that are already operating in the market with their movement toward the production efficiency frontier. Of course, both benchmarking practices and competition mechanisms should be extended to public equity operators [87]. Collecting data and monitoring the quality, and economical and social efficiency of service is of paramount importance in the water provision industry, as in all other public utility sectors, because the contractual incompleteness which is typical of concession contracts might induce the concessionaire to adopt opportunistic behavior to the detriment of users. Even though standards and targets are generally well identified in the contract clauses, evaluating the quality and efficiency of the water supply service remains usually a complex and uncertain activity for the public sector, in particular for the local governments, because of the performance measuring capability limitations of the public sector. Greater transparency and the involvement of the users themselves are required as a mitigation measure for that. The Galli Law itself introduced an Observation Agency for the Water Services whose mission was to collect, process and diffuse data related to financial records, quality standards, tariff, and investment carried on by service operators. However, this evaluation body has never been set up.
The Law 42/2010 (the so-called Financial Law) decreed the cancellation of the ATOs as the local regulatory administrative units by the end of 2011, but without introducing a new organization of the water supply industry, but rather adding more ambiguity and contradiction to the legal framework. The recent Referendum held in 2011 has introduced further stickiness in the industry, and no incentives to the entrance of new private players into the water services market, with the partial repeal of regulations governing the determination of the water service tariff. In particular, the Referendum outcome overturned both Art. 15 of the so-called “Ronchi Decree” according to which private companies that wished to enter the public water services industry could do so with “equal treatment and no discrimination”, encouraged to buy up to 70% of any listed public water company, and Article 154 of the “Environmental Code” which established that private water companies could charge as much as they needed to guarantee an adequate return on invested capital and high profit. These new contextual factors put a limitation on the possibility of having recurrent competition in the industry to enhance efficiency and innovation. The absence of effective selection mechanisms based on tendering procedures should be balanced by the introduction of a strong regulation body to evaluate and promote service efficiency, as for example OFWAT in the UK.

5.3. Conclusions

The efficiency analysis has shown that the involvement of the private sector in the management of the infrastructure assets and water services delivery either alone or as a partner of the public sector may contribute to the improvement of the water industry efficiency. However, this is not the only way to gain efficiency because several contextual factors may be equally important as the kind of management implemented. The analysis of the environmental factors found also that both the geographical localization of the concessionaire and agglomeration economies have an influence on the efficiency measurement. The efficiency analysis has also indicated that economies of scale are a relevant economical factor. The unexpected result of this empirical study is the general dominance of scale dis-economies, and in particular, of the decreasing returns connected to scale. A great number of water service operators should henceforth reduce the size of operations in order to increase their operational efficiency. This unexpected outcome of the study contrasts the findings of similar studies that investigated scale economies in the water provision industry, and specifically in the Italian water industry [56,63,88].
The efficiency model implemented did not include any measure of service quality. The quality of service should be an important output of the efficiency model. However, it is not always easy to find information from the operators. In some studies a dispersion index of the infrastructure network is used as a measure of service quality [56,89]. Moreover, in Italy, even though the infrastructure network dispersion may be very relevant, it cannot be often used as a quality index because it does not generally depend on the provider capability.
This study has adopted the perspective of the service operator, focusing on the performance (e.g., operational efficiency) of its production activities, avoiding taking into account the user perspective (e.g., without introducing in the analysis any variable associated to a measure of social benefit, such as the tariff paid by users). Therefore, the results offer a limited picture of the industry and the impact of the service provider typology on performance. This issue merits a more in depth investigation. Indeed, as Pérard [4] claims, most theories on private sector participation in the water provision industry are based on the supposed difference between the private and the public sector in terms of operational efficiency. However, we have to acknowledge that the choice between public and private water service management cannot only be a matter of operational efficiency.

Acknowledgments

I am grateful to the anonymous referees for their helpful comments that contributed to a substantial improvement of this paper.

Conflicts of Interest

The author declares no conflict of interest.

References and Notes

  1. Bassi, A.M.; Tan, Z.; Goss, S. An integrated assessment of investments towards global water sustainability. Water 2010, 2, 726–741. [Google Scholar] [CrossRef]
  2. ANEA—UTILITATIS. Blue Book: I dati sul servizio idrico in Italia—Anno 2009. Available online: http://www.utilitatis.org/book/blue_book/2009bluebook.html (accessed on 13 December 2010).
  3. Abbott, M.; Cohen, B. Productivity and efficiency in the water industry. Util. Policy 2009, 17, 233–244. [Google Scholar] [CrossRef]
  4. Pérard, E. Water supply: Public or private? An approach based on cost of funds, transaction costs, efficiency and political costs. Policy Soc. 2009, 27, 193–219. [Google Scholar] [CrossRef]
  5. Saal, D.; Parker, D. Productivity and price performance in the privatized water and sewerage companies of England and Wales. J. Regul. Econ. 2001, 20, 61–90. [Google Scholar] [CrossRef]
  6. Walter, M.; Cullmann, A.; Hirschhausen, C.; Wand, R.; Zschille, M. Quo vadis efficiency analysis of water distribution? A comparative literature review. Util. Policy 2009, 17, 225–232. [Google Scholar] [CrossRef]
  7. Ferreira da Cruz, N.; Marques, R.C.; Romano, G.; Guerrini, A. Measuring the efficiency of water utilities: A cross-national comparison between Portugal and Italy. Water Policy 2012, 14, 841–853. [Google Scholar] [CrossRef]
  8. Berg, S.V.; Marques, R.C. Quantitative studies of water and sanitation utilities: A benchmarking literature survey. Water Policy 2011, 13, 591–606. [Google Scholar] [CrossRef] [Green Version]
  9. Vinnari, E.M.; Hukka, J.J. Great expectations, tiny benefits—Decision-making in the privatization of Tallin water. Util. Policy 2007, 15, 78–85. [Google Scholar] [CrossRef]
  10. Carvalho, P.; Cunha Marques, R. The influence of the operational environment on the efficiency of water utilities. J. Environ. Manag. 2011, 92, 2698–2707. [Google Scholar] [CrossRef]
  11. Araral, E. The failure of water utilities privatization: Synthesis of evidence, analysis and implications. Policy Soc. 2008, 27, 221–228. [Google Scholar] [CrossRef]
  12. Kirkpatrick, C.; Parker, D.; Zhang, Y.F. An empirical analysis of state and private sector provision of water services in Africa. World Bank Econ. Rev. 2006, 20, 143–163. [Google Scholar] [CrossRef]
  13. Bel, G.; Warner, M. Does privatization of solid waste and water services reduce costs? A review of empirical studies. Resour. Conserv. Recycl. 2008, 52, 1337–1348. [Google Scholar] [CrossRef]
  14. Bhattacharyya, A.; Harris, T.; Narayanon, R.; Raffiee, K. Specification and estimation of the effect of ownership on the economic efficiency of the water utilities. Reg. Sci. Urban Econ. 1995, 25, 759–784. [Google Scholar] [CrossRef]
  15. Saal, D.; Parker, D. The comparative impact of privatization and regulation on productivity growth in the English and Welsh water and sewerage industry, 1985–99. Int. J. Regul. Gov. 2004, 4, 139–170. [Google Scholar]
  16. Olsen, B.E.; Haugland, S.A.; Karlsen, E.; Husoy, G.J. Governance of complex procurements in the oil and gas industry. J. Purch. Supply Manag. 2005, 11, 1–13. [Google Scholar] [CrossRef]
  17. Bhattacharyya, A.; Parker, E.; Raffiee, K. An examination of the effect of ownership on the relative efficiency of public and private water utilities. Land Econ. 1994, 70, 197–209. [Google Scholar] [CrossRef]
  18. Byrnes, P.; Grosskopf, S.; Hayes, K. Efficiency and ownership: Further evidence. Rev. Econ. Stat. 1986, 65, 337–341. [Google Scholar] [CrossRef]
  19. Feigenbaum, S.; Teeples, R. Public versus private water delivery: A hedonic cost approach. Rev. Econ. Stat. 1983, 65, 672–678. [Google Scholar] [CrossRef]
  20. Mann, P.; Mikesell, J. Ownership and water system operation. Water Resour. Bull. 1976, 12, 995–1004. [Google Scholar] [CrossRef]
  21. Bruggink, T.H. Public versus regulated private enterprise in the municipal water industry: A comparison of operating costs. Q. Rev. Econ. Bus. 1982, 22, 111–125. [Google Scholar]
  22. Lambert, D.; Dichev, D.; Raffiee, K. Ownership and sources of inefficiency in the provision of water services. Water Res. 1993, 29, 1573–1578. [Google Scholar] [CrossRef]
  23. Shih, J.; Harrington, W.; Pizer, W.; Gillington, K. Economies of scale in community systems. J. Am. Water Works Assoc. 2006, 98, 100–108. [Google Scholar]
  24. Crain, W.M.; Zardkoohi, A. A test of the property-right theory of the firm: Water utilities in the United States. J. Law Econ. 1978, 21, 395–408. [Google Scholar]
  25. Morgan, D. Investor owned vs. publicly owned water agencies: An evaluation of the property rights theory of the firm. Water Resour. Bull. 1977, 13, 775–781. [Google Scholar] [CrossRef]
  26. Casarin, A.A.; Delfino, J.A.; Delfino, M.E. Failures in water reform: Lessons from the Buenos Aires’s concessions. Util. Policy 2007, 15, 234–247. [Google Scholar] [CrossRef]
  27. Rais, J.C.; Esquivel, M.E.; Sour, S. La concesiòn de los servicios de agua potable y alcantarillado sanitario en Tucumàn Republica Argentina; Public Private Infrastructure Advisory Facility: Washington, DC, USA, 2002. [Google Scholar]
  28. Sabbioni, G. Efficiency in the Brazilian sanitation sector. Util. Policy 2008, 16, 11–20. [Google Scholar] [CrossRef]
  29. Da Silva e Souza, G.; Cohelo de Faria, R.; Belchiair, S.; Moreira, T. Estimating the relative efficiency of Brazilian publicly and privately owned water utilities: A stochastic cost frontier approach. J. Am. Water Resour. Assoc. 2007, 43, 1237–1244. [Google Scholar] [CrossRef]
  30. Seroa da Motta, R.; Moreira, A. Efficiency and regulation in the sanitation sector in Brazil. Util. Policy 2006, 14, 185–195. [Google Scholar] [CrossRef]
  31. Estache, A.; Rossi, M. How different is the efficiency of public and private water companies in Asia? World Bank Econ. Rev. 2002, 16, 139–148. [Google Scholar] [CrossRef]
  32. Dumol, M. The Manila Water Concession: A Key Government Official’s Diary of the World’s Largest Privatization; The World Bank: Washington, DC, USA, 2000.
  33. Wang, H.; Wu, W.; Zheng, S. An econometric analysis of private sector participation in China’s urban water supply. Util. Policy 2011, 19, 134–141. [Google Scholar] [CrossRef]
  34. Estache, A.; Kouassi, E. Sector Organization, Governance and the Inefficiency of African Water Utilities; Policy Research Working Paper, No. 2890; The World Bank: Washington, DC, USA, 2002. [Google Scholar]
  35. Ashton, J. Cost efficiency in the UK water and sewerage industry. Appl. Econ. Lett. 2000, 7, 455–458. [Google Scholar] [CrossRef]
  36. Saal, D.S.; Reid, S. Estimating Opex Productivity Growth in English and Welsh Water and Sewerage Companies 1993–2003; Research Paper, No. 0434; Aston Business School, Ashton University: Birmingham, UK, 2004. [Google Scholar]
  37. Shaoul, J. A critical financial analysis of the performance of the privatized industries: The case of the water industry in England and Wales. Crit. Perspect. 1997, 8, 479–505. [Google Scholar] [CrossRef]
  38. Dore, M.H.I.; Kushner, J.; Zummerer, K. Privatization of water in the UK and France—What can we learn? Util. Policy 2004, 12, 41–50. [Google Scholar] [CrossRef]
  39. Garcia-Sanchez, I. Efficiency measurement in Spanish local government: The case of municipal water services. Rev. Policy Res. 2006, 23, 355–371. [Google Scholar] [CrossRef]
  40. Marques, R.C. Comparing private and public performance of Portuguese water services. Water Policy 2008, 10, 25–42. [Google Scholar]
  41. International Monetary Fund; Public-Private Partnerships. Technical Report Prepared by the Fiscal Affairs Department, 2004. Available online: http://www.imf.org/external/np/fad/2004/pifp/eng/031204.htm (accessed on 10 June 2013).
  42. Simoes, P.; de Witte, K.; Marques, R.C. Regulatory structures and the operational environment in the Portuguese solid waste sector. Waste Manag. 2010, 30, 1130–1137. [Google Scholar] [CrossRef]
  43. Charnes, A.; Cooper, W.; Rhodes, E. Measuring the efficiency of decision-making units. Eur. J. Oper. Res. 1978, 3, 429–444. [Google Scholar] [CrossRef]
  44. Curi, C.; Gitto, S.; Mancuso, P. New Evidence on the efficiency of Italian airports: A bootstrapped DEA analysis. Socio-Econ. Plan. Sci. 2011, 45, 84–93. [Google Scholar] [CrossRef] [Green Version]
  45. Ceccobelli, M.; Gitto, S.; Mancuso, P. ICT capital and labour productivity: A non-parametric analysis of 14 OECD countries. Telecommun. Policy 2012, 36, 282–292. [Google Scholar] [CrossRef]
  46. lo Storto, C. Gas distribution in Italy: A non parametric analysis of companies operational efficiency. Adv. Mater. Res. 2013, 838–841, 1972–1978. [Google Scholar] [CrossRef]
  47. lo Storto, C.; Ferruzzi, G. Benchmarking economical efficiency of renewable energy power plants: A data envelopment analysis approach. Adv. Mater. Res. 2013, 772, 699–704. [Google Scholar] [CrossRef]
  48. Goncharuk, A.G. Performance benchmarking in gas distribution industry. Benchmarking 2008, 15, 548–559. [Google Scholar] [CrossRef]
  49. Lam, P.L.; Shiu, A. A data envelopment analysis of the efficiency of China’s thermal power generation. Util. Policy 2001, 10, 75–83. [Google Scholar] [CrossRef]
  50. Marques, R.; Simoes, P. Incentive regulation and performance measurement of the Portuguese solid waste management services. Waste Manag. Res. 2009, 27, 188–196. [Google Scholar] [CrossRef]
  51. Byrnes, J.; Crase, L.; Dollery, B.; Villano, R. The relative economic efficiency of urban water utilities in regional New South Wales and Victoria. Resour. Energy Econ. 2010, 32, 439–455. [Google Scholar] [CrossRef]
  52. Cubbins, J.; Tzanikadis, G. Regression versus data envelopment analysis for efficiency measurement: An application to the England and Wales regulated water industry. Util. Policy 1998, 7, 75–85. [Google Scholar] [CrossRef]
  53. Garcia-Valiñas, M.A.; Muñiz, M.A. Is DEA useful in the regulation of water utilities? A dynamic efficiency evalutation. Appl. Econ. 2007, 39, 245–252. [Google Scholar] [CrossRef]
  54. Hernández-Sancho, F.; Molinos-Senante, M.; Sala-Garrido, R.; del Saz-Salazar, S. Tariffs and efficient performance by water suppliers: An empirical approach. Water Policy 2012, 14, 854–864. [Google Scholar] [CrossRef]
  55. Lin, C.; Berg, S.V. Incorporating service quality into yardstick regulation: An application to the Peru water sector. Rev. Ind. Organ. 2008, 32, 53–75. [Google Scholar] [CrossRef] [Green Version]
  56. lo Storto, C. Investment efficiency in the Italian water service industry: A benchmarking study using data envelopment analysis (DEA). Int. J. Eng. Manag. Econ. 2011, 2, 293–312. [Google Scholar] [CrossRef]
  57. lo Storto, C. Benchmarking in the Public Service Industry: The Italian Water Service Management Sector. In Proceedings of the IEEE International Conference on Industrial Engineering and Engineering Management, Singapore, 6–9 December 2011; pp. 1145–1149.
  58. lo Storto, C. Benchmarking operational efficiency in the integrated water service provision: Does contract type matter? Benchmarking 2015, 22. in press. [Google Scholar]
  59. Kulshrestha, M.; Vishwakarma, A. Efficiency evaluation of urban water supply services in an Indian state. Water Policy 2013, 15, 134–152. [Google Scholar] [CrossRef]
  60. Mahmoudi, M.J.; Fathi, B.; Sajadifar, H.; Shahsavari, A. Measuring efficiency of water and wastewater company: A DEA approach. Res. J. Appl. Sci. Eng. Technol. 2012, 4, 1642–1648. [Google Scholar]
  61. Raju, S.K.; Kumar, N.D. Ranking irrigation planning alternatives using data envelopment analysis. Water Resour. Manag. 2006, 20, 553–566. [Google Scholar] [CrossRef]
  62. Rodríguez Díaz, J.A.; Camacho Poyato, E.; López Luque, R. Applying benchmarking an data envelopment analysis (DEA) techniques to irrigation districts in Spain. Irrig. Drain. 2004, 53, 135–143. [Google Scholar] [CrossRef]
  63. Romano, G.; Guerrini, A. Measuring and comparing the efficiency of water utility companies: A data envelopment analysis approach. Util. Policy 2011, 19, 202–209. [Google Scholar] [CrossRef]
  64. Alsharif, K.A.; Feroz, E.H.; Klemer, A.; Raab, R.L. Supply systems in the Palestinian Territories: A data envelopment analysis approach to the management of water resources. J. Env. Manag. 2008, 87, 80–94. [Google Scholar] [CrossRef]
  65. Singh, M.; Upadhyay, V.; Mittal, A. Addressing sustainability in benchmarking framework for Indian urban water utilities. J. Infrastruct. Syst. 2010, 16, 81–92. [Google Scholar] [CrossRef]
  66. Thanassoulis, E. The use of data envelopment analysis in the regulation of UK water utilities: Water distribution. Eur. J. Oper. Res. 2000, 126, 436–453. [Google Scholar] [CrossRef]
  67. Thanassoulis, E. DEA and its use in the regulation of water companies. Eur. J. Oper. Res. 2000, 127, 1–13. [Google Scholar] [CrossRef]
  68. Tupper, H.C.; Resende, M. Efficiency and regulatory issues in the Brazilian water and sewage sector: An empirical study. Util. Policy 2004, 12, 29–40. [Google Scholar] [CrossRef]
  69. De Witte, K.; Marques, R.C. Designing performance incentives, an international benchmark study in the water sector. Cent. Eur. J. Oper. Res. 2010, 18, 189–220. [Google Scholar] [CrossRef]
  70. Cooper, W.W.; Seiford, L.M.; Tone, K. Data Envelopment Analysis: A Comprehensive Text with Models, Applications, References and DEA-Solver Software, 2nd ed.; Springer: New York, NY, USA, 2007. [Google Scholar]
  71. Banker, R.D.; Charnes, A.; Cooper, W.W. Some models for estimating technical and scale inefficiencies in data envelopment analysis. Manag. Sci. 1984, 30, 1078–1092. [Google Scholar] [CrossRef]
  72. Fare, R.; Grosskopf, S.; Lovell, C.A.K. The Measurement of Efficiency of Production; Kluwer-Nijhoff: Boston, MA, USA, 1985. [Google Scholar]
  73. Coelli, T.J.; Rao, D.S.P.; Battese, G.E. An Introduction to Efficiency and Productivity Analysis; Kluwer: Boston, MA, USA, 1998. [Google Scholar]
  74. Banker, R.D.; Natarajan, R. Evaluating contextual variables affecting productivity using data envelopment analysis. Oper. Res. 2008, 56, 48–58. [Google Scholar] [CrossRef]
  75. Simar, L.; Wilson, P.W. Estimation and inference in two-stage, semi-parametric models of productive efficiency. J. Econ. 2007, 136, 31–64. [Google Scholar] [CrossRef]
  76. Simar, L.; Wilson, P.W. Two-stage DEA: Caveat emptor. J. Prod. Anal. 2011, 36, 205–218. [Google Scholar] [CrossRef]
  77. CONVIRI. Relazione annuale al Parlamento sullo stato dei servizi idrici—Anno 2009; Fotolampo srl: Campobasso, Italy, 2010. [Google Scholar]
  78. CONVIRI. Rapporto sullo stato dei servizi Idrici: Situazione organizzativa, Investimenti, Tariffe Criticità—Anno 2010; Commissione nazionale per la vigilanza sulle risorse idriche: Roma, Italy, 2011. [Google Scholar]
  79. ANEA—UTILITATIS. Blue Book: I dati sul servizio idrico in Italia—Anno 2008. Available online: http://www.utilitatis.org/book/blue_book/2008bluebook.html (accessed on 13 December 2010).
  80. The particular operator typology influences the nature of market competition. Indeed, while private equity companies have to compete to enter a local water supply market and to be awarded the concession to provide water services, public-private equity companies may compete either to enter the local water supply market or to purchase equity shares of a public company that is already operating in the market.
  81. In the concession agreement, the right to use the infrastructure assets and to provide water services is transferred by the contracting authority, i.e., a local municipality or a regional government, to a concessionaire. While the concessionaire is entitled to use the infrastructure and is obliged to ensure required maintenance, and has to pay a concession fee, the contracting authority remains the sole owner of the assets.
  82. Ball, S.D.; Johnson, K.; Slattery, P. Labor productivity in hotels: An empirical study. Int. J. Hosp. Manag. 1986, 13, 141–147. [Google Scholar]
  83. The total production cost includes the following cost items: employees, maintenance, depreciation, materials and consumables, services, provision for liabilities and charges.
  84. The “number of connections”, “number of municipalities” and “population amount” variables are not under the operators’control because, as a result of the tendering procedure, the concession awarded to the service providers to supply drinking water and sewerage determines a local monopolistic market with no competition.
  85. In the first group, the efficiency measurement of Padania Acque Gestioni is close to 100%. In the second group, the efficiency scores of both Acque Toscane and Idrotigullio are higher than 90%.
  86. Similar findings emerged from a recent empirical study [58]. That study adopted the ATO (Optimal Territorial Area) as the research unit and investigated the effect that the nature of service operators and the typology of water service provision contracts have on the ATO operational efficiency. The study showed that the operational efficiency measurement is higher in those ATOs in which water services are mostly provided by private equity operators or by public-private equity operators.
  87. At an international level there is full agreement about the usefulness of such a kind of practices. The recent ISO standards relative to the water service supply (i.e., ISO 24510:2007, ISO 24511:2007 and ISO 24512:2007) provide guidelines for the evaluation, improvement and efficient management of drinking and wastewater systems.
  88. The scale of operations and the agglomeration economies emerged as important determinants of the operational efficiency of the ATOs (Optimal Territorial Areas) in the Italian water supply industry [56]. However, adopting the ATO as the research unit rather than the single service operator, research findings showed that scale dis-economies due to increasing returns to scale are dominant over scale dis-economies due to decreasing returns to scale. Thus, the perspective from which the benchmarking analysis is conducted, efficiency is measured, and scale effects are investigated, should be consistent with the goal of the performance study.
  89. Picazo-Tadeo, A.J.; Sáez-Fernández, F.J.; González-Gómez, F. Does service quality matter in measuring performance of water utilities? Util. Policy 2008, 16, 30–38. [Google Scholar] [CrossRef]

