Article

Development of a Web-Based L-THIA 2012 Direct Runoff and Pollutant Auto-Calibration Module Using a Genetic Algorithm

1
Regional Infrastructure Engineering, Kangwon National University, Chuncheon, Gangwon 200-701, Korea
2
Geoinformatic Engineering Research Institute, Inha University, Namgu, Incheon 402-751, Korea
3
Water Pollution Load Management Research Division, National Institute of Environmental Research, Seogu, Incheon 404-708, Korea
4
Agricultural Biological Engineering, Purdue University, West Lafayette, IN 47907-2093, USA
5
Department of Biological and Agricultural Engineering, Texas A&M University, College Station, TX 77843-2117, USA
*
Author to whom correspondence should be addressed.
Water 2013, 5(4), 1952-1966; https://doi.org/10.3390/w5041952
Submission received: 1 July 2013 / Revised: 14 November 2013 / Accepted: 20 November 2013 / Published: 27 November 2013

Abstract

:
The Long-Term Hydrology Impact Assessment (L-THIA) model has been used as a screening evaluation tool in assessing not only urbanization, but also land-use changes on hydrology in many countries. However, L-THIA has limitations due to the number of available land-use data that can represent a watershed and the land surface complexity causing uncertainties in manually calibrating various input parameters of L-THIA. Thus, we modified the L-THIA model so that could use various (twenty three) land-use categories by considering various hydrologic responses and nonpoint source (NPS) pollutant loads. Then, we developed a web-based auto-calibration module by integrating a Genetic-Algorithm (GA) into the L-THIA 2012 that can automatically calibrate Curve Numbers (CNs) for direct runoff estimations. Based on the optimized CNs and Even Mean Concentrations (EMCs), our approach calibrated surface runoff and nonpoint source (NPS) pollution loads by minimizing the differences between the observed and simulated data. Here, we used default EMCs of biochemical oxygen demand (BOD), total nitrogen (TN), and total phosphorus-TP (as the default values to L-THIA) collected at various local regions in South Korea corresponding to the classifications of different rainfall intensities and land use for improving predicted NPS pollutions. For assessing the model performance, the Yeoju-Gun and Icheon-Si sites in South Korea were selected. The calibrated runoff and NPS (BOD, TN, and TP) pollutions matched the observations with the correlation (R2: 0.908 for runoff and R2: 0.882–0.981 for NPS) and Nash-Sutcliffe Efficiency (NSE: 0.794 for runoff and NSE: 0.882–0.981 for NPS) for the sites. We also compared the NPS pollution differences between the calibrated and averaged (default) EMCs. The calibrated TN and TP (only for Yeoju-Gun) EMCs-based pollution loads identified well with the measured data at the study sites, but the BOD loads with the averaged EMCs were slightly better than those of the calibrated EMCs. The TP loads for the Yeoju-Gun site were usually comparable to the measured data, but the TP loads of the Icheon-Si site had uncertainties. These findings indicate that the web-based auto-calibration module integrated with L-THIA 2012 could calibrate not only the surface runoff and NPS pollutions well, but also provide easy access to users across the world. Thus, our approach could be useful in providing a tool for Best Management Practices (BMPs) for policy/decision-makers.

1. Introduction

Typically, urbanization leads to increases in impervious surface and results in increased runoff and nonpoint source (NPS) pollutant loads. Urbanization closer to a stream might be more influential than that far from a stream because the increased runoff and NPS pollutant loads flow directly into the stream. In South Korea, approximately 90% of the population live in urban areas, and the percentage is still increasing with urbanization. In order to alleviate the impacts of urbanization, various researches and government regulations regarding point source (PS) and NPS pollutants have been actively implemented [1,2]. The Ministry of Environment (MOE) in South Korea has developed national water quality improvement strategies to reduce the NPS pollutants entering into watersheds [3]. Therefore, modeling approaches that can simulate runoff and NPS pollutant loads at regional-/watershed-scales are required and have been developed such as Areal Nonpoint Source Watershed Environment Response Simulation (ANSWER) [4], Agriculture Nonpoint Source (AGNPS) [5], Soil and Water Assessment Tool (SWAT) [6], Hydrological Simulation Program-FORTRAN (HSPF) [7], and Storm Water Management Model (SWMM) [8], etc. Harbor [9] developed a spreadsheet version of the Long-Term Hydrologic Impact Assessment (L-THIA) model to evaluate the impacts of land-use changes on hydrology, and the model has been improved by many researchers [10,11,12,13,14,15]. However, the number of limited land-uses (i.e., high density residential, low density residential, agricultural, grass or pasture, forest, industrial, water) was only allowed in modeling with the previous L-THIAs. Currently, many land-use categories available exist in watershed-scales while some land-use data were only allowed in the L-THIA models. This discrepancy between field-scale and model-based land-use data might cause uncertainties in simulating runoff and NPS pollutant loads indicating that the consideration of spatially distributed land-use existing in a watershed is required. The previous L-THIAs were limited not only in land-use categories, but also Event Mean Concentrations (EMC) data. The EMCs used in the previous L-THIAs were collected from Texas (USA) while the EMC values might be different based on various watersheds, climate conditions, land uses, etc. In general, hydrological and water quality models require calibration processes that can adjust model conditions (i.e., input parameters, etc.) closer to specific study regions. Then, models may appropriately simulate/reproduce hydrological processes that can represent real world conditions in the field. However, the land surface has variations (due to different soils, vegetation, topography, etc.) indicating that hydrological models require various input parameters/data in modeling in the field. It might suggest that the calibration and validation processes could be limited when conditioning input parameters manually. These drawbacks may be an issue regarding the reliability of modeling approaches when applied to a real world condition. Thus, optimization approaches that can search model parameters from unknown spaces might be helpful to better simulate hydrological processes across the land surface. To date, various optimization schemes (i.e., Generalized Likelihood Uncertainty Estimation (GLUE) [16,17], Genetic Algorithm (GA) [18,19,20,21], Shuffled Complex Evolution-University of Arizona, SCE-UA [15,22]) have been developed/used in research areas. And various physically-based hydrological models have been integrated with optimizations for their own purposes. However, these optimization-simulation approaches adapting their own model parameterizations and structures still have drawbacks, and the complexity of existing models might limit their availability in application in the field.
Thus, we explored a web-based auto-calibration approach that can estimate land surface runoff and pollutant loads under various land surface conditions. The objectives of this study was three-fold: (1) to develop a genetic algorithm-based automatic calibration module for improving the performance of Long-Term Hydrologic Impact Assessment (L-THIA) models; (2) to test our approach in simulating runoff and pollutant load estimations using the sub-daily (hourly-based) time step and event mean concentrations (EMCs) with various land uses and rainfall criteria; and (3) to provide a web-based L-THIA model for a better and easier application by policy/decision makers. This study will greatly assist in preventing water pollution and suggest better water resource management at watershed scales.

2. Materials and Methods

2.1. Overview of the L-THIA

The L-THIA model is a straightforward model to assess the impacts of land-use changes on land surface runoff and non-point source (NPS) pollutions. This model requires minimum model input parameters to generate surface runoff based on curve numbers (CNs) that can be determined by land-use and hydrologic soil group (HSG) data. The initial L-THIA model was developed based on the spreadsheet versions for calculating surface runoff using land-use changes. Currently, L-THIA incorporated with the ArcView platform [15] is improved to calibrate model parameters using SCE-UA. However, this model was still limited by not only considering the sub-daily (hourly-based) time step, but also by calibrating EMCs for various rainfall intensities and land-uses. Also, the ArcView GIS system requires minimum skills to be used by users. For these reasons, we developed a web-based auto-calibration module that can calibrate simulated sub-daily runoff and NPS pollutions based on various rainfall intensities and land-use classifications for the L-THIA model. Here, we adapted a runoff model developed by Kum et al. [23] for estimating direct surface water runoff. Figure 1 shows the schematic diagram of our approach to calibrating direct runoff and nonpoint source pollutant loads in the field. In order to search optimized CN values ranged from 20 to 99, a Genetic Algorithm (GA, [18]) was integrated with the L-THIA model, called the automatic calibration module. Our newly developed auto-calibration module with integrated GA estimates direct runoff based on optimized CN values. Then our approach calibrates NPS pollutions based on the optimized CNs and EMCs. Note that the calibration ranges (±30%) for EMCs were constrained in the module. Figure 2 shows the GA performance for searching solutions (CNs and EMCs). GA is one of the existing powerful search algorithms developed by Holland [18] and Goldberg [24]. To date, GAs have been extended/improved through various updated versions [24,25,26,27,28,29]. Parameters (P1 = {CNi = 1,…,M}; P2 = {EMCj = 1,…,N}) to be searched are represented by chromosomes (genes) in an array. New random parameters were reproduced through the GA operator comprised of selection, crossover, and mutation processes as shown in Figure 1. Then, GAs evaluate the suitability of chromosomes (P1, P2) using the Nash-Sutcliffe Efficiency [NSE(P1, P2)] in Equation (1) and search/tune(optimized) parameters by minimizing the differences between observations and simulations in the given generations:
Water 05 01952 i001
where, Obst is the observed runoff, nonpoint source pollutant load at time t, Simt is the simulated runoff, nonpoint source pollutant load at time t, Obsavg is the average of observations, t is the time running index, M is the number of CN values, and N is the number of EMC values. The GA control variables are shown in Table 1.
Table 1. Variables to control genetic algorithm used in this study.
GA control variablesValues
Population size100
Number of generation500
Number of significant digits5
Crossover probability0.85
Initial mutation rate0.005
Minimum mutation rate0.0005
Maximum mutation rate0.25
One of the outstanding benefits in the sense of user-friendliness is that the web-based model can allow users to modify input data on the web and send model outputs via the user’s email. Thus, the web-based L-THIA model could be more useful not only for estimating surface runoff and NPS pollutions, but also for providing easy applications across the world. When NSE values are within the range of 0.0 to 0.5, the model selects the calibrated results with the highest NSE. Note that calibrated results (NSE < 0.0) were not used in this study.
Figure 1. Overview of genetic algorithm (GA).
Water 05 01952 g001
Figure 2. Schematic diagram of direct runoff and pollutant calibration in the Long-Term Hydrology Impact Assessment (L-THIA) 2012 model.
Water 05 01952 g002

2.2. Characteristics of Non-Point Source Pollution Loads with Classifications of Various Land Use and Rainfall Criteria

NPS pollution loads are usually influenced not only by surface runoff and pollutants, but also by rainfall quantities and intensities [30] based on land-use data in the field, because water qualities may vary with rainfall characteristics. Also, other environmental factors (i.e., timing/distribution of rainfall events, land covers and changes, nutrient/pesticide residuals in the soil matrix, etc.) need to be considered. In order to more accurately capture runoff and NPS pollutions, the South-Korean government provides the EMCs (that represent the whole country) for biochemical oxygen demand (BOD), total nitrogen (TN), and total phosphorus (TP) corresponding to the classifications of various (twenty three) land-use data and rainfall intensities (see details in Table 2, [31,32,33,34]). Note that the twenty-three land-use data in Korea were classified as shown in Table 2, but that the EMC data for the inland wetland, costal wetland, water, and sea were not available. These EMC values, used as the default values for L-THIA, have differing ranges of less than 10, 10–30, 30–50, and more than 50 mm, respectively. Here, L-THIA 2012 can use the maximum 92 hydrologic response units (HRUs) based on the twenty-three land-use categories suggested by the Korean Ministry of Environment (MOE) and the four hydrologic soil group (HSG) comprised of A, B, C, and D. In order to assess the applicability of our proposed model, we calibrated the GA-based L-THIA model using the measured direct runoff and pollutant loads. Also, we averaged the default EMCs (in Table 2) with respect to the different rainfall intensities and individual land-use data. Then, we estimated and compared the averaged-/calibrated-EMCs based NPS pollutant loads using the measured runoff to evaluate the robustness of our approach in adjusting EMCs.
Table 2. Default (Measured) Event Mean Concentrations (EMCs) of biochemical oxygen demand (BOD), total nitrogen (TN), and total phosphorus (TP).
Rainfall rangesKorean ministry of environment—event mean concentration (mg/L)
Below 10 mm10–30 mm30–50 mmOver 50 mm
water quality itemsBODTNTPBODTNTPBODTNTPBODTNTP
Residential6.17.10.27.37.00.27.02.70.22.86.40.4
Industrial53.78.31.229.74.10.612.04.40.13.92.00.1
Commercial16.82.81.321.13.10.520.42.11.39.81.51.4
Leisure24.25.41.864.82.90.719.94.70.516.14.60.7
Transportation12.33.01.36.82.60.25.52.20.22.31.10.1
Public building7.97.30.39.05.90.34.81.60.14.76.70.7
Paddy4.02.20.23.92.50.63.93.10.33.72.70.4
Upland0.00.00.016.92.42.413.65.42.340.78.610.3
Green house7.82.20.611.84.51.711.05.53.212.44.52.1
Orchard0.00.00.01.00.40.13.71.50.22.52.00.4
Other Crop0.00.00.00.00.00.04.410.11.32.05.71.4
Deciduous forest1.21.70.11.22.00.11.83.30.22.11.80.5
Coniferous forest1.11.80.11.11.90.01.22.40.00.91.70.0
Mixed forest1.21.80.11.80.60.01.81.60.10.91.80.0
Golf course4.67.11.56.14.81.36.26.91.93.94.91.5
Pasture3.62.00.56.82.60.63.92.40.33.42.00.7
Grass3.62.00.56.82.60.63.92.40.33.42.00.7
Mining area15.65.50.212.42.60.919.82.30.713.32.20.7
Barren15.65.50.212.42.60.919.82.30.713.32.20.7
Inland wetland
Costal wetland
Water
Sea

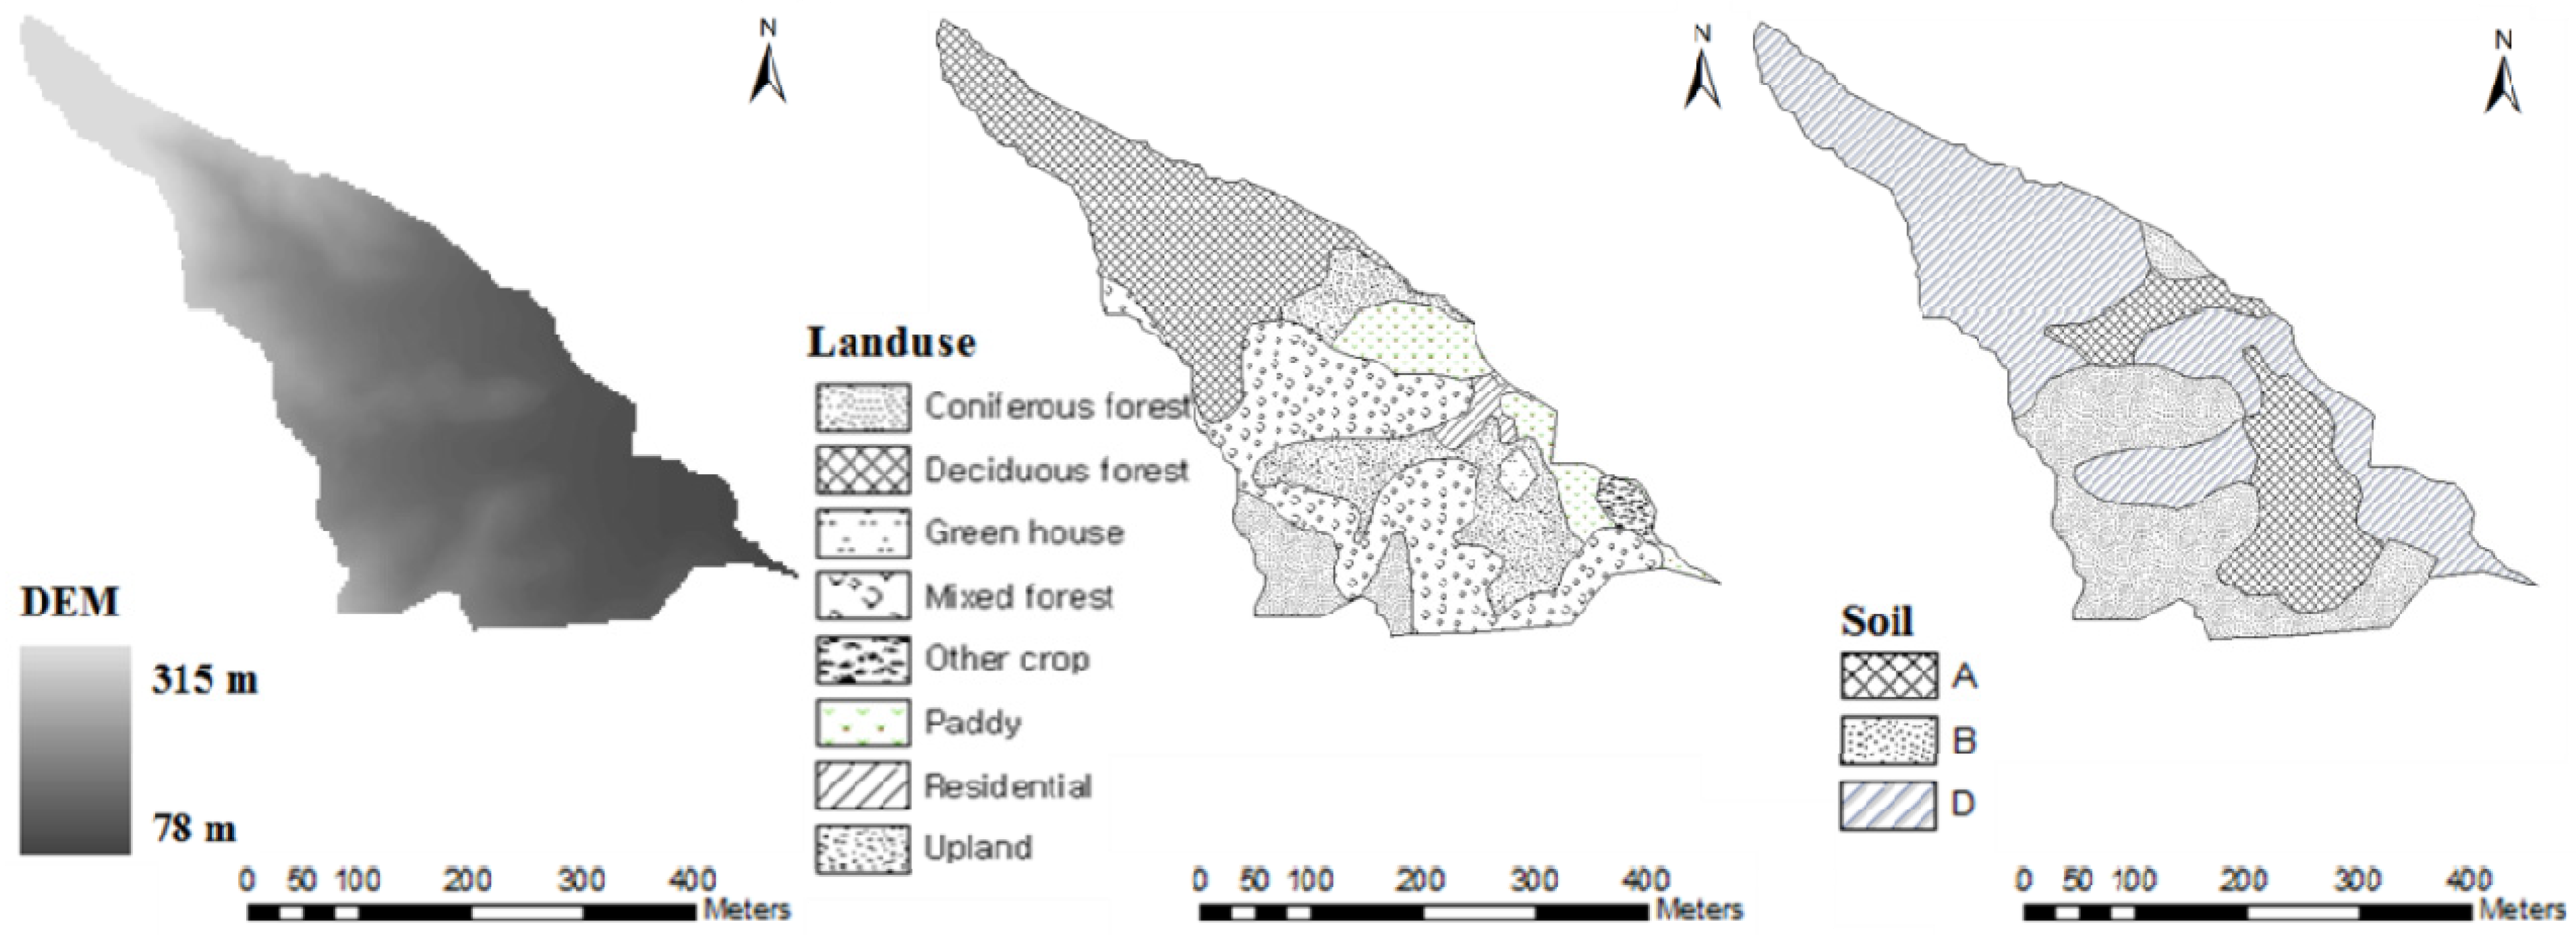
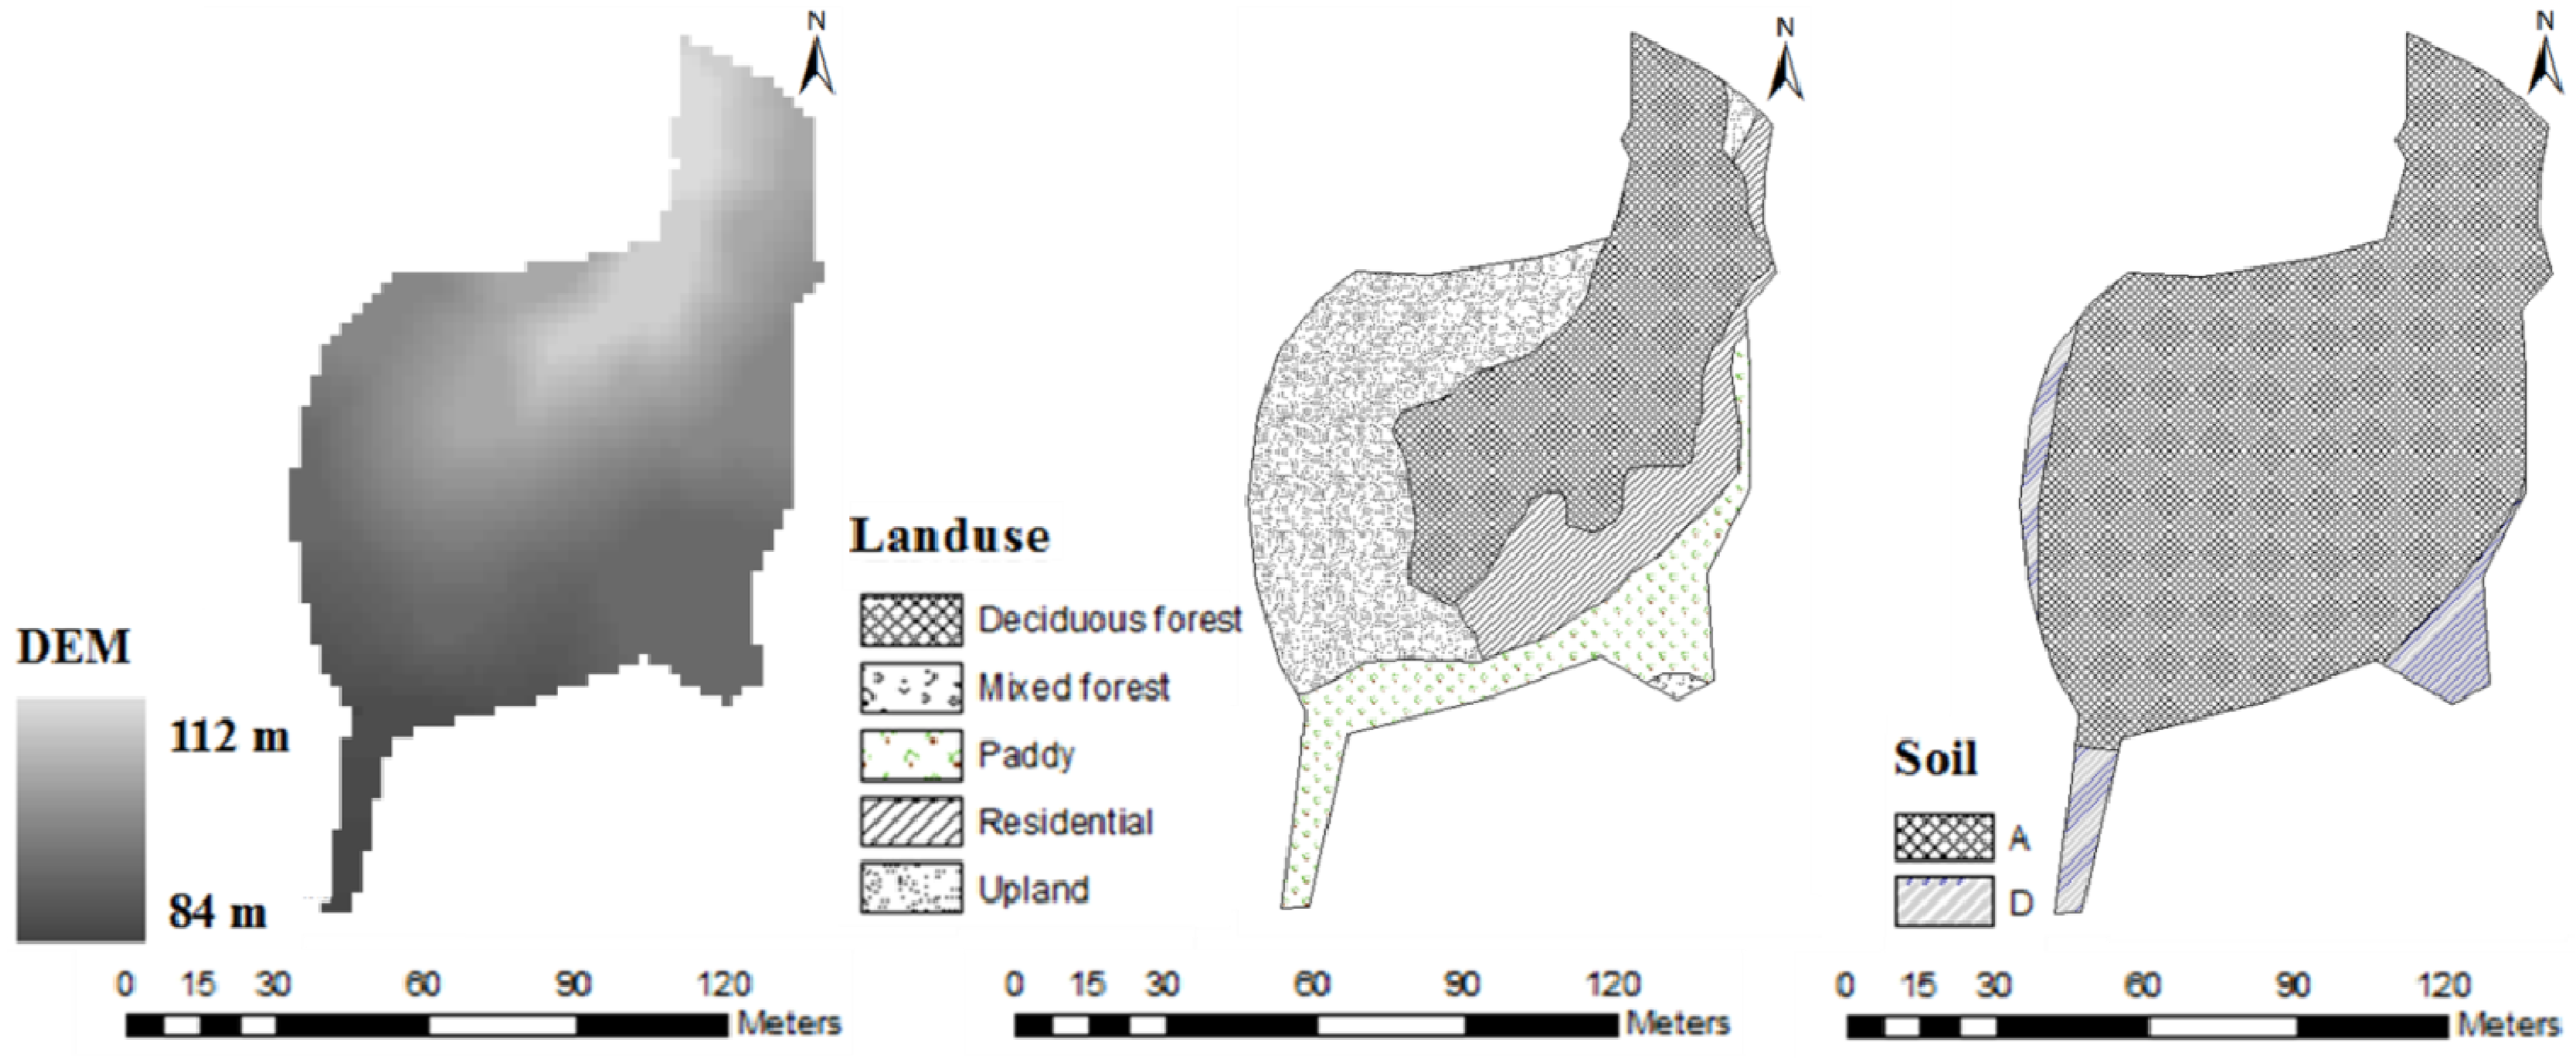
2.3. Application of L-THIA 2012

The Yeoju-Gun and Icheon-Si sites are located within the Paldang watershed (South-Korea) as shown in Figure 3 and are exposed to NPS pollutants generated by frequent overflows at outfalls of storm sewers within urbanized areas during the summer monsoon period. For this reason, systematic and effective methods that can prevent NPS pollutions need to be developed.
Figure 3. Location of study area, Yeoju-Gun and Icheon-Si, South Korea.
Water 05 01952 g003
Figure 4 and Figure 5 present the outfalls of two sites within the watershed. The land-use data from the MOE, the soil map from the National Academy of Agricultural Science (NAAS) of South Korea, and the digital elevation model (DEM, 5 m × 5 m) in Figure 4 and Figure 5 were collected to derive Hydrologic Response Units (HRUs). The soil map was converted to represent the four HSG, and then DEM was used to compute the slope and slope length. The ten-minute interval data of rainfall, runoff, and NPS pollutant loads were measured for the six storm events in 2011 as shown in Table 3. Here, our approach was only tested during the simulation period in 2011, because of the limited EMCs.
Figure 4. Digital elevation model (DEM), land-use, soil map of study area, Yeoju-Gun, SouthKorea.
Water 05 01952 g004
Figure 5. DEM, land-use, soil map of study area, Icheon-Si, SouthKorea.
Water 05 01952 g005
Table 3. The rainfall amounts for the six storm events.
Yeoju-GunIcheon-Si
DateRainfall (mm)DateRainfall (mm)
22 April 201130.58 July 2011104.5
30 April 201180.58 August 201150.0
23 June 201131.213 August 201167.0
13 August 201148.811 September 2011124.5
29 September 201123.429 September 201128.5
6 November 201115.815 October 201160.0

3. Results and Discussion

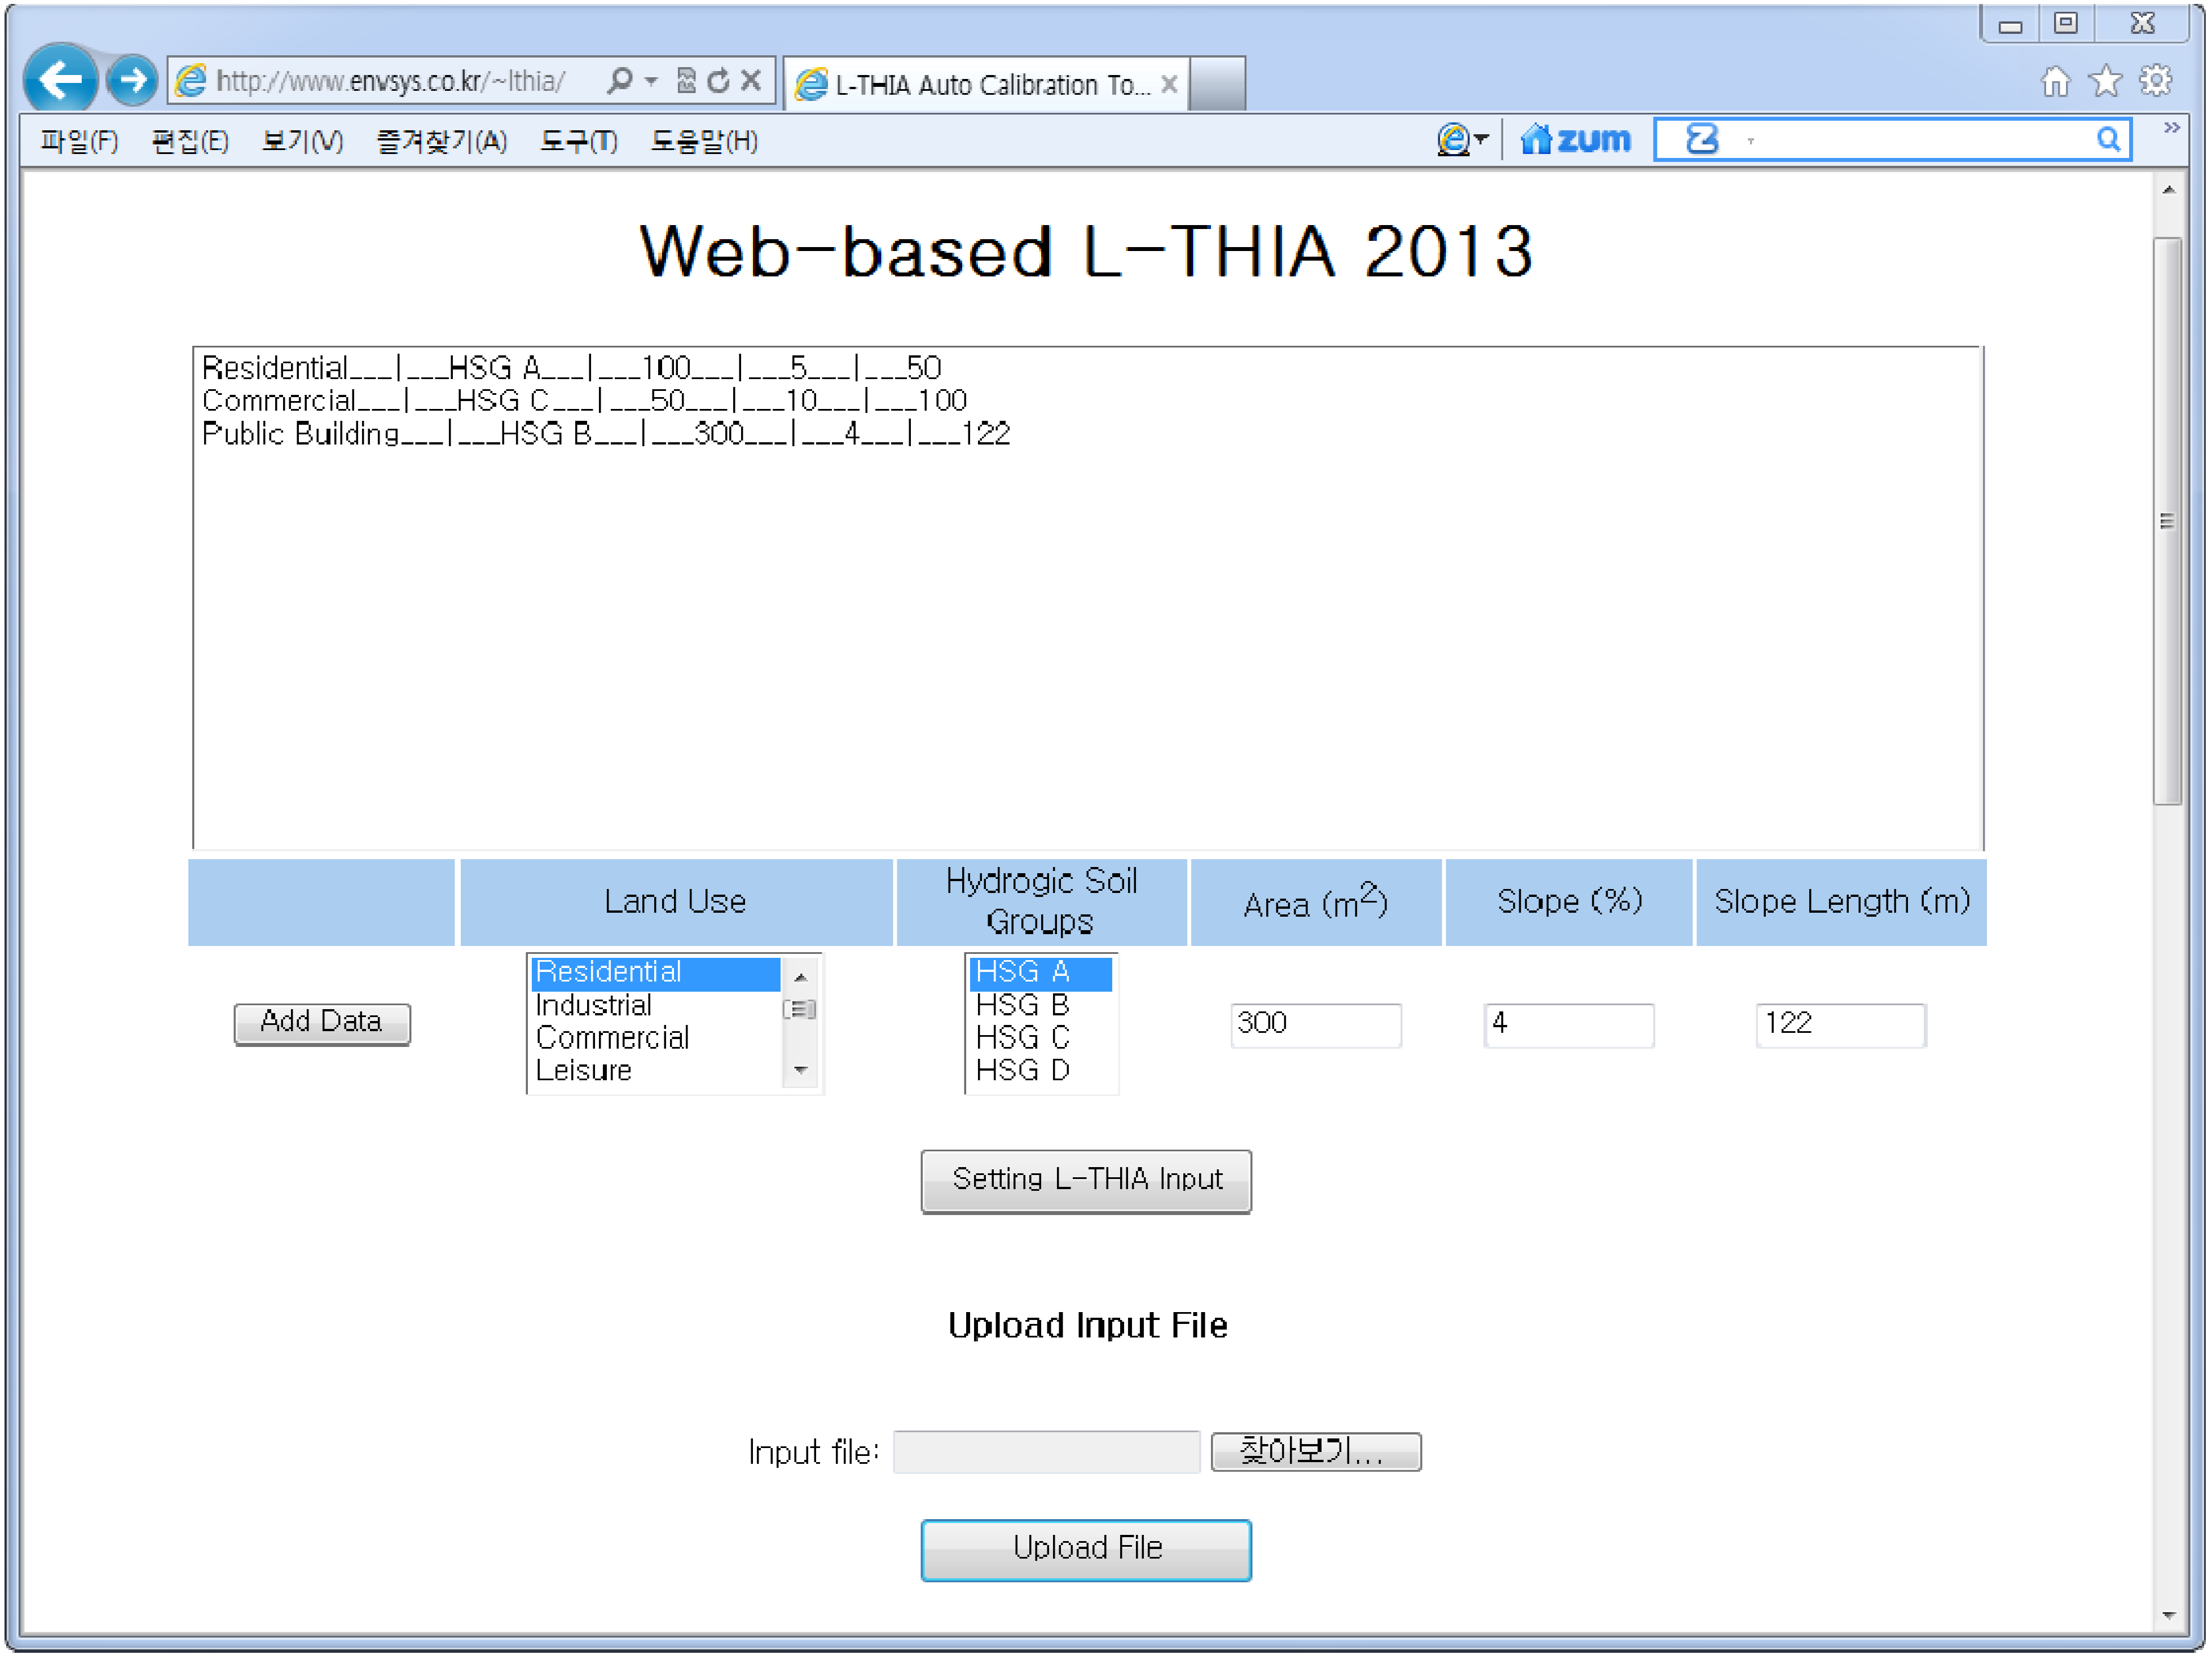
3.1. Development of L-THIA 2012 Model

Figure 6 shows the interface of L-THIA 2012 on the Internet. Basically, our proposed model requires two of the major inputs (HRUs and rainfall data). The model allows users to upload the input data (text-formatted files) directly via the web interface to the server. The rainfall data also needs to be uploaded with the limited model running time. As shown in Figure 6, users can determine the land-use/HSG and add specific study area, slope, and slope length data corresponding to the HRUs. The model uses the twenty three land-use categories provided by the MOE, and the default CNs are obtained from the Soil Conservation Service of the United States Department of Agriculture (USDA-SCS) [35], the Natural Resources Conservation Service of the United States Department of Agriculture (USDA-NRCS) [36], and the Ministry of Construction Transportation (MOCT) [37]. The default EMCs for BOD, TN, and TP are provided by the Korean Environment Foundation Investigation Project (KEFIP), and both the default CNs and EMCs can be editable by users. Then, the model provides the graphical model outputs for runoff, BOD, TN, and TP (Figure 7) and allows additional analysis by the spreadsheet software.
Figure 6. Interface of Web-based L-THIA 2012.
Water 05 01952 g006
Figure 7. Results of the web-based L-THIA 2012.
Water 05 01952 g007

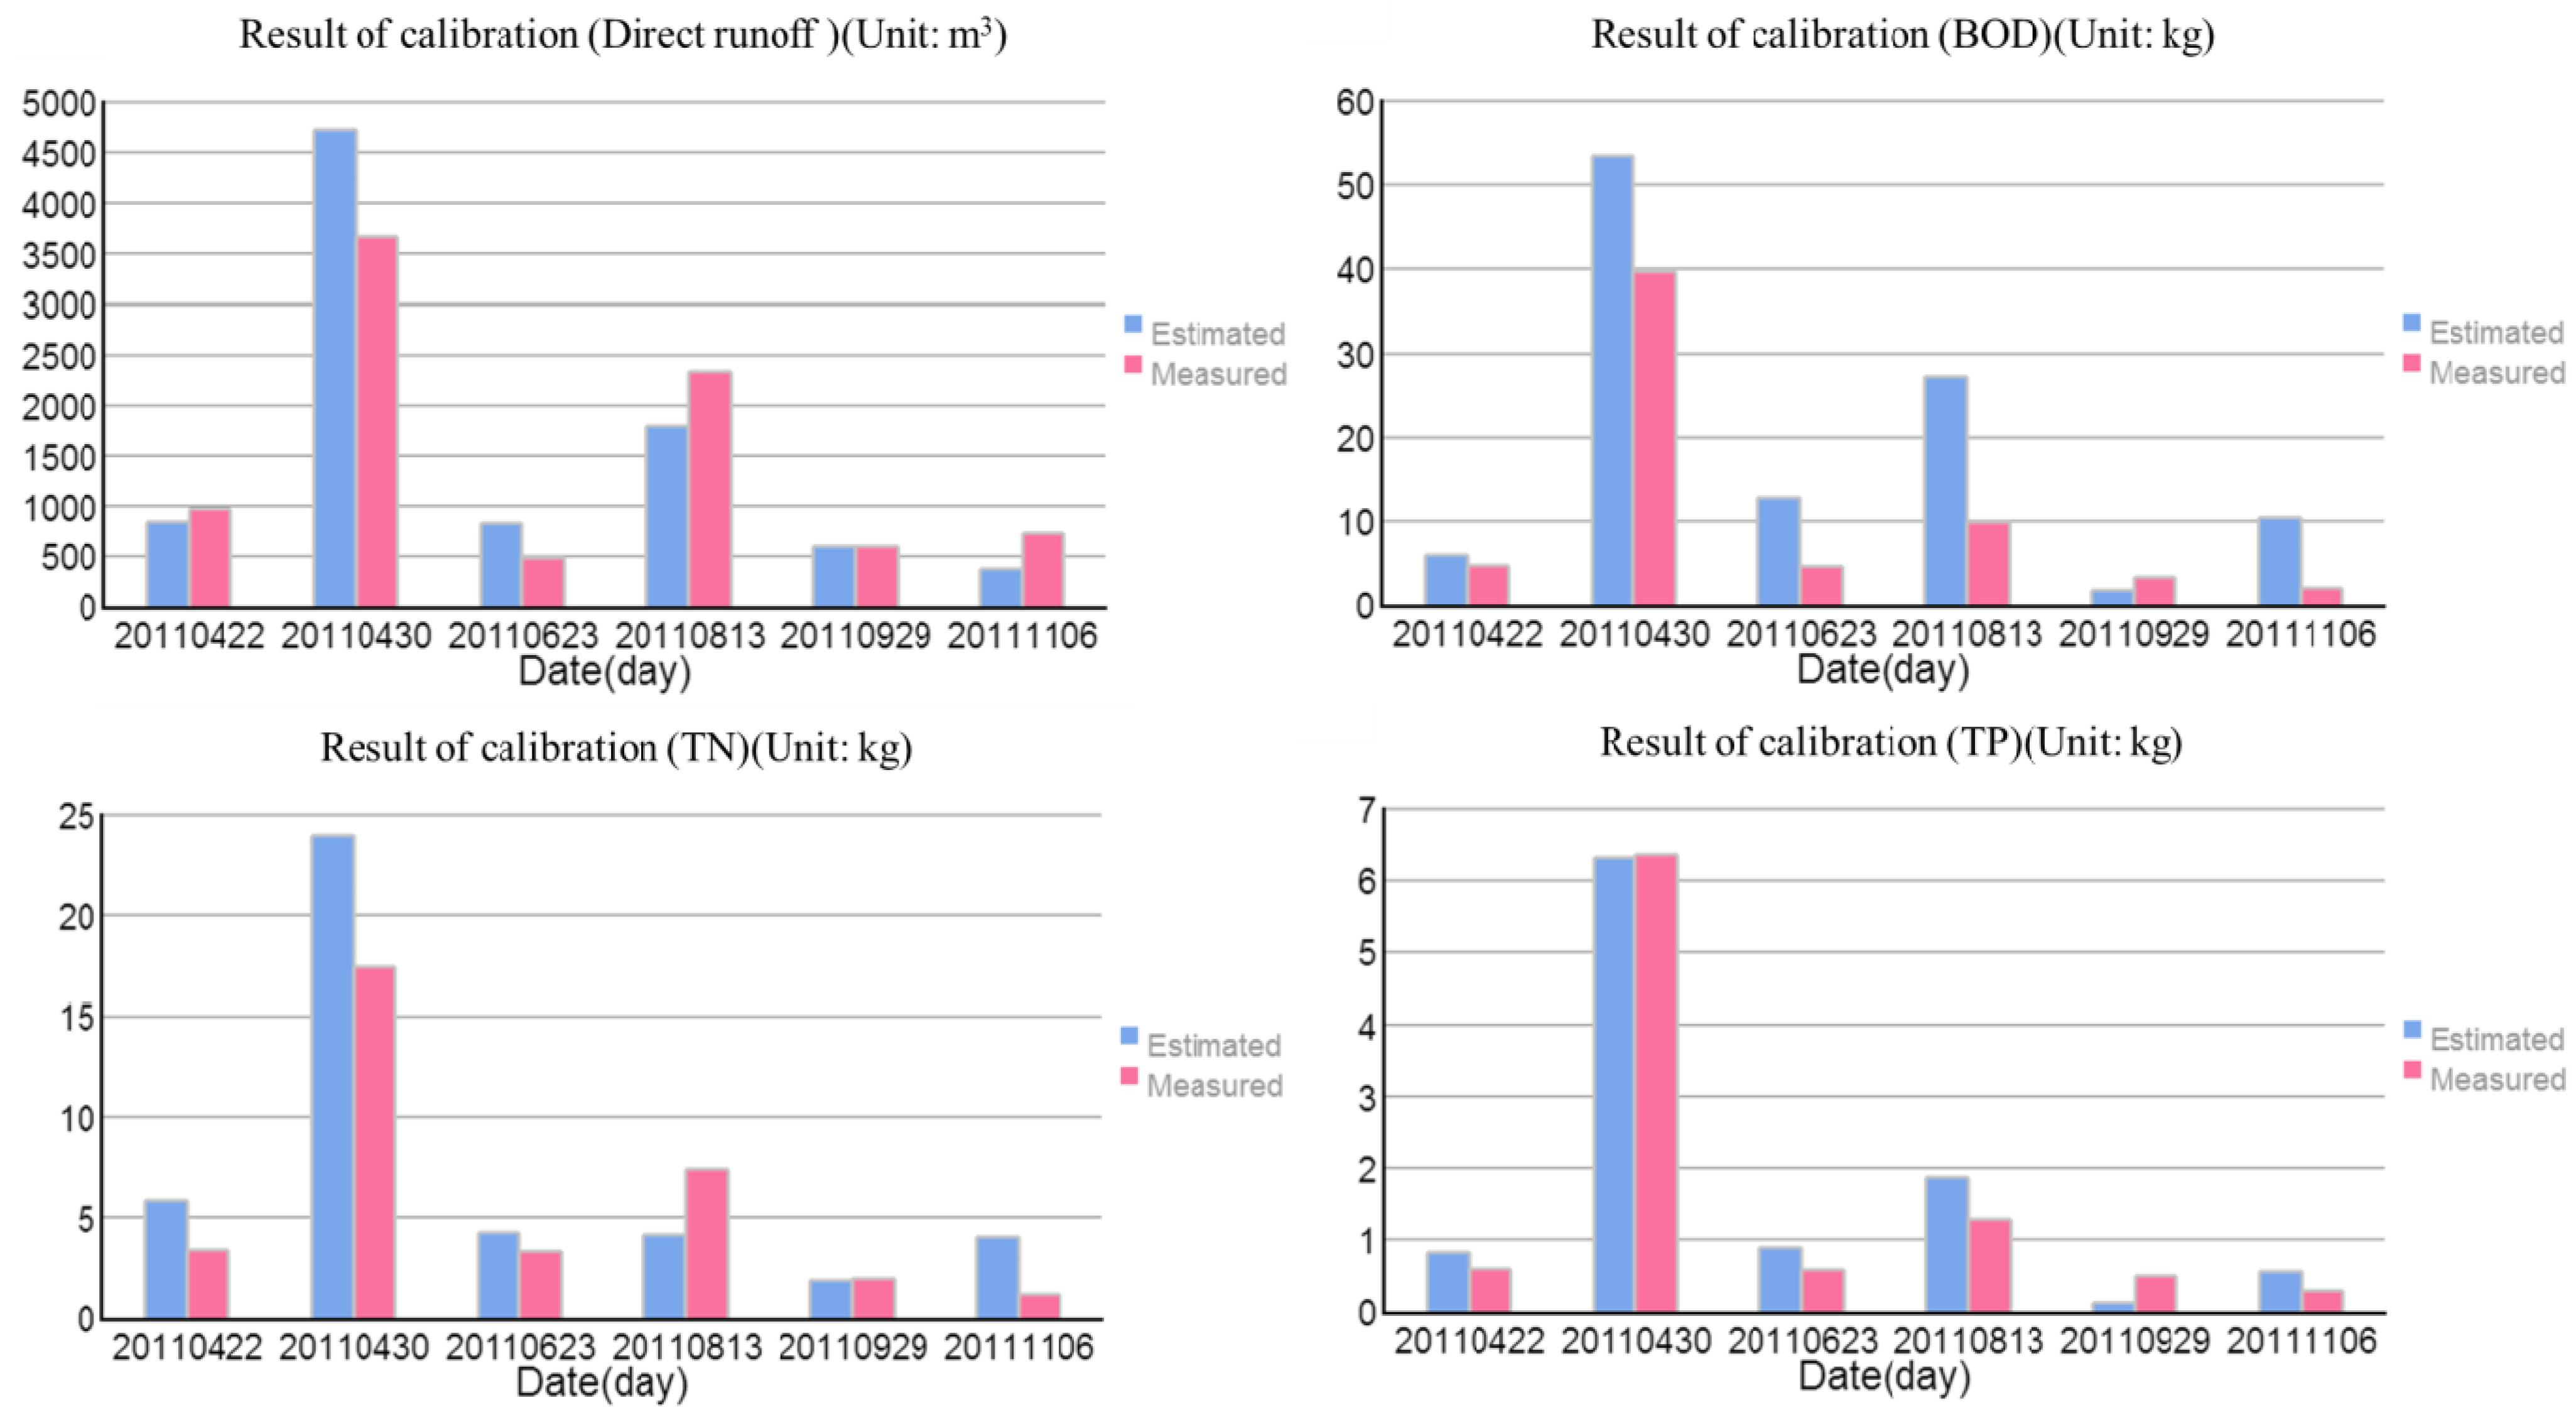
3.2. Runoff and NPS Pollutant Load Estimations

In order to evaluate our approach, the Yeoju-Gun and Icheon-Si sites located within the Paldang watershed were selected. Our approach calibrated the CN values for estimating the surface runoff using the rainfall data with ten-minute intervals (for the six storm events) by comparing the measured data (Table 4). Based on the estimated runoff, we calibrated the NPS pollution loads for BOD, TN, and TP. Table 4 presents that the estimated runoff results show a good match with the coefficient of determination (R2: 0.908 and 0.965) and Nash Sutcliffe model Efficiency (NSE: 0.794 and 0.869) values for the Yeoju-Gun and Icheon-Si sites, respectively. Also, L-THIA 2012 calibrated the BOD, TN, and TP loads based on the optimized CNs with the measured direct runoff and nonpoint source pollutant loads. The estimated BOD, TN, and TP loads also identified well with the observations with R2 (0.895, 0.882, and 0.981) and NSE (0.654, 0.798, and 0.974) at the Yeoju-Gun site. However, the statistics of NPS pollution loads for the Icheon-Si site had slightly more uncertainties compared to those of the Yeoju-Gun site. BOD (R2: 0.904 and NSE: 0.608) and TN (R2: 0.883 and NSE: 0.755) identified well with the measured data, but the NSE values of TP were not in the ranges of 0 to 1. Uncertainties included in the TP measurements might considerably influence the model outputs. For TP, we need additional experiments with more accurate measurements in the future. Hence, the TP results were excluded in this study. As Donigian [38] has suggested, the model result indicates “Good” when the NSE value is 0.7 or greater. The NSE values for the Yeoju-Gun and Icheon-Si sites show a “Good” and “Fair” agreement with the measured data. These findings support the reliability of our approach to estimate the runoff and NPS pollutant loads with uncertainties (TP).
Table 4. Result of Direct Runoff and NPS Pollutant Load Estimations.
Study areaDateMeasured dataEstimated data
Direct runoff (m3)BOD (m3)TN (kg)TP (kg)Direct runoff (m3)BOD (m3)TN (kg)TP (kg)
Yeoju-Gun22 April 2011972.745.945.830.82840.954.703.360.59
30 April 20113669.4153.4523.996.324725.7739.7117.436.36
23 June 2011482.0512.804.240.89829.814.593.300.58
13 August 20112338.5427.314.131.871795.219.907.391.28
29 September 2011599.471.701.850.12600.513.301.930.49
6 November 2011728.1010.444.010.55371.231.961.170.29
Icheon-Si8 July 20112635.4720.2814.224.752034.2332.7714.41
8 August 2011272.991.952.010.08510.227.683.42
13 August 2011862.761.502.430.23898.0514.266.29
11 September 20113530.6936.8631.294.132707.6142.9518.97
29 September 2011249.151.321.370.11152.391.020.50
15 October 2011247.747.402.910.61727.4811.365.02

3.3. Comparison of the Calibrated and Averaged EMCs

In order to test the model performance in adjusting EMCs, we estimated the calibrated/averaged (BOD: 9.24 mg/L, TN: 3.39 mg/L; and TP: 0.79 mg/L)-EMCs based NPS loads using the measured runoff or individual storm events at the Yeoju-Gun and Icheon-Si sites. The model outputs at the Yeoju-Gun site showed the statistics of R2 (0.918)/NSE (0.716) for BOD, R2 (0.728)/NSE (0.520) for TN, and R2 (0.879)/NSE (0.548) for TP, respectively (Table 5). The TN (R2: 0.882 and NSE: 0.798) and TP (R2: 0.981 and NSE: 0.974) loads based on the calibrated EMCs still had a good match with the measured data as opposed to those (R2: 0.728 and NSE: 0.520 for TN and R2: 0.879 and NSE: 0.548 for TP) of the averaged EMCs at the Yeoju-Gun site, but the BOD loads (R2: 0.918 and NSE: 0.716) with the averaged BOD EMCs were closer to the measured data compared to those (R2: 0.895 and NSE: 0.654) of the calibrated BOD EMCs. This might suggest that measurement errors (relatively higher than TN and TP) of the BOD concentrations influenced the NPS loads. In the Icheon-Si site, the BOD and TN results (R2: 0.902/0.907 and NSE: 0.899/0.428 for the averaged EMCs) showed similar trends to those of the Yeoju-Gun site. These findings suggest that our approach performs better in estimating TN loads. However, the TP loads for the averaged EMCs also had negative NSE values, as shown in the case of the calibrated EMCs. This might indicate that the TP pollution loads are considerably affected by measurement errors. Thus, we need to not only improve our auto-calibration module, but also build more accurate EMC databases for better estimating NPS pollution loads.
Table 5. Comparison of averaged-EMC Nonpoint Source Pollutant Loads with the measured data.
Study AreaDateMeasured dataEstimated data (using averaged EMCs)
Direct runoff (m3)BOD (m3)TN (kg)TP (kg)Direct runoff (m3)BOD (m3)TN (kg)TP (kg)
Yeoju-Gun22 April 2011972.745.945.830.82972.748.983.300.77
30 April 20113669.4153.4523.996.323669.4133.8912.442.91
23 June 2011482.0512.804.240.89482.054.451.630.38
13 August 20112338.5427.314.131.872338.5421.607.931.85
29 September 2011599.471.701.850.12599.475.542.030.48
6 November 2011728.1010.444.010.55728.106.732.470.58
Icheon-Si8 July 20112635.4720.2814.224.752635.4724.348.93
8 August 2011272.991.952.010.08272.992.520.93
13 August 2011862.761.502.430.23862.767.972.92
11 September 20113530.6936.8631.294.133530.6932.6111.97
29 September 2011249.151.321.370.11249.152.300.84
15 October 2011247.747.402.910.61247.742.290.84

4. Conclusions

In this study, we developed a web-based auto-calibration L-THIA 2012 model based on a genetic algorithm (GA) that can calibrate surface runoff and NPS pollutant loads. We estimated the surface runoff with ten-minute intervals of rainfall (total six storm events) and NPS loads based on the Event Mean Concentrations (EMCs) corresponding to the classifications of various rainfall intensities and land-use. In order to assess our proposed approach, the Yeoju-Gun and Icheon-Si sites located within the Paldang watershed were selected near the northern area in South Korea. Our model outputs using the sub-daily (10 min intervals) rainfall and classified EMCs corresponding to the various rainfall intensities and land-use matched reasonably well with the observations, although the results at the Icheon-Si site showed more uncertainties (especially for TP with the negative NSE value). Additionally, we estimated the calibrated-/averaged-EMCs based pollutant loads using the measured runoff to test the model performance in adjusting EMCs. Our auto-calibration module estimated the TN loads with the calibrated EMCs better than those of the averaged EMCs at the Yeoju-Gun/Icheon-Si sites, but the BOD loads for the averaged EMCs had a slightly better agreement with the measured data compared to those of the calibrated EMCs. The TP loads using the calibrated EMCs also identified better than that of the averaged TP EMCs at the Yeoju-Gun site, but the TP comparison for the Icheon-Si site was excluded due to measurement errors. Thus, our proposed model adapting the newly developed auto-calibration module could reduce uncertainties due to the model parameters and structures. Furthermore, this web-based scheme has less limitations in the application in the field while text-formatted input data are only required for modeling. Input datasets (i.e., EMCs) can be easily updated by users when needed, and this model directly sends the model outputs to users via email. These findings show the reliability of our approach in estimating runoff and NPS pollutions indicating that it could be more useful in providing a tool for a Total Maximum Daily Load (TMDL) and Best Management Practices (BMPs) for policy/decision-makers. Furthermore, the web-based L-THIA model could provide easy access to users across the world. In our future works, we plan to develop an improved L-THIA model that can estimate runoff and NPS pollutions using open source GIS programs.

Conflicts of Interest

The authors declare no conflicts of interest.

References

  1. Choi, J.Y. Status and prospects of nonpoint source management policies, water for future. J. Korea Water Res. Assoc. 2006, 39, 12–18. [Google Scholar]
  2. Gyeonggi Research Institute (GRI). Policy study on the application of estimation techniques nonpoint source pollution. Gyeonggi Res. Inst. 2008, 25–60. [Google Scholar]
  3. Ministry of Environment. Establishment of Comprehensive Measures for Control of Non-Point Source Pollutant Loads of the Four Major River Basins; Ministry of Environment: Seoul, Korea, 2004.
  4. Rewerts, C.C.; Engel, B.A. ANSWERS on GRASS: Integrating a watershed simulation with a GIS. Trans. ASABE 1991, 91-2621, 1–9. [Google Scholar]
  5. Young, R.A.; Onstad, C.A.; Bosch, D.; Anderson, W.P. AGNPS, Agricultural Non-point Source Pollution Model: A Watershed Analysis Tool, USDA; Conservation Research Report 35; U.S. Department of Agriculture, Agricultural Research Service: Washington, DC, USA, 1987; pp. 49–51.
  6. Arnold, J.G.; Srinivasan, R.; Muttiah, R.S.; Williams, J.R. Large area hydrologic modeling and assessment part I: Model development. J. Am. Water Res. Assoc. 1998, 34, 73–89. [Google Scholar] [CrossRef]
  7. Bicknell, B.R.; Imhoff, J.I., Jr.; Jobes, T.H.; Donigian, A.S., Jr. Hydrologic Simulation Program Fortran (HSPF) User’s Manual for Version 12; U.S. Environmental Protection Agency, National Exposure Research Laboratory: Athens, Greece, 2001; pp. 1–12.
  8. Huber, W.C.; Dickinson, R.E. Storm Water Management Model Version 4; User’s Manual; University of Florida, Department of Environmental Engineering Sciences: Gainesville, FL, USA, 1988; pp. 1–15. [Google Scholar]
  9. Harbor, J.M. A practical method for estimating the impact of land-use change on surface runoff, groundwater recharge and wetland hydrology. J. Am. Plan. Assoc. 1994, 60, 95–108. [Google Scholar] [CrossRef]
  10. Bhaduri, B.; Minner, M.; Tatalovich, S.; Harbor, J. Assessing the long-term hydrological impact of land-use change: Cuppy-mcclue watershed, Indiana. J. Am. Water Works Assoc. 1997, 89, 13–19. [Google Scholar]
  11. Miner, M.; Harbor, J.; Happold, S.; Michael-Butler, P. Cost apportionment for a storm water management system: Differential burdens on landowners from hydrologic and area-based approaches. Appl. Geogr. Stud. 1998, 14, 1–14. [Google Scholar]
  12. Lim, K.J.; Engel, B.A. Development of Daily/Yearly L-THIA WWW System. Available online: https://engineering.purdue.edu/mapserve/LTHIA7 (accessed on 20 November 2013).
  13. Lim, K.J.; Engel, B.A.; Kim, Y.; Bhaduri, B.; Harbor, J. Development of the Long-Term Hydrologic Impact Assessment (L-THIA) WWW System. In Proceedings of the 10th International Soil Conservation, 2 May 2002; Stott, D., Mohtar, R., Steinhardt, G., Eds.; Purdue University: West Lafayette, IN, USA; pp. 1018–1023.
  14. Lim, K.J.; Engel, B.A.; Tang, Z.; Muthukrishnan, S.; Choi, J.; Kim, K. Effect of calibration on L-THIA GIS runoff and pollutant estimation. J. Environ. 2006, 78, 35–43. [Google Scholar]
  15. Kim, J.J.; Kim, T.D.; Choi, D.H.; Lim, K.J.; Engel, B.A.; Jeon, J.H. L-THIA modification and SCE-UA application for spatial analysis of nonpoint source pollution at Gumho river basin. J. Korea Water Res. Assoc. 2009, 25, 311–321. [Google Scholar]
  16. Beven, K.; Binley, A. The future of distributed models: Model calibration and uncertainty predictions. Hydrol. Process. 1992, 6, 279–298. [Google Scholar] [CrossRef]
  17. Beven, K.; Freer, J. Equifinality, data assimilation, and uncertainty estimation in mechanistic modelling of complex environmental systems using the GLUE methodology. J. Hydrol. 2001, 249, 11–29. [Google Scholar] [CrossRef]
  18. Holland, J.H. Adaptation in Natural and Artificial System; University of Michigan Press: Ann Arbor, MI, USA, 1975. [Google Scholar]
  19. Wang, Q.J. The genetic algorithm and its application to calibrating conceptual rainfall-runoff models. Water Resour. Res. 1991, 27, 2467–2471. [Google Scholar] [CrossRef]
  20. Lim, K.J.; Park, Y.S.; Kim, J.; Sin, Y.; Kim, N.W.; Kim, S.J.; Jeon, J.; Engel, B.A. Development of genetic algorithm-based optimization Module in WHAT system for hydrograph analysis and model application. Comput. Geosci. 2010, 36, 936–944. [Google Scholar] [CrossRef]
  21. Shin, Y.; Mohanty, B.P.; Ines, A.V.M. Soil hydraulic properties in one-dimensional layered soil profile using layer-specific soil moisture assimilation scheme. Water Resour. Res. 2012, 48. [Google Scholar] [CrossRef]
  22. Duan, Q.Y.; Sorooshian, S.; Gupta, H.V. Effective and efficient global optimization for conceptual rainfall-runoff models. Water Resour. Res. 1992, 28, 1015–1031. [Google Scholar] [CrossRef]
  23. Kum, D.H.; Ryu, J.C.; Choi, J.W.; Shin, M.H.; Shin, D.S.; Cheon, S.U.; Choi, J.D.; Lim, K.J. Development and evaluation of runoff-sediment evaluation system and BMPs evaluation modules for agricultural fields using hourly rainfall. J. Korea Water Res. Assoc. 2012, 28, 375–383. [Google Scholar]
  24. Goldberg, D.E. Genetic Algorithms in Search and Optimization and Machine Learning; Addison-Wesley Longman Publishing Co., Inc.: Boston, MA, USA, 1989. [Google Scholar]
  25. Krishnakumar, K. Microgenetic algorithms for stationary and non-stationary function optimization. Proc. SPIE Intell. Control Adapt. Syst. 1989, 1196, 289–296. [Google Scholar] [CrossRef]
  26. Carroll, D.L. Genetic algorithms and optimizing chemical oxygen-Iodine lasers. Dev. Theor. Appl. Mech. 1996, 18, 411–424. [Google Scholar]
  27. Ines, A.V.M.; Droogers, P. Inverse modeling in estimating soil hydraulic functions: A genetic algorithm approach. Hydrol. Earth Syst. Sci. 2002, 6, 49–65. [Google Scholar] [CrossRef]
  28. Ines, A.V.M.; Mohanty, B.P. Near-surface soil moisture assimilation for quantifying effective soil hydraulic properties using genetic algorithm: 1. Conceptual modeling. Water Resour. Res. 2008, 44. [Google Scholar] [CrossRef]
  29. Shin, Y.; Mohanty, B.P. Development of a deterministic downscaling algorithm for remote sensing soil moisture footprint using soil and vegetation classifications. Water Resour. Res. 2013, 49. [Google Scholar] [CrossRef]
  30. Hanriver Environment Research Center. Long-Term Monitoring of Nonpoint Source Pollution from Major Land Uses (6); Hanriver Environment Research Center: Seoul, Korea, 2012.
  31. Geumriver Environment Research Center. Long-Term Monitoring of Nonpoint Source Pollution from Major Land Uses (3); Geumriver Environment Research Center: Seoul, Korea, 2009.
  32. Hanriver Environment Research Center. Long-Term Monitoring of Nonpoint Source Pollution from Major Land Uses (3); Hanriver Environment Research Center: Seoul, Korea, 2009.
  33. Nakdongriver Environment Research Center. Long-Term Monitoring of Nonpoint Source Pollution from Major Land Uses (3); Nakdongriver Environment Research Center: Seoul, Korea, 2009.
  34. Yeongsanriver Environment Research Center. Long-Term Monitoring of Nonpoint Source Pollution from Major Land Uses (3); Yeongsanriver Environment Research Center: Seoul, Korea, 2009.
  35. United States Department of Agriculture, Soil Conservation Service (USDA-SCS). National Engineering Handbook, Section 4—Hydrology; USDA: Washington, DC, USA, 1985.
  36. Natural Resources Conservation Service (NRCS). Urban Hydrology for Small Watersheds; Technical Release 55; NRCS: Washington, DC, USA, 1986.
  37. Ministry of Construction Transportation (MOCT). River Design Criteria Description; MOCT: Seoul, Korea, 2005.
  38. Donigian, A.S. HSPF Training Workshop Handbook and CD, Lecture #19, Calibration and Verification Issues, Slide #L19-22 [DCN 1-0238]; Environmental Protection Agency: Washington, DC, USA, 2000.

