Article

Perceptions of Water Ownership, Water Management, and the Responsibility of Providing Clean Water

1
Faculty of Medicine, University of Calgary, 3330 Hospital Drive NW, Calgary AB T2N 4N1, Canada
2
Stream of Community Rehabilitation and Disability Studies, Department Community Health Sciences, Faculty of Medicine, University of Calgary, 3330 Hospital Drive NW, Calgary AB T2N 4N1, Canada
*
Author to whom correspondence should be addressed.
Water 2013, 5(4), 1865-1889; https://doi.org/10.3390/w5041865
Submission received: 16 September 2013 / Revised: 8 November 2013 / Accepted: 11 November 2013 / Published: 19 November 2013

Abstract

:
Perceptions of water and water related issues still render many under-researched topics. This study aims to further our knowledge regarding people’s perceptions of water and our understanding about the different ways individuals use water. The authors asked the question: Does the way an individual perceives water (i.e., as a commodity, a human right, private resource, public resource and/or natural resource) influence consumption and conservation of water, and sentiments towards control and allocation of water? An exploratory online questionnaire was designed to generate qualitative and quantitative data of survey participants’ perceptions, beliefs and actions towards water issues, such as overconsumption and scarcity. Data analysis included comparison of the quantitative data regarding the non-statistical association between how an individual perceives water and the individual’s beliefs, as well as qualitative analysis of the comments using an iterative pattern coding technique. One hundred and sixty four individuals participated in the survey (75% completion rate) and over 430 comments were made. Themes that emerged from the comments included: responsibility, scarcity, the value of water, knowledge gained and education needed. Comparison of the different perceptions of water revealed that different perceptions of what water is resulted in different beliefs about what the cost of water should be. These findings have implications for future water use, including what needs to change in order to increase appreciation for water issues.

1. Introduction

This research aims to better understand individuals’ perceptions of water and how it impacts individuals’ beliefs and actions toward water. Perceptions are the lens in which the participants identify water, and beliefs and actions are how the individuals react based on their perceptions; in this research, perceptions refers to how the individual perceives water i.e., as a commodity, a human right, private resource, public resource and/or natural resource. The authors asked the question: Does the way an individual perceives water influence consumption and conservation of water, and sentiments towards control and allocation of water? Our study differs from existing research by addressing perceptions of water itself, and comparing those perceptions/beliefs about water consumption, conservation and management.
Various studies have used surveys to collect information on public attitudes and perceptions of water [1]. In regards to water quality, many studies have found that concern for pollution in water is increasing, particularly in drinking water [2,3]. This has led to a steady increase in the consumption of bottled water, as participants in these studies have indicated they are not happy with their tap water [4,5,6,7]. Doria found that perceptions of drinking water quality are highly influenced by organoleptic factors, such as taste and odour [8]. Research on willingness to pay for improved water sources in order to get better quality water has found a range of results. People’s willingness to pay for improved water sources ranges from a distinct lack of willingness to pay [9,10] to the majority being willing to pay a good deal more than what is currently being charged [11,12]. Recycling waste water for direct use is not a new idea, nor are the studies that have looked at people’s perceptions of it. These studies have found that better understanding of how the water is recycled, including the treatment process and how it flows back into the system is crucial to uptake [13,14]. One example of a study that looked at attitudes towards water quality is by Syme and Williams, who compared attitudes to psychological and experiential factors, attitudes and demographics [15].
However there are several topics related to public attitudes and perceptions of water that have not been well researched. These topics include people’s perceptions of the value of water, water consumption, water regulations, the water footprint, and water scarcity Although studies exist that covered attitudes these studies did not ask exactly how participants perceive water, meaning what they consider water to be (i.e., a natural resource, a commodity, a public resource, etc.). Instead, many surveys simply make assumptions about how an individual perceives water [1]. Most of the surveys assume water is recognized as a natural resource. The following topics are inadequately covered in current water surveys.
Some surveys ask questions about the value of water [12,16,17]. How people value water is an important concern, particularly when addressing mitigation of overconsumption of water. While there is willingness to pay for water surveys, the value of water does not necessarily fall within the measurements used in willingness to pay estimates. Evaluations of people’s perceptions of the value of water external to willingness to pay have not been well documented. In this research survey, the value of water was related to other values, such as aesthetic and health related values.
Surveys that inquire about the different uses of water do not include questions about what the individual thinks about the way he/she is using water, or the way he/she thinks it should be used. It is important to understand not only how individuals use water, but how they believe it should be used, and moreover, what they perceive as necessary (i.e., water for drinking, for sanitation, etc.) water use. Questions in the survey address this.
There has been some research regarding how water should be controlled and allocated. For example, surveys conducted for the European Union have focused primarily on private versus a public water distribution system [18]. However, there are many other questions related to the control and allocation of water that have not yet been addressed, such as who should be in control (i.e., local versus national governments). The survey used in this research addresses those questions, and relates them to the individuals’ perceptions of water.
Only one survey was found that included questions on the water footprint, and no surveys were found that looked at people’s perceptions or attitudes toward the water footprint [19]. The water footprint is a measurement of water consumption akin to the carbon footprint [20]. This survey includes an explanation and questions about the water footprint.
Water scarcity issues have been surveyed mostly in water scarce areas [21]. In the RBC survey of Canadian water attitudes, there are only two questions related to water quantity, and neither addresses concern around running out of water [22]. In Quebec, there has been several studies on people’s perceptions of water quality and consumption, including a study on fluoridated water [23], and two studies that included the impact of taste and demographics on perceptions of water [24,25]. These studies address consumption, but are related more to water quality than to scarcity issues. In this research, individuals’ perceptions of water quantity were addressed.
The rationale for the study is to address the current literature gap between individuals’ perceptions of water and perceptions of the value of water, water consumption, water regulations, the water footprint, and water scarcity, and further our knowledge regarding people’s perceptions of water and our understanding about the different ways individuals use water. This is important in order to better understand the views of the public, the actions the public considers as necessary, and how the public would like to have water issues addressed, including elements such as who is seen to be the appropriate regulating body. Such knowledge will provide a foundation for further research and help to guide policy. Syme and Williams and, more recently, Hu et al. concluded that perceptions of water influence the actions of individuals, particularly in regards to perceptions of water quality and consumption of bottled water [3,15]. Similar to an older study by Doria et al. [26], Hu et al. suggest that when trying to understand people’s behaviour concerning water use, it is useful to first understand how people perceive their water [3]. This study aims to discover how people perceive water and how it relates to their use of water.

2. Methods

2.1. Method

An exploratory online questionnaire was designed to generate qualitative and quantitative data with the purpose of providing researchers and policy makers with a better understanding of a variety of perceptions, beliefs and actions towards water issues such as overconsumption and scarcity. The mixed-methods approach included quantitative questions but also allowed the individual to expand on any ideas using comment fields if so desired. Using both quantitative and qualitative data allows a better representation of the data and increases validity by providing the participant with the ability to expand on any ideas not offered in the quantitative questions [27]. It also permits the researchers to compare the qualitative comments with the quantitative responses [28], as well as allows for multiple measurements of the same question [29]. The data from the exploratory questionnaire provides a foundation for further research on the topic of perceptions of individuals on water issues in comparison to their actions and beliefs in relation to these water issues, as this is a recent and under-researched area [30,31]. Using an online survey allowed as many participants to be reached as possible; as well, the online link allowed a variety of individuals access to the survey [32].

2.2. Survey Design

The 37 questions address the following: (a) perceptions of water; (b) personal water consumption habits and beliefs about consumption and conservation; (c) whose responsibility it is to provide clean water; and (d) water regulations including water pricing, as well as attitudes towards; (e) the water footprint—defined as a measurement of water consumption akin to the carbon footprint; and (f) water security—defined as having ensured access to clean water (see Appendix). The survey was formatted so each of these topics had one page that included all related questions. This organization was meant to keep participants focused on the topic, and to ensure readability and comprehensibility of the survey [33].
Questions include multi-answer and single-answer multiple choice, and ranking scale questions (Likert scale ranked one to seven). Comment boxes were provided to address the possibility of a lack of choices in the multiple choice and ranking scale as well as to allow the participant to expand on any ideas. The results of the multiple choice and Likert scale questions are considered quantitative whereas the results of the comments are considered qualitative. There are questions regarding demographic-related information, namely age, gender, and country in which the participant is currently residing. The survey was pilot tested on a group of peers, to check for readability, internal reliability and validity [34].
Survey Monkey, an online website, was used to design and distribute the survey; it provided a quick link for participants to easily access the survey at their own leisure. Data collection was conducted from October 2012 to January 2013.

2.3. Recruitment

The survey link was sent to various contacts of the authors, including peers and coworkers, as well as to relevant listservs (such as water and environment listservs). The participants in the initial group were encouraged to forward the survey; this resulted in the link being added to a Facebook page and an online downhill SKI forum.

2.4. Sampling

Snowball convenience sampling was used in order to obtain the greatest number and widest variety of participants in order to understand key perceptions from a range of perspectives. This sampling method was chosen as a means of gathering initial information on the subject in order to create a foundation for further research. The use of snowball sampling meant participants were encouraged to forward the link to their own peers and co-workers [35]. No inclusion or exclusion criteria were used; therefore all of the responses from all of the participants were used for data analysis.

2.5. Data Analysis

One part of data analysis was the comparison of the quantitative data on the possible association between how an individual perceives water (that was addressed in the first set of questions in the survey) and the individual’s beliefs regarding: (1) the price of water; (2) whose responsibility it is to provide the public with clean water; and (3) the importance of conservation and regulation (these questions were addressed throughout the survey). Survey Monkey provides a tool that “filters” the results to show only the responses to all of the questions from those who answered one particular question in a particular way. This tool was used to filter the data in order to see the responses to all questions based on the response to the first question regarding perception of water. Filtering the results allowed for exploration of how the different perceptions impacted responses to the other questions in order to analyze whether there is a non-statistical association between individual water perceptions compared to beliefs and actions. Using comparison illuminates the associations between how the individual perceives water and the various beliefs the individual has regarding the different topics and the actions they take. This comparison is crucial in understanding the impact of attitudes on water use.
Comments provided further information on an individual’s beliefs and ideas; the comments were coded using an inductive pattern coding technique, where the comments were read and when a theme became apparent, a code was developed to indicate the presence of this theme in the comment (Table 1). The use of software during analysis of qualitative data increases validity and reliability because it allows the researcher to develop and test classifications and connections using software that provides a system of rules based logic, thereby mitigating potential bias [36,37]. Atlas.ti has been identified as a useful tool when conducting pattern coding [38] and was used for qualitative analysis of the comments. The comments were read repeatedly, using an iterative technique, adding new codes as they appeared until no new themes were emerging. Some codes were auto-codes, meaning the theme was apparent in a particular word used, and thus the code could be identified using the Atlas.ti auto-coding tool that automatically searches and identifies the word in comments. Other codes were hand codes, meaning the text had to be identified by hand. Pattern coding is a thorough and rigorous coding strategy that provided the best technique for coding the comments due to the continuous, iterative nature of the method [38].

2.6. Limitations

This study used an online exploratory survey that was distributed via snowball sampling. Therefore the results are not generalizable because only those who received the survey link through social networks of the researchers and who had access to a computer could complete the survey [39]. As well, the survey was written in English, thus limiting the potential number of participants to 20% of the world’s population. Furthermore, because the participants are limited to those with a computer who were reached through snowball sampling there may be a sampling bias. In future studies, a researcher could change the sampling protocol to obtain data that might be generalizable related to a certain group. For example, administering the survey online and in person using stratified random sampling to locals, for example Calgarians, could help make the results more applicable to Calgary, Alberta, Canada.
Furthermore, within the survey, the questions used language that required basic reading skills, understanding of certain words in context (such as commodity, human right, etc.), and knowledge of water consumption rates. While the survey was targeted to fit all age groups and used language that was simplified to the best of the authors’ ability, there is the possibility that internal validity was compromised by the language used in the survey. This limits the sample to well-educated and privileged groups, who are already more likely to answer online surveys. This issue could be resolved by testing the questions on a sample group who represent a more diverse study population, and by providing definitions and statistics that are pertinent to answering the question. Furthermore, descriptive results are presented, but there is not any advanced statistical analysis. Overall percentages (Table 1, Table 2, Table 3, Table 4 Table 5, Table 6) and ranking average (Table 7) are provided; as well, the cross tabulation function of the software is used to give percentages and ranking average based on how a certain question was answered (Question 5: Imagine a full glass of clean drinking water. In your opinion, this water is primarily: a commodity, a natural resource, a private resource, a public resource, a human right; see Figure 1). The authors believe that as this is an exploratory study the findings still provide the reader with useful knowledge related to the research question. However a study that leads to generalizable results and that uses advanced statistical analysis might be useful as a next step.
Ethics approval was granted by the University of Calgary Conjoint Health Research Ethics Board 21 September 2012.

3. Results

3.1. Demographics of the Sample

The final population of our study included 164 participants of that 75% completed the survey. Of the participants, 108 identified as being male and 49 identified as female; 45 indicated being under 18 years of age, 90 indicated being between 18 and 24 years old, 15 between 25 and 39 years old, and nine over 39 years old. Of the participants, 74 indicated that they currently live in Canada, 65 from the United States of America, and one from each of the following countries: Taiwan, France, Austria, UK, Norway, Finland, and Italy. This variety of participants offered a wide collection of responses, opinions and ideas, however the large majority of the participants were from younger age groups in Canada and the US. Based on the qualitative comments of participants the authors posit that the participants were from areas that are typically water abundant, for example, “seeing those who do not have instant access to clean water from a tap makes me feel instant gratitude for my access to clean water” and “For those of us who have unlimited access to water…”. The authors submit that a question around water climate in the area the research participant resides would add to better understand recipients’ answers on scarcity. This may be considered a limitation, as there may be little insight from participants residing in water scarce regions.
As well, there is potential bias within the results based on the respondents, as well as the non-response rate. Furthermore, over-reporting on good behaviour may also be a cause of bias in the results. The authors acknowledge these possible biases, and believe the results still offer insight to the research question.

3.2. Themes

The comment boxes provided participants with a chance to expand on their answers to the quantitative questions and offer further insight. The codes found in the comments revealed common themes: Education needed (n = 35), Free water (n = 20), Bottled water (n = 16), Government (n = 16), Conserving behaviour (n = 15) and Responsibility (n = 15), Accessibility (n = 11), Human right (n = 11), Life (n = 11), Knowledge gained (n = 9), Mitigate consumption (n = 9), Non-monetary cost (n = 9), Availability (n = 8), Affordability (n = 7), Monetary cost (n = 6), Increase the price of water (n = 5), First Nations (n = 2), Government control (n = 2), and Indirect use (n = 1). Over 430 comments provided a wealth of information, including more detailed answers to the question, questions about the question, and comments about the question.

3.2.1. Theme: Responsibility

Responsibility was discussed frequently in the comments, both in response to the questions about responsibility and in other contexts. The majority of respondents believed that it is the responsibility of the government to ensure access to clean water (78.6% = Local government and 71.4% = Federal government) and very few respondents thought that it is at all the responsibility of the individual (20.0%) (Table 1). Many reacted to the question “Would you be in favour of putting restrictions on the amount of water an entire community is allowed to use on a daily basis?” by commenting that if there was a restriction on an entire community, individuals would act selfishly. For example, one participant responded “Only if house to house was also restricted, otherwise one house would obey the restrictions while another used the entire amount”. A fear of individuals acting solely for their own best interest resonated with the majority of the participants indicating that the government should be in charge.
Table 1. Beliefs about responsibility for providing clean water: All participants.
Responsible entityResponse rate (%)
The local government78.6
The federal government71.4
Non-governmental organizations15.7
Trans/International bodies26.4
It is the responsibility of the individual20.0
Scarcity was discussed in relation to the need for conservation and restrictions, and the general consensus is that water restrictions are only necessary in water scarce areas. Comments included: “In areas where water is less abundant, for example the Vegas area, restrictions should exist”, “I avoid beef as much as I can, particularly if it is produced in water poor regions”, and water should be “Free if abundant”. The sentiment of the respondents who were opposed to restrictions (48.61%) (based on responses to a Likert scale question) may be related to the lack of concern for running out of water in the participant’s community (61.4%) (Table 2). Yet, while nearly half of the participants were opposed to restrictions, conservation efforts were still apparent: the majority of participants acknowledged making an effort to conserve water (54.75%).
Table 2. Beliefs about water scarcity: All participants.
Level of concernResponse rate (%)
Yes, very concerned6.3
No, not in this life time61.4
Maybe, but not for a long time25.2
Not sure7.1

3.2.2. Theme: The Value of Water

There were a wide variety of comments regarding the value of water. Many respondents commented that the value of water is best seen in non-monetary ways. In response to the question “The greatest way to appreciate the value of water is to… (a) Look at the price of a bottle of water in a convenience store; (b) Look at a waterfall; (c) Compare the condition of those who have clean water to those who do not have clean water; (d) Water does not have a value; (e) Other (Table 3), no respondents indicated that the true value of water is reflected in the price of a bottle of water, and only one respondent commented that the value of water is reflected in the cost of obtaining it. Based on the results, the value of water is most commonly seen by comparing those who have clean water to those who do not (80.7%). This is reflected in the comments: four respondents commented that the value of water is truly appreciated when one becomes thirsty.
Table 3. Beliefs about the value of water: All participants.
Ways to value waterResponse rate (%)
Compare the condition of those who have clean water to those who do not have clean water80.7
Other8.6
Water does not have a value6.4
Look at a waterfall4.3
Look at the price of a bottle of water in a convenience store0
On the other hand, the monetary value of water is also mentioned: “I would say the value of water is how much the average person would pay for water in an area i.e., the average water bill/ how many people purify their own water”. Comments such as “Just raise water rates” were found five times throughout the survey. This indicates that some participants thought that raising the price of water will encourage conservation. However, although some participants acknowledge the use of raising the price of water in order to promote water conservation, the majority indicated they were opposed to charging more money for water. This opposition is reflected in the question “Which do you prefer, a tax or a reimbursement?” in which the respondents had to choose between the two; 84.3% preferred a reimbursement, (n = 4) commented “neither”, and 43 respondents skipped the question. This illustrates opposition to paying more for water.
Yet when asked “Would you be willing to pay an additional amount on your monthly bill in order to ensure a sustained supply of water for yourself?” 37.1% of respondents indicated they would be willing to pay to guarantee a sustained supply of water (32.8% were Unsure and 30.2% said No). And when asked about putting a price on guaranteeing a sustained water supply (“Regardless of whether you are currently paying for your water, how much would you be willing to pay out of a pocket monthly in order to ensure a sustained supply of water for your household?”), 87.1% indicated they would be willing to pay some amount more than CAD$1.00 (Table 4). This appears contradictory, as 30.2% of respondents indicated they would not be willing to pay an additional fee on a monthly bill, yet only 12.9% indicated “None” when asked how much they would be willing to pay.
Table 4. Beliefs about payment for a guaranteed water supply: All participants.
Amount individual is willing to payResponse rate (%)
As much as is necessary to maintain a secure water supply37.9
Between CAD $1.00–5.0028.4
Between CAD $5.01–7.5020.7
None12.9

3.2.3. Theme: Knowledge Gained

Several comments indicated that knowledge was gained during participation in the survey. One participant commented that “After completing this survey, I would try to make an effort to cut back regardless of a reimbursement”. In response to reading that it takes 15,400 L of water to produce one kilogram of beef [20], a participant commented “I had no idea, that is unreal”. In response to the question of whether to add a water footprint label on consumer goods a participant commented “This is a really good idea.” Based on the comments, it seems that participants learned more about water issues.

3.2.4. Theme: Education Needed

However, a lack of knowledge on many water related issues also became apparent. Comments indicated that education is needed in the following areas: (1) water conservation actions, e.g., “How does the container you drink your water from have anything to do with water conservation?” (2) water recycling technology, e.g., “would toilet water be reused after flushing? you need a hell of a purification system for that.” and “Does it smell bad?” and most prominently; (3) awareness of the water consumption rates and the possibility of water scarcity, e.g., in response to a question regarding adding the water footprint label to consumer goods “Need to get the idea out there that this is important first before it will be beneficial putting them on consumer goods” and “I am not sure if it would influence the general public until more awareness is raised”. Another example of awareness issues became apparent in the responses to the question “Given what you know about water consumption, how many litres of water would you estimate you use in one day?” in which there were twelve comments akin to “I really have no idea”. Only 10.8% of the participants indicated they think they use over 100 L of water a day. The majority (50.8%) indicated that they think that they use between 20 and 50 L of water a day (Table 5). In reality, the average Canadian uses 329 L of water a day [40]. One respondent admitted: “Without knowing more about my current consumption level, I cannot judge what cutting back 10 litres would require”. Also related to consumption are the indirect uses of water, which many seemed to be unaware of: “Again, maybe I just don’t know the relation between eating beef and eating meat is to water consumption, but I don’t see the relevance”. These comments indicate that there is a lack of knowledge on water conservation, water reuse, and water consumption rates.
Table 5. Beliefs about personal daily water consumption (in liters): All participants.
Believed water daily consumption in litresResponse rate (%)
20–50 50.8
50–10022.5
10–2015.8
100 or more10.8

3.3. Perceptions of Water versus Beliefs and Actions

The final results were cross tabulated using Survey Monkey data analysis tools, filtering for demographics, including gender, current country of residence and age, and for each perception of water (commodity, human right, private resource, public resource, natural resource).
As all participants did not answer all the questions, data is presented as percentages. The individual’s perception of water was addressed in the first question, in which the participant could select more than one response; all of the answers were chosen by at least fifteen participants. A natural resource was selected by 67.9% of the participants, a human right by 51.4%, a public resource by 40.7%, a commodity by 30.0%, and a private resource by 10.7% (Table 6). We addressed how these perceptions are related to beliefs about the price of water, about whose responsibility it is to provide access to clean water, about the importance of conservation, and about personal consumption habits, in order to better understand the non-statistical association between perceptions and beliefs and actions.
Table 6. Perceptions of water: All participants.
Water is seen as…Response rate (%)
A natural resource67.9
A human right51.4
A public resource40.7
A commodity30.0
A private resource10.7
Several beliefs were found to be similar throughout the different perceptions. First was the sentiment that the government, both local and federal, should be in charge of ensuring the public has access to clean water. The only exception to this belief was within those who indicated that water is a private resource, where 86.7% thought it was the responsibility of the local government, but only 46.7% thought it was the responsibility of the federal government. Thus, in the case of those who perceived water to be a private resource it was still seen as the government’s responsibility, but specifically the local government. Furthermore, when asked “How much of an effort do you put into conserving water” on a scale of one to seven, seven being “I always make an effort”, the average among the different perceptions was between 4.00 and 4.44. As well, there was no difference in the water conserving behaviours between the groups; in all groups the majority take short showers and do only full loads of laundry.
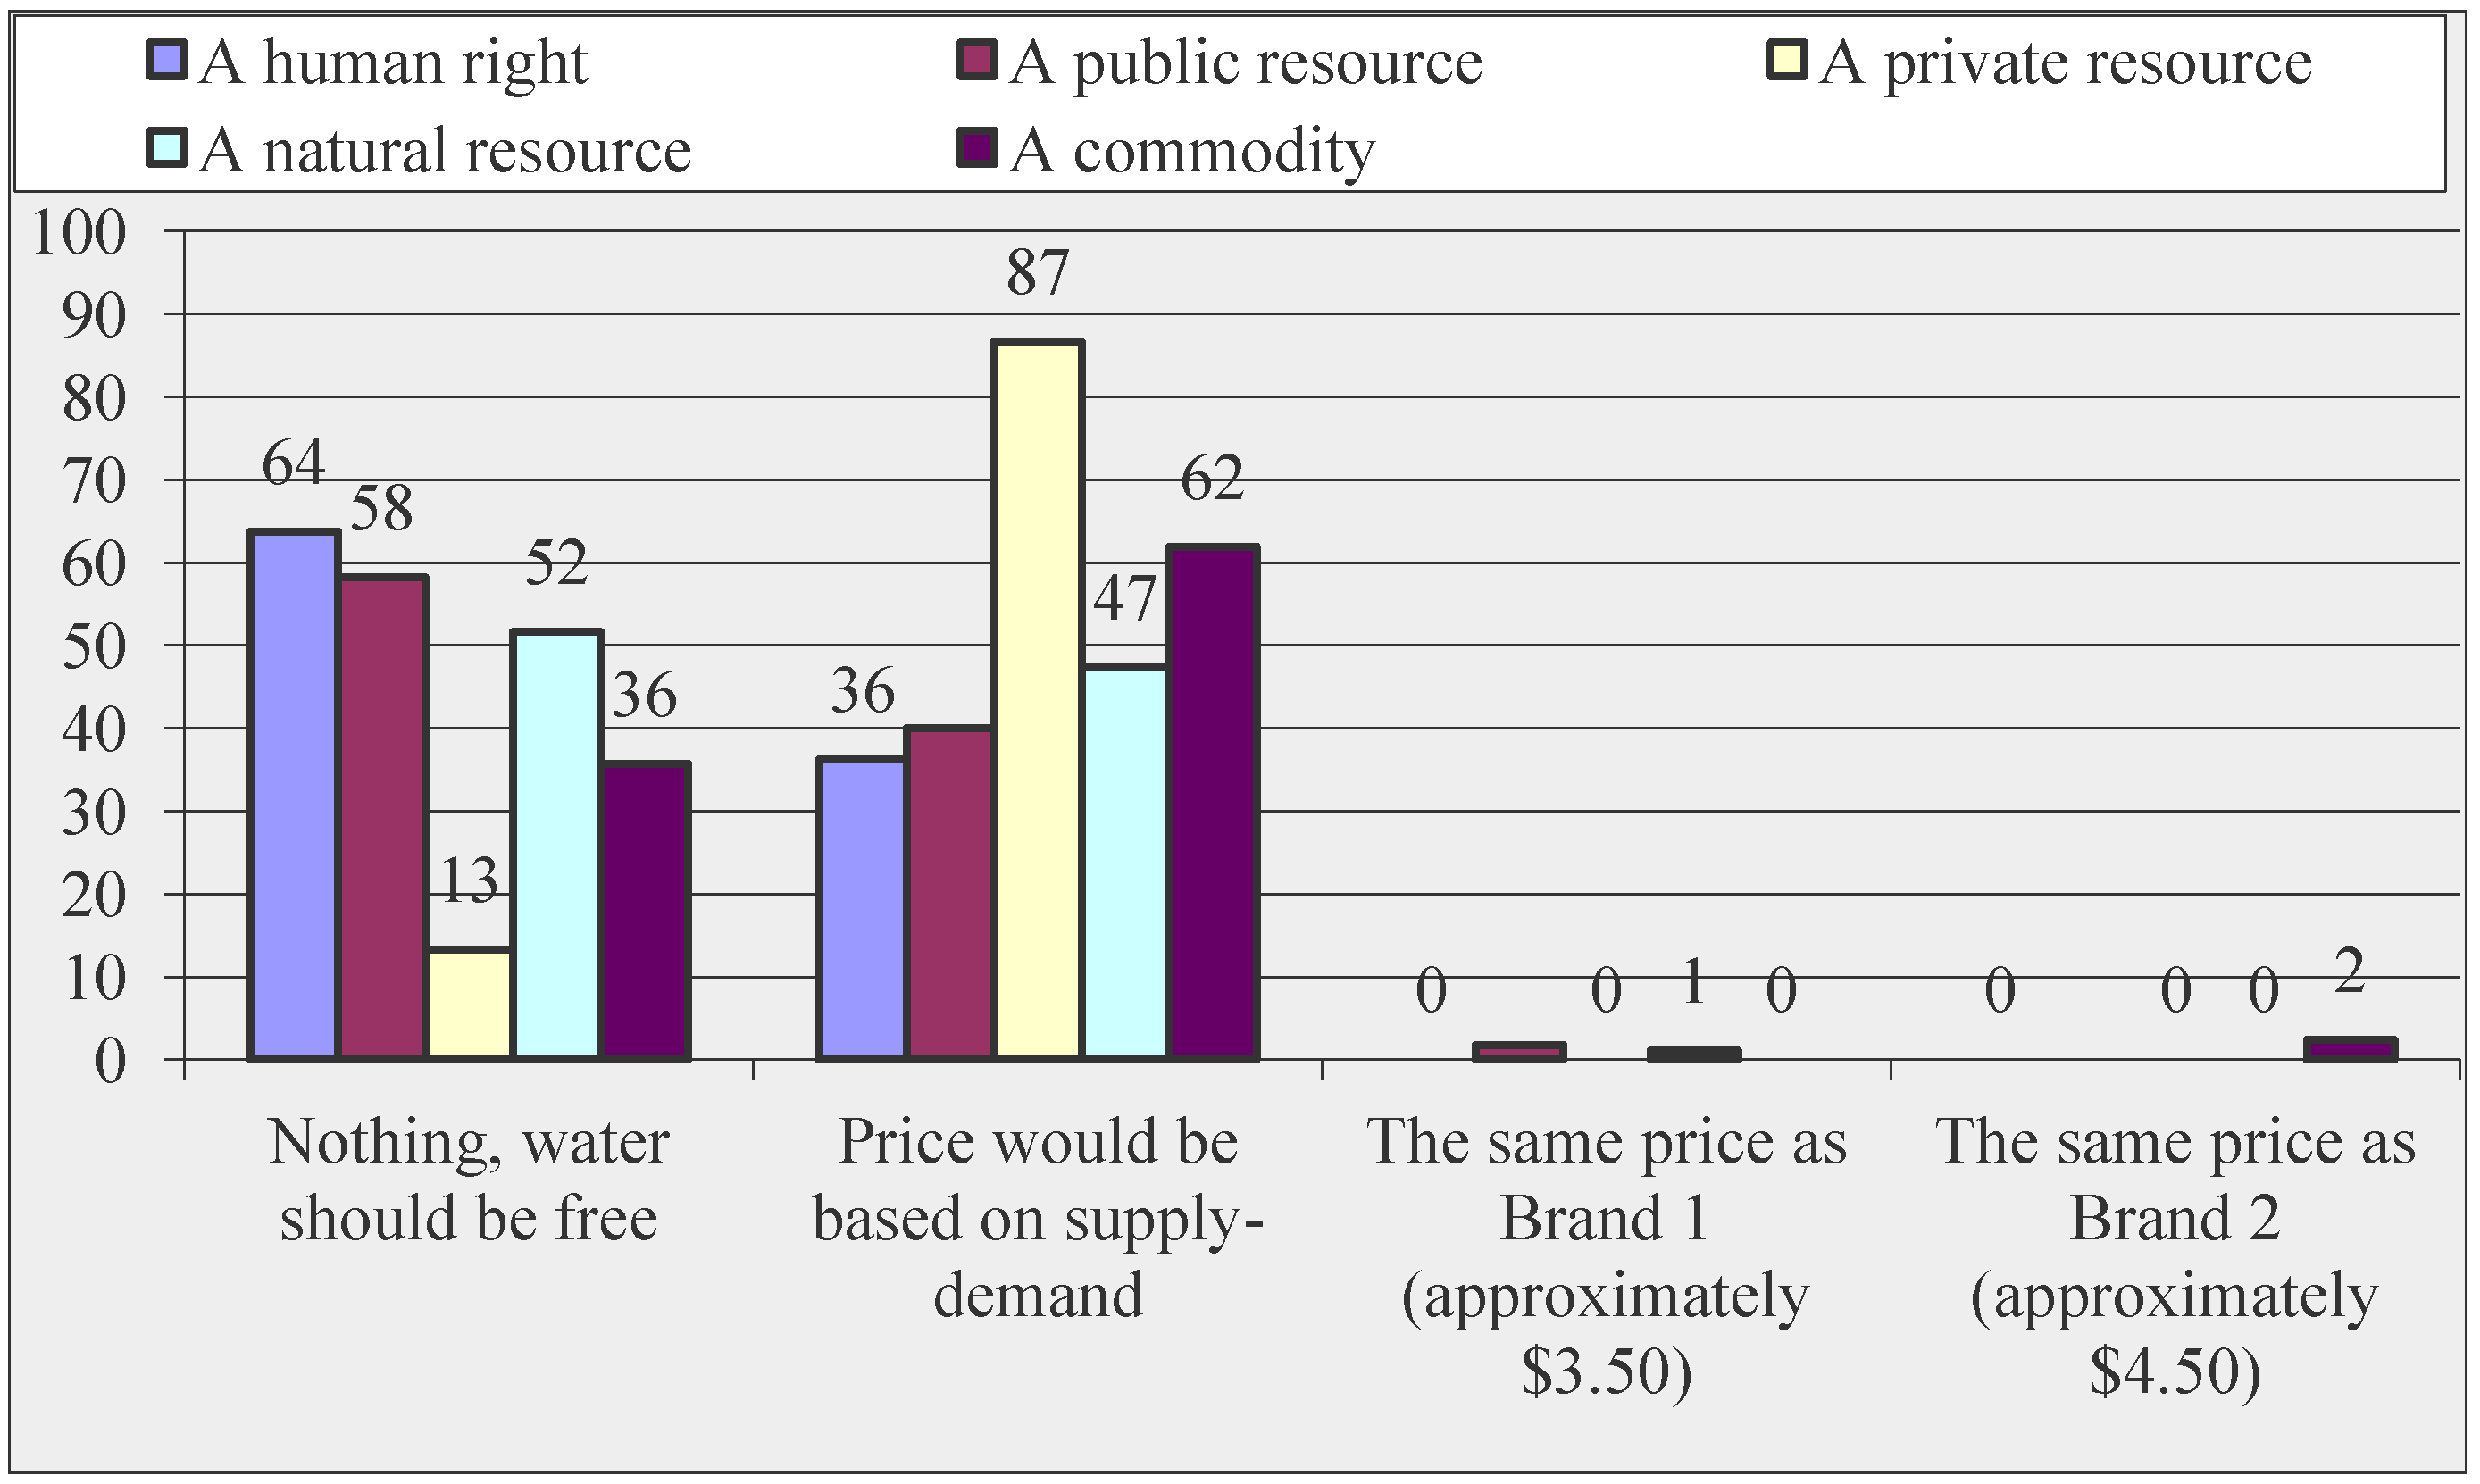
The difference amongst the perceptions was found in beliefs about the cost of water (Figure 1). From highest to lowest number of participants who thought water should be free: #1. participants who perceived clean drinking water to be a human right (63.8%); #2. participants who perceived clean drinking water to be a commodity (61.9%); #3. participants who perceived clean drinking water to be a public resource (58.2%); #4. participants who perceived clean drinking water to be a natural resource (51.6%); and #5. participants who perceived clean drinking water to be a private resource (13.3%).
Figure 1. Comparison of beliefs about the cost of water. If water was to be sold on a drop-by-drop basis, how much would you charge for one litre? (%)
Water 05 01865 g001
The beliefs of those who perceive water to be a private resource are particularly unique. Those believed water is a private resource felt differently about the importance of conserving water: when asked how important it is to conserve water on a Likert scale of one to seven, seven being “very important”, all the other participants indicated an average between 5.68 and 5.97 while the average response of those who perceived water as a private resource was 4.85 (Table 7). More respondents (86.7%) think water should have a price based on supply and demand than those who think water should be free (13.3%). Of those who perceive water to be a private resource, 27% believe it is the responsibility of the individual to ensure access to clean water, which is the largest portion compared to the beliefs of the other perceptions.
Table 7. Comparison of beliefs about the importance of conserving water.
Those who believe water is primarily…Importance of conserving water (1–7)
A public resource5.98
A human right5.97
A natural resource5.87
A commodity5.68
A private resource4.85

4. Discussion

4.1. Theme: Responsibility

The majority of the participants indicated that control of water is the responsibility of the government, both local and federal. There is apparent opposition to leaving the responsibility of allocating water up to the individual. This is similar to a study conducted in Iowa that found that in total, two thirds of the participants think that it is the responsibility of either the local or state government to protect water quality; the only population that thought that it was up to the individual were farmers [41]. Another study in Pakistan also found that 78.4% of participants were willing to accept the government having control over water sources; in this same study it was found that individuals were not making any effort to improve their own water quality [42]. Syme and Williams, who looked at perceptions of water quality, found that “trust in institutions” was common [15]. Preference for government control is revealed as a common sentiment.
One possible reason for a preference for government-level management rather than individual is something known as “perception of externalities”, which is when an individual acts based on the behaviour of others; this is a commonly cited reason for a lack of personal responsibility and conservation effort [43]. That is, when an individual perceives that others are not conserving water that individual feels he/she must also use water excessively. This is also known as inter-personal trust, and a lack of inter-personal trust has been cited as a reason for not conserving water [44]. This is related to the Tragedy of the Commons, a theory that all of the community will act as individuals and consume as much as possible [43]. Interestingly, the Tragedy of the Commons was mentioned by an individual in the survey: “If restriction is placed on the community rather than individuals, each individual will over consume (much like the famous ‘Tragedy of the Commons’.” Responsibility was found to be closely related to opinions about personal consumption, and it is apparent that respondents feel that the government must remain responsible in order to ensure reasonable allocation and use.

4.2. Theme: Scarcity

It is clear that there is very little concern exhibited by the survey participants for running out of clean water, particularly in the participants’ communities. This could be due to the majority of the participants living in Canada and the US where water is abundant, or the government has an emergency plan for drought or scarcity [45,46,47]. This finding is somewhat inconsistent with other studies: a nationwide study of the US found that the majority of participants are aware of water scarcity issues and want to see reforms to improve these problems [48], which was similar to another study in Colorado [49]. Studies in Australia have found that individuals are only somewhat aware of water scarcity issues, and have found further education is needed to enhance public knowledge about water scarcity issues [50,51]. There is no known survey of Canadians’ perceptions of water scarcity, therefore any direct comparison of the findings is not possible.
This lack of concern for the possibility of water scarcity is not reflected in the respondents’ substantial average conservation efforts. These efforts may instead be due to a perceived moral obligation where individuals feel the need to act in environmentally friendly ways for ethical reasons [40,52]. Overall, while the participants’ seemed unconcerned about running out of water, conservation efforts are still apparent.

4.3. Theme: The Value of Water

The value of water is seen to be primarily non-monetary, thus it is possible that encouraging water conservation may be more successful if ecological reasons are given as incentive to conserve water, rather than raising the price of water as a punishment for not conserving. Similarly, one study of urban and rural participants in Southern Alberta (Canada) found that urban participants considered water for the environment to be of greater concern than water for humans, and that conservation efforts are important [53]. Based on the results, a policy that addresses water as a valuable natural resource may be effective in encouraging conservation; this is reinforced by research that suggests that conservation actions come from self-motivation to conserve a valuable resource [43,54]. The results also suggest that raising the price of water will not be effective as there is resistance and dislike for raising the price of water. These results contradict the findings of other studies that indicate water costs increase conservation [55,56]. The respondents are opposed to an increase in water prices but open to adopting water conserving behaviour, which is an important consideration for policy makers when making recommendations.
Further research is needed to study the association between beliefs about increased water prices in comparison to willingness to pay for a guaranteed water supply. While individuals are opposed to having the price raised on their current water supply, they would be willing to pay more if they could guarantee their water supply. This association needs to be further investigated to better understand the circumstances in which individuals are willing to pay more for water.

4.4. Themes: Knowledge Gained and Education Needed

Awareness of water issues is a topic covered in this survey, however the comments of respondents who indicated that they felt they learned something new about water through taking the survey indicates that knowledge gained and education of survey participants was an unintended yet beneficial outcome. It also illuminates the lack of awareness about water issues that were assumed to be known and that more education is needed. There are many comments by study participants regarding confusion about the water issue being addressed in the question and these comments point to a gap in knowledge regarding water issues. Greater awareness and education is needed in order to enhance the promotion of water conservation. This has been found in other studies as well, for a variety of water topics including water scarcity [50,51], drinking water quality [57], and water reclamation [58]. One study that looked specifically at the consumption of bottled water instead of tap water in Brazil discussed similar findings: education is critical for understanding the implications of consuming water from different sources [5]. This need for more information is pertinent for policy makers when designing educational tools related to water issues.

4.5. Perceptions of Water versus Beliefs and Actions

The different perceptions of water did not impact beliefs about responsibility and conservation, and there was no discernible difference in the actions taken to conserve water between the groups of different perceptions. However, variance was found in the participants’ beliefs about the price of water. The distinction between those who thought that water should be free compared to those who thought that there should be a price varied only slightly among individuals who perceived water as a commodity, human right, or a public resource, all three groups mostly believed water should be free. There was a slightly larger difference in those who perceived water to be a natural resource, and a large difference in those who perceived water to be a private resource, most of who indicated water should have a price.
There is a dichotomy between the ideas that water is a private resource versus water being an open resource. These views are linked to perceptions about the price of water: those who think water is a private resource strongly believe water should have a price. Further research is needed in order to identify what views a person may hold that may influence him/her to see water as a private or public good.

5. Conclusions

The results of this survey indicate that water issues are not often considered by the participants, and there is a large spectrum of beliefs about water consumption, conservation, control, and management that need further investigation. From the results of this survey it is apparent that some perceptions may influence certain beliefs, such as perceiving water as a private resource and believing water should have a price, however many other beliefs were not correlated to any specific perception.
The beliefs and perceptions of the participants indicate that clean water is seen as a human right and as a public resource, that conservation is important and that the value of water goes beyond monetary worth. These results are a product of participants who mostly live in water abundant areas, and therefore must be considered in context. As indicated in the results, further education and public understanding of water issues is needed. This has implications for water policy makers and governments. Water is essential for life and the world is coming to the end of a golden age of water [59]; greater awareness and understanding of water use and management will promote a sustainable future for water use.

Acknowledgments

Thank-you to the Wolb Pack for support and guidance, to Tom Jack for insight, and to Stephanie Noga for being there from the beginning. This work was in part supported by a Genome Canada and Genome Alberta research grant.

Conflicts of Interest

The authors declare no conflict of interest.

References

  1. Noga, J.; Wolbring, G. A Comprehensive List of Water Attitude Surveys- A Bibliography of Surveys on People’s Perceptions of Water Quality, Water Use and Willingness to Pay; Hydrocarbon Metagenomics: Calgary, Canada, 2013; p. 283. Available online: http://www.hydrocarbonmetagenomics.com/wp-content/uploads/2013/07/A-Comprehensive-List-of-Water-Attitudes-Surveyfinal.pdf (accessed on 19 September 2013).
  2. Monroe County Health Department, Water Quality Opinion Survey 2000: Public Attitudes and Knowledge Regarding Water Quality in Monroe County, New York; Monroe County Health Department: Monroe County, NY, USA, 2000.
  3. Hu, Z.; Morton, L.W.; Mahler, R.L. Bottled water: United States consumers and their perceptions of water quality. Int. J. Environ. Res. Public Health 2011, 8, 565–578. [Google Scholar] [CrossRef]
  4. Rani, B.; Maheshwari, R.; Garg, A.; Prasad, M. Bottled water—A global market overview. Bull. Environ. Pharmacol. Life Sci. 2012, 1, 1–4. [Google Scholar]
  5. De Queiroz Josiane, T.M.; de França, D.M.; Léo, H.; Andréa, Z. Perceptions of bottled water consumers in three Brazilian municipalities. J. Water Health 2013, 11, 520–531. [Google Scholar] [CrossRef]
  6. Dupont, D.P. Tapping into consumers’ perceptions of drinking water quality in Canada: Capturing customer demand to assist in better management of water resources. Can. Water Resour. J. 2005, 30, 11–20. [Google Scholar] [CrossRef]
  7. Doria, M. Bottled water versus tap water: Understanding consumers-preferences. J. Water Health 2006, 4, 271–276. [Google Scholar]
  8. De França Doria, M. Factors influencing public perception of drinking water quality. Water Policy 2010, 12, 1–19. [Google Scholar] [CrossRef]
  9. Pattanayak, S.; van den Berg, C.; Yang, J.C.; van Houtven, G. The Use of Willingness to Pay Experiments: Estimating Demand for Piped Water Connections in Sri Lanka. In World Bank Policy Research Working Paper; Bank, W., Ed.; World Bank: Washington, DC, USA, 2006. [Google Scholar]
  10. Mbata, J.N. Estimating household willingness to pay for water services in a rural economy: The case of Kanye in southern Botswana. Dev. S. Afr. 2006, 23, 29–43. [Google Scholar] [CrossRef]
  11. Rollins, K.; Zachariah, O.; Frehs, J.; Tate, D. Resource valuation and public policy: Consumers willinness to pay for improving water services infrastructure. Can. Water Resour. J. 1997, 22, 185–195. [Google Scholar] [CrossRef]
  12. Jordan, J.L.; Elnagheeb, A.H. Willingness to pay for improvements in drinking water quality. Water Resour. Res. 1993, 29, 237–245. [Google Scholar] [CrossRef]
  13. Hartley, T.W. Public perception and participation in water reuse. Desalination 2006, 187, 115–126. [Google Scholar] [CrossRef]
  14. Bruvold, W.H.; Ward, P.C. Using reclaimed wastewater: Public opinion. J. Water Pollut. Control Fed. 1972, 44, 1690–1696. [Google Scholar]
  15. Syme, G.J.; Williams, K.D. The psychology of drinking water quality: An exploratory study. Water Resour. Res. 1993, 29, 4003–4010. [Google Scholar] [CrossRef]
  16. Davis, Hibbitts & McCaig, Inc. Healthy Streams Plan: Public Values Assessment. Available online: http://cfpub.epa.gov/npstbx/files/publicvalues.pdf (accessed on 19 September 2013).
  17. Strang, V. Evaluating Water: Cultural Beliefs and Values about Water Quality, Use and Conservation; Water UK Publications: Oxford, UK, 2001. [Google Scholar]
  18. TNS Political & Social Attitudes of Europeans Towards Water-Related Issues Communication. Available online: http://ec.europa.eu/environment/pdf/fl_344_sum_en.pdf (accessed on 19 September 2013).
  19. Saunders, C.; Guenther, M.; Kaye-Blake, W.; Miller, S.; Tait, P.R. Consumer attitudes towards sustainability attributes on food labels. In Proceedings of 2010 New Zealand Agricultural and Resource Economics Society (Inc.) Conference, New Zealand Agricultural and Resource Economics Society, Nelson, New Zealand, 26–27 August 2010.
  20. Water Footprint Homepage. Available online: http://www.waterfootprint.org/?page=files/home (accessed on 19 September 2013).
  21. Evans, J.; Calabria, J.; Brown, W.; Keyes, A.M.; Risse, M. Water Issues in Georgia: A Survey of Public Perceptions and Attitudes about Water; University of Georgia: Athens, GA, USA, 2011. [Google Scholar]
  22. Royal Bank of Canada. RBC Canadian Water Attitudes Survey; Royal Bank of Canada: Toronto, Canada, 2012. Available online: http://www.rbc.com/community-sustainability/_assets-custom/pdf/CWAS-2012-report.pdf (accessed on 19 September 2013).
  23. Levallois, P.; Grondin, J.; Gingras, S. Knowledge, perception and behaviour of the general public concerning the addition of fluoride in drinking water. Can. J. Public Health 1997, 89, 162–165. [Google Scholar]
  24. Grondin, J.; Levallois, P.; Morel, S.; Gingras, S. The Influence of Demographics, Risk Perception, Knowledge, and Organoleptics on Water Consumption Patterns. In Proceedings of the American Water Works Association Annual Conference: Management and Regulations, Toronto, Canada, 23–27 June 1996; pp. 537–546.
  25. Levallois, P.; Grondin, J.; Gingras, S. Evaluation of consumer attitudes on taste and tap water alternatives in Quebec. Water Sci. Technol. 1999, 40, 135–139. [Google Scholar] [CrossRef]
  26. Doria, M.; Pidgeon, N.; Hunter, P. Perception of tap water risks and quality: A structural equation model approach. Water Sci. Technol. 2005, 52, 143–149. [Google Scholar]
  27. Bryman, A. Quantity and Quality in Social Research; Psychology Press: New York, NY, USA, 1988; Volume 18. [Google Scholar]
  28. Creswell, J. A Framework for Design. In Research Design: Qualitative Quantitative and Mixed Methods Approaches; Sage Publications: Thousand Oaks, CA, USA, 2003. [Google Scholar]
  29. Tashakkori, A.; Teddlie, C. Handbook of Mixed Methods in Social & Behavioral Research; SAGE Publications, Incorporated: Thousand Oaks, CA, USA, 2002. [Google Scholar]
  30. Elizondo, G.M.; Lofthouse, V. Towards a sustainable use of water at home: Understanding how much, where and why? J. Sustain. Dev. 2010, 3, 3–10. [Google Scholar]
  31. Barr, S. Are we all environmentalists now? Rhetoric and reality in environmental action. Geoforum 2004, 35, 231–249. [Google Scholar] [CrossRef]
  32. Schmidt, W.C. World-Wide Web survey research: Benefits, potential problems, and solutions. Behav. Res. Methods Instrum. Comput. 1997, 29, 274–279. [Google Scholar] [CrossRef]
  33. Gillham, B. Developing a Questionnaire; Continuum: London, UK, 2000. [Google Scholar]
  34. Chung, K.C.; Pillsbury, M.S.; Walters, M.R.; Hayward, R.A. Reliability and validity testing of the Michigan Hand Outcomes Questionnaire. J. Hand Surg. 1998, 23, 575–587. [Google Scholar] [CrossRef]
  35. Oliver, P.; Jupp, V. Snowball Sampling; Sage: Thousand Oaks, CA, USA, 2006. [Google Scholar]
  36. Weitzman, E.A.; Miles, M.B. Computer Programs for Qualitative Data Analysis; Sage: Thousand Oaks, CA, USA, 1995. [Google Scholar]
  37. Weitzman, E.A.; Miles, M.B. Choosing software for qualitative data analysis: An overview. Field Methods 1995, 7, 1–5. [Google Scholar] [CrossRef]
  38. Miles, M.B.; Huberman, A.M. Qualitative Data Analysis: An Expanded Sourcebook; Sage Publications, Incorporated: Thousand Oaks, CA, USA, 1994. [Google Scholar]
  39. Wolbring, G.; Leopatra, V. Climate change, water, sanitation and energy insecurity: Invisibility of people with disabilities. Can. J. Disabil. Stud. 2012, 1, 66–90. [Google Scholar]
  40. Wise Water Use 2011. Available online: http://www.ec.gc.ca/eau-water/default.asp? lang=En&n=F25C70EC-1 (accessed on 19 September 2013).
  41. Morton, L.W.; Brown, S. Water Issues in the Four State Heartland Region: A Survey of Public Perceptions and Attitudes About Water—Iowa, Nebraska, Kansas, Missouri; The Heartland Regional Water Coordination Initiative Bulletin# SP289; Iowa State Uniy Extensionversit: Ames, IA, USA, 2007. [Google Scholar]
  42. Ahmad, I.; Sattar, A. Factors Determining Public Demand for Safe Drinking Water (A Case Study of District Peshawar); Pakistan Institute of Development Economics Working Papers & Research Reports: Islamabad, Pakistan, 2010. [Google Scholar]
  43. Corral-Verdugo, V.; Frias-Armenta, M.; Pérez-Urias, F.; Orduña-Cabrera, V.; Espinoza-Gallego, N. Residential water consumption, motivation for conserving water and the continuing tragedy of the commons. Environ. Manag. 2002, 30, 527–535. [Google Scholar] [CrossRef]
  44. Jorgensen, B.; Graymore, M.; O’Toole, K. Household water use behavior: An integrated model. J. Environ. Manag. 2009, 91, 227–236. [Google Scholar] [CrossRef]
  45. Disaster and Drought Assistance. Available online: http://www.usda.gov/wps/portal/usda/usdahome?navid=DISASTER_ASSISTANCE (accessed on 19 September 2013).
  46. 2010 British Columbia Drought Response Plan Environment. Available online: http://livingwatersmart.ca/drought/docs/2010/bc_drought_response_plan_june-2010.pdf (accessed on 12 November 2013).
  47. Water. Environment Canada. Available online: http://www.ec.gc.ca/eau-water/ (accessed on 19 September 2013).
  48. ITT Corporation. Value of Water Survey: Americans on the U.S. Water Crisis. ITT Corporation: White Plains, NY, USA, 2012. Available online: http://www.xyleminc.com/valueofwater/media/ITT%20Value%20of%20Water%20Survey.pdf (accessed on 12 November 2013).
  49. Pritchett, J.; Bright, A.; Shortsleeve, A.; Thorvaldson, J.; Bauder, T.; Waskom, R. Public Perceptions, Preferences, and Values for Water in the West: A Survey of Western and Colorado Residents; Colorado Water Institute: Fort Collins, CO, USA, 2009. [Google Scholar]
  50. Dolnicar, S.; Hurlimann, A.; Grün, B. What affects public acceptance of recycled and desalinated water? Water Res. 2011, 45, 933–943. [Google Scholar] [CrossRef]
  51. Hurlimann, A.; Dolnicar, S.; Meyer, P. Understanding behaviour to inform water supply management in developed nations—A review of literature, conceptual model and research agenda. J. Environ. Manag. 2009, 91, 47–56. [Google Scholar] [CrossRef]
  52. Syme, G.J.; Nancarrow, B.E.; Seligman, C. The evaluation of information campaigns to promote voluntary household water conservation. Eval. Rev. 2000, 24, 539–578. [Google Scholar] [CrossRef]
  53. Zuo, A.; Bjornlund, H.; Wheeler, S.; Khan, E.; Corral de Zubielqui, C. Exploring Attitudes to Water Re-Allocation in Southern Alberta; University of Lethbridge: Lethbridge, Canada, 2010. [Google Scholar]
  54. Willis, R.M.; Stewart, R.A.; Panuwatwanich, K.; Williams, P.R.; Hollingsworth, A.L. Quantifying the influence of environmental and water conservation attitudes on household end use water consumption. J. Environ. Manag. 2011, 92, 1996–2009. [Google Scholar] [CrossRef]
  55. Moore, S.; Murphy, M.; Watson, R. A longitudinal study of domestic water conservation behavior. Popul. Environ. 1994, 16, 175–189. [Google Scholar] [CrossRef]
  56. Rajbhandary, S.; Borisova, T.; Adams, D.; Haynes, D.; Boyer, C. Use, Perceptions, and Barriers to Water Conservation Strategies for Florida Water Utilities; University of Florida: Gainesville, FL, USA, 2010. [Google Scholar]
  57. Janmaat, J. Divergent drinking water perceptions in the Annapolis Valley. Can. Water Resour. J. 2007, 32, 99–110. [Google Scholar] [CrossRef]
  58. Boucher, M.; Jackson, T.; Mendoza, I.; Snyder, K. Public Perception of Windhoek’s Drinking Water and its Sustainable Future: A detailed analysis of the public perception of water reclamation in Windhoek, Namibia; Department of Infrastructure, Water and Waste Management, The City of Windhoek: Windhoek, Namibia, 2011. [Google Scholar]
  59. Fishman, C. The Big Thirst: The Secret Life and Turbulent Future of Water; Simon and Schuster: New York, NY, USA, 2011. [Google Scholar]

Appendix: Survey Questions

Demographics

  • Male or Female
  • Age:
    • Under 18
    • 18–24
    • 25–39
    • Over 39
  • Country:
All the following questions are to be answered based on the participant’s personal beliefs and current knowledge of water issues.

Personal Sentiments Regarding Water

  • Imagine a full glass of clean drinking water. In your opinion, this water is primarily (please indicate as many as you feel are accurate in numerical order, 1 being the most accurate):
    A commodity
    A natural resource
    A private resource
    A public resource
    A human right
  • Imagine a fresh water lake in a field on the side of a highway. In your opinion, this water is primarily (please indicate as many as you feel are accurate in numerical order, 1 being the most accurate):
    A commodity
    A natural resource
    A private resource
    A public resource
    A human right
  • Having access to clean water for drinking and sanitation is:
    • A human right
    • A luxury
    • Similar to income, one must earn his/her own
  • In your opinion, whose responsibility is it to ensure a community has access to clean water for drinking and sanitation? (you may select more than one answer)
    • The local government
    • The federal government
    • Non-government organizations
    • Trans/International bodies (ex. United Nations)
    • It is the responsibility of the individual
  • In your opinion, whose responsibility is it to ensure clean water for drinking and sanitation is provided to those who currently do not have it? (you may select more than one answer)
    • The local government
    • The federal government
    • Non-government organizations
    • Trans/International bodies (ex. United Nations)
    • It is the responsibility of the individual
  • Which of the following organized groups are you most comfortable with having control of water quality and water supply in your community?
    • The local government
    • The federal government
    • Non-government organizations
    • Trans/International bodies (ex. United Nations)
  • Which of the following organized groups are you most comfortable with having control of water quality and water supply globally?
    • The local government
    • The federal government
    • Non-government organizations
    • Trans/International bodies (ex. United Nations)
  • If water was to be sold on a drop-by-drop basis, how much would you charge for one litre?
    • Nothing, water should be free
    • Price would be based on supply-demand
    • The same price as Aquafina (approximately $3.50)
    • The same price as Fiji (approximately $4.50)
  • The greatest way to appreciate the value of water is to:
    • Look at the price of a bottle of water in a convenience store
    • Look at a waterfall
    • Compare the condition of those who have clean water to those who do not have clean water
    • Water does not have a value
    • Other (please specify)

Water Consumption

10.
How important do you think it is to conserve water? (please mark on the line)
Water 05 01865 i001
11.
Would you be in favour of putting restrictions on the amount of water an individual household is allowed to use on a daily basis? (please mark on the line)
Water 05 01865 i002
12.
Would you be in favour of putting restrictions on the amount of water an entire community is allowed to use on a daily basis? (please mark on the line)
Water 05 01865 i002
13.
Are you mindful of your own water consumption?
  • Yes
  • No
  • Somewhat
14.
How much of an effort do you put into conserving water? (please mark on the line)
Water 05 01865 i003
15.
How often do you consider where the water is coming from when you turn on the tap?
  • Every time
  • Almost every time
  • A few times a day
  • A few times a week
  • Never

Water Conservation Behaviours

16.
Check all that apply in the following categories
  • Where you live there is/are:
    Low flow shower heads
    Low flush toilets
    A “smart technology” washing machine and dryer
    Rain barrels
    A pitcher of water in the fridge
    A laundry rack/line for air drying
    A vegetable garden
    A dishwasher
  • Currently in your everyday life, do you:
    Take short showers
    Drink bottled water
    Drink water taken directly from the tap
    Drink water from a filtered pitcher (such as Brita)
    Do only full loads of laundry
    Take baths
    Eat meat more than five times a week
    Know where your master water shut-off valve is located
17.
Given what you know about water consumption, how many litres of water would you estimate you use in one day?
  • 10–20 litres
  • 20–50 litres
  • 50–100 litres
  • 100 or more litres
18.
List three uses of water which you think are necessary and should not be restricted
  • (1)
  • (2)
  • (3)
19.
Are you aware of the current rates at which water is being consumed globally?
  • Yes (not necessarily an exact number)
  • No
  • Somewhat
  • Not sure
20.
Are you concerned about the possibility of running out of clean water globally?
  • Yes, very concerned
  • No, not in this life time
  • Maybe, but not for a long time
  • Not sure
21.
Are you concerned about running out of clean water in your community?
  • Yes, very concerned
  • No, not in this life time
  • Maybe, but not for a long time
  • Not sure
22.
Which of the following would you be willing to give up in order to conserve water? Check all that apply, if applicable:
Showering everyday
Taking showers longer than 10 minutes
Taking baths
Your grass lawn
Washing your car more than once a month
Buying disposable water bottles
Eating beef
Eating all meat
Drinking bottled water
23.
Would you be willing to use recycled water for watering your lawn, washing your car, and other activities which do not involve direct personal contact with or ingestion of the water? (Recycled water is water which has been flushed down the drains, filtered, purified, tested, and brought back in a different pipe)
  • Yes
  • No
  • Unsure
24.
When considering all of your daily activities which require water, how much do you feel a restriction on water consumption would affect your lifestyle?
  • Significantly, I would have to actively change my habits and behaviours
  • Somewhat, I would have to constantly keep in mind my water use
  • Not much/very little, I would have to remember to be cautious
  • Not at all, my habits would not have to change

Organized Water Conservation Methods

25.
If a proposal of taxing water from the first drop was proposed for your community and you were given a vote, how would you vote?
  • In favour
  • Opposed
  • Unsure
26.
If a proposal of a monetary reimbursement based on the amount of water not consumed within a limit was proposed, and you were given a vote, how would you vote?
  • In favour
  • Opposed
  • Unsure
27.
Which do you prefer, a tax or a reimbursement?
  • A tax
  • A reimbursement
28.
If a new policy was implemented which restricted the amount of water each industry could use (Example: 25% to agriculture, 30% to oil production, etc.), and the public vote was taken into consideration, would you choose to vote?
  • Yes
  • No
  • Unsure
29.
There is a not-for-profit organization called BlueW (bluew.org), which registers local businesses who are willing to provide free tap water to anyone with a reusable water bottle without requiring the person to make a purchase. Would you be willing to participate in this?
  • Yes
  • No
  • Maybe
30.
If you could get CAD$1.00 for each day that you used 10 litres of water less than your usual amount, would you make the effort to cut back 10 litres?
  • Yes
  • No
  • Unsure

The Water Footprint

31.
A new tool is emerging known as the ‘water footprint’, which can be used to measure the amount of water individuals, families, businesses and industries use. It is akin to a carbon footprint. Although it takes water to produce electricity, food, and clothing, these water uses are commonly unknown. Are you aware of the water footprint?
  • Yes
  • No
32.
It takes 15 400 litres of water to produce one kilogram of beef. Do you believe that knowing this will influence how much beef you consume? Or if you already knew this, does it influence how much beef you eat?
  • Yes
  • Maybe a little
  • No
  • Unsure
33.
Do you believe it would be beneficial to create a water footprint label for consumer goods? For example, adding a water footprint label next to the ‘Nutrition Facts’ on a package of rice.
  • Yes
  • No
  • Unsure
34.
Would seeing that one product required a large amount of water to produce while a similar product required much less affect your choice between the two goods?
  • Yes
  • No
  • Unsure
35.
Which is more likely to influence your decision (1) comparing carbon footprints or (2) comparing water footprints?
  • Comparing carbon footprints
  • Comparing water footprints
  • Neither would affect my decision
  • Unsure
36.
Which, if either, is more likely to influence your decision to NOT buy a product (1) seeing a product required a large amount of carbon emissions to be produced (carbon footprint) or (2) seeing a product required a large amount of water to be produced (water footprint)?
  • A large carbon footprint
  • A large water footprint
  • Neither, that would not influence my decision
  • Unsure

Other Utilities Related to Water

37.
Rank the following utilities and services in order of importance to you:
Electricity
Water
Heat
Air conditioning
Telephone service (both cellular and land line)
Wireless internet

Water Security

38.
Would you be willing to pay an additional amount on your monthly bill in order to ensure a sustained supply of water for yourself?
  • Yes
  • No
  • Unsure
39.
Regardless of whether you are currently paying for your water, how much would you be willing to pay out of a pocket monthly in order to ensure a sustained supply of water for your household?
  • None
  • Between CAD $1.00–5.00
  • Between CAD $5.01–7.50
  • As much as is necessary to maintain a secure water supply
40.
Is there anyone you can think of in your community who does not have access to clean water and/or sanitation?
  • No
  • Yes; please indicate who ___________

