Article

Framing Scenarios of Binational Water Policy with a Tool to Visualize, Quantify and Valuate Changes in Ecosystem Services

1
U.S. Geological Survey, Western Geographic Science Center, Tucson, AZ 85719, USA
2
Department of Hydrology and Water Resources, University of Arizona, Tucson, AZ 85721, USA
3
Department of Agriculture and Resource Economics, University of Arizona, Tucson, AZ 85721, USA
4
U.S. Geological Survey, Western Geographic Science Center, Seattle, WA 98104, USA
*
Author to whom correspondence should be addressed.
Water 2013, 5(3), 852-874; https://doi.org/10.3390/w5030852
Submission received: 10 April 2013 / Revised: 1 June 2013 / Accepted: 7 June 2013 / Published: 28 June 2013
(This article belongs to the Special Issue Ecological Watershed Management)

Abstract

:
In the Santa Cruz Watershed, located on the Arizona-Sonora portion of the U.S.-Mexico border, an international wastewater treatment plant treats wastewater from cities on both sides of the border, before discharging it into the river in Arizona. These artificial flows often subsidize important perennial surface water ecosystems in the region. An explicit understanding of the benefits of maintaining instream flow for present and future generations requires the ability to assess and understand the important trade-offs implicit in water-resource management decisions. In this paper, we outline an approach for modeling and visualizing impacts of management decisions in terms of rare terrestrial and aquatic wildlife, vegetation, surface water, groundwater recharge, real-estate values and socio-environmental vulnerable communities. We identify and quantify ecosystem services and model the potential reduction in effluent discharge to the U.S. that is under scrutiny by binational water policy makers and of concern to stakeholders. Results of service provisioning are presented, and implications for policy makers and resource managers are discussed. This paper presents a robust ecosystem services assessment of multiple scenarios of watershed management as a means to discern eco-hydrological responses and consider their potential values for future generations living in the borderlands.

1. Introduction

When international borders separate ecosystems, questions of sustainability and resource equity can get lost in institutional complexity. The geographic, economic and cultural disconnect between land and water-resource managers and those who benefit from these resources often limit discourse between them [1], especially in the U.S.-Mexico borderlands [2,3]. Marginalized stakeholders in the borderlands tend to suffer from the consequences of unsustainable natural resource policies, because they have less ability to adapt to change [4,5].
Currently, wastewater from Nogales, Sonora, Mexico, is treated in the United States and deposited into a U.S. river. Associated ecosystem services have not been documented and could be lost if the effluent is discontinued. Ecosystem services can be described as the benefits people obtain from ecosystems [6]. Ecosystem services provide a useful way to convey environmental issues for watersheds that have multiple and sometimes complex administrative boundaries [7]; in some cases, the valuation of ecosystem services can be used to support and fund riparian restoration and conservation projects [8]. Our goal is to develop and communicate the most robust representation of science pertaining to this policy that might be altered by changing it. Using an ecosystem services framework, we aim to (1) better understand the multiple roots of a historic and pressing binational water policy issue, (2) provide language to discuss opposing interests and values, and (3) create a basis for negotiation and policy implementation.
The Santa Cruz Watershed is located on the Arizona-Sonora portion of the U.S.-Mexico border (Figure 1). Surface water flows north from Nogales, Sonora, Mexico, into Nogales, Arizona, the United States, via the Nogales Wash tributary of the Santa Cruz River and continues north in the Colorado River Basin. Within Nogales, Sonora, the 2010 census recorded a population of about 220,000 with a growth rate of 3.2%. In Nogales, Arizona, the 2010 census recorded a population of only 20,837.
Rapid industrial and population growth in Mexico’s northern-border region has put increased pressure on state and municipal governments to provide effective and efficient public services, particularly for potable water and wastewater infrastructure [3,9]. People in Nogales, Sonora, rely on groundwater supplies from wells located south of the Santa Cruz Watershed, in the Los Alisos Basin (a.k.a. the Assumption River; Figure 1). Wastewater generated by both Nogales (Ambos Nogales) is delivered by gravity to the Nogales International Wastewater Treatment Plant (NIWTP), approximately ten miles north of the border at Rio Rico, Arizona (Figure 2).
Figure 1. Location map of the Santa Cruz Watershed, Santa Cruz County, towns, streams and boundaries.
Water 05 00852 g001
Figure 2. Map of the Santa Cruz Watershed with close-up view (right) showing the location of the Nogales International Wastewater Treatment Plant (NIWTP) in relationship to the rivers and streams, places, watershed boundaries and the Los Alisos Wastewater Treatment Plant (LAWTP).
Water 05 00852 g002
The NIWTP is operated and maintained by the U.S. Section of the International Boundary and Water Commission (IBWC). Along the U.S.-Mexico border, the IBWC coordinates with its counterpart in Mexico, Comisión Internacional de Límites y Aguas (CILA), to provide binational solutions to issues that arise during the application of U.S.-Mexico treaties regarding boundary demarcation, ownership of waters, sanitation, water quality and flood control in the borderlands [10]. Under IBWC’s Minute 276 [11], the total capacity of the NIWTP allotted for Nogales, Sonora, is limited to 9.9 million gallons per day (MGD), for which Mexico pays the IBWC approximately $350,000 USD annually [12].
The surface-water flows of the Santa Cruz River are mostly supported by treated wastewater discharges [13]. In 2009, the NIWTP was upgraded from an aerated lagoon plant to an activated sludge plant to mitigate excess ammonia, nitrates and biological oxygen demand discharged to the river. IBWC subsidizes costs for treating wastewater delivered from Sonora up to its allotted 9.9 MGD. Through mid-2012, wastewater discharges from Nogales, Sonora, have sometimes exceeded treaty allocations by more than three MGD. Construction of a new plant, the Los Alisos Wastewater Treatment Plant (LAWTP), was completed in 2012 with support from the U.S. Environmental Protection Agency (EPA) to treat the excess from Sonora to Arizona, diverting them to the Los Alisos Basin, south of Nogales (Figure 2).
In compliance with the National Environmental Policy Act (NEPA), EPA prepared an Environmental Assessment (EA) to analyze the potential environmental impacts on Arizona of upgrades to the NIWTP in Rio Rico and diversions of wastewater to the LAWTP in Sonora. The findings from the EA demonstrated little impacts and determined that an Environmental Impact Statement (EIS) would not be required for the NIWTP upgrade or construction of the LAWTP [14].
There is a potential for increased diversion of treated effluent flows to the Santa Cruz River in response to future needs for reused wastewater, climate change and/or future cost increases for wastewater treatment in Arizona. Mexico is under no obligation to deliver any wastewater to Arizona, under IBWC’s Minute 276 [11]. In the event that the U.S. considers increasing treatment costs and/or negotiating for the security of wastewater flows from Mexico, it is important to understand the value of effluent discharged to the Santa Cruz River in Arizona.
A report by the Arizona Cooperative Extension in 2009 shows that less than a third of Arizona streams and rivers supported by effluent in 1987 remain supported due to diversions for agriculture, etc. [15]. Global warming is expected to increase temperatures in the next 50 years, further reducing surface-water runoff [16,17], especially in arid lands [18]. Because of these issues, stakeholders and citizens are concerned about the volume of water left to sustain flows, groundwater recharge, vegetation and associated values for wildlife and human populations in Arizona [19,20].
The most obvious impact of the treated effluent is the Santa Cruz river riparian area and the multitude of plant and animal species that inhabit the area. The Tucson Audubon Society manages a 9.5 km riparian corridor north of and including Tumacácori National Historical Park (TUMA), and the Park itself is designated an Important Bird Area (IBA; Figure 2). The IBA is made up of a cottonwood-willow riparian corridor that is the primary habitat for a number of bird species of conservation concern, both globally and nationally (e.g., Bell’s vireo (Vireo bellii), yellow-billed cuckoo (Coccyzus americanus) and gray hawk (Buteo nitidus)), as well as species in rare/unique habitat (e.g., riparian obligates, like Lucy’s warbler (Oreothlypis luciae) and the summer tanager (Piranga rubra)), who do not adapt to non-riparian habitats [21]). A large number of neotropical migrant birds depend on riparian corridors in the Western U.S. for their summer breeding [22]. Surface flow in this area of the Santa Cruz River is also important for a number of critical fish, like mosquitofish (Gambusia affinis) and the longfin dace (Agosia chrysogaster).
In addition to riparian vegetation and wildlife, the benefits of maintaining effluent discharge for instream flow include the potential for recreation, property value, aquifer storage and groundwater supply—which is also valuable for off-channel and indirect potable use purposes. Costs of maintaining instream flow and off-channel use include monetary expenses needed to expand, operate and maintain the wastewater treatment plants and delivery infrastructure, as well as non-monetary expenses associated with the potential for effluent to degrade environmental and drinking-water quality. As future pressures of climate and population change increase, it is important to consider the costs and benefits of different scenarios of managing binational resources using terminology that can be acceptable to all stakeholders [23].

2. Materials and Methods

We determined which ecosystem services are of value to stakeholders in the watershed, considered how they might be altered by subsequent changes in instream flow and modeled potential change scenarios using a spatially-explicit platform. Results are guided by three goals of valuing ecosystem services as laid out by Costanza and Folke [24]: ecological sustainability; fairness in resource distribution; and efficient resource allocation. A benefit transfer is used to calculate monetary expenses of replacing effluent lost based on the scenarios created. Ecosystem services measured in this study include water provisioning, vegetation and habitat provisioning; these are compared to real-estate values, the value to replace water and vulnerable communities.

2.1. Binational Effluent Scenario Development

The NIWTP is currently designed to treat 14.74 MGD with a peak operational capacity 17.2 MGD. Current discharges average about 15.1 MGD with an annual contribution of 12.5 MGD from Nogales, Sonora. The LAWTP has just come online in mid-2012 and is expected to divert 2.5 MGD of wastewater from NIWTP, in Arizona. The wastewater utility in Nogales, Sonora, (Organismo Operador Municipal de Agua Potable Alcantarillado y Saneamiento de Nogales; OOMAPAS-NS) hopes to expand LAWTP’s capacity to 7.5 MGD by 2015 [25]. In addition, the uphill pumping station and the pipeline to the plant are being constructed to potentially handle a volume of up to 17 MGD of influent to LAWTP. There is no security under Minute 276 [11] for Mexico to continue sending effluent to Arizona, particularly given the uncertainties associated with climate change, rate increases, population increases, and water shortages. Considering this, multiple scenarios depicting potential future discharge from the NIWTP outfall (Figure 3) to the Santa Cruz River were developed as a percent of the Current Day discharges where 15 MGD of effluent released at NIWTP outfall:
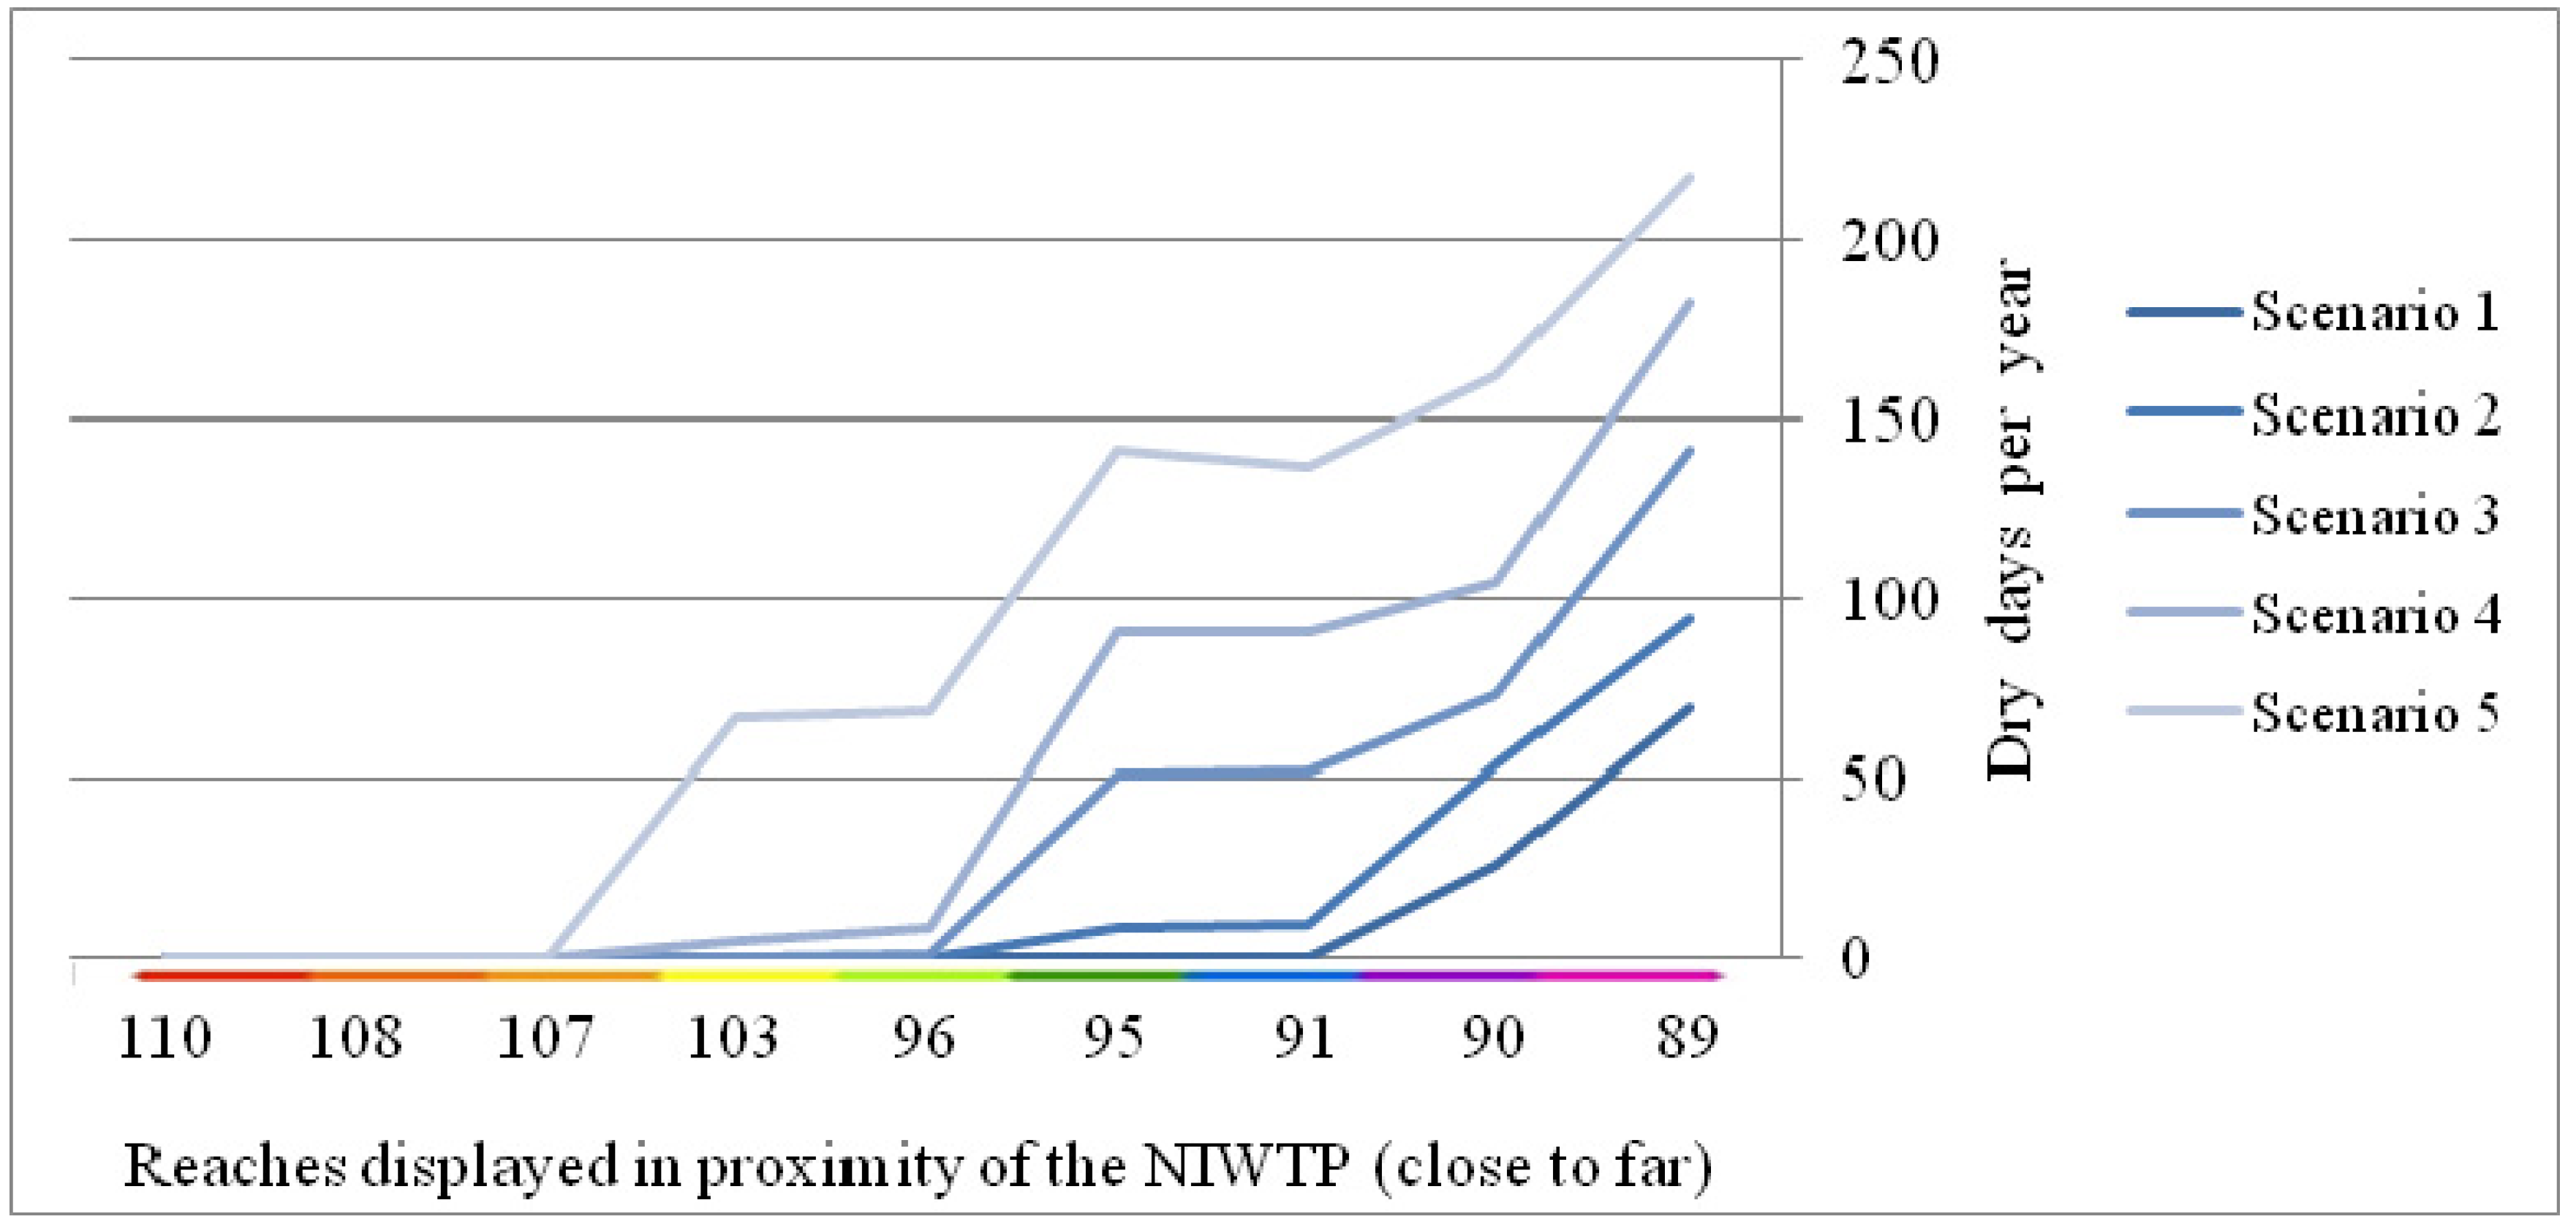
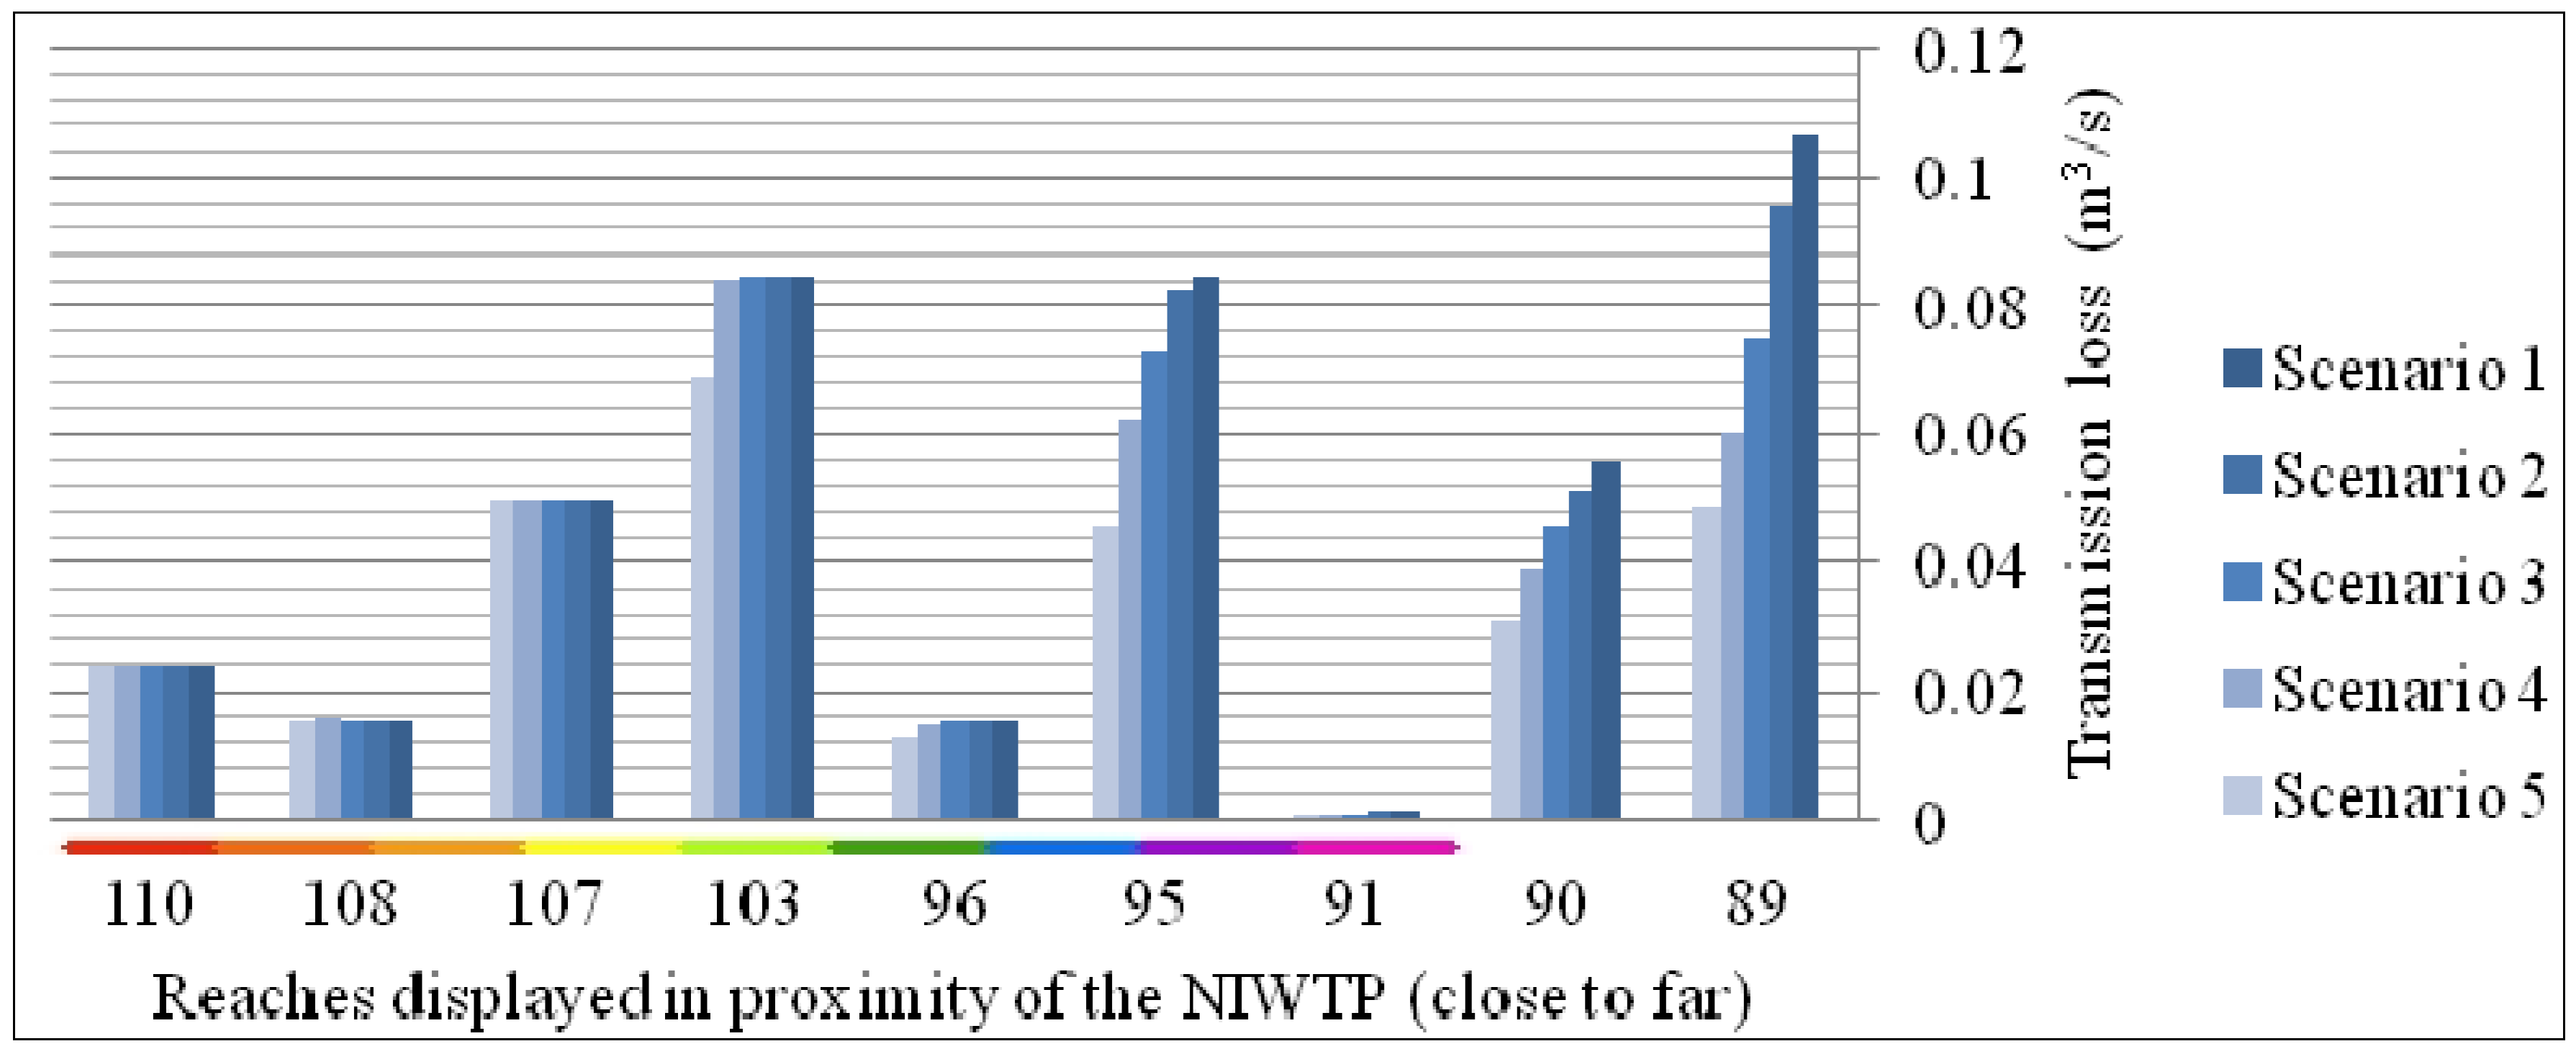
  • Scenario 1: 100% or 15 MGD,
  • Scenario 2: 83% or 12.5 MGD,
  • Scenario 3: 67% or 10 MGD,
  • Scenario 4: 50% or 7.5 MGD,
  • Scenario 5: 33% or 5 MGD.
It is important to note that Scenario 5 is equivalent to Mexico diverting 100% of their effluent contributions in 2013.
Figure 3. Photographs of reaches of the Santa Cruz River moving away from the NIWTP, where (a) water is being discharged at the outfall of the NIWTP (Photo from Tosline [26]); (b) the river is flowing northward; (c) the river is drying out at Amado; and (d) the dry bed north of Amado (Photos b–d by Sam Treese).
Water 05 00852 g003

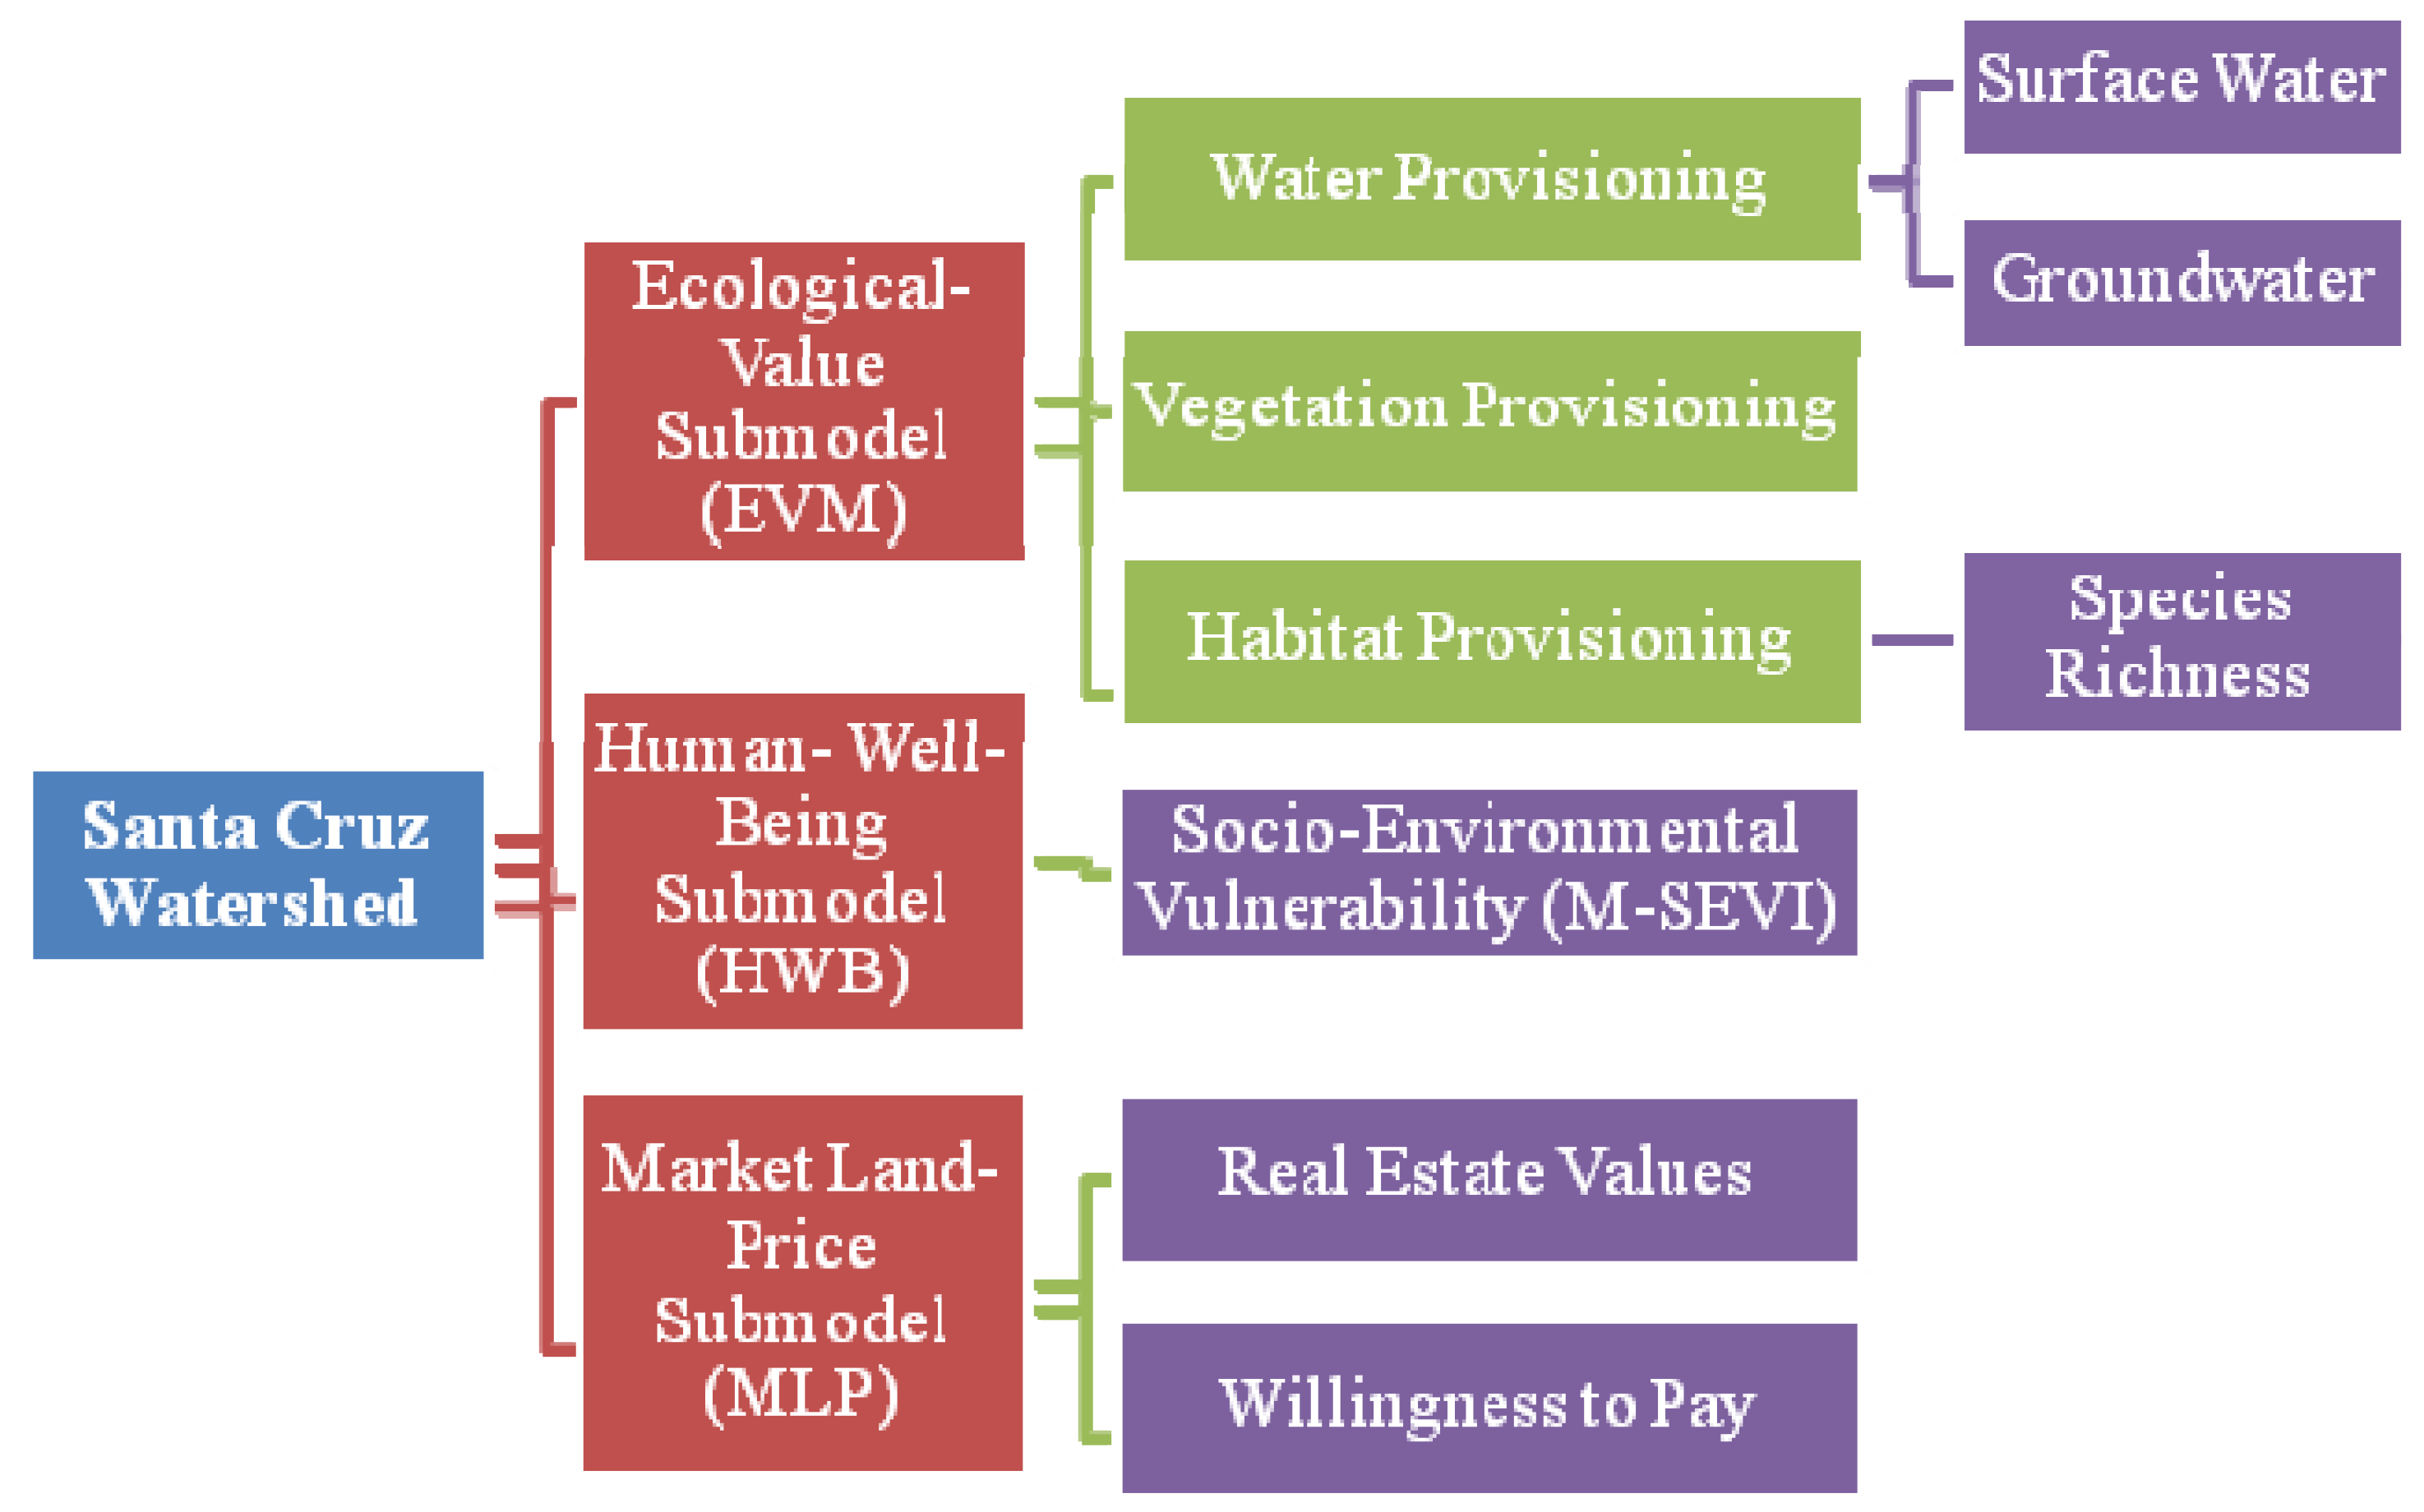
2.2. Santa Cruz Watershed Ecosystem Portfolio Model (SCWEPM)

The Ecosystem Portfolio Model, an online decision support GIS tool, uses the concepts of the three “pillars” of sustainability as sub-models: the Ecological-Value Submodel (EVM), the Human Well-Being Submodel (HWB) and the Market Land-Price Submodel (MLP), which can be analyzed under various scenarios [23,27,28]. The EPM approach embraces traditional geospatial map overlay analysis for regional ecological planning, originally introduced by McHarg [29], and provides for multiple scenarios of ecosystem services provisioning to be visualized for suitability/capability analysis. Through this process, it is easy to identify where “non-capable” areas can be eliminated and also to display an ordinal assignment of suitability to “capable” areas. In the fall of 2009, the EPA’s Ecosystem Services Research Program (ESRP) joined the U.S. Geological Survey (USGS) to develop the EPM to examine alternative scenarios of ecosystem service provisioning for the binational Santa Cruz Watershed [23]. Figure 4 is a conceptual graphic of the three sub-models of the SCWEPM, attributes and ecosystem services. Products from any of the sub-models can be selected, compared or bundled to inform decision-makers. Assumptions, uncertainties and the strengths and weaknesses of the EPM are provided in detail by Labiosa et al. [28]. The EPM does not maintain a steady subset of models within it, as it is flexible, to apply to different places and different problems; however, the submodels of the EPM need to be calibrated, depending on their intended application.
Figure 4. Conceptual graphic of the Santa Cruz Watershed Ecosystem Portfolio Model (SCWEPM), sub-models (in red boxes), ecosystem services (in green boxes) and quantifiable attributes (in purple boxes).
Water 05 00852 g004

2.2.1. Ecological-Value Submodel (EVM): Water, Vegetation and Wildlife Habitat

The biophysical models of the environment contained in the EVM generate quantities of natural resource provisioning or ecosystem services: visible water, vegetation and wildlife. Results from the EVM help decision-makers make more informed choices.
The Soil and Water Assessment Tool (SWAT) [30,31] was calibrated to improve model performance and reliability in this arid-land watershed [32]. Important outputs of the SWAT model include flow, evapotranspiration, estimates of sediment loads and transmission losses. Herein, we discuss SWAT output in terms of ecosystem services (visible water). We analyzed the impact of reductions in daily discharge from 15 to 5 MGD on the current perennial reaches of the Santa Cruz River using the SWAT model. Currently, the discharges from NIWTP are responsible for keeping about 26 river miles of the downstream Santa Cruz in perennial flow, which the model divided into separate reaches, portrayed in Figure 2.
Desert riparian forest is one among the most threatened forest types in the United States, as a result of river regulation, groundwater over-use and invasive species [33]. Riparian forests are also hotspots of animal biodiversity in arid ecosystems [34]. Using Wildlife Habitat Relation (WHR) models in conjunction with vegetation maps, we quantified and mapped terrestrial vertebrate species richness [34]. We assessed the historical changes in riparian habitat and associated species richness by crosswalking WHR species richness data to a series of six historical vegetation maps dating from 1936 to 2006. Historical maps depict the spatial distribution of plant communities defined by dominant life form and patch structure (e.g., riparian woodland, tree savanna) [35]. We assessed changes in habitat distributions at Tumacacori (2 km of linear riparian area) and Tubac (1 km), before and after the introduction of wastewater in 1972. We use these historical, pre-treatment plant data as information to describe future states of riparian change given the diversion of water from the Santa Cruz River.

2.2.2. Market Land-Price Submodel (MLP)

The Market Land-Price Submodel (MLP) evaluates land price as a function of land use/land cover (LULC) patterns and other predictor variables. People gravitate toward scenic places, paying more to live in them than in less attractive areas [36]. A premium is typically paid by buyers of riparian property of the Santa Cruz Watershed [37,38,39,40,41,42]. Arora et al. [43] and Amaya et al. [44] studied different factors that might affect median home values in the U.S. portion of the Santa Cruz Watershed, using the hedonic pricing method and census data. Census block group data was combined with GIS data for vegetation and land cover, land administration, measures of species richness and open space and proximity to amenities and disamenities. Areas with more species-rich habitat in the U.S.-portion of the Santa Cruz Watershed portray higher median home values, along with those with closer access to public lands or with relatively more undeveloped private land [43].
A previous study by Bourne [40] quantified an average housing price for homes within 1.1 miles of riparian vegetation, receiving an average price premium of 3.1%, with premiums ranging as high as 5.8% in Tubac and Rio Rico, Arizona. Estimated median house value in 2009 computed for Santa Cruz County is $125,907 [45]. If parcels located within 1.1 miles of this river’s reach enjoy an average price premium of 3.1% of the county’s median house value, the monetary gain that homeowners have for living near the Santa Cruz River riparian corridor can be approximated as $3903 per home. We used a parcel map from Santa Cruz County, assuming each parcel has a home on it, to compare our results with this figure.

2.2.3. Human Well-Being Submodel (HWB)

The SCWEPM’s Human Well-Being (HWB) submodel uses data and models to evaluate a set of human well-being indicators and metrics of interest to the public, land-use planners and stakeholders. We developed a Modified Socio-Environmental Vulnerability Index (M-SEVI), using determinants from binational census and neighborhood data, to identify marginalized communities in the Santa Cruz Watershed. The M-SEVI is an index that portrays a community’s average levels of education, presence or absence of access to infrastructure (sewer and/or water lines), migration status (whether or not they have migrated to the area within the past 5 years), housing-type and average number of dependents [4]. Compared to the rest of the U.S. portion of the watershed, the communities at Rio Rico were identified as having a low vulnerability; however, communities at Tubac and Tumacácori were moderately high, due to a lack of infrastructure. In consideration of environmental justice and to defer any decrease in regional quality of life, it is especially important to understand what ecosystem services might be lost or gained in vulnerable communities.

2.3. Benefits Transfer

Valuation studies can employ benefit transfer as a method to generate monetary value estimates of ecosystem services, where monetary values estimated at one site are transposed to another [46]. Evaluating substitutes requires understanding replacement costs at policy sites for which to adapt a value to the study site. In the Santa Cruz Watershed, Colorado River water is delivered to Tucson via a long system of pipelines called the Central Arizona Project (CAP). Tucson Water Company blends CAP with groundwater to provide potable water supplies for the city. In FY13, Tucson Water will pay $144 per acre-foot of CAP water, consistent with prices charged in adjacent municipalities [47,48]. A study documented by Bark [8] describes the potential to utilize effluent for riparian-restoration—she clearly denotes that the CAP water is an uninterruptible, highly secure, potable supply, while effluent is not and should not be compared for such uses in Tucson, Arizona. However, in the case of Nogales, there is no extra effluent or other sources to fulfill the riparian requirements. Additionally, local agencies have considered piping CAP water to the area, and therefore, we feel it is an adequate consideration as the only source of replacement—though we did not consider the additional costs to extend the CAP water supply in this calculation. We simply estimated the value of binational effluent to the Santa Cruz River north of the NIWTP as an indicator of the ability to provide ecosystem services of value to stakeholders using this replacement price.

3. Results

3.1. Scenarios

Surface flows provide many ecosystem services, such as vegetation and habitat for wildlife, as well as recharge to groundwater resources for water provisioning. Using the sub-models of the SCWEPM, we mapped and quantified the biophysical outputs and socioeconomic impacts of the scenarios being considered, where it is assumed the premium will be removed or reduced with less riparian vegetation and not accounting for willingness to accept values (outlined in Table 1).
The scenarios of effluent discharge in terms of visible water flowing by number of days per year were plotted in a graph (Figure 5) in relation to the reach identified using the SWAT model (Figure 2). In our most extreme Scenario 5, where effluent discharge is reduced to 5 MGD, reaches closer to the NIWTP are not impacted by the change in volume, but those reaches farthest away are predicted to have up to three times as many dry days per year. As surface flow declines, so does the recharge to the aquifer. Those reaches that are impacted by perennial flow decline are also impacted by reductions in percolation and in reaches farthest away from the NIWTP, by as much as 50% from the current day (Figure 6).
The river at IBA and Tubac will no longer be perennial in Scenario 2, and downstream drying progresses in further reduction to Scenarios 3 through 5. According to Lite and Stromberg [33], cottonwood-willow galleries suffer when streams are dry more than 25% of the time. Under Scenario 5 (representing 33% of current day discharge), the river at Tubac (16 miles downstream) will be dry approximately 37% of the time (136 days/year), and the IBA, 26 miles, at which the river is perennial under current conditions, will be dry about 60% of the time (217 days/year).
Table 1. Summary table of impacts to ecosystem services in the Santa Cruz River, Arizona, for varying effluent release scenarios. IBA, Important Bird Area; TUMA, Tumacácori National Historical Park.
Effluent Release ScenarioPerennial Surface FlowVegetation HabitatReal-Estate ValueVulnerable Communities AffectedGroundwater Recharge
Scenario 1: 100% 18–25 mi.N/A 7,781 parcels with combined sales price of $30,370,153 baselineN/ARecharge estimates from the channel ~11,160 AFY baseline
Scenario 2: 83%16 mi. IBA riparian zone impacted7,491 parcels with combined increase in sales price of $29,238,249 (difference/loss of Water 05 00852 i001) Tubac impactedRecharge estimates from the channel decrease by ~4% ( Water 05 00852 i002)
Scenario 3: 67%11.5 mi. IBA riparian zone and north of TUMA impacted6,684 parcels with combined increase in sales price of $26,088,434 (difference/loss of Water 05 00852 i003)Tubac and Tumacacori impactedRecharge estimates from the channel decrease by ~12% ( Water 05 00852 i004)
Scenario 4: 50%10.7 mi. IBA riparian zone and north of TUMA and TUMA impacted6,405 parcels with combined increase in sales price of $24,999,464 (difference/loss of Water 05 00852 i005) Same communities at Tubac and Tumacacori impactedRecharge estimates from the channel decrease by ~20% ( Water 05 00852 i006)
Scenario 5: 33%6.3 mi. Same IBA riparian zone and north of TUMA and TUMA impacted4,930 parcels with combined increase in sales price of $19,242,367 (difference/loss of Water 05 00852 i007) Same communities at Tubac and Tumacacori impactedRecharge estimates from the channel decrease by ~32% ( Water 05 00852 i008)
Figure 5. Line graph displaying the number of dry days per year that is predicted at each reach, with varying effluent release scenarios [49], where Scenario 1 is current day or 15 million gallons per day (MGD), Scenario 2 is 12.5 MGD (83%), Scenario 3 is 10 MGD (67%), Scenario 4 is 7.5 MGD (50%) and Scenario 5 is 5 MGD (33%).
Water 05 00852 g005
Figure 6. Column chart portraying predicted transmission losses (cubic meters per second; cms) at each reach, for varying scenarios [49], where Scenario 1 is current day or 15 MGD, Scenario 2 is 12.5 MGD (83%), Scenario 3 is 10 MGD (67%), Scenario 4 is 7.5 MGD (50%) and Scenario 5 is 5 MGD (33%).
Water 05 00852 g006
Based on the historical mapped vegetation data and the WHR models, these riparian forest and woodlands (RFW) offer potential habitat for 263 species (55 mammals, 169 birds and 38 herptiles), while other non-forest/woodland (NFW) floodplain types (tree savanna, shrub savanna, shrubland and strand) provide potential habitat for 99 species (35 mammals, 50 birds and 14 herptiles) [34]. The historical distribution of these types, along a 3 km stretch of riparian corridor at the IBA, is presented in Figure 7. Prior to the introduction of treated wastewater, NFW types were the majority cover type in the area. In 1936, the distribution was about equal, but starting by 1956, there was a steep decline in RFW and an increase in NFW types (Figure 7). Both types declined slightly between 1956 and 1975. After 1975, with the introduction of effluent, RFW increased slightly and NFW declined. Considerable effluent-driven changes are observed from 1983 to 2006, with the decline in NFW and rapid increase of RFW.
Figure 7. Historical distribution of riparian forests and woodlands (RFW) and non-forest/woodland (NFW) vegetation along a 3 km stretch of the Santa Cruz River.
Water 05 00852 g007
A summary of the various effluent-discharge scenarios of the SCWEPM is described below (and mapped in Figure 8):
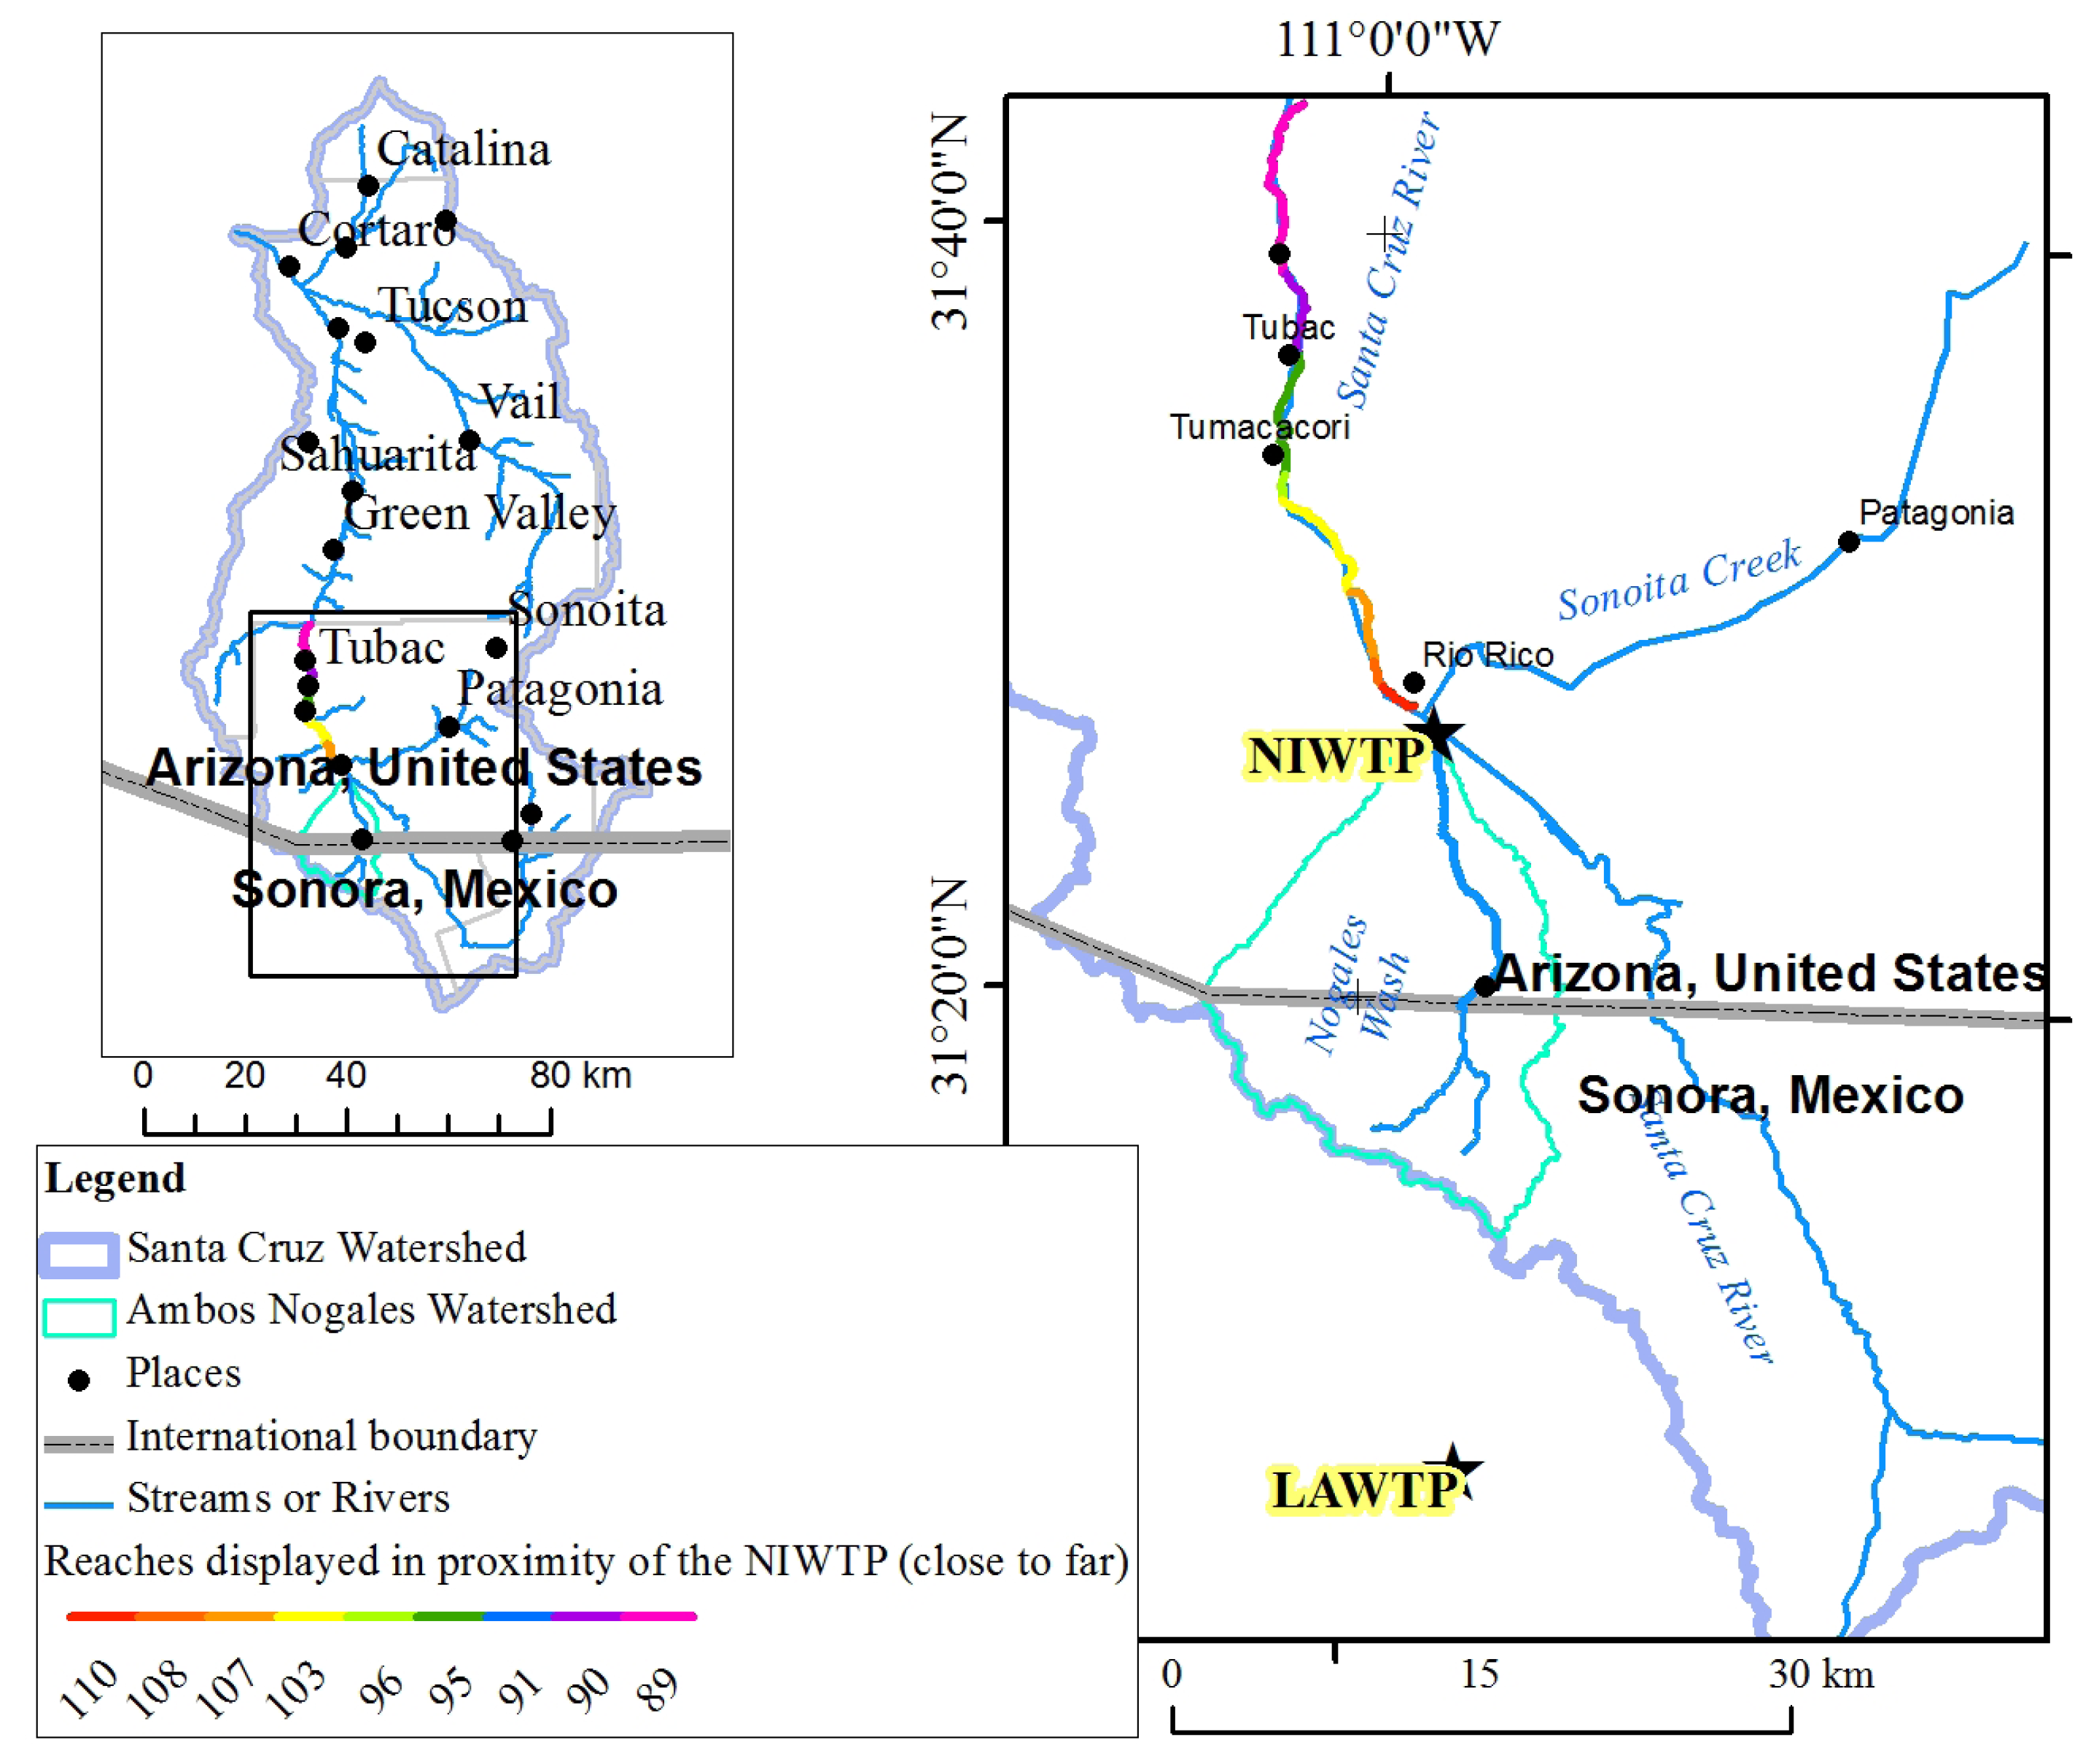
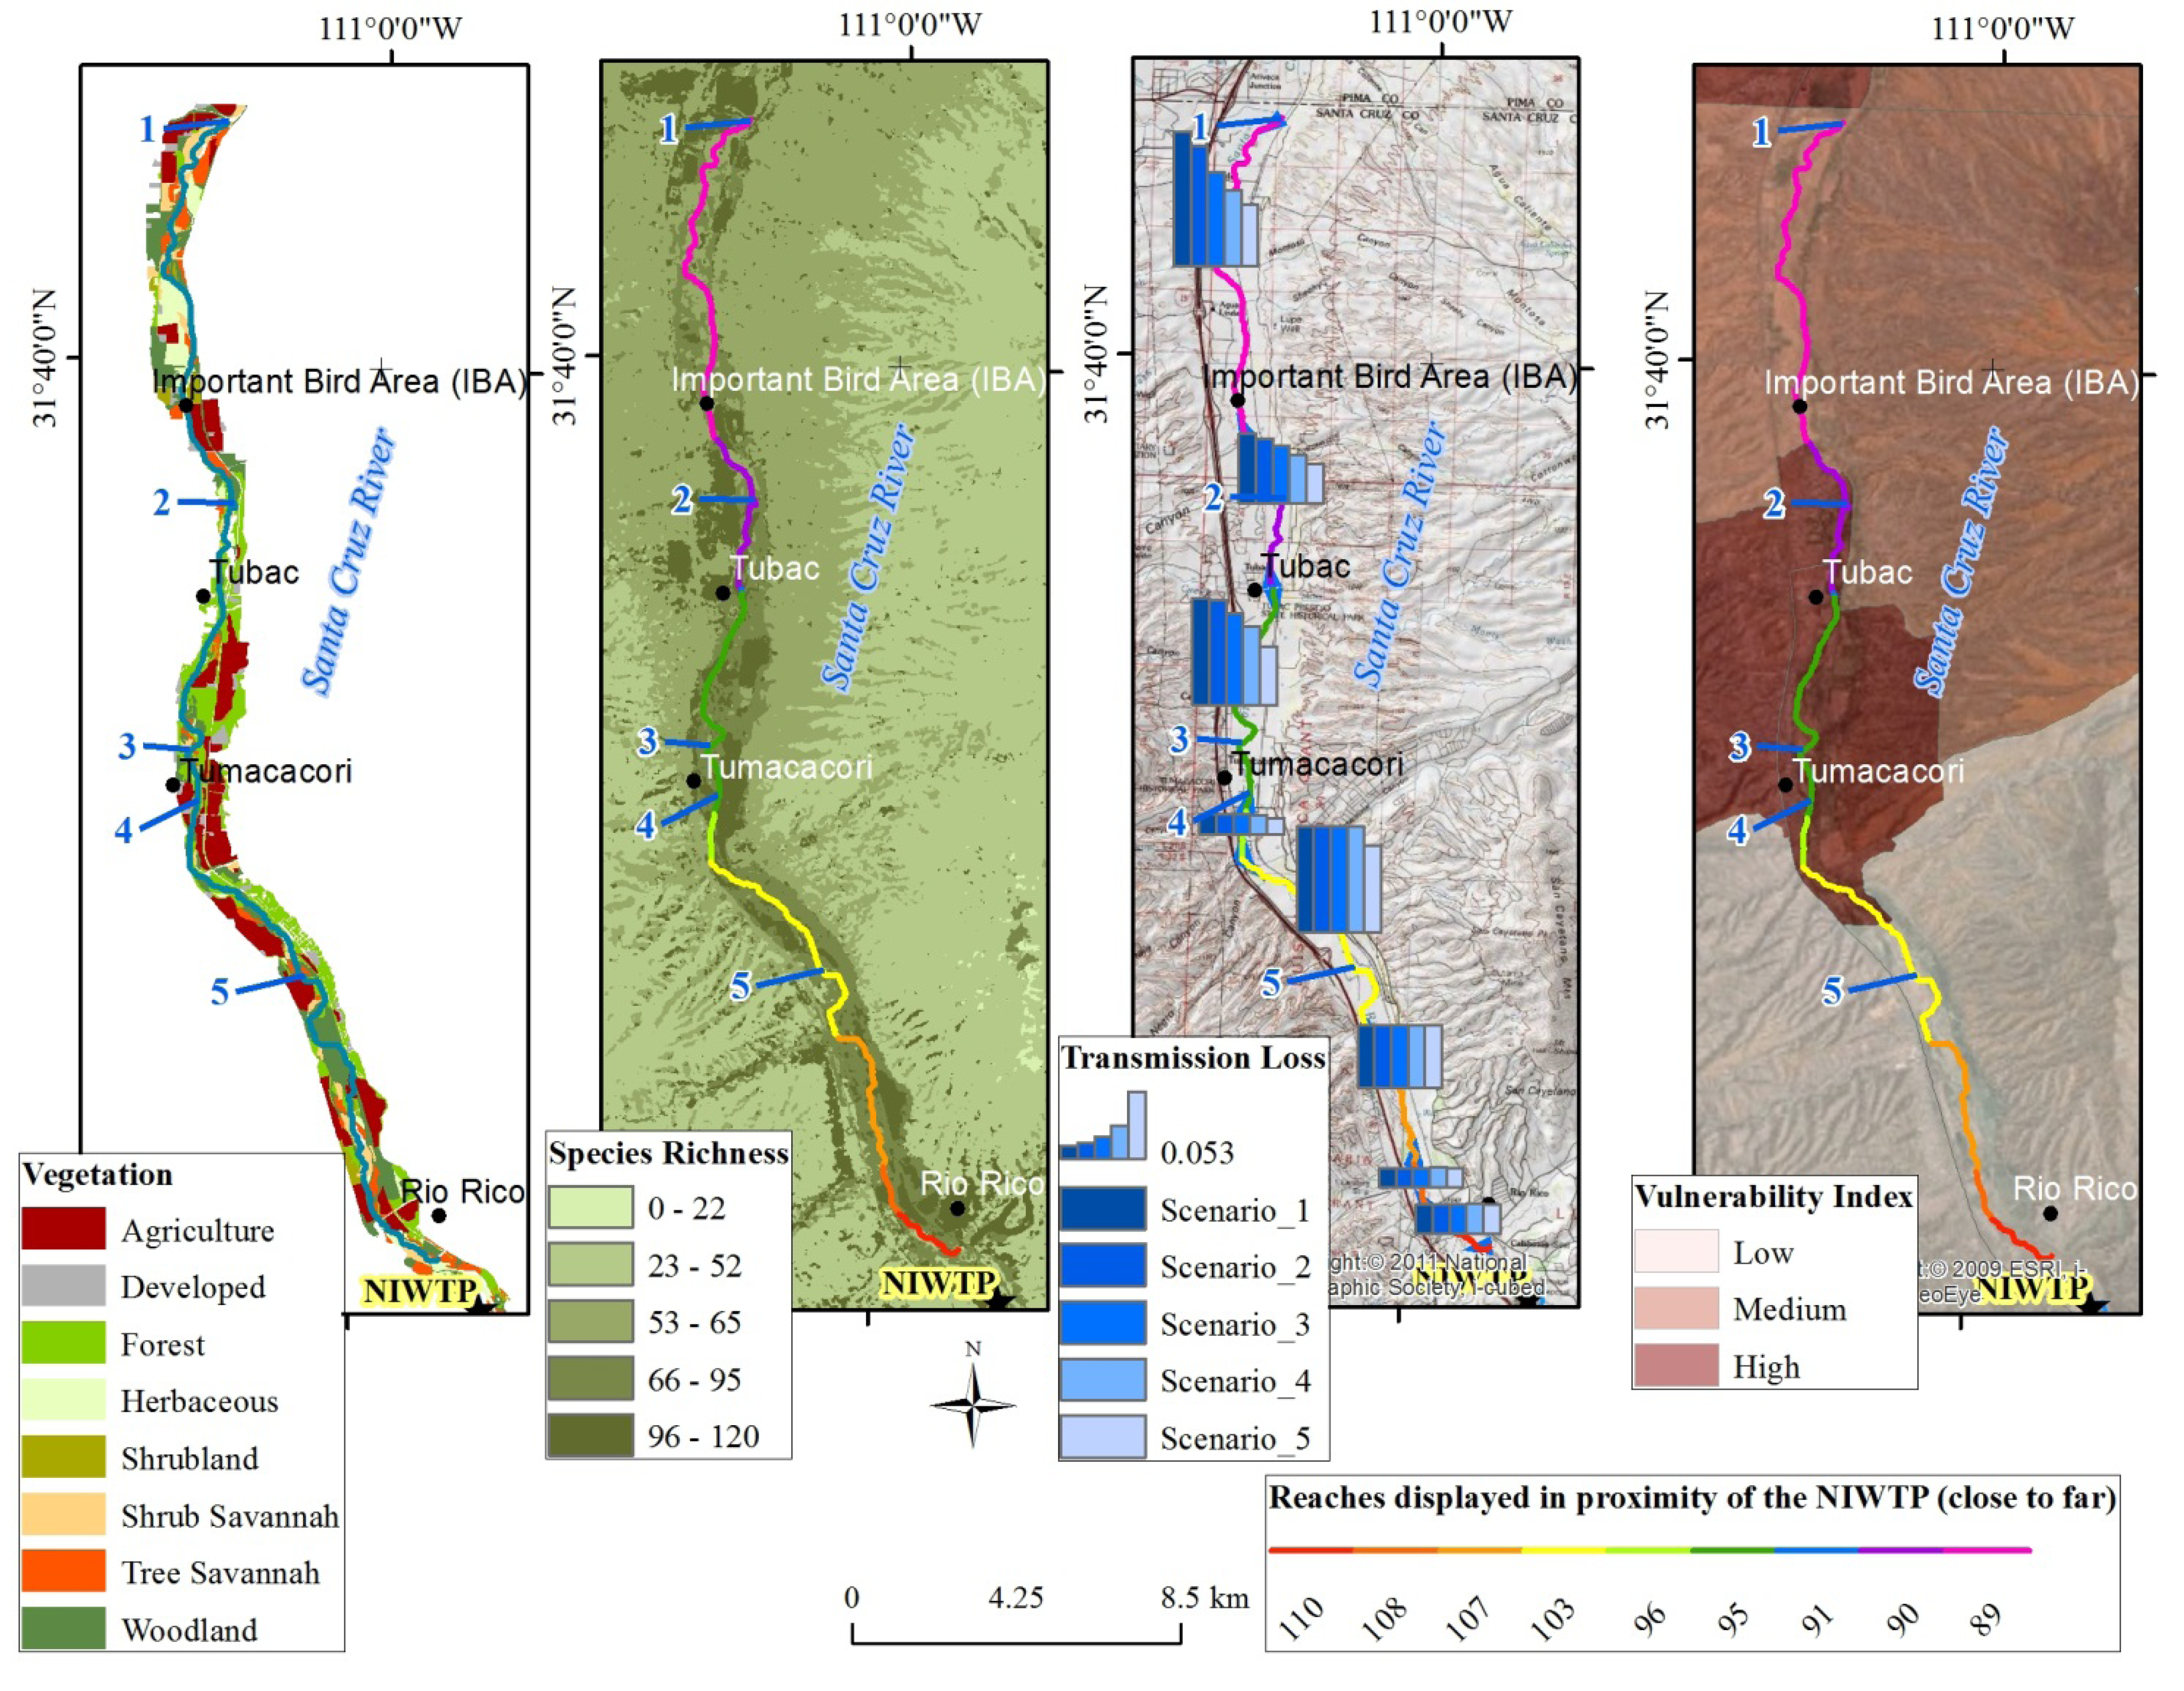
  • In Scenario 1, where the current 15 MGD are being discharged at the NIWTP, perennial surface flow is expected to extend across 18–26 river miles, supporting riparian forest or woodland vegetation, habitat for 267 species and groundwater recharge estimates from the channel at approximately 11,160 AFY. According to the parcel map, 7781 privately owned parcels of real-estate exist within the 1.1 mile buffer of the river. This privately owned land calculation comprises 6331 ha of the 21,116 ha riparian buffer zone. The real-estate value of the riparian zone in RFW status is estimated to be $30.4 M.
  • In Scenario 2, where 83% of current day discharge is released at the NIWTP (12.5 MGD), the perennial surface flow is reduced to approximately 16 river miles, impacting the IBA riparian zone on the Tucson Audubon-held conservation easement land and decreasing home values for up to 290 parcels of land (~461 ha). This results in a loss of up to $1.3 M in lost home value premiums, for the region. Highly vulnerable communities at Tubac are impacted by this loss. Recharge estimates from the channel decrease by approximately 4% (approximately 428 AFY).
  • In Scenario 3, where 67% of current day discharge is released at the NIWTP (10 MGD), perennial surface flow is reduced to approximately 11.5 river miles, impacting the IBA riparian zone on the Tucson Audubon-held conservation easement land and areas north of Tumacácori. Home values for up to 1097 parcels of land (~1318 ha) will lose their riparian proximity value, including the highly vulnerable communities at Tubac and Tumacácori. This translates into real-estate value loss of up to $4.3 M for the region. Recharge estimates from the channel decrease by approximately 12% (approximately 1377 AFY) from the current day.
  • In Scenario 4, where 50% of current day discharge is released at the NIWTP (7.5 MGD), the perennial surface flow is reduced to approximately 10.7 river miles, which impacts the IBA riparian zone on the Tucson Audubon-held conservation easement land, through all of Tumacácori National Historic Park (TUMA). Home values for up to 1376 parcels of land (1451 ha) will lose their riparian premiums, impacting the same highly vulnerable communities at Tubac and Tumacácori. The real-estate sales prices for the region, estimated to be lost by this scenario, are approximately $5.4 M. Recharge estimates from the channel decrease by approximately 20% (approximately 2186 AFY).
  • Finally, in Scenario 5, where 33% of current day discharge is released at the NIWTP (5 MGD), perennial surface flow is reduced to approximately 6.3 river miles. The same IBA riparian zone on the Tucson Audubon-held conservation easement through all of TUMA is impacted. Home values for up to 2851 parcels of land (3056 ha) will lose their riparian premiums, equivalent to $11.1 M, impacting the same highly vulnerable communities at Tubac and Tumacácori. Recharge estimates from the channel decrease by approximately 32% (approximately 3564 AFY).
Figure 8. Map series portraying the comparison of various effluent-discharge scenarios of the SCWEPM, where the perennial flow extent for each scenario is numbered (1, 2, 3, 4 and 5). Maps display from left to right: vegetation, habitat species richness, transmission loss (at each reach) and U.S. Census Block groups mapped according to the Modified Socio-Environmental Vulnerability Index (M-SEVI).
Water 05 00852 g008

3.2. Benefit Transfer

3.2.1. Surface Water

We then applied a point benefit transfer to calculate the monetary value for treated effluent being discharged into the Santa Cruz River from the NIWTP outfall using the figure that Tucson Water will pay per acre-foot of CAP water in FY13 (fiscal year 2013; $144), to identify how that value might change under the varying scenarios (Table 2). This creates a linear relationship with the flow regime when that price is extrapolated out across scenarios. In Scenario 5, the dollar value is reduced by two-thirds from the current Scenario 1, equivalent to the two-thirds reduction in treated effluent at the outfall and resulting in a $1.61 M loss.
Table 2. Estimated price of domestic-use water, based on calendar year 2013 (*), calculated at the outfall (point-source) of the NIWTP for varying effluent release scenarios.
ScenarioWater discharged at the NIWTP outfall (MGD)Dollar value of treated effluent at outfall/year * (million $)Dollar value difference from current scenario of treated effluent at outfall/year *(million $)
Scenario 1: 100%152.42
Scenario 2: 83%12.52.02(0.40)
Scenario 3: 67%101.61(0.81)
Scenario 4: 50%7.51.21(1.21)
Scenario 5: 33%50.81(1.61)

3.2.2. Ground Water

We also calculated a replacement cost for the potential loss of groundwater recharge, by multiplying the recharge values for each scenario by the $144 per acre-foot and estimate $512 K to replace the effluent lost in Scenario 5 (i.e., a 2/3 reduction; Table 3). Replacement costs can vary depending on if someone really thinks it is necessary to replace the visible water. Right now, citizens of Santa Cruz County, in the United States, are benefitting from the surface water and groundwater recharge services of the effluent, and more so, those who own real-estate adjacent to the riparian zone are benefiting from vegetation and habitat-provisioning, which increases the value of their land. It is unclear which official body might take responsibility for paying this amount of money for these services. Like all economic models of price determination, results are subject to supply and demand, and no one knows for sure what the future market will be, but we can guess that water will remain a valuable commodity. This study provides a basis for discussions about the future management, financial investments and binational policy related to the effluent.
Table 3. Dollar value, based on calendar year 2013 (*), of binational effluent percolating the soil—estimated as recharge to the aquifer—in the Santa Cruz Active Management Area (SCAMA), where $144 is paid per acre-foot of water (325,851 gallons). SWAT, Soil and Water Assessment Tool.
ScenarioWater percolating to the SCAMA aquifers derived by SWAT SCWEPM (acre-ft/year)Dollar value of water recharging the SCAMA aquifers/year * (million $)Dollar value difference from current scenario to recharge SCAMA aquifers/year * (K $)
Scenario 1: 100%11,1601.6
Scenario 2: 83%10,7321.55(62)
Scenario 3: 67%9,7831.4(198)
Scenario 4: 50%8,9741.29(315)
Scenario 5: 33%7,5961.1(513)

3.3. Willingness to Pay

Demand for ecosystem services can also be elicited by posing hypothetical scenarios that involve the description of alternatives in social survey questionnaires [50]. A contingent valuation (CV) survey of visitors to TUMA and Tubac Presidio State Park was used to obtain willingness to pay (WTP) estimates for effluent use to maintain the riparian corridor [51]. In 2006, the mean WTP via a one-time payment, to maintain the Upper Santa Cruz riparian corridor, was $71 per respondent, the median response was $30 and the most common response was $50, though you can visit these sites and not actually see the river. We multiplied the median value by the yearly number of visitors at TUMA, roughly 60,000 [47], to calculate a WTP value of approximately $1.8 M. This could cover the estimated price of domestic-use water calculated at the outfall (point-source) of the NIWTP for effluent release in Scenario 5 ($1.61 M) or be stretched out to cover the same scenario’s dollar value of binational effluent percolating the soil estimated as recharge to the aquifer for approximately three and half years, where $513 K would be needed to replace lost recharge per year.

4. Discussion

Hedonic modeling results suggest that policies to maintain the riparian corridor via managed effluent for instream flows, can support biodiversity and provide economic benefits to homeowners in Santa Cruz County, improving regional economics and quality of life. The potential harm to the local real-estate market and the identification of vulnerable communities being impacted by a diversion of flow might influence the United States and local politicians to recognize the need to ensure flow for environmental justice, given the executive order issued by the U.S. President in 1994 mandating that all Federal Agencies address environmental justice in their duties.
There are a lot of stones left unturned as we publish this report. We want to recognize that in the iterative process of building the SCWEPM, our scenarios only consider the value of instream flow that the effluent contributes in Arizona. Further, our research does not reflect the costs associated with treating wastewater at NIWTP vs. pumping the wastewater and treating it at the LAWTP, something we consider to be an important next step in associated research. Future economic research suggestions include conducting a cost-benefit analysis for Nogales, Sonora, to identify how much money and effort it takes to send the effluent waters up and over the watershed south to Los Alisos (in terms of energy and dollars/pesos) vs. the gravity-supported downhill flows to NIWTP. And finally, our results do not reflect the real cost of piping the CAP water to the NIWTP for our scenarios, which would ultimately increase the values represented in our study substantially. We recognize that this research is very basic in the field of economics and welcome more related research in this field. We stress the importance of primary economic valuation or even more accurate secondary methods (benefit function transfer). The methods employed within are very indicative and could vastly be improved through primary analyses.
The replacement costs that have been calculated in this study are based on the assumption that someone will be willing to pay to have the effluent replaced, for surface flows and/or groundwater recharge. Local representatives from the U.S. Bureau of Reclamation (BOR) have been developing a Nogales/Santa Cruz Active Management Area (SCAMA) “Water Storage Appraisal Study” with the City of Nogales and Arizona Department of Water Resources (ADWR) with Santa Cruz County, to investigate the possible management alternatives for future water storage and sustainability in our study area [26,52]. Here, we demonstrate that groundwater supplies are being recharged through percolation and transmission losses via surface flow from effluent, and decreasing flow will decrease recharge potential. It is possible that the State of Arizona might consider the recharge value a worthy investment for achieving potential safe-yield in this shallow aquifer.
In 2000, the Groundwater Users Advisory Council for the SCAMA suggested that the Federal government provide funds or incentives to purchase effluent from Mexico [20]. The quantification of ecosystem services can be used to motivate payment for conservation [53]. Payments for ecosystem service (PES) policies compensate individuals or communities for undertaking actions that increase the provision of ecosystem services, and hundreds of PES initiatives have emerged around the globe. Mexico has initiated large-scale programs that give direct payments to landowners for undertaking specific land use practices that could increase the provision of hydrological services [54].
Riparian areas recognized by this research effort as having species-rich habitat have more biodiversity potential and could be considered for wildlife observation or conservation. The U.S. National Park Service (NPS) mission is to preserve the natural resources of their parks for this and future generations. The river at Tumacácori National Historical Park (TUMA) will no longer be perennial if all the waste water coming from Mexico is diverted to the Los Alisos Basin (Scenario 5). The NPS and Tucson Audubon Society might consider results from this scenario analysis in formulating ecological preservation plans for the riparian area and habitat at Tumacácori.
The Endangered Species Act (ESA) requires the identification and designation of “Critical Habitat” that can be protected to prevent extinction. The designation of “Critical Habitat” protects an area to prevent extinction and could ensure the maintenance of instream flow to support the riparian cottonwood-willow forests. We consider the transboundary impacts that improved water quality used by migratory wildlife should be explored for a cost-comparison, because increasing the amount of aquatic and riparian habitats at Los Alisos in Sonora could largely benefit wildlife that migrates into Mexico and offset losses identified in the United States [14].
It would be prudent also to consider assigning monetary values to more ecosystem services identified in the SCWEPM. Improvements to the SCWEPM include the potential to incorporate measures of environmental quality and include scenarios of climate change. A study done by Tucson-based Sonoran Institute shows water quality and fish activity improving in the Santa Cruz River near Rio Rico because of the upgrade to the NIWTP in 2009, but the reach is still impaired for pollutants [55,56]. We demonstrated this application of the SCWEPM in a presentation to the Arizona-Mexico Commission (AMC), where an action item based on stakeholder interest was then initiated. The AMC is a public-private membership-driven, non-profit entity, with the capacity to develop collaborative solutions for the combined region. The Environment and Water Committees of the AMC developed an “action item” (intended to facilitate work that might otherwise not take place) for additional modeling using local datasets that could lead to incorporating climate predictions or new developments (e.g., urbanization or a new proposed mine). Committee members are interested in modeling the “net benefit” per acre-foot of binational effluent in future iterations. Datasets at the committee’s disposal have been made available to improve the functionality of comparing tradeoffs in terms of environmental quality.
In December 2000, the IBWC declared Minute 306 [57], which is recognized by policymakers in both countries, to protect the Colorado River Delta and ensure water for ecological purposes [12]. Ojeda-Revah and Brown [5] demonstrate that diversion of water in the Colorado River comes at the expense of habitat provisioning, sustained surface flow, flood control, groundwater recharge and pollutant removal through filtration, all of which can be quantified using ecosystem service valuation. The potential impacts to vegetation, fish and wildlife habitat through effluent loss in the Santa Cruz River may influence binational surface-water or land-use managers to recognize the need to ensure instream flow here, too, for ecological purposes.

5. Conclusions

Water is the focus of increasing controversy in arid lands where managers are challenged by the lack of an economic market for surface flows. The integration of ecosystem services and scenario analysis into watershed-management plans provides a conceptual basis and a decision-making framework to support information-rich planning processes that can span administrative boundaries and maximize social welfare. The quantification and valuation of ecosystem services associated with instream flow is recognized by water law and thereby provides a platform to foster negotiation for maintenance and in some cases, payment for provision.
This study was designed to explore means of resolving the allocation of binational effluent in the study area. Relocating the historical effluent supply from the river comes at the expense of ecosystem service provisioning, which is of interest to managers, environmentalists, and legislators. In considering how to allocate effluent for instream flow, decision-makers need to know which parts of a watershed are providing ecosystem services and how much flow is needed to sustain them. In this paper, we provide a framework for understanding the value of binational effluent, discuss how estimates are developed, and summarize the ecosystem services provided by effluent-driven instream flow. A scenario analysis of declining discharges from the binational treatment plant in Arizona demonstrates that at the most extreme, visible water declines at an Important Bird Area from 7.5 months out of a year to 2.5 months. This results in a loss of riparian forest and woodlands, habitat for many species, and reverts the riparian zone to pretreatment-plant conditions. We relate losses of habitat and vegetation to losses in property value when homes are no longer situated by a perennial river and identify socio-environmentally vulnerable neighborhoods that might be impacted by these losses. Ultimately, monetary values are estimated to replace the amount of water at the outfall and in terms of groundwater recharge, given the replacement water supply is provided. Our estimates are offered to suggest ballpark figures and no significance should be attached to any of the individual costs reported, as they are subject to spatial and temporal variability. Ideally, the effluent discussed herein could be examined with all externalities accounted for and the means of estimating value in this study would be directly comparable. Limitations of this case study, including the fact that not all ecosystem services are quantified or monetized, can be improved upon in the future.
Our results might be used to consider offsets to treatment costs and create incentives to maintain flows in Arizona. Binational governmental agencies can use these findings as they wish to satisfy stakeholders, improve environmental quality, protect wildlife, sustain safe-yield, uphold real-estate markets and/or protect marginalized communities, depending on their mission. A ribbon-cutting ceremony was held on 30 August 2012, in Nogales, Sonora, to inaugurate the LAWTP to handle wastewater flows from about 20,300 sewer connections, equivalent to Scenario 2 of this analysis for the NIWTP. The potential for new copper mining operations, urban growth and climate change could also impact surface and groundwater in the Santa Cruz River, both at the treatment plant (as we have modeled), but also for citizens relying on the groundwater availability south of there. It will ultimately be up to policy-makers and land-use managers whether or not they use the information now available for regional planning or to make decisions about future ecosystem service provisioning. We are hopeful that the continued advancement of interdisciplinary ecosystem service investigations can be established as a precedent for binational policy development and implementation.

Acknowledgments

The authors wish to thank the USGS Land Change Science (LCS) Program, formerly the Geographic Analysis and Monitoring (GAM), and U.S.-Mexico Border Environmental Health Initiative (BEHI), as well as the EPA’s Ecosystem Services Research Program (ESRP) for investing in this research. Support for researchers was also provided by the U.S. National Science Foundation (NSF) Water Sustainability and Climate (WSC) grant (EAR1038938) and the Climate Assessment for the Southwest (CLIMAS) at the University of Arizona.
We sincerely appreciate the careful peer reviews of this manuscript provided by Hans Huth (Hydrologist, Office of Border Environmental Protection, Arizona Department of Environmental Quality), Ken Bagstad (Research Economist, USGS), Thomas Konner (Environmental Engineer, EPA) and Laura López-Hoffman (Ecologist, University of Arizona). Agencies and partners contributing to this research should also be acknowledged, including colleagues from the USGS (James Callegary, David Strong, Mark Feller and Cynthia Wallace); EPA (Yongping Yuan, Wenming Nie and John Lin); U.S. National Park Service, Tumacácori National Historical Park (Jeremy Moss and Jason Welborn); Arizona State University (Francisco Lara-Valencia); University of Arizona (Felipe Caldeira, Gladys Amaya, Gaurav Arora, Sandy Dall’erba, Phil Guertin, Francina Dominguez, Amy McCoy, Katie Hirschboeck and Chris Scott); New Mexico State University (Ken Boykin); Arizona Department of Environmental Quality (Edna Mendoza and Jose Rodriguez); Instituto Municipal de Investigación y Planeacíon (Claudia Gil Anaya, Edgar Castellanos and Edgar Tepezano); Sonoran Institute (Emily Brott and Claire Zugmeyer); and Friends of the Santa Cruz River (FOSCR; Sherry Sass and Ben Lomeli).

References

  1. Brauman, K.A.; Daily, G.C.; Duarte, T.K.; Mooney, H.A. The nature and value of ecosystem services: An overview highlighting hydrologic services. Annu. Rev. Environ. Resour. 2007, 32, 67–98. [Google Scholar] [CrossRef]
  2. Varady, R.G.; Mack, M.D. Transboundary water resources and public health in the U.S.-Mexico border region. J. Environ. Health 1995, 57. No. 8. [Google Scholar]
  3. Norman, L.M.; Hirsch, D.D.; Ward, A.W. Proceedings of a USGS Workshop on Facing Tomorrow’s Challenges Along the U.S.-Mexico Border—Monitoring, Modeling, and Forecasting Change Within the Arizona-Sonora Transboundary Watersheds; U.S. Geological Survey Circular: Tucson, AZ, USA, 2008.
  4. Norman, L.M.; Villarreal, M.L.; Lara-Valencia, F.; Yuan, Y.; Nie, W.; Wilson, S.; Amaya, G.; Sleeter, R. Mapping socio-environmentally vulnerable populations access and exposure to ecosystem services at the U.S.–Mexico borderlands. Appl. Geogr. 2012, 34, 413–424. [Google Scholar] [CrossRef]
  5. Ojeda-Revah, L.; Brown, C. Environmental Services at the U.S.-Mexican Border. In Southwest Consortium for Environmental Research and Policy; The U.S.-Mexican Border Environment: Progress and Challenges for Sustainability; SCERP Monograph Series; San Diego State University Press: San Diego, CA, USA, 2012; pp. 145–185. [Google Scholar]
  6. Millennium Ecosystem Assessment, Ecosystems and Human Well-Being: Current State and Trends: Findings of the Condition and Trends Working Group, 1st ed.; Island Press: Washington, DC, USA, 2005.
  7. López-Hoffman, L.; Varady, R.G.; Flessa, K.W.; Balvanera, P. Ecosystem services across borders: A framework for transboundary conservation policy. Front. Ecol. Environ. 2009, 8, 84–91. [Google Scholar]
  8. Bark, R.H. Levelling the playing field—A case study of how non-market values can compete in policy debates over wastewater allocation in a semi-arid region. Policy Soc. 2011, 30, 311–321. [Google Scholar] [CrossRef]
  9. Norman, L.M.; Huth, H.; Levick, L.; Shea Burns, I.; Phillip Guertin, D.; Lara-Valencia, F.; Semmens, D. Flood hazard awareness and hydrologic modelling at Ambos Nogales, United States–Mexico border. J. Flood Risk Manag. 2010, 3, 151–165. [Google Scholar] [CrossRef]
  10. International Boundary and Water Commission (IBWC), Final Report of the Binational Nogales Wash United States/Mexico Groundwater Monitoring Program; International Boundary and Water Commission: El Paso, TX, USA, 2001.
  11. International Boundary and Water Commission (IBWC). Minute 276: Conveyance, Treatment and Disposal of Sewage from Nogales, Arizona and Nogales, Sonora Exceeding the Capacities Allotted to the United States and Mexico at the Nogales International Sewage Treatment Plant under Minute 227. 1998. Available online: http://www.ibwc.state.gov/Files/Minutes/Min276.pdf (accessed on 18 June 2013).
  12. International Boundary and Water Commission. Minutes between the United States and Mexican Sections of the IBWC. 2012. Available online: http://www.ibwc.state.gov/Treaties_Minutes/minutes.html (accessed on 18 June 2013).
  13. Erwin, G. Groundwater Flow Model of the Santa Cruz Active Management Area Microbasins International Boundary to Nogales International Wastewater Treatment Plant Santa Cruz County, Arizona; Arizona Department of Water Resources: Phoenix, AZ, USA, 2007. [Google Scholar]
  14. U.S. Environmental Protection Agency, Environmental Assessment for Water System Improvements; City of Nogales, Sonora, Mexico; U.S. Environmental Protection Agency: San Francisco, CA, USA, 1999.
  15. Vanderpool, T. Precarious Life; Sustained by Effluent, the Santa Cruz River Faces an Uncertain Future. Tucson Weekly. Tucson Weekly. 2012. Available online: http://www.tucsonweekly.com/tucson/precarious-life/Content?oid=3496904 (accessed on 8 April 2013).
  16. Hoerling, M.; Eischeid, J. Past peak water in the southwest. Southwest Hydrol. 2007, 6, 18–19. [Google Scholar]
  17. Dominguez, F.; Cañon, J.; Valdes, J. IPCC-AR4 climate simulations for the Southwestern U.S.: The importance of future ENSO projections. Clim. Change 2010, 99, 499–514. [Google Scholar] [CrossRef]
  18. Milly, P.; Betancourt, J.; Falkenmark, M.; Hirsch, R.M.; Kundzewicz, Z.W.; Lettenmaier, D.P.; Stouffer, R.J. Stationarity is dead: Whither water management? Science 2008, 318, 573–574. [Google Scholar]
  19. Kamp, D. Sonora sewage plant has ramifications for SC River. The Weekly Bulletin. 18 January 2011. Available online: http://www.nogalesinternational.com/the_bulletin/news/sonora-sewage-plant-has-ramifications-for-sc-river/article_2bb34952-f502-5e17-9382-707ddfd67d1f.html (accessed on 8 April 2013).
  20. Frisvold, G.; Osgood, D.E. Financing wastewater collection and treatment on the U.S.-Mexico border. Available online: http://opensiuc.lib.siu.edu/cgi/viewcontent.cgi?article=1146&context=jcwre (accessed on 18 June 2013).
  21. Johnson, R.; Haight, L.T.; Simpson, J.M. Endangered species vs. endangered habitats: A concept. Available online: http://www.rmrs.nau.edu/awa/ripthreatbib/johnson_etal_endspec.pdf (accessed on 18 June 2013).
  22. Skagen, S.K.; Melcher, C.P.; Howe, W.H.; Knopf, F.L. Comparative use of riparian corridors and oases by migrating birds in Southeast Arizona. Conserv. Biol. 1998, 12, 896–909. [Google Scholar] [CrossRef]
  23. Norman, L.; Tallent-Halsell, N.; Labiosa, W.; Weber, M.; McCoy, A.; Hirschboeck, K.; Callegary, J.; van Riper, C.; Gray, F. Developing an ecosystem services online decision support tool to assess the impacts of climate change and urban growth in the Santa Cruz Watershed; where we live, work, and play. Sustainability 2010, 2, 2044–2069. [Google Scholar]
  24. Costanza, R.; Folke, C. Valuing Ecosystem Services with Efficiency, Fairness, and Sustainability as Goals. In Nature’s Services: Societal Dependence on Natural Ecosystems; Island Press: Covelo, CA, USA, 1997; pp. 49–70. [Google Scholar]
  25. Gastelum-Ceballos, F.O. Planta de Tratamiento de Aguas Residuales Los Alisos. In Proceedings of Arizona-Mexico Commission’s (AMC) Environment Committee Meeting, Tucson, AZ, USA, 6 June 2012.
  26. Tosline, D. SCAMA/Nogales Water Storage Appraisal Study. In Proceedings of USIBWC Meeting, Nogales, AZ, USA, 22 May 2012; Available online: http://www.ibwc.state.gov/Files/CF_SEAZ_SCAMA_WSS_011212.pdf (accessed on 8 April 2013).
  27. Byrd, K.B.; Kreitler, J.R.; Labiosa, W.B. Tools and Methods for Evaluating and Refining Alternative Futures for Coastal Ecosystem Management—The Puget Sound Ecosystem Portfolio Model; Open-File Report 2011-1279; United States Geological Survey (USGS): Washington, DC, USA, 2011; p. 47. [Google Scholar]
  28. Labiosa, W.B.; Bernknopf, R.; Hearn, P.; Hogan, D.; Strong, D.; Pearlstine, L.; Mathie, A.M.; Wein, A.M.; Gillen, K.; Wachter, S. The South Florida Ecosystem Portfolio Model; a map-based multicriteria ecological, economic, and community land-use planning tool. In U.S. Geological Survey Scientific Investigations Report 2009-5181; U.S. Geological Survey: Washington, DC, USA, 2009; p. 41. [Google Scholar]
  29. McHarg, I.L. Design with Nature, 1st ed.; John Wiley & Sons: New York, NY, USA, 1991; p. 208. [Google Scholar]
  30. Arnold, J.G.; Srinivasan, R.; Muttiah, R.S.; Williams, J.R. Large area hydrologic modeling and assessment. Part I: Model development. Jawra J. Am. Water Resour. Assoc. 1998, 34, 73–89. [Google Scholar] [CrossRef]
  31. Neitsch, S.L.; Arnold, J.G.; Kiniry, J.R.; Williams, J.R. Soil and Water Assessment Tool: Theoretical Documentation; Version 2009; Texas Water Resources Institute: College Station, TX, USA, 2011. [Google Scholar]
  32. Niraula, R.; Norman, L.M.; Meixner, T.; Callegary, J. Multi-gauge Calibration for modeling the semi-arid Santa Cruz Watershed in Arizona-Mexico border area using SWAT. Air Soil Water Res. 2012, 5, 41–57. [Google Scholar]
  33. Stromberg, J.; Lite, S.; Beauchamp, V. Managing Stream Flow Regimes for Riparian Ecosystem Restoration. In Proceedings of Tamarisk Symposium, Grand Junction, CO, USA, 22–24 October 2003; Available online: http://www.coopext.colostate.edu/TRA/abstracts/2203Tamarisk/Stromberg.html (accessed on 8 April 2013).
  34. Villarreal, M.L.; Norman, L.M.; Boykin, K.G.; Wallace, C.S.A. Biodiversity losses and conservation trade-offs: Assessing future urban growth scenarios for a North American trade corridor. Int. J. Biodivers. Sci. Ecosyst. Serv. Manag. 2013, 9, 90–103. [Google Scholar]
  35. Villarreal, M.L.; Drake, S.; Marsh, S.E.; McCoy, A.L. The influence of wastewater subsidy, flood disturbance and neighbouring land use on current and historical patterns of riparian vegetation in a semi-arid watershed. River Res. Appl. 2012, 28, 1230–1245. [Google Scholar]
  36. Carruthers, J.I.; Mulligan, G.F. Environmental Valuation: Connecting Theory, Evidence, and Public Policy. In Proceedings of Annual Meeting of the Association of Collegiate Schools of Planning, Ft. Worth, TX, USA, 13–26 June 2006; Available online: http://www.huduser.org/publications/pdf/jic_gfm_rep_0501.pdf (accessed on 8 April 2013).
  37. Colby, B.G.; Wishart, S. Quantifying the influence of desert riparian areas on residential property values. Apprais. J. 2002, 70, 304–308. [Google Scholar]
  38. Bark-Hodgins, R.H.; Osgood, D.E.; Colby, B.G. Remotely Sensed Proxies for Environmental Amenities in Hedonic Analysis: What Does Green Mean. In Environmental Valuation: Interregional and Intraregional Perspectives; Ashgate Publishing, Ltd.: London, UK, 2006; pp. 191–209. [Google Scholar]
  39. Bark-Hodgins, R.; Colby, B.G. An economic assessment of the sonoran desert conservation plan. Nat. Resour. J. 2006, 46, 709. [Google Scholar]
  40. Bourne, K. Effect of the Santa Cruz River Riparian Corridor on Single Family Homes Using the Hedonic Pricing Method. Master Thesis, Department of Agricultural and Resource Economics, University of Arizona, Tucson, AZ, USA, May 2007. [Google Scholar]
  41. Bark, R.H.; Osgood, D.E.; Colby, B.G.; Katz, G.; Stromberg, J. Habitat preservation and restoration: Do homebuyers have preferences for quality habitat? Ecol. Econ. 2009, 68, 1465–1475. [Google Scholar]
  42. Bark, R.H.; Osgood, D.E.; Colby, B.G.; Halper, E.B. How do homebuyers value different types of green space? J. Agric. Resour. Econ. 2011, 36, 395–415. [Google Scholar]
  43. Arora, G.; Frisvold, G.B.; Norman, L.M. Hedonic Study at the Santa Cruz Watershed. In Proceedings of Santa Cruz River Researcher’s Day, Tucson, AZ, USA, 29 March 2012.
  44. Amaya, G.; Norman, L.M.; Frisvold, G.B. Measuring the Impacts of Natural Amenities and the US-Mexico Border, on Housing Values in the Santa Cruz Watershed, Using Spatially-Weighted Hedonic Modeling. In Proceedings of Santa Cruz River Researcher’s Day, Tucson, AZ, USA, 29 March 2011; Available online: http://sonoraninstitute.org/component/docman/doc_download/997-amaya-scrrd-2011-presentation.html (accessed on 8 April 2013).
  45. City-Data Santa Cruz County, Arizona Detailed Profile—Houses, Real Estate, Cost of Living, Wages, Work, Agriculture, Ancestries, and More. Available online: http://www.city-data.com/county/Santa_Cruz_County-AZ.html (accessed on 8 April 2013).
  46. Brouwer, R.; Spaninks, F.A. The validity of environmental benefits transfer: Further empirical testing. Environ. Resour. Econ. 1999, 14, 95–117. [Google Scholar] [CrossRef]
  47. Bruttell, N. Local golf courses increase prices after effluent rate hike Golfers prefer higher prices to yellow courses. Today’s News-Herald. 19 March 2011. Available online: http://www.havasunews.com/articles/2011/03/19/news/doc4d84291eaecaa062631554.txt (accessed on 31 May 2012).
  48. Lower Colorado River Authority Domestic Use. Available online: http://www.lcra.org/water/supply/contracts/domestic.html (accessed on 31 May 2012).
  49. Niraula, R.; Meixner, T.; Norman, L.M. Hydrological Modeling of a Semi-Arid Santa Cruz Basin. Santa Cruz River Researchers’ Day, Tucson, AZ, USA; 29 March 2012. Available online: http://www.friendsofsantacruzriver.org/userfiles/file/Researchers%27%20Day%202012/2012%20Researchers%27%20Day%20Proceedings.pdf (accessed on 8 April 2013).
  50. Wilson, M.A.; Carpenter, S.R. Economic valuation of freshwater ecosystem services in the United States: 1971–1997. Ecol. Appl. 1999, 9, 772–783. [Google Scholar]
  51. Frisvold, G.; Sprouse, T.W. Willingness to Pay for Binational Effluent. Water Sustainability Program; College of Agriculture and Life Sciences, The University of Arizona: Tucson, AZ, USA, 2009.
  52. Bureau of Reclamation, Lower Colorado Region. In Nogales Area Water Storage; U.S. Department of the Interior: Washington, DC, USA. Available online: http://www.usbr.gov/lc/phoenix/programs/progdescon.html (accessed on 8 April 2013).
  53. Tallis, H.; Kareiva, P.; Marvier, M.; Chang, A. An ecosystem services framework to support both practical conservation and economic development. Proc. Natl. Acad. Sci. USA 2008, 105, 9457–9464. [Google Scholar] [CrossRef]
  54. Muñoz-Piña, C.; Guevara, A.; Torres, J.M.; Braña, J. Paying for the hydrological services of Mexico’s forests: Analysis, negotiations and results. Ecol. Econ. 2008, 65, 725–736. [Google Scholar] [CrossRef]
  55. Nogales International New Study Shows SC River on the Rebound. Nogales International. 13 September 2011. Available online: http://www.nogalesinternational.com/news/new-study-shows-sc-river-on-the-rebound/article_c2adfdb4-de1c-11e0-9d8f-001cc4c002e0.html (accessed on 8 April 2013).
  56. U.S. Environmental Protection Agency. Watershed Priorities: Santa Cruz. Available online: http://www.epa.gov/region9/water/watershed/santacruz.html (accessed on 13 June 2012).
  57. International Boundary and Water Commission (IBWC). Conceptual Framework for U.S.-MX Studies for Future Recommendations Concerning the Riparian and Estuarine Ecology of the Limitrophe Section of the Colorado River and Its Associated Delta. Minute 306. 12 December 2000. Available online: http://www.ibwc.gov/Files/Minutes/Min306.pdf (accessed on 18 June 2013).

