Article

Determination of Perchlorate in Bottled Water from Italy

1
Department of Chemistry and Biology, University of Salerno, via Giovanni Paolo II 132, Fisciano 84084, Italy
2
Department of Human, Philosophical and Educational Science, University of Salerno, via Giovanni Paolo II 132, Fisciano 84084, Italy
*
Author to whom correspondence should be addressed.
Water 2013, 5(2), 767-779; https://doi.org/10.3390/w5020767
Submission received: 8 April 2013 / Revised: 28 May 2013 / Accepted: 31 May 2013 / Published: 13 June 2013
(This article belongs to the Special Issue Analytical Chemistry of Water)

Abstract

:
Perchlorate is regarded as an emerging persistent inorganic contaminant. It is widely known that perchlorate is an endocrine disruptor as it competitively inhibits iodide transport in the thyroid gland. As drinking water is the major source of human exposure to perchlorate, its occurrence in commercially available bottled waters purchased in different regions of Italy was investigated. Perchlorate was measured using the rapid, sensitive, and selective LC-ESI-MS/MS (liquid chromatography-electrospray tandem mass spectrometry) method by multiple reaction monitoring (MRM) of the transition 98.8→82.8, which corresponds to the loss of one oxygen atom in the perchlorate ion (ClO4→ClO3). The chlorine isotope ratio (35Cl/37Cl) was used as a confirmation tool. The limit of quantification (LOQ) for this method was 5 ng/L, and the recovery ranged from 94% to 108%. Perchlorate was detected in 44 of the 62 drinking waters tested, with concentrations ranging from <5 to 75 ng/L. These values are similar in magnitude to those reported in drinking water from the USA and do not pose an immediate health concern.

1. Introduction

Since its discovery in 1997 in a number of water supplies in the western United States, perchlorate has become an important environmental issue. Sources of this emerging contaminant include the military and commercial application of perchlorate salts as oxidizers in propellants, flares, munitions, matches, fireworks, blasting agents, and other materials [1,2]. Although the natural occurrence of perchlorate is poorly understood, and the exact role of atmospheric processes in the formation of perchlorate remains uncertain, recent studies have demonstrated that significant quantities of perchlorate can form naturally in the atmosphere, especially during thunderstorms [3,4,5].
Health concerns arise from the ability of perchlorates to disrupt the thyroid gland’s use of iodine in metabolic hormones, which could affect normal metabolism, growth and development [6,7,8,9]. Due to these concerns, the U.S. Environmental Protection Agency (EPA) placed perchlorate on the contaminant candidate list (CCL) [10] for further study. Several states indicated that exposure limits of less than 4–18 μg/L provides adequate health protection [11]. However, as more information on the extent of the contamination and the dangerous effects of perchlorate consumption has become available, the U.S. EPA has periodically reduced the acceptable limit for safe consumption. In 2005, the limit was set at 0.7 μg/kg/day, corresponding to 25 μg/L for a 70 kg human male whose perchlorate exposure comes only from drinking water [12]. However, controversy arose as to whether this limit would adequately protect the most sensitive populations, e.g., developing fetuses and infants with low dietary iodine [13]. The National Research Council suggested that pregnant women, fetuses, and infants are the life stages with the greatest potential sensitivity to perchlorate [12].
Due to its high solubility in aqueous media, perchlorate is persistent and ubiquitously present in the environment. Since the late 1990s, perchlorate has been detected in surface, ground and drinking water throughout the United States [14,15,16,17,18]. Recently, as more attention has been paid to this issue all over the world, perchlorate has also been detected in industrial effluents and drinking water in Japan [19], Korea [20], and Canada [21]. We also found appreciable levels of perchlorate in the headwater (0.29 μg/L) of a river in Italy, although it was not detectable in the watercourse [22].
A variety of analytical methods have been developed for the determination of perchlorate [23,24,25,26,27,28,29]; however, ion chromatography (IC) coupled with conductivity cell detection (CD) is the most common approach [25]. Furthermore, this method is the first to be approved by the U.S. EPA for the determination of perchlorate in drinking water [30]. Although this method is widely used for the determination of trace levels of perchlorate in water, it presents problems in the analysis in more complex matrices such as a higher probability of false positive results and a lack of selectivity [31]. To determine trace levels of perchlorate in complex matrices, IC was coupled to tandem mass spectrometry (MS/MS) to take advantage of the high selectivity and sensitivity of mass spectrometry operated in multiple reactions monitoring (MRM) mode. Accordingly, the U.S. EPA approved Method 331.0 based on IC-MS or IC-MS/MS for the determination of perchlorate in drinking water [32]. IC-MS/MS was demonstrated to yield limits of detection (LOD) of 5–25 ng/L when determining perchlorate in a variety of matrices, including water, urine, amniotic fluid, wine and food [33,34,35,36,37]. Although the analytical system using IC/ESI-MS(/MS) is designed to separate ionic compounds, a post-column suppressor is required to remove non-volatile ionic eluent that compromises ionisation efficiency. In many laboratories, MS(/MS) systems are currently connected to HPLC systems. The reversed-phase LC-ESI-MS/MS method is simpler and more applicable than the IC-ESI-MS/MS method. Therefore, several studies developed the application of reversed phase LC-ESI-MS/MS for perchlorate analysis [38,39,40].
In this study, we investigated the occurrence of perchlorate in Italian bottled water using high performance liquid chromatography-electrospray tandem mass spectrometry (HPLC-ESI-MS/MS) [41,42]. This technique was further developed with a new reversed-phase LC method using a different column packing and new mobile phase composition to simplify the chromatographic separation and mass spectrometric detection. Several water samples were collected from different locations to provide a national basis of perchlorate level in bottled water which could represent a baseline for future risk assessment evaluation because perchlorate is currently not regulated in Italian drinking water. To our knowledge, this is the first report on perchlorate determination in drinking water from Italy.

2. Materials and Methods

2.1. Reagents and Standards

Sodium perchlorate was obtained from Sigma (>99.5% purity). Water, acetonitrile and formic acid were LCMS Optima Grade from Romil (Waterbeach, Cambridge). Standards were prepared using a serial dilution of a 100 mg/L stock solution of perchlorate to 1, 5, 10, 25, 50, and 100 ng/L solutions. The standards were prepared in deionized water.

2.2. Sample Preparation

Drinking water samples were prepared by elution through one barium cartridge and one silver cartridge (CHROMAFIX® PS–Ba2+ and PS–Ag+ cartridges, Macherey-Nagel, Düren, Germany) in series. The cartridges, were first prepared by flushing with 5 mL of deionized water. Samples were eluted with the first 4 mL discarded and the following 1 mL collected for analysis.

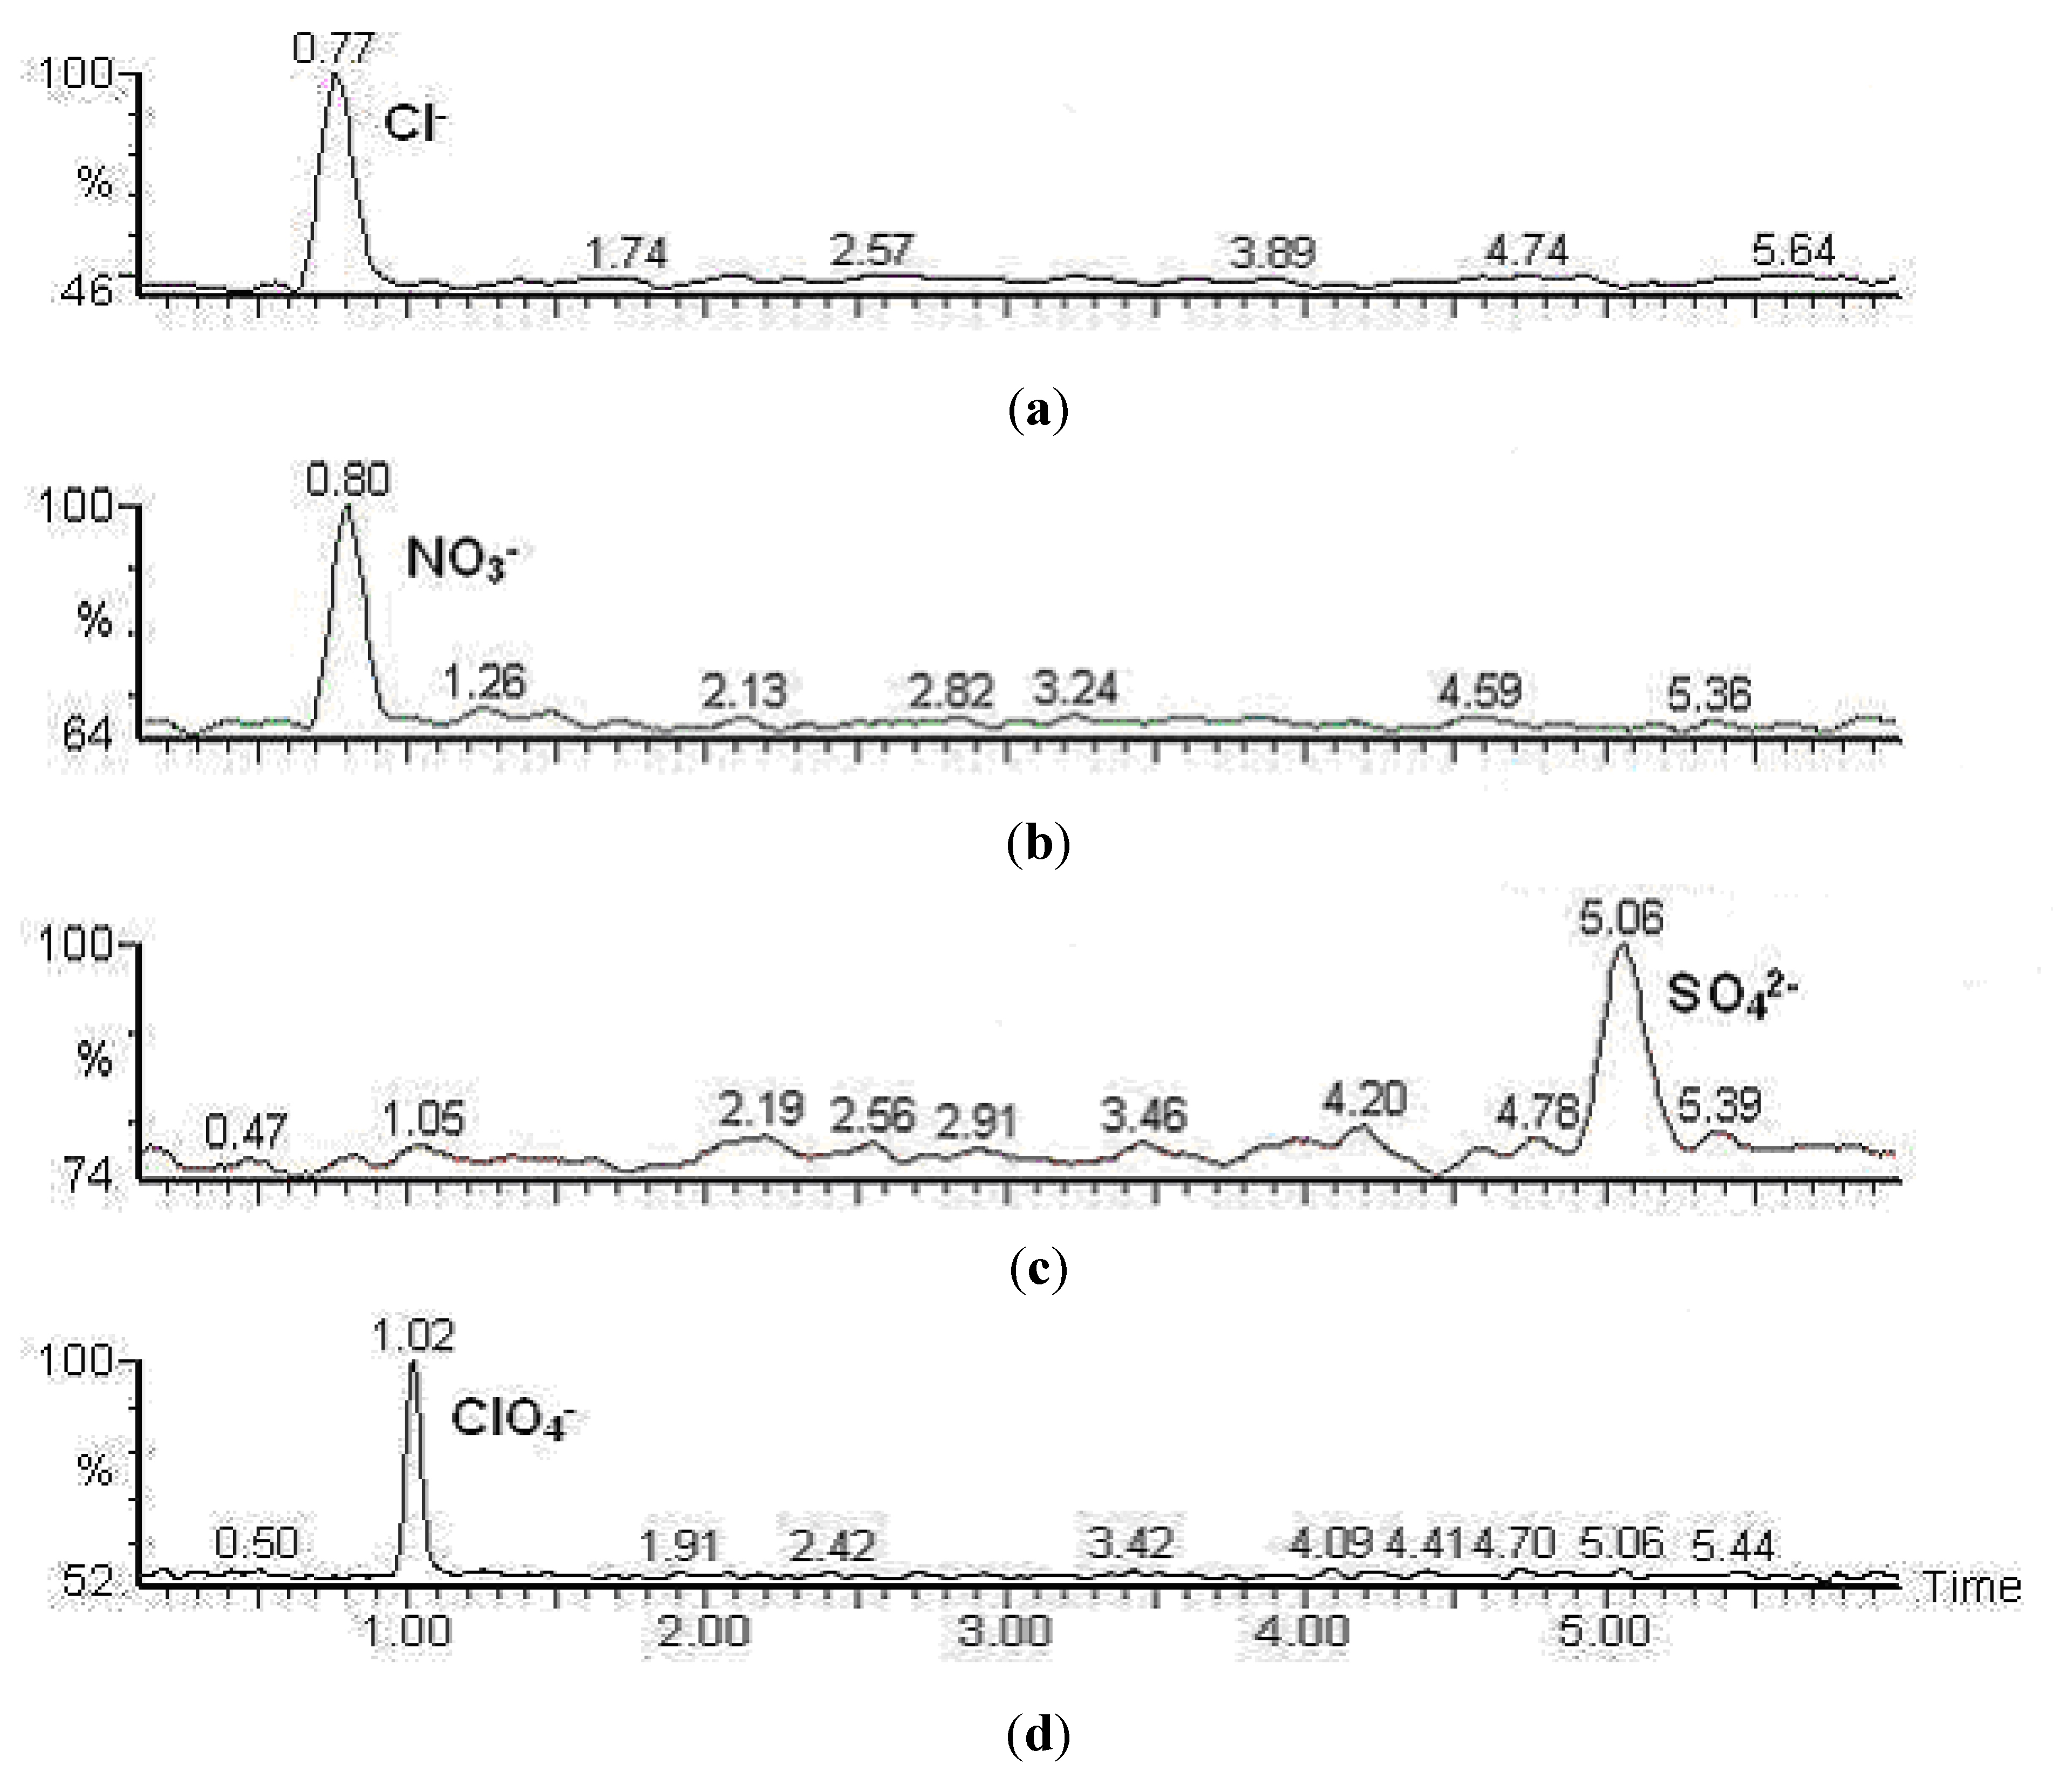
2.3. Liquid Chromatography

A 1525 binary pump (Waters, Milford, MA, USA) was used for all analyses. All analytes were separated using a 100 × 2.1 mm Kinetex–C18 column with a 2.6 µm particle size (Phenomenex, Torrance, CA, USA). The Kinetex–C18 particles consist of a nearly monodisperse 1.9 μm solid (non-porous) silica core surrounded by a 0.35 μm porous silica shell [43]. This particle results in a very stable and homogeneous packed column bed that significantly reduces peak dispersion due to eddy and resistance to mass transfer. The improved mass transfer kinetics significantly improve chromatographic resolution and also increase sensitivity. Isocratic elution at 50% B was run at a flow rate of 0.2 mL/min. Eluent A was water–acetonitrile–formic acid (95:5:0.1 v/v/v) and eluent B was water–acetonitrile–formic acid (5:95:0.1 v/v/v). The injection volume was 50 µL. Under these conditions, the retention time of perchlorate was 1 min.

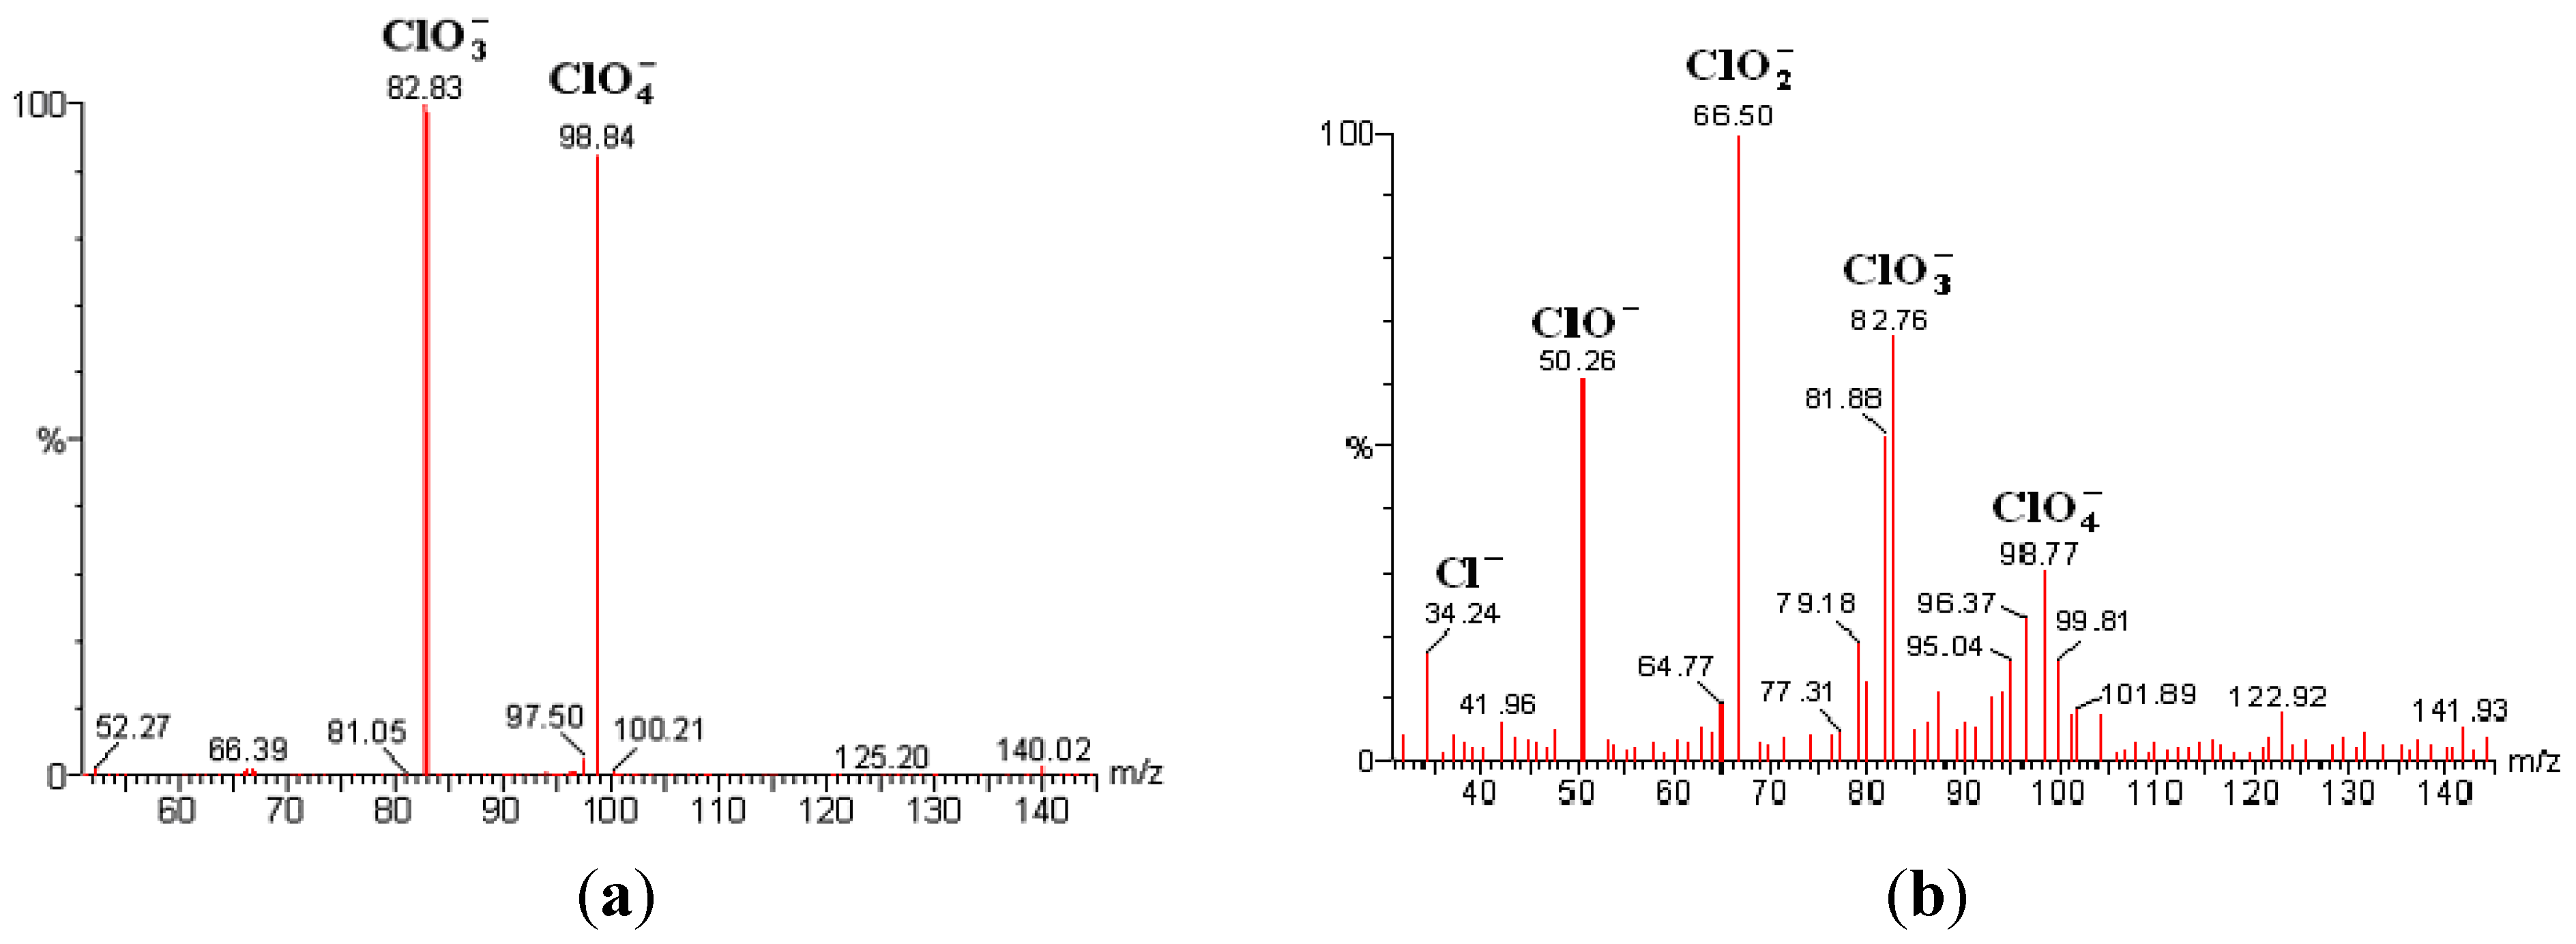
2.4. Mass Spectrometry

A Quattro micro API (Micromass, Manchester, UK) triple quadrupole tandem mass spectrometer operating in the MRM negative ion mode was used for the detection of perchlorate. Data acquisition was accomplished by MassLynx version 3.5 software (Micromass, Manchester, UK). The following conditions were found to provide the optimum signal: ion source temperature, 120 °C; desolvation temperature, 300 °C; cone gas, 30 L/h; desolvation gas, 800 L/h; cone voltage, 40 V; collision energy, 30 eV; collision cell pressure, 2 Pa; and capillary voltage, 2 kV. Two multiple reaction monitoring (MRM) transitions were analyzed: m/z 99–83 (35Cl) and 101–85 (37Cl). Quantification was accomplished using an external standard method. Instrument calibration was performed by analyzing standards at 1, 5, 10, 25, 50, and 100 ng/L. To demonstrate that the instrument was properly calibrated throughout the analysis, a calibration verification standard was analyzed every 10 samples. A blank sample was analyzed between each sample to verify that the measured levels of perchlorate were not a measurement artefact.

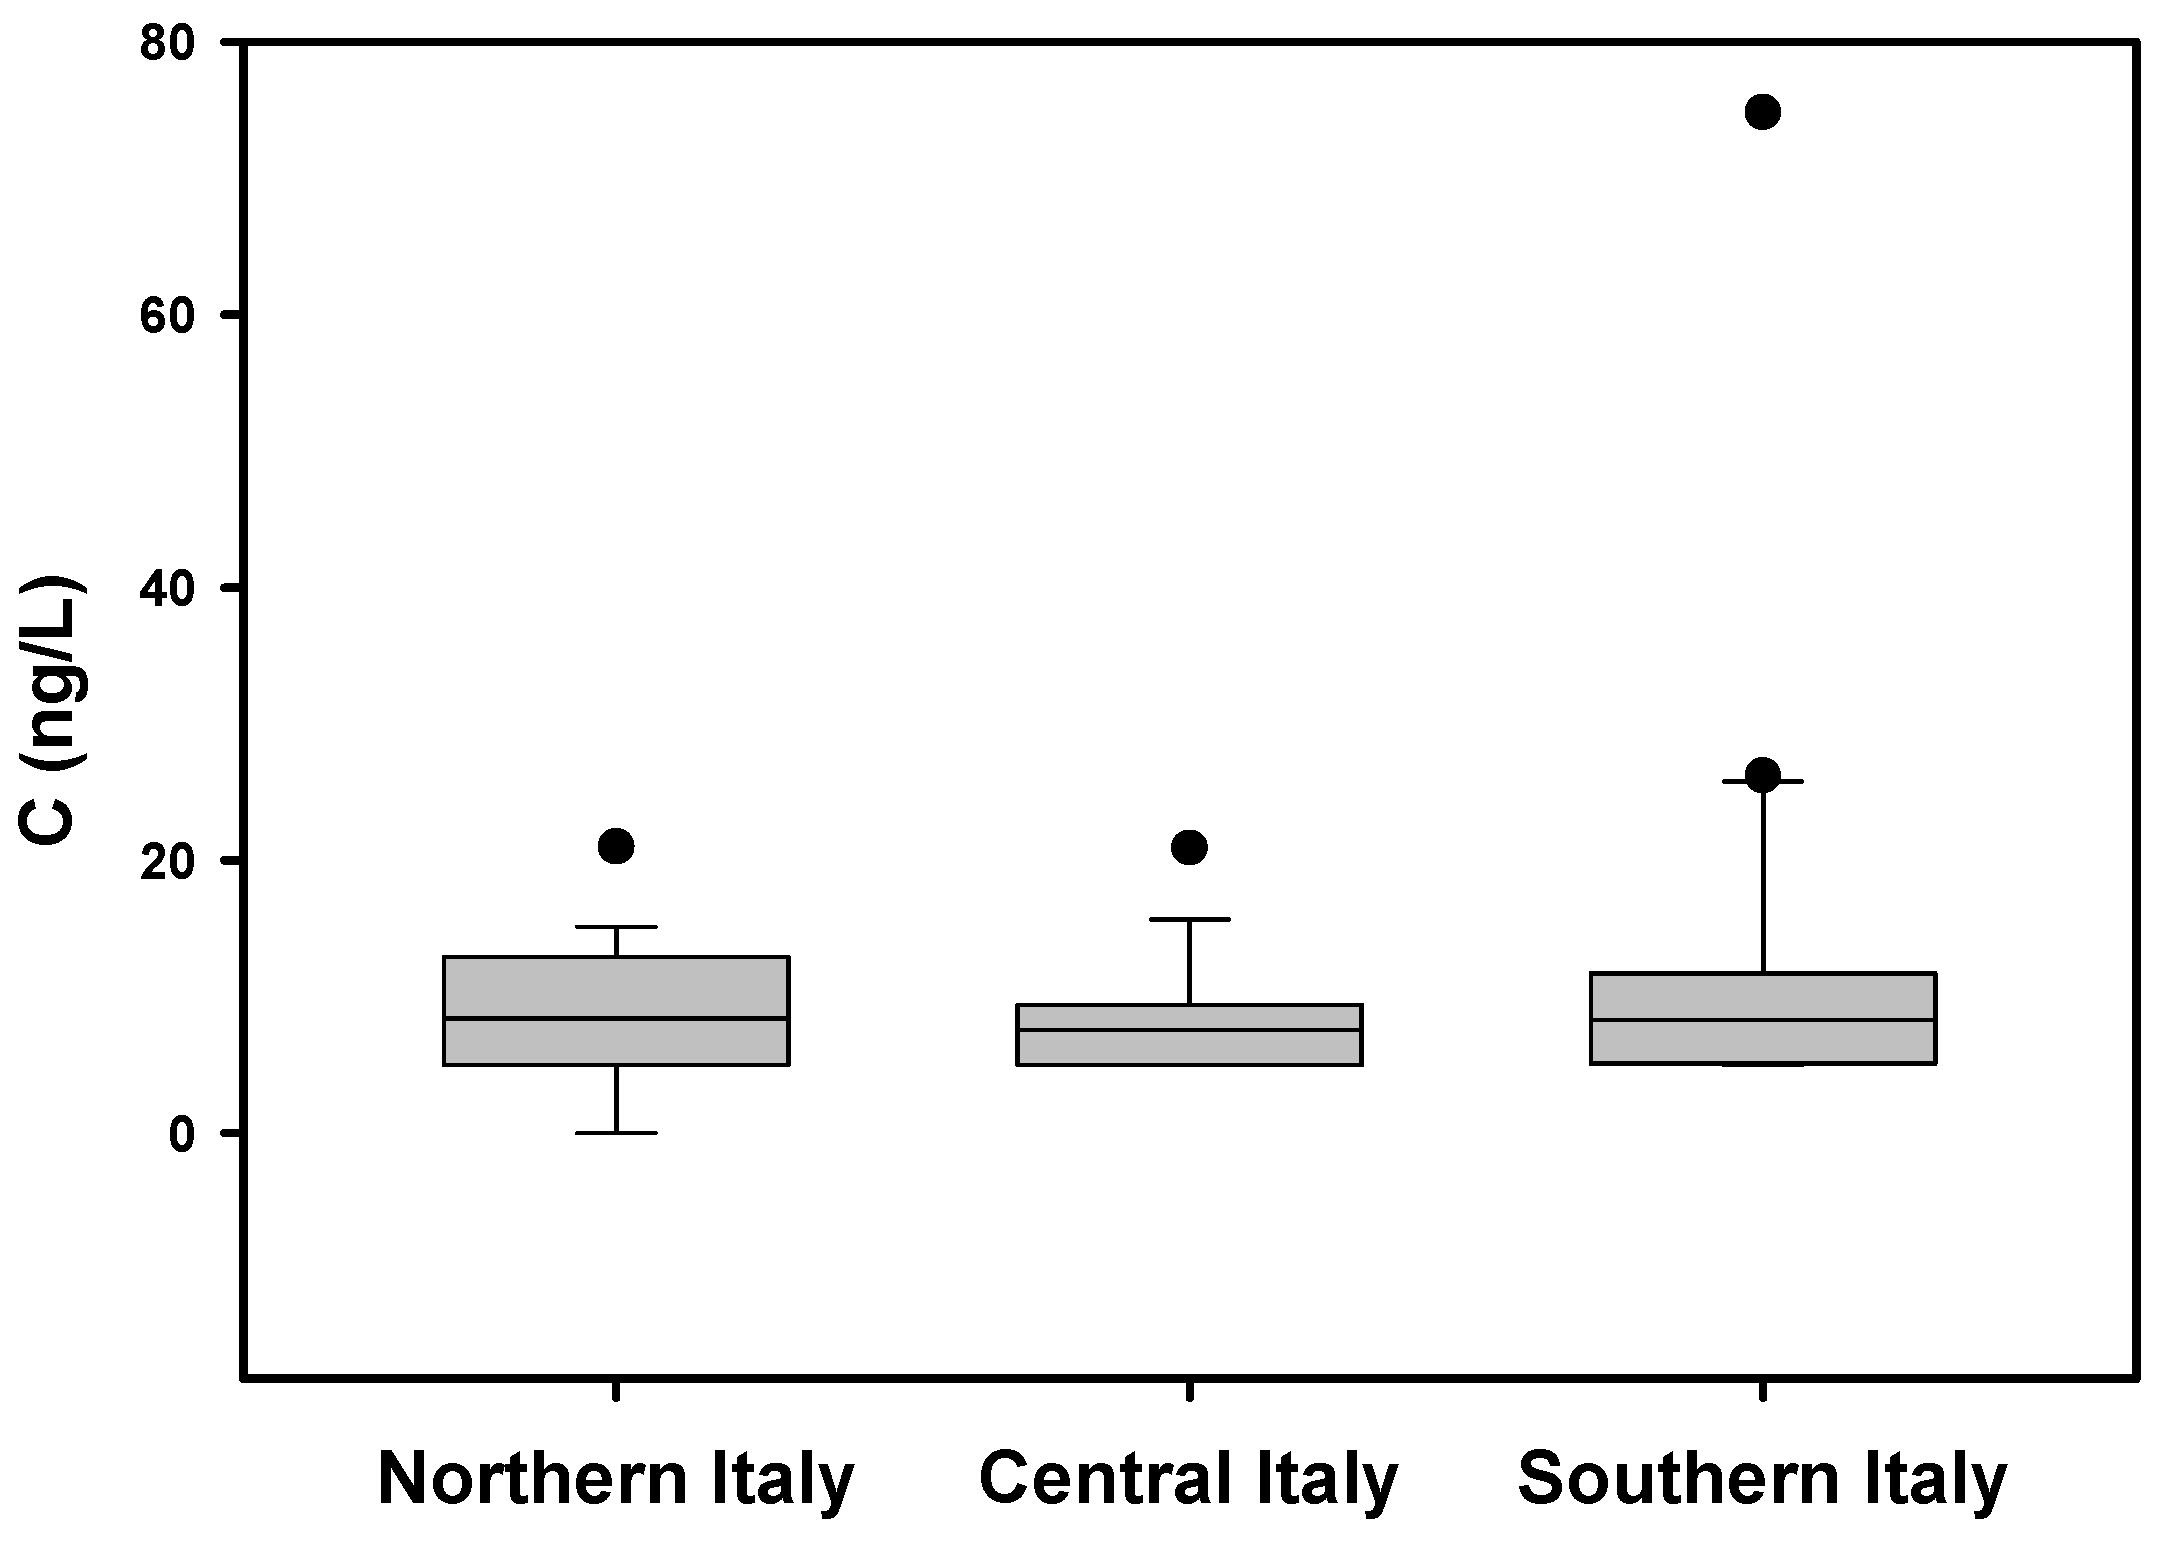
3. Results and Discussion
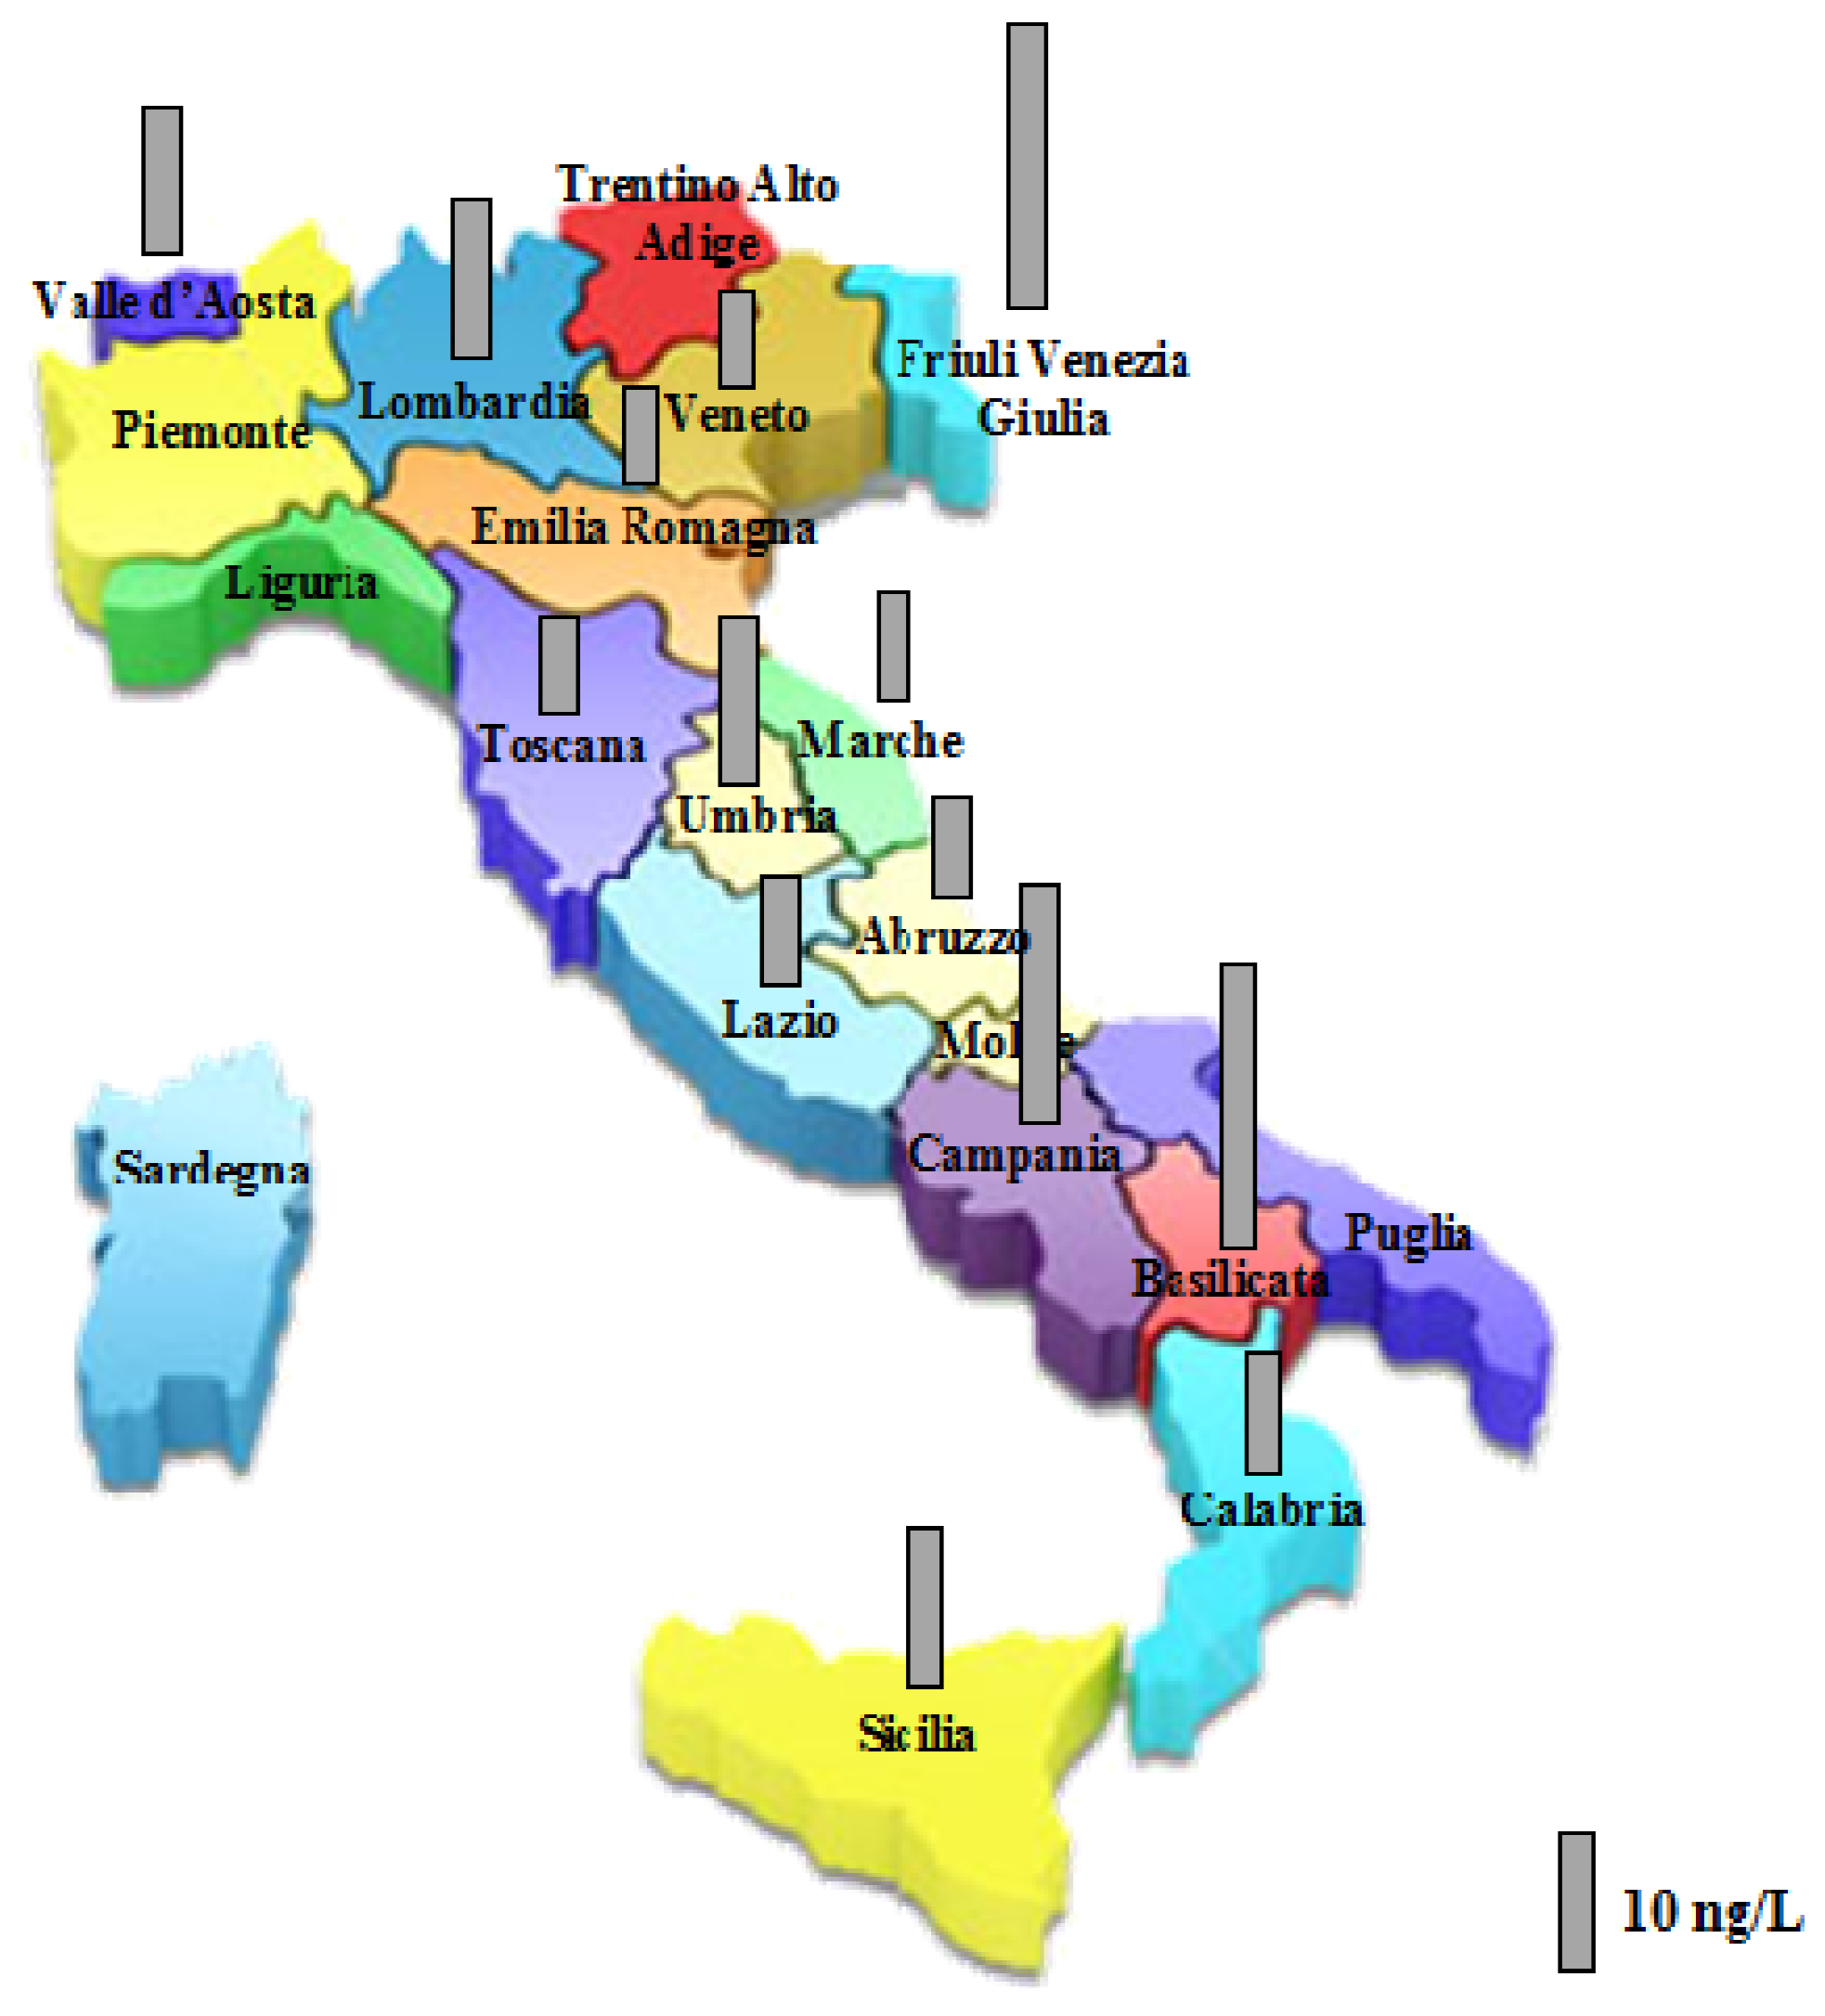
Occurrence of perchlorate in bottled waters. While Italy is the first country in Europe and second in the world for bottled water consumption [44], being estimated in 70% of the total drinking water consumed and with a global market showing an exponential growth in the last twenty years, there is currently no equivalence reference dose and/or regulatory limits for perchlorate consumption.
For this study, 62 commercially available bottled waters, purchased from various local merchants, were collected from 15 of the 20 regions of Italy. Twenty were purchased from northern Italy, 16 from central Italy and 26 from southern Italy. The analyzed perchlorate concentrations in the drinking water samples are presented in Table 1. The reported values are averages of triplicate measurements within each brand. Perchlorate was a ubiquitous component at trace levels in drinking waters analyzed. Most of the samples contained measurable amounts of perchlorate, except for 17 water samples. These 17 samples showed perchlorate levels below the limit of quantification. Based on the samples analyzed, drinking water from the Calabria region showed the lowest level of perchlorate with 5 ± 0.4 ng/L, whereas water from the Basilicata region showed the highest level of perchlorate with 75 ± 0.5 ng/L. It is interesting to note that the perchlorate concentrations in bottled water were in the ppt levels, similar in magnitude to reported drinking water sampled in the USA [39]. No samples exceeded the U.S. EPA perchlorate regulations; in fact, perchlorate concentrations were three orders of magnitude lower than the U.S. advisory levels [11], thus unlikely to pose an immediate health concern.
In our opinion, because perchlorate is currently not regulated in Italian drinking water, these results could provide a national basis of perchlorate level in bottled water and represent a baseline for future risk assessment evaluation.
Table 1. Perchlorate concentration in bottled water from different Italian regions.
RegionPerchlorate a (ng/L)RegionPerchlorate a (ng/L)
Valle D’Aosta<LOQUmbria<LOQ
7 ± 0.3 <LOQ
13 ± 0.4 9 ± 0.2
9 ± 0.4 9 ± 0.2
13 ± 0.3 15 ± 0.3
Piemonte<LOQ 6 ± 0.5
Lombardia15 ± 0.6 21 ± 0.2
7 ± 0.1 <LOQ
<LOQMarche8 ± 0.3
<LOQ 8 ± 0.3
11 ± 0.3Lazio<LOQ
13 ± 0.5 8 ± 0.3
8 ± 0.4Abruzzo7 ± 0.3
Veneto7 ± 0.4Basilicata6 ± 0.3
8 ± 0.3 8 ± 0.3
<LOQ 8 ± 0.2
<LOQ 8 ± 0.2
Friuli V. G.14 ± 0.4 75 ± 0.5
21 ± 0.4Calabria9 ± 0.3
<LOQ 9 ± 0.5
Toscana9 ± 0.2 5 ± 0.4
8 ± 0.3 5 ± 0.3
<LOQ 13 ± 0.3
<LOQ 8 ± 0.3
Campania25 ± 0.4 8 ± 0.2
<LOQ 13 ± 0.4
26 ± 0.2Sicilia<LOQ
<LOQ 8 ± 0.3
<LOQ 9 ± 0.2
7 ± 0.2 <LOQ
11 ± 0.3 17 ± 0.5
Note: a Average of triplicates.
We compared these results with those of tap water from different regions of Italy and we found that in all cases values of these latter were higher than those of bottled water (roughly one order magnitude) probably because of different conditions of the water sources and different biogeochemical processes governing perchlorate behavior in groundwater. Moreover a recent study has found that small amounts of perchlorate and other contaminants may be added during disinfection by municipal water treatment facilities that employ sodium hypochlorite [45]. For the sake of clarity, we note that Italian bottled water is not subjected to pre-treatment procedures, such as disinfection techniques that can result in perchlorate production, or processing steps that include carbon absorption and can remove perchlorate from the water. Thus, the variability of perchlorate levels within the tested brands is due to the origin of the water from different regions of Italy (Figure 1).
In Figure 2, a map of sample regions with perchlorate concentrations represented by bars is reported.
Figure 1. Box and whisker plot of perchlorate concentration in bottled water from northern, central and southern Italy.
Water 05 00767 g001
Figure 2. Map of sample regions of Italy. Perchlorate concentration is represented by bars.
Water 05 00767 g002
Analytical observations. Optimal MS and MS/MS parameters for the perchlorate ion were evaluated by directly infusing 1 mg/L stock perchlorate in HPLC eluent. The effect of collision energy on intensity is shown in Figure 3. In the mass spectrum acquired with the collision energy set at 20 eV, the presence of ClO3species was evident (Figure 3a). As the collision energy is increased to 40 eV, the complexity of the spectrum is increased (Figure 3b). At this collision energy, a significant decrease was evident in the observed intensity for the ClO4 ion coupled with the appearance of ClO2, ClO, and Cl species. When the collision energy was 20 eV and 40 eV, the signal was strongest for transition m/z 99 to 83 and m/z 99 to 66, respectively.
Figure 3. Mass spectra of 1 mg/L stock perchlorate in high performance liquid chromatography (HPLC) eluent acquired with a collision energy of 20 eV (a) and 40 eV (b).
Water 05 00767 g003
The optimization of ESI–MS/MS analysis was used for monitoring two multiple reactions. The transition is a result of oxygen loss from the molecular ion of perchlorate, ClO4→ClO3, whereas the transition for the 35Cl and 37Cl isotopes is m/z 99 to 83 and m/z 101 to 85, respectively. The 37Cl transition was monitored to provide additional confirmation of the presence of perchlorate. The measured isotopic ratio of 35Cl to 37Cl is derived from the natural abundance of chlorine isotopes.
Figure 4 shows the MRM chromatograms for analysis of a 100 ng/L perchlorate standard. The chromatograms (a) and (b) show adequate signals for both transitions. Using seven different concentrations, in triplicate injections, and covering a range from 1 to 100 ng/L perchlorate, the correlation coefficients of the calibration curve in the deionized water were 0.996 and 0.999 using a linear fit for the 98.8→82.8 and 100.9→84.9 transitions, respectively. These data show that quantification can be performed with good linearity and sensitivity. The measured isotopic ratio of 35Cl to 37Cl varies from 2.7 to 3.4.
Figure 4. High performance liquid chromatography-electrospray tandem mass spectrometry (HPLC-ESI-MS/MS) of 100 ng/L perchlorate standard. (a) Multiple reaction monitoring (MRM) for the 35Cl isotope: m/z 99 to 83; (b) MRM for the 37Cl isotope: m/z 101 to 85.
Water 05 00767 g004
When ESI is used for quantitative analysis, the effect of ionization suppression or enhancement must be considered. The presence of common ions in the sample can have a serious suppression or enhancement effect (matrix effect) on the analyte of interest. Improved sample clean-up, selection of the separation column, matrix dilution, and the addition of an isotopically labeled internal standard have been used to minimize matrix effects. A key to reduce suppression is to ensure that the analyte and high concentrations of matrix are well separated and do not enter the ion source and interface at the same time. In addition to ion suppression in the source, the analysis of perchlorate was also hindered by isobaric interferences attributed to minor sulphate isotopes (H34S16O4 and H32S16O318O). Pre-treatment of water samples and the selection of separation columns are critical for the reduction of sample bleed and efficient separation of high levels of interfering ions, particularly sulphate.
In general, IC-ESI-MS/MS is a superior technique for the separation of coexisting anions from perchlorate because the IC system is designed to separate ions. However, sodium and potassium-based aqueous solutions are usually used as eluents in IC-ESI-MS/MS; therefore, a suppressor is required to remove these non-volatile ions. Moreover, an organic solvent, such as acetonitrile, must be mixed as a post-column solvent with an additional LC pump to improve sensitivity [33,34]. Therefore, the analytical system using IC-ESI-MS/MS is inevitably too complex to control. In contrast, the LC-ESI-MS/MS method is considered to be simpler and less expensive than the IC-ESI-MS/MS method. Additionally, in many cases, MS/MS systems are connected to the LC systems for the analysis of organic micropollutants. The LC-ESI-MS/MS method is more applicable if the separation of perchlorate from coexisting anions is achieved.
The effects of common anions on perchlorate analysis were studied by analyzing a series of solutions containing 10 ng/L of perchlorate and the common anions (fluoride, chloride, nitrate, carbonate and sulphate) at different concentrations ranging from 50 to 200 mg/L. The studied concentrations were generally higher than the concentrations of these common anions that were detected in drinking water.
The studied concentrations of fluoride, chloride, nitrate, carbonate and sulphate were 50, 100, and 200 mg/L. Figure 5 shows the chromatograms of 10 ng/L of perchlorate and 200 mg/L of coexisting common anions. As shown in Figure 5, perchlorate was well separated from the other anions. Perchlorate and nitrate anions were detected by monitoring the signals from their product ions, which were formed by loss of an oxygen atom from their molecular ions. Chloride and sulphate anions were detected by monitoring the signals from their molecular ions. No peak from the CO32− anion was observed because of its extremely low ESI efficiency, while fluoride anion was not detected because its mass was out of the scan range. The chloride and nitrate peaks were observed at an earlier retention time than the perchlorate peak (Figure 5a,b). Furthermore, the perchlorate peak was not affected by the presence of sulphate because it eluted later than the perchlorate peak (Figure 5c,d). The presence of these common anions at the studied concentrations had no significant negative impact on perchlorate recoveries, which were in a range of 94%–108%. Additionally, peak shifting to earlier retention times was not observed for perchlorate [42]. These chromatographic conditions resulted in a rapid and successful isocratic separation of perchlorate from coexisting anions.
Figure 5. HPLC-ESI-MS/MS of 10 ng/L of perchlorate and 200 mg/L of coexisting common anions. (a) MRM for Cl: m/z 35 to 35; (b) MRM for NO3: m/z 62 to 46; (c) MRM for SO42−: m/z 97 to 97; (d) MRM for ClO4: m/z 99 to 83.
Water 05 00767 g005
A pre-treatment of drinking water samples using silver and barium cartridges in series for chloride and sulphate removal was adopted to reduce instrument contamination and maintenance. Influence of sample pre-treatment on perchlorate recovery was subsequently studied.
Perchlorate standards at 5, 10, 25, and 100 ng/L were pre-treated by elution through one barium and one silver cartridge (Macherey-Nagel) in series prior to analysis. These cartridges were evaluated before use and were not found to retain perchlorate. The data presented in Table 2 show no significant effects of pre-treatment on the recovery. Triplicate analysis of perchlorate standards showed better than 96% to 102% recovery. The sample preparation method does not interfere with the quantitative determination of trace levels of perchlorate.
The limit of detection (LOD) and limit of quantification (LOQ) were determined from seven replicate analyses of the four lowest calibration standards (1, 5, 10, and 25 ng/L). LOD and LOQ were calculated as 3S0 and 10S0, respectively, where S0 is the y-intercept of the ordinary least squares best-fit line of the standard deviations plotted against concentration. Standards were run through all method-preparation steps. The LOD was determined to be 2 ng/L, and the LOQ was calculated to be 5 ng/L.
Table 2. Effects of pre-treatment on perchlorate spike recovery.
StandardPerchlorate (ng/L)Recovery a (%)
1596
210101
32598
4100102
Note: a Average of triplicates.

4. Conclusions

A fast, sensitive, and selective reversed-phase LC-ESI-MS/MS method was developed for the determination of perchlorate anion in drinking water and was applied, for the first time, in the determination of perchlorate in bottled drinking water from Italy. Italy has no regulatory limit for perchlorate in drinking water, therefore the U.S. equivalent reference dose was used as the standard. The use of a different column packing and a new mobile phase composition provided accurate quantification by compensating for matrix effects without developing laborious clean-up procedures or performing standard additions for each sample. Perchlorate was detected at trace levels (<5 to 75 ng/L) in 70% of the analyzed samples. These perchlorate concentration levels are similar in magnitude to the drinking water samples reported in the USA and are unlikely to be an immediate health concern. The presence of common anions had no significant negative impact on perchlorate recoveries, which were in a range of 94%–108%. Monitoring the 37Cl and 35Cl transitions by MS/MS improved the specificity of the method. The LOQ of the method was calculated to be 5 ng/L and was adequate to collect useful data on perchlorate levels in drinking water samples.

Acknowledgments

The authors wish to acknowledge financial support from Italian Minister of Research MURST-CNR 60%.

Conflicts of Interest

The author declares no conflict of interest.

References

  1. Greer, M.A.; Goodman, G.; Pleus, R.C.; Greer, S.E. Health effects assessment for environmental perchlorate contamination: The dose response for inhibition of thyroidal radioiodine uptake in humans. Environ. Health Perspect. 2002, 110, 927–937. [Google Scholar] [CrossRef]
  2. Smith, P.N.; Theodorakis, C.W.; Anderson, T.A.; Kendall, R.J. Preliminary assessment of perchlorate in ecological receptors at the Longhorn Army Ammunition Plant (LHAAP), Karnak, Texas. Ecotoxicology 2001, 10, 305–313. [Google Scholar] [CrossRef]
  3. Dasgupta, P.K.; Martinelango, P.K.; Jackson, W.A.; Anderson, T.A.; Tian, K.; Tock, R.W.; Rajacopalan, S. The origin of naturally occurring perchlorate: The role of atmospheric processes. Environ. Sci. Technol. 2005, 39, 1569–1575. [Google Scholar] [CrossRef]
  4. Parker, D.R.; Seyfferth, A.L.; Reese, B.K. Perchlorate in groundwater: A synoptic survey of “Pristine” sites in the coterminous United States. Environ. Sci. Technol. 2008, 42, 1465–1471. [Google Scholar] [CrossRef]
  5. Rao, B.; Anderson, T.A.; Orris, G.J.; Rainwater, K.A.; Rajagopalan, S.; Sandvig, R.M.; Scanlon, B.R.; Stonestrom, D.A.; Walvoord, M.A.; Jackson, W.A. Widespread natural perchlorate in unsaturated zones of the Southwest United States. Environ. Sci. Technol. 2007, 41, 4522–4528. [Google Scholar] [CrossRef]
  6. Saito, K.; Yamamoto, K.; Takay, T.; Yoshida, S. Inhibition of iodide accumulation by perchlorate and thiocyanate in a model of the thyroid iodide transport system. Acta Endocionol. 1983, 104, 456–461. [Google Scholar]
  7. Urbansky, E.T.; Schock, M.R. Issues in managing the risks associated with perchlorate in drinking water. J. Environ. Manag. 1999, 56, 79–95. [Google Scholar] [CrossRef]
  8. Wolff, J. Perchlorate and tyroid gland. Pharmacol. Rev. 1998, 50, 89–105. [Google Scholar]
  9. Xu, J.; Song, Y.; Min, B.; Steinberg, L.; Logan, B.E. Microbial degradation of perchlorate: Principles and applications. Environ. Eng. Sci. 2003, 20, 405–422. [Google Scholar] [CrossRef]
  10. U.S. Environmental Protection Agency (USEPA), Announcement of the Draft Drinking Water Contaminant Candidate List Notice; EPA Number 815Z97003; October 1997; p. 52193.
  11. California Department of Health Services. Perchlorate in Drinking Water. 7 December 2012. Available online: http://www.cdph.ca.gov/certlic/drinkingwater/pages/Perchlorate.aspx (accessed on 11 March 2013).
  12. National Resource Council (NRC), Health Implication of Perchlorate Ingestion; National Resource Council National Academic Press: Washington, DC, USA, 2005.
  13. Dasgupta, P.K.; Dyke, J.V.; Kirk, A.B.; Jackson, W.A. Perchlorate in the United States. Analysis of relative source contributions to the food chain. Environ. Sci. Technol. 2006, 40, 6608–6614. [Google Scholar] [CrossRef]
  14. Dyke, J.V.; Kirk, A.B.; Martinelango, P.K.; Dasgupta, P.K. Sample processing method for the determination of perchlorate in milk. Anal. Chim. Acta 2006, 567, 73–78. [Google Scholar] [CrossRef]
  15. Kirk, A.B.; Smith, E.E.; Tian, K.; Anderson, T.A.; Dasgupta, P.K. Perchlorate in milk. Environ. Sci. Technol. 2003, 37, 4979–4981. [Google Scholar] [CrossRef]
  16. Krynitsky, A.J.; Niemann, R.A.; Nortrup, D.A. Determination of perchlorate anion in foods by ion chromatography-tandem mass spectrometry. Anal. Chem. 2004, 76, 5518–5522. [Google Scholar] [CrossRef]
  17. Sanchez, C.A.; Crump, K.S.; Krieger, R.I.; Khandaker, N.R.; Gibbs, J.P. Perchlorate and nitrate in leafy vegetables of North America. Environ. Sci. Technol. 2005, 39, 9391–9397. [Google Scholar] [CrossRef]
  18. Stetson, S.J.; Wanty, R.B.; Helsel, D.R.; Kalkhoff, S.J.; Mcalady, D.L. Stability of low levels of perchlorate in drinking water and natural water samples. Anal. Chim. Acta 2006, 567, 108–113. [Google Scholar] [CrossRef]
  19. Kosaka, K.; Asami, M.; Matsuoka, Y.; Kamoshita, M.; Kunikane, S. Occurrence of perchlorate in drinking water sources of metropolitan area in Japan. Water Res. 2007, 41, 3473–3482. [Google Scholar]
  20. Quinones, O.; Oh, J.; Vanderford, B.; Kim, J.H.; Cho, J.; Snyder, S.A. Perchlorate assessment of the Nakdong and Yeongsan watersheds, Republic of Korea. Environ. Toxicol. Chem. 2007, 26, 1349–1354. [Google Scholar] [CrossRef]
  21. Backus, S.M.; Klawuun, P.; Brown, S.; D’sa, I.; Sharp, S.; Surette, C.; Williams, D.J. Determination of perchlorate in selected surface waters in the Great Lakes Basin by HPLC/MS/MS. Chemosphere 2005, 61, 834–843. [Google Scholar] [CrossRef]
  22. Vigliotta, G.; Motta, O.; Guarino, F.; Iannece, P.; Proto, A. Assessment of perchlorate-reducing bacteria in a highly polluted river. Int. J. Hyg. Environ. Health 2010, 213, 437–443. [Google Scholar] [CrossRef]
  23. Urbansky, E.T. Quantitation of perchlorate ion: Practices and advances applied to the analysis of common matrices. Crit. Rev. Anal. Chem. 2000, 30, 311–343. [Google Scholar] [CrossRef]
  24. Heinnickel, M.; Smith, S.C.; Koo, J.; O’Connor, S.M.; Coates, J.D. A bioassay for the detection of perchlorate in the ppb range. Environ. Sci. Technol. 2011, 45, 2958–2964. [Google Scholar] [CrossRef]
  25. Anderson, T.A.; Wu, T.H. Extraction, clean-up, and analysis of the perchlorate anion in tissue samples. Bull. Environ. Contam. Toxicol. 2002, 68, 684–691. [Google Scholar] [CrossRef]
  26. Liu, Y.; Mou, S.; Heberling, S. Determination of trace level bromate and perchlorate in drinking water by ion chromatography with an evaporative preconcentration technique. J. Chromatogr. A 2002, 956, 85–91. [Google Scholar] [CrossRef]
  27. Magnuson, M.L.; Ubansky, E.T.; Kelty, C.A. Microscale extraction of perchlorate in drinking water with low level detection by electrospray-mass spectrometry. Talanta 2000, 52, 285–291. [Google Scholar] [CrossRef]
  28. Urbansky, E.T.; Gu, B.; Magnuson, M.L.; Brown, G.M.; Kelly, C.A. Survey of bottled waters for perchlorate by electrospray ionization mass spectrometry (ESI-MS) and ion chromatography (IC). J. Sci. Food Agric. 2000, 80, 1798–1804. [Google Scholar] [CrossRef]
  29. Johnson, J.; Grimshaw, D.; Richman, K. Analysis for Perchlorate by Ion Chromatography: Significant Recent Findings; American Pacific Corp.: Las Vegas, NV, USA, 2003. [Google Scholar]
  30. U.S. Environmental Protection Agency (USEPA), Method 314.0 Determination of Perchlorate in Drinking Water Using Ion Chromatography, Revision 1.0.; USEPA: Cincinnati, OH, USA, 1999.
  31. Yu, L.; Cheng, Q.; Canas, J.; Valentin-Blasini, L.; Blount, B.C.; Anderson, T. Challenges in determining perchlorate in biological tissues and fluids: Implications for characterizing perchlorate exposure. Anal. Chim. Acta 2006, 567, 66–72. [Google Scholar] [CrossRef]
  32. U.S. Environmental Protection Agency (USEPA), Method 331.0 Determination of Perchlorate in Drinking Water by Liquid Chromatography Electrospray Ionization Mass Spectrometry, Revision 1.0.; USEPA: Cincinnati, OH, USA, 2005.
  33. El Aribi, H.; Le Blanc, Y.J.C.; Antosen, S.; Sakuma, T. Analysis of perchlorate in foods and beverages by ion chromatography coupled with tandem mass spectrometry (IC-ESI-MS/MS). Anal. Chim. Acta 2006, 567, 39–47. [Google Scholar] [CrossRef]
  34. Krynitsky, A.J.; Niemann, R.A.; Williams, A.D.; Hopper, M.L. Streamlined sample preparation procedure for determination of perchlorate anion in foods by ion chromatography-tandem mass spectrometry. Anal. Chim. Acta 2006, 567, 94–99. [Google Scholar] [CrossRef]
  35. Snyder, S.A.; Pleus, R.C.; Vanderford, B.J.; Holady, J.C. Perchlorate and chlorate in dietary supplements and flavour enhancing ingredients. Anal. Chim. Acta 2006, 567, 26–32. [Google Scholar] [CrossRef]
  36. Oldi, J.F.; Kannan, K. Analysis of perchlorate in human saliva by liquid chromatography-tandem mass spectrometry. Environ. Sci. Technol. 2009, 43, 142–147. [Google Scholar] [CrossRef]
  37. Wang, Z.; Lau, B.P.-Y.; Tague, B.; Sparling, M.; Forsyth, D. Determination of perchlorate in infant formula by isotope dilution ion chromatography/tandem mass spectrometry. Food Addit. Contam. 2011, 28, 799–806. [Google Scholar] [CrossRef]
  38. Ells, E.; Barnett, D.A.; Purves, R.W.; Guevremont, R. Trace determination of perchlorate in water matrices in human urine using ESI-FAIMS-MS. J. Environ. Monitor. 2000, 2, 393–397. [Google Scholar] [CrossRef]
  39. Snyder, S.A.; Vanderford, B.J.; Rexing, D.J. Trace analysis of bromate, chlorate, iodate, perchlorate in natural and bottled waters. Environ. Sci. Technol. 2005, 39, 4586–4593. [Google Scholar] [CrossRef]
  40. U.S. Environmental Protection Agency (USEPA). Perchlorate in Water, Soils and Solid Wastes Using High Performance Liquid Chromatography/Electrospray Ionization/Mass Spectrometry (HPLC/ESI/MS or HPLC/ESI/MS/MS). 2007. Available online: http://www.epa.gov/osw/hazard/testmethods/pdfs/6850.pdf (accessed on 11 March 2013).
  41. Li, Y.; George, E.J. Analysis of perchlorate in water by reversed–phase LC/ESI–MS/MS using an internal standard technique. Anal. Chem. 2005, 77, 4453–4458. [Google Scholar] [CrossRef]
  42. Li, Y.; George, E.J. Reversed-phase liquid chromatograhy/electrospray ionization tandem mass spectrometry for analysis of perchlorate in water. J. Chromatogr. A 2006, 1133, 215–220. [Google Scholar] [CrossRef]
  43. Phenomenex Technical Note TN-1080. Available online: http://www.phenomenex.com/Kinetex/CoreShellTechnology (accessed on 19 March 2012).
  44. Niccolucci, V.; Botto, S.; Rugani, B.; Nicolardi, V.; Bastianoni, S.; Gaggi, C. The real water consumption behind drinking water: the case of Italy. J. Environ. Manag. 2011, 92, 2611–2618. [Google Scholar] [CrossRef]
  45. Stanford, B.D.; Pisarenko, A.N.; Snyder, S.A.; Gordon, G. Perchlorate, bromate, and chlorate in hypochlorite solutions: Guidelines for utilities. J. Am. Water Works Assoc. 2011, 103, 71–83. [Google Scholar]

